Metal–organic frameworks (MOFs) as host materials for the ...

Photophysical Properties of Anthracenic Metal Organic Frameworks
Jennifer Marie Hay
Thesis submitted to the faculty of the Virginia Polytechnic Institute and State University in partial fulfillment of the requirements for the degree of
Master of Science
In Chemistry
Amanda J. Morris, Chair Karen J. Brewer Brian E. Hanson
September 24th, 2014
Blacksburg, VA
Keywords: Luminescence, Metal Organic Frameworks, Photophysics
Photophysical Properties of Anthracenic Metal Organic Frameworks
Jennifer Marie Hay Abstract: Luminescent metal organic frameworks (MOFs) are promising new materials
with applications as sensors, photocatalysts, and other luminescent devices. Although
MOFs retain the chemical and physical properties of their constituents, the properties of
the MOF are often altered from those of its building blocks, making rational design and
synthesis difficult.
Anthracene is a polyaromatic hydrocarbon whose photophysical properties have
been found to be easily tuned through structural modifications. The tunability of
anthracene makes it an ideal candidate for use in luminescent devices, such as
photoprobes and organic light emitting diodes.
MOFs designed with π conjugated molecules like anthracene ligands possess
similar photophysical properties such as absorption and fluorescence in the UV and
visible spectrum. In hopes of better understanding how the photophysical properties of
the organic ligand is altered upon incorporation into a MOF, the spectroscopic properties
of anthracenedicarboxylic acids were studied before and after integration into zinc based
MOFs.
Steady state and time resolved measurements were performed on three
anthracenedicarboxylic acids: 9,10-anthracenedicarboxylic acid, 2,6-
anthracendicarboxylic acid, and 1,4-anthracenedicarboxylic acid. The position of the
carboxylic acid groups on anthracene was found to effect the position and structure of the
absorption and emission spectra. The difference in the spectra is attributed to the

perturbation by the acid groups on certain electronic transitions with dipole moments
across two of the three axes of anthracene. The position of the acid groups had different
effects on the fluorescence quantum yields and lifetimes of the three anthracenic acids
studied.
Two of the linkers were synthesized into MOFs through a solvothermal reaction
with zinc nitrate, to form PCN-13, from 9,10-anthracenedicarboxylic acid, and
[Zn(C16H8O4)(H2O)]n, from 2,6-anthracenedicarboxylic acid. The luminescent
properties of the two MOFs were studied and compared to those of the free based linker.
Incorporation of the luminescent anthracenedicarboxylic acids into Zn based MOFs were
found to either increase or decrease the luminescent properties of the ligands.
iii

Acknowledgements
I would like to thank my advisor, Dr. Amanda Morris, whose support has made
this work possible. Thank you for your encouraging words and guidance. You have been
the most influential professional mentor that has made an impression on me. You have
helped me to grow both professionally and as an individual.
I would like to thank my husband, Christian, who has been by my side through
some very trying times in the past and continued to support me throughout my graduate
career. Words cannot describe how thankful I am for your constant support and love.
Without you I would not have been able to accomplish so much.
To my parents, William and Sarah Hay, I would also like to express my extreme
appreciation for their support and guidance throughout the years. I am beyond grateful to
have such amazing people, not just in my life, but as my parents as well. You two have
provided me with every opportunity possible, and have supported me in all my decisions.
I would like to express my gratitude for all of the help provided by Dr. William
Maza. Without your guidance, contributions, and willingness to teach me, I would not
have been able to accomplish so much in the lab.
I would also like to thank my committee members Dr. Karen Brewer and Dr.
Brian Hanson whose patience and support has been critical to this work. Thank you for
your guidance me throughout the years and for believing in my ability to succeed.
iv
Attribution
Throughout this research project, multiple peers have guided my work. Chapter 2
summarizes the results on the three anthracenic acids and will soon be submitted for
publication. A brief description of their contributions towards this publication has been
added here.
Chapter 2: Systematic Investigation of the Excited State Properties
Anthracenedicarboxylic Acids
Chapter 2 will be submitted to The Journal of Physical Chemistry A
Dr. William Maza, currently a post-doc in Dr. Amanda Morris’ group, provided guidance
and direction in the experimental design and analysis of the data presented in Chapter 2.
He has also contributed by attaining the fluorescence lifetimes of the three acids in
various solvents.
Robert Chapleski, a graduate student in Dr. Diego Troya’s group, performed coordinate
scan DFT calculations on the anthracenedicarboxylic acids.
v

Table of contents Abstract Acknowledgements iv Attribution v List of Figures vii List of Tables ix Chapter 1. Ligand Centered Excited State Properties of Metal Organic Frameworks
1
1.1 Luminescent Metal Organic Frameworks 1 1.2 Advantages of MOFs 2 1.3 Typical Ligands Used in MOF Synthesis 6 1.4 Coordination and Aggregation Effects of Linker-based Luminescence in MOFs
11
1.4.1 Stilbene MOFs 12 1.4.2 Anthracene MOFs 20 1.4.3 Phosphorescent MOFs 22 1.5 MOFs with Sensitizing Ligands 24 1.6 Research Goals 26 1.7 References 26 Chapter 2. Systematic Investigation of the Excited State Properties 33 Anthracenedicarboxylic Acids 2.1 Introduction 34 2.2 Materials and Methods 35 2.3 Results and Discussion 38 2.4 Conclusion 55 2.5 References 58 Chapter 3. Synthesis and Luminescent Properties of Two 62 Microporous Metal Organic Frameworks 3.1 Introduction 62 3.2 Experimental 63 3.3 Results and Discussion 65 3.4 Conclusion 79 3.5 References 81 Future Work 83 Appendix A
vi

List of Figures Figure 1-1. Band Gaps of IRMOFs 5 Figure 1-2. Luminescence of H4TCPE and MOFs 6 Figure 1-3 Common aromatic ligands used in MOFs 7 Figure 1-4. Non-interpenetrated framework of Ni(4,4’-bpy)2.5(H2O)2•(ClO4)2•1.5(4,4’-bpy)•2H2O
8
Figure 1-5. Normalized fluorescence spectra of [Mg(DHT)(DMF)2]n and photographs of each sample under UV light
12
Figure 1-6. Normalized excitation and emission profiles of powdered trans-4,4’-stilbenedicarboxylic acid and individual crystal of MOF
15
Figure 1-7. Normalized emission of stilbene MOFs 18 Figure 1-8. Solid state emission spectra at room temperature of H2L1 and H2L2 and complexes 1–5
22
Figure 1-9. Solid state luminescence spectra of phosphorescent MOFs 23 Figure 2-1. Normalized absorbance of anthracene in THF 40 Figure 2-2. Normalized absorbance and emission anthracene, 9,10-ADCA, 2,6-ADCA, 1,4-ADCA
42
Figure 2-3. Normalized absorbance of 9,10-ADCA and anthracene in THF, and DFT calculations of ground state energy as a function of the COOH and anthracene dihedral angles.
44
Figure 2-4. Normalized absorbance of 2,6-ADCA and anthracene in THF, and DFT calculations of ground state energy as a function of the COOH and anthracene dihedral angles.
46
Figure 2-5. Normalized absorbance of 1,4-ADCA and anthracene in THF, and DFT calculations of ground state energy as a function of the COOH and anthracene dihedral angles.
48
Figure 2-6. Normalized emission spectra of 9,10-ADCA and anthracene in THF. 49 Figure 2-7. Diagram of potential energy curves of 9,10-ADCA 51 Figure 2-8. Normalized emission of 2,6-ADCA and anthracene in THF 52 Figure 2-9. Normalized emission of 1,4-ADCA and anthracene in THF 53 Figure 2-10. Comparison of nuclear coordinate changes between the equilibrium excited state and the ground and Franck-Condon states.
54
Figure 2-11. Florescence decay of 9,10-, 2,6-, and 1,4-ADCA in THF 55 Figure 3-1. Secondary building unit of [Zn(C16H8O4)(H2O)]n 66 Figure 3-2. View down the crystallographic a, b, and c axis of [Zn(C16H8O4)(H2O)]n
70
Figure 3-3. Crystal structure of PCN-13 71 Figure 3-4. PXRD and TGA of PCN-13 72 Figure 3-5. PXRD and TGA of [Zn(C16H8O4)(H2O)]n 72 Figure 3-6. Normalized absorbance of 9,10- and 2,6-ADC in DMF 73 Figure 3-7. Normalized absorbance of MOFs and linkers 74 Figure 3-8. Normalized emission of 9,10-ADC 76 Figure 3-9. Normalized absorbance and emission spectra of 9,10-ADC and PCN-13 77
vii
Figure 3-10. Normalized absorbance and emission of [Zn(C16H8O4)(H2O)]n 78 Figure A1. 1H NMR of 9,10-ADCA in d-DMSO A Figure A2. 1H NMR of 2,6-ADCA in d-DMSO A Figure A3. 1H NMR of 1,4-ADCA in d-DMSO B Figure A4. Absorbance and Emission of 9,10-ADCA in AcCN Figure A5. Absorbance and Emission of 9,10-ADCA in DMF Figure A6. Absorbance and Emission of 9,10-ADCA in DMSO Figure A7. Absorbance and Emission of 9,10-ADCA in MeOH Figure A8. Absorbance and Emission of 2,6-ADCA in DMF Figure A9. Absorbance and Emission of 2,6-ADCA in DMSO Figure A10. Absorbance and Emission of 2,6-ADCA in MeOH Figure A11. Absorbance and Emission of 1,4-ADCA in AcCN Figure A12. Absorbance and Emission of 1,4-ADCA in DMF Figure A13. Absorbance and Emission of 1,4-ADCA in DMSO Figure A14. Absorbance and Emission of 1,4-ADCA in MeOH Figure A15. Frontier Orbitals of 9,10-ADCA Figure A16. Frontier Orbitals of 2,6-ADCA Figure A17. Frontier Orbitals of 1,4-ADCA Figure A18. Frontier Orbitals of Anthracene Figure A19. Normalized Absorbance of 9,10-ADCA Figure A20. Normalized Absorbance of 2,6-ADCA Figure A21. Normalized Absorbance of 1,4-ADCA Figure A22. Highest energy conformation of 9,10-ADCA
B C C D D E E F F G G H H I I J J K K
viii

List of Tables Table 1-1. Fluorescent lifetimes and pre-exponential factors of MOFs 1-6 19 Table 2-1. Summary of Steady State Absorption and Emission Data 43 Table 2-2. Summary of Fluorescence Lifetimes and Quantum Yields 55 Table 3-1. Crystal data and structure refinement for complex 1 67 Table 3-2. Bond lengths and angles for complex 1 68 Table 3-3. Hydrogen bond lengths and angles for complex 1 69 Table A1. Polarity/polarizability solvent parameter (π) vs. kr for 9,10-, 2,6-, and 1,4-ADCA.
L
Table A2. Index of hydrogen bond acceptor character (β) vs. kr for 9,10-, 2,6-, and 1,4-ADCA.
L
Table A3. Index of hydrogen bond donor character (α) vs. kr for 9,10-, 2,6-, and 1,4-ADCA.
M
Table A4. Refractive index (η) vs. kr for 9,10-, 2,6-, and 1,4-ADCA.
M
ix
Chapter 1: Ligand Centered Excited State Properties of Metal Organic Frameworks
1.1 Luminescent Metal Organic Frameworks
Metal organic frameworks (MOFs) are porous inorganic-organic hybrid materials with a
wide range of potential applications in gas storage1, catalysis2, sensors3, and separations4. These
crystalline solids are comprised of inorganic clusters connected by functionalized organic
molecules to form a 3D porous network. The chemical and physical properties of MOFs arise
from the individual building blocks, which allows them to be tuned for specific applications by
appropriate choice of metal and organic ligand. Postsynthetic modification provides additional
means of controlling the structure and properties of these materials, affording an even wider range
of possible uses.5
Luminescent MOFs can be designed for applications as sensors6, photocatalysts7,
sensitizers8, and for use in optoelectronics9-10 , often through the incorporation of luminescent
organic linkers and/or metals. Photo-excitation a MOF results in a complex that is more reactive
towards electron or proton transfer and more readily undergoes chemical reactions.7, 11 The rational
design of MOFs for photophysical applications requires an understanding of how the excited state
properties of the individual components, organic ligand and metal ions, are effected once
incorporated into a MOF. Knowledge of the dynamics of the excited state is essential to
understanding photophysical and photochemical processes and how these processes are affected
by the local environment.
Recently interest in luminescent MOFs for the sensing of gases and vapours has increased
because of the advantages these materials provide over current sensors. Due to their highly porous
1
nature, MOFs absorb analytes in greater concentrations within the system than external
environment, allowing for better and possibly more sensitive detection of gases and vapours.12
Luminescent MOFs for sensing are often comprised of rigid aromatic linkers, which provides π*
→ π or n* → π based emission which is susceptible to quenching or enhanced luminescence,
through interactions with guest species.
Luminescent MOFs have found further applications as photocatalysts in part due to their
porosity, resulting in more available catalytic sites than nonporous catalysts. They also provide the
tunability, whereupon the wavelength of excitation can be adjusted by organic linker conjugation
and functionalization, and they become better oxidants and reductants upon photoexcitation. The
ease with which MOFs may be recovered and reused provides an additional advantage for their
use as heterogeneous photcatatalysts.
Ideally luminescent MOFs may be rationally designed by selective choice of an organic
linker with desired emissive properties, but often the photophysical properties of the organic
backbone is effected by the new environment within the MOF. Reports show linker based
emission of MOFs is less structured and broadened, with increased fluorescence lifetime, τfl, and
quantum yields, Φfl due to the more rigid environment, aggregation effects, or metal-ligand
interactions.13 Although the photophysics of MOFs and their constituents has been studied
throughout the literature, a better understanding of their structure-property relationships is still
lacking. This chapter is an accumulation of the relevant literature pertaining to excited state
processes within MOFs and how they differ from their individual building blocks, with a focus on
MOFs constructed from polyaromatic ligands.
1.2 Advantages of MOFs for Luminescent Devices.
2
There are a number of benefits to using MOFs for a wide range of applications due to their
ease of synthesis, thermal stability, structure predictability, and structural integraty due to the
strong bonds between linkers and metal clusters and ions.14-15 Through the use of reticular
synthesis MOFs may be designed with predetermined structures due the formation of secondary
building units (SBUs).16 MOF synthesis is often performed using solvothermal techniques where
the organic linker and metal salt are dissolved in organic solvent(s) and heated at temperatures
ranging from room temperature to 200 °C for a couple hours to a few days.15 Alternative methods
used in the synthesis of MOFs include slow evaporation methods, microwave-assisted techniques,
electrochemical methods, and solvent free syntheses.17
Interest in fluorescent MOFs with applications as sensors and photocatalysts has flourished
as researchers have explored the effects of incorporating luminescent metals, linkers, and guest
molecules into MOFs.18-20 Upon absorption of a photon, electrons are promoted to an excited
state, where a number of radiation and radiationless relaxation processes can occur, including
internal conversion, fluorescence, intersystem crossing, and phosphorescence. All of these
processes are effected by, not only the nature of the ground and excited states of the material, but
also its microenvironment (solvent and analyte molecules, temperature, etc.). In MOFs the
luminescence can be generated from both the organic linker and inorganic salt with possible metal-
to-ligand and ligand-to-metal charge transfer. It is therefore necessary to gain an understanding of
the difference between the photophysics (quantum yields, excited state lifetimes, radiative and
nonradiative rate constants, etc.) of the individual components incorporated into MOFs, and the
photophysics of the MOF itself, if one hopes to design MOFs rationally.
3
MOFs have the highest known surface area (~3000 m2 g-1) and pore volumes (1-2 cm3 g-
1), and as a result, they have been well studied for applications in gas storage.16 It has been shown,
in the work of Yahgi et al., that by functionalization of the organic ligands, it is possible to obtain
isoreticular MOFs with differing pore volumes, suitable for gas storage and separations. In their
work with MOFs of the zeolitic imidazole framework (ZIF) series, the pore diameter was varied
from 7.1 to 15.9 Å through alteration of the imidazole linker with polar and nonpolar groups,
resulting in MOFs with selective gas absorption of CO2.21 In a similar fashion, it is possible to
design MOFs with specific excited state properties through ligand modification.
An advantage to using MOFs as sensors or photocatalysts is that they can be tuned to absorb
and/or emit light of a specific energy through appropriate choice of organic linker. An example
of the tunability of MOF properties through variation of the organic linker is observed in the work
of Mul et al.22 In their work they were able to effect the metal-to-ligand charge-transfer energy
within the IRMOF series by substitution of different carboxylate functionalized aromatic linkers
into the Zn based IRMOF series (Figure 1-1). They found that the HOMO-LUMO gap of the
IRMOFs could be decreased with increased conjugation and the addition of electron donating
substituents. A few of the MOFs under study, with absorption edge in the 400-314 nm range,
showed photocatalytic activity towards propene oxidation, with IRMOF-8, formed from 2,6-
naphthalenedicarboxylic acid, showing the highest activity.22
4

Figure 1-1. Example of tunable band gaps of the IRMOF series by substitution of aromatic linkers.
(Reprinted with permission from ChemSusChem 2008, 1 (12), 981-983.)
Excited state dynamics are susceptible to environmental effects, therefore, incorporation
of an organic molecule into a MOF may result in a compound with different excited state properties
than molecule on its own. In some cases, incorporation of a luminescent ligand into a more rigid
environment like a MOF may result in benefits like increased quantum yields and lifetimes. Such
an effect is observed when tetrakis(4-carboxyphenyl)ethylene (TCPE4-) is used as a ligand in a d10
metal-centered MOFs of the formulas (Zn2(C30H16O8)(H2O)•4DEF (1) and
Cd2(C30H16O8)(DEF)(C2H5OH)2•DEF (2)). The phenyl rings of tetraphenylethylene(TPE) rotate
freely in dilute solutions, resulting in quenched fluorescence, but upon aggregate formation in
solution or in the solid state, these rotations are hindered and emission is observed.23 Dincă and
co-workers found that MOFs 1 and 2 exhibit similar fluorescence to the solid linker, H4TCPE,
with emission maxima for the MOFs at 480 nm (1) and 455 nm (2) (Figure 1-2).24 The
fluorescence of the MOFs decay in a biexponential manner similar to the solid linker.
5

Figure 1-2. Solid state diffuse reflectance (dotted lines) and emission (solid lines) spectra of
H4TCPE (blue), 1 (red), and 2 (green), and an epifluorescence microscopy image for a crystal of
2 (inset). (Reprinted with permission from Journal of the American Chemical Society 2011, 133
(50), 20126-20129. Copyright (2014) American Chemical Society)
The emission from MOFs 1 and 2 are linker based, but results not from aggregation effects
as in the solid linker, but from the rigidity of the MOF environment. Solid-state 1H and 13C NMR
studies and DFT calculations were conducted by Dincă and co-workers25 on the Zn based MOF to
determine the dynamics of the phenyl ring systems. They found that the activation energy of the
phenyl ring flip in the orthorhombic form of the MOF to be 43(6) kJ/mol, which is greater than
free TPE (20 kJ/mol), and believed to be the cause of the fluorescence turn-on in the MOF.25
1.3 Typical Ligands Used in MOF Synthesis
Organic ligands used in MOF synthesis may range from simple molecules like terephthalic
acid, used in the synthesis26 of IRMOF-1, to complex compounds such as 5,5’-(naphthalene-2,6-
diyl)diisophthalic acid, used in the synthesis27 of a scintillating MOF. The choice of ligand is
generally dependent on the intended application and/or desired topology. Ligands are
6
functionalized with groups capable of forming strong bonds with metals. These groups often
include, but are not limited to, carboxylates16, 28, amines29, pyridines30, and phosphates31.
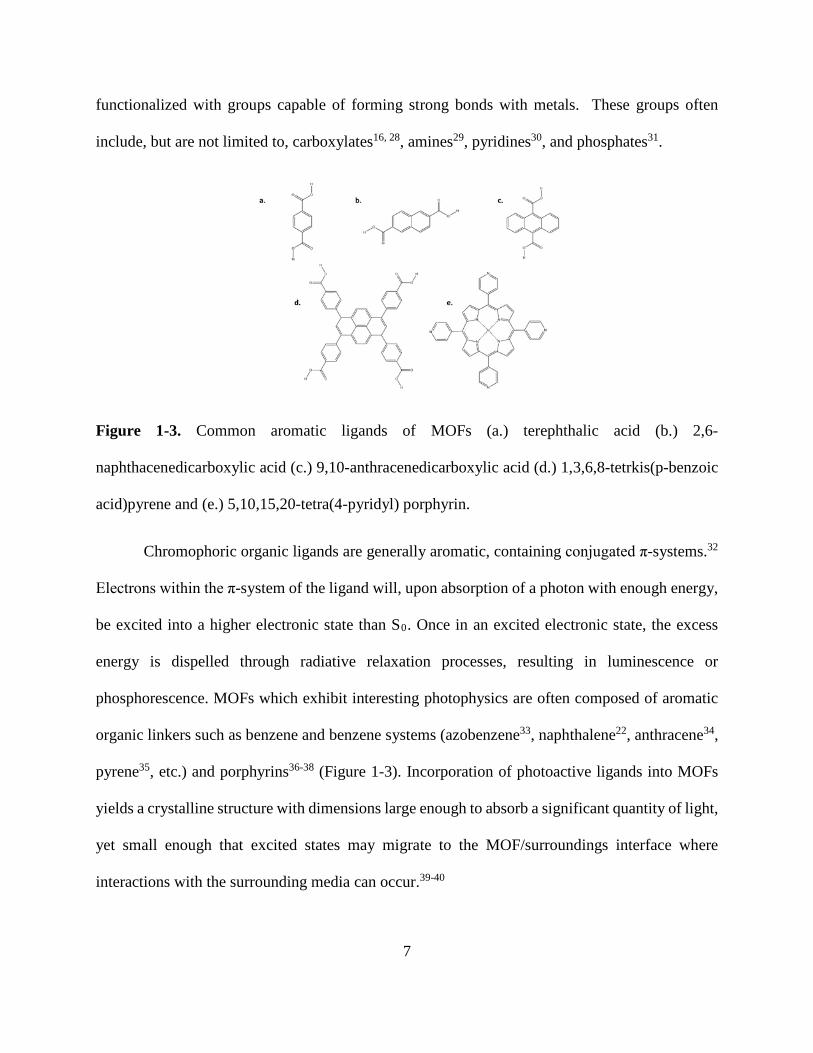
Figure 1-3. Common aromatic ligands of MOFs (a.) terephthalic acid (b.) 2,6-
naphthacenedicarboxylic acid (c.) 9,10-anthracenedicarboxylic acid (d.) 1,3,6,8-tetrkis(p-benzoic
acid)pyrene and (e.) 5,10,15,20-tetra(4-pyridyl) porphyrin.
Chromophoric organic ligands are generally aromatic, containing conjugated π-systems.32
Electrons within the π-system of the ligand will, upon absorption of a photon with enough energy,
be excited into a higher electronic state than S0. Once in an excited electronic state, the excess
energy is dispelled through radiative relaxation processes, resulting in luminescence or
phosphorescence. MOFs which exhibit interesting photophysics are often composed of aromatic
organic linkers such as benzene and benzene systems (azobenzene33, naphthalene22, anthracene34,
pyrene35, etc.) and porphyrins36-38 (Figure 1-3). Incorporation of photoactive ligands into MOFs
yields a crystalline structure with dimensions large enough to absorb a significant quantity of light,
yet small enough that excited states may migrate to the MOF/surroundings interface where
interactions with the surrounding media can occur.39-40
7
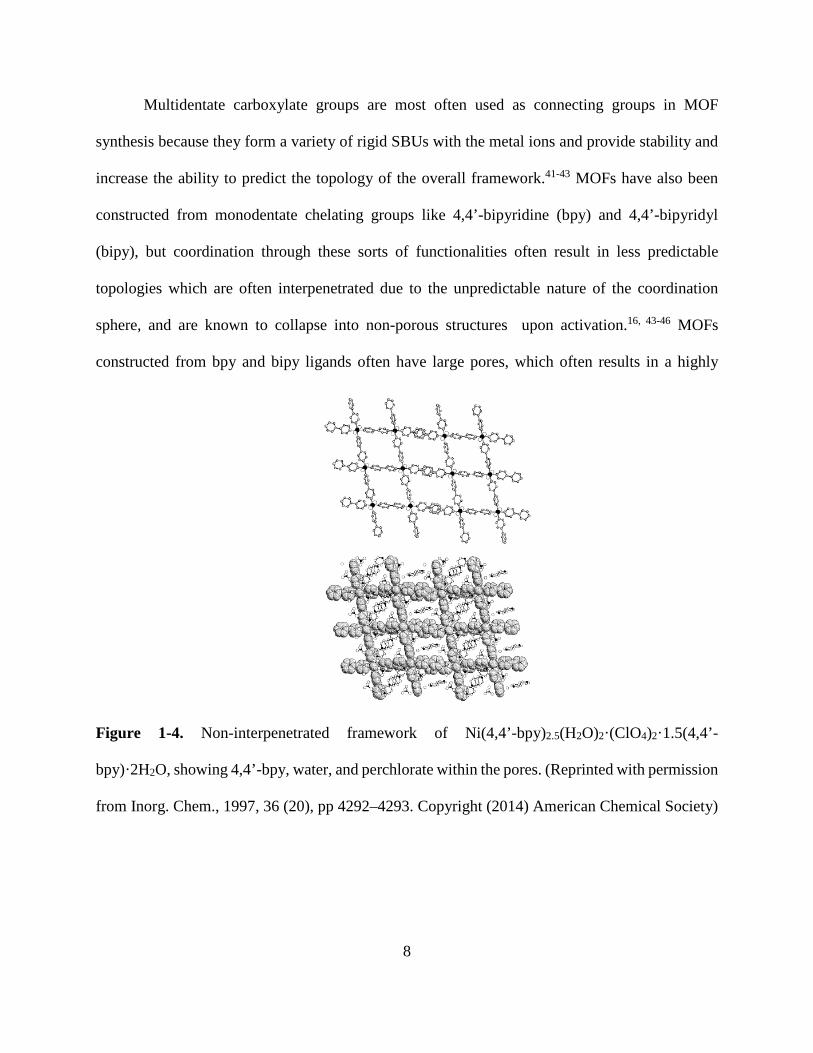
Multidentate carboxylate groups are most often used as connecting groups in MOF
synthesis because they form a variety of rigid SBUs with the metal ions and provide stability and
increase the ability to predict the topology of the overall framework.41-43 MOFs have also been
constructed from monodentate chelating groups like 4,4’-bipyridine (bpy) and 4,4’-bipyridyl
(bipy), but coordination through these sorts of functionalities often result in less predictable
topologies which are often interpenetrated due to the unpredictable nature of the coordination
sphere, and are known to collapse into non-porous structures upon activation.16, 43-46 MOFs
constructed from bpy and bipy ligands often have large pores, which often results in a highly
Figure 1-4. Non-interpenetrated framework of Ni(4,4’-bpy)2.5(H2O)2·(ClO4)2·1.5(4,4’-
bpy)·2H2O, showing 4,4’-bpy, water, and perchlorate within the pores. (Reprinted with permission
from Inorg. Chem., 1997, 36 (20), pp 4292–4293. Copyright (2014) American Chemical Society)
8
interpenetrated network. One example of interpenetrated bpy networks was observed with
Ag(4,4’-bpy)·NO3, which is composed of three interpenetrated chains cross-linked in a near
orthogonal geometry.45 Yaghi et al. has shown that it is possible to prevent interpenetrated
structures through the inclusion of hydrogen-bonded guest aggregates within the pores of the
MOF. The use of space filling guests, like hydrogen-bonded hydrate ions and bpy aggregates, were
shown to prevent interpenetrated frameworks in the case of Ni(4,4’-
bpy)2.5(H2O)2·(ClO4)2·1.5(4,4’-bpy)·2H2O (Figure 1-4).44
Absorption and emission processes in MOFs composed of aromatic linkers can occur
through electronic interactions between the ligand and the metal clusters or they may be primarily
ligand or metal based. In aromatic ligands like those listed above, the electronic transitions
between the HOMO and LUMO are π → π* based. Once incorporated into a MOF, the HOMO
and LUMO may still reside on the π-system or, as a result of orbital overlap and electronic effects
due to functional groups and chelation, the frontier orbitals may reside on the metal or metal
clusters. An a example of a shift in the location of the HOMO and LUMO from purely linker based
to linker and metal, is observed when 2,2’-dihydroxy-[1,1’]-binaphthalene-3,3’-dicarboxylic acid
(H2bna) is integrated into Cd(II) or Zn(II) based MOFs.47 Wong et al. found that the luminescence
of the MOF was more intense than solid H2Bna and longer lived due to ligand complexation with
d10 metal-hydroxy (or oxy) clusters, which provides stability to the ligand, resulting in fewer
pathways of radiationless decay. Theoretical calculations showed that the HOMO and LUMO of
the ligand are associated with the π-system of the naphthalene derivative but, in the case of the
MOF, the HOMO still resides on the ligand but the LUMO is d10-metal-oxygen based resulting in
ligand-to-metal charge transfer (LMCT) emission.
9
Aromatics molecules containing heteroatoms provide another characteristic transition, n
→ π*, when the non-bonding orbitals are higher in energy than the π orbitals of the conjugated
system, the n → π* will be the lowest lying transition. In the case of 1,3,5-benzenetricarboxylic
acid (H3BTC), a common ligand in MOF synthesis48-50, the lowest energy transition in the
absorption spectrum is the n → π* transition, with the π → π* transition appearing at shorter
wavelengths. Fang et al. have incorporated BTC into Zn and Cd frameworks and found the
emission is π*→ n based and red-shifted relative to the free based linker.48 The similar shape and
location of the fluorescence of the Zn and Cd BTC MOFs are very similar to free H3BTC,
suggesting that the emission is primarily linker based with little perturbation resulting from
coordination to the metal sites.
Phosphorescent MOFs are promising candidates for sensing materials because intersystem
crossing from an excited singlet to triplet state results in a large bathochromic shift between the
absorption and emission, which simplifies device configuration by reducing the interference of the
excitation beam.51 Phosphorescent metal complexes, like Ru(bpy)3, have been incorporated into
the MOFs because of the ability of the complex to absorb light over a broad range of wavelengths
and because the dynamics of the 3MLCT excited states are well understood. Kent et al.
incorporated Ru(II)-bpy building blocks into a series of Zn based MOFs of the molecular formulas
[ZnL1]·2DMF·4H2O (MOF-1) and [Zn(L2-H2)]·3H2O (MOF-2), where L1 is [Ru[4,4’-(CO2)2-
bpy]2(bpy)]2- and L2-H2 is [Ru[4,4’-bpy)]2(CN)2]4-.40 MOFs 1 and 2 exhibited light harvesting
abilities due to the Ru(II)-bpy building blocks, and were capable of long-range electron migration
to the MOF/solution interface where oxidative or reductive quenching could occur through
interactions with 1,4-benzoquinone (oxidative quencher) or N,N,N’,N’-tetramethylbenzidine
(reductive quencher). The introduction of the cationic quencher methylene blue was found to 10

amplify the quenching of emission of MOF-2 by 7000 fold compared to quenching of free
Ru(bpy)2CN2.51
Luminescent ligands capable of excited state electron or proton transfer provide interesting
photophysical properties when incorporated into a MOF. Organic ligands capable of excited state
intramolecular proton transfer (ESIPT) have been incorporated into MOFs to tune the emission.11,
52 Jayaramulu et al. synthesized a MOF of the formula [Mg(DHT)(DMF)2]n where DHT is 2,5-
dihydroxy-terephthalate, a ligand capable of proton transfer in its excited state, through the process
of enol to keto tautomerization.11 The excited state proton transfer capabilities of the MOF allowed
for its emission to be “tuned” through the use of solvent molecules in both solution and in the solid
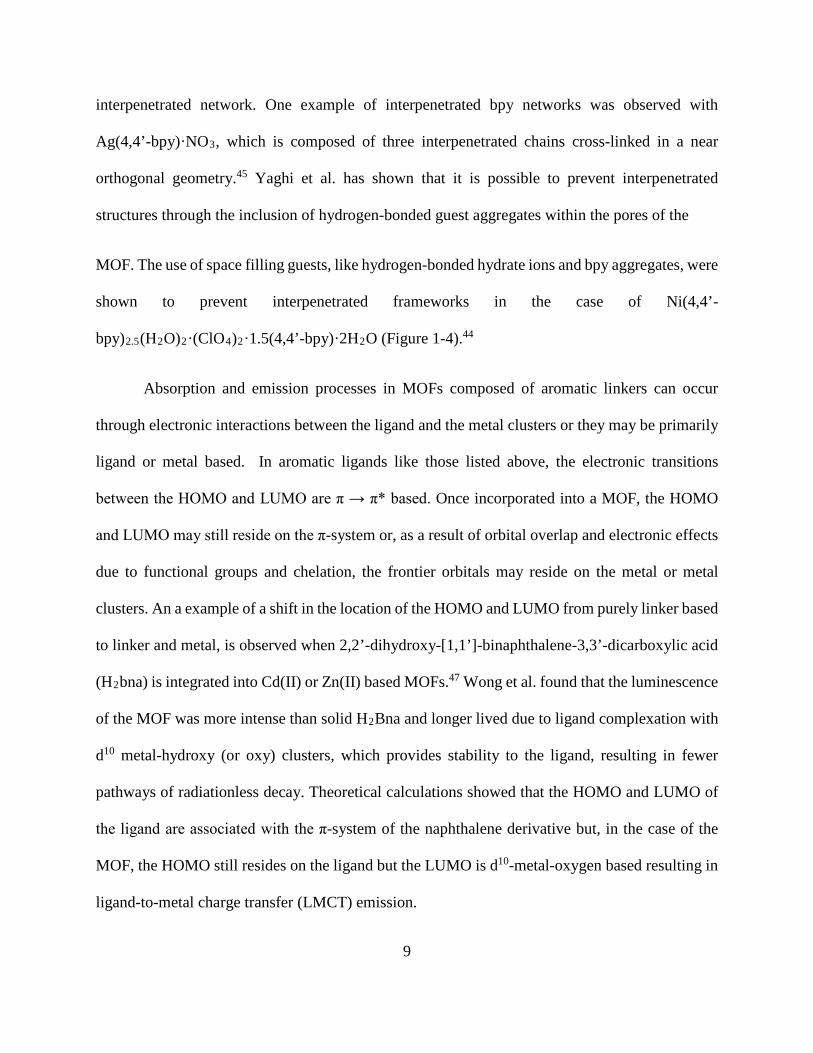
state (Figure 1-5)11. The freebased linker H2DHT emits in the green in polar aprotic solvents like
DMF and DMSO, with maxima 510 nm. In protic solvents like ethanol, DHT emits in the blue
with a maximum around 440 nm. The shift in the emission is believed to be due to additional
excited state processes like ESIPT, where the blue emission is attributed to the enol isomer and
the green emission is attributed to the keto isomer of free DHT. The presence of uncomplexed
hydroxide groups of DHT allows the MOF to exhibit tunable emission due to ESIPT. The MOF
displays a blue emission in ethanol and trifluoroacetic acid (TFA) acidified DMSO. In ethanol and
acidified DMSO, DHT is present as the enol isomer due to the formation of intermolecular
hydrogen bonds preventing the ESIPT process from occurring. In water and DMSO, DHT is
present as the keto isomer as a result of ESIPT and exhibits yellow and green emission,
respectively. In DMF the MOF emits in the blue to yellow range, suggesting that various exited
state processes are involved.11 Desolvation of the [Mg(DHT)]n framework was shown to result in
selective sensing of Cu(II), due to luminescence quenching, in both DMSO and the solid state. The
11
MOF was shown to be reusable through the process of removing the Cu(II) ions, using the
chelating agent EDTA, without framework collapse.53
1.4 Coordination and Aggregation Effects on Linker-based Luminescence in MOFs
Throughout the literature it has been shown that the emission of MOFs containing
aromatic ligands is effected by metal coordination and chromophore proximity. Often the emission
spectra of the MOF incorporated ligand is shifted and broadened relative to the free based linker.
The following section will primarily focus on these types of effects as they pertain to stilbene, a
linker that has been well studied in solution, the solid state, and upon incorporation into MOFs.
1.4.1 Stilbene MOFs. Stilbene has been incorporated into MOFs in the form of 4,4′-dicarboxylic
acid and its derivatives. MOFs constructed from stilbene linkers form 3D open porous structures
Figure 1-5. (Top) Normalized fluorescence spectra of [Mg(DHT)(DMF)2]n and photographs of
each sample under UV light; (a) ethanol, (b) DMSO, (c) water, and (d) DMF. (Bottom) Normalized
fluorescence spectra of [Mg(DHT)(DMF)2]n after grinding with solvents and photographs of each
sample under UV light; (a) TFA, (b) DMSO, and (c) water. (Reproduced from Chem. Commun.,
2010,46, 7906-7908 with permission of The Royal Society of Chemistry.)
12
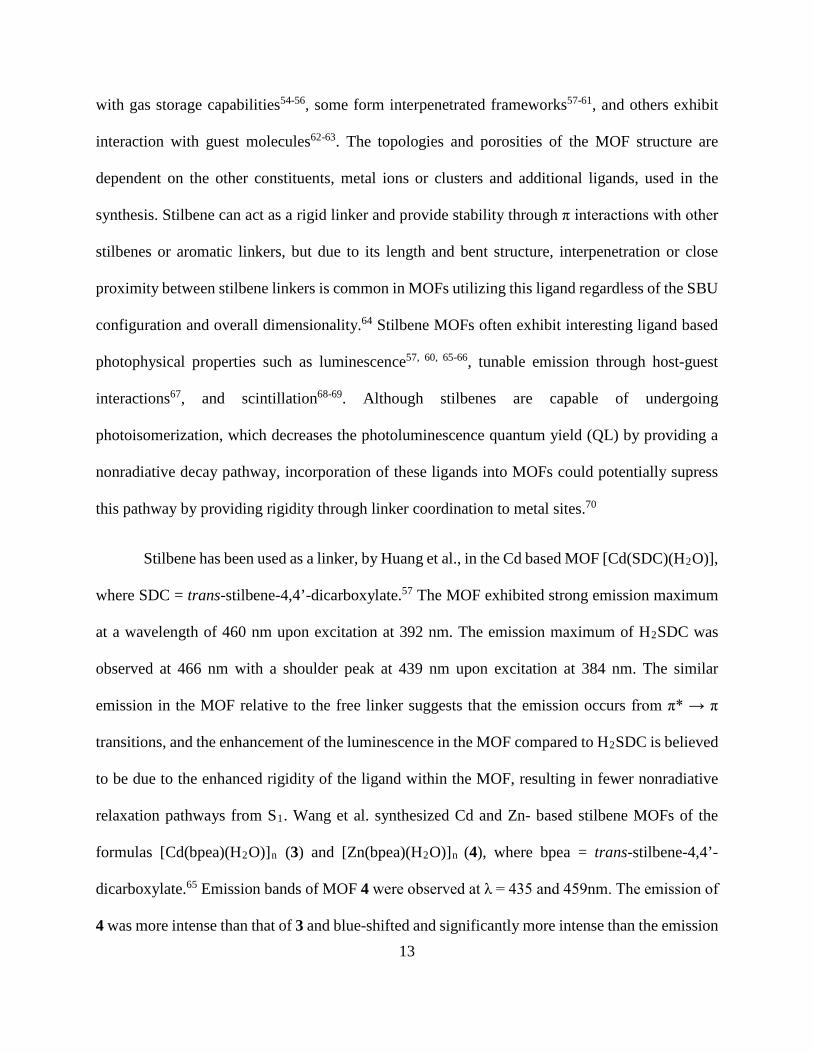
with gas storage capabilities54-56, some form interpenetrated frameworks57-61, and others exhibit
interaction with guest molecules62-63. The topologies and porosities of the MOF structure are
dependent on the other constituents, metal ions or clusters and additional ligands, used in the
synthesis. Stilbene can act as a rigid linker and provide stability through π interactions with other
stilbenes or aromatic linkers, but due to its length and bent structure, interpenetration or close
proximity between stilbene linkers is common in MOFs utilizing this ligand regardless of the SBU
configuration and overall dimensionality.64 Stilbene MOFs often exhibit interesting ligand based
photophysical properties such as luminescence57, 60, 65-66, tunable emission through host-guest
interactions67, and scintillation68-69. Although stilbenes are capable of undergoing
photoisomerization, which decreases the photoluminescence quantum yield (QL) by providing a
nonradiative decay pathway, incorporation of these ligands into MOFs could potentially supress
this pathway by providing rigidity through linker coordination to metal sites.70
Stilbene has been used as a linker, by Huang et al., in the Cd based MOF [Cd(SDC)(H2O)],
where SDC = trans-stilbene-4,4’-dicarboxylate.57 The MOF exhibited strong emission maximum
at a wavelength of 460 nm upon excitation at 392 nm. The emission maximum of H2SDC was
observed at 466 nm with a shoulder peak at 439 nm upon excitation at 384 nm. The similar
emission in the MOF relative to the free linker suggests that the emission occurs from π* → π
transitions, and the enhancement of the luminescence in the MOF compared to H2SDC is believed
to be due to the enhanced rigidity of the ligand within the MOF, resulting in fewer nonradiative
relaxation pathways from S1. Wang et al. synthesized Cd and Zn- based stilbene MOFs of the
formulas [Cd(bpea)(H2O)]n (3) and [Zn(bpea)(H2O)]n (4), where bpea = trans-stilbene-4,4’-
dicarboxylate.65 Emission bands of MOF 4 were observed at λ = 435 and 459nm. The emission of
4 was more intense than that of 3 and blue-shifted and significantly more intense than the emission 13

observed for the free linker in the solid state (λ = 441 and 465 nm). The blue-shift is attributed
differences in the orbitals involved in the emission process of the MOF relative to the free linker.
Linker emission is believed to result from a π* → π transition, whereas, upon coordination to metal
ions in the MOFs, the radiative transition develops n* → π character, and hence a slight blue-shift
is observed in the MOF relative to the free linker. The enhancement of the luminescence is, again,
believed to be a result of coordination to the metal ion, thereby reducing the intraligand
nonradiative processes. The difference in emission intensity between MOFs 3 and 4 is assumed
to be due to differences in the ability of the metal ions to polarize the electron density of the oxygen
atoms. Stilbene has also been incorporated into Zn-based MOFs, where other ligands such as
pyridine (py), 4,4’-bipyridine (4,4’-bpy), 1,2-bis(4-pyridyl)ethane (bpea/L2), and 4-(4-((E)-2-
(pyridin-4-yl)vinyl)- styryl)pyridine (L1) are also incorporated into the framework.60, 66 The
luminescence of these MOFs have been attributed to intraligand π* → π transitions with influences
from the metal center and the coupling of electronic states between chromophores.70
In an effort to understand the effects of ligand coordination and local environment on the
luminescent properties of stilbene MOFs, Baur et al. synthesized two stilebene/Zn MOFs with
different topologies using the same starting materials, but under different reaction conditions to
yield Zn3L3(DMF)2 (5) and Zn4OL3 (6), where L = trans-4,4’-stilbene dicarboxylate.70 MOF 5
was synthesized by solvothermal methods in DMF to yield a 2-D MOF with layers consisting of
hexagonal networks of trinuclear Zn3-(RCO2)6 SBUs connected by organic trans-4,4’-
stilbenedicarboxylate links. The stilbene linkers remain planar due to the symmetry of the SBU in
which the bridging carboxylate groups connect the Zn atoms through a nonplanar syn-skew
geometry.70 MOF 6 was synthesized solvothermally in DEF, which afforded a 3-D framework
14

with Zn4O(RCO2)6 SBUs connected by trans-stilbene links, which are distorted slightly more than
the linker in 5 but still remain essentially planar.
The difference in topology of MOFs 5 and 6 seemed to effect the luminescence properties
of the stilbene linker, as is indicated by the differences observed in their excitation and emission
Figure 1-6. Normalized excitation (red) and emission (blue) profiles of (top) powdered trans-4,4’-
stilbenedicarboxylic acid (excitation at λ = 350 nm , (middle) individual crystal of MOF 5 soaked
in chloroform (excitation at λ = 350 nm), and (top) chloroform soaked crystal of MOF 6 (excitation
at λ = 325 nm). Excitation spectra of all three were detected at λ = 450 nm. (Reprinted with
permission from J. Am. Chem. Soc., 2007, 129 (22), pp 7136–7144. Copyright (2014) American
Chemical Society)
15
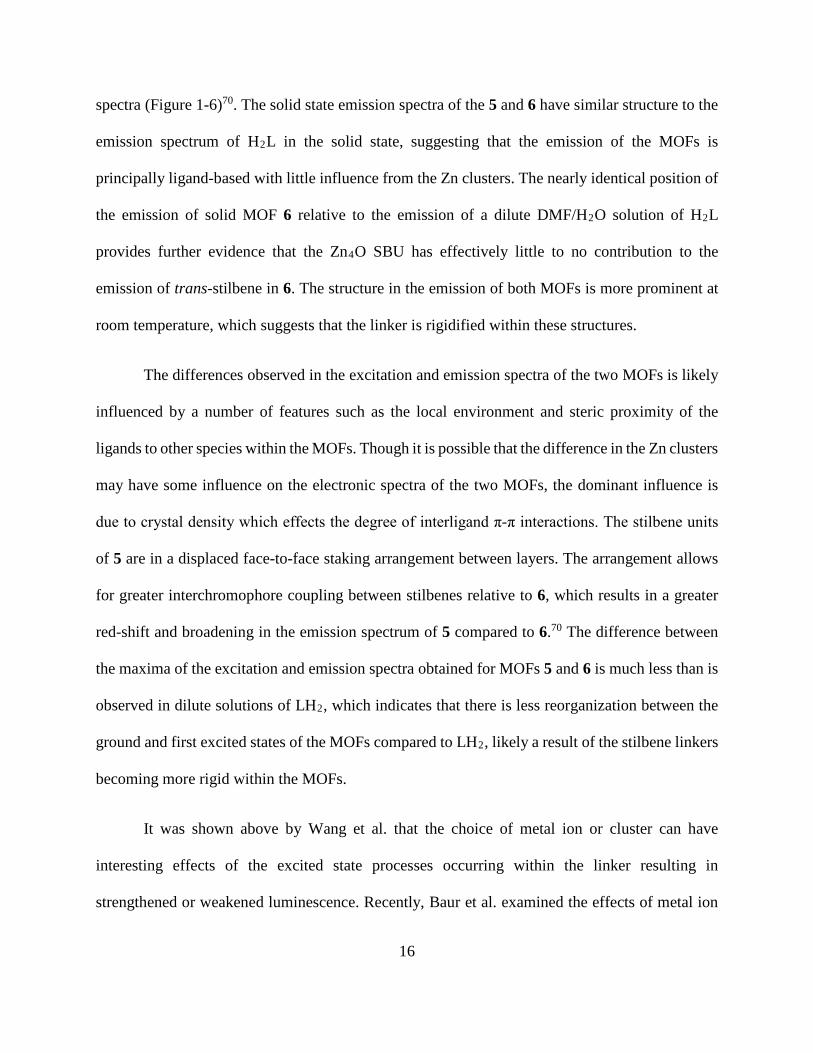
spectra (Figure 1-6)70. The solid state emission spectra of the 5 and 6 have similar structure to the
emission spectrum of H2L in the solid state, suggesting that the emission of the MOFs is
principally ligand-based with little influence from the Zn clusters. The nearly identical position of
the emission of solid MOF 6 relative to the emission of a dilute DMF/H2O solution of H2L
provides further evidence that the Zn4O SBU has effectively little to no contribution to the
emission of trans-stilbene in 6. The structure in the emission of both MOFs is more prominent at
room temperature, which suggests that the linker is rigidified within these structures.
The differences observed in the excitation and emission spectra of the two MOFs is likely
influenced by a number of features such as the local environment and steric proximity of the
ligands to other species within the MOFs. Though it is possible that the difference in the Zn clusters
may have some influence on the electronic spectra of the two MOFs, the dominant influence is
due to crystal density which effects the degree of interligand π-π interactions. The stilbene units
of 5 are in a displaced face-to-face staking arrangement between layers. The arrangement allows
for greater interchromophore coupling between stilbenes relative to 6, which results in a greater
red-shift and broadening in the emission spectrum of 5 compared to 6.70 The difference between
the maxima of the excitation and emission spectra obtained for MOFs 5 and 6 is much less than is
observed in dilute solutions of LH2, which indicates that there is less reorganization between the
ground and first excited states of the MOFs compared to LH2, likely a result of the stilbene linkers
becoming more rigid within the MOFs.
It was shown above by Wang et al. that the choice of metal ion or cluster can have
interesting effects of the excited state processes occurring within the linker resulting in
strengthened or weakened luminescence. Recently, Baur et al. examined the effects of metal ion
16

choice on linker based luminescence of a series of 8 isostructural homo- and heterometallic 2-D
MOFs composed of trans-4,4’-stilbene dicarboxylate (L) and Cd, Co, Mn, and/or Zn.64 MOFs
were synthesized using solvothermal methods and DMF as the solvent, which yielded 8 MOFs of
the formula M12M2 L3(DMF)2, where MOF the homometallic structures 7-10 consist of (7) M1 =
M2 = Zn, (8) = Cd, (9) = Mn, and (10) = Co, and the heterometallic structures consist of (11) M1
= Zn, and M2 = Cd, (12) = Mn, (13) = Co, and (14) M1 = Co, M2 = Mn. The isostructural MOFs
exhibit trinuclear SBUs consisting of a central M2(II) ions coordinated octahedrally, connected,
through bridging carboxylate groups, to two tetrahedral-coordinated M1(II) ions, which are also
coordinated to two DMF molecules.64 The trans-stilbene linker connects the SBUs and forms a 2-
D hexagonal pinwheel network extending outwards into the a,b-plane; these 2-D layers pack in a
staggered fashion to give a dense structure with pore spaces filled with DMF molecules.64
Steady-state fluorescence studies were conducted on MOFs 7-9 and 11-13 using an
excitation wavelength of 350 nm (Figure 1-7a)64. Fluorescence lifetimes were measured by
exciting the samples at 330 nm using a sub-nanosecond excitation pulse, and detecting the resulting
emission at 440 nm, and fitting the signal decay to a model which deconvoluted the sample signal
from the excitation pulse. The emission spectra of MOFs 7-9 and 11-13 exhibit fine structure and
several vibronic bands similar to the vibronic structure observed in the emission of trans-stilbene
in solution and in the solid state, indicating the emission of the MOFs are primarily ligand based.
The small red-shift observed in the emission profiles of the MOFs relative to an aqueous solution
of stilbenedicarboxylate sodium salt (Na2L), is attributed to intermediate electronic coupling
between stilbene units (Figure 1-7b)64. The emission spectrum of powdered trans-stilbene-4,4’-
dicarboxylic acid (H2L) is even further red-shifted than the MOFs and is significantly broadened
as a result of extensive coupling between the aromatic molecules in the solid state (Figure 1-7b)64. 17
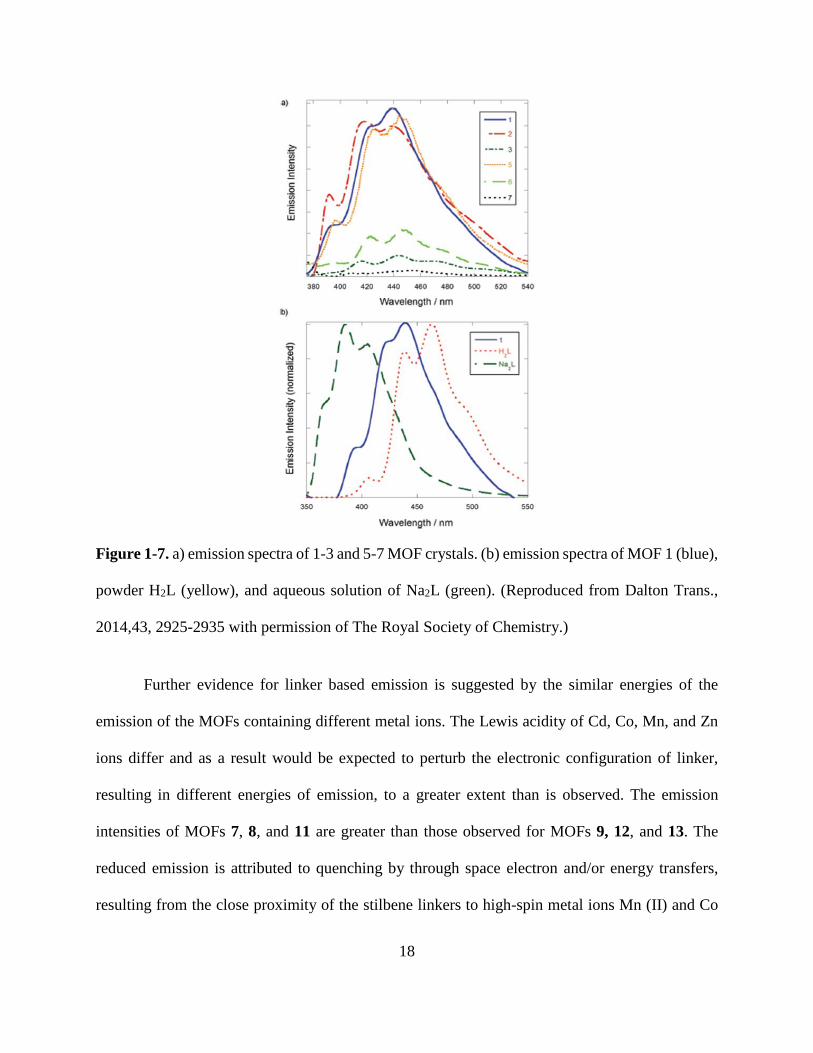
Further evidence for linker based emission is suggested by the similar energies of the
emission of the MOFs containing different metal ions. The Lewis acidity of Cd, Co, Mn, and Zn
ions differ and as a result would be expected to perturb the electronic configuration of linker,
resulting in different energies of emission, to a greater extent than is observed. The emission
intensities of MOFs 7, 8, and 11 are greater than those observed for MOFs 9, 12, and 13. The
reduced emission is attributed to quenching by through space electron and/or energy transfers,
resulting from the close proximity of the stilbene linkers to high-spin metal ions Mn (II) and Co
Figure 1-7. a) emission spectra of 1-3 and 5-7 MOF crystals. (b) emission spectra of MOF 1 (blue),
powder H2L (yellow), and aqueous solution of Na2L (green). (Reproduced from Dalton Trans.,
2014,43, 2925-2935 with permission of The Royal Society of Chemistry.)
18
(II), with S = 5/2 and S = 3/2, respectively.64 These quenching processes do not occur in the
structures containing d10 metal ions, Zn and Cd. The lack of emission from MOFs 10 and 14 is
believed to be due to reabsorption of any weak luminescence by the higher concentrations of Co(II)
ions within the structures.
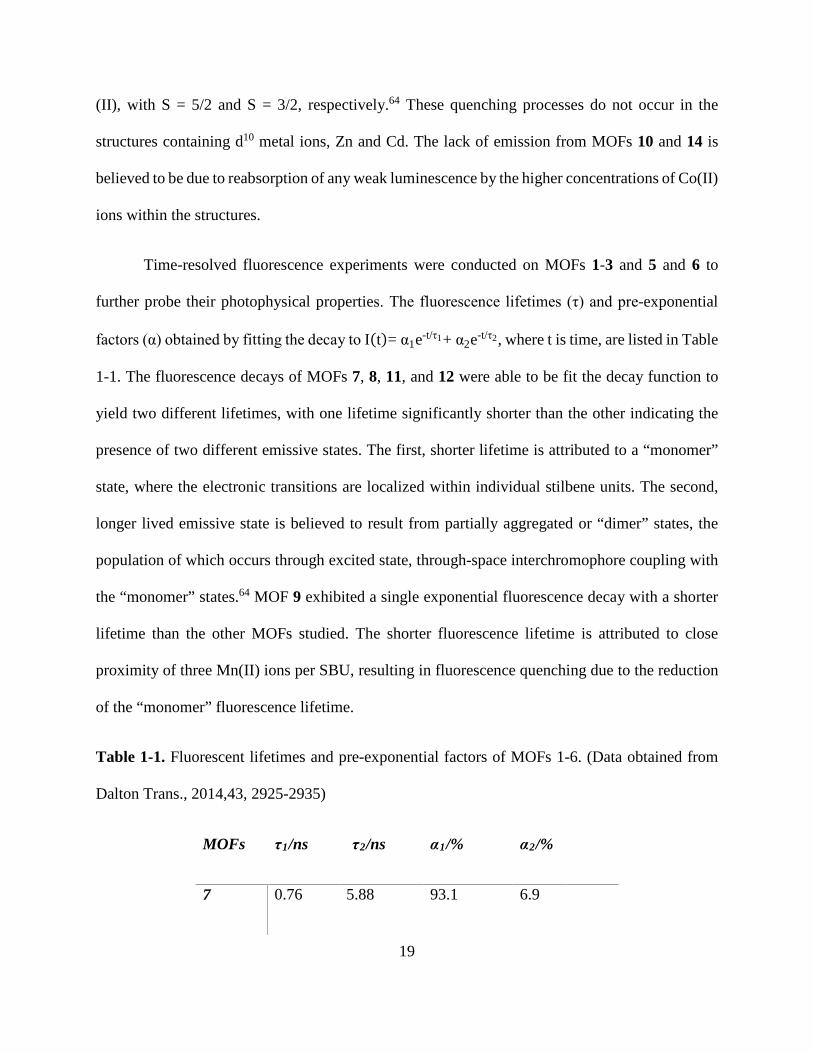
Time-resolved fluorescence experiments were conducted on MOFs 1-3 and 5 and 6 to
further probe their photophysical properties. The fluorescence lifetimes (τ) and pre-exponential
factors (α) obtained by fitting the decay to I(t)= α1e-t/τ1+ α2e-t/τ2, where t is time, are listed in Table
1-1. The fluorescence decays of MOFs 7, 8, 11, and 12 were able to be fit the decay function to
yield two different lifetimes, with one lifetime significantly shorter than the other indicating the
presence of two different emissive states. The first, shorter lifetime is attributed to a “monomer”
state, where the electronic transitions are localized within individual stilbene units. The second,
longer lived emissive state is believed to result from partially aggregated or “dimer” states, the
population of which occurs through excited state, through-space interchromophore coupling with
the “monomer” states.64 MOF 9 exhibited a single exponential fluorescence decay with a shorter
lifetime than the other MOFs studied. The shorter fluorescence lifetime is attributed to close
proximity of three Mn(II) ions per SBU, resulting in fluorescence quenching due to the reduction
of the “monomer” fluorescence lifetime.
Table 1-1. Fluorescent lifetimes and pre-exponential factors of MOFs 1-6. (Data obtained from
Dalton Trans., 2014,43, 2925-2935)
MOFs τ1/ns τ2/ns α1/% α2/%
7 0.76 5.88 93.1 6.9
19
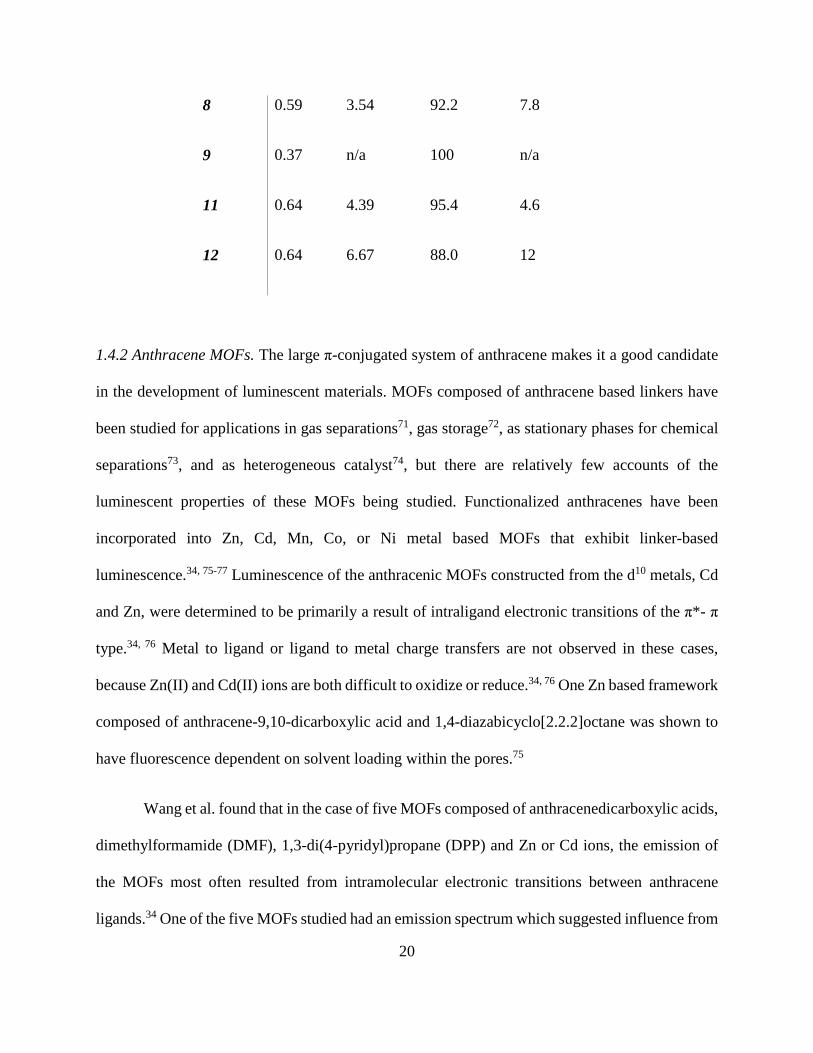
8 0.59 3.54 92.2 7.8
9 0.37 n/a 100 n/a
11 0.64 4.39 95.4 4.6
12 0.64 6.67 88.0 12
1.4.2 Anthracene MOFs. The large π-conjugated system of anthracene makes it a good candidate
in the development of luminescent materials. MOFs composed of anthracene based linkers have
been studied for applications in gas separations71, gas storage72, as stationary phases for chemical
separations73, and as heterogeneous catalyst74, but there are relatively few accounts of the
luminescent properties of these MOFs being studied. Functionalized anthracenes have been
incorporated into Zn, Cd, Mn, Co, or Ni metal based MOFs that exhibit linker-based
luminescence.34, 75-77 Luminescence of the anthracenic MOFs constructed from the d10 metals, Cd
and Zn, were determined to be primarily a result of intraligand electronic transitions of the π*- π
type.34, 76 Metal to ligand or ligand to metal charge transfers are not observed in these cases,
because Zn(II) and Cd(II) ions are both difficult to oxidize or reduce.34, 76 One Zn based framework
composed of anthracene-9,10-dicarboxylic acid and 1,4-diazabicyclo[2.2.2]octane was shown to
have fluorescence dependent on solvent loading within the pores.75
Wang et al. found that in the case of five MOFs composed of anthracenedicarboxylic acids,
dimethylformamide (DMF), 1,3-di(4-pyridyl)propane (DPP) and Zn or Cd ions, the emission of
the MOFs most often resulted from intramolecular electronic transitions between anthracene
ligands.34 One of the five MOFs studied had an emission spectrum which suggested influence from
20

the coordinated metal ions. The five MOFs of the formulas: [Cd4(L1)2(DPP)2(DMF)2(SO4)2]n
(15), [Zn2(L1)(DPP)2Cl2]n (16), [Cd(L2)(DPP)]n (17), [Zn(L2)(DPP)]n (18), and
([Cd2(L2)Cl4][((CH3)2NH2]2)n (19), where synthesized in a solvothermal reaction with
anthracene-9,10-dicarboxylic acid (H2L1) or anthracene-1,5-dicarboxylic acid (H2L2) and CdII or
ZnII ions.34 The solid state emission spectra of the five MOFs and the ligands, H2L1 and H2L2, are
shown in Figure 1-834. All of the complexes exhibited luminescence with either the purple, green,
or blue emission. MOFs 17-19 showed intense emission upon excitation at 386, 385, and 380 nm,
respectively. 17-19 exhibit emission maxima at 442/485/529, 433/485/524, and 434/520 nm,
respectively. Complexes 15, and 17-19 show similar emissive structure to the ligands in the solid
state, which indicates that the intraligand transfer π*–π transitions are the dominant source of the
emission.34 MOF 16 has a blue shifted emission spectrum of ~70 nm, relative to H2L1 in the solid
state. The blue shift of the emission spectrum of 16 relative to the ligand may be due to increased
rigidity and asymmetry of the ligand upon complexation to the metal center, which reduces the
nonradiative decay from the intraligand excited state.
21
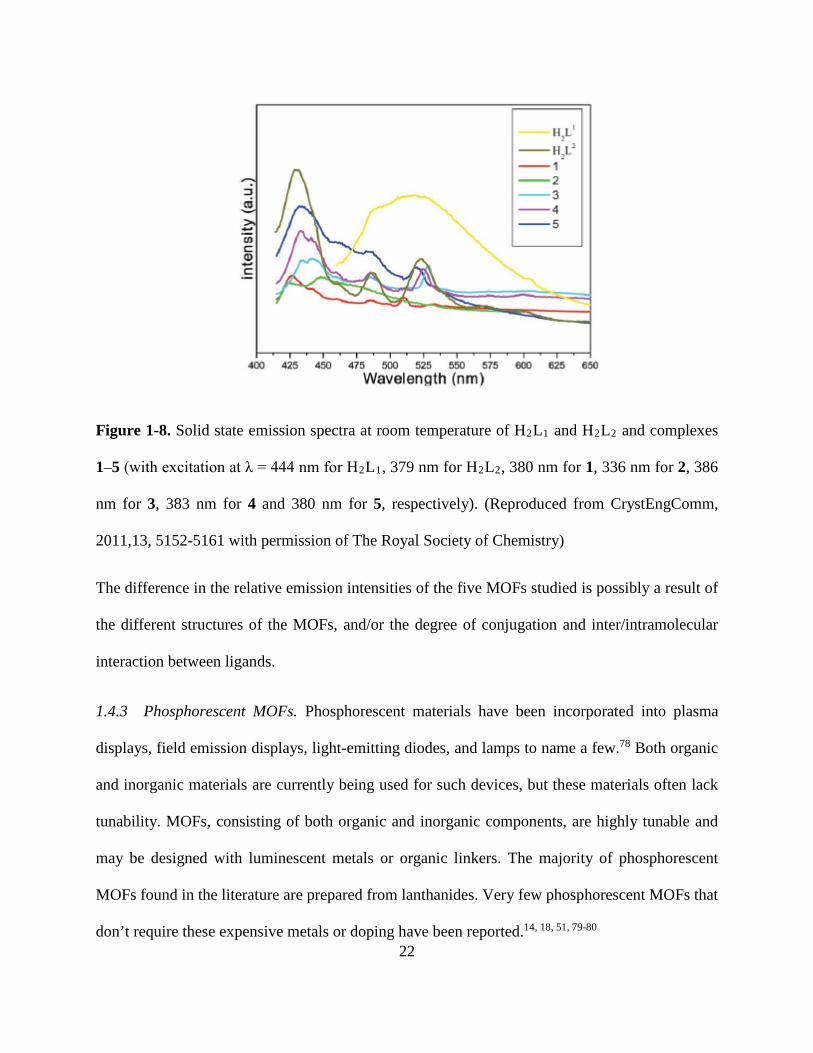
Figure 1-8. Solid state emission spectra at room temperature of H2L1 and H2L2 and complexes
1–5 (with excitation at λ = 444 nm for H2L1, 379 nm for H2L2, 380 nm for 1, 336 nm for 2, 386
nm for 3, 383 nm for 4 and 380 nm for 5, respectively). (Reproduced from CrystEngComm,
2011,13, 5152-5161 with permission of The Royal Society of Chemistry)
The difference in the relative emission intensities of the five MOFs studied is possibly a result of
the different structures of the MOFs, and/or the degree of conjugation and inter/intramolecular
interaction between ligands.
1.4.3 Phosphorescent MOFs. Phosphorescent materials have been incorporated into plasma
displays, field emission displays, light-emitting diodes, and lamps to name a few.78 Both organic
and inorganic materials are currently being used for such devices, but these materials often lack
tunability. MOFs, consisting of both organic and inorganic components, are highly tunable and
may be designed with luminescent metals or organic linkers. The majority of phosphorescent
MOFs found in the literature are prepared from lanthanides. Very few phosphorescent MOFs that
don’t require these expensive metals or doping have been reported.14, 18, 51, 79-80 22
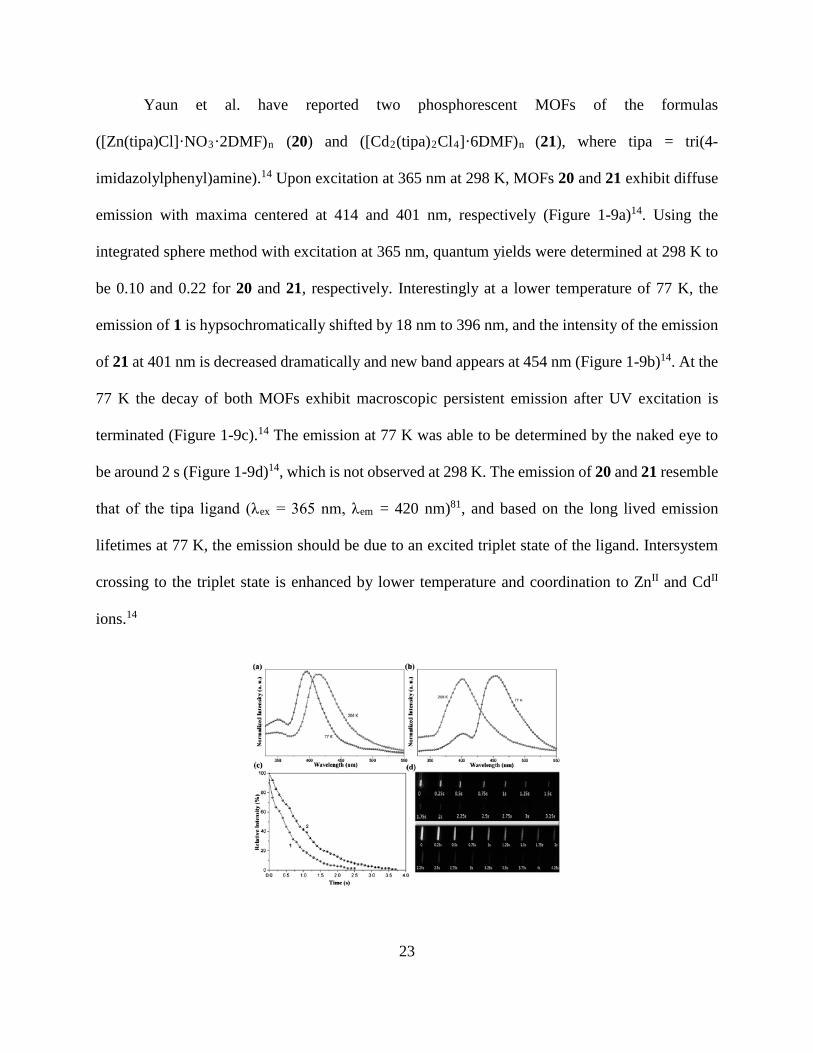
Yaun et al. have reported two phosphorescent MOFs of the formulas
([Zn(tipa)Cl]·NO3·2DMF)n (20) and ([Cd2(tipa)2Cl4]·6DMF)n (21), where tipa = tri(4-
imidazolylphenyl)amine).14 Upon excitation at 365 nm at 298 K, MOFs 20 and 21 exhibit diffuse
emission with maxima centered at 414 and 401 nm, respectively (Figure 1-9a)14. Using the
integrated sphere method with excitation at 365 nm, quantum yields were determined at 298 K to
be 0.10 and 0.22 for 20 and 21, respectively. Interestingly at a lower temperature of 77 K, the
emission of 1 is hypsochromatically shifted by 18 nm to 396 nm, and the intensity of the emission
of 21 at 401 nm is decreased dramatically and new band appears at 454 nm (Figure 1-9b)14. At the
77 K the decay of both MOFs exhibit macroscopic persistent emission after UV excitation is
terminated (Figure 1-9c).14 The emission at 77 K was able to be determined by the naked eye to
be around 2 s (Figure 1-9d)14, which is not observed at 298 K. The emission of 20 and 21 resemble
that of the tipa ligand (λex = 365 nm, λem = 420 nm)81, and based on the long lived emission
lifetimes at 77 K, the emission should be due to an excited triplet state of the ligand. Intersystem
crossing to the triplet state is enhanced by lower temperature and coordination to ZnII and CdII
ions.14
23

Figure 1-9. The solid-state luminescence spectra of: a) complex 20, and b) complex 21 at 298 and
77 K upon excitation at λex=365 nm. c) Afterglow intensity decay curves of 20 and 21. d) After
stopping the UV irradiation, the afterglow photographs of samples (20: upper; 21: lower) in
Suprasil quartz tubes were extracted from videos with 0.25 s intervals at 77 K. (Reprinted with
permission from Chemistry – A European Journal 2014, 20 (32), 10093-10098)
Some MOF materials have been found to exhibit both fluorescence and phosphorescence
emission at room temperature and very low temperatures. Chen et al. prepared a MOF with such
properties of the formula [(Ag4I4(bix)]n 20, where bix = 1,4-bis(imidazole-1-ylmethyl)benzene.80
Excitation at 380 nm of complex 20 at both room temperature and 10 K results in emission bands
at 448 nm and 523 nm. Upon excitation at 10 K, the intensity of the higher energy band at 448 nm
is reduced and the intensity of the lower energy band is increased, suggesting that the two bands
result from different excited states. To test this assumption emission lifetimes of these two bands
were determined at 10 K. Both decay curves for the emission at 448 and 523 nm were satisfyingly
fit to a biexponential function to give lifetimes τ1 = 7.580 x 10⁻⁹ s (16.31%), τ2 = 6.662 x 10⁻¹⁰ s
(83.96%) and τ1 = 3.402 x 10⁻⁴ s (44.26%), τ2 = 1.264 x 10⁻³ s (56.57%), respectively. The decay
of the 448 nm band is on the order of nanoseconds, suggesting fluorescence emission, whereas the
decay of the 523 nm band is much slower, on the order of milliseconds, suggesting the emission
is phosphorescent. The free ligand exhibits an emission band at 444 nm when excited at 380 nm,
which resembles the higher energy band of 20. This resemblance suggests that the higher energy
band of 20 is due to intraligand π→π* transitions, and the lower energy band is possible due to
metal-ligand charge transfer with perturbation from metal-metal interactions.80
1.5 MOFs with Sensitizing Ligands
24
Luminescent lanthanide MOFs are highly sensitive to their microenvironment which is
why they are some of the most well studied MOF sensors, which have been used in the detection
of gases, vapors, temperature, and pH.82 Sensitizing luminescent lanthanide metals with organic
ligands, which act as “antenna” have been studied extensively.20, 82-89 Lanthanides typically exhibit
f-f type transitions with small extinction coefficients, and when sensitized with organic ligands,
strong f-f emission can be observed upon excitation of the ligand.90 Bo et al. have synthesized two
europium based MOFs sensitized with either 5-methylisophthalate (mip) ions or 5-tert-
butylisophthalate anions (tip) with the formulas [Eu(OH)(mip)]n (mip-Eu) and [Eu(tip1.5]2n (tip-
Eu).20 The excitation spectra, monitored at 614 nm, of mip-Eu and tip-Eu show characteristic
sharp lines due to 4f6-4f6 transitions as well as a broad band centered about 308 nm. The broad
band is likely a result of a ligand to metal energy transfer resulting from excited state orbital
overlap between the ligand and the 4f orbitals of the lanthanides. The MOFs exhibited
characteristic Eu3+ emission by excitation at 308 nm providing further evidence of energy transfer
between the ligand and lanthanides.
In certain lanthanide MOFs the ligand may also play a role in the depopulation of the
excited states. Silva et al. have shown that a MOF constructed from 2,5-pyridinedicarboxylate,
lanthanum, and/or europium exhibited characteristic lanthanide emission upon UV excitation of
the ligand (λ = 310 nm), as well as excitation of the lanthanide band (λ = 393 nm).85 The quantum
yield of emission is much greater under UV excitation (43%) than under direct lanthanide
excitation (4%), and is nearly double the calculated quantum efficiency (23%) calculated on the
assumption that only radiative and nonradiative processes are involved in the depollution of the
5D0 excited state. The large difference between the calculated efficiency and the observed
efficiency upon UV excitation at 393 nm suggests that other processes besides radiative and 25

nonradiative decay are involved in population/depopulation of the 5D0 state due to interaction with
the ligand.85
1.6 Research of Goals It has been shown that the luminescence of a MOF is dependent on the organic and
inorganic building blocks that form the framework. The majority of photoactive MOFs, not
composed from lanthanides, are designed with aromatic linkers. The photophysical properties of
the linker in a MOF are often altered, relative to the solid or liquid state, by the new environment
within the framework. The excited state processes that occur upon absorption of a photon are
perturbed by the different environment within the MOF, which results in shifted and broadened
spectra, as well as altered quantum yields and lifetimes, relative to the free ligand. The following
chapters will discuss the difference in the photophysical properties of three anthracenedicarboxylic
acids: 9,10-antrhacenedicarboxylic acid, 2,6-anthracenedicarboxylic acid, and 1,4-
anthracenedicarboxylic acid. The effects of carboxylic acid group location on the photophysics of
anthracene will be discussed in further detail. Finally the effects on the photophysics of 9,10-
anthracenedicarboxylic acid and 2,6-anthracenedicarboxylic acid upon incorporation into Zn
based MOFs will be discussed.
1.7 References
1. Li, H.; Eddaoudi, M.; Groy, T. L.; Yaghi, O. M., Establishing Microporosity in Open Metal−Organic Frameworks: Gas Sorption Isotherms for Zn(BDC) (BDC = 1,4-Benzenedicarboxylate). Journal of the American Chemical Society 1998, 120 (33), 8571-8572. 2. Zhou, S.; Kong, Z.-G.; Wang, Q.-W.; Li, C.-B., Synthesis, structure and photocatalytic property of a novel 3D (3,8)-connected metal–organic framework based on a flexible triphosphonate and a pentanuclear Cu(II) unit. Inorganic Chemistry Communications 2012, 25 (0), 1-4.
26
3. Dou, Z.; Yu, J.; Cui, Y.; Yang, Y.; Wang, Z.; Yang, D.; Qian, G., Luminescent Metal–Organic Framework Films As Highly Sensitive and Fast-Response Oxygen Sensors. Journal of the American Chemical Society 2014, 136 (15), 5527-5530. 4. Li, J.-R.; Sculley, J.; Zhou, H.-C., Metal-Organic Frameworks for Separations. Chem. Rev. (Washington, DC, U. S.) 2012, 112 (2), 869-932. 5. Vermeulen, N. A.; Karagiaridi, O.; Sarjeant, A. A.; Stern, C. L.; Hupp, J. T.; Farha, O. K.; Stoddart, J. F., Aromatizing Olefin Metathesis by Ligand Isolation inside a Metal- Organic Framework. J. Am. Chem. Soc. 2013, 135 (40), 14916-14919. 6. Wang, G.-Y.; Song, C.; Kong, D.-M.; Ruan, W.-J.; Chang, Z.; Li, Y., Two luminescent metal-organic frameworks for the sensing of nitroaromatic explosives and DNA strands. Journal of Materials Chemistry A 2014, 2 (7), 2213-2220. 7. Zhang, C.-F.; Qiu, L.-G.; Ke, F.; Zhu, Y.-J.; Yuan, Y.-P.; Xu, G.-S.; Jiang, X., A novel magnetic recyclable photocatalyst based on a core-shell metal-organic framework Fe3O4@MIL-100(Fe) for the decolorization of methylene blue dye. Journal of Materials Chemistry A 2013, 1 (45), 14329-14334. 8. Lee, D. Y.; Shin, C. Y.; Yoon, S. J.; Lee, H. Y.; Lee, W.; Shrestha, N. K.; Lee, J. K.; Han, S.-H., Enhanced photovoltaic performance of Cu-based metal-organic frameworks sensitized solar cell by addition of carbon nanotubes. Sci. Rep. 2014, 4. 9. Pramanik, M.; Patra, A. K.; Bhaumik, A., Self-assembled titanium phosphonate nanomaterial having a mesoscopic void space and its optoelectronic application. Dalton Trans. 2013, 42 (14), 5140-5149. 10. Silva, C. G.; Corma, A.; Garcia, H., Metal-organic frameworks as semiconductors. Journal of Materials Chemistry 2010, 20 (16), 3141-3156. 11. Jayaramulu, K.; Kanoo, P.; George, S. J.; Maji, T. K., Tunable emission from a porous metal-organic framework by employing an excited-state intramolecular proton transfer responsive ligand. Chemical Communications 2010, 46 (42), 7906-7908. 12. Kreno, L. E.; Leong, K.; Farha, O. K.; Allendorf, M.; Van Duyne, R. P.; Hupp, J. T., Metal–Organic Framework Materials as Chemical Sensors. Chemical Reviews 2011, 112 (2), 1105-1125. 13. Cui, Y.; Yue, Y.; Qian, G.; Chen, B., Luminescent Functional Metal–Organic Frameworks. Chemical Reviews 2011, 112 (2), 1126-1162. 14. Yuan, S.; Deng, Y.-K.; Sun, D., Unprecedented Second-Timescale Blue/Green Emissions and Iodine-Uptake-Induced Single-Crystal-to-Single-Crystal Transformation in ZnII/CdII Metal–Organic Frameworks. Chemistry – A European Journal 2014, n/a-n/a. 15. Rowsell, J. L. C.; Yaghi, O. M., Metal–organic frameworks: a new class of porous materials. Microporous and Mesoporous Materials 2004, 73 (1–2), 3-14. 16. Yaghi, O. M.; O'Keeffe, M.; Ockwig, N. W.; Chae, H. K.; Eddaoudi, M.; Kim, J., Reticular synthesis and the design of new materials. Nature 2003, 423 (6941), 705-714. 17. Dey, C.; Kundu, T.; Biswal, B. P.; Mallick, A.; Banerjee, R., Crystalline metal-organic frameworks (MOFs): synthesis, structure and function. Acta Crystallographica Section B 2014, 70 (1), 3-10. 18. Zhang, C.-J.; Wang, M.-S.; Guo, G.-C., Crystal structure and photoluminescent properties of a Ag(I)-carboxylate coordination compound: Luminescence modulation by a π-conjugated ancillary ligand. Inorganic Chemistry Communications 2013, 35 (0), 76-78. 19. Tanaka, D.; Horike, S.; Kitagawa, S.; Ohba, M.; Hasegawa, M.; Ozawa, Y.; Toriumi, K., Anthracene array-type porous coordination polymer with host-guest charge transfer interactions in excited states. Chemical Communications 2007, (30), 3142-3144.
27
20. Bo, Q.-B.; Zhang, H.-T.; Wang, H.-Y.; Miao, J.-L.; Zhang, Z.-W., Anhydrous Lanthanide MOFs and Direct Photoluminescent Sensing for Polyoxometalates in Aqueous Solution. Chemistry – A European Journal 2014, 20 (13), 3712-3723. 21. Banerjee, R.; Furukawa, H.; Britt, D.; Knobler, C.; O’Keeffe, M.; Yaghi, O. M., Control of Pore Size and Functionality in Isoreticular Zeolitic Imidazolate Frameworks and their Carbon Dioxide Selective Capture Properties. Journal of the American Chemical Society 2009, 131 (11), 3875-3877. 22. Gascon, J.; Hernández-Alonso, M. D.; Almeida, A. R.; van Klink, G. P. M.; Kapteijn, F.; Mul, G., Isoreticular MOFs as Efficient Photocatalysts with Tunable Band Gap: An Operando FTIR Study of the Photoinduced Oxidation of Propylene. ChemSusChem 2008, 1 (12), 981-983. 23. Dong, Y.; Lam, J. W. Y.; Qin, A.; Liu, J.; Li, Z.; Tang, B. Z.; Sun, J.; Kwok, H. S., Aggregation-induced emissions of tetraphenylethene derivatives and their utilities as chemical vapor sensors and in organic light-emitting diodes. Applied Physics Letters 2007, 91 (1), -. 24. Shustova, N. B.; McCarthy, B. D.; Dincă, M., Turn-On Fluorescence in Tetraphenylethylene-Based Metal–Organic Frameworks: An Alternative to Aggregation-Induced Emission. Journal of the American Chemical Society 2011, 133 (50), 20126-20129. 25. Shustova, N. B.; Ong, T.-C.; Cozzolino, A. F.; Michaelis, V. K.; Griffin, R. G.; Dincă, M., Phenyl Ring Dynamics in a Tetraphenylethylene-Bridged Metal–Organic Framework: Implications for the Mechanism of Aggregation-Induced Emission. Journal of the American Chemical Society 2012, 134 (36), 15061-15070. 26. Hailian, L.; Mohamed, E.; Keeffe, M. O.; Yaghi, O. M., Design and synthesis of an exceptionally stable and highly porous metal-organic framework. Nature 1999, 402 (6759), 276-279. 27. Perry Iv, J. J.; Feng, P. L.; Meek, S. T.; Leong, K.; Doty, F. P.; Allendorf, M. D., Connecting structure with function in metal-organic frameworks to design novel photo- and radioluminescent materials. Journal of Materials Chemistry 2012, 22 (20), 10235-10248. 28. Logvinenko, V.; Sapchenko, S.; Fedin, V., Thermal decomposition of inclusion compounds on the base of the metal–organic framework [Zn4(dmf)(ur)2(ndc)4]. J Therm Anal Calorim 2014, 1-7. 29. Jasuja, H.; Huang, Y.-g.; Walton, K. S., Adjusting the Stability of Metal–Organic Frameworks under Humid Conditions by Ligand Functionalization. Langmuir 2012, 28 (49), 16874-16880. 30. Zhou, L.; Xue, Y.-S.; Xu, Y.; Zhang, J.; Du, H.-B., Two photoluminescent metal-organic frameworks based on a BODIPY-derived bipyridine ligand. CrystEngComm 2013, 15 (36), 7315-7320. 31. Darling, K.; Zubieta, J., Solid state coordination chemistry of metal-azolate compounds: Structural consequences of incorporation of phosphate components in the Co(II)/4-pyridyltetrazolate/phosphate system. Inorganica Chimica Acta 2013, 394 (0), 512-518. 32. Valeur, B., Molecular Fluorescence: Principles and Applications. WILEY-VCH Weinheim ; New York, 2002. 33. Brown, J. W.; Henderson, B. L.; Kiesz, M. D.; Whalley, A. C.; Morris, W.; Grunder, S.; Deng, H.; Furukawa, H.; Zink, J. I.; Stoddart, J. F.; Yaghi, O. M., Photophysical pore control in an azobenzene-containing metal-organic framework. Chemical Science 2013, 4 (7), 2858-2864. 34. Wang, J.-J.; Hu, T.-L.; Bu, X.-H., Cadmium(ii) and zinc(ii) metal-organic frameworks with anthracene-based dicarboxylic ligands: solvothermal synthesis, crystal structures, and luminescent properties. CrystEngComm 2011, 13 (16), 5152-5161.
28
35. Stylianou, K. C.; Heck, R.; Chong, S. Y.; Bacsa, J.; Jones, J. T. A.; Khimyak, Y. Z.; Bradshaw, D.; Rosseinsky, M. J., A Guest-Responsive Fluorescent 3D Microporous Metal−Organic Framework Derived from a Long-Lifetime Pyrene Core. Journal of the American Chemical Society 2010, 132 (12), 4119-4130. 36. Johnson, J. A.; Chen, S.; Reeson, T. C.; Chen, Y.-S.; Zeng, X. C.; Zhang, J., Direct X-ray Observation of Trapped CO2 in a Predesigned Porphyrinic Metal–Organic Framework. Chemistry – A European Journal 2014, 20 (25), 7632-7637. 37. Zhao, M.; Ou, S.; Wu, C.-D., Porous Metal–Organic Frameworks for Heterogeneous Biomimetic Catalysis. Accounts of Chemical Research 2014, 47 (4), 1199-1207. 38. Xie, M.-H.; Yang, X.-L.; Zou, C.; Wu, C.-D., A SnIV–Porphyrin-Based Metal–Organic Framework for the Selective Photo-Oxygenation of Phenol and Sulfides. Inorganic Chemistry 2011, 50 (12), 5318-5320. 39. Kent, C. A.; Liu, D.; Ito, A.; Zhang, T.; Brennaman, M. K.; Meyer, T. J.; Lin, W., Rapid energy transfer in non-porous metal-organic frameworks with caged Ru(bpy)32+ chromophores: oxygen trapping and luminescence quenching. Journal of Materials Chemistry A 2013, 1 (47), 14982-14989. 40. Kent, C. A.; Liu, D.; Ma, L.; Papanikolas, J. M.; Meyer, T. J.; Lin, W., Light Harvesting in Microscale Metal–Organic Frameworks by Energy Migration and Interfacial Electron Transfer Quenching. Journal of the American Chemical Society 2011, 133 (33), 12940-12943. 41. Rosi, N. L.; Eddaoudi, M.; Kim, J.; O'Keeffe, M.; Yaghi, O. M., Advances in the chemistry of metal-organic frameworks. CrystEngComm 2002, 4 (68), 401-404. 42. Yaghi, O. M.; Li, G.; Li, H., Selective binding and removal of guests in a microporous metal-organic framework. Nature 1995, 378 (6558), 703-706. 43. Kim, J.; Chen, B.; Reineke, T. M.; Li, H.; Eddaoudi, M.; Moler, D. B.; O'Keeffe, M.; Yaghi, O. M., Assembly of Metal−Organic Frameworks from Large Organic and Inorganic Secondary Building Units: New Examples and Simplifying Principles for Complex Structures▵. Journal of the American Chemical Society 2001, 123 (34), 8239-8247. 44. Yaghi, O. M.; Li, H.; Groy, T. L., A Molecular Railroad with Large Pores: Synthesis and Structure of Ni(4,4‘-bpy)2.5(H2O)2(ClO4)2·1.5(4,4‘-bpy)·2H2O†. Inorganic Chemistry 1997, 36 (20), 4292-4293. 45. Yaghi, O. M.; Li, H., T-Shaped Molecular Building Units in the Porous Structure of Ag(4,4‘-bpy)·NO3. Journal of the American Chemical Society 1996, 118 (1), 295-296. 46. Blake, A. J.; Champness, N. R.; Hubberstey, P.; Li, W.-S.; Withersby, M. A.; Schröder, M., Inorganic crystal engineering using self-assembly of tailored building-blocks. Coordination Chemistry Reviews 1999, 183 (1), 117-138. 47. Zheng, S.-L.; Yang, J.-H.; Yu, X.-L.; Chen, X.-M.; Wong, W.-T., Syntheses, Structures, Photoluminescence, and Theoretical Studies of d10 Metal Complexes of 2,2‘-Dihydroxy-[1,1‘]binaphthalenyl-3,3‘-dicarboxylate. Inorganic Chemistry 2003, 43 (2), 830-838. 48. Fang, Q.; Zhu, G.; Xue, M.; Sun, J.; Sun, F.; Qiu, S., Structure, Luminescence, and Adsorption Properties of Two Chiral Microporous Metal−Organic Frameworks. Inorganic Chemistry 2006, 45 (9), 3582-3587. 49. Chen, W.; Wang, J.-Y.; Chen, C.; Yue, Q.; Yuan, H.-M.; Chen, J.-S.; Wang, S.-N., Photoluminescent Metal−Organic Polymer Constructed from Trimetallic Clusters and Mixed Carboxylates. Inorganic Chemistry 2003, 42 (4), 944-946.
29

50. Tomar, K., Assembly of an eight connected porous Cd(II) framework with octahedral and cubo-octahedral cages: Sorption and luminescent properties. Inorganic Chemistry Communications 2013, 37 (0), 127-131. 51. Kent, C. A.; Liu, D.; Meyer, T. J.; Lin, W., Amplified Luminescence Quenching of Phosphorescent Metal–Organic Frameworks. Journal of the American Chemical Society 2012, 134 (9), 3991-3994. 52. Kanoo, P.; Ghosh, A. C.; Cyriac, S. T.; Maji, T. K., A Metal–Organic Framework with Highly Polar Pore Surfaces: Selective CO2 Adsorption and Guest-Dependent On/Off Emission Properties. Chemistry – A European Journal 2012, 18 (1), 237-244. 53. Jayaramulu, K.; Narayanan, R. P.; George, S. J.; Maji, T. K., Luminescent Microporous Metal–Organic Framework with Functional Lewis Basic Sites on the Pore Surface: Specific Sensing and Removal of Metal Ions. Inorganic Chemistry 2012, 51 (19), 10089-10091. 54. Wei, W.; Xia, Z.; Wei, Q.; Xie, G.; Chen, S.; Qiao, C.; Zhang, G.; Zhou, C., A heterometallic microporous MOF exhibiting high hydrogen uptake. Microporous and Mesoporous Materials 2013, 165 (0), 20-26. 55. Wang, X.-S.; Ma, S.; Rauch, K.; Simmons, J. M.; Yuan, D.; Wang, X.; Yildirim, T.; Cole, W. C.; López, J. J.; Meijere, A. d.; Zhou, H.-C., Metal−Organic Frameworks Based on Double-Bond-Coupled Di-Isophthalate Linkers with High Hydrogen and Methane Uptakes. Chemistry of Materials 2008, 20 (9), 3145-3152. 56. Zheng, S.-T.; Zuo, F.; Wu, T.; Irfanoglu, B.; Chou, C.; Nieto, R. A.; Feng, P.; Bu, X., Cooperative Assembly of Three-Ring-Based Zeolite-Type Metal–Organic Frameworks and Johnson-Type Dodecahedra. Angewandte Chemie International Edition 2011, 50 (8), 1849-1852. 57. Kun-Lin, H.; Yan-Ting, H.; Mei, H., [Cd(SDC)(H2O)]: a 3-D hybrid open framework with an interpenetrated (4,4) topology and double-strand helicates (SDC=4,4'-stilbenedicarboxylate). Journal of Coordination Chemistry 2008, 61 (17), 2735-2742. 58. Yang, J.; Ma, J.-F.; Liu, Y.-Y.; Batten, S. R., Four-, and six-connected entangled frameworks based on flexible bis(imidazole) ligands and long dicarboxylate anions. CrystEngComm 2009, 11 (1), 151-159. 59. Zhang, L.; Yao, Y.-L.; Che, Y.-X.; Zheng, J.-M., Hydrothermal Synthesis of a Series of Interpenetrated Metal−Organic Frameworks Based on Long Multicarboxylate and Long Heterocyclic Aromatic Ligands. Crystal Growth & Design 2010, 10 (2), 528-533. 60. Huang, K.-L.; Liu, X.; Liang, G.-M., Second-ligand-dependent multi-fold interpenetrated architectures of two 3-D metal(II)–organic coordination polymers. Inorganica Chimica Acta 2009, 362 (5), 1565-1570. 61. Deng, Z.-P.; Huo, L.-H.; Wang, H.-Y.; Gao, S.; Zhao, H., A series of three-dimensional lanthanide metal-organic frameworks with biphenylethene-4,4[prime or minute]-dicarboxylic acid: Hydrothermal syntheses and structures. CrystEngComm 2010, 12 (5), 1526-1535. 62. Cheng, A.-L.; Liu, N.; Yue, Y.-F.; Jiang, Y.-W.; Gao, E.-Q.; Yan, C.-H.; He, M.-Y., Unprecedented 3D entanglement of 1D zigzag coordination polymers leading to a robust microporous framework. Chemical Communications 2007, (4), 407-409. 63. Cheng, A.-L.; Ma, Y.; Zhang, J.-Y.; Gao, E.-Q., Towards tuning the packing and entanglement of zigzag coordination chains by terminal ligands. Dalton Transactions 2008, (15), 1993-2004. 64. Bauer, C. A.; Jones, S. C.; Kinnibrugh, T. L.; Tongwa, P.; Farrell, R. A.; Vakil, A.; Timofeeva, T. V.; Khrustalev, V. N.; Allendorf, M. D., Homo- and heterometallic luminescent 2-D stilbene metal-organic frameworks. Dalton Transactions 2014, 43 (7), 2925-2935.
30

65. Wang, H.-Y.; Gao, S.; Huo, L.-H.; Ng, S. W.; Zhao, J.-G., Three Interpenetrated Frameworks Assembly from a Long Multicarboxylate Ligand and Transition Metal. Crystal Growth & Design 2008, 8 (2), 665-670. 66. Cheng, A.-L.; Ma, Y.; Sun, Q.; Gao, E.-Q., Layered and pillar-layered metal-organic frameworks based on pinwheel trinuclear zinc-carboxylate clusters. CrystEngComm 2011, 13 (7), 2721-2726. 67. Yan, D.; Tang, Y.; Lin, H.; Wang, D., Tunable Two-color Luminescence and Host-guest Energy Transfer of Fluorescent Chromophores Encapsulated in Metal-Organic Frameworks. Sci. Rep. 2014, 4. 68. Allendorf, M.; Houk, R.; Bhakta, R.; Nielsen, I. B.; Doty, P., Scintillating Metal Organic Frameworks: A New Class of Radiation Detection Materials. MRS Online Proceedings Library 2009, 1164, null-null. 69. Bauer, C. A.; Allendorf, M. D.; Doty, F. P.; Simmons, B. A. Hybrid metal organic scintillator materials system and particle detector. US7985868B1, 2011. 70. Bauer, C. A.; Timofeeva, T. V.; Settersten, T. B.; Patterson, B. D.; Liu, V. H.; Simmons, B. A.; Allendorf, M. D., Influence of Connectivity and Porosity on Ligand-Based Luminescence in Zinc Metal−Organic Frameworks. Journal of the American Chemical Society 2007, 129 (22), 7136-7144. 71. Duan, X.; Cai, J.; Yu, J.; Wu, C.; Cui, Y.; Yang, Y.; Qian, G., Three-dimensional copper (II) metal-organic framework with open metal sites and anthracene nucleus for highly selective C2H2/CH4 and C2H2/CO2 gas separation at room temperature. Microporous Mesoporous Mater. 2013, 181, 99-104. 72. Wen, H.-M.; Li, B.; Yuan, D.; Wang, H.; Yildirim, T.; Zhou, W.; Chen, B., A porous metal-organic framework with an elongated anthracene derivative exhibiting a high working capacity for the storage of methane. J. Mater. Chem. A 2014, 2 (29), 11516-11522. 73. Hawes, C. S.; Nolvachai, Y.; Kulsing, C.; Knowles, G. P.; Chaffee, A. L.; Marriott, P. J.; Batten, S. R.; Turner, D. R., Metal-organic frameworks as stationary phases for mixed-mode separation applications. Chem. Commun. (Cambridge, U. K.) 2014, 50 (28), 3735-3737. 74. Gole, B.; Bar, A. K.; Mallick, A.; Banerjee, R.; Mukherjee, P. S., An electron rich porous extended framework as a heterogeneous catalyst for Diels-Alder reactions. Chem. Commun. (Cambridge, U. K.) 2013, 49 (67), 7439-7441. 75. Zhuang, J.; Friedel, J.; Terfort, A., The oriented and patterned growth of fluorescent metal–organic frameworks onto functionalized surfaces. Beilstein Journal of Nanotechnology 2012, 3, 570-578. 76. Chang, Z.; Zhang, A.-S.; Hu, T.-L.; Bu, X.-H., ZnII Coordination Poylmers Based on 2,3,6,7-Anthracenetetracarboxylic Acid: Synthesis, Structures, and Luminescence Properties. Crystal Growth & Design 2009, 9 (11), 4840-4846. 77. Liu, F.; Zhang, L.; Wang, R.; Sun, J.; Yang, J.; Chen, Z.; Wang, X.; Sun, D., Five MOFs with different topologies based on anthracene functionalized tetracarboxylic acid: syntheses, structures, and properties. CrystEngComm 2014, 16 (14), 2917-2928. 78. Jüstel, T.; Nikol, H.; Ronda, C., New Developments in the Field of Luminescent Materials for Lighting and Displays. Angewandte Chemie International Edition 1998, 37 (22), 3084-3103. 79. Zhang, C.; Zhang, M.; Qin, L.; Zheng, H., Crystal Structures and Spectroscopic Properties of Metal–Organic Frameworks Based on Rigid Ligands with Flexible Functional Groups. Crystal Growth & Design 2013, 14 (2), 491-499.
31

80. Chen, L.; Ma, J.; Chen, Q.; Feng, R.; Jiang, F.; Hong, M., A 2D silver-iodide-organic framework with both fluorescent and phosphorescent emissions. Inorganic Chemistry Communications 2012, 15 (0), 208-211. 81. Wu, H.; Liu, H.-Y.; Liu, Y.-Y.; Yang, J.; Liu, B.; Ma, J.-F., An unprecedented 2D [rightward arrow] 3D metal-organic polyrotaxane framework constructed from cadmium and a flexible star-like ligand. Chemical Communications 2011, 47 (6), 1818-1820. 82. Zhou, X.-H.; Li, L.; Li, H.-H.; Li, A.; Yang, T.; Huang, W., A flexible Eu(iii)-based metal-organic framework: turn-off luminescent sensor for the detection of Fe(iii) and picric acid. Dalton Transactions 2013, 42 (34), 12403-12409. 83. Guo, L.-R.; Tang, X.-L.; Ju, Z.-H.; Zhang, K.-M.; Jiang, H.-E.; Liu, W.-S., Lanthanide metal-organic frameworks constructed by asymmetric 2-nitrobiphenyl-4,4[prime or minute]-dicarboxylate ligand: syntheses, structures, luminescence and magnetic investigations. CrystEngComm 2013, 15 (44), 9020-9031. 84. Vilela, S. M. F.; Ananias, D.; Fernandes, J. A.; Silva, P.; Gomes, A. C.; Silva, N. J. O.; Rodrigues, M. O.; Tome, J. P. C.; Valente, A. A.; Ribeiro-Claro, P.; Carlos, L. D.; Rocha, J.; Almeida Paz, F. A., Multifunctional micro- and nanosized metal-organic frameworks assembled from bisphosphonates and lanthanides. J. Mater. Chem. C 2014, 2 (17), 3311-3327. 85. Silva, P.; Ananias, D.; Bruno, S. M.; Valente, A. A.; Carlos, L. D.; Rocha, J.; Almeida Paz, F. A., Photoluminescent Metal–Organic Frameworks – Rapid Preparation, Catalytic Activity, and Framework Relationships. European Journal of Inorganic Chemistry 2013, 2013 (32), 5576-5591. 86. Zhang, L.; Song, T.; Xu, J.; Sun, J.; Zeng, S.; Wu, Y.; Fan, Y.; Wang, L., Polymorphic Ln(III) and BPTC-based porous metal-organic frameworks with visible, NIR photoluminescent and magnetic properties. CrystEngComm 2014, 16 (12), 2440-2451. 87. Wei, Z.; Gu, Z.-Y.; Arvapally, R. K.; Chen, Y.-P.; McDougald, R. N.; Ivy, J. F.; Yakovenko, A. A.; Feng, D.; Omary, M. A.; Zhou, H.-C., Rigidifying Fluorescent Linkers by Metal-Organic Framework Formation for Fluorescence Blue Shift and Quantum Yield Enhancement. J. Am. Chem. Soc. 2014, 136 (23), 8269-8276. 88. Decadt, R.; Van Hecke, K.; Depla, D.; Leus, K.; Weinberger, D.; Van Driessche, I.; Van Der Voort, P.; Van Deun, R., Synthesis, Crystal Structures, and Luminescence Properties of Carboxylate Based Rare-Earth Coordination Polymers. Inorganic Chemistry 2012, 51 (21), 11623-11634. 89. Rao, X.; Song, T.; Gao, J.; Cui, Y.; Yang, Y.; Wu, C.; Chen, B.; Qian, G., A Highly Sensitive Mixed Lanthanide Metal–Organic Framework Self-Calibrated Luminescent Thermometer. Journal of the American Chemical Society 2013, 135 (41), 15559-15564. 90. Zhang, T.; Lin, W., Metal-organic frameworks for artificial photosynthesis and photocatalysis. Chemical Society Reviews 2014, 43 (16), 5982-5993.
32

Chapter 2. Systematic Investigation of the Excited State Properties Anthracenedicarboxylic
Acids
Jennifer M. Hay, William A. Maza, Robert C. Chapleski, Taylor M. Gaillot, Diego Troya, and
Amanda J. Morris*
Department of Chemistry, Virginia Polytechnic Institute and State University, Blacksburg,
Virginia 24061, United States
This chapter will soon be submitted for publication to Physical Chemistry A, therefore the
manuscript is formatted for submission. Jennifer Hay conceived and executed the data presented,
with guidance on experimental design and interpretation from Dr. William A. Maza and Amanda
J. Morris. The majority of the theoretical calculations were performed by Robert C. Chapleski with
guidance from Dr. Diego Troya.
ABSTRACT : Steady state absorption and emission spectra and time resolved fluorescence
measurements were obtained for three anthracenedicarboxylic acids: 9,10-anthracenedicarboxylic
acid (9,10-ADCA), 2,6-anthracenedicarboxylic acid (2,6-ADCA), and 1,4-anthracenedicarboxylic
acid (1,4-ADCA). The fluorescence quantum yields in polar solvents (dimethylsulfoxide,
acetonitrile, dimethylformamide, and methanol) were found to be between 0.9 and 0.1, and
fluorescence quantum yields between of 0.7 and 0.5 were determined in non-polar tetrahydrofuran.
These quantum yields were found to decrease with decreasing solvent dielectric constant, and are
dependent on the position of the acid groups on the ring system, with 1,4-ADCA exhibiting the
lowest quantum yields in the solvents studied. The fluorescence lifetimes ranged between 8.5 to
33

23 ns in polar solvents, and between 16.3 and 11.1 ns in tetrahydrofuran. The lifetimes show an
overall decrease with decreasing solvent dielectric constant, and are dependent on substituent
location with 1,4-ADCA exhibiting the longest lifetimes. The radiative and nonradiative decay
constants were calculated from the fluorescence quantum yields and lifetimes. Analysis and
comparison of the experimentally determined radiative rate of decay to calculated rates of decay
suggest that intramolecular forces are dominant contributors to the radiative rate of decay.
Evaluation of the 0,0 energies and the non-radiative rate of decay indicates that while changes in
the energy gap contribute to an increase in non-radiative rate of decay, the dominant contributor
is an increase in the rate of intersystem crossing. The position of the carboxylic acid functional
groups on the anthracene system resulted in differences in the photophysics of anthracene due to
resonance, inductive effects resulting in the perturbation of the electronic transitions oriented along
the longitudinal and transverse short axes of anthracene.
2.1 Introduction
The tenability and sensitivity of the excited states of organic photoactive molecules impart
versatility to their potential use in a wide array of applications. These include incorporation into
organic light emitting diodes1-2 (OLEDs), organic semicondictors3, and fluorescent probes as
sensing elements4-5. Knowledge of the dynamics and energetics of the excited states is important
to understand the photophysical and photochemical propensity of a species towards a particular
application. Such knowledge also aids the rational design of derivatives whose photophysical and
photochemical properties may be more adept towards the same applications than the parent
structure.
Anthracene is a polyaromatic hydrocarbon whose excited state properties have been extensively
researched. Its photophysical properties have been found to be easily tuned through structural
34

modifications, making it an ideal chromophore for use in luminescent devices. For example,
anthracene has been used in the functionalization of bimesityls, resulting in tunable emission,
fluorescence quantum yields and electroluminescence suitable for OLED applications.2
Incorporation of anthracene onto polyphenyleneethynylene backbones has resulted in organic
semiconductor materials with applications in solar energy harvesting.3 Anthracenes have also been
incorporated into Langmuir-Blodgett (LB) films as a photoprobe in order to characterize the
molecular microenvironment of the anthracene within the films.4 The possible applications of
anthracene and its derivatives are extensive, but full realization of its potential requires a greater
understanding of how microenvironment and derivatization effects its photophysical properties.
The photophysical characterization of three anthracene derivatives, 9,10-anthracenedicarboxylic
acid, 2,6-anthracenendicarboxylic acid, and 1,4-anthracenedicarboxylic acid were studied in
various solvents in hopes of gaining a better understanding of the effect of substituent position and
specific solvent effects on the ground and excited state properties of anthracenedicarboxylic acid.
2.2 Materials and Methods
9,10-anthracenedicarboxylic acid (9,10-ADCA), 1,4-anthracenedicarboxylic acid (1,4-ADCA),
and 2,6-anthracenedicarboxylic acid (2,6-ADCA) were synthesized following previously reported
procedures with minimal modifications.6-10 All other chemicals and solvents including anthracene
(> 99 %), Zn(NO3)2·6 H2O (> 99 %), KOH (85 %), acetonitrile (AcCN, HPLC grade > 99.9 %),
cyclohexane (HPLC grade > 99.5 %), dimethylformamide(DMF, HPLC grade > 99%), dimethyl
sulfoxide (DMSO, ACS grade > 99.9 %), methanol (MeOH, HPLC grade > 99.9 %), and
tetrahydrofuran (THF, ACS grade > 99 %) were used as received without further purification from
Alfa Aesar, Fisher Scientific, or Sigma-Aldrich.
35
Synthesis of 9,10-ADC.10 9,10-dibromoanthracene (2.0 g, 5.96 mmol) was stirred in anhydrous
diethyl ether (20 mL) and n-butyllithium (9.76 mL, 15.6 mmol, of 1.6 M hexane solution) was
added dropwise to the solution. After stirring the reaction was cooled in an ice bath and gaseous
CO2 was bubbled through the solution for 1 h. The product was extracted into DI water and then
acidified with sulfuric acid, and the yellow product was collected and washed with DI water. 1H
NMR (d-DMSO, p.p.m.) δ 8.06 (dd, 4 H, J = 6.85 MHz, J = 3.15 MHz), 7.67 (dd, 4 H, J = 6.80
MHz, J = 2.80 MHz).
Synthesis of 1,4-ADCA.6, 8-9
1,4-dimethylanthraquinone. 1,4-napthoquinone(18.7 g, 0.118 mol) and 2,4-hexadiene (10.0 g,
0.121 mol) in toluene was heated at 65 ºC for 4 days with stirring. The solvent was evaporated off
to yield an oily brown mixture of 1,4-dimethyl-1,4-dihydro-9,10-anthraquinone. A solution of 60
g of KOH in absolute ethanol (500 mL) was cooled in an ice bath and stirred while adding a
solution of 1,4-dimethyl-1,4-dihydro-9,10-anthraquinone in ethanol (2.5 L). The resulting mixture
was purged with gaseous O2 for 2 h while being cooled in an ice bath. The solvent was evaporated
off, and the resulting residue was dissolved in water and the dimethyl product was extracted with
toluene. Removal of the aromatic solvent, followed by recrystallization in ethanol at 4 ºC yielded
pure 1,4-dimethylanthraquinone. 1H NMR (CDCl3, p.p.m.) δ 8.17 (dd, 2 H, J = 5.80 MHz, J = 3.4
MHz), 7.73 (dd, 2 H. J = 5.80 MHz, J = 3.40 MHz), 7.41 (s, 1 H), 2.79 (s, 6 H).
1,4-dicarboxyanthraquinone. In a 40 mL autoclave, 1,4-dimethylanthraquinone ( 200 mg, 0.8
mmol) was combined with an 18 % HNO3 solution and heated 220 ºC for 3 h. After cooling, the
yellow precipitate was collected and washed with water to give pure 1,4-dicarboxyanthraquinone.
1H NMR (d-DMSO, p.p.m.) δ 8.16 (dd, 2 H, J = 5.80 MHz, J = 3.60 MHz), 7.95 (dd, 2 H, J = 5.80
MHz, J = 3.4 MHz), 7.85 (s, 1 H).
36

1,4-ADCA. Reduction of the quinone was performed using a modified procedure given by
Johnson et al.7, where metallic Zn (6.58 g, 0.10 mol) and NH4OH (50 mL) were stirred in a round
bottom flask in an ice bath as 1,4-dicarboxyanthraquinone (2.11 g, 7.13 mmol) was added slowly.
Following the addition, the reaction is heated to 100 °C and stirred for 2 h. The reaction mixture
was cooled to room temperature (rt) and filtered by vacuum. The filtrate was acidified with 12 M
HCl to give an orange precipitate, 1,4-ADCA. 1H NMR (d-DMSO, p.p.m) δ 9.47 (s, 2 H), 8.17
(dd, 2 H, J = 5.12 MHz, J = 2.60 MHz), 8.14 (s, 2 H), 7.61 (dd, 2 H, J = 5.24 MHz, J = 2.52 MHz).
Synthesis of 2,6-ADCA.6-7, 9
2,6-dimethylanthraquinone. In an autoclave, benzoquinone (5.0 g, 46 mmol), isoprene (11.4 g,
139 mmol), and a spatula tip of hydroquinone, were suspended in 20 mL of ethanol and heated at
130 ºC for 6 h. The autoclave was allowed to reach rt and the reaction mixture was mixed with a
potassium hydroxide solution in ethanol (400 ml, 5 %) and heated for 8h at 40 ºC. Stirring was
continued for 12h at room temperature. The mixture was heated again at 50 ºC for 1h and filtered
to give an insoluble white cream solid, 2,6-dimethylanthraquinone.6 1H NMR (d-DMSO) δ 8.11
(d, 2 H, J = 8.0 MHz), 8.01 (s, 1 H), 7.73 (d, 2 H, J = 8.0 MHz), 2.52 (s, 6 H).
2,6-dicarboxyanthraquinone was prepared using the same procedure used to synthesize 1,4-
dicarboxyanthraquinone.9 1H NMR (d-DMSO, p.p.m.) δ 8.67 (s, 2 H), 8.4 (d, 2 H, J = 6.40 MHz),
8.3 (d, 2 H, J = 7.60 MHz).
2,6-dicarboxyanthraquinone was reduced to 2,6-ADCA using the same modified reduction
procedure given above for the 1,4-dicarboxyanthraquinone.7 1H NMR (d-DMSO, p.p.m) δ 8.89 (s,
2 H), 8.83 (s, 2 H), 8.21 (d, 2 H, J = 8.92 MHz), 7.98 (d, 2 H, J = 8.90 MHz).
Photophysical measurements. Steady-state absorption spectra of the ADCAs were obtained
using a Cary Series 5000 UV-vis NIR spectrophotometer. Steady-state fluorescence spectra were
37
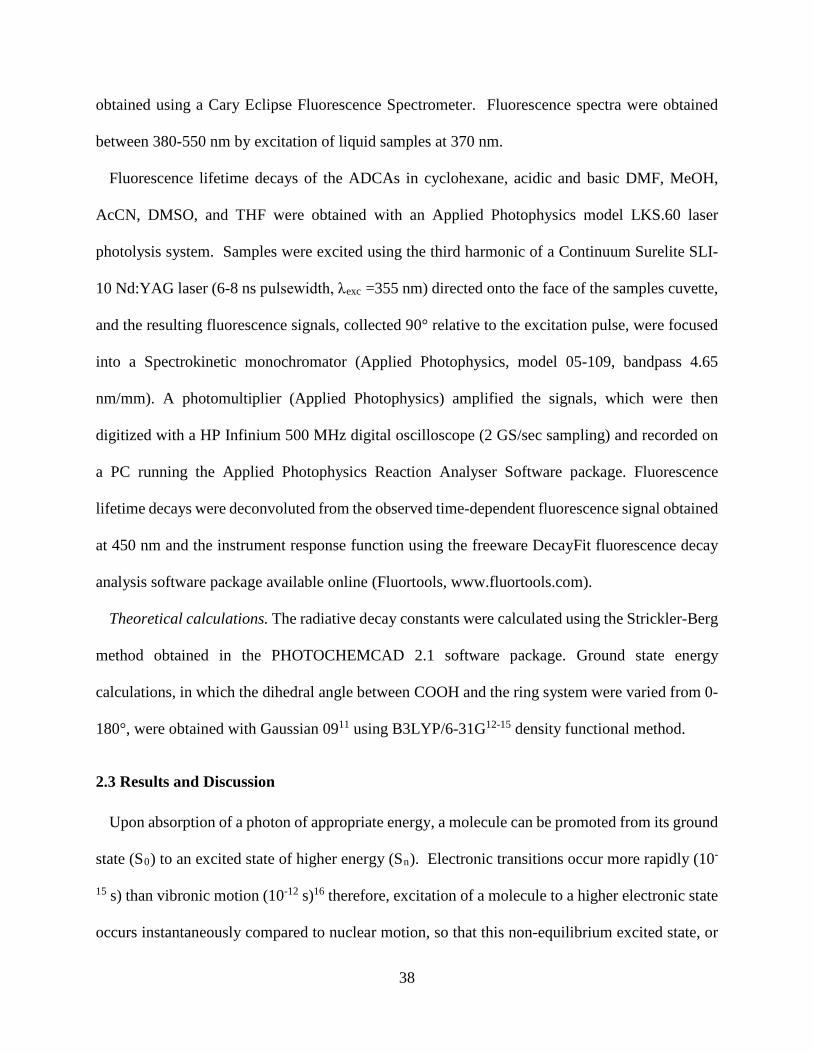
obtained using a Cary Eclipse Fluorescence Spectrometer. Fluorescence spectra were obtained
between 380-550 nm by excitation of liquid samples at 370 nm.
Fluorescence lifetime decays of the ADCAs in cyclohexane, acidic and basic DMF, MeOH,
AcCN, DMSO, and THF were obtained with an Applied Photophysics model LKS.60 laser
photolysis system. Samples were excited using the third harmonic of a Continuum Surelite SLI-
10 Nd:YAG laser (6-8 ns pulsewidth, λexc =355 nm) directed onto the face of the samples cuvette,
and the resulting fluorescence signals, collected 90° relative to the excitation pulse, were focused
into a Spectrokinetic monochromator (Applied Photophysics, model 05-109, bandpass 4.65
nm/mm). A photomultiplier (Applied Photophysics) amplified the signals, which were then
digitized with a HP Infinium 500 MHz digital oscilloscope (2 GS/sec sampling) and recorded on
a PC running the Applied Photophysics Reaction Analyser Software package. Fluorescence
lifetime decays were deconvoluted from the observed time-dependent fluorescence signal obtained
at 450 nm and the instrument response function using the freeware DecayFit fluorescence decay
analysis software package available online (Fluortools, www.fluortools.com).
Theoretical calculations. The radiative decay constants were calculated using the Strickler-Berg
method obtained in the PHOTOCHEMCAD 2.1 software package. Ground state energy
calculations, in which the dihedral angle between COOH and the ring system were varied from 0-
180°, were obtained with Gaussian 0911 using B3LYP/6-31G12-15 density functional method.
2.3 Results and Discussion
Upon absorption of a photon of appropriate energy, a molecule can be promoted from its ground
state (S0) to an excited state of higher energy (Sn). Electronic transitions occur more rapidly (10-
15 s) than vibronic motion (10-12 s)16 therefore, excitation of a molecule to a higher electronic state
occurs instantaneously compared to nuclear motion, so that this non-equilibrium excited state, or
38

Franck-Condon state, configuration is identical to the ground state. The excess energy of the
excited state is dissipated through radiation and/or radiationless processes. Such transitions may
be unimolecular or bimolecular depending on the chemical structure and environment.17 A useful
parameter used to describe such photophysical processes is quantum yield of fluorescence. The
fluorescence quantum yield (Φfl), simply put, is the ratio of the number of emitted photons to the
number of photons absorbed. In the absence of intermolecular deactivation processes, Φfl, is
related to the radiative (kr) and nonradiative (knr) decay rate constants by expression (1).
Φfl= kr
kr+knr
(1)
where, knr is sum of the internal conversion rate constant, kic, and the intersystem crossing rate
constant, kisc (5).
knr= kic+kisc (2)
τfl =1
kr+knr
(3)
Φfl= krτfl (4)
The rates of deactivation from S1 are related to the lifetime of the fluorecence, τfl, using
expression (3), which can be related to the fluorescence quantum yield by (4). Fluorescence
quantum yields can provide useful information on the nonradiative processes that compete with
fluorescence in the deactivation of the lowest singlet excited state, S1.18
Anthracene displays interesting spectral properties such as intense absorption and emission
spectra. The absorption spectrum is characterized by two sets of close lying bands spanning the 1)
220 nm to 280 nm range and 2) the 290 nm to 400 nm range (Figure 2-1). These band clusters
correspond to two separate π → π* transitions; the various maxima observed in these regions are
vibrational in nature, whose transition moments lie in one of the three planes of the molecular axes.
For example, it has been established that the transition dipole of the lowest energy transition of
39
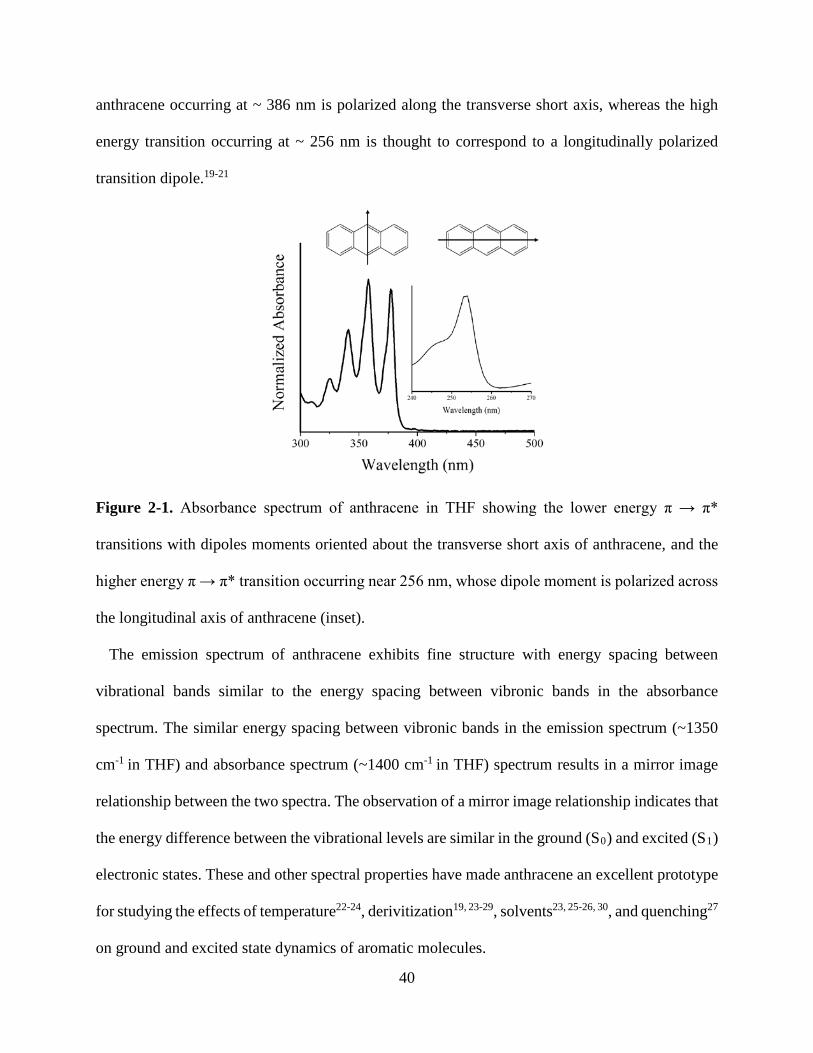
anthracene occurring at ~ 386 nm is polarized along the transverse short axis, whereas the high
energy transition occurring at ~ 256 nm is thought to correspond to a longitudinally polarized
transition dipole.19-21
Figure 2-1. Absorbance spectrum of anthracene in THF showing the lower energy π → π*
transitions with dipoles moments oriented about the transverse short axis of anthracene, and the
higher energy π → π* transition occurring near 256 nm, whose dipole moment is polarized across
the longitudinal axis of anthracene (inset).
The emission spectrum of anthracene exhibits fine structure with energy spacing between
vibrational bands similar to the energy spacing between vibronic bands in the absorbance
spectrum. The similar energy spacing between vibronic bands in the emission spectrum (~1350
cm-1 in THF) and absorbance spectrum (~1400 cm-1 in THF) spectrum results in a mirror image
relationship between the two spectra. The observation of a mirror image relationship indicates that
the energy difference between the vibrational levels are similar in the ground (S0) and excited (S1)
electronic states. These and other spectral properties have made anthracene an excellent prototype
for studying the effects of temperature22-24, derivitization19, 23-29, solvents23, 25-26, 30, and quenching27
on ground and excited state dynamics of aromatic molecules.
40
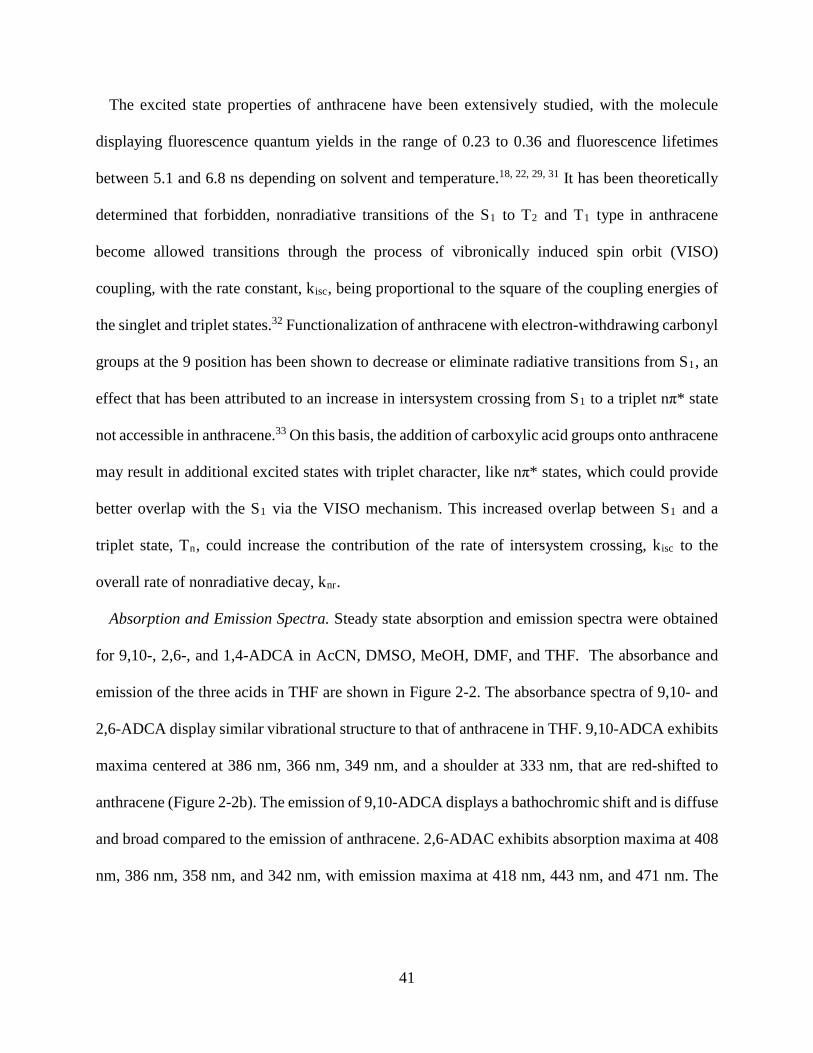
The excited state properties of anthracene have been extensively studied, with the molecule
displaying fluorescence quantum yields in the range of 0.23 to 0.36 and fluorescence lifetimes
between 5.1 and 6.8 ns depending on solvent and temperature.18, 22, 29, 31 It has been theoretically
determined that forbidden, nonradiative transitions of the S1 to T2 and T1 type in anthracene
become allowed transitions through the process of vibronically induced spin orbit (VISO)
coupling, with the rate constant, kisc, being proportional to the square of the coupling energies of
the singlet and triplet states.32 Functionalization of anthracene with electron-withdrawing carbonyl
groups at the 9 position has been shown to decrease or eliminate radiative transitions from S1, an
effect that has been attributed to an increase in intersystem crossing from S1 to a triplet nπ* state
not accessible in anthracene.33 On this basis, the addition of carboxylic acid groups onto anthracene
may result in additional excited states with triplet character, like nπ* states, which could provide
better overlap with the S1 via the VISO mechanism. This increased overlap between S1 and a
triplet state, Tn, could increase the contribution of the rate of intersystem crossing, kisc to the
overall rate of nonradiative decay, knr.
Absorption and Emission Spectra. Steady state absorption and emission spectra were obtained
for 9,10-, 2,6-, and 1,4-ADCA in AcCN, DMSO, MeOH, DMF, and THF. The absorbance and
emission of the three acids in THF are shown in Figure 2-2. The absorbance spectra of 9,10- and
2,6-ADCA display similar vibrational structure to that of anthracene in THF. 9,10-ADCA exhibits
maxima centered at 386 nm, 366 nm, 349 nm, and a shoulder at 333 nm, that are red-shifted to
anthracene (Figure 2-2b). The emission of 9,10-ADCA displays a bathochromic shift and is diffuse
and broad compared to the emission of anthracene. 2,6-ADAC exhibits absorption maxima at 408
nm, 386 nm, 358 nm, and 342 nm, with emission maxima at 418 nm, 443 nm, and 471 nm. The
41
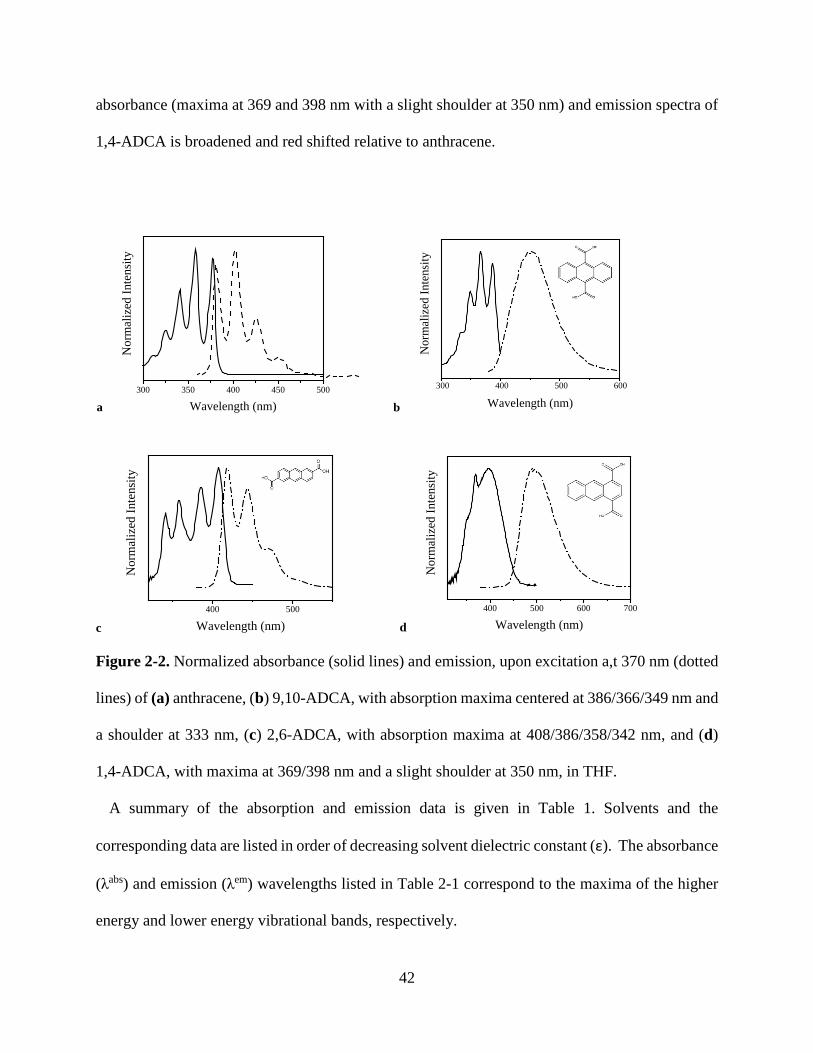
absorbance (maxima at 369 and 398 nm with a slight shoulder at 350 nm) and emission spectra of
1,4-ADCA is broadened and red shifted relative to anthracene.
300 350 400 450 500
a
Nor
mal
ized
Inte
nsity
Wavelength (nm)
300 400 500 600
Nor
mal
ized
Inte
nsity
Wavelength (nm)b
400 500
Nor
mal
ized
Inte
nsity
Wavelength (nm)c 400 500 600 700
Nor
mal
ized
Inte
nsity
Wavelength (nm)d
Figure 2-2. Normalized absorbance (solid lines) and emission, upon excitation a,t 370 nm (dotted
lines) of (a) anthracene, (b) 9,10-ADCA, with absorption maxima centered at 386/366/349 nm and
a shoulder at 333 nm, (c) 2,6-ADCA, with absorption maxima at 408/386/358/342 nm, and (d)
1,4-ADCA, with maxima at 369/398 nm and a slight shoulder at 350 nm, in THF.
A summary of the absorption and emission data is given in Table 1. Solvents and the
corresponding data are listed in order of decreasing solvent dielectric constant (ε). The absorbance
(λabs) and emission (λem) wavelengths listed in Table 2-1 correspond to the maxima of the higher
energy and lower energy vibrational bands, respectively.
42

Table 2-1. Summary of Steady State Absorption and Emission Data
Solvent [a]ε [b]λabs (nm) [c]λem (nm) Stokes (cm-1) E0,0 (eV)
9,10-ADCA
DMSO 46.7 390 455 3660 3.1 AcCN 37.5 385 457 4090 3.1 DMF(acid) 36.7 388 451 3600 3.1 MeOH 32.7 385 423 2330 3.1 THF 7.58 387 451 3670 3.1
2,6-ADCA
DMSO 46.7 410 425 861 3.0 DMF(acid) 36.7 409 423, 448 809 3.0 MeOH 32.7 401 424 1350 3.0 THF 7.58 408 418 590 3.0
1,4-ADCA
DMSO 46.7 389 511 6140 2.8 AcCN 37.5 392 517 6170 2.8 DMF(acid) 36.7 390 531 6810 2.8 MeOH 32.7 386 497 5790 2.9 THF 7.58 397 490 4780 2.8
[a]ε is the dielectric constant16, [b]λabs is the lowest energy maximum in the absorbance spectrum, and [c]λem is the highest energy maximum in the fluorescence spectrum.
The Stokes shift, given in cm-1, was calculated from the difference between the λem and λabs of
the absorbance and emission spectra. The largest Stokes shift (Table 2-1) is observed in 1,4-ADCA
(4780 cm-1) followed by 9,10-ADCA (3670 cm-1) and 2,6-ADCA (590 cm-1), all three of which
are larger than the Stokes shift of anthracene in THF (~ 278 cm-1).
The 0,0 transition energy was determined using the Planck relation (5), where λ is the
wavelength at which the absorbance and emission spectra intersect.
E(eV)= 1240 eV nm
λ (nm)
(5)
The energies of the 0,0 transition do not vary much between solvents, but decrease in the order of
9,10-ADCA, 2,6-ADCA, and 1,4-ADCA with 0,0 energies of 3.1, 3.0, and 2.8/2.9, respectively.
Effects of Functional Group Location on Spectra. The addition of functional groups onto the
anthracene ring system has been shown to effect the absorption and emission spectra.19, 26, 34-35 For
43

example, in the case of 9-anthroic acid, the vibrational structure in the absorbance spectra is
maintained but, due to inductive effects, the spectra is red-shifted relative to that of anthracene.34
It is assumed that the red-shift observed in the absorbance spectra of the three acids studied here
(Figure 2-1b-d) are also due to inductive effects. The magnitude of the spectral shift and the
vibrational structure depend on the location of the carboxylic acid on the aromatic ring system and
the extent to which the groups perturb the electronic transitions. It is known that the effects of
sterics and electronics are closely related, suggesting that the dihedral angle between an aromatic
system and its substituents is what will differ most between electronic states rather than changes
in the bond lengths of the aromatic system.17 The energetics of the ground state have been
calculated relative to the dihedral angle between the acid groups and the anthracene rings to
determine the angle that generates the most stable ground state conformation of the three acids
studied (Figure 2-3,4, and 5c). An understanding of the ground state geometry of the acid groups
on the ring system will provide a better understanding of the effects of the functional groups on
the electronic transitions occurring in anthracene.
250 300 350 400 450
0.0
0.2
0.4
0.6
0.8
1.0
300 350 400Nor
mal
ized
Abs
orba
nce
Wavelength (nm)a 0 50 100 150 200 250 300 350
0
50
100
150
200
250
300
350Energy (eV)
Dih
edra
l Ang
le 1
Dihedral Angle 2
0.0000.05170.10350.15530.20700.25880.31050.36230.4140
b
Figure 2-3. (a) Normalized absorbance of 9,10-ADCA (black) and anthracene (red) in THF. Inset
shows lower energy maxima. (b) DFT calculations of ground state energy as a function of the
COOH and anthracene dihedral angles.
44
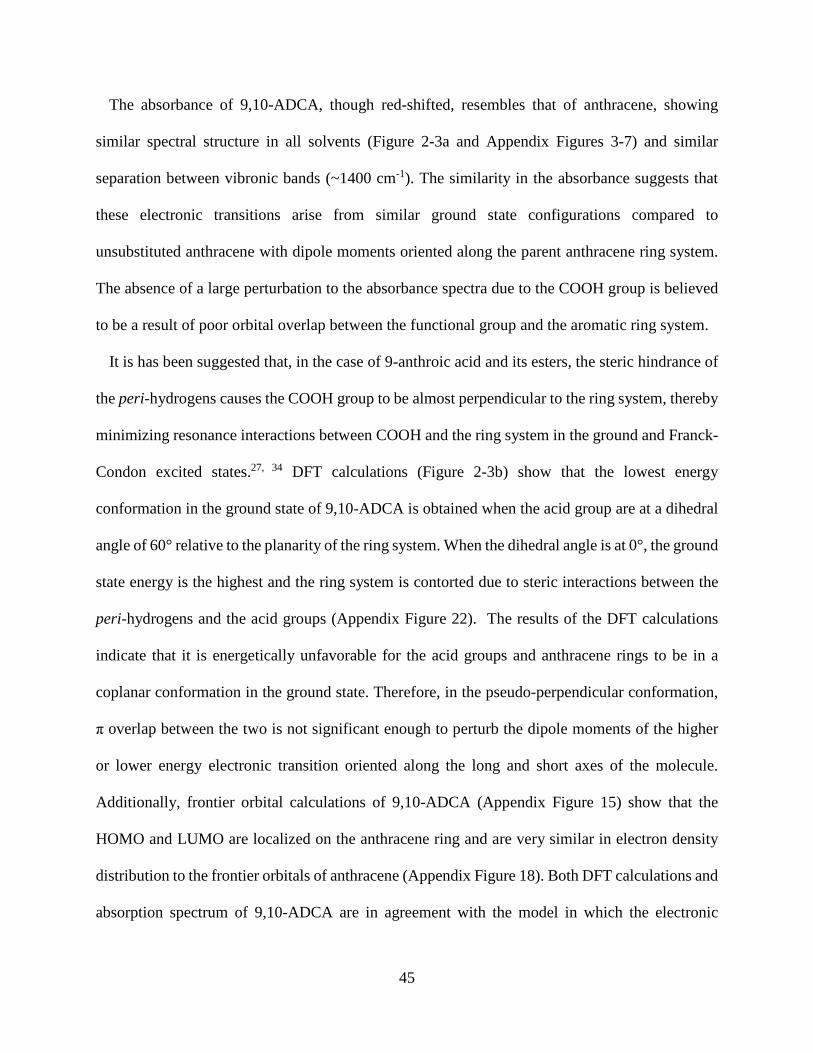
The absorbance of 9,10-ADCA, though red-shifted, resembles that of anthracene, showing
similar spectral structure in all solvents (Figure 2-3a and Appendix Figures 3-7) and similar
separation between vibronic bands (~1400 cm-1). The similarity in the absorbance suggests that
these electronic transitions arise from similar ground state configurations compared to
unsubstituted anthracene with dipole moments oriented along the parent anthracene ring system.
The absence of a large perturbation to the absorbance spectra due to the COOH group is believed
to be a result of poor orbital overlap between the functional group and the aromatic ring system.
It is has been suggested that, in the case of 9-anthroic acid and its esters, the steric hindrance of
the peri-hydrogens causes the COOH group to be almost perpendicular to the ring system, thereby
minimizing resonance interactions between COOH and the ring system in the ground and Franck-
Condon excited states.27, 34 DFT calculations (Figure 2-3b) show that the lowest energy
conformation in the ground state of 9,10-ADCA is obtained when the acid group are at a dihedral
angle of 60° relative to the planarity of the ring system. When the dihedral angle is at 0°, the ground
state energy is the highest and the ring system is contorted due to steric interactions between the
peri-hydrogens and the acid groups (Appendix Figure 22). The results of the DFT calculations
indicate that it is energetically unfavorable for the acid groups and anthracene rings to be in a
coplanar conformation in the ground state. Therefore, in the pseudo-perpendicular conformation,
π overlap between the two is not significant enough to perturb the dipole moments of the higher
or lower energy electronic transition oriented along the long and short axes of the molecule.
Additionally, frontier orbital calculations of 9,10-ADCA (Appendix Figure 15) show that the
HOMO and LUMO are localized on the anthracene ring and are very similar in electron density
distribution to the frontier orbitals of anthracene (Appendix Figure 18). Both DFT calculations and
absorption spectrum of 9,10-ADCA are in agreement with the model in which the electronic
45
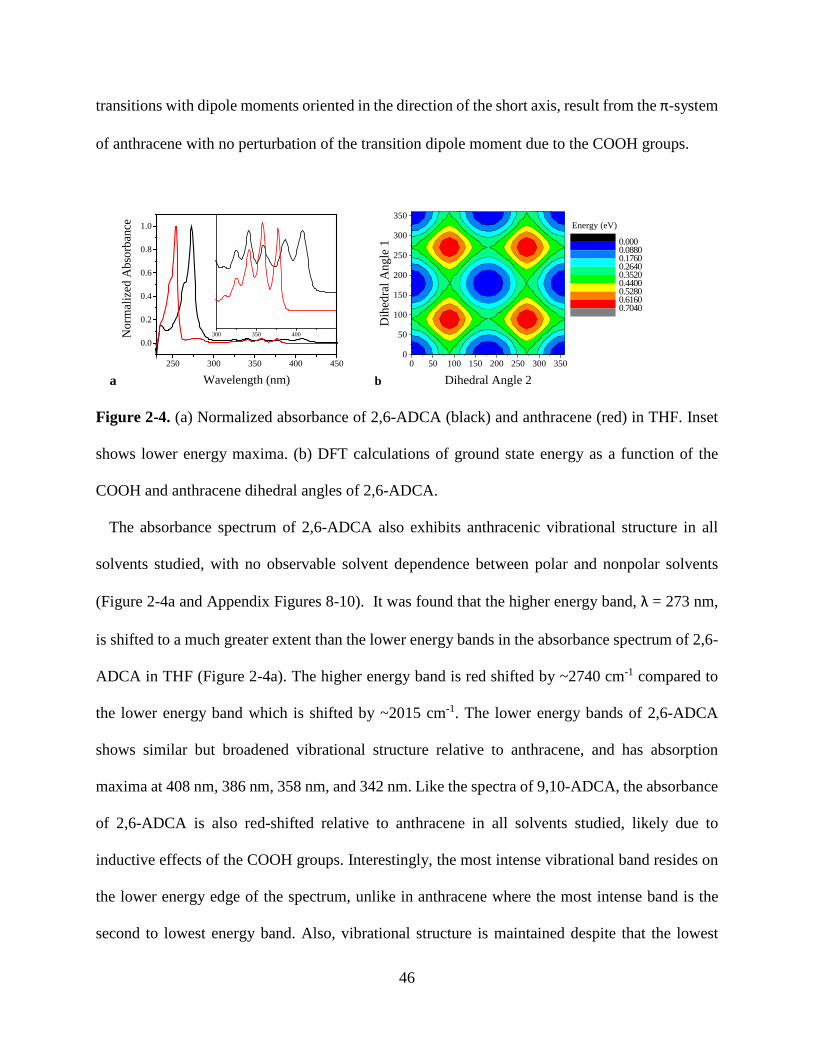
transitions with dipole moments oriented in the direction of the short axis, result from the π-system
of anthracene with no perturbation of the transition dipole moment due to the COOH groups.
250 300 350 400 450
0.0
0.2
0.4
0.6
0.8
1.0
300 350 400Nor
mal
ized
Abs
orba
nce
Wavelength (nm)a0 50 100 150 200 250 300 350
0
50
100
150
200
250
300
350
Dih
edra
l Ang
le 1
Dihedral Angle 2
Energy (eV)
0.0000.08800.17600.26400.35200.44000.52800.61600.7040
b
Figure 2-4. (a) Normalized absorbance of 2,6-ADCA (black) and anthracene (red) in THF. Inset
shows lower energy maxima. (b) DFT calculations of ground state energy as a function of the
COOH and anthracene dihedral angles of 2,6-ADCA.
The absorbance spectrum of 2,6-ADCA also exhibits anthracenic vibrational structure in all
solvents studied, with no observable solvent dependence between polar and nonpolar solvents
(Figure 2-4a and Appendix Figures 8-10). It was found that the higher energy band, λ = 273 nm,
is shifted to a much greater extent than the lower energy bands in the absorbance spectrum of 2,6-
ADCA in THF (Figure 2-4a). The higher energy band is red shifted by ~2740 cm-1 compared to
the lower energy band which is shifted by ~2015 cm-1. The lower energy bands of 2,6-ADCA
shows similar but broadened vibrational structure relative to anthracene, and has absorption
maxima at 408 nm, 386 nm, 358 nm, and 342 nm. Like the spectra of 9,10-ADCA, the absorbance
of 2,6-ADCA is also red-shifted relative to anthracene in all solvents studied, likely due to
inductive effects of the COOH groups. Interestingly, the most intense vibrational band resides on
the lower energy edge of the spectrum, unlike in anthracene where the most intense band is the
second to lowest energy band. Also, vibrational structure is maintained despite that the lowest
46

energy conformation being when the COOH groups are coplanar with the ring system, at a dihedral
angle of 0°, according to DFT calculations. At such an angle, overlap of the π-orbitals between the
ring system of anthracene and the COOH groups should be significant enough to allow for
resonance between the rings and the acid groups, which would be expected to perturb the electronic
transitions. Frontier orbital calculations of 2,6-ADCA in its lowest energy conformation (θ ≈ 0°)
show that the HOMO and LUMO are localized almost completely on the anthracene ring system.
The calculations predict that the electronic transitions occurring in the absorption spectrum of the
acid would be π→π* transitions.
It is clear from the absorbance spectrum of 2,6-ADCA in THF, that functionalization of the
anthracene ring at the 2,6 position perturbs the electronic transitions with dipole moments across
the longitudinal axis to a greater extent that those oriented across the short axis of anthracene.
Additional evidence of these substituent effects on the absorbance spectra of anthracene has been
observed in the case of 2,3,9,10-tetraphenylanthracene. The addition of phenyl substituents at the
9,10 positions had relatively no effect on the absorption spectrum, compared to anthracene, other
than producing a slight red shift.19 There is believed that the phenyl groups in the 2,3 positions
approach near coplanarity with the ring system, which has a much greater effect on the higher
energy absorption band (220 nm to 280 nm), shifting it to the red by ~4000 cm-1, whereas the lower
energy absorption band is only shifted by ~800 cm-1.19 The greater red shift of the higher energy
transition relative to the lower energy transition in the absorption spectrum of 2,3,9,10-
tetraphenylanthracene indicates that functionalization at the 2 and 3 position may result in greater
perturbation of the transition dipole moment along the long axis than the dipole moment along the
short axis. The tetraphenyl data along with the anthracenic structure evident in the absorption
spectrum of 2,6-ADCA suggests that functionalization at the 2, 3, 6, and 7 positions on anthracene
47

mainly effect the electronic transitions with moments oriented along the longitudinal long axis
with minor perturbation to the transitions oriented along the vertical short axis. Additionally, DFT
calculations of the ground state frontier orbitals of 2,6-ADCA show that the HOMO and LUMO
are evenly distributed on the anthracene ring, with little electron density residing on the COOH
groups (Appendix Figures 20). DFT calculations and the absorption data obtained for 2,6-ADCA
indicate that functionalization at the 2,6, and likely the 3,7 positions, has little effect on the
transition dipole moment across the short axis, regardless of increased resonance, but perturbs the
dipole oriented along the long axis to a much greater extent.
250 300 350 400 450 500
0.0
0.2
0.4
0.6
0.8
1.0
300 350 400 450
Nor
mal
ized
Abs
orba
nce
Wavelength (nm)a 0 50 100 150 200 250 300 350
0
50
100
150
200
250
300
350Energy (eV)
Dih
edra
l Ang
le 1
Dihedral Angle 2
0.0000.05670.11350.17030.22700.28380.34050.39720.4540
b
Figure 2-5. (a) Normalized absorbance of 1,4-ADCA (red) and anthracene (black) in THF. Inset
shows lower energy maxima. (b) DFT calculations of ground state energy as a function of the
COOH and anthracene dihedral angles of 1,4-ADCA.
The absorbance spectra of 1,4-ADCA is structureless in DMSO, but in THF (Figure 2-5a),
AcCN, and MeOH, a broad band is observed around 390 nm and a higher energy shoulder is seen
around 369 nm (Appendix Figures 11-14). The lack of vibrational structure and the red shift of the
spectra indicate that there is additional resonance between the COOH group and the ring system,
which perturbs the dipole moment of the electronic transitions along the short axis. DFT
calculations (Figure 2-5b) show that the lowest energy conformation in the ground state has the
dihedral angles between acid groups and ring system at 0°, making the COOHs coplanar with the
48
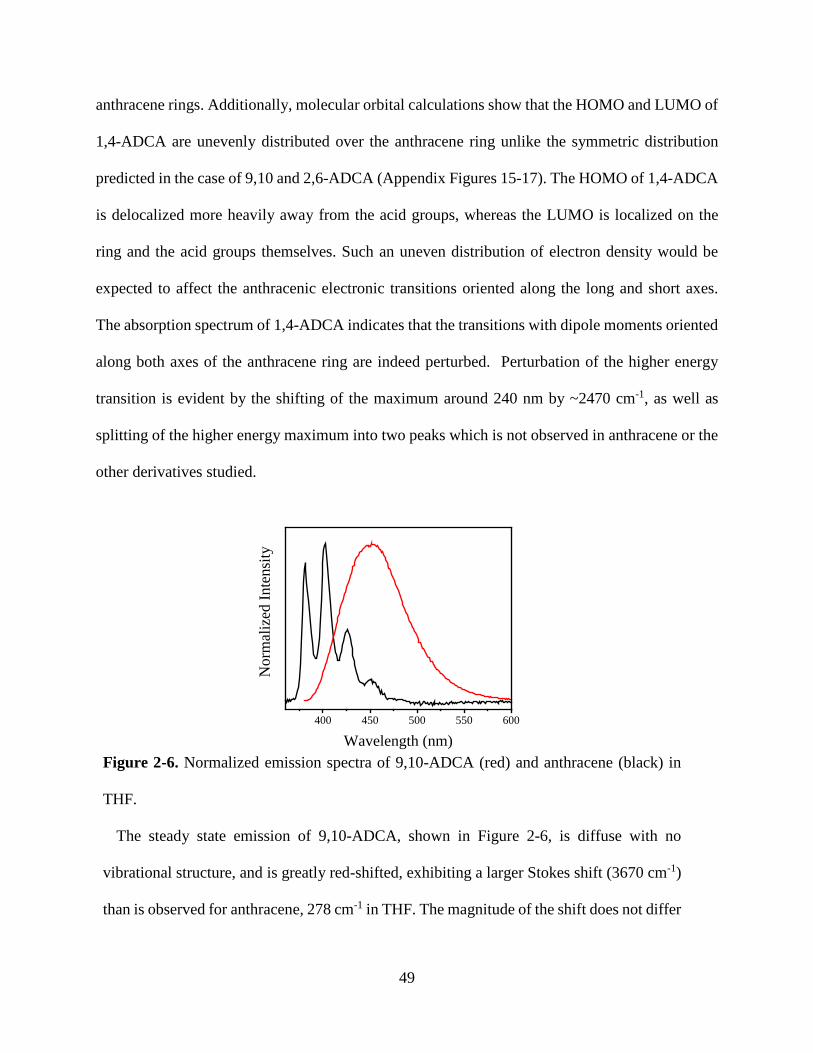
anthracene rings. Additionally, molecular orbital calculations show that the HOMO and LUMO of
1,4-ADCA are unevenly distributed over the anthracene ring unlike the symmetric distribution
predicted in the case of 9,10 and 2,6-ADCA (Appendix Figures 15-17). The HOMO of 1,4-ADCA
is delocalized more heavily away from the acid groups, whereas the LUMO is localized on the
ring and the acid groups themselves. Such an uneven distribution of electron density would be
expected to affect the anthracenic electronic transitions oriented along the long and short axes.
The absorption spectrum of 1,4-ADCA indicates that the transitions with dipole moments oriented
along both axes of the anthracene ring are indeed perturbed. Perturbation of the higher energy
transition is evident by the shifting of the maximum around 240 nm by ~2470 cm-1, as well as
splitting of the higher energy maximum into two peaks which is not observed in anthracene or the
other derivatives studied.
400 450 500 550 600
Nor
mal
ized
Inte
nsity
Wavelength (nm) Figure 2-6. Normalized emission spectra of 9,10-ADCA (red) and anthracene (black) in
THF.
The steady state emission of 9,10-ADCA, shown in Figure 2-6, is diffuse with no
vibrational structure, and is greatly red-shifted, exhibiting a larger Stokes shift (3670 cm-1)
than is observed for anthracene, 278 cm-1 in THF. The magnitude of the shift does not differ
49
greatly between solvents differing in polarity, therefore it is assumed that the solvent
dielectric of those solvents probed has little influence on the electronic transitions, S0 → Sn
and S1 → S0.
The origin of the Stokes shift is likely due to changes in the nuclear geometry in the
excited state as the rotation of the -COOH groups to a near coplanar conformation with
anthracene, result in a lower energy excited state complex due to increased resonance and
π overlap. This suggests that the equilibrium excited state, S1, lies significantly lower in
energy than the Franck-Condon state compared to anthracene. Another possible
contribution to the large shift, originally suggested by Werner and Hercules34 is due to
differences in the potential energy functions of the ground and excited states. DFT
calculations of 9,10-ADCA indicate that in the ground state the potential energy function
has a minimum and maximum around θ = 60° and 0°, respectively (Figure 2-3b). It is
proposed that an excited state of singlet character, Sn′, exists lying below the Franck-
Condon state of singlet character, Sn, and that this lowest energy accessible state has a
geometric configuration in which the dihedral angle between the COOH group and
anthracene rings is significantly different than that of the ground state and probably
approaches θ = 0° (Figure 2-7).
50

Figure 2-7. Possible relationship between ground states of different geometries (S0 and S0′)
and Franck-Condon and equilibrium excited state (Sn and Sn′).
The broad and structureless emission does not seem to be the result of inhomogeneous
band broadening but more likely results from CT interactions between the functional groups
and the ring system in the equilibrium excited state.27, 34 Relaxation from the Franck-
Condon excited state, Sn, to the equilibrium excited state, Sn′, coincides with rotation of the
COOH group to near coplanarity with the anthracene ring, resulting in increased π-overlap
causing homogeneous band broadening in the emission.34
51
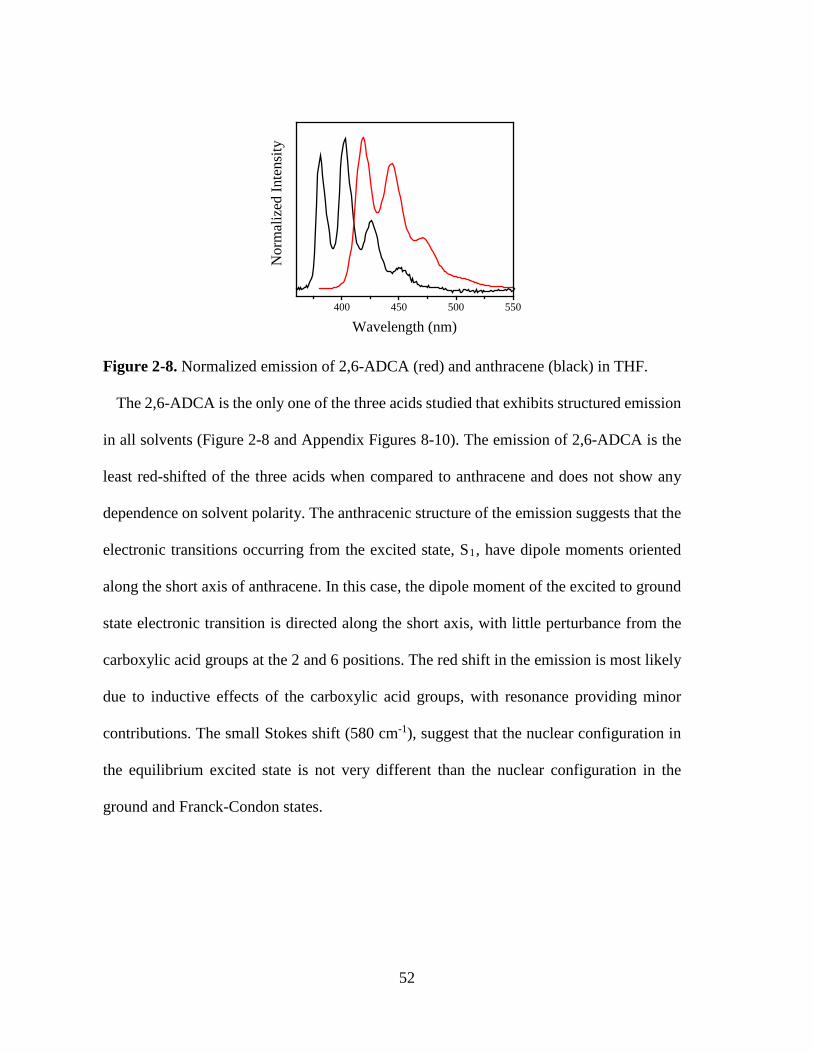
400 450 500 550
Nor
mal
ized
Inte
nsity
Wavelength (nm)
Figure 2-8. Normalized emission of 2,6-ADCA (red) and anthracene (black) in THF.
The 2,6-ADCA is the only one of the three acids studied that exhibits structured emission
in all solvents (Figure 2-8 and Appendix Figures 8-10). The emission of 2,6-ADCA is the
least red-shifted of the three acids when compared to anthracene and does not show any
dependence on solvent polarity. The anthracenic structure of the emission suggests that the
electronic transitions occurring from the excited state, S1, have dipole moments oriented
along the short axis of anthracene. In this case, the dipole moment of the excited to ground
state electronic transition is directed along the short axis, with little perturbance from the
carboxylic acid groups at the 2 and 6 positions. The red shift in the emission is most likely
due to inductive effects of the carboxylic acid groups, with resonance providing minor
contributions. The small Stokes shift (580 cm-1), suggest that the nuclear configuration in
the equilibrium excited state is not very different than the nuclear configuration in the
ground and Franck-Condon states.
52

400 450 500 550 600 650 700
Nor
mal
ized
Inte
nsity
Wavelength (nm)
Figure 2-9. Normalized emission of 1,4-ADCA (red) and anthracene (black) in THF.
The emission spectra of 1,4-ADCA is red shifted and lacks vibrational structure in all
solvents with no observable trends due to solvent polarity. The red shift, as in the case of
the other derivatives studied, is most likely due to inductive effects of the COOH groups.
The lack of structure is likely due to resonance with the COOH groups providing additional
relaxation pathways and perturbation of the electronic transition along the short axis of
anthracene.
1,4-ADCA shows the largest Stokes shift of the three acids (4780 cm-1). The magnitude
of the Stokes shift is indicative of a significant change in nuclear configuration between the
equilibrium excited state and the Franck-Condon state. Figure 2-10 shows a simplified
representation of the difference between the equilibrium excited state the Franck-Condon
state for the three acids and anthracene in THF in order of increasing change in nuclear
configuration between interacting states.
53

Figure 2-10. Comparison of nuclear coordinate changes between the equilibrium excited
state and the ground and Franck-Condon states of the three anthracenic acids and
anthracene.
Contributions to Radiative and Nonradiative Decay Constants. Fluorescence quantum yields, Фfl,
and fluorescence lifetimes, τfl, of the three acids in various solvents are displayed in Table 2-2
along with the rate constants for the radiative, kr, and nonradiative, knr, decay components of the
fluorescence lifetimes. The Фfl of the three acids were determined using Eq. 6 and the Фfl of
anthracene in ethanol (0.27)16 as a reference, Фref. The fluorescence lifetimes (τfl) were determined
by deconvoluting the fluorescence decays (Figure 2-11), using DecayFit software, from the
impulse signal and modeling the decays to a single exponential decay function (Eq. 7).
ϕfl= ϕrefms
mref
ηs2
ηref2
(6)
I(t)=A1e-t/τfl (7)
where ms and mref are the slopes obtained by plotting the integrated intensity of emission vs.
absorbance at the excitation wavelength for both the sample and reference.
54
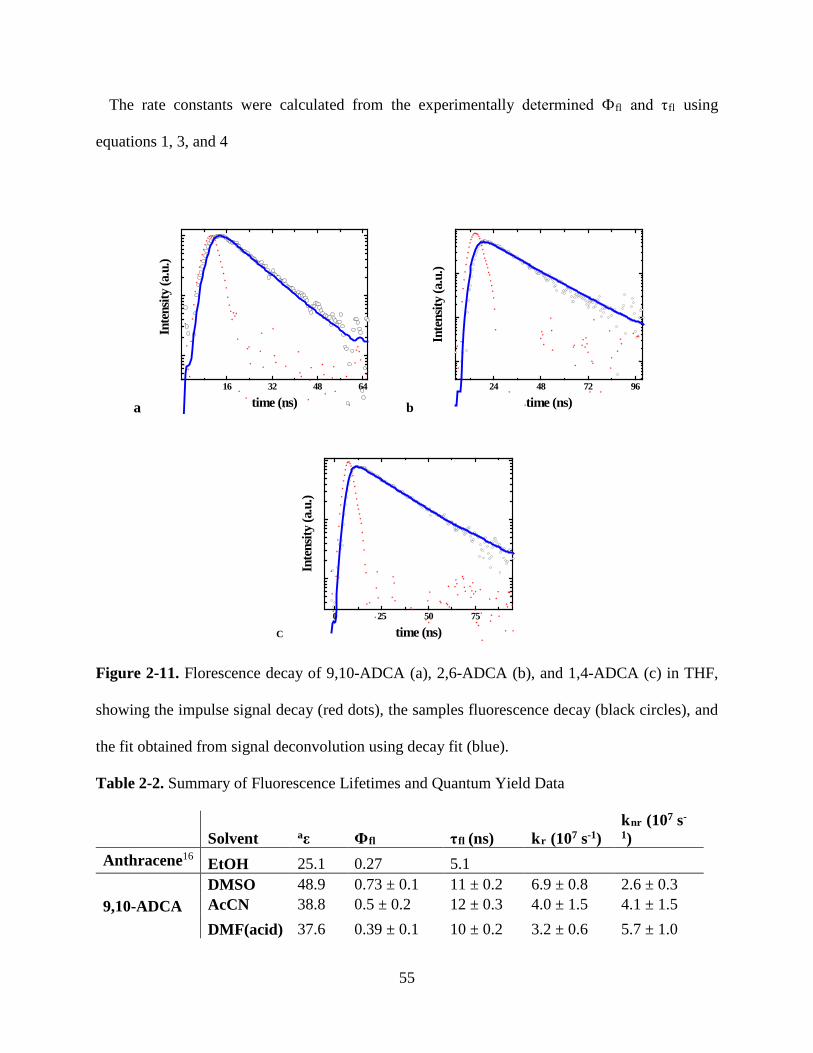
The rate constants were calculated from the experimentally determined Фfl and τfl using
equations 1, 3, and 4
16 32 48 64
Inte
nsity
(a.u
.)
time (ns)a24 48 72 96
Inte
nsity
(a.u
.)
time (ns)b
0 25 50 75
Inte
nsity
(a.u
.)
time (ns)C
Figure 2-11. Florescence decay of 9,10-ADCA (a), 2,6-ADCA (b), and 1,4-ADCA (c) in THF,
showing the impulse signal decay (red dots), the samples fluorescence decay (black circles), and
the fit obtained from signal deconvolution using decay fit (blue).
Table 2-2. Summary of Fluorescence Lifetimes and Quantum Yield Data
Solvent aε Фfl τfl (ns) kr (107 s-1) knr (107 s-
1) Anthracene16 EtOH 25.1 0.27 5.1
9,10-ADCA DMSO 48.9 0.73 ± 0.1 11 ± 0.2 6.9 ± 0.8 2.6 ± 0.3 AcCN 38.8 0.5 ± 0.2 12 ± 0.3 4.0 ± 1.5 4.1 ± 1.5 DMF(acid) 37.6 0.39 ± 0.1 10 ± 0.2 3.2 ± 0.6 5.7 ± 1.0
55
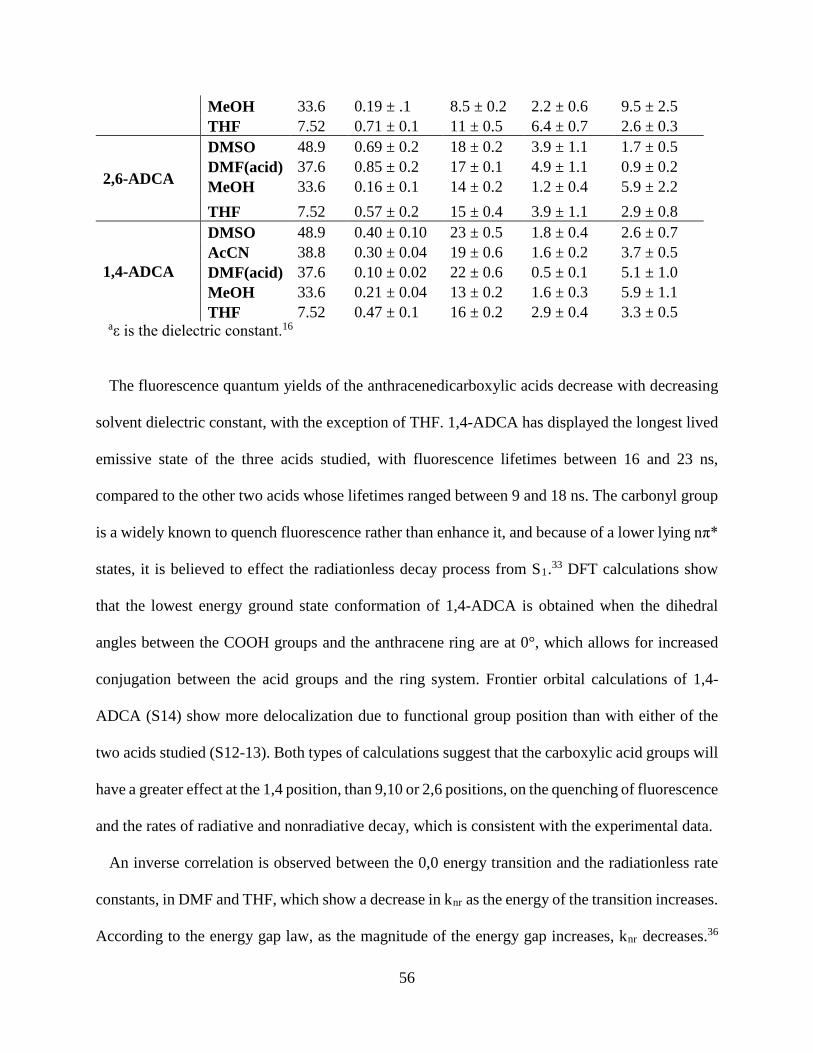
MeOH 33.6 0.19 ± .1 8.5 ± 0.2 2.2 ± 0.6 9.5 ± 2.5 THF 7.52 0.71 ± 0.1 11 ± 0.5 6.4 ± 0.7 2.6 ± 0.3
2,6-ADCA
DMSO 48.9 0.69 ± 0.2 18 ± 0.2 3.9 ± 1.1 1.7 ± 0.5 DMF(acid) 37.6 0.85 ± 0.2 17 ± 0.1 4.9 ± 1.1 0.9 ± 0.2 MeOH 33.6 0.16 ± 0.1 14 ± 0.2 1.2 ± 0.4 5.9 ± 2.2 THF 7.52 0.57 ± 0.2 15 ± 0.4 3.9 ± 1.1 2.9 ± 0.8
1,4-ADCA
DMSO 48.9 0.40 ± 0.10 23 ± 0.5 1.8 ± 0.4 2.6 ± 0.7 AcCN 38.8 0.30 ± 0.04 19 ± 0.6 1.6 ± 0.2 3.7 ± 0.5 DMF(acid) 37.6 0.10 ± 0.02 22 ± 0.6 0.5 ± 0.1 5.1 ± 1.0 MeOH 33.6 0.21 ± 0.04 13 ± 0.2 1.6 ± 0.3 5.9 ± 1.1 THF 7.52 0.47 ± 0.1 16 ± 0.2 2.9 ± 0.4 3.3 ± 0.5
aε is the dielectric constant.16
The fluorescence quantum yields of the anthracenedicarboxylic acids decrease with decreasing
solvent dielectric constant, with the exception of THF. 1,4-ADCA has displayed the longest lived
emissive state of the three acids studied, with fluorescence lifetimes between 16 and 23 ns,
compared to the other two acids whose lifetimes ranged between 9 and 18 ns. The carbonyl group
is a widely known to quench fluorescence rather than enhance it, and because of a lower lying nπ*
states, it is believed to effect the radiationless decay process from S1.33 DFT calculations show
that the lowest energy ground state conformation of 1,4-ADCA is obtained when the dihedral
angles between the COOH groups and the anthracene ring are at 0°, which allows for increased
conjugation between the acid groups and the ring system. Frontier orbital calculations of 1,4-
ADCA (S14) show more delocalization due to functional group position than with either of the
two acids studied (S12-13). Both types of calculations suggest that the carboxylic acid groups will
have a greater effect at the 1,4 position, than 9,10 or 2,6 positions, on the quenching of fluorescence
and the rates of radiative and nonradiative decay, which is consistent with the experimental data.
An inverse correlation is observed between the 0,0 energy transition and the radiationless rate
constants, in DMF and THF, which show a decrease in knr as the energy of the transition increases.
According to the energy gap law, as the magnitude of the energy gap increases, knr decreases.36
56

No such correlation is observed in the other solvents studied, nor is there any correlation between
knr and the solvent parameters listed above. The lack of solvent dependence suggests that while
changes in the energy gap contribute to an increase in knr, the dominant contributor is an increase
in kisc. The increase in triplet formation, as suggested previously, is likely due to an increase in
VISO coupling between singlet and triplet states.
2.4 Conclusion
Three anthracenedicarboxylic acids were synthesized and the photophysical properties probed
as a function of substituent location. Differences in solvent polarity, H-bond donor and acceptor
ability have little or no significant effects on the ground and excited state radiative and nonradiative
decay processes of the three acids. The addition of carboxylic acid groups onto different positions
on anthracene has been shown to effect the location of the ground state HOMOs and LUMOs and
the electronic transitions of the anthracene system.
The results indicate that functionalization at the 9,10- and 2,6 position does not perturb the
electronic transitions to the same extent as functionalization at the 1,4 position. The addition of
the acid groups at the 9,10 positions has almost no effect of the electronic transition oriented along
the short axis of anthracene due to sterics prohibiting orbital overlap between the COOHs and
anthracene. Functionalization at the 2,6 position only slightly perturbs the electronic transitions
oriented along both the longitudinal and transverse axis of anthracene, resulting in a red-shifted
and broadened spectrum with differences in the intensities of the vibrational bands. In both
molecules, the HOMOs and LUMOs of the ground state are localized on the anthracene ring
system showing little changes due to carboxylic acid positions. 1,4-ADCA has a diffuse
absorbance spectrum with significant changes to both the higher and lower energy bands, relative
to anthracene. The COOH groups are oriented about the short axis, so perturbation of the short
57
axis transitions is expected as a result of resonance between the acid groups and the ring system.
The structural differences observed in the higher energy bands is believed to be related to the
unsymmetric delocalization of the HOMO and LUMOs of 1,4-ADCA. The diffuse and red-shift
could be indicative of charge transfer interactions between anthracene and the acid groups in the
excited state, but further studies are needed to confirm such character and its effects on the
absorption spectrum.
Emission spectra of 9,10- and 1,4-ADCA are vibrationless unlike in anthracene and 2,6-ADCA.
Emission from the equilibrium excited state of 9,10-ADCA is broad and diffuse due to rotation of
the COOH groups resulting in perturbation of the S1 → S0 and increased line broadening. Emission
from the equilibrium excited state of 1,4-ADCA is also structureless due to perturbation by the
COOH groups of the S1 → S0 transition. The large Stokes shift of 9,10- and 1,4-ADCA suggest
that the ground state and equilibrium excited state conformations of the acids are significantly
different. The structured emission of 2,6-ADCA and small Stokes shift indicate that the
configuration of the ground and Franck-Condon states are similar and that the dipole moment of
the S1 → S0 transition is oriented along the short axis, thereby being mostly unaffected by the
functional groups.
The fluorescence quantum yields and lifetimes exhibit may exhibit a trend with solvent dielectric
constant, while kr and knr do not show a similar trend. The fluorescence quantum yields, lifetimes,
and the rates of radiative and nonradiative decay do not show any observable trend with any other
solvent parameters. This indicates that intramolecular, rather than intermolecular, dynamics are
dominate contributors the rates of radiative and nonradiative decay. In THF and DMF, knr
decreases with increased 0,0 energy gap, but no such trend is observed in the other solvents studied.
This data suggests that the dominate contributor to knr is intersystem crossing to a triplet state,
58

likely due to increased VISO coupling. In order to truly determine whether or not intrermolecular
forces are a dominant contributor to the rates of radiative and nonradiative decay, further studies
in various solvents are needed.
2.5 References
1. Danel, K.; Huang, T.-H.; Lin, J. T.; Tao, Y.-T.; Chuen, C.-H., Blue-Emitting Anthracenes with End-Capping Diarylamines. Chemistry of Materials 2002, 14 (9), 3860-3865. 2. Moorthy, J. N.; Venkatakrishnan, P.; Natarajan, P.; Huang, D.-F.; Chow, T. J., De Novo Design for Functional Amorphous Materials: Synthesis and Thermal and Light-Emitting Properties of Twisted Anthracene-Functionalized Bimesitylenes. Journal of the American Chemical Society 2008, 130 (51), 17320-17333. 3. Swager, T. M.; Gil, C. J.; Wrighton, M. S., Fluorescence Studies of Poly(p-phenyleneethynylene)s: The Effect of Anthracene Substitution. The Journal of Physical Chemistry 1995, 99 (14), 4886-4893. 4. Dutta, A. K., Characterization of Aggregates of Nonamphiphilic Anthracene Assembled in Ultrathin Supramolecular Langmuir−Blodgett Films. Langmuir 1997, 13 (21), 5678-5684. 5. Nierth, A.; Kobitski, A. Y.; Nienhaus, G. U.; Jäschke, A., Anthracene−BODIPY Dyads as Fluorescent Sensors for Biocatalytic Diels−Alder Reactions. Journal of the American Chemical Society 2010, 132 (8), 2646-2654. 6. Cabellero, A. G.; Croft, A. K.; Nalli, S. M., Remote aromatic stabilization in radical reactions. Tetrahedron Letters 2008, 49 (22), 3613-3615. 7. Fontenot, S. A.; Cangelosi, V. M.; Pitt, M. A. W.; Sather, A. C.; Zakharov, L. N.; Berryman, O. B.; Johnson, D. W., Design, synthesis and characterization of self-assembled As2L3 and Sb2L3 cryptands. Dalton Transactions 2011, 40 (45), 12125-12131. 8. Garay, R. O.; Naarmann, H.; Muellen, K., Synthesis and characterization of poly(1,4-anthrylenevinylene). Macromolecules 1994, 27 (7), 1922-1927. 9. J. Arient, J. P., Nitration and Oxidation of Anthraquinone Dimethyl Derivatives. Collection of Czechoslovak Chemical Communications 1973, 39 (11), 3117-3123. 10. Jones, S.; Atherton, J. C. C.; Elsegood, M. R. J.; Clegg, W., Dimethyl 9,10-anthracenedicarboxylate: a centrosymmetric transoid molecule. Acta Crystallographica Section C 2000, 56 (7), 881-883. 11. Frisch, M. J.; Trucks, G. W.; Schlegel, H. B.; Scuseria, G. E.; Robb, M. A.; Cheeseman, J. R.; Scalmani, G.; Barone, V.; Mennucci, B.; Petersson, G. A.; Nakatsuji, H.; Caricato, M.; Li, X.; Hratchian, H. P.; Izmaylov, A. F.; Bloino, J.; Zheng, G.; Sonnenberg, J. L.; Hada, M.; Ehara, M.; Toyota, K.; Fukuda, R.; Hasegawa, J.; Ishida, M.; Nakajima, T.; Honda, Y.; Kitao, O.; Nakai, H.; Vreven, T.; Montgomery Jr., J. A.; Peralta, J. E.; Ogliaro, F.; Bearpark, M. J.; Heyd, J.; Brothers, E. N.; Kudin, K. N.; Staroverov, V. N.; Kobayashi, R.; Normand, J.; Raghavachari, K.; Rendell, A. P.; Burant, J. C.; Iyengar, S. S.; Tomasi, J.; Cossi, M.; Rega, N.; Millam, N. J.; Klene, M.; Knox, J. E.; Cross, J. B.; Bakken, V.; Adamo, C.; Jaramillo, J.; Gomperts, R.; Stratmann, R. E.; Yazyev, O.; Austin, A. J.; Cammi, R.; Pomelli, C.; Ochterski, J. W.; Martin, R. L.; Morokuma, K.; Zakrzewski, V. G.; Voth, G. A.; Salvador, P.; Dannenberg, J. J.; Dapprich, S.; Daniels, A. D.; Farkas, Ö.; Foresman, J. B.; Ortiz, J. V.; Cioslowski, J.; Fox, D. J. Gaussian 09, Gaussian, Inc.: Wallingford, CT, USA, 2009.
59

12. Becke, A. D., Density-functional thermochemistry. III. The role of exact exchange. The Journal of Chemical Physics 1993, 98 (7), 5648-5652. 13. Lee, C.; Yang, W.; Parr, R. G., Development of the Colle-Salvetti correlation-energy formula into a functional of the electron density. Physical Review B 1988, 37 (2), 785-789. 14. Miehlich, B.; Savin, A.; Stoll, H.; Preuss, H., Results obtained with the correlation energy density functionals of becke and Lee, Yang and Parr. Chemical Physics Letters 1989, 157 (3), 200-206. 15. Stephens, P. J.; Devlin, F. J.; Chabalowski, C. F.; Frisch, M. J., Ab Initio Calculation of Vibrational Absorption and Circular Dichroism Spectra Using Density Functional Force Fields. The Journal of Physical Chemistry 1994, 98 (45), 11623-11627. 16. Valeur, B., Molecular Fluorescence : Principles and Applications. Wiley-VCH: Weinheim, New York, 2002. 17. Martin Klessinger, J. M., Excited States and Photochemistry of Organic Molecules. VCH Publishers, Inc.: New York, New York, 1995. 18. Dawson, W. R.; Windsor, M. W., Fluorescence yields of aromatic compounds. The Journal of Physical Chemistry 1968, 72 (9), 3251-3260. 19. Jones, R. N., The Ultraviolet Absorption Spectra of Anthracene Derivatives. Chemical Reviews 1947, 41 (2), 353-371. 20. Sidman, J. W., Electronic and Vibrational States of Anthracene. The Journal of Chemical Physics 1956, 25 (1), 115-121. 21. Platt, J. R., Classification of Spectra of Cata-Condensed Hydrocarbons. The Journal of Chemical Physics 1949, 17 (5), 484-495. 22. Eastman, J. W., The dependence of fluorescence on solvent and temperature. Spectrochimica Acta Part A: Molecular Spectroscopy 1970, 26 (7), 1545-1557. 23. Greiner, G., The unusual temperature dependence of the fluorescence intensity and lifetime of anthracene in ethanol. Journal of Photochemistry and Photobiology A: Chemistry 2000, 137 (1), 1-7. 24. Bennett, R. G.; McCartin, P. J., Radiationless Deactivation of the Fluorescent State of Substituted Anthracenes. The Journal of Chemical Physics 1966, 44 (5), 1969-1972. 25. Werner, T. C.; Hoffman, R. M., Relation between an excited state geometry change and the solvent dependence of 9-methyl anthroate fluorescence. The Journal of Physical Chemistry 1973, 77 (13), 1611-1615. 26. Jones, R. N., Some Factors Influencing the Ultraviolet Absorption Spectra of Polynuclear Aromatic Compounds. I. A General Survey1. Journal of the American Chemical Society 1945, 67 (12), 2127-2150. 27. Werner, T. C.; Fisch, R.; Goodman, G., Spectral Studies on Aromatic Esters of 9-Anthroic Acid. Spectroscopy Letters 1974, 7 (8), 385-393. 28. Ohta, A.; Hattori, K.; Kusumoto, Y.; Kawase, T.; Kobayashi, T.; Naito, H.; Kitamura, C., Effects of Alkoxy Substitution on the Optical Properties of 9,10-Anthraquinone and Anthracene: 2,3,6,7-Tetrapropoxy-substituted vs. 2,6-Dipropoxy-substituted Derivatives. Chemistry Letters 2012, 41 (7), 674-676. 29. Boens, N.; Qin, W.; Basarić, N.; Hofkens, J.; Ameloot, M.; Pouget, J.; Lefèvre, J.-P.; Valeur, B.; Gratton, E.; vandeVen, M.; Silva, N. D.; Engelborghs, Y.; Willaert, K.; Sillen, A.; Rumbles, G.; Phillips, D.; Visser, A. J. W. G.; van Hoek, A.; Lakowicz, J. R.; Malak, H.; Gryczynski, I.; Szabo, A. G.; Krajcarski, D. T.; Tamai, N.; Miura, A., Fluorescence Lifetime
60

Standards for Time and Frequency Domain Fluorescence Spectroscopy. Analytical Chemistry 2007, 79 (5), 2137-2149. 30. Tigoianu, I. R.; Dorohoi, D. O.; Airinei, A., Solvent influence on the electronic absorption spectra of anthracene. Rev. Chim. (Bucharest, Rom.) 2009, 60 (1), 42-44. 31. Blatt, E.; Treloar, F. E.; Ghiggino, K. P.; Gilbert, R. G., Viscosity and temperature dependence of fluorescence lifetimes of anthracene and 9-methylanthracene. The Journal of Physical Chemistry 1981, 85 (19), 2810-2816. 32. Gastilovich, E. A.; Klimenko, V. G.; Korol'kova, N. V.; Nurmukhametov, R. N.; Serov, S. A., Effect of the vibronically induced spin-orbit coupling of electronic ππ* states on nonradiative intersystem crossing: Anthracene. Optics & Spectroscopy 2008, 105 (1), 38-45. 33. Hirayama, S., Effect of substituent on the behaviour of the excited singlet and triplet states in carbonyl derivatives of anthracene of the type 9-X[middle dot]CO[middle dot]A. Journal of the Chemical Society, Faraday Transactions 1: Physical Chemistry in Condensed Phases 1982, 78 (8), 2411-2421. 34. Werner, T. C.; Hercules, D. M., Fluorescence of 9-anthroic acid and its esters. Environmental effects on excited-state behavior. The Journal of Physical Chemistry 1969, 73 (6), 2005-2011. 35. Abdel-Mottaleb, M. S. A.; Galal, H. R.; Dessouky, A. F. M.; El-Naggar, M.; Mekkawi, D.; Ali, S. S.; Attya, G. M., Fluorescence and photostability studies of anthracene-9-carboxylic acid in different media. International Journal of Photoenergy 2000, 2 (1), 47-53. 36. Englman, R.; Jortner, J., The energy gap law for radiationless transitions in large molecules. Molecular Physics 1970, 18 (2), 145-164.
61

Chapter 3. Synthesis and Luminescent Properties of Two Microporous Metal Organic
Frameworks
3.1 Introduction
Photoactive metal organic frameworks (MOFs) have been shown to be promising new
candidates for applications as sensors1-2, photocatalysts3, sensitizers4, and electroluminescent
devices5-6. Luminescent MOFs can be constructed from fluorescent or phosphorescent lanthanides,
aromatic organic molecules, or metal complexes used as linkers.7-9 A very attractive feature of
MOFs, which allow for their use in an array of applications, is that they are constructed from both
organic and inorganic components. In the case of fluorescent MOFs, the luminescence may be
generated from either or both the organic and inorganic counterparts resulting in both predictable
and unforeseen properties and tunability previously unobserved in materials primarily composed
of inorganic or organic parts.
MOFs with luminescence originating from the organic ligand are desirable because the
range of their absorption and emission can be tuned through functionalization of the organic linkers
prior or post MOF synthesis. This provides researchers with the ability to rationally design these
materials with desired absorption and emission properties required for a particular application.
Photoactive MOFs are often constructed from aromatic ligands which provide rigidity and π-based
excitation and emission. Functionalization of the aromatic ligands often results in perturbation of
the photo-induced electronic transitions, thereby affecting the absorption and emission energies of
the material.
62
MOFs with ligand-based luminescence may have similar chemical and physical properties
to that of the ligand, but as a result of metal coordination, solvent environment, and aggregation
effects, the photophysics of the MOF differ. In this chapter, the steady state luminescence of two
MOFs, Zn4O(H2O)3(C16H8O4)3·2DMF (PCN-13)10, and being reported for the first time,
[Zn(C16H8O4)(H2O)]n (1), are compared to the steady state luminescence of their constituent
linkers: 9,10-anthracenedicarboxylic acid (9,10-ADCA) and 2,6-anthracenedicarboxylic acid (2,6-
ADCA). In the previous chapter the effects of carboxylic acid functional group location on the
ring system on the photophysics of the organic ligands were examined. It was determined that both
the absorbance and emission spectra were effected differently, depending on the location of the
carboxylic acid groups. Upon construction into a MOF, the ligands photophysical properties would
be expected to differ due to the change in molecular environment. Herein, I will discuss the effects
of the incorporated ligand on steady state luminescence of the zinc based MOFs, PCN-13 and
[Zn(C16H8O4)(H2O)]n (1).
3.2 Experimental
The synthesis of 9,10-ADCA and 2,6-ADCA have been described in the previous chapter.
Synthesis of PCN-13. Synthesis of PCN-13 was performed as previously reported.10 9,10-ADCA
(0.005 g, 0.019 mmol) and Zn(NO3)2·6H2O (0.02 g, 0.068 mmol) was dissolved separately in 1.5
mL of dimethylformamide (DMF). The two solution were combined in a 20 mL autoclave and
placed in an oven programmed to increase in temperature at a rate of 1 °C/min to 120 °C. The
autoclave was left in the oven at 120 °C for 24 h. After 24 h, the autoclave was cooled to room
temperature at a rate < 1 °C/min. The resulting light-brown crystals were collected by vacuum
filtration, washed with DMF, and dried in a vacuum oven with no heat.
63
Synthesis of [Zn(C16H8O4)(H2O)]n (1). 5.0 mg (1.9 x 10⁻² mmol) of 2,6-ADCA was added to a 1
dram vial, and 5.6 mg (1.9 x 10⁻² mmol) of Zn(NO3)2·6H2O was added to a separate 1 dram vial.
To each vial 583 μL of a DEF/H2O (9:1) solution was added. The Zn(NO3)2 solution was added
to the vial containing 2,6-ADCA, and the vial was capped and sonicated for 15 min. After
sonication, the vial was placed in an oven set to ramp up to 120 °C at 1 °C/min. The reaction was
left at 120 °C for 24 h before being cooled to room temperature at a rate of less than 1 °C/min.
Yellow/brown plate crystals were collected by vacuum filtration, washed with DEF and dried
under vacuum for 24 h. Once dry, the crystals were ground using a mortar and pestle and
characterized using PXRD. Single crystal analysis was performed on a batch of 1, which were left
in the DEF solution until analysis could be performed.
Single Crystal X-ray Crystallographic Study. A yellow-brown plate (0.1769 x 0.1098 x 0.0195
mm3) was centered on the goniometer of an Agilent Nova diffractometer operating with CuKα
radiation. The data collection routine, unit cell refinement, and data processing were carried out
with the program CrysAlisPro.11 The Laue symmetry and systematic absences were consistent
with the monoclinic space groups C2/c and Cc. The centric space group C2/c was chosen. The
structure was solved using SHELXS-201312 and refined using SHELXL-201312 via OLEX2.13 The
final refinement model involved anisotropic displacement parameters for non-hydrogen atoms. A
riding model was used for the aromatic hydrogens. The symmetry independent H-atom of the
water molecule was located from the residual electron density map and the O-H distance restrained
to 0.82(2) during refinement. The isotropic displacement parameter of the water H-atom was
refined independently.
Steady State Luminescence Studies. Steady-state absorption spectra of the 9,10- and 2,6-ADCs
were obtained using a Cary Series 5000 UV-vis NIR spectrophotometer on ~5 x 10⁻⁵ M DMF
64
solutions. Basic solutions of DMF were obtained by dissolving 1.0 g of KOH tablets in
approximately 20 mL of DMF, followed by filtration to remove undissolved KOH. The basic DMF
solution was titrated into 5 x 10⁻⁵ M DMF solutions of the linkers, and the UV-vis spectrum was
monitored throughout the titration. The basic form of the linkers were determined to be present in
solution once the spectra stopped shifting after the addition of many aliquots of basic DMF.
MOF steady-state Kubelka-Monk spectra were carried out on a Cary Series 5000 UV-vis
NIR spectrophotometer equipped with a diffuse reflectance attachment. The MOF was ground into
a fine powder using a mortar and pestle, before being placed in the sample holder.
Steady-state fluorescence spectra of 5 x 10⁻⁵ M basic DMF solutions of 9,10- and 2,6-ADC
were obtained using a Cary Eclipse Fluorescence Spectrometer. Fluorescence spectra were
obtained between 380-600 nm by excitation of liquid samples at 370 nm. MOF fluorescence
spectra were collected on the same instrument using quartz slides and a light layer of vacuum
grease to hold the MOF in place on the slide.
3.3 Results and Discussion
Crystal Structure Description of 1. Single X-ray crystal analysis reveals that 1 crystallizes in a
monoclinic crystal system of a C1 2/c 1 space group with the molecular formula of
Zn(C16H8O4)(H2O) and formula weight of 347.61 g/mol. The unit cell consists of six 2,6-ADC
molecules, each connected to four Zn atoms by the oxygens of the carboxylate groups (Figure 3-1
b). The Zn atom is complexed to four different 2,6-ADC linkers and a water molecule in a distorted
triganol bipyramidal geometry (Figure 3-1a).
65
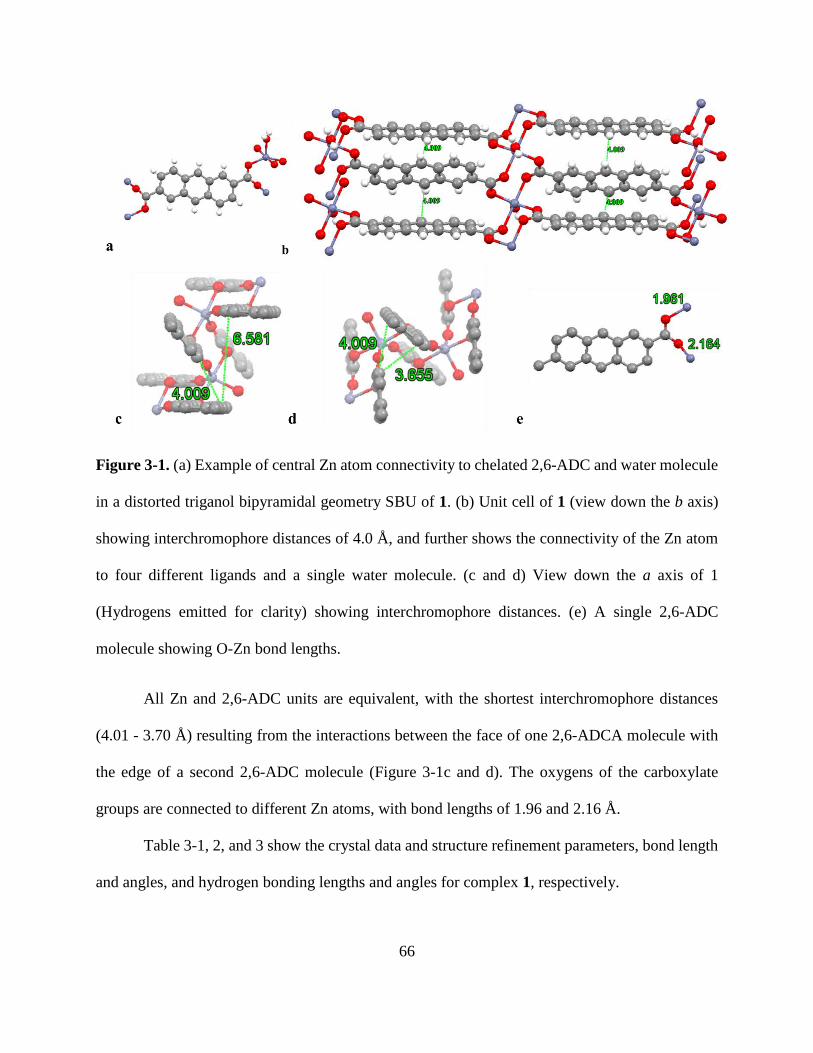
Figure 3-1. (a) Example of central Zn atom connectivity to chelated 2,6-ADC and water molecule
in a distorted triganol bipyramidal geometry SBU of 1. (b) Unit cell of 1 (view down the b axis)
showing interchromophore distances of 4.0 Å, and further shows the connectivity of the Zn atom
to four different ligands and a single water molecule. (c and d) View down the a axis of 1
(Hydrogens emitted for clarity) showing interchromophore distances. (e) A single 2,6-ADC
molecule showing O-Zn bond lengths.
All Zn and 2,6-ADC units are equivalent, with the shortest interchromophore distances
(4.01 - 3.70 Å) resulting from the interactions between the face of one 2,6-ADCA molecule with
the edge of a second 2,6-ADC molecule (Figure 3-1c and d). The oxygens of the carboxylate
groups are connected to different Zn atoms, with bond lengths of 1.96 and 2.16 Å.
Table 3-1, 2, and 3 show the crystal data and structure refinement parameters, bond length
and angles, and hydrogen bonding lengths and angles for complex 1, respectively.
66
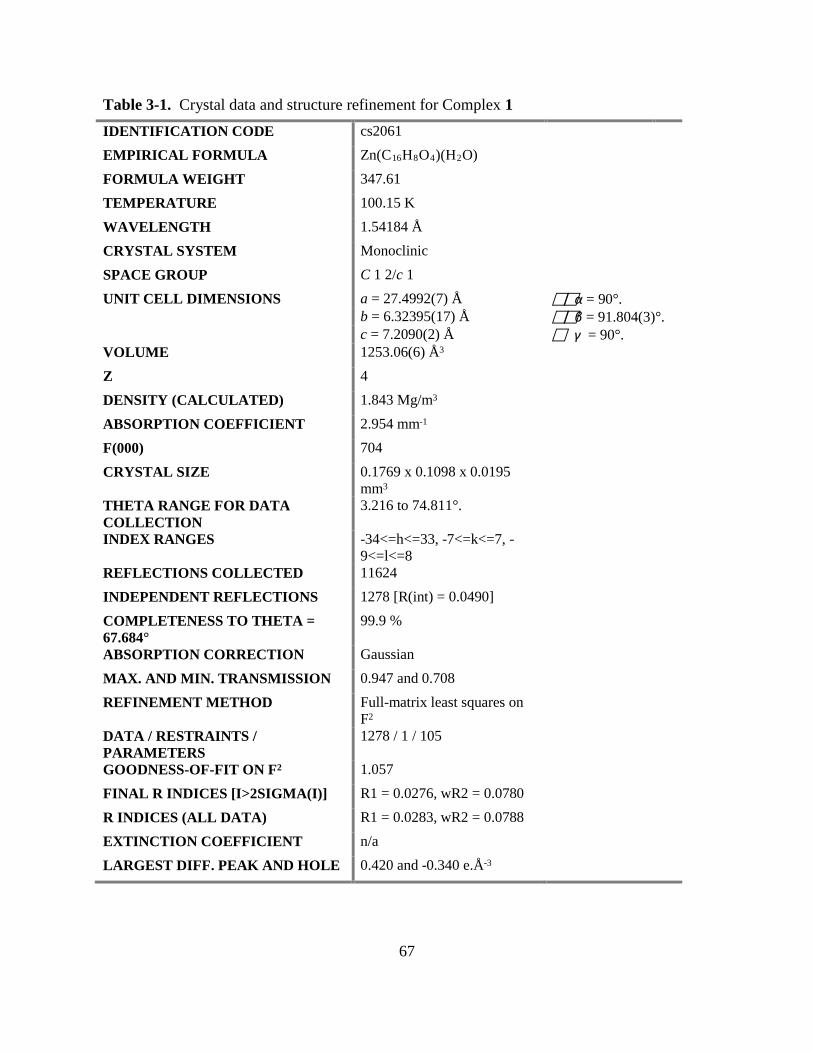
Table 3-1. Crystal data and structure refinement for Complex 1 IDENTIFICATION CODE cs2061 EMPIRICAL FORMULA Zn(C16H8O4)(H2O) FORMULA WEIGHT 347.61 TEMPERATURE 100.15 K WAVELENGTH 1.54184 Å CRYSTAL SYSTEM Monoclinic SPACE GROUP C 1 2/c 1 UNIT CELL DIMENSIONS a = 27.4992(7) Å α = 90°. b = 6.32395(17) Å β = 91.804(3)°. c = 7.2090(2) Å γ = 90°. VOLUME 1253.06(6) Å3 Z 4 DENSITY (CALCULATED) 1.843 Mg/m3 ABSORPTION COEFFICIENT 2.954 mm-1 F(000) 704 CRYSTAL SIZE 0.1769 x 0.1098 x 0.0195
mm3
THETA RANGE FOR DATA COLLECTION
3.216 to 74.811°.
INDEX RANGES -34<=h<=33, -7<=k<=7, -9<=l<=8
REFLECTIONS COLLECTED 11624 INDEPENDENT REFLECTIONS 1278 [R(int) = 0.0490] COMPLETENESS TO THETA = 67.684°
99.9 %
ABSORPTION CORRECTION Gaussian MAX. AND MIN. TRANSMISSION 0.947 and 0.708 REFINEMENT METHOD Full-matrix least squares on
F2
DATA / RESTRAINTS / PARAMETERS
1278 / 1 / 105
GOODNESS-OF-FIT ON F2 1.057 FINAL R INDICES [I>2SIGMA(I)] R1 = 0.0276, wR2 = 0.0780 R INDICES (ALL DATA) R1 = 0.0283, wR2 = 0.0788 EXTINCTION COEFFICIENT n/a LARGEST DIFF. PEAK AND HOLE 0.420 and -0.340 e.Å-3
67

Table 3-2. Bond lengths [Å] and angles [°] for complex 1.
Bond lengths [Å] for 1 Angles [°] for 1
Zn(1)-O(1)#1 2.1645(13) O(1)#2-Zn(1)-O(1)#1
175.12(6) C(3)-C(2)-C(4)
120.58(16)
Zn(1)-O(1)#2 2.1645(13) O(2)-Zn(1)-O(1)#1
93.55(5) C(4)-C(2)-C(1)
119.27(16)
Zn(1)-O(2)#3 1.9611(12) O(2)#3-Zn(1)-O(1)#2
93.55(5) C(2)-C(3)-C(7)
120.44(17)
Zn(1)-O(2) 1.9611(12) O(2)-Zn(1)-O(1)#2
88.11(5) C(5)-C(4)-C(2)
120.49(16)
Zn(1)-O(3) 1.977(2) O(2)#3-Zn(1)-O(1)#1
88.11(5) C(4)-C(5)-C(6)
120.89(17)
O(1)-C(1) 1.268(2) O(2)-Zn(1)-O(2)#3
140.32(8) C(5)-C(6)-C(7)
118.74(16)
O(2)-C(1) 1.260(2) O(2)#3-Zn(1)-O(3)
109.84(4) C(8)#4-C(6)-C(5)
121.87(17)
C(1)-C(2) 1.499(2) O(2)-Zn(1)-O(3)
109.84(4) C(8)#4-C(6)-C(7)
119.39(17)
C(2)-C(3) 1.371(3) O(3)-Zn(1)-O(1)#2
87.56(3) C(3)-C(7)-C(6)
118.85(17)
C(2)-C(4) 1.427(3) O(3)-Zn(1)-O(1)#1
87.56(3) C(8)-C(7)-C(3)
121.61(17)
C(3)-C(7) 1.430(2) C(1)-O(1)-Zn(1)#1
123.67(11) C(8)-C(7)-C(6)
119.53(17)
C(4)-C(5) 1.360(2) C(1)-O(2)-Zn(1)
119.36(11) C(7)-C(8)-C(6)#4
121.07(17)
C(5)-C(6) 1.432(2) O(1)-C(1)-C(2) 118.99(16)
68

C(6)-C(7) 1.436(2) O(2)-C(1)-O(1) 123.37(16)
C(6)-C(8)#4 1.401(2) O(2)-C(1)-C(2) 117.62(15)
C(7)-C(8) 1.401(3 C(3)-C(2)-C(1) 120.14(16) Symmetry transformations used to generate equivalent atoms: #1 -x,-y,-z+1 #2 x,-y,z-1/2 #3 -x,y,-z+1/2 #4 -x+1/2,-y+1/2,-z+1 Table 3-3. Hydrogen bonds lengths [Å ] and angles [°]for 1.
D-H...A d(D-H) d(H...A) d(D...A) <(DHA) O(3)-H(3A)...O(1)#5 0.780(17) 1.878(19) 2.6314(19) 162(3)
Symmetry transformations used to generate equivalent atoms: #1 -x,-y,-z+1 #2 x,-y,z-1/2 #3 -x,y,-z+1/2 #4 -x+1/2,-y+1/2,-z+1 #5 -x,y-1,-z+1/2
Figure 3-2 shows the structure of 1 looking down the a, b, and c axes. The MOF has a very
compact and symmetric topology interchromophore distances of 4.0 Å. The complex has a
calculated density of 1.843 Mg/m3 and no solvent molecules are present within the crystal
structure. Each 2,6-ADC molecule is connected to four separate Zn centers through the carboxylate
functional groups.
69

Figure 3-2. View down the crystallographic a axis (a), b axis (b), and c axis (c).
Crystal Structure Description of PCN-13. The crystal structure of PCN-13 has been described in
the literature14 and is presented here in Figure 3-3. The SBU of PCN-13 is formed by a
Zn4O(H2O)3(COO)6 cluster (Figure 3-3a), where a central oxygen is connected to four Zn atoms
in a tetrahedral geometry. The three of the four Zn atoms are connected to three different 9,10-
ADC linkers and a water molecule and the μ3-oxygen. The fourth Zn atom is only connected to
the three 9,10-ADC linkers and the μ3-oxygen. Each 9,10-ADC ligand is connected to two SBUs,
and every SBU is connected to six different 9,10-ADC ligand, forming a 3-D framework with no
possible π-π stacking (Figure 3-3b).
70

Figure 3-3. (a) Zn4O(H2O)3(COO)6 SBU of PCN-13. The water ligands (Hydrogens not shown
for clarity) are connected to the three front-most Zn atoms. (b) View down the a axis of PCN-13.
(carbon (grey), hydrogen (white), oxygen (red), and zinc (blue).)
Characterization of PCN-13 and 1. Powder x-ray diffraction (PXRD) was used to characterize the
structure of PCN-13. Experimentally determined patterns were overlaid with the simulated PXRD
pattern generated from the literature crystal structure using Mercury.15 Thermogravimetric analysis
(TGA) was also used for identification purposes for PCN-13, and results matched well with the
TGA found in the literature. Figure 3-2 shows PXRD, comparing the simulated literature pattern
to experimentally obtained pattern, and TGA data for PCN-13.
71

10 20 30 40 50 602θ (degrees)
Inte
nsity
a
100 200 300 400 500 60020
30
40
50
60
70
80
90
100
110
Weig
ht %
Temperature (°C)b
0.0
0.2
0.4
0.6
0.8
1.0
Deriv
ative
of W
eight
%
Figure 3-4. (a) PXRD of simulated literature pattern (blue) and experimentally obtained PCN-13
pattern (black). (b) TGA of synthesized PCN-13 showing the loss in weight percent (solid curve)
and derivative of the weight percent (dashed curve) as a function of temperature.
The PXRD of synthesized PCN-13 matches well with the literature pattern. The TGA in
Figure 3-4 shows a gradual loss in weight percent as a function of temperature. The loss of two
unbound DMF molecules is observed from approximately 100 to 240 °C, resulting in a weight
percent loss of 11.7 %. The loss of DMF molecules is followed by the loss of three bound water
molecules from 240 to 320 °C giving a weight percent loss of 7.7 %. Degradation of 9,10-ADC is
observed from 330 to 510 °C.
10 20 30 40 50 60 70
2θ (degrees)
Inte
nsity
a
100 200 300 400 500 60020
30
40
50
60
70
80
90
100
110
Temperature (°C)
Wei
ght %
b
0.0
0.5
1.0
1.5
2.0
Der
ivat
ive
of W
eigh
t %
Figure 3-5. (a) PXRD of simulated pattern from crystallography data of 1 (blue) and
experimentally obtained 1 pattern (black). (b) TGA of synthesized 1 showing the loss in weight 72

percent (solid curve) and derivative of the weight percent (dashed curve) as a function of
temperature.
Other than crystal structure determination from a single crystal, PXRD was also used to
confirm the synthesis of 1, by comparing it to a simulated PXRD pattern obtained, using Mercury,
from the crystallographic data obtained for 1 (Figure 3-5a). TGA was also used to confirm the
makeup of the MOF. TGA shows the loss of one bound water molecule, 5.12 weight %, is observed
from 160 – 230 °C, followed by the degradation of 2,6-ADC starting around 400 °C (Figure 3-5b).
Steady state absorption and emission. Steady state luminescence spectra were obtained for the
PCN-13 and 1 and 9,10- and 2,6-anthracenedicarboxylate (9,10-ADC and 2,6-ADC). Absorption
spectra of the two ligands were obtained in basic DMF and both exhibit vibrational structure
similar to their parent molecule, anthracene (Figure 3-6a and b). 9,10-ADC exhibits absorption
maxima at 348/368/386/408 nm with spacing between bands of approximately 1560/1270/1400
cm-1. The absorbance of 2,6-ADC shows maxima at 349/368/389/420 nm with approximate
spacing between bands of 1480/1470/1900 cm-1.
300 350 400 450
Nor
mal
ized
Inte
nsity
Wavelength (nm)a 300 320 340 360 380 400 420 440
0.0
0.2
0.4
0.6
0.8
1.0
Nor
mal
ized
Abs
orba
nce
Wavelength (nm)b
Figure 3-6. (a) Normalized absorption of 9,10-ADC and (b) 2,6-ADC in DMF.
73

MOFs are often not very soluble and may be degraded by various solvents, therefore, the
absorption and emission of the MOFs were obtained in the solid state. A diffuse reflectance
attachment was used to obtain an absorbance spectra of the two MOFs, which were recorded in
the Kubelka-Monk, F(R), mode. The normalized F(R) of the MOFs and the basic form of the
linkers are compared in Figure 3-7.
300 325 350 375 400 425 450
Nor
mal
ized
F(R
)
Wavelength (nm)a 300 350 400 450 500 550 600
Nor
mal
ized
F(R
)
Wavelength (nm)b
Figure 3-7. (a) Normalized absorbance of solid PCN-13 (solid line) and basic 9,10-ADC in DMF
(dashed line). (b) Normalized absorbance of solid 1 (solid line) and basic 2,6-ADC in DMF
(dashed line).
The absorbance spectrum of PCN-13 is broadened and blue shifted relative to the basic
linker in solution. Absorbance maxima for PCN-13 were observed at 342/357/373/395 nm with
spacing between bands approximately 1230/1200/1490 cm-1. Despite the broadening of the
absorbance spectrum of PCN-13 relative to the ligand, the anthracenic vibrational structure is still
apparent, suggesting that the transitions occurring are π to π* based. Since Zn(II) has a d10
electronic configuration, it is neither easy to reduce or oxidize, which further suggests that ligand
to ligand electron transfer is responsible for the absorption spectra of PCN-13.16 The broadening
of the absorbance spectrum of PCN-13 relative to 9,10-ADC is due to inductive effects of the Zn
74
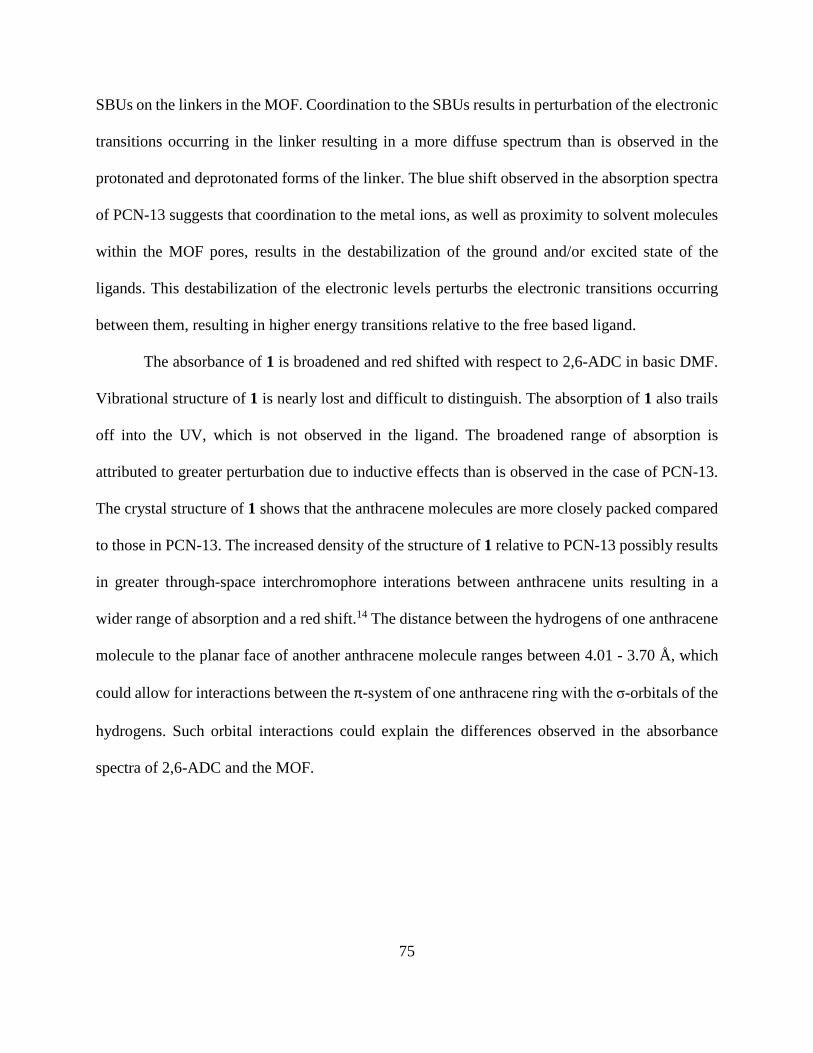
SBUs on the linkers in the MOF. Coordination to the SBUs results in perturbation of the electronic
transitions occurring in the linker resulting in a more diffuse spectrum than is observed in the
protonated and deprotonated forms of the linker. The blue shift observed in the absorption spectra
of PCN-13 suggests that coordination to the metal ions, as well as proximity to solvent molecules
within the MOF pores, results in the destabilization of the ground and/or excited state of the
ligands. This destabilization of the electronic levels perturbs the electronic transitions occurring
between them, resulting in higher energy transitions relative to the free based ligand.
The absorbance of 1 is broadened and red shifted with respect to 2,6-ADC in basic DMF.
Vibrational structure of 1 is nearly lost and difficult to distinguish. The absorption of 1 also trails
off into the UV, which is not observed in the ligand. The broadened range of absorption is
attributed to greater perturbation due to inductive effects than is observed in the case of PCN-13.
The crystal structure of 1 shows that the anthracene molecules are more closely packed compared
to those in PCN-13. The increased density of the structure of 1 relative to PCN-13 possibly results
in greater through-space interchromophore interations between anthracene units resulting in a
wider range of absorption and a red shift.14 The distance between the hydrogens of one anthracene
molecule to the planar face of another anthracene molecule ranges between 4.01 - 3.70 Å, which
could allow for interactions between the π-system of one anthracene ring with the σ-orbitals of the
hydrogens. Such orbital interactions could explain the differences observed in the absorbance
spectra of 2,6-ADC and the MOF.
75
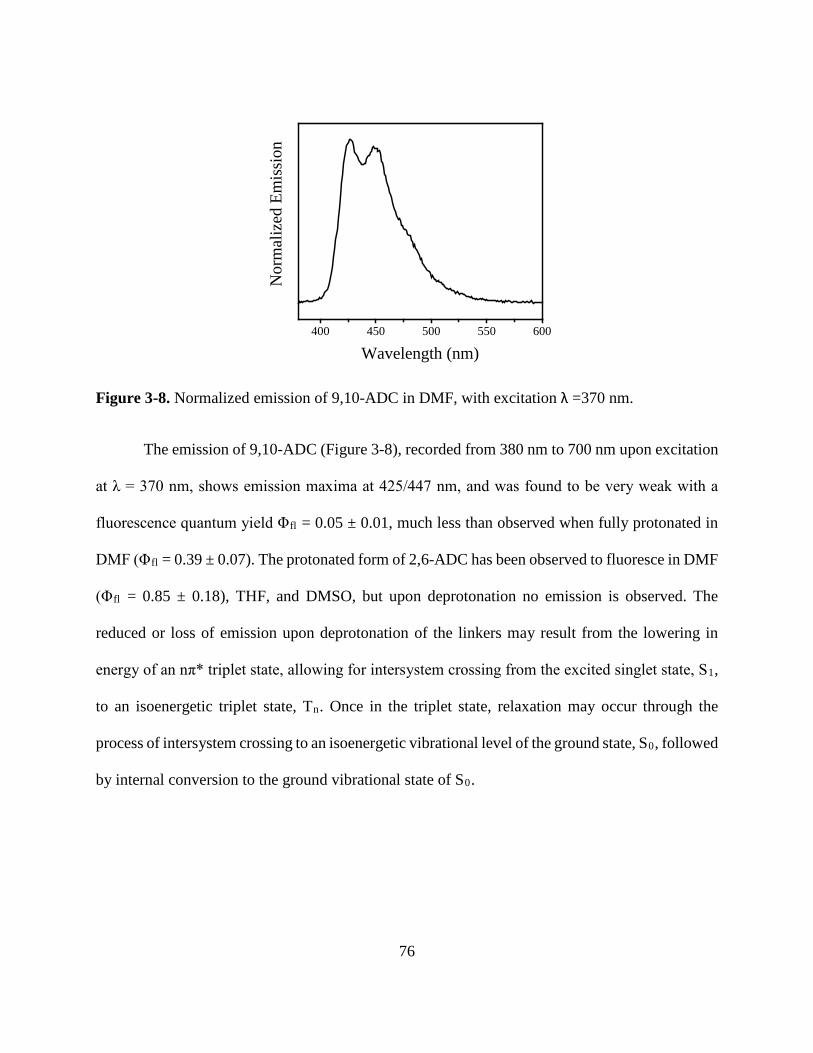
400 450 500 550 600
Nor
mal
ized
Em
issi
on
Wavelength (nm)
Figure 3-8. Normalized emission of 9,10-ADC in DMF, with excitation λ =370 nm.
The emission of 9,10-ADC (Figure 3-8), recorded from 380 nm to 700 nm upon excitation
at λ = 370 nm, shows emission maxima at 425/447 nm, and was found to be very weak with a
fluorescence quantum yield Φfl = 0.05 ± 0.01, much less than observed when fully protonated in
DMF (Φfl = 0.39 ± 0.07). The protonated form of 2,6-ADC has been observed to fluoresce in DMF
(Φfl = 0.85 ± 0.18), THF, and DMSO, but upon deprotonation no emission is observed. The
reduced or loss of emission upon deprotonation of the linkers may result from the lowering in
energy of an nπ* triplet state, allowing for intersystem crossing from the excited singlet state, S1,
to an isoenergetic triplet state, Tn. Once in the triplet state, relaxation may occur through the
process of intersystem crossing to an isoenergetic vibrational level of the ground state, S0, followed
by internal conversion to the ground vibrational state of S0.
76
400 450 500 550 600 650
Nor
mal
ized
Em
issi
on
Wavelength (nm)a 300 400 500 600 700
Nor
mal
ized
Inte
nsity
Wavelength (nm)b
Figure 3-9. (a) Normalized emission of 9,10-ADC in basic DMF (solid line) and PCN-13 (dashed
line), and (b) Normalized absorbance (solid line) and emission (dashed line), excitation at λ = 374
nm, of PCN-13.
Figure 3-9a shows the emission of PCN-13 overlayed with the emission of 9,10-ADC in
DMF. Upon incorporation into the MOF, vibration structure of 9,10-ADC emission is lost and a
red shift is observed. The red shift in the emission of PCN-13 relative to 9,10-ADC in solution can
be attributed to inductive effects between anthracene units and the Zn metals. The broadening of
the emission is likely homogeneous and due to an increased number of available vibrational
sublevels as a result of coordination to Zn. Figure 3-9b shows the emission and excitation spectra
of PCN-13. The energy of the 0,0 transition was determined using Planck’s relation, E(eV)= 1240λ(nm)
, where λ is the wavelength at which the absorbance and emission spectra intersect. The E0,0 for
PCN-13 was found to be 2.88 eV, which is lower than the E0,0 observed for 9,10-ADC in DMF,
3.04 eV. A Stokes shift of 4170 cm-1 was observed for PCN-13, which was a good degree larger
than the Stokes shift observed for 9,10-ADC in DMF (980 cm-1). The larger Stokes shift suggests
that there is a greater degree of reorganization of the nuclear coordinates between the ground and
excited state of PCN-13 than the linker in solution. The change in nuclear configuration in the
77
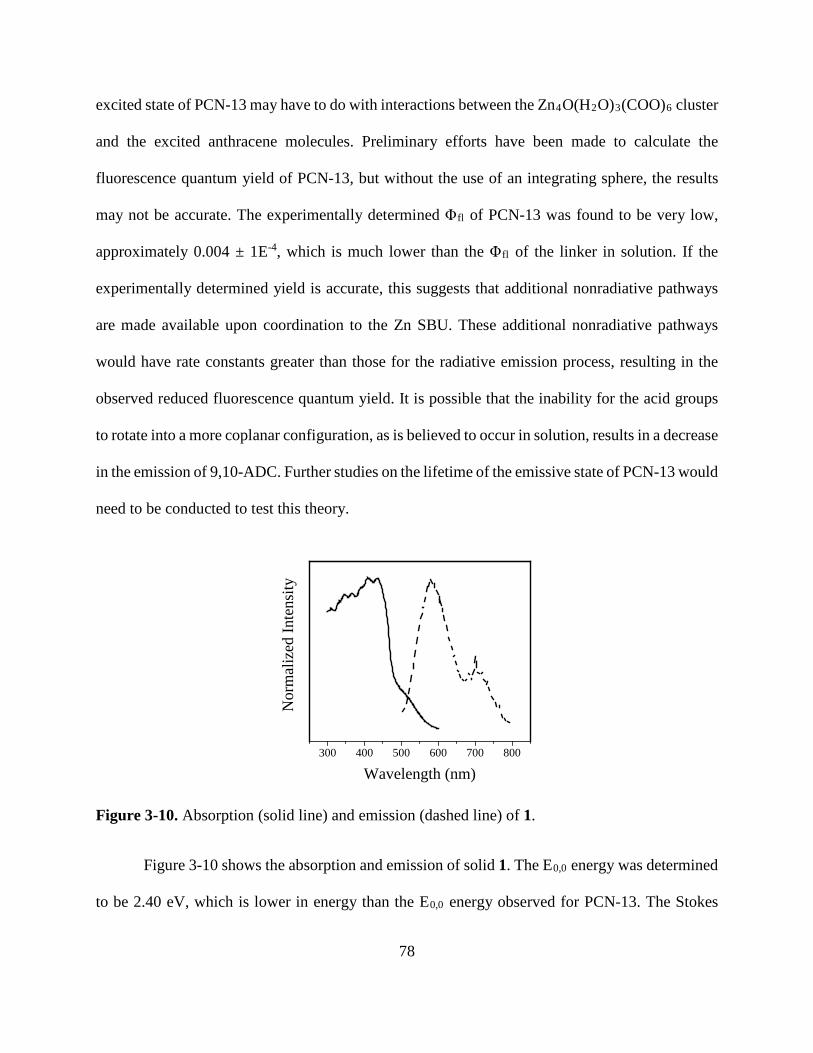
excited state of PCN-13 may have to do with interactions between the Zn4O(H2O)3(COO)6 cluster
and the excited anthracene molecules. Preliminary efforts have been made to calculate the
fluorescence quantum yield of PCN-13, but without the use of an integrating sphere, the results
may not be accurate. The experimentally determined Φfl of PCN-13 was found to be very low,
approximately 0.004 ± 1E-4, which is much lower than the Φfl of the linker in solution. If the
experimentally determined yield is accurate, this suggests that additional nonradiative pathways
are made available upon coordination to the Zn SBU. These additional nonradiative pathways
would have rate constants greater than those for the radiative emission process, resulting in the
observed reduced fluorescence quantum yield. It is possible that the inability for the acid groups
to rotate into a more coplanar configuration, as is believed to occur in solution, results in a decrease
in the emission of 9,10-ADC. Further studies on the lifetime of the emissive state of PCN-13 would
need to be conducted to test this theory.
300 400 500 600 700 800
Nor
mal
ized
Inte
nsity
Wavelength (nm)
Figure 3-10. Absorption (solid line) and emission (dashed line) of 1.
Figure 3-10 shows the absorption and emission of solid 1. The E0,0 energy was determined
to be 2.40 eV, which is lower in energy than the E0,0 energy observed for PCN-13. The Stokes
78
shift was found to be 5820 cm-1. One possible cause for the emission of 2,6-ADC in the MOF but
not in solution could be due to increased rigidity of the organic linker in the MOF relative to
solution, as well as inductive effects due to coordination to the Zn atoms. The MOF has a very
compact structure and as a result of coordinated water molecules, hydrogen bonding is also present
throughout the complex. The close packing and hydrogen bonding likely leads to increased rigidity
of the ligand in the MOF relative to solution. The increased rigidity reduces the number of
available radiationless pathways, allowing for the competing process of emission to occur.
3.4 Conclusion This work has shown that the location of carboxylic acid groups on anthracene perturbs the
electronic transition, with dipole moments across the longitudinal and short axes of anthracene, to
different extents. Positioning of the carboxylic acid group at the 9,10 positions has little influence
on the absorption spectrum of anthracene other than a red shift due to inductive effects. Whereas
the a slightly more perturbed spectrum, red shifted with different vibrational structure relative to
anthracene, is obtained by COOH placement at the 2,6 position due both inductive and resonance
effects. The functionalization of the 1,4 position on anthracene results in the most perturbation to
the electronic transitions occurring in anthracene. Both high and low energy transitions of
anthracene are red-shifted to a greater extent in 1,4-ADCA than either of the other two acids
studied.
Carboxylic acid functionalization at the 9,10 position of anthracene had little effect on the
absorption spectrum of anthracene, but the emission spectrum was greatly red shifted and void of
anthracenic vibrational structure. The absorbed increase in Stokes shift and absence of vibrational
structure is believed to be due to the rotation of carboxylic acid groups to a more coplanar
configuration. The rotation in the excited state likely increases the overlap between the π-systems
79

of the anthracene rings and the carboxylic acid group, which perturbs the anthracenic π→π*
transitions and may result in charge transfer character in the excited state. Further studied in frozen
solutions will need to be performed to provide further evidence for the rotation of the carboxylic
acid groups in the excited state.
The addition of carboxylic acids onto anthracene resulted in an increase in fluorescence
quantum yields and fluorescence lifetimes. Anthracene exhibits a Φfl of 0.27 in ethanol, whereas
the dicarboxylic acids of anthracene all displayed Φfl ranging between 0.73 and 0.40 in DMSO
and THF. Both the fluorescence quantum yields and lifetimes exhibit minor dependencies on
solvent dielectric constant. These yields and lifetimes to not exhibit any trends with changes in
other solvent parameters, but a wider range of solvents with varying in solvent parameter
magnitudes are needed to fully determine if any solvochromism exhists.
A new microporous MOF (1) has been synthesized from Zn(NO3)2 and 2,6-
anthracenedicarboxlic acid. The MOFs 1 and previously reported10 PCN-13 have been
characterized using PXRD and TGA, and the steady state luminescent properties have been studied
and compared to the luminescent properties of 9,10- and 2,6-ADC in basic DMF. It has been
determined that the absorption and emissive properties of the linkers are affected by coordination
to metal centers and proximity to other ligands within the MOF. Metal coordination and
aggregation effects result in a shift in the absorption and emission wavelengths and broadening of
the spectra. In the case of 1, incorporation of a non-fluorescent ligand, 2,6-ADC, results in a MOF
with fluorescent properties. Increased rigidity of the ligand within the MOF reduces the available
radiationless processes, allowing for the competing process of fluorescence to become a more
dominant pathway. In the case of PCN-13, the effects of incorporating the ligand into the MOF
does not have the same effects as are observed with 1. PCN-13 is nearly non-emissive, unlike the
80
free based ligand, 9,10-ADC. It is possible that coordination of the ligand to the Zn SBU prohibits
rotation of the acid groups to a more coplanar configuration with the ring system, thereby resulting
in less intense fluorescence. This works shows that incorporation of a fluorescent ligand into a
MOF may enhance the emission by reducing nonradiative processes, through rigidification of the
ligand, or may actually provide additional radiationless pathways to compete with fluorescence.
3.5 References
1. Dou, Z.; Yu, J.; Cui, Y.; Yang, Y.; Wang, Z.; Yang, D.; Qian, G., Luminescent Metal–Organic Framework Films As Highly Sensitive and Fast-Response Oxygen Sensors. Journal of the American Chemical Society 2014, 136 (15), 5527-5530. 2. Wang, G.-Y.; Song, C.; Kong, D.-M.; Ruan, W.-J.; Chang, Z.; Li, Y., Two luminescent metal-organic frameworks for the sensing of nitroaromatic explosives and DNA strands. Journal of Materials Chemistry A 2014, 2 (7), 2213-2220. 3. Zhang, C.-F.; Qiu, L.-G.; Ke, F.; Zhu, Y.-J.; Yuan, Y.-P.; Xu, G.-S.; Jiang, X., A novel magnetic recyclable photocatalyst based on a core-shell metal-organic framework Fe3O4@MIL-100(Fe) for the decolorization of methylene blue dye. Journal of Materials Chemistry A 2013, 1 (45), 14329-14334. 4. Zhou, X.-H.; Li, L.; Li, H.-H.; Li, A.; Yang, T.; Huang, W., A flexible Eu(iii)-based metal-organic framework: turn-off luminescent sensor for the detection of Fe(iii) and picric acid. Dalton Transactions 2013, 42 (34), 12403-12409. 5. Pramanik, M.; Patra, A. K.; Bhaumik, A., Self-assembled titanium phosphonate nanomaterial having a mesoscopic void space and its optoelectronic application. Dalton Trans. 2013, 42 (14), 5140-5149. 6. Silva, C. G.; Corma, A.; Garcia, H., Metal-organic frameworks as semiconductors. Journal of Materials Chemistry 2010, 20 (16), 3141-3156. 7. Bo, Q.-B.; Zhang, H.-T.; Wang, H.-Y.; Miao, J.-L.; Zhang, Z.-W., Anhydrous Lanthanide MOFs and Direct Photoluminescent Sensing for Polyoxometalates in Aqueous Solution. Chemistry – A European Journal 2014, 20 (13), 3712-3723. 8. Yuan, S.; Deng, Y.-K.; Sun, D., Unprecedented Second-Timescale Blue/Green Emissions and Iodine-Uptake-Induced Single-Crystal-to-Single-Crystal Transformation in ZnII/CdII Metal–Organic Frameworks. Chemistry – A European Journal 2014, 20 (32), 10093-10098. 9. Kent, C. A.; Liu, D.; Ma, L.; Papanikolas, J. M.; Meyer, T. J.; Lin, W., Light Harvesting in Microscale Metal–Organic Frameworks by Energy Migration and Interfacial Electron Transfer Quenching. Journal of the American Chemical Society 2011, 133 (33), 12940-12943. 10. Shengqian Ma, X.-S. W., Christopher D. Collier, Erika S. Manis, and Hong-Cai Zhou*, Ultramicroporous Metal-Organic Framework Based on 9,10-Anthracenedicarboxylate for Selective Gas Adsorption. Inorganic Chemistry 2007, 46 (21), 8499-8501. 11. Technologies, A. CrysAlisPro Software system, v1.171.36.28, Agilent Technologies UK Ltd: Oxford, UK, 2013. 12. Sheldrick, G. M., A short history of SHELX. Acta Cryst. 2008, A64, 112-122.
81
13. Dolomanov, O. V. B., L. J.; Gildea, R. J.; Howard, J. A. K.; Puschmann, H. , J. Appl. Cryst. 2009, 42, 339-341. 14. Bauer, C. A.; Jones, S. C.; Kinnibrugh, T. L.; Tongwa, P.; Farrell, R. A.; Vakil, A.; Timofeeva, T. V.; Khrustalev, V. N.; Allendorf, M. D., Homo- and heterometallic luminescent 2-D stilbene metal-organic frameworks. Dalton Transactions 2014, 43 (7), 2925-2935. 15. Ma, S.; Wang, X.-S.; Collier, C. D.; Manis, E. S.; Zhou, H.-C., Ultramicroporous Metal−Organic Framework Based on 9,10-Anthracenedicarboxylate for Selective Gas Adsorption. Inorganic Chemistry 2007, 46 (21), 8499-8501. 16. Liu, F.; Zhang, L.; Wang, R.; Sun, J.; Yang, J.; Chen, Z.; Wang, X.; Sun, D., Five MOFs with different topologies based on anthracene functionalized tetracarboxylic acid: syntheses, structures, and properties. CrystEngComm 2014, 16 (14), 2917-2928.
82

Future Work
Photophysics of Anthracenedicarboxylic acids.
Further studies of the three acids in solvents with differing polarity will need to be
performed to provide evidence for or against any solvochromatic trends. Solvochromism would
be apparent in solvents of differing polarity if there exists an excited charge transfer between the
π-systems of the carboxylic acid groups and anthracene. A study in solvents that vary in
hydrogen bond donor, or acceptor strength could be performed to determine the effects of
intermolecular forces on the rates of radiative and nonradiative decay.
To test the hypothesis that 9,10-ADCA undergoes conformational changes in the excited
state, the absorbance and fluoresce should be taken in a glass matrix. A Possible solvent mixture
to use for this experiment is EPA (ethanol, isopentane, and diethyl ether), which will form a
glass at 5 K or less. Assuming that the ground state conformation is when the acid groups are at a
dihedral angle of 60 ° to the anthracene plane, the excited state should remain in this 60 °
conformation when frozen. The emission of the frozen molecule should show similar vibrational
structure to the emission of anthracene, if the acid groups of 9,10-ADCA are frozen in such a
position (60 °) that overlap of the π-systems is not possible.
Photophysics of the Anthracenic MOFs.
The current data on PCN-13 suggests that incorporation of 9,10-ADC into the Zn based
MOF results in an increase in the rate of nonradiative decay. The fluorescence quantum yield,
obtained without the use of an integrating sphere, is much lower than the basic or acidic linker in
solution, suggesting that incorporation into the MOF is “turning off” the fluorescence of the
83
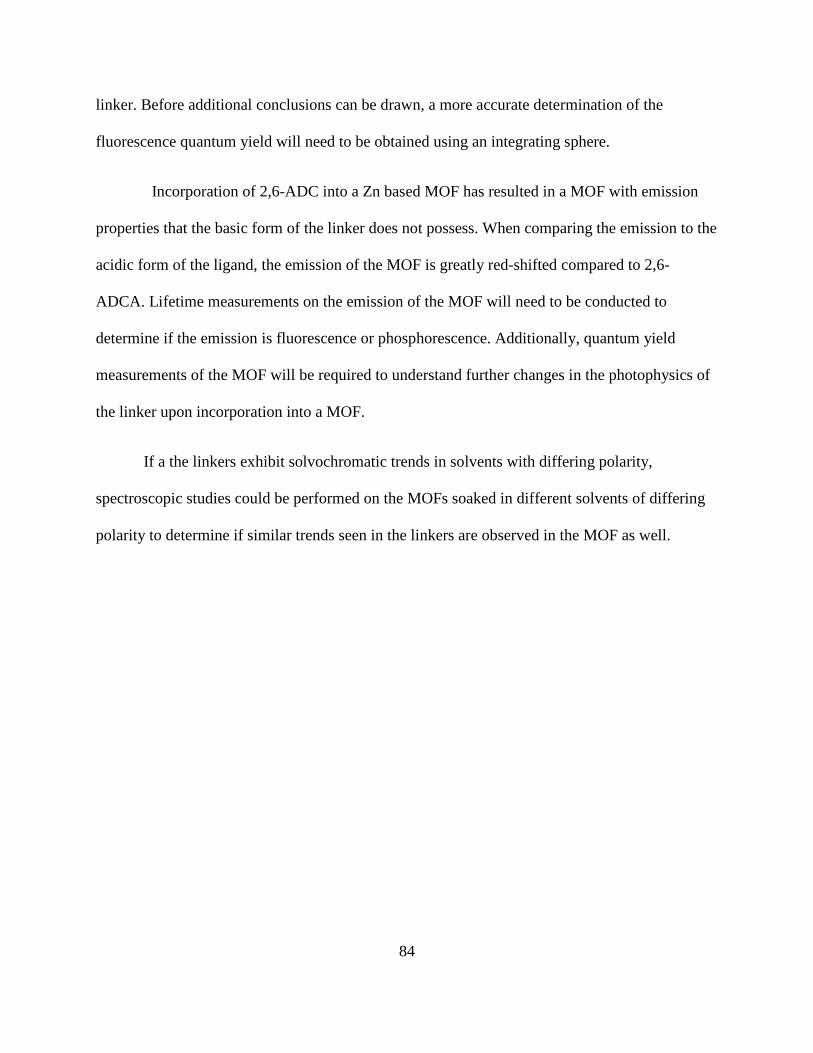
linker. Before additional conclusions can be drawn, a more accurate determination of the
fluorescence quantum yield will need to be obtained using an integrating sphere.
Incorporation of 2,6-ADC into a Zn based MOF has resulted in a MOF with emission
properties that the basic form of the linker does not possess. When comparing the emission to the
acidic form of the ligand, the emission of the MOF is greatly red-shifted compared to 2,6-
ADCA. Lifetime measurements on the emission of the MOF will need to be conducted to
determine if the emission is fluorescence or phosphorescence. Additionally, quantum yield
measurements of the MOF will be required to understand further changes in the photophysics of
the linker upon incorporation into a MOF.
If a the linkers exhibit solvochromatic trends in solvents with differing polarity,
spectroscopic studies could be performed on the MOFs soaked in different solvents of differing
polarity to determine if similar trends seen in the linkers are observed in the MOF as well.
84
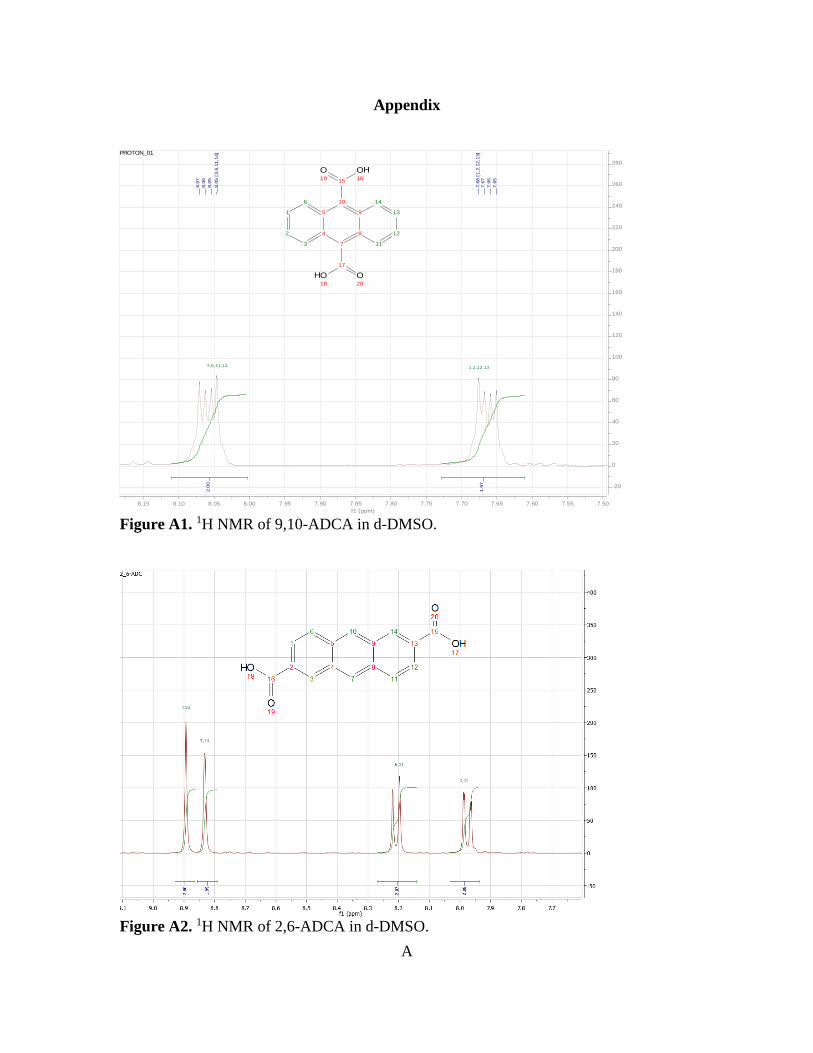
Appendix
7.507.557.607.657.707.757.807.857.907.958.008.058.108.15f1 (ppm)
-20
0
20
40
60
80
100
120
140
160
180
200
220
240
260
280PROTON_01
1.97
2.00
7.65
7.66
7.67
7.68
[1,
2,12
,13]
8.05
[3,
6,11
,14]
8.05
8.06
8.07
3,6,11,14 1,2,12,13
1
2
3
4
5
6
7
8
9
10
11
12
13
14
15
OH16
17
OH18
O19
O20
Figure A1. 1H NMR of 9,10-ADCA in d-DMSO.
Figure A2. 1H NMR of 2,6-ADCA in d-DMSO.
A
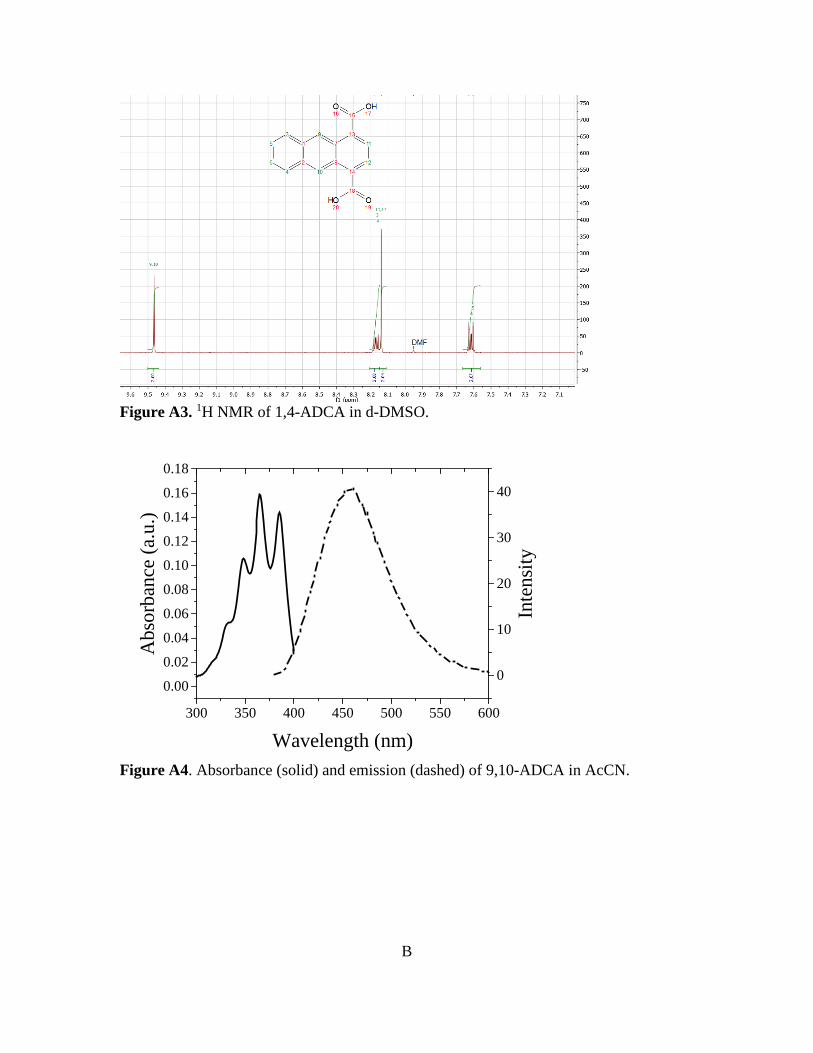
Figure A3. 1H NMR of 1,4-ADCA in d-DMSO.
300 350 400 450 500 550 600
0.00
0.02
0.04
0.06
0.08
0.10
0.12
0.14
0.16
0.18
Wavelength (nm)
Abs
orba
nce
(a.u
.)
0
10
20
30
40
Inte
nsity
Figure A4. Absorbance (solid) and emission (dashed) of 9,10-ADCA in AcCN.
B

300 350 400 450 500 550 600-0.05
0.00
0.05
0.10
0.15
0.20
Wavelength (nm)
Abs
orba
nce
(a.u
.)
0
20
40
60
80
100
Inte
nsity
Figure A5. Absorbance (solid) and emission (dashed) of 9,10-ADCA in DMF.
300 350 400 450 500 550 600
0.00
0.02
0.04
0.06
0.08
0.10
0.12
0.14
0.16
0.18
Wavelength (nm)
Abs
orba
nce
(a.u
.)
-10
0
10
20
30
40
50
60
70
80In
tens
ity
Figure A6. Absorbance (solid) and emission (dashed) of 9,10-ADCA in DMSO.
C

300 350 400 450 500 550 600-0.05
0.00
0.05
0.10
0.15
0.20
Wavelength (nm)
Abs
orba
nce
(a.u
.)
0
2
4
6
8
10
12
14
Inte
nsity
Figure A7. Absorbance (solid) and emission (dashed) of 9,10-ADCA in MeOH.
350 400 450 500 550-0.020.000.020.040.060.080.100.120.140.160.18
Wavelength (nm)
Abs
orba
nce
(a.u
.)
0
100
200
300
400
500
Inte
nsity
Figure A8. Absorbance (solid) and emission (dashed) of 2,6-ADCA in DMF.
D
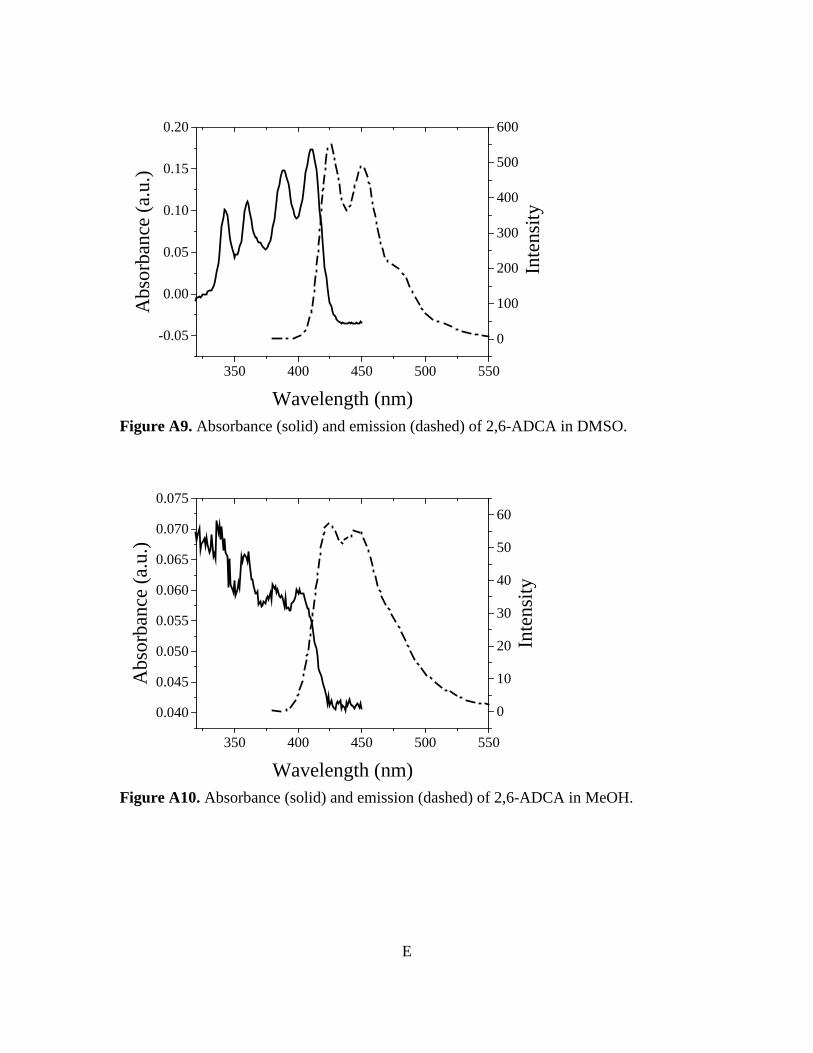
350 400 450 500 550
-0.05
0.00
0.05
0.10
0.15
0.20
Wavelength (nm)
Abs
orba
nce
(a.u
.)
0
100
200
300
400
500
600
Inte
nsity
Figure A9. Absorbance (solid) and emission (dashed) of 2,6-ADCA in DMSO.
350 400 450 500 550
0.040
0.045
0.050
0.055
0.060
0.065
0.070
0.075
Wavelength (nm)
Abs
orba
nce
(a.u
.)
0
10
20
30
40
50
60In
tens
ity
Figure A10. Absorbance (solid) and emission (dashed) of 2,6-ADCA in MeOH.
E
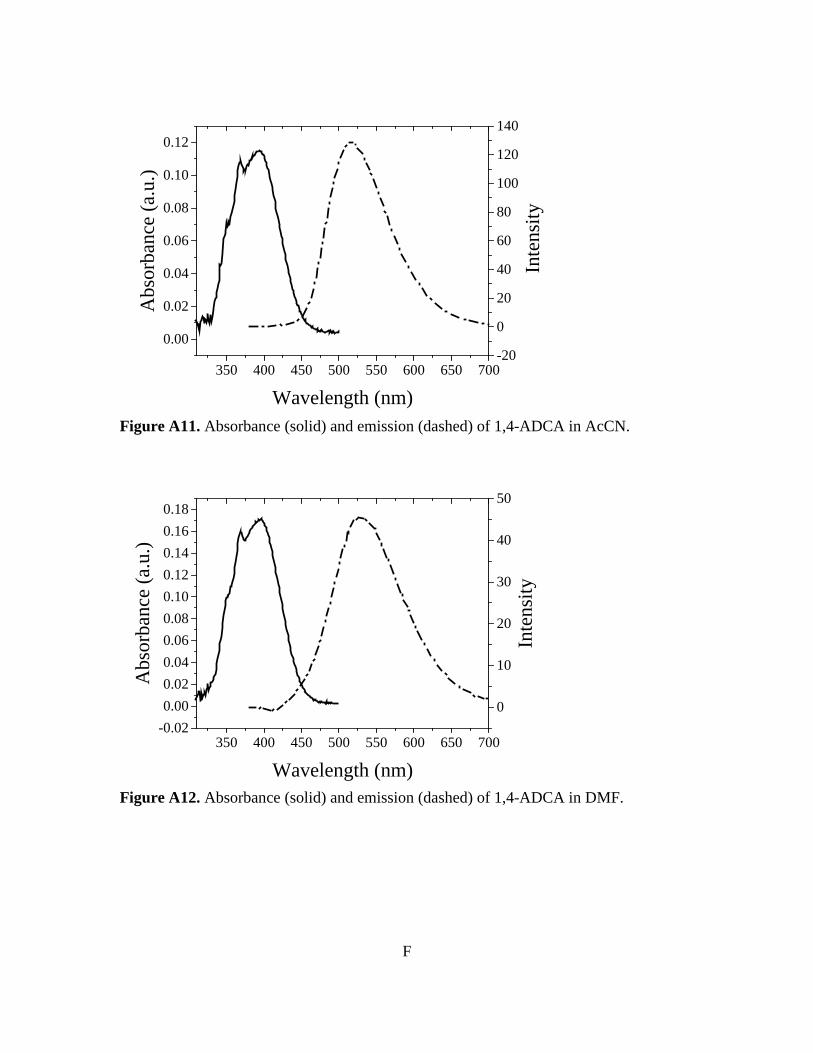
350 400 450 500 550 600 650 700
0.00
0.02
0.04
0.06
0.08
0.10
0.12
Wavelength (nm)
Abs
orba
nce
(a.u
.)
-20
0
20
40
60
80
100
120
140
Inte
nsity
Figure A11. Absorbance (solid) and emission (dashed) of 1,4-ADCA in AcCN.
350 400 450 500 550 600 650 700-0.020.000.020.040.060.080.100.120.140.160.18
Wavelength (nm)
Abs
orba
nce
(a.u
.)
0
10
20
30
40
50
Inte
nsity
Figure A12. Absorbance (solid) and emission (dashed) of 1,4-ADCA in DMF.
F
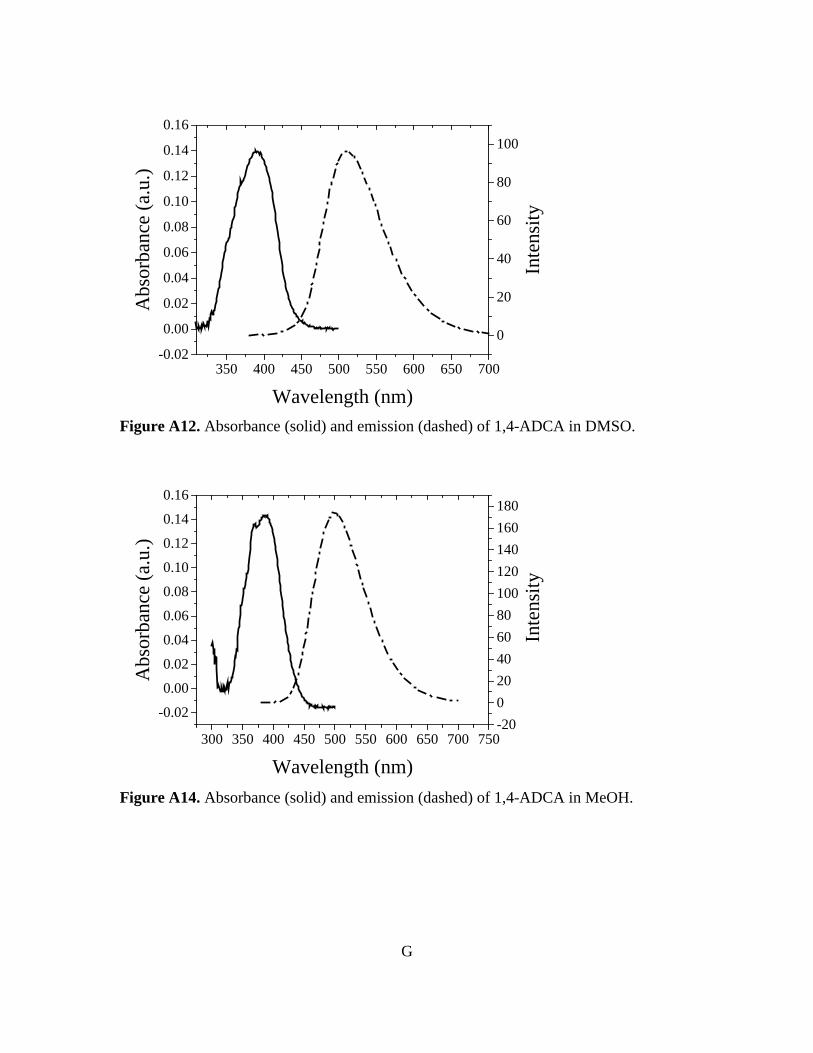
350 400 450 500 550 600 650 700-0.02
0.00
0.02
0.04
0.06
0.08
0.10
0.12
0.14
0.16
Wavelength (nm)
Abs
orba
nce
(a.u
.)
0
20
40
60
80
100
Inte
nsity
Figure A12. Absorbance (solid) and emission (dashed) of 1,4-ADCA in DMSO.
300 350 400 450 500 550 600 650 700 750
-0.02
0.00
0.02
0.04
0.06
0.08
0.10
0.12
0.14
0.16
Wavelength (nm)
Abs
orba
nce
(a.u
.)
-20020406080100120140160180
Inte
nsity
Figure A14. Absorbance (solid) and emission (dashed) of 1,4-ADCA in MeOH.
G
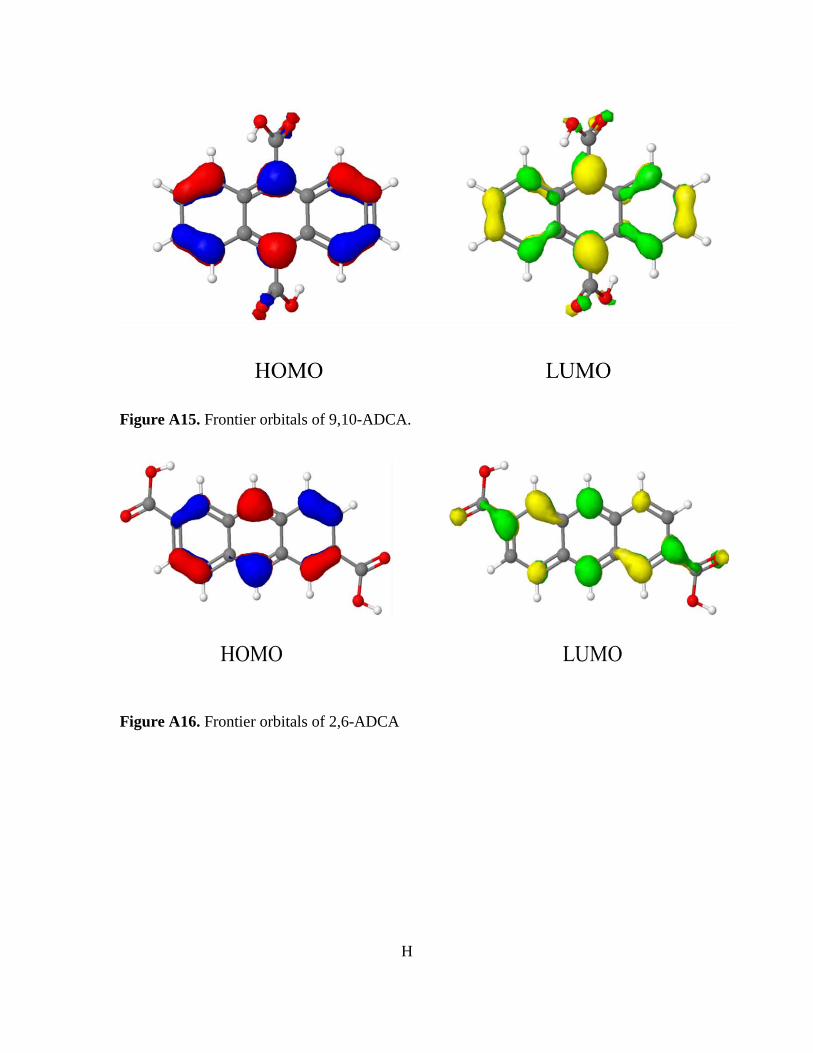
Figure A15. Frontier orbitals of 9,10-ADCA.
Figure A16. Frontier orbitals of 2,6-ADCA
H
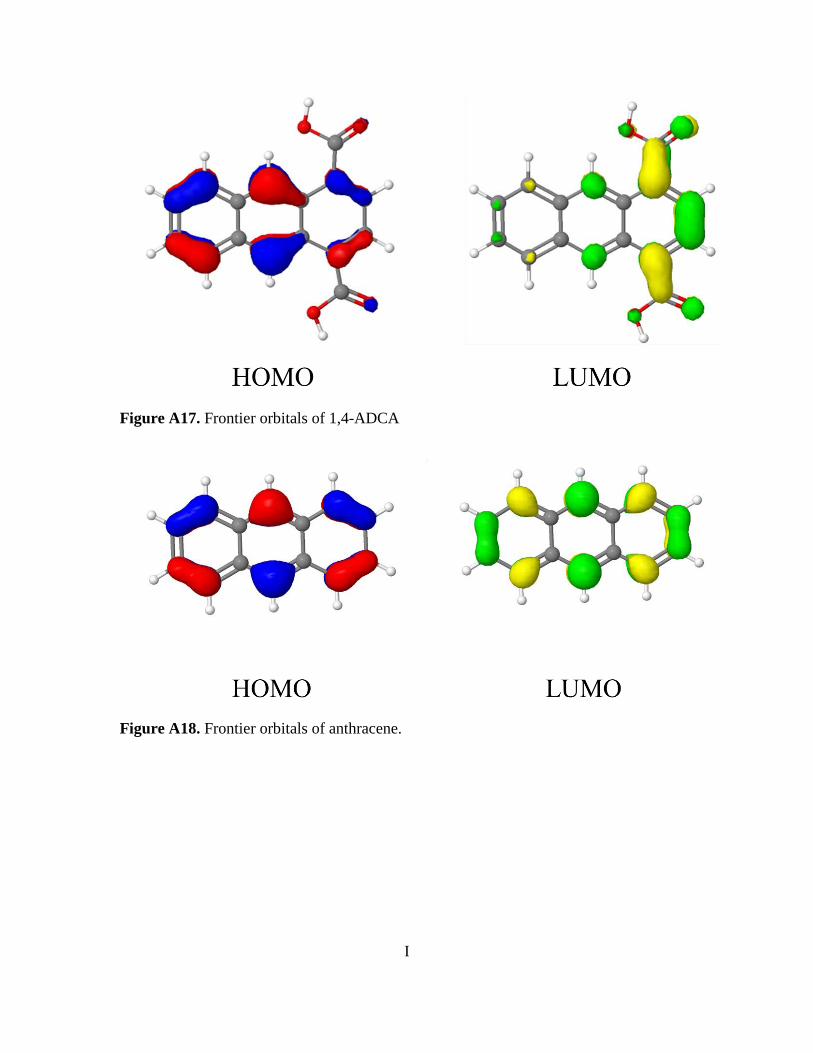
Figure A17. Frontier orbitals of 1,4-ADCA
Figure A18. Frontier orbitals of anthracene.
I

250 300 350 400 450
0.0
0.2
0.4
0.6
0.8
1.0
300 350 400Nor
mal
ized
Abs
orba
nce
Wavelength (nm) Figure A19. Normalized absorbance of 9,10-ADCA(black) and anthracene(red) in THF.
250 300 350 400 450
0.0
0.2
0.4
0.6
0.8
1.0
300 350 400Nor
mal
ized
Abs
orba
nce
Wavelength (nm) Figure A20. Normalized absorbance of 2,6-ADCA(black) and anthracene(red) in THF.
J

250 300 350 400 450 500
0.0
0.2
0.4
0.6
0.8
1.0
300 350 400 450
Nor
mal
ized
Abs
orba
nce
Wavelength (nm) Figure A21. Normalized absorbance of 1,4-ADCA(black) and anthracene(red) in THF.
Figure A22. Highest energy conformation of 9,10-ADCA showing the distortion of the anthracene ring when the carboxylic acid groups are coplanar (0°) to the ring system.
K

Table A1. Polarity/polarizability solvent parameter (π) vs. kr for 9,10-, 2,6-, and 1,4-
ADCA.
π* kr
9,10-ADCA 2,6-ADCA 1,4-ADCA
DMSO 1 6.89 ± 0.77 3.85 ± 1.12 1.75 ± 0.44
DMF 0.88 3.24 ± 0.58 4.94 ± 1.05 0.46 ± 0.09
AcCN 0.75 3.95 ± 1.45 1.56 ± 0.21
MeOH 0.6 2.24 ± 0.59 1.16 ± 0.42 1.57 ± 0.30
THF 0.58 6.4 ± 0.69 3.88 ± 1.09 2.88 ± 0.43
Table A2. Index of hydrogen bond acceptor character (β) vs. kr for 9,10-, 2,6-, and 1,4-
ADCA.
β kr
9,10-ADCA 2,6-ADCA 1,4-ADCA
DMSO 0.76 6.89 ± 0.77 3.85 ± 1.12 1.75 ± 0.44
DMF 0.69 3.24 ± 0.58 4.94 ± 1.05 0.46 ± 0.09
MeOH 0.62 2.24 ± 0.59 1.16 ± 0.42 1.57 ± 0.30
THF 0.55 6.4 ± 0.69 3.88 ± 1.09 2.88 ± 0.43
AcCN 0.31 3.95 ± 1.45 1.56 ± 0.21
L

Table A3. Index of hydrogen bond donor character (α) vs. kr for 9,10-, 2,6-, and 1,4-
ADCA.
α kr
9,10-ADCA 2,6-ADCA 1,4-ADCA
MeOH 0.93 2.24 ± 0.59 1.16 ± 0.42 1.57 ± 0.30
AcCN 0.19 3.95 ± 1.45 1.56 ± 0.21
DMSO 0 6.89 ± 0.77 3.85 ± 1.12 1.75 ± 0.44
DMF 0 3.24 ± 0.58 4.94 ± 1.05 0.46 ± 0.09
THF 0 6.4 ± 0.69 3.88 ± 1.09 2.88 ± 0.43
Table A4. Refractive index (η) vs. kr for 9,10-, 2,6-, and 1,4-ADCA.
n kr
9,10 2,6 1,4
DMSO 1.479 6.89 ± 0.77 3.85 ± 1.12 1.75 ± 0.44
DMF 1.43 3.24 ± 0.58 4.94 ± 1.05 0.46 ± 0.09
THF 1.407 6.4 ± 0.69 3.88 ± 1.09 2.88 ± 0.43
AcCN 1.344 3.95 ± 1.45 1.56 ± 0.21
MeOH 1.329 2.24 ± 0.59 1.16 ± 0.42 1.57 ± 0.30
M


![Photochemical Hydrogen Production with Metal–Organic ... › content › pdf › 10.1007 › s11244-016-0690-z.pdfproduction of hydrogen [3–5]. Metal–Organic Frameworks (MOFs)](https://static.fdocuments.in/doc/165x107/5ed93d406714ca7f476965bc/photochemical-hydrogen-production-with-metalaorganic-a-content-a-pdf-a.jpg)


![Metal–Organic Framework-Functionalized Alumina Membranes ... · Metal–organic frameworks (MOFs) are an emerging group of hybrid nano-porous materials [1,2]. Formed by assembling](https://static.fdocuments.in/doc/165x107/5fc16e685df9db35603021e7/metalaorganic-framework-functionalized-alumina-membranes-metalaorganic-frameworks.jpg)