Photonic Crystal Fiber for E Raman Scattering of CdTe...
8
MAK ET AL. VOL. 5 ’ NO. 5 ’ 3823–3830 ’ 2011 www.acsnano.org 3823 April 25, 2011 C 2011 American Chemical Society Photonic Crystal Fiber for Efficient Raman Scattering of CdTe Quantum Dots in Aqueous Solution Jacky S. W. Mak, Abdiaziz A. Farah, Feifan Chen, and Amr S. Helmy * The Edward S. Rogers Sr. Department of Electrical and Computer Engineering, University of Toronto, 10 King's College Road, Toronto, Ontario, M5S 3G4 Canada. C olloidal quantum dots (QDs) are sus- pensions of semiconductor nanopar- ticles that offer both the intriguing optical properties of quantum-confined par- ticles, and the practical advantages of solu- tion-based processing. 1 3 In the past two decades, aqueous synthesis of colloidal QDs has gained much popularity and evolved tremedously. 4 8 This simple and cost-effective technique allows very small (2 6 nm), monodisperse, and highly water- soluble QDs to be synthesized in gram quan- tities. QD capping plays a pivotal role in the properties and utility of the material; the use of short-chain thiols, such as thioglycolic acid (TGA), as capping agents has been shown to greatly improve the photoluminescent (PL) quantum efficiency of as-synthesized QDs to values of 40 60%. 4 3-Mercaptopropionic acid (MPA) has also shown to offer a larger range of size and PL tunability and a longer emission decay time. 4 Other thiols, such as 1 thioglycerol (TG), are found to be more suitable for synthesizing stable core shell QDs. 7 The unique properties of the di fferent colloidal QDs have potentials for a wide field of novel applications ranging from photovoltaics 9 and optoelectronics, 10 to biosensing, 11 bioimaging, 12 and even cancer treatments. 13 One of the most important technological challenges in QD advancement is the devel- opment of a cost-effective, reliable, and sensitive optical monitoring system to con- trol the physical, chemical, and size-depen- dent properties of QDs before, during, and after their fabrication on a nanometer scale. To measure and compare these properties between the different QDs, many analytical techniques have been employed including but not limited to PL, electrolumines- cence (EL), ultraviolet visible spectroscopy (UV vis), transmission electron microscope (TEM) or high resolution transmission elec- tron microscope (HRTEM), capillary zone electrophoresis (CZE), X-ray diffraction (XRD), and X-ray photoelectron spectrosco- py (XPS). These techniques provide valuable information on the composition and prop- erties of the QDs; yet, none of them de- scribes how the capping agents interact with the core of the QDs. Their impact on the overall molecular structure, molecular complex, and different QD properties also remains unclear. Consequently, this limits our capability to improve the quantum efficiency, stability, and bioconjugating abil- ity further from what has been achieved today. Complex QD designs for increasing performance and functionalities in different applications remain very challenging. Fourier-transform infrared spectroscopy (FT-IR) can be an alternative for determining the molecular interactions between the QDs and their capping agents. However, the strong and broad absorption bands of water often overlap with those from the QDs and stabilizing agents. This limits the number of vibrational modes that can be resolved. A complementary technique to FT-IR is Raman spectroscopy, which is a rapid and nondestructive means of probing mo- lecular vibrations optically through inelastic * Address correspondence to [email protected]. Received for review January 14, 2011 and accepted April 25, 2011. Published online 10.1021/nn200157z ABSTRACT A novel hollow-core photonic crystal fiber platform was used for the first time to observe clear vibrational modes of the CdTe core, CdS 0.7 Te 0.3 interface, and carboxylate-metal complexes in dilute aqueous CdTe quantum dot (QD) solutions. These modes demonstrate the presence of crystalline cores, defects, and surface passivation responsible for photoluminescent efficiency and stability. In addition, 3-mercaptopropionic acid (MPA)-capped QDs show higher crystallinity and stability than those capped with thioglycolic acid (TGA) and 1 thioglycerol (TG). This detailed, nondestructive characterization was carried out using Raman spectroscopy for solutions with QD concentration of 2 mg/mL, which is similar to their concentration during synthesis process. This platform can be extended to the in situ studies of any colloidal nanoparticles and aqueous solutions of relevant biological samples using Raman spectroscopy. KEYWORDS: photonic crystal fiber . thiol-capped quantum dots . Raman spectroscopy . thioglycolic acid . 3-mercaptopropionic acid . 1 thioglycerol ARTICLE
Transcript of Photonic Crystal Fiber for E Raman Scattering of CdTe...
MAK ET AL. VOL. 5 ’ NO. 5 ’ 3823–3830 ’ 2011
www.acsnano.org
3823
April 25, 2011
C 2011 American Chemical Society
Photonic Crystal Fiber for EfficientRaman Scattering of CdTe QuantumDots in Aqueous SolutionJacky S. W. Mak, Abdiaziz A. Farah, Feifan Chen, and Amr S. Helmy*
The Edward S. Rogers Sr. Department of Electrical and Computer Engineering, University of Toronto, 10 King's College Road, Toronto, Ontario, M5S 3G4 Canada.
Colloidal quantum dots (QDs) are sus-pensions of semiconductor nanopar-ticles that offer both the intriguing
optical properties of quantum-confined par-ticles, and the practical advantages of solu-tion-based processing.1�3 In the past twodecades, aqueous synthesis of colloidalQDs has gained much popularity andevolved tremedously.4�8 This simple andcost-effective technique allows very small(2�6 nm), monodisperse, and highly water-soluble QDs to be synthesized in gramquan-tities. QD capping plays a pivotal role in theproperties and utility of the material; the useof short-chain thiols, such as thioglycolic acid(TGA), as capping agents has been shown togreatly improve the photoluminescent (PL)quantum efficiency of as-synthesized QDs tovalues of 40�60%.4 3-Mercaptopropionicacid (MPA) has also shown to offer a largerrange of size and PL tunability and a longeremission decay time.4 Other thiols, such as1�thioglycerol (TG), are found to be moresuitable for synthesizing stable core�shellQDs.7 The unique properties of the differentcolloidal QDs have potentials for a widefield of novel applications ranging fromphotovoltaics9 and optoelectronics,10 tobiosensing,11 bioimaging,12 and even cancertreatments.13
One of the most important technologicalchallenges in QD advancement is the devel-opment of a cost-effective, reliable, andsensitive optical monitoring system to con-trol the physical, chemical, and size-depen-dent properties of QDs before, during, andafter their fabrication on a nanometer scale.To measure and compare these propertiesbetween the different QDs, many analyticaltechniques have been employed includingbut not limited to PL, electrolumines-cence (EL), ultraviolet�visible spectroscopy(UV�vis), transmission electron microscope(TEM) or high resolution transmission elec-tron microscope (HRTEM), capillary zone
electrophoresis (CZE), X-ray diffraction(XRD), and X-ray photoelectron spectrosco-py (XPS). These techniques provide valuableinformation on the composition and prop-erties of the QDs; yet, none of them de-scribes how the capping agents interactwith the core of the QDs. Their impact onthe overall molecular structure, molecularcomplex, and different QD properties alsoremains unclear. Consequently, this limitsour capability to improve the quantumefficiency, stability, and bioconjugating abil-ity further from what has been achievedtoday. Complex QD designs for increasingperformance and functionalities in differentapplications remain very challenging.Fourier-transform infrared spectroscopy
(FT-IR) can be an alternative for determiningthemolecular interactions between theQDsand their capping agents. However, thestrong andbroad absorption bands ofwateroften overlap with those from the QDs andstabilizing agents. This limits the number ofvibrational modes that can be resolved.A complementary technique to FT-IR
is Raman spectroscopy, which is a rapidand nondestructive means of probing mo-lecular vibrations optically through inelastic
* Address correspondence [email protected].
Received for review January 14, 2011and accepted April 25, 2011.
Published online10.1021/nn200157z
ABSTRACT A novel hollow-core photonic crystal fiber platform was used for the first time to
observe clear vibrational modes of the CdTe core, CdS0.7Te0.3 interface, and carboxylate-metal
complexes in dilute aqueous CdTe quantum dot (QD) solutions. These modes demonstrate the
presence of crystalline cores, defects, and surface passivation responsible for photoluminescent
efficiency and stability. In addition, 3-mercaptopropionic acid (MPA)-capped QDs show higher
crystallinity and stability than those capped with thioglycolic acid (TGA) and 1�thioglycerol (TG).
This detailed, nondestructive characterization was carried out using Raman spectroscopy for
solutions with QD concentration of 2 mg/mL, which is similar to their concentration during synthesis
process. This platform can be extended to the in situ studies of any colloidal nanoparticles and
aqueous solutions of relevant biological samples using Raman spectroscopy.
KEYWORDS: photonic crystal fiber . thiol-capped quantum dots . Ramanspectroscopy . thioglycolic acid . 3-mercaptopropionic acid . 1�thioglycerol
ARTIC
LE

MAK ET AL. VOL. 5 ’ NO. 5 ’ 3823–3830 ’ 2011
www.acsnano.org
3824
scattering. Raman provides the unique vibrationalmodes or “fingerprints” of the molecules that enablesimilar molecular structures to be unambiguously dis-tinguished and identified. More importantly, the vibra-tional modes of water are inherently weaker in Ramanscattering than in FT-IR. Distinctive Raman modesof colloidal QDs in their native and dilute aqueousenvironment can be readily obtained without signifi-cant interference. However, Raman scattering hasnot been successful in characterizing QDs becauseit is generally very weak compared to elastic scatter-ing, and it is further weakened in aqueous ordilute solutions; therefore, it has only been used incharacterizing QDs coated on films or in powderform.8,14�17 Surface-enhanced Raman spectroscopy(SERS) has also been used to obtain an enhancedRaman signal from solutions.18�20 However, metallicnanoparticles have to be mixed with the QD solution,which could alter the structure and propertiesof the QDs from its as-synthesized state due to con-formational changes when interacting with metallicnanoparticles.An alternative means of enhancing Raman signals
from aqueous or diluted solutions, without the need ofadditional metallic nanoparticles, is hollow-corephotonic crystal fiber (HC-PCF).21,22 HC-PCFs are opticalfibers consisting of a central air core and a high air-filling fraction cladding formed by a periodic air holearray in silica. The periodic air holes confine the pumplaser inside the central core of the PCF throughboth photonic bandgap effects and total internalreflections.23 This is a distinguishing feature of ourtechnique as we can utilize both guiding mechanismsby selectively filling the central air core with QDsolution to maintain the photonic bandgap effects ofthe cladding. By confining both the pump laser and thesolution along the length of the PCF, a larger volumefor light�matter interaction is achieved comparedto that of a conventional Raman spectroscopyscheme.24,25 Figure 1 compares the conventional Ra-man spectroscopy scheme with the one using HC-PCFas an interaction medium for Raman spectroscopy. Inconventional Raman spectroscopy (Figure 1a), thepump laser is focused directly into the QD solution togenerate Raman scattering. Most of the Raman signaldetected is scattered from the beamwaist of the pumplaser in which the pump laser is most intense. In thiscase, the pump laser and the QDs are only interactingin the volume limited by the spot size of the pump laserin the lateral direction and the depth of field in the axialdirection. Since Raman signals are scattered in alldirections, only a fraction of the scattered signal iscollected by the objective and detected by the detec-tor due to the limited numerical aperture of theobjective. In the case of an aqueous QD solution, theamount of scattered signal detected from the smallquantity of QDs dispersed in water is very minimal.
By employing HC-PCF as the medium for light�mat-ter interactions (Figure 1b), both the pump laser andtheQD solution can be confinedwithin the central coreof the HC-PCF. Subsequently, the confined laser powerwithin the core induces a strong interaction with thesolution that is filled inside. Thus, Raman signals arescattered throughout the whole length of the fiber asopposed to just the depth of field of the objective inthe conventional scheme. Since Raman signals are onlyslightly shifted from the wavelength of the pump laser,they will also be confined inside the central core of thePCF. As a result, the output signal from the fiber endwill be collected more efficiently by the objective anddirected to the detector. In addition, it is important tonote that the pump laser is confined inside the “liquid”core of the PCF; thus, the interaction between thepump laser and the glass wall of the fiber is minimaland the resulted interference is very limited in thepresence of other vibrational modes and backgrounds.With the use of HC-PCF, the detected Raman signal canbe 2 orders of magnitude greater than that of theconventional Raman spectroscopy.26 In addition, theunprecedented interaction volume can be increasedby extending the length of the fiber. The limitingfactors are the absorption and the attenuation due topropagation loss of the pump laser inside the centralcore, which we can optimize through appropriate de-signs of the HC-PCF.In the essence of combining HC-PCF with Raman
spectroscopy, the practical advantages of optical fibersare added to the conventional scheme. This includesthe high flexibility and compactness of optical fibersfor remote sensing and in situ detections, samplingversatility, and potential for low-cost analysis as thecost of HC-PCF drops dramatically through economiesof scale. In addition, HC-PCF requires only a very smallsample volume for detection, and it is capable ofdetecting multiple compounds in parallel. This is cru-cial in many biological, environmental, and forensic
Figure 1. Raman scattering and signal collection in (a)conventional Raman spectroscopy and (b) Raman spec-troscopy using HC-PCF.
ARTIC
LE

MAK ET AL. VOL. 5 ’ NO. 5 ’ 3823–3830 ’ 2011
www.acsnano.org
3825
applications where sample analysis with only nanolitervolume is required.In nanomaterial analysis, this platform shows poten-
tial for low-cost in situ monitoring of QD structureduring the synthesis process. The usefulness of HC-PCF for Raman spectroscopy has recently been demon-strated in the studies of ZnO nanoparticles synthesizedthrough the base hydrolysis method,21 and colloidalCdTenanoparticles postsynthesizedusing rapid thermalannealing.22 In these studies, Raman modes of the ZnOand CdTe nanoparticles were obtained owing to thedetected signal enhancement provided by the HC-PCF.In this study, we report the enhanced detected
Raman signals from aqueous solutions of thiol-stabilized CdTe QDs through the use of HC-PCF. Thestructure of the highly fluorescent CdTe QDs and thethree different ligandsused for stabilization are shown inFigure 2 along with their UV�vis and PL profile. Strongand clear vibrational modes ascribed to the CdTe semi-conductor core, capping agents, and their interfacewereobtained for the first time in the aqueous medium. Theobserved Raman vibrational modes are divided intothree regimes. Themodes in the low Raman shift regimereveal the low crystallinity of CdTeQDs cappedwith TGAdue to a large inclusion of Te compounds and surfacedefects. The modes in the mid and high Raman shiftregime reveal the formation of thiolates, and Cd�S
bonds between the thiolate and the CdTe core, whichstabilize the QD through a structured CdSxTe1�x ternarycompound.MPA is also found to promote the formationof unidentate and chelating bidentate complexes withtheCdTe core. These complexes further passivate theQDand potentially improve its stability at the expense of itssolubility andbioconjugating ability. Thiswork substanti-ates the promise of HC-PCF in enhancing the Ramanscattering signal of nanoparticles in aqueous solutionsand enables possible studies of molecular structuresrelating to the different properties of QDs.
RESULTS AND DISCUSSION
Figure 3 shows the Raman spectra of aqueous CdTeQDs from100 to 1750 cm�1. The spectra are divided intothree regimes in which the peaks are correlated to thevibrational modes in the CdTe semiconductor core,capping ligands, and their interfacial structures. Someof the modes are broad because they overlap withmultiple weak Raman modes that are located inproximity. These modes may originate from differentfunctional groups, different conformations of the samefunctional groups, or both. The limited sensitivity of thesystem prevented them from being resolved.
CdTe Core and Te Defects. In the low Raman shift regime,between 100 and 200 cm�1 as depicted in Figure 3(a),Raman modes corresponding to the crystalline core and
Figure 2. (a) Core�shell structure of CdTeQDs. (b)Molecular structure of capping ligands. (c) UV�vis spectra of the CdTeQDs(inset: fluorescent images of the QD solutions). (d) PL profile of the QDs.
ARTIC
LE

MAK ET AL. VOL. 5 ’ NO. 5 ’ 3823–3830 ’ 2011
www.acsnano.org
3826
Te defects of the CdTe QDs are observed. The peaks at∼120, ∼140 and ∼160 cm�1 are attributed to the Te A1,Te E and CdTe TO, and CdTe LO modes of the QDs,respectively.27�31 These modes are observed in all threespectra indicating that both the crystalline CdTe core andTedefects arepresented in theQDs regardless of the typeand structure of the capping agent used. In particular, theCdTe LOmodes are shifted to the lower wavenumber by∼10 cm�1 compared to the LOmodeof bulk CdTe crystalreported at ∼170 cm�1.28,32 These shifts indicate thepresence of phonon localization due to quantum con-finement effects, which suggests that the expected zero-dimensional CdTe structures are indeed in place. Inaddition, the similar shifts of the CdTe LO mode amongthe three spectra show that similar crystalline sizes areformed with the three different capping ligands used.Moving toward the lower Raman shifts at ∼120 and∼140 cm�1, two Te modes are observed in the threespectra. The two Te modes indicate the presence of Tecrystals, either within the center of the QD or the surfacedefects at the boundary of the QDs.30,31,33 QDs withsurface defects are known to have lower crystallinityand introduce trap states which reduces the PL quantumefficiency.34 However, the amount of Te inclusions or
surface defects cannot be quantified from the spectra asthe Raman cross sections of Temodes are 75 times largerthan that of the crystalline CdTemodes.31 Because of theclose proximity and broadness of the Te E and CdTe TOvibrationalmode at 140 cm�1, precise contribution of theTe E modes from QDs with different caps cannot bedetermined from their spectra. Nevertheless, we cancalculate the intensity ratios of the Te A1 mode to CdTeLO mode to compare the crystallinity of these QDs. Asshown in Table 1, the ratio is highest for TGA-cappedQDs, followed by those for TG and then MPA. In ourprevious study, we have shown that an increase in theratio indicates an increase in Te inclusion or surfacedefects relative to the amount of CdTe crystals formedin the QDs.22 This suggests that crystallinity improvedfromTGA-cappedQDs to TG-cappedQDs and is greatestwith MPA-capped QDs. The improved crystallinity con-tributes to a greater PL efficiency with fewer trap statesthat led to nonradiative processes; thus, a brighter QD issynthesized with MPA. Overall, both the crystalline CdTecore and defects are observed in QDs capped with TGA,MPA, and TG. However, different crystalline cores areobtained with MPA-capped QDs being the most crystal-line among the three solutions.
Figure 3. Raman spectra of thiol-capped CdTeQDs dispersed in aqueous solutions. The Raman shift between (a) 100�200, (b)200�310, and (c) 310�1750 cm�1 correspond to the low, medium, and high Raman shift regimes in which Raman modes ofthe QD core (red box), core-thiol interface (purple box), and thiol agents (green box) are observed respectively. Te defect,CdTe LO, and CdTe TO modes of the QD core are shown graphically in panel a. CdS and CdS0.7Te0.3 modes of the core�thiolinterface compound are shown in panel b. Carboxylate symmetric and asymmetric stretches of the thiol agents are shown inpanel c. TGA spectrum between 310�1750 cm�1 has been scaled for clarity.
ARTIC
LE
MAK ET AL. VOL. 5 ’ NO. 5 ’ 3823–3830 ’ 2011
www.acsnano.org
3827
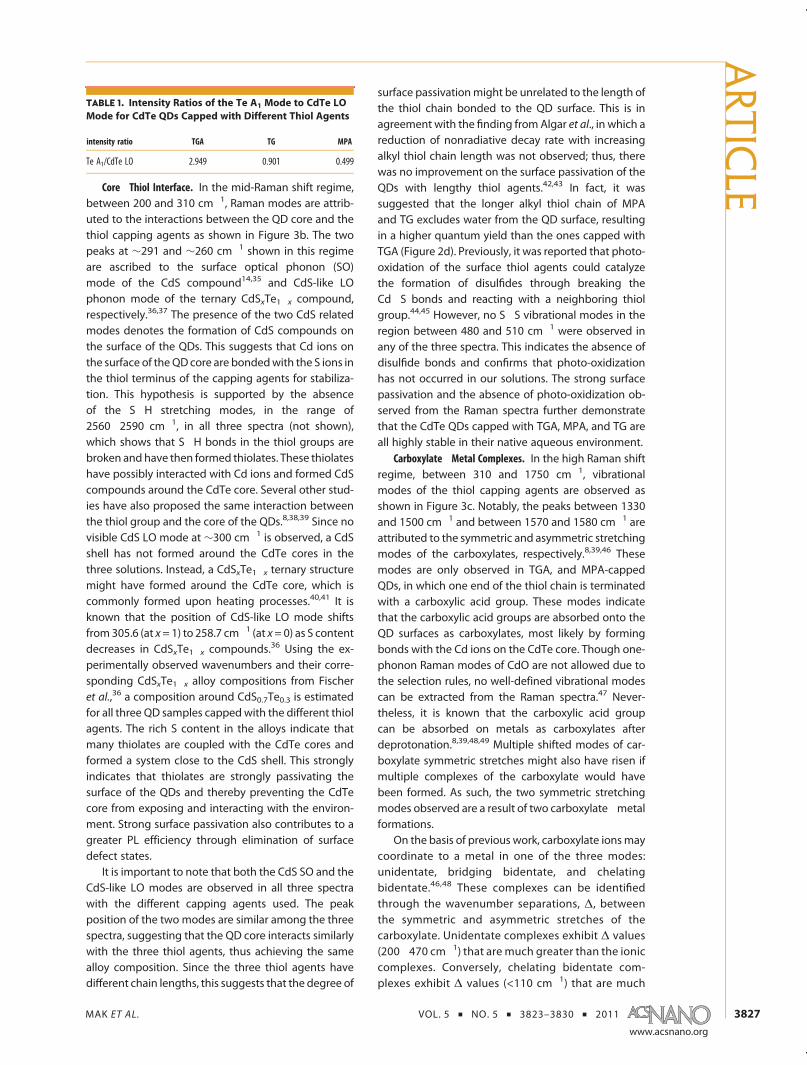
Core�Thiol Interface. In the mid-Raman shift regime,between 200 and 310 cm�1, Raman modes are attrib-uted to the interactions between the QD core and thethiol capping agents as shown in Figure 3b. The twopeaks at ∼291 and ∼260 cm�1 shown in this regimeare ascribed to the surface optical phonon (SO)mode of the CdS compound14,35 and CdS-like LOphonon mode of the ternary CdSxTe1�x compound,respectively.36,37 The presence of the two CdS relatedmodes denotes the formation of CdS compounds onthe surface of the QDs. This suggests that Cd ions onthe surface of theQD core are bondedwith the S ions inthe thiol terminus of the capping agents for stabiliza-tion. This hypothesis is supported by the absenceof the S�H stretching modes, in the range of2560�2590 cm�1, in all three spectra (not shown),which shows that S�H bonds in the thiol groups arebroken and have then formed thiolates. These thiolateshave possibly interacted with Cd ions and formed CdScompounds around the CdTe core. Several other stud-ies have also proposed the same interaction betweenthe thiol group and the core of the QDs.8,38,39 Since novisible CdS LO mode at ∼300 cm�1 is observed, a CdSshell has not formed around the CdTe cores in thethree solutions. Instead, a CdSxTe1�x ternary structuremight have formed around the CdTe core, which iscommonly formed upon heating processes.40,41 It isknown that the position of CdS-like LO mode shiftsfrom305.6 (at x= 1) to 258.7 cm�1 (at x= 0) as S contentdecreases in CdSxTe1�x compounds.36 Using the ex-perimentally observed wavenumbers and their corre-sponding CdSxTe1�x alloy compositions from Fischeret al.,36 a composition around CdS0.7Te0.3 is estimatedfor all three QD samples cappedwith the different thiolagents. The rich S content in the alloys indicate thatmany thiolates are coupled with the CdTe cores andformed a system close to the CdS shell. This stronglyindicates that thiolates are strongly passivating thesurface of the QDs and thereby preventing the CdTecore from exposing and interacting with the environ-ment. Strong surface passivation also contributes to agreater PL efficiency through elimination of surfacedefect states.
It is important to note that both the CdS SO and theCdS-like LO modes are observed in all three spectrawith the different capping agents used. The peakposition of the two modes are similar among the threespectra, suggesting that the QD core interacts similarlywith the three thiol agents, thus achieving the samealloy composition. Since the three thiol agents havedifferent chain lengths, this suggests that the degree of
surface passivationmight be unrelated to the length ofthe thiol chain bonded to the QD surface. This is inagreement with the finding from Algar et al., in which areduction of nonradiative decay rate with increasingalkyl thiol chain length was not observed; thus, therewas no improvement on the surface passivation of theQDs with lengthy thiol agents.42,43 In fact, it wassuggested that the longer alkyl thiol chain of MPAand TG excludes water from the QD surface, resultingin a higher quantum yield than the ones capped withTGA (Figure 2d). Previously, it was reported that photo-oxidation of the surface thiol agents could catalyzethe formation of disulfides through breaking theCd�S bonds and reacting with a neighboring thiolgroup.44,45 However, no S�S vibrational modes in theregion between 480 and 510 cm�1 were observed inany of the three spectra. This indicates the absence ofdisulfide bonds and confirms that photo-oxidizationhas not occurred in our solutions. The strong surfacepassivation and the absence of photo-oxidization ob-served from the Raman spectra further demonstratethat the CdTe QDs capped with TGA, MPA, and TG areall highly stable in their native aqueous environment.
Carboxylate�Metal Complexes. In the high Raman shiftregime, between 310 and 1750 cm�1, vibrationalmodes of the thiol capping agents are observed asshown in Figure 3c. Notably, the peaks between 1330and 1500 cm�1 and between 1570 and 1580 cm�1 areattributed to the symmetric and asymmetric stretchingmodes of the carboxylates, respectively.8,39,46 Thesemodes are only observed in TGA, and MPA-cappedQDs, in which one end of the thiol chain is terminatedwith a carboxylic acid group. These modes indicatethat the carboxylic acid groups are absorbed onto theQD surfaces as carboxylates, most likely by formingbonds with the Cd ions on the CdTe core. Though one-phonon Raman modes of CdO are not allowed due tothe selection rules, no well-defined vibrational modescan be extracted from the Raman spectra.47 Never-theless, it is known that the carboxylic acid groupcan be absorbed on metals as carboxylates afterdeprotonation.8,39,48,49 Multiple shifted modes of car-boxylate symmetric stretches might also have risen ifmultiple complexes of the carboxylate would havebeen formed. As such, the two symmetric stretchingmodes observed are a result of two carboxylate�metalformations.
On the basis of previous work, carboxylate ionsmaycoordinate to a metal in one of the three modes:unidentate, bridging bidentate, and chelatingbidentate.46,48 These complexes can be identifiedthrough the wavenumber separations, Δ, betweenthe symmetric and asymmetric stretches of thecarboxylate. Unidentate complexes exhibit Δ values(200�470 cm�1) that are much greater than the ioniccomplexes. Conversely, chelating bidentate com-plexes exhibit Δ values (<110 cm�1) that are much
TABLE 1. Intensity Ratios of the Te A1 Mode to CdTe LO
Mode for CdTe QDs Capped with Different Thiol Agents
intensity ratio TGA TG MPA
Te A1/CdTe LO 2.949 0.901 0.499
ARTIC
LE

MAK ET AL. VOL. 5 ’ NO. 5 ’ 3823–3830 ’ 2011
www.acsnano.org
3828
less than the ionic complexes. Bridging bidentatecomplexes exhibit Δ values (140�190 cm�1) that liein between the chelating bidentate and ionic com-plexes. As shown in Table 2, both TGA and MPA-capped QDs have two carboxylate�metal com-plexes. Both TGA and MPA show the formation ofchelating bidentate complexes. In addition, TGAformed the bridging bidentate complexes whileMPA formed the unidentate complexes. It was re-cently reported that the carboxylate�metal complexchanges from unidentate to bridging bidentatewhen the average size of the QDs increases from 8to 20 nm.8 However, the average particle sizes of ourTGA andMPA-cappedQDs calculated are very similar(i.e., 3.20 nm for TGA-capped QDs and 3.07 nm forMPA-capped QDs using their first absorption max-imum at 546 and 536 nm, respectively).50 The smallsize difference between the two QD solutions isunlikely to cause a difference in the carboxylate�metal complex. This suggests that the length of thealkyl thiol chain might have influenced not only thetype of complexes formed but also the amount ofcomplexes formed. To compare the quantity ofcarboxylate�metal complex formed between thedifferent interactions and QD solutions, the intensityratios of the COO symmetric stretches to the CdS 2SOmode are calculated. As shown in Table 3, the tworatios are much greater than 1 for MPA-capped QDsand less than 1 for TGA-capped QDs. The large ratioimplies that a large quantity of carboxylate ions iscoordinated with the Cd ions. This is not only sug-gesting that the formation of carboxylate�metalcomplexes is much more favorable with MPA thanwith TGA, but also that the surface of the QD is morepassivated by carboxylates in the MPA chain.51,52 Asa result, fewer defect sites are present in MPA-capped QDs, which corresponds to a higher PLquantum efficiency, however, in the sacrifice of
losing its solubility potentially due to the reductionof free carboxylate ions. Bioconjugation to the QDsmight also be limited with a reduced number ofthiol terminuses on its surface. Since the chelatingbidentate interactions of the carboxylates�metalcomplex are stronger than the unidentate interac-tions of the thiolates�metal complex, the largerquantity of chelating bidentate complexes formedin MPA-capped makes it more stable than the TGA-capped ones. Altogether, both TGA and MPA-cappedQDs form carboxylate�metal complexes with theCdTe core, but the longer alkyl chain in MPA enableda larger quantity of the complexes to be formedwith it rather than with TGA; thus potentially per-mitting a higher stabilized QD to be synthesizedwith MPA.
CONCLUSION
In summary, we demonstrated the use of HC-PCF toobtain efficient Raman scattering of the differentthiol-capped CdTe QDs in aqueous environment.Strong and clear Raman modes of the CdTe semi-conductor core, capping ligands, and their interfacialstructures were successfully observed and comparedwithout integrating any metallic nanoparticles forenhancement. To the best of our knowledge, this isthe first time that such strong Raman modes of thethiol-capped CdTe QDs in aqueous solution havebeen reported. The enhanced detected Raman sig-nals were achieved through increased light�matterinteraction and efficient accumulation of the Ramanscattering signal along the whole length of the HC-PCF.In addition, our experimental results also demon-
strated the great potential of HC-PCF for opticalsensing with minuscule analyte volume. The use ofHC-PCF can be extended to the in situ studies ofcolloidal nanoparticles using Raman spectroscopy.Physical changes of the QD structure, such as crystal-linity, interfacial modes, and surface passivation, canbe monitored and controlled dynamically during thevarious synthesis processes for property optimiza-tions. For example, surface chemistry between QDsand electrode surface can be optimized to achieveefficient sensitized photocurrents for practicalphotovoltaic devices. Furthermore, structural dy-namics of the QDs can be determined experimen-tally in different biological systems to revealthe possible cause of some undesirable effects
TABLE 2. The Wavenumber Separations, Δ, between the Symmetric and Asymmetric Stretching Modes of the
Carboxylate, and Their Corresponding Carboxylate�Metal
capping agent separation between νs(COO)a and νas(COO), Δ1 structure separation between νs(COO)
b and νas(COO), Δ2 structure
TGA 187 cm�1 bridging bidentate 70 cm�1 chelating bidentateMPA 215 cm�1 unidentate 102 cm�1 chelating bidentate
a Symmetric stretches between 1300 and 1400 cm�1. b Symmetric stretches between 1400 and 1500 cm�1.
TABLE 3. Intensity Ratios of the Symmetric Carboxylate
Stretch to CdS 2SO Mode
intensity ratio
capping agent νs(COO)a/CdS 2SO νs(COO)
b/CdS 2SO
TGA 0.205 0.547MPA 12.803 5.390
a Symmetric stretches between 1300 and 1400 cm�1. b Symmetric stretchesbetween 1400 and 1500 cm�1.
ARTIC
LE

MAK ET AL. VOL. 5 ’ NO. 5 ’ 3823–3830 ’ 2011
www.acsnano.org
3829
(i.e., cytotoxicity and photobleaching). Systematicstudy of molecular structures will enable us to betterunderstand the basis of different QD propertieswhich further optimizes our QD designs for different
applications. Ultimately, HC-PCF can be served asa platform for studying the vibrational modes ofcomplex aqueous solutions of relevant biologicalsamples such as DNA.53
METHODS AND MATERIALSThe thiol-capped CdTe quantumdots (QDs) used in this study
were synthesized with minor modification to literatureprocedure.54,55 Sodium borohydride (NaBH4, 99%), telluriumpowder (∼200 mesh, 99.8%), cadmium chloride (CdCl2, 99%),thioglycolic acid (TGA) (98%), 3-mercaptopropionic acid (MPA)(99%), and 1-thioglycerol (TG) (99%) purchased from Aldrichchemicals. All chemicals were used as received; Millipore Qwater (18 sm) were used throughout the nanocrystal synthesis.Synthesis of TGA-capped CdTe QDs: 300 mg (7.90 mmol) of
NaBH4 was dissolved in 10 mL of water under argon environ-ment and cooled in an ice bath. A 400mg (3.14mmol) portion oftellurium powder was added, and the reaction mixture was leftstirring for 2 h to get a deep pink-purple clear solution. Theresulting NaHTe solution was kept under argon before use.CdCl2 (1.15 g, 6.28 mmol) was then dissolved in 70 mL ofMillipore water and bubbled with argon for 20 min. One mL(15.08 mmol) of TGA was slowly added to this solution, whichresults in the formation of white precipitate due to the forma-tion of Cd�TGA complex in the solution. The pH value of thesolution was adjusted to 11.0 by dropwise addition of 2.0 MNaOH solution with stirring. The freshly prepared NaHTe solu-tion was then rapidly added to the Cd precursor solution atroom temperature. After being continuously stirred at roomtemperature for 10min, the resulting orange solution is refluxedfor a predetermined time (2�16 h) and then cooled to roomtemperature. The obtained CdTe NCs were precipitated by theaddition of reagent grade acetone and were isolated andpurified by repeated precipitation/centrifugation cycles withacetone/water and dried in vacuum for overnight. Solid CdTeQD samples were then weighted and dispersed in deionizedwater to prepare aqueous solutions of 2 mg/mL and 0.4 mg/mLfor Raman and photoluminescence (PL) measurementsrespectively.MPA-capped CdTe QDs were obtained using 400 mg of
tellurium powder, 297 mg of NaBH4, 1.15 g of CdCl2, and1.15 mL of MPA as described above. TG-capped CdTe QDs wereobtained using 565 mg of tellurium powder, 420 mg of NaBH4,1.0 g of CdCl2 and 1.62 mL of TG as described above.Raman spectra were acquired using a Horiba Jobin Yvon
HR800 micro-Raman system equipped with a CW 632.8 nmHeNe laser in the range of 2�5 mW. The spectral resolution ofthe spectrometer was about 1 cm�1. The laser light was focusedonto the hollow-core photonic crystal fibers (HC-PCFs) using a100� objective. Each spectrum was averaged over 40 measure-ments with an accumulation time of 30 s. Room temperature PLmeasurements were performed using a Perkin-Elmer lumines-cence spectrophotometer in aqueous solution. The HC-PCFsused in these experiments were obtained from NKT Photonics,HC-800-01. Each piece was segmented, stripped, and cleavedinto pieces of ∼6 cm long. The core of the HC-PCF wasselectively filled, using a technique developed by Irizar et al.,21
to allow enhancement of the detected Raman signal throughbandgap confinement of the pump laser. Raman spectra ob-tained were baseline removed and fitted with Gaussian orGaussian�Lorentzian mixed functions to determine their peakpositions, amplitudes, and full-width at half-maxima (FWHMs).The positions of the functions fit to the spectra are labeled inFigure 3.
Acknowledgment. We thank the Natural Sciences and En-gineering Research Council of Canada (NSERC) for financialsupport.
Supporting Information Available: Summary of Raman peaksobtained from TGA, MPA, and TG-capped CdTe QDs, and theirproposed assignments; CdTe QD spectra fit with Gaussian andGaussian�Lorentzian mixed functions; spectra comparison ofwater, TG, and diluted TG; and Raman spectra of TGA, MPA, andTG. This material is available free of charge via the Internet athttp://pubs.acs.org.
REFERENCES AND NOTES1. Medintz, I. L.; Uyeda, H. T.; Goldman, E. R.; Mattoussi, H.
Quantum Dot Bioconjugates for Imaging, Labelling andSensing. Nat. Mater. 2005, 4, 435–446.
2. Wood, V.; Bulovi�c, V. Colloidal QuantumDot Light-EmittingDevices. Nano Rev. 2010, 1, 5202–5209.
3. Sargent, E. H. Infrared Photovoltaics Made by SolutionProcessing. Nat. Photon. 2009, 3, 325–331.
4. Rogach, A. L.; Franzl, T.; Klar, T. A.; Feldmann, J.; Gaponik, N.;Lesnyak, V.; Shavel, A.; Eychmüller, A.; Rakovich, Y. P.;Donegan, J. F. Aqueous Synthesis of Thiol-Capped CdTeNanocrystals: State-of-the-Art. J. Phys. Chem. C 2007, 111,14628–14637.
5. Zhang, H.; Sun, P.; Liu, C.; Gao, H.; Xu, L.; Fang, J.; Wang, M.;Liu, J.; Xu, S., L-Cysteine Capped CdTe-CdS Core-ShellQuantum Dots: Preparation, Characterization and Immu-no-Labeling of HeLa Cells. Luminescence [Online earlyaccess] doi: 10.1002/bio. Published online December 16,2009; http://onlinelibrary.wiley.com/doi/10.1002/bio.1188/pdf (accessed Jul 28, 2010).
6. Liu, J.; Shi, Z.; Yu, Y.; Yang, R.; Zuo, S., Water-SolubleMulticolored Fluorescent CdTe Quantum Dots: Synthesisand Application for Fingerprint Developing. J. ColloidInterface Sci. 2010, 342, 278�282; Epub 2009 Oct 29.
7. Wang, C.; Zhang, H.; Zhang, J.; Li, M.; Sun, H.; Yang, B.Application of Ultrasonic Irradiation in Aqueous Synthesisof Highly Fluorescent CdTe/CdS Core�Shell Nanocrystals.J. Phys. Chem. C 2007, 111, 2465–2469.
8. Abd El-sadek, M. S.; Ram Kumar, J.; Moorthy Babu, S. TheRole of Potassium Tellurite as Tellurium Source in Mercap-toacetic Acid-CappedCdTeNanoparticles. Curr. Appl. Phys.2010, 10, 317–322.
9. Sargent, E. H. Solar Cells, Photodetectors, and OpticalSources from Infrared Colloidal QuantumDots. Adv. Mater.2008, 20, 3958–3964.
10. Cho, K.-S.; Lee, E. K.; Joo, W.-J.; Jang, E.; Kim, T.-H.; Lee, S. J.;Kwon, S.-J.; Han, J. Y.; Kim, B.-K.; Choi, B. L.; et al. High-Performance Crosslinked Colloidal Quantum-Dot Light-Emitting Diodes. Nat. Photon. 2009, 3, 341–345.
11. Qian, X.; Peng, X.-H.; Ansari, D. O.; Yin-Goen, Q.; Chen, G. Z.;Shin, D. M.; Yang, L.; Young, A. N.; Wang, M. D.; Nie, S.In Vivo Tumor Targeting and Spectroscopic Detectionwith Surface-Enhanced Raman Nanoparticle Tags. Nat.Biotechnol. 2008, 26, 83–90.
12. Kim, S.; Lim, Y. T.; Soltesz, E. G.; De Grand, A. M.; Lee, J.;Nakayama, A.; Parker, J. A.; Mihaljevic, T.; Laurence, R. G.;Dor, D. M.; et al. Near-Infrared Fluorescent Type IIQuantum Dots for Sentinel Lymph Node Mapping. Nat.Biotechnol. 2004, 22, 93–97.
13. Yaghini, E.; Seifalian, A. M.; MacRobert, A. J. Quantum Dotsand Their Potential Biomedical Applications in Photosen-sitization for Photodynamic Therapy.Nanomedicine 2009,4, 353–363.
ARTIC
LE
MAK ET AL. VOL. 5 ’ NO. 5 ’ 3823–3830 ’ 2011
www.acsnano.org
3830
14. Schreder, B.; Schmidt, T.; Ptatschek, V.; Spanhel, L.;Materny, A.; Kiefer, W. Raman Characterization of CdTe/CdS”Core-Shell” Clusters in Colloids and Films. J. Cryst. Growth2000, 214�215, 782–786.
15. Byrne, S. J.; Corr, S. A.; Rakovich, T. Y.; Gun'ko, Y. K.;Rakovich, Y. P.; Donegan, J. F.; Mitchell, S.; Volkov, Y.Optimisation of the Synthesis and Modification of CdTeQuantum Dots for Enhanced Live Cell Imaging. J. Mater.Chem. 2006, 16, 2896–2902.
16. Zhang, J.-Y.; Wang, X.-Y.; Xiao, M.; Qu, L.; Peng, X. LatticeContraction in Free-Standing CdSe Nanocrystals. Appl.Phys. Lett. 2002, 81, 2076–2078.
17. Baranov, A. V.; Rakovich, Y. P.; Donegan, J. F.; Perova, T. S.;Moore, R. A.; Talapin, D. V.; Rogach, A. L.; Masumoto, Y.;Nabiev, I. Effect of ZnS Shell Thickness on the PhononSpectra in CdSe Quantum Dots. Phys. Rev. B 2003, 68,165306.
18. Castro, J. L.; L�opez-Ramírez, M. R.; Centeno, S. P.; Otero, J. C.Adsorption of Mercaptoacetic Acid on a Colloidal SilverSurface as Investigated by Raman Spectroscopy. Biopoly-mers 2004, 74, 141–145.
19. Castro, J. L.; L�opez-Ramírez, M. R.; Arenas, J. F.; Otero, J. C.Surface-Enhanced Raman Scattering of 3-Mercaptopro-pionic Acid Adsorbed on a Colloidal Silver Surface.J. Raman Spectrosc. 2004, 35, 997–1000.
20. Wang, Y.; Zhang, J.; Jia, H.; Li, M.; Zeng, J.; Yang, B.; Zhao, B.;Xu, W.; Lombardi, J. R. Mercaptopyridine Surface-Functio-nalized CdTe Quantum Dots with Enhanced RamanScattering Properties. J. Phys. Chem. C 2008, 112, 996–1000.
21. Irizar, J.; Dinglasan, J.; Goh, J. B.; Khetani, A.; Anis, H.;Anderson, D.; Goh, C.; Helmy, A. S. Raman Spectroscopyof Nanoparticles Using Hollow-Core Photonic CrystalFibers. IEEE J. Sel. Top. Quant. 2008, 14, 1214–1222.
22. Rutledge, S. A.; Farah, A. A.; Dinglasan, J.; Anderson, D. J.;Das, A.; Goh, J.; Goh, C.; Helmy, A. S. Postsynthesis Crystal-linity Improvement of Colloidal CdTe Nanoparticles UsingRapid Thermal Annealing. J. Phys. Chem. C 2009, 113,20208–20213.
23. Fini, J. M. Microstructure Fibres for Optical Sensing inGases and Liquids. Meas. Sci. Technol. 2004, 15, 1120.
24. Benabid, F.; Knight, J. C.; Antonopoulos, G.; Russell, P. St J.Stimulated Raman Scattering in Hydrogen-Filled Hollow-Core Photonic Crystal Fiber. Science 2002, 298, 399–402.
25. Yan, H.; Gu, C.; Yang, C.; Liu, J.; Jin, G.; Zhang, J.; Hou, L.; Yao,Y. Hollow Core Photonic Crystal Fiber Surface-EnhancedRaman Probe. Appl. Phys. Lett. 2006, 89, 204101-3.
26. Yang, X.; Shi, C.; Wheeler, D.; Newhouse, R.; Chen, B.;Zhang, J. Z.; Gu, C. High-Sensitivity Molecular Sensingusing Hollow-Core Photonic Crystal Fiber and Surface-Enhanced Raman Scattering. J. Opt. Soc. Am. A 2010, 27,977–984.
27. Ochoa, O. R.; Witkowski Iii, E. J.; Colajacomo, C.; Simmons,J. H.; Potter, B. G., Jr. Raman Characterization of CdTeNanocrystallites Embedded in a Glass Matrix. J. Mater. Sci.Lett. 1997, 16, 613–616.
28. Vinogradov, V. S.; Karczewski, G.; Kucherenko, I. V.; Mel'nik,N. N.; Fernandez, P. Raman Spectra of Structures withCdTe-, ZnTe-, and CdSe-Based Quantum Dots and TheirRelation to the Fabrication Technology. Phys. Solid State2008, 50, 164–167.
29. Amirtharaj, P. M.; Pollak, F. H. Raman Scattering Study ofthe Properties and Removal of Excess Te on CdTe Sur-faces. Appl. Phys. Lett. 1984, 45, 789–791.
30. Shin, S. H.; Bajaj, J.; Moudy, L. A.; Cheung, D. T. Character-ization of Te Precipitates in CdTe Crystals. Appl. Phys. Lett.1983, 43, 68–70.
31. Morell, G.; Reyn�es-Figueroa, A.; Katiyar, R. S.; Farías, M. H.;Espinoza-Beltran, F. J.; Zelaya-Angel, O.; S�anchez-Sinencio,F. Raman Spectroscopy of Oxygenated Amorphous CdTeFilms. J. Raman Spectrosc. 1994, 25, 203–207.
32. Islam, S. S.; Rath, S.; Jain, K. P.; Abbi, S. C.; Julien, C.;Balkanski, M. Forbidden One-LO-Phonon Resonant Ra-man Scattering and Multiphonon Scattering in Pure CdTeCrystals. Phys. Rev. B 1992, 46, 4982.
33. Na, H.-K.; Shon, P.-K. A Raman Scattering Study of CdTe/p-(111)InSb Heterointerfaces Grown by R.F. Sputtering inHigh Vacuum. Solid State Commun. 1993, 85, 609–612.
34. Gilbert, B.; Huang, F.; Lin, Z.; Goodell, C.; Zhang, H.;Banfield, J. F. Surface Chemistry Controls Crystallinity ofZnS Nanoparticles. Nano Lett. 2006, 6, 605–610.
35. Schreder, B.; Schmidt, T.; Ptatschek, V.; Winkler, U.; Materny,A.; Umbach, E.; Lerch, M.; Muller, G.; Kiefer, W.; Spanhel, L.CdTe/CdS Clusters with “Core�Shell” Structure in Colloidsand Films: The Path of Formation and Thermal Breakup.J. Phys. Chem. B 2000, 104, 1677–1685.
36. Fischer, A.; Anthony, L.; Compaan, A. D. Raman Analysis ofShort-Range Clustering in Laser-Deposited CdSxTe1�x
Films. Appl. Phys. Lett. 1998, 72, 2559–2561.37. Pal, R.; Dutta, J.; Chaudhuri, S.; Pal, A. K. CdSxTe1�x Films:
PreparationandProperties. J. Phys.D:Appl. Phys.1993,26, 704.38. Kim, J. E.; Hwang, C.-S.; Yoon, S. Synthesis and Surface
Characterization by Raman Spectroscopy of Water-Dis-persible ZnS: Mn Nanocrystals Capped with Mercaptoa-cetic Acid. Notes 2008, 29, 1247.
39. Zhang, H.; Zhou, Z.; Yang, B.; Gao, M. The Influence ofCarboxyl Groups on the Photoluminescence of Mercap-tocarboxylic Acid-Stabilized CdTe Nanoparticles. J. Phys.Chem. B 2002, 107, 8–13.
40. Dhere, R.; Wu, X.; Albin, D.; Perkins, C.; Moutinho, H.;Gessert, T. Formation and Characterization of CdSxTe1�x
Alloys Prepared from Thin Film Couples of CdS and CdTe.IEEE PV Spec. Conf. 2002, 484–487.
41. Murali, K. R.; Palanisamy, T. Electrical andOptical Properties ofPulse Plated CdSxTe1�x Films. Ionics 2010, 16, 613–619.
42. Blum, A. S.; Moore, M. H.; Ratna, B. R. Quantum DotFluorescence as a Function of Alkyl Chain Length inAqueous Environments. Langmuir 2008, 24, 9194–9197.
43. Aldeek, F.; Balan, L.; Lambert, J.; Schneider, R. The Influ-ence of Capping Thioalkyl Acid on the Growth andPhotoluminescence Efficiency of CdTe and CdSe Quan-tum Dots. Nanotechnology 2008, 19, 475401.
44. Kloepfer, J. A.; Bradforth, S. E.; Nadeau, J. L. PhotophysicalProperties of Biologically Compatible CdSe Quantum DotStructures. J. Phys. Chem. B 2005, 109, 9996–10003.
45. Aldana, J.; Wang, Y. A.; Peng, X. Photochemical Instabilityof CdSe Nanocrystals Coated by Hydrophilic Thiols. J. Am.Chem. Soc. 2001, 123, 8844–8850.
46. Nakamoto, K. Infrared and Raman Spectra of Inorganic andCoordination Compounds: Part B.; Wiley: Hoboken, NJ, 2009.
47. Popovi�c, Z. V.; Stani�si�c, G.; Stojanovi�c, D.; Kosti�c, R. Infraredand Raman Spectra of CdO. Phys. Status Solidi B 1991, 165,K109–K112.
48. Socrates, G. Infrared Characteristic Group Frequencies;Wiley: New York, 1980.
49. Shevchenko, L. L. Infrared Spectra of Salts and Complexesof Carboxylic Acids and Some of Their Derivatives. Russ.Chem. Rev. 1963, 32, 201.
50. Yu, W. W.; Qu, L.; Guo, W.; Peng, X. Experimental Determi-nation of the Extinction Coefficient of CdTe, CdSe, andCdS Nanocrystals. Chem. Mater. 2003, 15, 2854–2860.
51. Gao, M.; Kirstein, S.; Mohwald, H.; Rogach, A. L.; Kornowski,A.; Eychmuller, A.; Weller, H. Strongly PhotoluminescentCdTe Nanocrystals by Proper SurfaceModification. J. Phys.Chem. B 1998, 102, 8360–8363.
52. Zhang, H.; Wang, D.; Möhwald, H. Ligand-Selective Aqu-eous Synthesis of One-Dimensional CdTe Nanostructures.Angew. Chem., Int. Ed. 2006, 45, 748–751.
53. Abu-Ghazalah, R. M.; Irizar, J.; Helmy, A. S.; Macgregor, R. B.,Jr. A Study of the Interactions that Stabilize DNA FrayedWires. Biophys. Chem. 2010, 147, 123–129.
54. Klayman, D. L.; Griffin, T. S. Reaction of Selenium withSodium Borohydride in Protic Solvents. A Facile Methodfor the Introduction of Selenium intoOrganicMolecules. J.Am. Chem. Soc. 1973, 95, 197–199.
55. Gu, Z.; Zou, L.; Fang, Z.; Zhu, W.; Zhong, X. One-PotSynthesis of Highly Luminescent CdTe/CdS Core/ShellNanocrystals in Aqueous Phase. Nanotechnology 2008,19, 135604.
ARTIC
LE