Photochemical Model Performance for PM2.5 Sulfate, Nitrate, Ammonium, and pre-cursor species SO2,...
19
Photochemical Model Performance for PM2.5 Sulfate, Nitrate, Ammonium, and pre- cursor species SO2, HNO3, and NH3 at Background Monitor Locations in the Central and Eastern United States Kirk Baker October 2006 Lake Michigan Air Directors Consortium University of Illinois - Chicago
-
Upload
shyann-crookham -
Category
Documents
-
view
219 -
download
0
Transcript of Photochemical Model Performance for PM2.5 Sulfate, Nitrate, Ammonium, and pre-cursor species SO2,...
Photochemical Model Performance for PM2.5 Sulfate, Nitrate, Ammonium, and pre-cursor species
SO2, HNO3, and NH3 at Background Monitor Locations in the Central and Eastern United States
Kirk BakerOctober 2006
Lake Michigan Air Directors Consortium
University of Illinois - Chicago

Ammonia Monitor Network
• 9 rural and 1 urban (MI)• Measure SO4, SO2,
NH4, NH3, NO3, HNO3• 24-hr average sample
every 6 days• Samples at most sites
use URG manual• Data collected and
validated for entire year of 2004
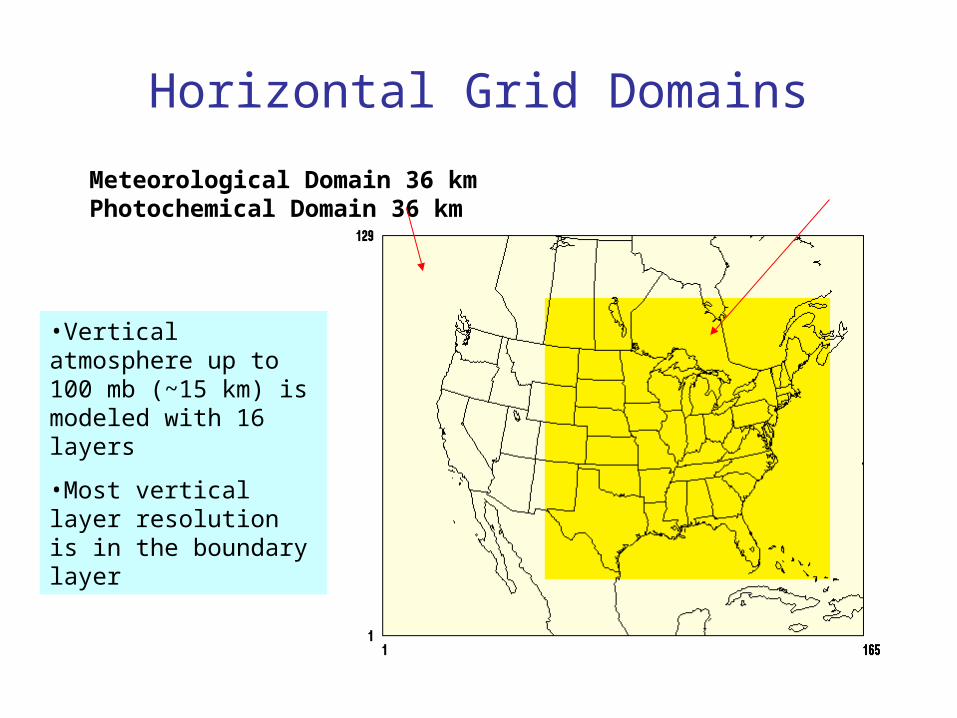
Horizontal Grid Domains
Meteorological Domain 36 km Photochemical Domain 36 km
•Vertical atmosphere up to 100 mb (~15 km) is modeled with 16 layers
•Most vertical layer resolution is in the boundary layer
Photochemical Model
• The emissions are based on 2002 emission inventories developed for O3/PM2.5 State Implementation Plans (2004 biogenics)
• Boundary and initial concentrations are monthly averages from a global photochemical model simulation (GEOS-CHEM model)
• MM5 v3.6.X• CAMx 4.30: mechanism 4; CB4+ gas-phase;
ISORROPIA inorganic; RADM aqueous phase• Snow cover; palmer drought index; BELD3
landuse

Model Performance Metrics
• Metrics consistent with EPA modeling guidance:– Bias– Error– Fractional Bias– Fractional Error– r2
• Model performance using daily average measurements: SO2, SO4, NH3, NH4, NO3, HNO3
N
i
M
jji
ji
ji
ji
OP
OP
MNFE
1 1
21
N
i
M
jji
ji
ji
ji
OP
OP
MNFB
1 1
21
N
i
M
j
ji
ji OP
MNMB
1 1
)(1
N
i
M
j
ji
ji OP
MNMAGE
1 1
||1
Bias
Error
Fractional Bias
Fractional Error

SO2
SO4
NH3
NH4
HNO3
NO3
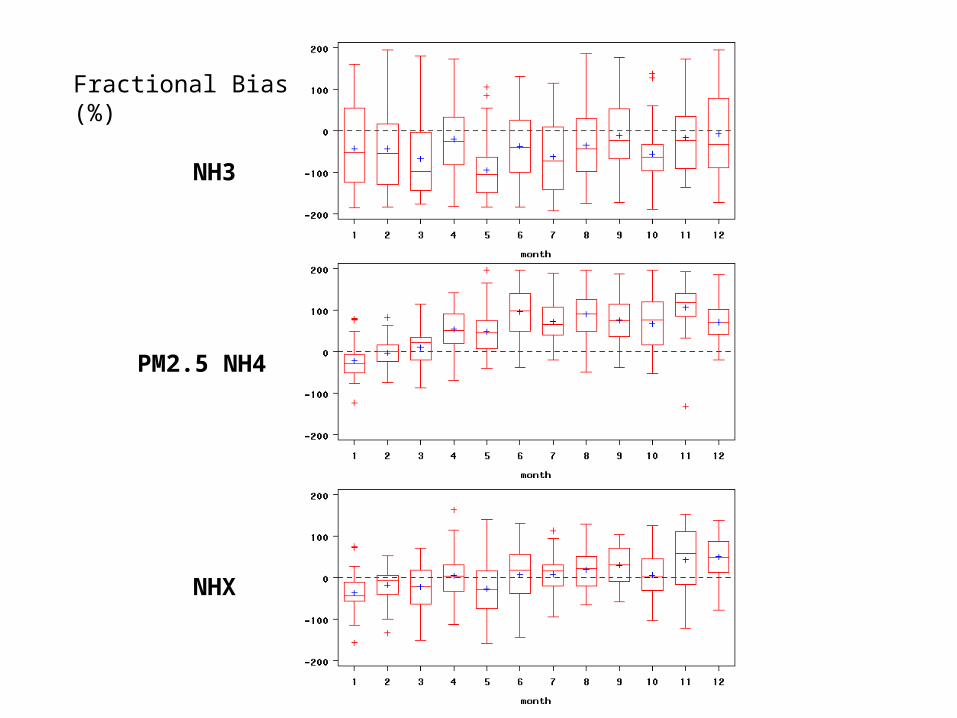
NH3
PM2.5 NH4
NHX
Fractional Bias (%)
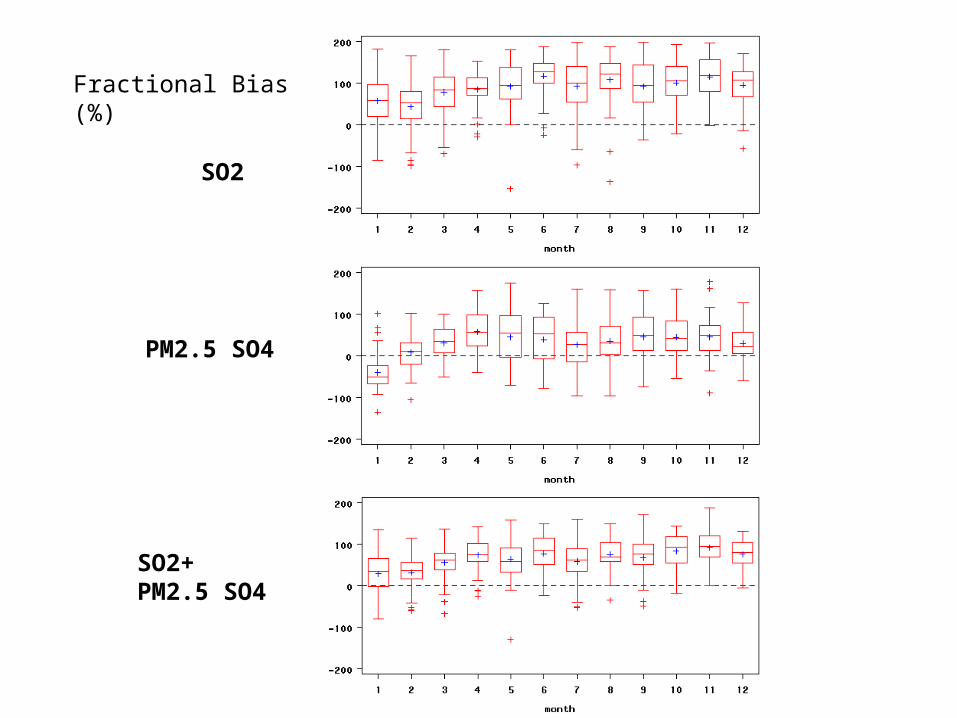
SO2
PM2.5 SO4
Fractional Bias (%)
SO2+ PM2.5 SO4

HNO3
PM2.5 NO3
Fractional Bias (%)
HNO3+ PM2.5 NO3

Bias (ug/m3)
-1
0
1
2
3
4
5
6
NH3 NO3 HNO3 SO2 SO4 NH4
Winter Spring Summer Fall
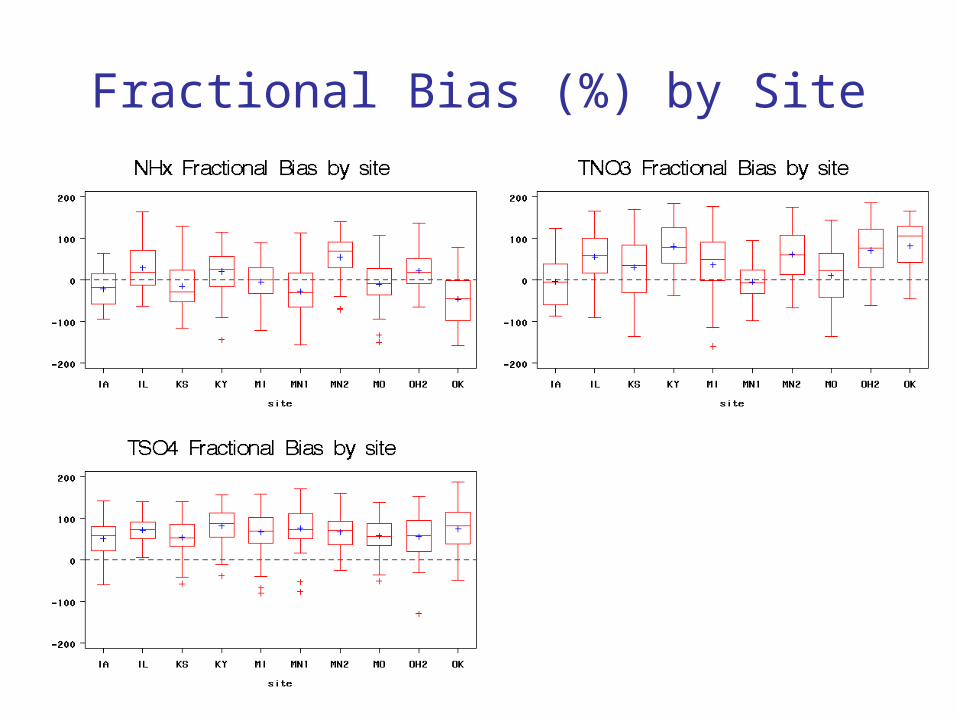
Fractional Bias (%) by Site
0
2
4
6
8
10
12
14
16
1 2 3 4 5 6 7 8 9 10 11 12
Con
cen
trati
on
(u
g/m
3)
AMN CASNET Model AMN Model CASTNET
0
0.5
1
1.5
2
2.5
3
3.5
4
1 2 3 4 5 6 7 8 9 10 11 12
Con
cen
trati
on
(u
g/m
3)
SO2
HNO3
• Monthly average HNO3 and SO2 concentrations at 24 Midwest CASTNET stations (blue dots)
• CASTNET samples are 7 day averages
• No cyclone inlet at CASTNET monitor so concentrations should be a little higher
• CASTNET stations are clustered around the Ohio Valley
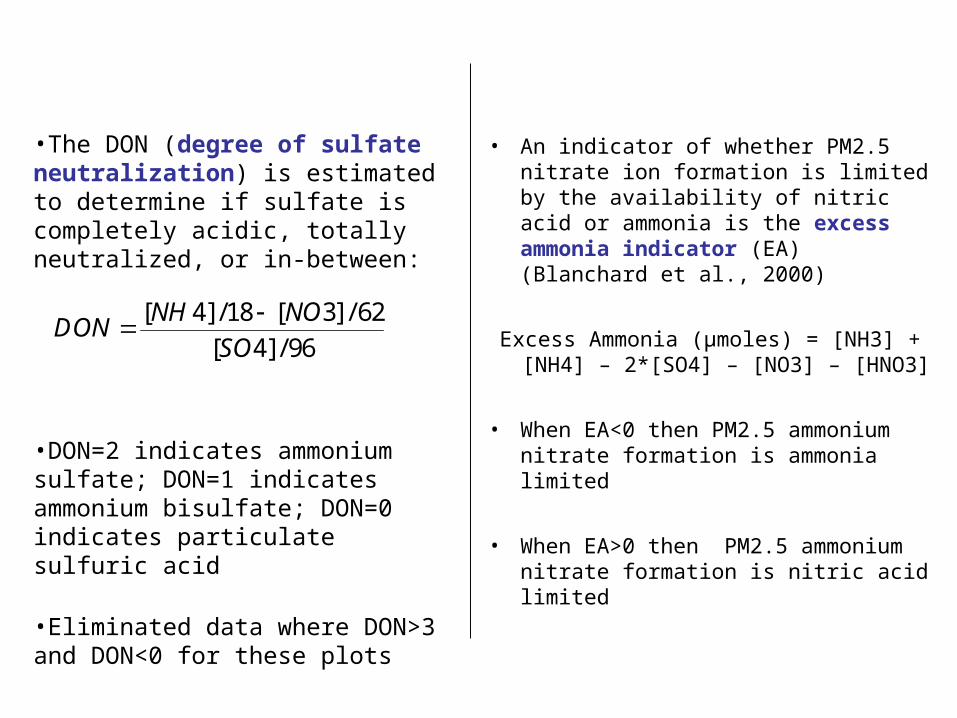
•The DON (degree of sulfate neutralization) is estimated to determine if sulfate is completely acidic, totally neutralized, or in-between:
•DON=2 indicates ammonium sulfate; DON=1 indicates ammonium bisulfate; DON=0 indicates particulate sulfuric acid
•Eliminated data where DON>3 and DON<0 for these plots
96/]4[
62/]3[18/]4[
SO
NONHDON
• An indicator of whether PM2.5 nitrate ion formation is limited by the availability of nitric acid or ammonia is the excess ammonia indicator (EA) (Blanchard et al., 2000)
Excess Ammonia (µmoles) = [NH3] + [NH4] – 2*[SO4] – [NO3] – [HNO3]
• When EA<0 then PM2.5 ammonium nitrate formation is ammonia limited
• When EA>0 then PM2.5 ammonium nitrate formation is nitric acid limited
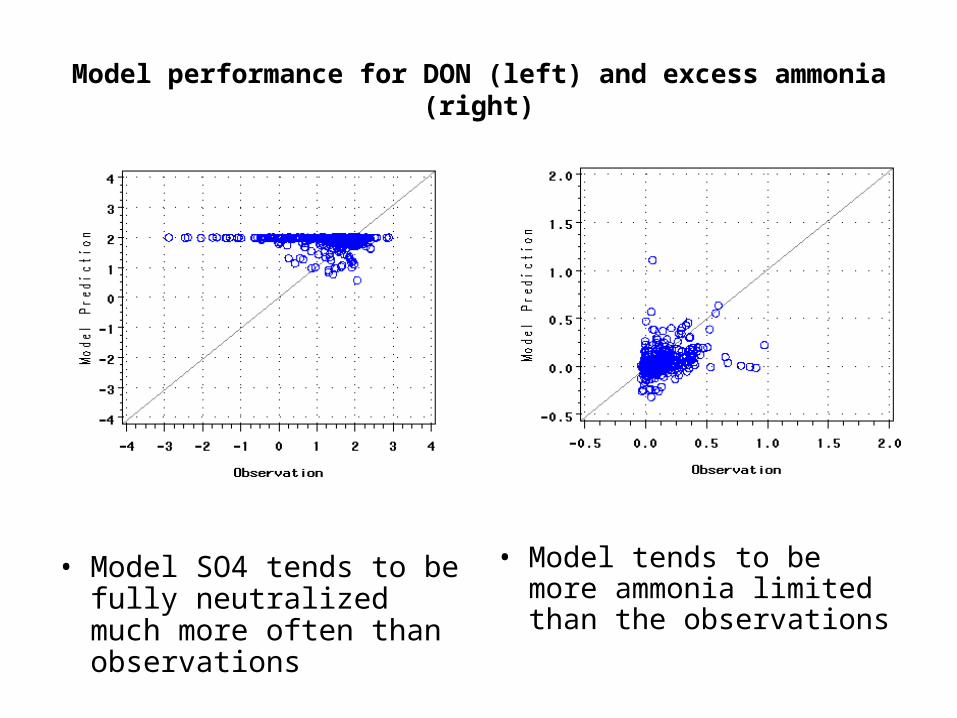
• Model SO4 tends to be fully neutralized much more often than observations
• Model tends to be more ammonia limited than the observations
Model performance for DON (left) and excess ammonia (right)
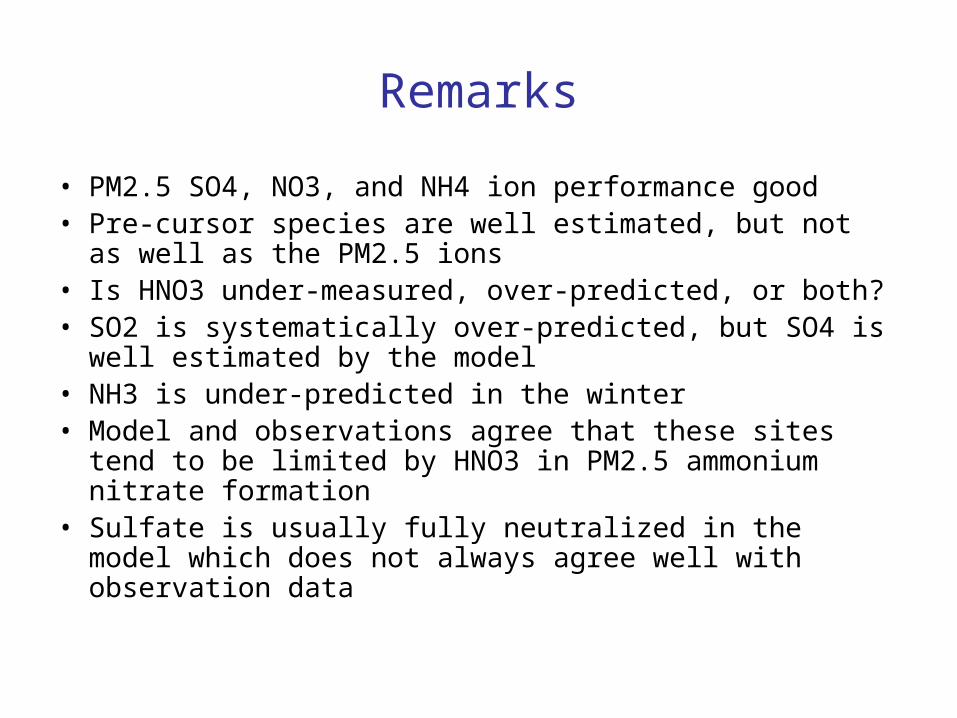
Remarks
• PM2.5 SO4, NO3, and NH4 ion performance good• Pre-cursor species are well estimated, but not as well as
the PM2.5 ions• Is HNO3 under-measured, over-predicted, or both?• SO2 is systematically over-predicted, but SO4 is well
estimated by the model• NH3 is under-predicted in the winter• Model and observations agree that these sites tend to be
limited by HNO3 in PM2.5 ammonium nitrate formation• Sulfate is usually fully neutralized in the model which
does not always agree well with observation data

Species N RSQ N RSQ
NO3- 487 0.44 463 0.77
SO4= 536 0.49 510 0.71
NH4+ 477 0.35 103 0.72
SO2 558 0.52 42 0.86
Model-Obs Obs-Obs
Model-Observation and co-located observation error (ug/m3) and fractional error (%) metrics
Metric Species Model-Obs1 Model-Obs2 Obs-Obs3
Error NO3- 1.2 1.0 0.50 ± 0.08
Error SO2 4.5 3.39 ± 1.34
Error SO4= 1.5 1.2 0.75 ± 0.11
Error NH4+ 0.9 0.44 ± 0.11
Frac Error NO3- 85.9 84.7 45.0 ± 3.9
Frac Error SO2 96.6 39.0 ± 10.2
Frac Error SO4= 52.1 39.4 33.4 ± 2.7
Frac Error NH4+ 66.8 42.4 ± 8.2
1 model v. ammonia network2 model v. IMPROVE network3 confidence interval based on α=0.05

Wet Deposition (kg/km2) – NADP sites
Fractional Bias Fractional Error
Season N NO3- SO4
= NH4+ NO3
- SO4= NH4
+
Winter 496 -73 -91 -113 92 108 122Spring 535 -27 -9 -50 64 64 81
Summer 493 -14 14 -19 70 74 78Fall 458 -28 -48 -64 68 81 87
SO4= NO3
- NH4+
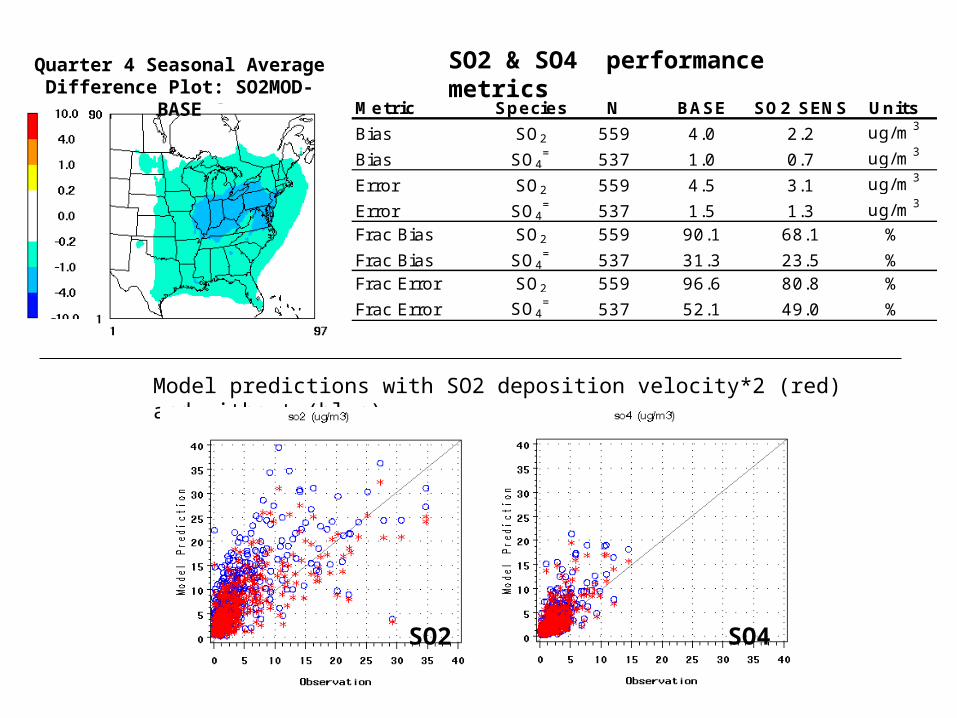
Quarter 4 Seasonal Average Difference Plot: SO2MOD-BASE
Model predictions with SO2 deposition velocity*2 (red) and without (blue)
SO2 & SO4 performance metrics
Metric Species N BASE SO2 SENS Units
Bias SO2 559 4.0 2.2 ug/m3
Bias SO4= 537 1.0 0.7 ug/m3
Error SO2 559 4.5 3.1 ug/m3
Error SO4= 537 1.5 1.3 ug/m3
Frac Bias SO2 559 90.1 68.1 %
Frac Bias SO4= 537 31.3 23.5 %
Frac Error SO2 559 96.6 80.8 %
Frac Error SO4= 537 52.1 49.0 %
SO2 SO4
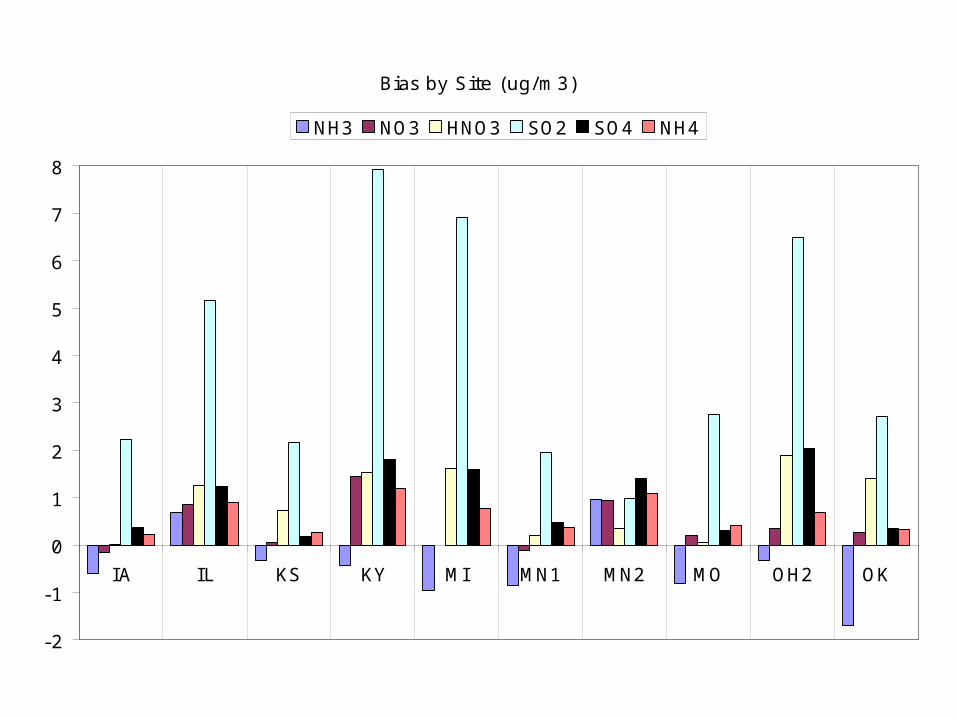
Bias by Site (ug/m3)
-2
-1
0
1
2
3
4
5
6
7
8
IA IL KS KY MI MN1 MN2 MO OH2 OK
NH3 NO3 HNO3 SO2 SO4 NH4