Phosphorylated Tau-Aβ42 Ratio as a Continuous Trait for .... Phosphorylated tau-Abeta42 ratio as...
9
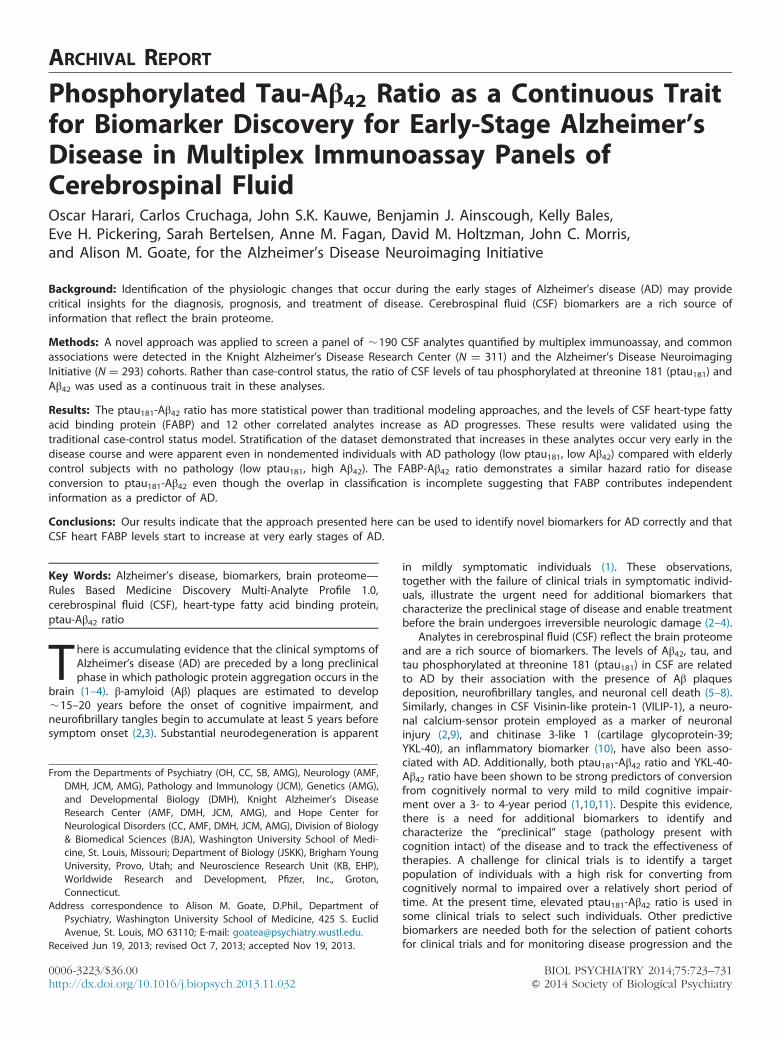
ARCHIVAL REPORT Phosphorylated Tau-Aβ 42 Ratio as a Continuous Trait for Biomarker Discovery for Early-Stage Alzheimer’s Disease in Multiplex Immunoassay Panels of Cerebrospinal Fluid Oscar Harari, Carlos Cruchaga, John S.K. Kauwe, Benjamin J. Ainscough, Kelly Bales, Eve H. Pickering, Sarah Bertelsen, Anne M. Fagan, David M. Holtzman, John C. Morris, and Alison M. Goate, for the Alzheimer’s Disease Neuroimaging Initiative Background: Identification of the physiologic changes that occur during the early stages of Alzheimer’s disease (AD) may provide critical insights for the diagnosis, prognosis, and treatment of disease. Cerebrospinal fluid (CSF) biomarkers are a rich source of information that reflect the brain proteome. Methods: A novel approach was applied to screen a panel of 190 CSF analytes quantified by multiplex immunoassay, and common associations were detected in the Knight Alzheimer’s Disease Research Center (N ¼ 311) and the Alzheimer’s Disease Neuroimaging Initiative (N ¼ 293) cohorts. Rather than case-control status, the ratio of CSF levels of tau phosphorylated at threonine 181 (ptau 181 ) and Aβ 42 was used as a continuous trait in these analyses. Results: The ptau 181 -Aβ 42 ratio has more statistical power than traditional modeling approaches, and the levels of CSF heart-type fatty acid binding protein (FABP) and 12 other correlated analytes increase as AD progresses. These results were validated using the traditional case-control status model. Stratification of the dataset demonstrated that increases in these analytes occur very early in the disease course and were apparent even in nondemented individuals with AD pathology (low ptau 181 , low Aβ 42 ) compared with elderly control subjects with no pathology (low ptau 181 , high Aβ 42 ). The FABP-Aβ 42 ratio demonstrates a similar hazard ratio for disease conversion to ptau 181 -Aβ 42 even though the overlap in classification is incomplete suggesting that FABP contributes independent information as a predictor of AD. Conclusions: Our results indicate that the approach presented here can be used to identify novel biomarkers for AD correctly and that CSF heart FABP levels start to increase at very early stages of AD. Key Words: Alzheimer’s disease, biomarkers, brain proteome— Rules Based Medicine Discovery Multi-Analyte Profile 1.0, cerebrospinal fluid (CSF), heart-type fatty acid binding protein, ptau-Aβ 42 ratio T here is accumulating evidence that the clinical symptoms of Alzheimer’s disease (AD) are preceded by a long preclinical phase in which pathologic protein aggregation occurs in the brain (1–4). β-amyloid (Aβ) plaques are estimated to develop 15–20 years before the onset of cognitive impairment, and neurofibrillary tangles begin to accumulate at least 5 years before symptom onset (2,3). Substantial neurodegeneration is apparent in mildly symptomatic individuals (1). These observations, together with the failure of clinical trials in symptomatic individ- uals, illustrate the urgent need for additional biomarkers that characterize the preclinical stage of disease and enable treatment before the brain undergoes irreversible neurologic damage (2–4). Analytes in cerebrospinal fluid (CSF) reflect the brain proteome and are a rich source of biomarkers. The levels of Aβ 42 , tau, and tau phosphorylated at threonine 181 (ptau 181 ) in CSF are related to AD by their association with the presence of Aβ plaques deposition, neurofibrillary tangles, and neuronal cell death (5–8). Similarly, changes in CSF Visinin-like protein-1 (VILIP-1), a neuro- nal calcium-sensor protein employed as a marker of neuronal injury (2,9), and chitinase 3-like 1 (cartilage glycoprotein-39; YKL-40), an inflammatory biomarker (10), have also been asso- ciated with AD. Additionally, both ptau 181 -Aβ 42 ratio and YKL-40- Aβ 42 ratio have been shown to be strong predictors of conversion from cognitively normal to very mild to mild cognitive impair- ment over a 3- to 4-year period (1,10,11). Despite this evidence, there is a need for additional biomarkers to identify and characterize the “preclinical” stage (pathology present with cognition intact) of the disease and to track the effectiveness of therapies. A challenge for clinical trials is to identify a target population of individuals with a high risk for converting from cognitively normal to impaired over a relatively short period of time. At the present time, elevated ptau 181 -Aβ 42 ratio is used in some clinical trials to select such individuals. Other predictive biomarkers are needed both for the selection of patient cohorts for clinical trials and for monitoring disease progression and the From the Departments of Psychiatry (OH, CC, SB, AMG), Neurology (AMF, DMH, JCM, AMG), Pathology and Immunology (JCM), Genetics (AMG), and Developmental Biology (DMH), Knight Alzheimer’s Disease Research Center (AMF, DMH, JCM, AMG), and Hope Center for Neurological Disorders (CC, AMF, DMH, JCM, AMG), Division of Biology & Biomedical Sciences (BJA), Washington University School of Medi- cine, St. Louis, Missouri; Department of Biology (JSKK), Brigham Young University, Provo, Utah; and Neuroscience Research Unit (KB, EHP), Worldwide Research and Development, Pfizer, Inc., Groton, Connecticut. Address correspondence to Alison M. Goate, D.Phil., Department of Psychiatry, Washington University School of Medicine, 425 S. Euclid Avenue, St. Louis, MO 63110; E-mail: [email protected]. Received Jun 19, 2013; revised Oct 7, 2013; accepted Nov 19, 2013. 0006-3223/$36.00 BIOL PSYCHIATRY 2014;75:723–731 http://dx.doi.org/10.1016/j.biopsych.2013.11.032 & 2014 Society of Biological Psychiatry
Transcript of Phosphorylated Tau-Aβ42 Ratio as a Continuous Trait for .... Phosphorylated tau-Abeta42 ratio as...
ARCHIVAL REPORT
Phosphorylated Tau-Aβ42 Ratio as a Continuous Traitfor Biomarker Discovery for Early-Stage Alzheimer’sDisease in Multiplex Immunoassay Panels ofCerebrospinal Fluid
Oscar Harari, Carlos Cruchaga, John S.K. Kauwe, Benjamin J. Ainscough, Kelly Bales,Eve H. Pickering, Sarah Bertelsen, Anne M. Fagan, David M. Holtzman, John C. Morris,and Alison M. Goate, for the Alzheimer’s Disease Neuroimaging InitiativeBackground: Identification of the physiologic changes that occur during the early stages of Alzheimer’s disease (AD) may providecritical insights for the diagnosis, prognosis, and treatment of disease. Cerebrospinal fluid (CSF) biomarkers are a rich source ofinformation that reflect the brain proteome.
Methods: A novel approach was applied to screen a panel of �190 CSF analytes quantified by multiplex immunoassay, and commonassociations were detected in the Knight Alzheimer’s Disease Research Center (N ¼ 311) and the Alzheimer’s Disease NeuroimagingInitiative (N ¼ 293) cohorts. Rather than case-control status, the ratio of CSF levels of tau phosphorylated at threonine 181 (ptau181) andAβ42 was used as a continuous trait in these analyses.
Results: The ptau181-Aβ42 ratio has more statistical power than traditional modeling approaches, and the levels of CSF heart-type fattyacid binding protein (FABP) and 12 other correlated analytes increase as AD progresses. These results were validated using thetraditional case-control status model. Stratification of the dataset demonstrated that increases in these analytes occur very early in thedisease course and were apparent even in nondemented individuals with AD pathology (low ptau181, low Aβ42) compared with elderlycontrol subjects with no pathology (low ptau181, high Aβ42). The FABP-Aβ42 ratio demonstrates a similar hazard ratio for diseaseconversion to ptau181-Aβ42 even though the overlap in classification is incomplete suggesting that FABP contributes independentinformation as a predictor of AD.
Conclusions: Our results indicate that the approach presented here can be used to identify novel biomarkers for AD correctly and thatCSF heart FABP levels start to increase at very early stages of AD.
Key Words: Alzheimer’s disease, biomarkers, brain proteome—Rules Based Medicine Discovery Multi-Analyte Profile 1.0,cerebrospinal fluid (CSF), heart-type fatty acid binding protein,ptau-Aβ42 ratio
There is accumulating evidence that the clinical symptoms ofAlzheimer’s disease (AD) are preceded by a long preclinicalphase in which pathologic protein aggregation occurs in the
brain (1–4). β-amyloid (Aβ) plaques are estimated to develop�15–20 years before the onset of cognitive impairment, andneurofibrillary tangles begin to accumulate at least 5 years beforesymptom onset (2,3). Substantial neurodegeneration is apparent
From the Departments of Psychiatry (OH, CC, SB, AMG), Neurology (AMF,DMH, JCM, AMG), Pathology and Immunology (JCM), Genetics (AMG),and Developmental Biology (DMH), Knight Alzheimer’s DiseaseResearch Center (AMF, DMH, JCM, AMG), and Hope Center forNeurological Disorders (CC, AMF, DMH, JCM, AMG), Division of Biology& Biomedical Sciences (BJA), Washington University School of Medi-cine, St. Louis, Missouri; Department of Biology (JSKK), Brigham YoungUniversity, Provo, Utah; and Neuroscience Research Unit (KB, EHP),Worldwide Research and Development, Pfizer, Inc., Groton,Connecticut.
Address correspondence to Alison M. Goate, D.Phil., Department ofPsychiatry, Washington University School of Medicine, 425 S. EuclidAvenue, St. Louis, MO 63110; E-mail: [email protected].
Received Jun 19, 2013; revised Oct 7, 2013; accepted Nov 19, 2013.
0006-3223/$36.00http://dx.doi.org/10.1016/j.biopsych.2013.11.032
in mildly symptomatic individuals (1). These observations,together with the failure of clinical trials in symptomatic individ-uals, illustrate the urgent need for additional biomarkers thatcharacterize the preclinical stage of disease and enable treatmentbefore the brain undergoes irreversible neurologic damage (2–4).
Analytes in cerebrospinal fluid (CSF) reflect the brain proteomeand are a rich source of biomarkers. The levels of Aβ42, tau, andtau phosphorylated at threonine 181 (ptau181) in CSF are relatedto AD by their association with the presence of Aβ plaquesdeposition, neurofibrillary tangles, and neuronal cell death (5–8).Similarly, changes in CSF Visinin-like protein-1 (VILIP-1), a neuro-nal calcium-sensor protein employed as a marker of neuronalinjury (2,9), and chitinase 3-like 1 (cartilage glycoprotein-39;YKL-40), an inflammatory biomarker (10), have also been asso-ciated with AD. Additionally, both ptau181-Aβ42 ratio and YKL-40-Aβ42 ratio have been shown to be strong predictors of conversionfrom cognitively normal to very mild to mild cognitive impair-ment over a 3- to 4-year period (1,10,11). Despite this evidence,there is a need for additional biomarkers to identify andcharacterize the “preclinical” stage (pathology present withcognition intact) of the disease and to track the effectiveness oftherapies. A challenge for clinical trials is to identify a targetpopulation of individuals with a high risk for converting fromcognitively normal to impaired over a relatively short period oftime. At the present time, elevated ptau181-Aβ42 ratio is used insome clinical trials to select such individuals. Other predictivebiomarkers are needed both for the selection of patient cohortsfor clinical trials and for monitoring disease progression and the
BIOL PSYCHIATRY 2014;75:723–731& 2014 Society of Biological Psychiatry

724 BIOL PSYCHIATRY 2014;75:723–731 O. Harari et al.
success of disease-modifying treatment outcomes. Ultimately,biomarkers will enable early intervention in individuals beforethey present with symptoms, with the goal of delaying the onsetor preventing the cognitive decline seen in AD before the brain isirreversibly injured (2).
Two features of AD result in misclassification of subjects andseverely reduce the power of traditional clinical measures in thesearch for novel biomarkers: 1) 30% of cognitively normalindividuals show Alzheimer’s-type neuropathology by age 75years (2,3,12,13), and 2) current clinical diagnostic methods areonly 83% accurate as defined by neuropathologic confirmation atautopsy (14). To identify new CSF analytes associated with AD, wetook a novel approach by developing a quantitative measure of“caseness,” employing the CSF ptau181-Aβ42 ratio as an endo-phenotype for AD. This status-independent criterion avoids themisclassification of controls and cases and is a continuousquantitative trait. Both of these characteristics improve the powerof this approach over traditional clinical measures.
Methods and Materials
SubjectsIn participants enrolled in the Knight Alzheimer’s Disease
Research Center (Knight-ADRC; N ¼ 311), diagnosis was basedon criteria from the National Institute of Neurological andCommunicative Diseases and Stroke-Alzheimer’s Disease andRelated Disorders Association (15). The procedure for collection,processing, and assessment of CSF is described elsewhere (11,16).Data for subjects included in the Alzheimer’s Disease Neuro-imaging Initiative (ADNI; N = 292) were accessed from the ADNIwebsite (see Supplementary Methods and Table S1 inSupplement 1) (8). Processing, aliquoting, and storage wereperformed according to the ADNI Biomarker Core LaboratoryStandard Operating Procedures (http://adni.loni.ucla.edu). Addi-tional details for these two studies are provided elsewhere(10,17). Genotyping of rs7412 and rs429358, which define theapolipoprotein E (APOE) ε2, ε3, and ε4 isoforms, was previouslydescribed (17,18).
Expression studies were carried out using complementaryDNA obtained from the parietal lobe from 82 participants withAD (86 � 7 years old, 45% male, and 41% APOE ε4 carriers) and39 cognitively normal individuals (85 � 9 years old, 41% male,and 23% APOE ε4 carriers) obtained through the Knight-ADRCNeuropathology Core. Real-time data were analyzed using thecomparative Ct method (19) (see Supplementary Methods inSupplement 1).
Analyte MeasurementThe samples from both the Knight-ADRC and the ADNI were
evaluated by Rules Based Medicine, Inc. (Austin, Texas) for levelsof 190 analytes using the Human Discovery Multi-Analyte Profile(MAP) 1.0 panel and a Luminex 100 platform (Luminex Corpo-ration, Austin, Texas). Only analytes with �10% missing values ineach study were analyzed. The protocol used to quantify plasmaanalytes is described elsewhere (20,21).
For the Knight-ADRC participants, CSF Aβ42 and phospho-tau181 (ptau181) levels were obtained in duplicate by theKnight-ADRC Biomarker Core by quantitative enzyme-linkedimmunosorbent assay (Innotest; Innogenetics, Ghent, Belgium)(16). Quantification of CSF VILIP-1 and YKL-40 is describedelsewhere (9,10). For the ADNI participants, the CSF Aβ42 and
www.sobp.org/journal
ptau181 levels were measured using the multiplex xMAP Luminexplatform as described (8).
Statistical AnalysisThe analyses were performed in R (The R Foundation for
Statistical Computing v2.14.1). Analytes were log-transformed toapproximate a normal distribution, and outliers were removed.The associations with the CSF ptau181-Aβ42 ratio were testedusing linear regression models, adjusting for age at lumbarpuncture (LP); sex; and APOE genotype, encoded as five levelsbased on the genetic risk (ε22 ¼ 0; ε23 ¼ 1; ε33 ¼ 2; ε24 ¼ 3; ε34¼ 4; and ε44 ¼ 5). For analyses using the combined datasets, weincluded study as a covariate. We used two approaches to correctfor the multiple testing associated with examining 64 analytes:Bonferroni correction and simpleM. For 64 tests, the Bonferronicorrected p value corresponding to p ¼ .05 is p ¼ 7.81E-04.Because this method is most likely too conservative given thecorrelation structure of the analyte measurements, we alsoextended and applied the simpleM method (22) (see Supplemen-tary Methods in Supplement 1) and obtained corrected p values(p ¼ 1.39E-03 and p ¼ 1.43E-03) for the Knight-ADRC and theADNI studies, respectively. Logistic regression was used to test forassociation with Clinical Dementia Rating (CDR; CDR ¼ 0 vs. CDR� 0), adjusting for the above-mentioned covariates. Kaplan-Meiersurvival curves were calculated employing the function survfit,and the Cox proportional hazard regression models were testedusing the function coxph (package survival, v2.36-10). The Coxproportional hazard tests were adjusted by age, sex, APOEgenotype, and study. Hierarchical clustering was calculated usingthe complete linkage method provided (function hclust), andheatmaps were plotted using the function heatmap.2 (packagegplots, v2.10.1). Multivariate stepwise model selection (Table 1A,B)was performed using the function stepAIC (package MASS, v7.3-16), optimizing for the Bayesian information criterion, andincluded age, sex, and APOE genotype as fixed covariates. Theminimal multivariate model shown in Table 1C was obtained byselecting the subset of analytes identified as significant in eachstudy (Table 1A,B). We constrained this list to the analytes thatwere also significant (p � 5.0E-2) when the identified modelswere applied to the other study. The principal component analysiswas performed in R running the method prcomp (package stats,v2.14.1). The random forest results were obtained executing thefunction randomForest (implemented in the package random-Forest, v4.6-6) to grow 1000 trees, and the importance measurewas calculated by the mean decrease in accuracy.
Results
CSF ptau181-Aβ42 Ratio Confers More Statistical Power toIdentify CSF Analytes Associated with AD
We first evaluated the statistical power of the CSF ptau181-Aβ42ratio measure compared with the CDR at LP, using CSF levels ofVILIP-1 (9) and YKL-40 (10), which had previously been measuredand shown to be associated with CDR and CDR–sum of boxes inthe Knight-ADRC study (11,20,23). The CSF ptau181-Aβ42 ratio waspreviously shown to be a strong predictor of both the conversionof cognitively normal subjects to very mild or mild dementia (11)and the rate of decline across time in individuals with very milddementia (24). The CSF ptau181-Aβ42 ratio is strongly associatedwith CDR at LP (p ¼ 5.05E-16).
We employed linear regression models to analyze the associ-ation of CSF VILIP-1 with the log-transformed levels of CSF

Table 1. Multivariate models
(A) Inferred Knight-ADRC Model Replication on ADNI
p Value Effect p Value Effect
H-FABP 3.18E-08 .44 1.74E-11 .47VEGF 1.01E-05 �.63 1.85E-04 �.66TNF RII 8.56E-04 .63 1.08E-01 .22Thrombomodulin 2.03E-03 �.37 1.01E-03 �.39ACE 2.25E-03 �.36 8.66E-01 �.02Adiponectin 2.29E-03 .17 7.98E-03 .23HGF 2.69E-03 .51 5.60E-08 .60MIF 3.30E-03 .33 5.88E-04 .16SAP 4.26E-03 �.21 9.67E-01 .00CXCL9 8.17E-03 �.14 9.23E-01 �.01FasL 1.12E-02 .21 2.95E-01 �.10Age 1.33E-01 .01 3.17E-01 �.01Sex 4.84E-01 �.05 3.57E-01 �.07APOE Genotypes 2.80E-07 .14 3.64E-11 .19R Squared/BIC .50/�323.91 .56/�222.42.68
(B)Replication on Knight-ADRC Inferred ADNI Model
p Value Effect p Value EffectH-FABP 2.50E-09 .44 5.06E-16 .50HGF 2.39E-02 .37 2.19E-11 .68VEGF 1.65E-04 �.60 4.99E-06 �.68Complement 3 7.57E-01 �.03 2.62E-05 �.63ANGPT2 4.04E-01 .12 2.10E-04 .41APOA 1.13E-02 �.26 2.58E-04 .39MIF 2.08E-02 .33 6.71E-04 .14Fibrinogen 2.02E-01 .09 1.73E-03 �.12Prolactin 6.80E-01 �.04 9.88E-03 �.26TRAIL.R3 8.13E-01 .04 1.70E-02 �.28Sex 4.96E-01 .05 8.60E-01 �.01Age 7.24E-03 .01 9.89E-01 .00APOE Genotypes 7.90E-08 .16 6.16E-17 .22
R Squared/BIC .44/�296.91 .60/�370.60
(C)Knight-ADRC ADNI
p Value Effect p Value EffectH-FABP 6.44E-10 .45 1.87E-14 .50HGF 3.25E-02 .33 5.93E-09 .51MIF 6.27E-04 .40 3.11E-04 .16VEGF 3.47E-05 �.59 1.32E-06 �.66Age 6.78E-03 .01 3.51E-01 .00Sex 3.27E-01 .06 9.73E-01 .00APOE Genotypes 9.46E-09 .16 1.44E-14 .21R Squared/BIC .42/�336.92 .53/�360.04
Stepwise optimization in (A) the Knight-ADRC study and (B) the ADNIstudy. (C) A minimal model that includes the analytes commonly selectedin the Knight-ADRC study and the ADNI study.
ACE, angiotensinogen; ADNI, Alzheimer’s Disease Neuroimaging Initia-tive; ANGPT2, angiopoietin 2; APOA, apolipoprotein A; CXCL9, CXC motifchemokine ligand 9'; FasL, Fas ligand; H-FABP, heart, fatty acid bindingprotein; HGF, hepatocyte growth factor; Knight-ADRC, Knight Alzheimer’sDisease Research Center; MIF, macrophage migration inhibitory factor;SAP, serum amyloid P; TNFRII, tumor necrosis factor receptor two; TRAILR3,TRAIL receptor 3; VEGF, vascular endothelial growth factor.
O. Harari et al. BIOL PSYCHIATRY 2014;75:723–731 725
ptau181-Aβ42 ratio and observed a much stronger association thanwith CDR (p ¼ 3.18E-17 vs. p ¼ 3.80E-05). The CSF ptau181-Aβ42ratio remained more powerful than CDR even when converted toa dichotomous variable using two partitioning criteria. First, wesplit the subjects by the median value of CSF ptau181-Aβ42 ratio;second, we compared the subjects from the upper tercile to the
lower two terciles (intended to resemble the CDR distribution ofthe Knight-ADRC series). Both logistic models that included theCSF ratio showed much stronger associations (p ¼ 7.11E-08 andp ¼ 4.00E-09, respectively) than the CDR model (p ¼ 3.80E-05).
Similarly, the association of YKL-40 with the CSF ptau181-Aβ42ratio was stronger than CDR (p ¼ 8.99E-09 vs. p ¼ 7.76E-04,respectively). We also tested the normal quantile transformed CSFratio and the same two dichotomous representations for YKL-40.In every case, the test that included the CSF ratio was morestatistically significant than the CDR model (p ¼ 9.42E-06 and p ¼3.04E-05 partitioning by the median tercile and by the uppertercile, respectively). Together, these analyses provide a strongrationale for our subsequent use of the CSF ptau181-Aβ42 ratio fornovel biomarker discovery.
Correlation Structure of CSF Analytes. We applied stringentquality criteria to the CSF analyte measurements, selecting onlyanalytes that were measurable in �90% of the subjects in eachseries (N ¼ 311 for the Knight-ADRC series and N ¼ 293 for theADNI series). This criterion was met by 64 CSF analytes.
Analysis of the correlation matrix for the combined measure-ments of both datasets showed clear patterns in the analytelevels (Table S2 in Supplement 2). The hierarchical clusteringmethod identified 10 clusters containing 48 of the CSF analytes,with a within-cluster correlation r2 � .50. Six clusters included 2analytes, and the other four clusters included 3, 4, 9, and 20analytes (Figure S1 in Supplement 1). The remaining 16 CSFanalytes showed only weak correlations to other analytes in thedataset (mean r2 ¼ .16, and maximum r2 ¼ .35).
CSF Analytes Associated with ptau181-Aβ42 Ratio. Next, wetested for association between each of the CSF analytes and theptau181-Aβ42 ratio. There were 13 analytes that were significantlyassociated with the CSF ptau181-Aβ42 ratio (p � 1.0E-3) andexhibited the same direction of effect in the Knight-ADRC and theADNI series (Table 2; see Table S3 in Supplement 1 for thecomplete list of the analytes evaluated). Of these CSF analytes, 11showed a mean r2 ¼ .58 with each other (Figure 1), whereas theother two, Sortilin (SORT1) and tumor necrosis factor–relatedapoptosis-inducing ligand R3 (TRAIL-R3), exhibited a slightly lowercorrelation (r2 ¼ .49 and r2 ¼ .48, respectively) (Figure 1).
In both series, CSF heart-type fatty acid binding protein (H-FABP)was the most significantly associated analyte (p ¼ 4.77E-18 forKnight-ADRC and p ¼ 7.40E-18 for ADNI) and was associated withhigher levels of H-FABP in individuals with CSF ptau181-Aβ42 ratiosindicative of AD (Figure 2A). The regression coefficients for the twostudies (Table 2) did not differ significantly (F test p ¼ .24).
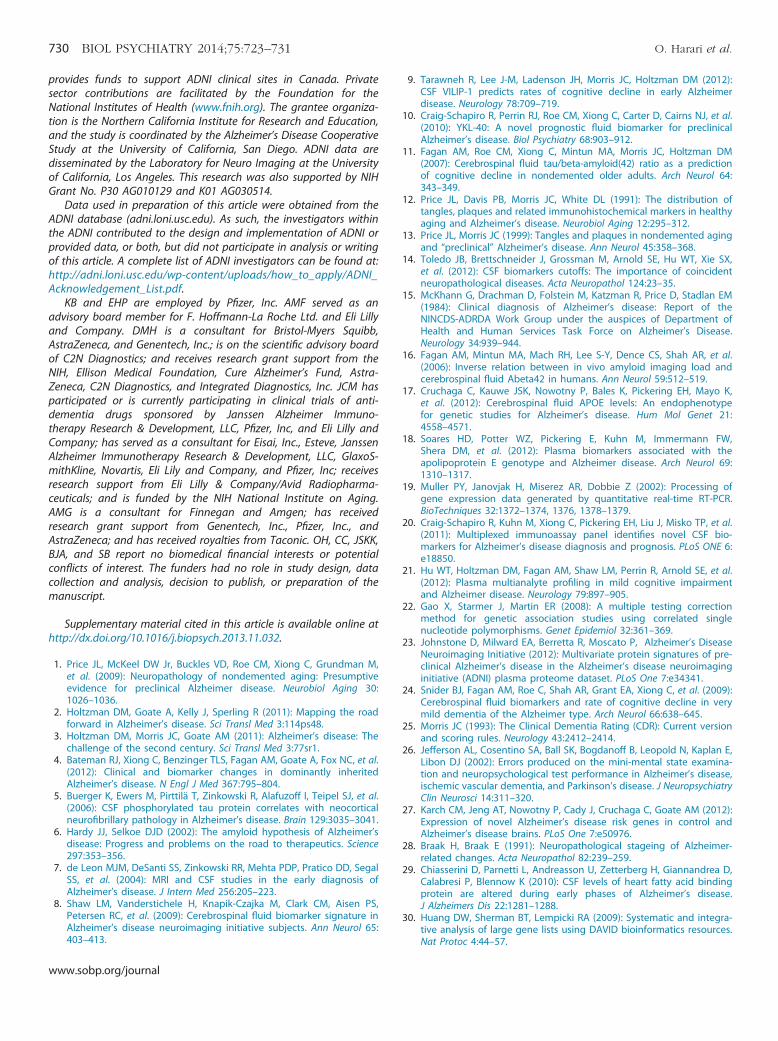
To investigate whether these associations were apparent inindividuals without dementia and individuals with dementia, wecombined the subjects from both studies and stratified them bythe presence or absence of cognitive impairment. There were 236subjects with a CDR � 0 and low CSF Aβ42 levels, which weemployed as a proxy for brain Aβ42 deposition (16) (cutoff ¼500 pg/mL for the Knight-ADRC study and 192 pg/mL for theADNI study). To evaluate the impact of Aβ42 deposition, wefurther stratified the 300 cognitively normal subjects (CDR ¼ 0) byCSF Aβ42 levels, distinguishing the 192 “clean” controls from the105 preclinical subjects with lower CSF Aβ42 levels. Each of the 13CSF analytes was significantly associated (p � 5.0E-4) in everystratum (Table 3). The analysis of covariance analysis revealed thatthe effect size for CSF H-FABP was significantly lower in controlscompared with the inferred preclinical and clinically assessedcognitively impaired individuals (p ¼ 4.44E-04 and p ¼ 5.87E-03)and that there was no significant difference in the effect observedin the preclinical and symptomatic cases (Figure 3); this is
www.sobp.org/journal
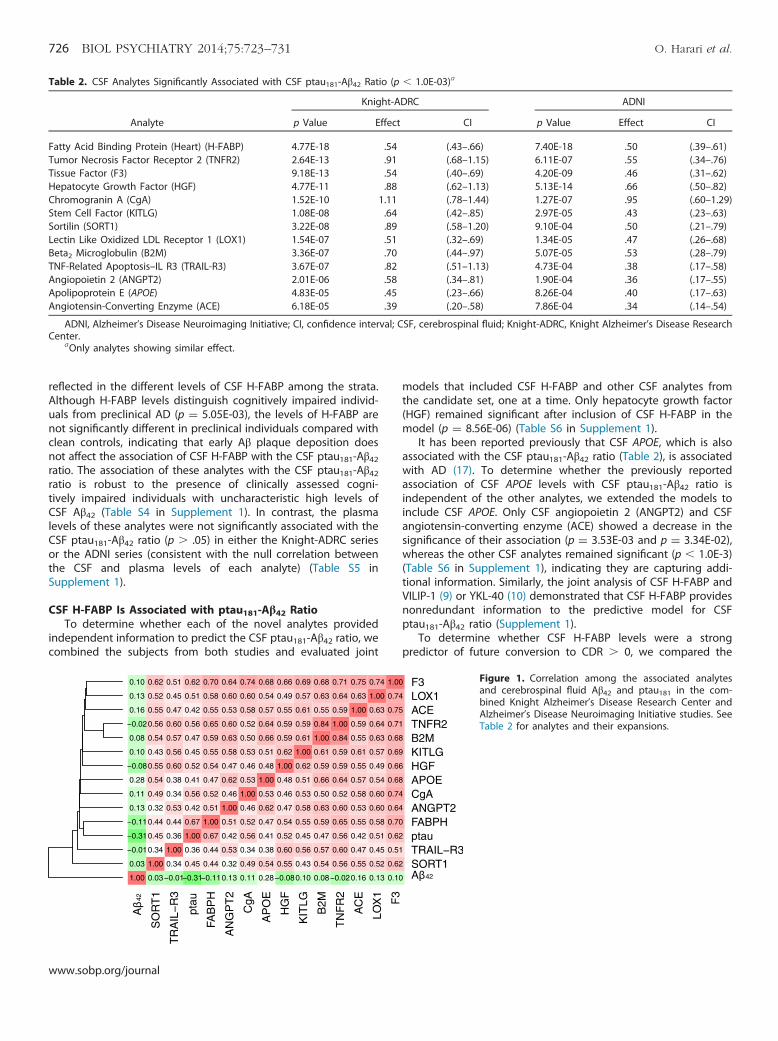
Table 2. CSF Analytes Significantly Associated with CSF ptau181-Aβ42 Ratio (p � 1.0E-03)a
Analyte
Knight-ADRC ADNI
p Value Effect CI p Value Effect CI
Fatty Acid Binding Protein (Heart) (H-FABP) 4.77E-18 .54 (.43–.66) 7.40E-18 .50 (.39–.61)Tumor Necrosis Factor Receptor 2 (TNFR2) 2.64E-13 .91 (.68–1.15) 6.11E-07 .55 (.34–.76)Tissue Factor (F3) 9.18E-13 .54 (.40–.69) 4.20E-09 .46 (.31–.62)Hepatocyte Growth Factor (HGF) 4.77E-11 .88 (.62–1.13) 5.13E-14 .66 (.50–.82)Chromogranin A (CgA) 1.52E-10 1.11 (.78–1.44) 1.27E-07 .95 (.60–1.29)Stem Cell Factor (KITLG) 1.08E-08 .64 (.42–.85) 2.97E-05 .43 (.23–.63)Sortilin (SORT1) 3.22E-08 .89 (.58–1.20) 9.10E-04 .50 (.21–.79)Lectin Like Oxidized LDL Receptor 1 (LOX1) 1.54E-07 .51 (.32–.69) 1.34E-05 .47 (.26–.68)Beta2 Microglobulin (B2M) 3.36E-07 .70 (.44–.97) 5.07E-05 .53 (.28–.79)TNF-Related Apoptosis–IL R3 (TRAIL-R3) 3.67E-07 .82 (.51–1.13) 4.73E-04 .38 (.17–.58)Angiopoietin 2 (ANGPT2) 2.01E-06 .58 (.34–.81) 1.90E-04 .36 (.17–.55)Apolipoprotein E (APOE) 4.83E-05 .45 (.23–.66) 8.26E-04 .40 (.17–.63)Angiotensin-Converting Enzyme (ACE) 6.18E-05 .39 (.20–.58) 7.86E-04 .34 (.14–.54)
ADNI, Alzheimer’s Disease Neuroimaging Initiative; CI, confidence interval; CSF, cerebrospinal fluid; Knight-ADRC, Knight Alzheimer’s Disease ResearchCenter.
aOnly analytes showing similar effect.
726 BIOL PSYCHIATRY 2014;75:723–731 O. Harari et al.
reflected in the different levels of CSF H-FABP among the strata.Although H-FABP levels distinguish cognitively impaired individ-uals from preclinical AD (p ¼ 5.05E-03), the levels of H-FABP arenot significantly different in preclinical individuals compared withclean controls, indicating that early Aβ plaque deposition doesnot affect the association of CSF H-FABP with the CSF ptau181-Aβ42ratio. The association of these analytes with the CSF ptau181-Aβ42ratio is robust to the presence of clinically assessed cogni-tively impaired individuals with uncharacteristic high levels ofCSF Aβ42 (Table S4 in Supplement 1). In contrast, the plasmalevels of these analytes were not significantly associated with theCSF ptau181-Aβ42 ratio (p � .05) in either the Knight-ADRC seriesor the ADNI series (consistent with the null correlation betweenthe CSF and plasma levels of each analyte) (Table S5 inSupplement 1).
CSF H-FABP Is Associated with ptau181-Aβ42 RatioTo determine whether each of the novel analytes provided
independent information to predict the CSF ptau181-Aβ42 ratio, wecombined the subjects from both studies and evaluated joint
www.sobp.org/journal
models that included CSF H-FABP and other CSF analytes fromthe candidate set, one at a time. Only hepatocyte growth factor(HGF) remained significant after inclusion of CSF H-FABP in themodel (p ¼ 8.56E-06) (Table S6 in Supplement 1).
It has been reported previously that CSF APOE, which is alsoassociated with the CSF ptau181-Aβ42 ratio (Table 2), is associatedwith AD (17). To determine whether the previously reportedassociation of CSF APOE levels with CSF ptau181-Aβ42 ratio isindependent of the other analytes, we extended the models toinclude CSF APOE. Only CSF angiopoietin 2 (ANGPT2) and CSFangiotensin-converting enzyme (ACE) showed a decrease in thesignificance of their association (p ¼ 3.53E-03 and p ¼ 3.34E-02),whereas the other CSF analytes remained significant (p � 1.0E-3)(Table S6 in Supplement 1), indicating they are capturing addi-tional information. Similarly, the joint analysis of CSF H-FABP andVILIP-1 (9) or YKL-40 (10) demonstrated that CSF H-FABP providesnonredundant information to the predictive model for CSFptau181-Aβ42 ratio (Supplement 1).
To determine whether CSF H-FABP levels were a strongpredictor of future conversion to CDR � 0, we compared the
Figure 1. Correlation among the associated analytesand cerebrospinal fluid Aβ42 and ptau181 in the com-bined Knight Alzheimer’s Disease Research Center andAlzheimer’s Disease Neuroimaging Initiative studies. SeeTable 2 for analytes and their expansions.
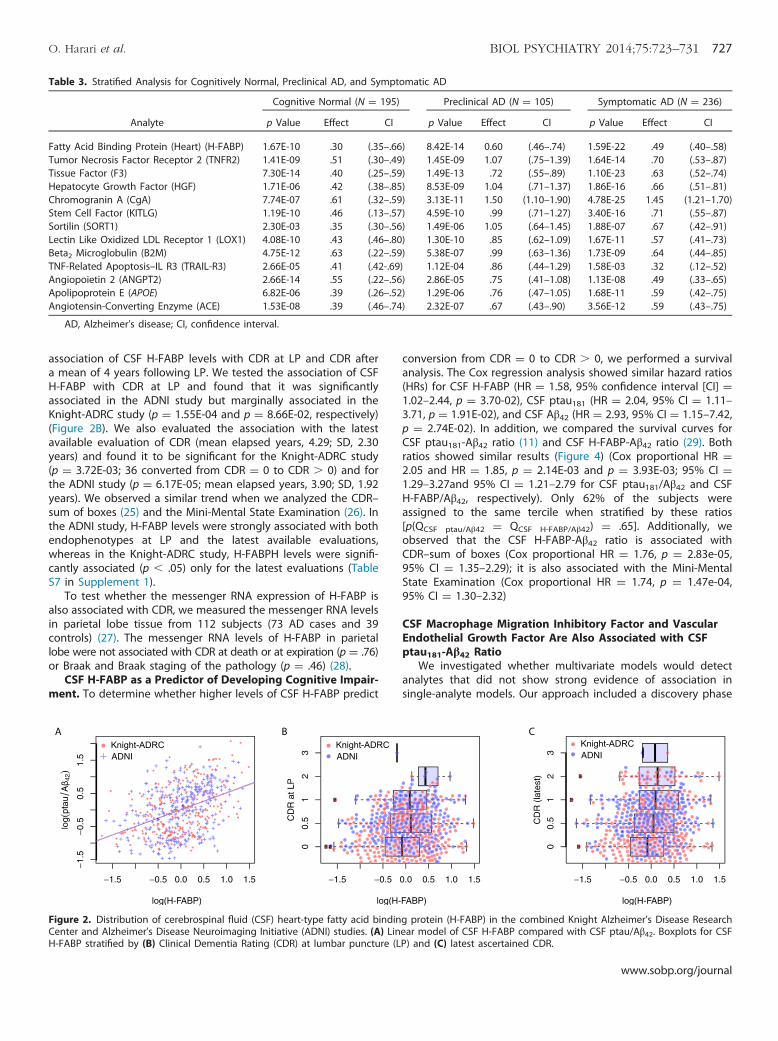
Table 3. Stratified Analysis for Cognitively Normal, Preclinical AD, and Symptomatic AD
Analyte
Cognitive Normal (N ¼ 195) Preclinical AD (N ¼ 105) Symptomatic AD (N ¼ 236)
p Value Effect CI p Value Effect CI p Value Effect CI
Fatty Acid Binding Protein (Heart) (H-FABP) 1.67E-10 .30 (.35–.66) 8.42E-14 0.60 (.46–.74) 1.59E-22 .49 (.40–.58)Tumor Necrosis Factor Receptor 2 (TNFR2) 1.41E-09 .51 (.30–.49) 1.45E-09 1.07 (.75–1.39) 1.64E-14 .70 (.53–.87)Tissue Factor (F3) 7.30E-14 .40 (.25–.59) 1.49E-13 .72 (.55–.89) 1.10E-23 .63 (.52–.74)Hepatocyte Growth Factor (HGF) 1.71E-06 .42 (.38–.85) 8.53E-09 1.04 (.71–1.37) 1.86E-16 .66 (.51–.81)Chromogranin A (CgA) 7.74E-07 .61 (.32–.59) 3.13E-11 1.50 (1.10–1.90) 4.78E-25 1.45 (1.21–1.70)Stem Cell Factor (KITLG) 1.19E-10 .46 (.13–.57) 4.59E-10 .99 (.71–1.27) 3.40E-16 .71 (.55–.87)Sortilin (SORT1) 2.30E-03 .35 (.30–.56) 1.49E-06 1.05 (.64–1.45) 1.88E-07 .67 (.42–.91)Lectin Like Oxidized LDL Receptor 1 (LOX1) 4.08E-10 .43 (.46–.80) 1.30E-10 .85 (.62–1.09) 1.67E-11 .57 (.41–.73)Beta2 Microglobulin (B2M) 4.75E-12 .63 (.22–.59) 5.38E-07 .99 (.63–1.36) 1.73E-09 .64 (.44–.85)TNF-Related Apoptosis–IL R3 (TRAIL-R3) 2.66E-05 .41 (.42-.69) 1.12E-04 .86 (.44–1.29) 1.58E-03 .32 (.12–.52)Angiopoietin 2 (ANGPT2) 2.66E-14 .55 (.22–.56) 2.86E-05 .75 (.41–1.08) 1.13E-08 .49 (.33–.65)Apolipoprotein E (APOE) 6.82E-06 .39 (.26–.52) 1.29E-06 .76 (.47–1.05) 1.68E-11 .59 (.42–.75)Angiotensin-Converting Enzyme (ACE) 1.53E-08 .39 (.46–.74) 2.32E-07 .67 (.43–.90) 3.56E-12 .59 (.43–.75)
AD, Alzheimer’s disease; CI, confidence interval.
O. Harari et al. BIOL PSYCHIATRY 2014;75:723–731 727
association of CSF H-FABP levels with CDR at LP and CDR aftera mean of 4 years following LP. We tested the association of CSFH-FABP with CDR at LP and found that it was significantlyassociated in the ADNI study but marginally associated in theKnight-ADRC study (p ¼ 1.55E-04 and p ¼ 8.66E-02, respectively)(Figure 2B). We also evaluated the association with the latestavailable evaluation of CDR (mean elapsed years, 4.29; SD, 2.30years) and found it to be significant for the Knight-ADRC study(p ¼ 3.72E-03; 36 converted from CDR ¼ 0 to CDR � 0) and forthe ADNI study (p ¼ 6.17E-05; mean elapsed years, 3.90; SD, 1.92years). We observed a similar trend when we analyzed the CDR–sum of boxes (25) and the Mini-Mental State Examination (26). Inthe ADNI study, H-FABP levels were strongly associated with bothendophenotypes at LP and the latest available evaluations,whereas in the Knight-ADRC study, H-FABPH levels were signifi-cantly associated (p � .05) only for the latest evaluations (TableS7 in Supplement 1).
To test whether the messenger RNA expression of H-FABP isalso associated with CDR, we measured the messenger RNA levelsin parietal lobe tissue from 112 subjects (73 AD cases and 39controls) (27). The messenger RNA levels of H-FABP in parietallobe were not associated with CDR at death or at expiration (p ¼ .76)or Braak and Braak staging of the pathology (p ¼ .46) (28).
CSF H-FABP as a Predictor of Developing Cognitive Impair-ment. To determine whether higher levels of CSF H-FABP predict
Figure 2. Distribution of cerebrospinal fluid (CSF) heart-type fatty acid bindinCenter and Alzheimer’s Disease Neuroimaging Initiative (ADNI) studies. (A) LinH-FABP stratified by (B) Clinical Dementia Rating (CDR) at lumbar puncture (L
conversion from CDR ¼ 0 to CDR � 0, we performed a survivalanalysis. The Cox regression analysis showed similar hazard ratios(HRs) for CSF H-FABP (HR ¼ 1.58, 95% confidence interval [CI] ¼1.02–2.44, p ¼ 3.70-02), CSF ptau181 (HR ¼ 2.04, 95% CI ¼ 1.11–3.71, p ¼ 1.91E-02), and CSF Aβ42 (HR ¼ 2.93, 95% CI ¼ 1.15–7.42,p ¼ 2.74E-02). In addition, we compared the survival curves forCSF ptau181-Aβ42 ratio (11) and CSF H-FABP-Aβ42 ratio (29). Bothratios showed similar results (Figure 4) (Cox proportional HR ¼2.05 and HR ¼ 1.85, p ¼ 2.14E-03 and p ¼ 3.93E-03; 95% CI ¼1.29–3.27and 95% CI ¼ 1.21–2.79 for CSF ptau181/Aβ42 and CSFH-FABP/Aβ42, respectively). Only 62% of the subjects wereassigned to the same tercile when stratified by these ratios[p(QCSF ptau/Aβ42 ¼ QCSF H-FABP/Aβ42) ¼ .65]. Additionally, weobserved that the CSF H-FABP-Aβ42 ratio is associated withCDR–sum of boxes (Cox proportional HR ¼ 1.76, p ¼ 2.83e-05,95% CI ¼ 1.35–2.29); it is also associated with the Mini-MentalState Examination (Cox proportional HR ¼ 1.74, p ¼ 1.47e-04,95% CI ¼ 1.30–2.32)
CSF Macrophage Migration Inhibitory Factor and VascularEndothelial Growth Factor Are Also Associated with CSFptau181-Aβ42 Ratio
We investigated whether multivariate models would detectanalytes that did not show strong evidence of association insingle-analyte models. Our approach included a discovery phase
g protein (H-FABP) in the combined Knight Alzheimer’s Disease Researchear model of CSF H-FABP compared with CSF ptau/Aβ42. Boxplots for CSFP) and (C) latest ascertained CDR.
www.sobp.org/journal

Figure 3. Distribution of cerebrospinal fluid heart-type fatty acid binding protein (H-FABP), ptau181, and Aβ42 stratified by the cognitive status of thesubjects (cognitive normal, preclinical, and cognitive decline) in the combined Knight Alzheimer’s Disease Research Center and the Alzheimer’s DiseaseNeuroimaging Initiative studies. AD, Alzheimer’s disease.
728 BIOL PSYCHIATRY 2014;75:723–731 O. Harari et al.
in which we made use of stepwise regression analysis to optimizea multivariate model for the CSF ptau181-Aβ42 ratio in one of thedatasets, which was followed by a replication phase, in which themodel was applied in the second dataset.
The multivariate model optimized for the Knight-ADRC dataset(Table 1A) showed an increased R2 (.14 for the discovery set and.12 for the ADNI study). It included H-FABP and HGF as well as CSFvascular endothelial growth factor (VEGF), macrophage migrationinhibitory factor (MIF), thrombomodulin, and adiponectin(Table 1A). The model optimized for the ADNI dataset(Table 1B) also increased the R2 for both datasets (.20 and .08for the ADNI and the Knight-ADRC dataset, respectively). Thismodel also selected H-FABP, HGF, VEGF, and MIF. We constructeda multivariate model with these four analytes and observed thatall of them remained significantly associated with the CSFptau181-Aβ42 ratio in the two datasets (Table 1C), reflecting anincreased goodness of fit for the model (increment of R2 ¼ .08 forthe Knight-ADRC dataset and increment of R2 ¼ .09 for the ADNIdataset). To evaluate whether the correlation among the analytesproduced spurious results, we applied principal componentanalysis to these selected analytes and evaluated a multivariate
Figure 4. Kaplan-Meier (solid lines) and Cox survival (dashed lines) curves fcerebrospinal fluid (CSF) ptau181/Aβ42 and CSF heart-type fatty acid binding profor CSF ptau-Aβ42 ratios converted after 5 years compared with 23.18% and 278.69%, 10.92%, and 34.78% of the subjects within the lower, intermediate, an
www.sobp.org/journal
model with the values rotated. We found that all of themremained significant (p � .05), indicating that these analytesprovide additional information regardless of their correlation.
In the single-analyte analysis, CSF MIF levels show a trendtoward association with the CSF ptau181-Aβ42 ratio (Table S3 inSupplement 1). Although CSF VEGF is mildly positively associatedin the single-analyte analysis (Table S3 in Supplement 1), it has anegative effect in the multivariate model. The stratified analysisrevealed that the change of direction occurs only in the cases(Figure S2 in Supplement 1).
The random forest method was also used to analyze thesedatasets, and it also highlighted the importance of H-FABP, MIF,HGF, and VEGF. These analytes are among the top six for the Knight-ADRC dataset. The analytes H-FABP, HGF, and MIF are among thetop eight analytes for the ADNI dataset (Table S8 in Supplement 1).
Discussion
The goal of this study was to identify novel CSF biomarkers forAD using a discovery dataset collected by the Knight-ADRC studyand a replication cohort ascertained by the ADNI. Although the
or the conversion (Clinical Dementia Rating [CDR] ¼ 0 to CDR � 0) fortein (H-FABP)/Aβ42. (A) Only 7.46% of the subjects within the lowest tercile.14% of the subjects in the intermediate and higher terciles. (B) Similarly,d higher terciles of CSF H-FABP/Aβ42 values had converted after 5 years.

O. Harari et al. BIOL PSYCHIATRY 2014;75:723–731 729
ascertainment and structure of the datasets are quite different,we were able to identify several biomarkers that showedconsistent effects across the two datasets. The Rules BasedMedicine Discovery Multi-Analyte Profile 1.0 panel includes 64analytes that are not totally independent of one another. We usedthe correlation structure of these analytes to approximate thenumber of independent tests and consequently used this numberto adjust our p values for multiple testing. We employed thisinformation to understand the apparent excess of analytesassociated with the CSF ptau181-Aβ42 ratio.
A novel feature of our study is the use of the CSF ptau181-Aβ42ratio as the outcome variable in our analyses rather thancomparing the levels of the test analytes in cases versus controls.The CSF ptau181-Aβ42 ratio provides several key advantages overthe more traditional approach. It captures the progression of thedisease before the onset of clinical symptoms by correcting themisclassification of control subjects with Aβ plaques. In addition,this method correctly assigns individuals with clinical dementiawho do not have AD. In a traditional analysis, these individualswould be included as cases, but they are analyzed as non-ADdementias when using the ptau181-Aβ42 ratio. We believe thateach of these factors contributes to the gain in statistical power ofthe CSF ptau181-Aβ42 ratio that we observed comparing itsperformance with the usual case-control model in the evaluationof the CSF levels of VILIP-1 and YKL-40.
The analytes associated with the CSF ptau181-Aβ42 ratio werecorrelated with CSF ptau181 but not Aβ42 (Figure 1), indicating thatthey do not reflect the very early Aβ-related events in the develop-ment of the disease, but they do discriminate between preclinicaland symptomatic AD. Query of the Database for Annotation,Visualization, and Integrated Discovery (30) failed to identify anypathway that characterized the candidate set of analytes.
The CSF levels of H-FABP, the most significant analyte, wereconsistently associated with the ptau181-Aβ42 ratio in both theKnight-ADRC and the ADNI datasets, even when the modelincluded other reported biomarkers, such as CSF VILIP-1 and YKL-40. Two previous studies reported the association of CSFH-FABP with AD in other smaller cohorts (31,32). In the currentstudy, we show that this association is present even at very earlystages of the disease, as demonstrated by the analysis of cogni-tively normal subjects with evidence of Aβ plaques. One limitationof our analysis is that although both studies are longitudinal, thenovel biomarkers have been measured only in cross-sectional data.We are unable to address the role of FABP as a novel AD biomarkeracross the entire course of disease at the present time. Despite thislimitation of our study design, we used the available longitudinaldata to show how CSF H-FABP can be employed to predict theconversion from cognitive normality to cognitive impairment. It stillremains to be determined whether addition of H-FABP in a modelincluding both CSF ptau181 and Aβ42 levels improves the accuracyof predicting conversion to symptomatic AD. Subjects in differentterciles for the CSF H-FABP-Aβ42 and the CSF ptau181-Aβ42 ratiossuggest this trend, but the studies included in our analysis did notprovide statistical power to test this hypothesis.
In contrast, H-FABP levels do not predict progression from CDR= .5 to CDR � .5, but it is noteworthy that the number of subjectsin this analysis is small (N = 81) compared with the analysis ofconversion from CDR = 0 to CDR � 0 (N = 219). Based on theseresults, we believe that H-FABP may be a very useful biomarker instaging preclinical AD.
The protein H-FABP is a member of a family of proteinscharacterized as lipid chaperones (33) that transport lipids tospecific compartments in the cell or outside the cell (33). It has
been demonstrated that in vitro fatty acids induce Aβ assemblyand modulate the rate of tau polymer assembly (34). Geneticstudies have implicated several genes involved in lipid metabo-lism as risk factors for AD, including APOE (35) and ABCA7 (36).
The multivariate analysis of the Multi-Analyte Profile 1.0panel of analytes identified distinct complex models for theKnight-ADRC and the ADNI datasets. Nevertheless, these modelsincluded a common subset of analytes. This subset of selectedanalytes includes CSF H-FABP as well as HGF, which wasreported previously to discriminate AD subjects from subjectswith other neurodegenerative disorders (32). Similarly, VEGF wasreported to discriminate controls from moderately severe ADcases but not from mild AD cases (31). We confirmed the role ofthese analytes in our dataset by demonstrating an associationwith CDR at LP.
In conclusion, the use of the CSF ptau181-Aβ42 ratio as anendophenotype of AD led to the identification of a set of 13correlated analytes associated with the disease in two independ-ent cohorts. This set of candidate analytes is extended by twoadditional analytes, which are significantly associated only in thecontext of multivariate models. Despite the differences in our twodatasets (the ADNI study has many symptomatic individuals andfewer nondemented controls, whereas the Knight-ADRC study islargely composed of controls and inferred preclinical AD sam-ples), these analytes were consistently associated with the CSFptau181-Aβ42 ratio and AD. Our analysis suggests that theseanalytes capture distinct information from that identified by thetraditional analytes (CSF Aβ42 and tau/ptau181) for the disease anddescribe novel facets of disease pathogenesis. Analysis of the roleof these analytes as novel biomarkers of AD pathogenesis inadditional datasets would help to determine the specificity ofthese changes to AD. Longitudinal analyses also would enablecharacterization of the temporal sequence of analyte changes inthe pathologic cascade of AD.
This work was supported by Pfizer, grants from the NationalInstitutes of Health (NIH) (Grant Nos. P30 NS069329-01, R01AG035083, R01 AG16208, P50 AG05681, P01 AG03991, P01AG026276, UL1 TR000448), and the Barnes-Jewish Hospital Founda-tion. We acknowledge the support of the BrightFocus FoundationAlzheimer’s Disease Research Grant No. A2013359S. We thank theClinical and Genetics Cores of the Knight Alzheimer’s Disease ResearchCenter at Washington University for clinical and cognitive assessmentsof the participants and for apolipoprotein E genotypes. We also thankthe Biomarker Core of the Adult Children Study at WashingtonUniversity for the cerebrospinal fluid collection and assays.
Data collection and sharing for this project were funded by theAlzheimer’s Disease Neuroimaging Initiative (ADNI) (NIH Grant No.U01 AG024904) and Department of Defense ADNI (Department ofDefense Award No. W81XWH-12-2-0012). The ADNI is funded by theNational Institute on Aging, the National Institute of BiomedicalImaging and Bioengineering, and generous contributions from thefollowing: Alzheimer’s Association, Alzheimer’s Drug DiscoveryFoundation, BioClinica, Inc., Biogen Idec, Inc., Bristol-Myers SquibbCompany, Eisai, Inc., Elan Pharmaceuticals, Inc., Eli Lilly andCompany, F. Hoffmann-La Roche Ltd. and its affiliated companyGenentech, Inc., GE Healthcare, Innogenetics N.V., IXICO Ltd.,Janssen Alzheimer Immunotherapy Research & Development,LLC, Johnson & Johnson Pharmaceutical Research & Development,LLC, Medpace, Inc., Merck & Co., Inc., Meso Scale Diagnostics, LLC,NeuroRx Research, Novartis Pharmaceuticals Corporation, Pfizer,Inc., Piramal Imaging, Servier, Synarc, Inc., and Takeda Pharma-ceutical Company. The Canadian Institutes of Health Research
www.sobp.org/journal
730 BIOL PSYCHIATRY 2014;75:723–731 O. Harari et al.
provides funds to support ADNI clinical sites in Canada. Privatesector contributions are facilitated by the Foundation for theNational Institutes of Health (www.fnih.org). The grantee organiza-tion is the Northern California Institute for Research and Education,and the study is coordinated by the Alzheimer’s Disease CooperativeStudy at the University of California, San Diego. ADNI data aredisseminated by the Laboratory for Neuro Imaging at the Universityof California, Los Angeles. This research was also supported by NIHGrant No. P30 AG010129 and K01 AG030514.
Data used in preparation of this article were obtained from theADNI database (adni.loni.usc.edu). As such, the investigators withinthe ADNI contributed to the design and implementation of ADNI orprovided data, or both, but did not participate in analysis or writingof this article. A complete list of ADNI investigators can be found at:http://adni.loni.usc.edu/wp-content/uploads/how_to_apply/ADNI_Acknowledgement_List.pdf.
KB and EHP are employed by Pfizer, Inc. AMF served as anadvisory board member for F. Hoffmann-La Roche Ltd. and Eli Lillyand Company. DMH is a consultant for Bristol-Myers Squibb,AstraZeneca, and Genentech, Inc.; is on the scientific advisory boardof C2N Diagnostics; and receives research grant support from theNIH, Ellison Medical Foundation, Cure Alzheimer’s Fund, Astra-Zeneca, C2N Diagnostics, and Integrated Diagnostics, Inc. JCM hasparticipated or is currently participating in clinical trials of anti-dementia drugs sponsored by Janssen Alzheimer Immuno-therapy Research & Development, LLC, Pfizer, Inc, and Eli Lilly andCompany; has served as a consultant for Eisai, Inc., Esteve, JanssenAlzheimer Immunotherapy Research & Development, LLC, GlaxoS-mithKline, Novartis, Eli Lily and Company, and Pfizer, Inc; receivesresearch support from Eli Lilly & Company/Avid Radiopharma-ceuticals; and is funded by the NIH National Institute on Aging.AMG is a consultant for Finnegan and Amgen; has receivedresearch grant support from Genentech, Inc., Pfizer, Inc., andAstraZeneca; and has received royalties from Taconic. OH, CC, JSKK,BJA, and SB report no biomedical financial interests or potentialconflicts of interest. The funders had no role in study design, datacollection and analysis, decision to publish, or preparation of themanuscript.
Supplementary material cited in this article is available online athttp://dx.doi.org/10.1016/j.biopsych.2013.11.032.
1. Price JL, McKeel DW Jr, Buckles VD, Roe CM, Xiong C, Grundman M,et al. (2009): Neuropathology of nondemented aging: Presumptiveevidence for preclinical Alzheimer disease. Neurobiol Aging 30:1026–1036.
2. Holtzman DM, Goate A, Kelly J, Sperling R (2011): Mapping the roadforward in Alzheimer’s disease. Sci Transl Med 3:114ps48.
3. Holtzman DM, Morris JC, Goate AM (2011): Alzheimer’s disease: Thechallenge of the second century. Sci Transl Med 3:77sr1.
4. Bateman RJ, Xiong C, Benzinger TLS, Fagan AM, Goate A, Fox NC, et al.(2012): Clinical and biomarker changes in dominantly inheritedAlzheimer’s disease. N Engl J Med 367:795–804.
5. Buerger K, Ewers M, Pirttilä T, Zinkowski R, Alafuzoff I, Teipel SJ, et al.(2006): CSF phosphorylated tau protein correlates with neocorticalneurofibrillary pathology in Alzheimer’s disease. Brain 129:3035–3041.
6. Hardy JJ, Selkoe DJD (2002): The amyloid hypothesis of Alzheimer’sdisease: Progress and problems on the road to therapeutics. Science297:353–356.
7. de Leon MJM, DeSanti SS, Zinkowski RR, Mehta PDP, Pratico DD, SegalSS, et al. (2004): MRI and CSF studies in the early diagnosis ofAlzheimer’s disease. J Intern Med 256:205–223.
8. Shaw LM, Vanderstichele H, Knapik-Czajka M, Clark CM, Aisen PS,Petersen RC, et al. (2009): Cerebrospinal fluid biomarker signature inAlzheimer’s disease neuroimaging initiative subjects. Ann Neurol 65:403–413.
www.sobp.org/journal
9. Tarawneh R, Lee J-M, Ladenson JH, Morris JC, Holtzman DM (2012):CSF VILIP-1 predicts rates of cognitive decline in early Alzheimerdisease. Neurology 78:709–719.
10. Craig-Schapiro R, Perrin RJ, Roe CM, Xiong C, Carter D, Cairns NJ, et al.(2010): YKL-40: A novel prognostic fluid biomarker for preclinicalAlzheimer’s disease. Biol Psychiatry 68:903–912.
11. Fagan AM, Roe CM, Xiong C, Mintun MA, Morris JC, Holtzman DM(2007): Cerebrospinal fluid tau/beta-amyloid(42) ratio as a predictionof cognitive decline in nondemented older adults. Arch Neurol 64:343–349.
12. Price JL, Davis PB, Morris JC, White DL (1991): The distribution oftangles, plaques and related immunohistochemical markers in healthyaging and Alzheimer’s disease. Neurobiol Aging 12:295–312.
13. Price JL, Morris JC (1999): Tangles and plaques in nondemented agingand “preclinical” Alzheimer’s disease. Ann Neurol 45:358–368.
14. Toledo JB, Brettschneider J, Grossman M, Arnold SE, Hu WT, Xie SX,et al. (2012): CSF biomarkers cutoffs: The importance of coincidentneuropathological diseases. Acta Neuropathol 124:23–35.
15. McKhann G, Drachman D, Folstein M, Katzman R, Price D, Stadlan EM(1984): Clinical diagnosis of Alzheimer’s disease: Report of theNINCDS-ADRDA Work Group under the auspices of Department ofHealth and Human Services Task Force on Alzheimer’s Disease.Neurology 34:939–944.
16. Fagan AM, Mintun MA, Mach RH, Lee S-Y, Dence CS, Shah AR, et al.(2006): Inverse relation between in vivo amyloid imaging load andcerebrospinal fluid Abeta42 in humans. Ann Neurol 59:512–519.
17. Cruchaga C, Kauwe JSK, Nowotny P, Bales K, Pickering EH, Mayo K,et al. (2012): Cerebrospinal fluid APOE levels: An endophenotypefor genetic studies for Alzheimer’s disease. Hum Mol Genet 21:4558–4571.
18. Soares HD, Potter WZ, Pickering E, Kuhn M, Immermann FW,Shera DM, et al. (2012): Plasma biomarkers associated with theapolipoprotein E genotype and Alzheimer disease. Arch Neurol 69:1310–1317.
19. Muller PY, Janovjak H, Miserez AR, Dobbie Z (2002): Processing ofgene expression data generated by quantitative real-time RT-PCR.BioTechniques 32:1372–1374, 1376, 1378–1379.
20. Craig-Schapiro R, Kuhn M, Xiong C, Pickering EH, Liu J, Misko TP, et al.(2011): Multiplexed immunoassay panel identifies novel CSF bio-markers for Alzheimer’s disease diagnosis and prognosis. PLoS ONE 6:e18850.
21. Hu WT, Holtzman DM, Fagan AM, Shaw LM, Perrin R, Arnold SE, et al.(2012): Plasma multianalyte profiling in mild cognitive impairmentand Alzheimer disease. Neurology 79:897–905.
22. Gao X, Starmer J, Martin ER (2008): A multiple testing correctionmethod for genetic association studies using correlated singlenucleotide polymorphisms. Genet Epidemiol 32:361–369.
23. Johnstone D, Milward EA, Berretta R, Moscato P, Alzheimer’s DiseaseNeuroimaging Initiative (2012): Multivariate protein signatures of pre-clinical Alzheimer’s disease in the Alzheimer’s disease neuroimaginginitiative (ADNI) plasma proteome dataset. PLoS One 7:e34341.
24. Snider BJ, Fagan AM, Roe C, Shah AR, Grant EA, Xiong C, et al. (2009):Cerebrospinal fluid biomarkers and rate of cognitive decline in verymild dementia of the Alzheimer type. Arch Neurol 66:638–645.
25. Morris JC (1993): The Clinical Dementia Rating (CDR): Current versionand scoring rules. Neurology 43:2412–2414.
26. Jefferson AL, Cosentino SA, Ball SK, Bogdanoff B, Leopold N, Kaplan E,Libon DJ (2002): Errors produced on the mini-mental state examina-tion and neuropsychological test performance in Alzheimer’s disease,ischemic vascular dementia, and Parkinson’s disease. J NeuropsychiatryClin Neurosci 14:311–320.
27. Karch CM, Jeng AT, Nowotny P, Cady J, Cruchaga C, Goate AM (2012):Expression of novel Alzheimer’s disease risk genes in control andAlzheimer’s disease brains. PLoS One 7:e50976.
28. Braak H, Braak E (1991): Neuropathological stageing of Alzheimer-related changes. Acta Neuropathol 82:239–259.
29. Chiasserini D, Parnetti L, Andreasson U, Zetterberg H, Giannandrea D,Calabresi P, Blennow K (2010): CSF levels of heart fatty acid bindingprotein are altered during early phases of Alzheimer’s disease.J Alzheimers Dis 22:1281–1288.
30. Huang DW, Sherman BT, Lempicki RA (2009): Systematic and integra-tive analysis of large gene lists using DAVID bioinformatics resources.Nat Protoc 4:44–57.

O. Harari et al. BIOL PSYCHIATRY 2014;75:723–731 731
31. Ohrfelt A, Andreasson U, Simon A, Zetterberg H, Edman A, Potter W,et al. (2011): Screening for new biomarkers for subcortical vasculardementia and Alzheimer’s disease. Dement Geriatr Cogn Dis Extra 1:31–42.
32. Hu WT, Chen-Plotkin A, Arnold SE, Grossman M, Clark CM, Shaw LM,et al. (2010): Novel CSF biomarkers for Alzheimer’s disease and mildcognitive impairment. Acta Neuropathol 119:669–678.
33. Furuhashi M, Hotamisligil GS (2008): Fatty acid-binding proteins: Rolein metabolic diseases and potential as drug targets. Nat Rev DrugDiscov 7:489–503.
34. Wilson DM, Binder LI (1997): Free fatty acids stimulate the polymerizationof tau and amyloid beta peptides. In vitro evidence for a common effectorof pathogenesis in Alzheimer’s disease. Am J Pathol 150:2181–2195.
35. Castellano JM, Kim J, Stewart FR, Jiang H, DeMattos RB, Patterson BW,et al. (2011): Human apoE isoforms differentially regulate brainamyloid-β peptide clearance. Sci Transl Med 3:89ra57.
36. Hollingworth P, Harold D, Sims R, Gerrish A, Lambert J-C, CarrasquilloMM, et al. (2011): Common variants at ABCA7, MS4A6A/MS4A4E,EPHA1, CD33 and CD2AP are associated with Alzheimer’s disease. NatGenet 43:429–435.
www.sobp.org/journal