“PHOSPHORUS DESORPTION AND SORPTION PROCESSES...
241
DOCTORAL THESIS Doctorate in Natural Sciences - Dr. rer. nat. “PHOSPHORUS DESORPTION AND SORPTION PROCESSES IN ACTIVATED SLUDGE SAMPLES WITH CAPACITY TO PERFORM EBPR PROCESSES” DATE: 17 DECEMBER 2014 REVIEWERS: 1. Prof. Dr. Brigitte Urban Professor of Biology and Soil Science Institute of Ecology (IE) Leuphana University 2. Prof. Dr.-Ing. Artur Mennerich Vice Dean Faculty of Civil and Enviromental Engineering Ostfalia – University of Applied Sciences 3. Dr.-Ing. habil. Christine Helmer-Madhok Research Associate Workgroup Water and Environment Hannover University AUTHOR: Patricia Elizabeth Minaya Bedón
Transcript of “PHOSPHORUS DESORPTION AND SORPTION PROCESSES...

DOCTORAL THESIS
Doctorate in Natural Sciences - Dr. rer. nat.
“PHOSPHORUS DESORPTION AND SORPTION PROCESSES IN
ACTIVATED SLUDGE SAMPLES WITH CAPACITY TO PERFORM
EBPR PROCESSES”
DATE: 17 DECEMBER 2014
REVIEWERS: 1. Prof. Dr. Brigitte Urban
Professor of Biology and Soil Science Institute of Ecology (IE) Leuphana University
2. Prof. Dr.-Ing. Artur Mennerich
Vice Dean Faculty of Civil and Enviromental Engineering Ostfalia – University of Applied Sciences
3. Dr.-Ing. habil. Christine Helmer-Madhok
Research Associate Workgroup Water and Environment Hannover University
AUTHOR: Patricia Elizabeth Minaya Bedón

ii
To Elva, Daniel, Andrés and Justino

iii
ACKNOWLEDGMENTS
First, I want to thank God for the faith and strength.
I would like to express my deepest gratitude to my advisor, Prof. Dr. Brigitte Urban for
the opportunity to perform this research under her supervision and her willingness to
support me in all aspects.
The present study was performed in the installations of the Bau-Wasser-Boden
Fakultät – Ostfalia Universität – Campus Suderburg, under the co-supervision by Prof.
Dr.-Ing. Artur Mennerich. I would like to express my warmest thanks to the entire
SiWaWi team, to Prof. Mennerich for the freedom and support he granted me, to Dipl.-
Geol. Ingeborg Joost, Dipl.-Ing. Pamela Holweg, Patrick Stohri and Dipl.-Ing. Sacha
Ogassa, for the friendship and the continuous support. I will take you always with me,
my “Lab Family”
I wish to express my thanks to Dr. Manfred Schütze – ifak Magdeburg, for his
continuous interest in my research work, for the interesting discussions and fruitful
comments on my thesis.
To Karin Dziarski for her continued support, interest in my work and friendship. Her
guide was invaluable for me and other doctoral students.
The analysis in the chemical laboratory would not have been possible without the
assistance of Sabine Henschel and Kerstin Lammers. I would want to thank them for
this valuable support.
I would also like to thank to Dipl.-Ing. Katharina Mey from the Labor für Material design
und Werkstoffzuverlässigkeit - Hochschule Osnabrück, for providing me with the
facilities being required to perform the electron microscopy analysis. I would want to
thank her for the interest and participation in my research study.
Last but not least, to my parents for having unchanging faith in me, to my big family
and friends for giving me a reason to laugh and make the work more bearable, to
Elena, Pepe, Carmencita, Emilio, Silvia, Cecilia y Rosa. To my friends in Germany for
the patience and friendship, to Vanessa, Yan Yan, Maria and Christian.

iv
ZUSAMMENFASSUNG
Die Entfernung von Phosphor aus Abwasser bleibt ein Forschungsthema, das in
Zukunft nur an Wichtigkeit gewinnen kann. Das wird durch die Umweltauswirkungen
der Eutrophierung und den Verlust eines essentiellen Nährstoffes für die
Nahrungsmittelproduktion dessen Knappheit immer offensichtlicher wird, immer
deutlicher. Auf Kläranlagen werden heute hauptsächlich zwei Techniken verwendet
um Phosphor zu entfernen, biologisch aktive Verfahren wie das Enhanced Biological
Phosphorus Removal (EBPR) Verfahren und Fällungstechniken unter Verwendung von
Metallsalzen. Bei beiden Methoden gibt es gegenwärtig Schwierigkeiten wie z.B. die
Instabilität des EBPR Prozesses wegen des Mangels an Wissen über die Grundlagen
des Stoffwechselprozesses. Bei der Verwendung von Fällungsmitteln kommt es zu
vielen Nachteilen im Zusammenhang mit der Nachbehandlung des Schlammes, bei der
Entsorgung kommt es zu dem Verlust der Schlammmassen und damit auch des
Phosphors aus dem Nährstoffkreislauf.
Die vorliegende Arbeit entstand also aus dem Bedarf nach einer nachhaltigen Methode
der Phosphorentfernung aus Abwasser bzw. des Überschussschlammes der in der
Siedlungswasserwirtschaft anfällt. Beim Sorptionsprozess kam Belebtschlamm als
Substrat zum Einsatz. Das erste Ziel der Untersuchungen war verschiedene
Bakteriengemeinschaften mit erhöhtem Potential für effiziente EBPR Prozesse zu
identifizieren und herzustellen. Anschließend war das nächste Ziel die Beurteilung der
Leistungsfähigkeit der Bakterienmassen den Phosphor zu sorbieren und zu
desorbieren. Schließlich fokussierte sich die Arbeit auf das dritte Ziel, die Bewertung
der Möglichkeiten die Sorptionskapazität für Phosphor verschiedener Schlämme zu
erhöhen. Die verschiedenen Belebtschlämme wurden dabei vorherigen
Ionenaustauschverfahren unter Verwendung von Kaliumchlorid, Calciumchlorid und
Magnesiumchlorid Lösungen ausgesetzt.
Die verschiedenen Bakteriengemeinschaften die in der Lage sind EBPR Prozesse zu
entwickeln, wurden in sequentiellen Batch-Reaktoren mit: Trockensubstanz-
Konzentrationen von 1-4 g/l, hydraulischer Verweilzeit (HRT) von 24 Stunden und einer
mittleren Verweilzeit (MCRT) von 15 Tagen betrieben. Die Dauer der Betriebszyklen
betrug 8 Stunden und die Betriebsparameter der Reaktoren wurden auf Basis
verschiedener Zulaufkonzentrationen variiert. Der Zulauf variiert entsprechend der
verwendeten Kohlenstoffquelle (Glucose, Mischung von Volatile Fatty Acids und
Propionsäure) und entsprechend unterschiedlicher C:N:P Anteile (18.1: 1.9: 1; 37: 2.5:
1; 45.2: 4: 1). Unter diesen Bedingungen wurden zwei große Bakteriengemeinschaften
erhalten, eine gemischte Gemeinschaft aus verschiedenen Morphotypen (bakterielle

v
Gemeinschaft EBPR) und eine bakterielle Gemeinschaft dominiert von dem Morphotyp
"Tetrad Forming Organisms" (TFO). Mit Neisser und PHA Färbetechniken wurde es
möglich in beiden bakteriellen Gemeinschaften die typischen Speicherpolymere für
bereits bekannte EBPR Systeme zu identifizieren. Darüber hinaus wurde bestätigt dass
es sich um den erwarteten EBPR Prozess in beiden Bakteriengemeinschaften handelt
in dem beiden Bakteriengemeinschaften eine gute Phosphor Entfernung von 90%
nachgewiesen werden konnte.
Nach der Bestätigung des ordnungsgemäßen Funktionieren des EBPR Prozesses in
den Belebtschlammproben wurden Phosphor Desorptionsprozesse mit Hilfe der Batch
Equilibrium Methode eingeführt. So, wurde jeder Schlammprobe in einem Verfahren
zur Vor-Stabilisierung eine Lösung aus CaCl2 und MgCl2 zugegeben, um anschließend
die Desorptionsphase zu starten, wobei als Elutionsmittel Zitronensäure,
Schwefelsäure und Chlorwasserstoffsäure benutzt wurden bis die Desorption bei pH-
Werten von 2, 3, 4 und 5 erreichet wurde. Zusätzlich wurde ein Ionenaustauscher als
Elutionsmittel (KCl) mit Konzentrationen von 20, 30, 40 und 50 mmol/l in
Mischflüssigkeit eingesetzt. Die besten Ergebnisse von Phosphordesorption wurden
unter Verwendung von Zitronensäure als Elutionsmittel erhalten, bei einem pH-Wert
von 3 und mit der EBPR Bakteriengemeinschaft. Nach Abschluss der Desorption
wurden die Schlammproben wieder stabilisiert um später als Sorbens für
Sorptionsverfahren eingesetzt werden zu können.
Für die Sorptionsversuche wurde ein spezifisches synthetisches Abwasser mit einer
gegebenen Konzentration von Phosphor als Adsorbat verwendet. Die Ergebnisse
zeigten positive Sorptionsraten in den Reaktoren, die Gegenstand eines früheren
Desorptionsverfahrens unter Verwendung von Kaliumchlorid als Elutionsmittel mit einer
Konzentration von 30 mmol/l waren. Auch, die Reaktoren die unter Verwendung sauer
Elutionsmittel ein Desorptionsverfahren durchliefen, zeigten während der Experimente
in der wässrigen Phase ein erhöhtes Potential Phosphor aufzunehmen. Die
Schlammproben mit den höchsten positiven Sorptionsraten wurden in der bakteriellen
Gemeinschaft erreicht die TFO's bilden. Im Vergleich zu dem Belebtschlamm der kein
vorheriges Desorptionsverfahren durchlief, konnte eine erhöhte Fähigkeit zur
Phosphorbindung festgestellt werden, sie betrug während der Sorptionsphase in den
Schlammproben der TFO-bakteriellen Gemeinschaft bis zu 45,7%, während die EBPR
bakterielle Gemeinschaft ihre phosphorbindende Fähigkeit bis zu 21.7% erhöhen
konnte. Beide Male wurde Kaliumchlorid als Elutionsmittel in dem vorangegangenen
Desorptionsversuch benutzt.

vi
Das Ergebnis dieser Forschung ist, dass es möglich ist, die Phosphorspeicherkapazität
von Belebtschlamm zu erhöhen wenn dieser spezifische Anforderungen erfüllt. Diese
Anforderungen werden wie folgt zusammengefasst: Die Schlammmasse muss in der
Lage sein, EBPR Prozesse zu entwickeln, auch muss der Schlamm aus einem
Belebungsbecken-System kommen, weil die Schlammflocken unter den
Umgebungsbedingungen des Reaktors stabilisiert worden sind. Schließlich muss der
Belebtschlamm aus einem Verfahren kommen, bei dem man für die
Phosphorentfernung keine Metallsalze verwendet.
Die erhöhte Phosphorstoffspeicherkapazität der Belebtschlammmassen in Verbindung
mit der Möglichkeit den Phosphor aus dem Belebtschlamm über Rücklösung in die
wässrige Phase wieder gewinnen zu können, bietet großes Potential in der Zukunft
einen in der Abwasserwirtschaft geschlossenen Phosphorkreislauf zu entwickeln und
so den Verlust des wichtigen Nährstoffes nachhaltig zu verhindern.

vii
TABLE OF CONTENTS
LIST OF FIGURES ...................................................................................................... xi
LIST OF TABLES ....................................................................................................... xiv
LIST OF ABBREVIATIONS ........................................................................................ xvi
CHAPTER 1: Introduction ........................................................................................... 1
CHAPTER 2: Objectives ............................................................................................. 5
CHAPTER 3: State of Knowledge .............................................................................. 7
3.1 Phosphorus in aquatic systems ........................................................................... 7
3.2 Forms of phosphorus in aquatic systems............................................................. 7
3.3 Problems with phosphorus excess in aquatic systems ........................................ 8
3.4 The problem of phosphorus starvation ................................................................ 9
3.4.1 Mismanagement of the phosphorus resource ............................................. 10
3.4.2 Management and technology approaches to phosphorus recovery ............. 11
3.5 Biological wastewater treatment for phosphorus removal .................................. 13
3.5.1 Phosphorus removal from wastewater using activated sludge .................... 13
3.5.2 Wastewater quality – A challenge for wastewater treatment........................ 14
3.5.3 Wastewater treatment plants configurations ................................................ 15
3.5.4 Wastewater treatment plants configurated for nitrogen removal .................. 17
3.5.5 Configuration of wastewater treatment plants for phosphorus removal ....... 20
3.5.6 Wastewater treatment plants configurations for EBPR processes ............... 24
3.6 Wastewater composition and operational parameters required to achieve good
EBPR processes. .................................................................................................... 27
3.7 Performance loss in EBPR processes ............................................................... 32
3.8 References ........................................................................................................ 35
CHAPTER 4: Material and methods ......................................................................... 47
4.1 Chemical analysis ............................................................................................. 48
4.1.1 Chemical Oxygen Demand (COD) and Biological Oxygen Demand
(BOD5) ………………………………………………………………………………….48
4.1.2 Nitrogenous compounds: ...................................................................... 49
4.1.3 Total phosphorus concentration (Ptot) ................................................... 50
4.1.4 Volatile fatty acids (VFA) concentration by titration and volatile fatty acids
composition by gas chromatography. ................................................................... 50
4.1.5. pH, dissolved oxygen (DO) and temperature ......................................... 51
4.2 Volumetric analysis ........................................................................................... 52
4.2.1 Sludge Volume Index (SVI) .................................................................... 52
4.3 Microscopic analysis ......................................................................................... 53

viii
4.3.1. Floc morphology ........................................................................................ 53
4.3.2 Determination of the relationship between the SVI and the sludge stringiness
with the aid of crystal violet staining…………………………………………………..53
4.3.3 PHA staining technique ............................................................................... 54
4.3.4 Neisser staining technique .......................................................................... 55
4.4 Gravimetric analysis .......................................................................................... 56
4.4.1 Total Solids (TS) .................................................................................... 56
4.4.2. Total Suspended Solids (TSS) and Volatile Suspended Solids (VSS) ........ 57
4.5 References ........................................................................................................ 58
CHAPTER 5: The production of volatile fatty acids in an SBR reactor using
glucose as a carbon source ..................................................................................... 60
5.1 Introduction ....................................................................................................... 60
5.2 Material and methods ........................................................................................ 61
5.2.1 Synthetic wastewater composition. ............................................................. 61
5.2.2 Inoculum ..................................................................................................... 62
5.2.3 Location: ..................................................................................................... 62
5.2.4 Reactor design and operational parameters ................................................ 62
5.2.5 Sampling ..................................................................................................... 63
5.2.6 Samples analysis ........................................................................................ 64
5.2.7 Stable operational conditions ...................................................................... 64
5.3 Results and discussion ...................................................................................... 68
5.3.1 VFA production within an operational cycle ................................................. 68
5.3.2. VFA production according to the TSS concentration (g/l) and the F/M ratio
(gBOD5/gTSS.cycle) ............................................................................................ 69
5.3.3. Influence of the TSS concentration and the F/M ratio on the acidogenic
potential (gVFA/gCOD fed) and on the degree of acidification -α (%) .................. 71
5.3.4 Influence of TSS concentration and F/M ratio on VFA composition. ............ 73
5.4 Conclusions ....................................................................................................... 77
5.5 References ........................................................................................................ 78
CHAPTER 6: Assessment of the accumulation of PHA and phosphorus in EBPR
bacterial communities using staining techniques and Scanning Electron
Microscopy (SEM) coupled with Energy-Dispersive X-ray spectroscopy (EDX) .. 80
6.1 Introduction ....................................................................................................... 80
6.2 Material and methods ........................................................................................ 83
6.3 Results and discussion ...................................................................................... 85
6.3.1. Identification of the principal bacterial morphotypes in the sludge samples
using light microscopy.......................................................................................... 85

ix
6.3.2 Storage of intracellular polymers during the anaerobic and the aerobic
phases. ................................................................................................................ 87
6.3.3 Assessment of phosphorus accumulation in activated sludge samples using
Scanning Electron Microscopy (SEM) coupled with Energy-dispersive X-ray
spectroscopy (EDX) ............................................................................................. 92
6.4 Conclusions ....................................................................................................... 96
6.5 References ........................................................................................................ 98
CHAPTER 7: Assessment of the performance of the EBPR process using
different carbon sources and different C:N:P ratios in synthetic wastewater .... 101
7.1 Introduction ..................................................................................................... 101
7.2 Material and Methods ...................................................................................... 103
7.2.1 Composition of the synthetic wastewater .................................................. 103
7.2.2 Inoculum .................................................................................................. 104
7.2.3 Location .................................................................................................... 104
7.2.4 Reactors ................................................................................................... 105
7.2.5 System Operation ..................................................................................... 106
7.2.6 Sampling ................................................................................................... 107
7.2.7 Sample Analysis ....................................................................................... 107
7.3 Results and discussions ................................................................................. 109
7.3.1 Stability assessment of phosphorus removal in EBPR processes considering
the use of different carbon sources in the influent. ............................................. 109
7.3.2 Stability assessment of phosphorus removal in EBPR processes using
different C:N:P ratios in the influent.................................................................... 117
7.4 Conclusions ..................................................................................................... 130
7.5 References ...................................................................................................... 132
CHAPTER 8: Assessment of the desorption and adsorption capacity of
phosphorus in activated sludge samples ............................................................. 136
8.1 Introduction ..................................................................................................... 136
8.2 Material and methods ...................................................................................... 138
8.2.1 Sludge sampling .................................................................................. 138
8.2.2 Pre-stabilization of the activated sludge samples using solutions of CaCl2
and MgCl2 .......................................................................................................... 139
8.2.3 Desorption process .............................................................................. 140
8.2.4 Stabilization of the activated sludge samples using a solution of CaCl2
and MgCl2 .......................................................................................................... 141
8.2.5 Sorption process .................................................................................. 142
8.3 Results and discussion – Desorption process ................................................. 145
8.3.1 Phosphorus desorption percentage vs reaction time ................................. 145

x
8.3.2 Determination of the apparent desorption coefficient (Kdes) ..................... 157
8.3.3 Relationship between the Soil/Solution ratio and the apparent desorption
coefficient (Kdes) ............................................................................................... 161
8.4 Results and discussion – Sorption process ..................................................... 168
8.4.1 Phosphorus sorption percentage (A%) vs reaction time. ........................... 170
8.4.2 Relationship between the distribution coefficient (Kd) and the soil to solution
ratio ................................................................................................................... 181
8.4.3 Determination of the optimum soil to solution ratio: ................................... 184
8.5 Conclusions: .................................................................................................... 188
8.6 References ...................................................................................................... 190
CHAPTER 9: Bacterial survival assessment in activated sludge samples
subjected to desorption – sorption processes ..................................................... 194
9.1 Introduction ..................................................................................................... 194
9.2 Materials and methods .................................................................................... 196
9.2.1 Sampling ................................................................................................... 196
9.2.2 Plate Count – Agar Pour Plate method ..................................................... 197
9.3. Results and discussion ................................................................................... 198
9.3.1 Survival percentage of bacterial communities at the end of the desorption
– stabilization- sorption processes. .................................................................... 198
9.4 Conclusions ..................................................................................................... 205
9.5 References ...................................................................................................... 206
CHAPTER 10: Conclusions .................................................................................... 207
APPENDIX ............................................................................................................... 210
APPENDIX 1: Calculation of the apparent desorption coefficient (Kdes) using the
batch equilibrium method in activated sludge samples .......................................... 210
APPENDIX 2: RELATIONSHIP BETWEEN THE SOIL/SOLUTION RATIO,
DESORPTION PERCENTAGE (Deq) AND APPARENT DESORPTION
COEFFICIENT (Kdes) IN A LOGARITHMIC LINEAR EQUATION ........................ 212
APPENDIX 3: Calculation of the distribution coefficient (Kd) using the batch
equilibrium method in activated sludge samples. ................................................... 215
APPENDIX 4: : RELATIONSHIP BETWEEN THE SOIL/SOLUTION RATIO,
SORPTION PERCENTAGE (A%) AND DISTRIBUTION COEFFICIENT (Kd) ....... 221

xi
LIST OF FIGURES Figure 3.1: General design of the plug flow activated sludge system. The return
activated sludge (RAS) is mentioned as “s” recycle…………………………...………….16
Figure 3.2: General design of the completely mixing activated sludge system…….….16
Figure 3.3: The Wuhrmann (1957) activated sludge configuration for nitrogen removal
………………………………………………………………………………………………….18
Figure 3.4: The BARDENPHO PROCESS activated sludge configuration for nitrogen
removal……………………………………………………………………………………..….18
Figure 3.5: The R-D-N PROCESS for nitrogen removal………………………….………19
Figure 3.6: EBPR metabolism according to the Wentzel-Comeau model. (Redraw from
Seviour & Nielsen, 2010)…………………………………………………………………….22
Figure 3.7: EBPR metabolism according to the Mino model. (Redraw from Seviour &
Nielsen, 2010) ..……………………………………………………………………………....24
Figure 3.8: The FIVE STAGE PHOREDOX process……………………………………..25
Figure 3.9: The TWO-STAGE HIGH RATE PHOREDOX process or A/O process…...26
Figure 3.10: The JOHANNESBURG process……………………………………………..26
Figure 3.11: The UCT system……………………………………………………………….27
Figure 4.1: Flowchart of the principal objectives and experimental processes in this
research………………………………………………………………………………………..47
Figure 5.1: Time distribution in each cycle of operation during fermentation
process………………………………………………………………………………………...62
Figure 5.2: VFA production within cycles of operation related to the TSS concentration
………………………………………………………………………………………………….68
Figure 5.3: VFA production within cycles of operation related to the F/M ratio
(gBOD5/gTSS.cycle)………………………………………………………………………....69
Figure 5.4: Total VFA production at the end of the anaerobic phase against the TSS
concentration and the F/M ratio……………………………………………………………..70
Figure 5.5: Degree of acidification (α-%) and acidogenic potential (gVFA/gCOD)
against the TSS concentration (g/l) and the F/M ratio (gBOD5/gTSS.cycle) in mixed
liquor…………………………………………………………………………………………...72
Figure 5.6: VFA composition at the end of the anaerobic phase against the F/M ratio
and the TSS concentration in mixed liquor………………………………………………..75
Figure 5.7: VFA composition at the end of the anaerobic phase against temperature
and pH in mixed liquor……………………………………………………………………….76
Figure 6.1: Flowchart of the pre-procedure for the SEM/EDX analyses………………..84
Figure 6.2: Basic appearance of the bacterial communities in the activated sludge
samples using the sudan black staining technique (1000 X)…………………………....85
Figure 6.3: Results of the PHA (6.3.a, 6.3.c, 6.3.e, 6.3.g) and Neisser (6.3.b, 6.3.d,
6.3.f, 6.3.h) staining techniques for the S1, S2, B2 and B4 sludge samples at the end of
the anaerobic phase……………………………………………………………………….…88
Figure 6.4: Results of the PHA (6.4.a, 6.4.c, 6.4.e, 6.4.g) and Neisser staining
techniques (6.4.b, 6.4.d, 6.4.f, 6.4.h) for the S1, S2, B2 and B4 sludge samples at the
end of the aerobic phase………………………………………………………………….…90
Figure 6.5: Results of the PHA and Neisser staining techniques for the Lüneburg-BS
sludge sample at the end of the aerobic phase…………………………………………...91
Figure 6.6: SEM image of the TFO morphotype (6.6.a) and EDX spectra corresponding
to the marked spectrum- points (6.6.b)………………………………………………….…93

xii
Figure 6.7: SEM image of a cluster of the coccoid cell morphotype (6.7.a) and its
respective EDX spectra (6.7.b)………………………………………………………….….94
Figure 6.8: SEM image of the filamentous morphotype (6.8.a) and the EDX spectra
corresponding to the marked spectrum point (6.8.b)………………………………….….95
Figure 7.1: Design of the SBR reactor used in the assessment of the EBPR
process…………………………………………………………………………………….…105
Figure 7.2: Length and sequence of phases within each cycle of operation…….…...106
Figure 7.3: Sampling cycle during the assessment of the EBPR process………..…..107
Figure 7.4: Phosphorus removal percentages (Prem %) according to the C/P ratio
(BOD5/Ptot) and the N/P ratio (Ntot/Ptot) in the influent synthetic wastewater……....110
Figure 7.5: Decrease of the bacterial concentration as TSS in the B3 reactor during the
first month of the experimental process………………………………………………..…112
Figure 7.6: Deterioration of the EBPR process in the B1 reactor because of the
presence of nitrate (NO3-) during the anaerobic phase………………………………...114
Figure 7.7: Phosphorus uptake per mass unit of VSS vs the C/P (BOD5/Ptot) and N/P
(Ntot/Ptot) ratios in the influent………………………………………………………….....115
Figure 7.8: Effect of the VFA concentration in the influent on the phosphorus uptake
capacity of the B1 and B3 reactors (Glucose bacterial communities) during the first
months of operation………………………………………………………………………...116
Figure 7.9: Effect of the VFA concentration in the influent on the phosphorus uptake
capacity of the B2 and B4 reactors (EBPR bacterial communities)……………….…..117
Figure 7.10: Phosphorus removal percentage against the N/P and C/P ratios in the
influent for the S reactors…………………………………………………………………..120
Figure 7.11: Trend lines determined by the C/P (BOD5/Ptot) ratio in the influent against
the phosphorus removal percentage……………………………………………….……..121
Figure 7.12: Phosphorus uptake per mass unit of Volatile Suspended Solids
(mgPtot/gVSS) against the C/P ratio (BOD5/Ptotal) in the influent for the B1 and B3
reactors……………………………………………………………………………………....123
Figure 7.13: Phosphorus uptake ratio (mgPtot/gVSS) against the C/P ratio
(BOD5/Ptotal) in the influent for the B2, B4 and S2 reactors…………………………..124
Figure 7.14: Phosphorus uptake ratio (mgPtot/gVSS) against the F/M ratio
(mgBOD5/gVSS) in mixed liquor for the S, B2 and B4 reactors……………………….125
Figure 7.15: Phosphorus uptake ratio (mgPtot/gVSS) against the F/M ratio
(mgBOD5/gVSS) in mixed liquor for the B1 and B3 reactors…………………………..126
Figure 7.16: Total phosphorus concentration in mixed liquor during an operational cycle
in the S1, S2 (Glucose community), B2 and B4 reactors (EBPR community)…….…128
Figure 8.1: Flowchart of the first stabilization and desorption processes…………......143
Figure 8.2: Flowchart of the second stabilization and adsorption process…………....144
Figure 8.3: Phosphorus desorption percentages at a pH of 2 for the S1 (a) and S2 (b)
sludge samples……………………………………………………………………………...146
Figure 8.4: Phosphorus desorption percentages at a pH of 3 for the S1 (a) and S2 (b)
sludge samples………………………………………………………………………….…..147
Figure 8.5: Phosphorus desorption percentages at a pH of 4 for the S1 (a) and S2 (b)
sludge samples…………………………………………………………………………..….149
Figure 8.6: Phosphorus desorption percentages at a pH of of 5 for the S1 (a) and S2
(b) sludge samples………………………………………………………………………….150
Figure 8.7: Phosphorus desorption percentages at a pH of 3 in the B2 (a) and B4 (b)
sludge samples……………………………………………………………………………...153

xiii
Figure 8.8: Phosphorus desorption percentages at a pH of 3 for the BS (a) and RS (b)
sludge samples of the Lüneburg WWTP…………………………………………………154
Figure 8.9: Phosphorus desorption percentages at a pH of 3 for the BS (a) and RS (b)
sludge samples of the Steinhorst WWTP………………………………………….…..…155
Figure 8.10: Apparent desorption coefficients (Kdes) vs the pH of desorption for the S1
(a) and S2 (b) sludge samples……………………………………………………………..159
Figure 8.11: Kdes coefficients at the end of the reaction time. Citric acid was used as
eluent during the desorption process……………………………………………………..160
Figure 8.12: Kdes coefficients obtained at the end of the desorption process using
potassium chloride as eluent……………………………………………………………….161
Figure 8.13: Soil/solution ratios vs Kdes coefficients for the S1 sludge sample ....….163
Figure 8.14: Soil/solution ratios vs Kdes coefficients for the S2 sludge sample …….163
Figure 8.15: Soil/solution ratios vs Kdes coefficients for the B2 and B4 sludge
samples……………………………………………………………………………………....165
Figure 8.16: Soil/solution ratios vs Kdes coefficients for the Lüneburg sludge
sample……………………………………………………………………………………......166
Figure 8.17: Soil/solution ratios vs Kdes coefficients for the Steinhorst sludge
sample………………………………………………………………………………………..167
Figure 8.18: Phosphorus sorption percentages vs reaction time for the S1 sludge
sample………………………………………………………………………………………..171
Figure 8.19: Phosphorus sorption percentages vs reaction time for the S2 sludge
sample……………………………………………………………………….……………….172
Figure 8.20: Phosphorus sorption percentages vs reaction time for the S1-KCl, S2-KCl
and control reactors. The sludge samples underwent a previous desorption process
using 20 mmol/l (a), 30 mmol/l (b), and 40 mmol/l (c) of KCl as eluent……………….175
Figure 8.21: Phosphorus sorption percentages vs reaction time for the S1-KCl, S2-KCl and control reactors. The sludge samples underwent a previous desorption process using KCl (30mmol/l) as eluent. The total phosphorus concentration in the influent during sorption process was 2.5 mg/l……………………………………………………..176 Figure 8.22: Phosphorus sorption percentages vs reaction time for the sludge sample
from the aeration tank of the Lüneburg WWTP……………………………………….....177
Figure 8.23: Phosphorus sorption percentages vs reaction time for the sludge sample
from the return sludge line (RS) of the Luneburg WWTP…………………………..…..178
Figure 8.24: Kd coefficients vs reaction time for the S1 (a), S2 (b), Lun-BS (c), and Lun-
RS (d) sludge samples…………………………………………………………………...…183
Figure 8.25: Soil/solution ratios vs Kd coefficients considering the potential phosphorus
sorption percentages for the S1-KCl-2.5 (a), S2-KCl-2.5 (b), S1-KCl-7.5 (c), S2-KCl-7.5
(d), Lun-BS-KCl (e) and Lun-RS-KCl (f) reactors………………………………...…..….185
Figure 9.1: Bacterial survival percentages after the desorption-stabilization-sorption
process using citric acid as eluent during the desorption process…………………..…201
Figure 9.2: Bacterial survival percentages for the S1 and S2 sludge samples after the
desorption-stabilization-sorption process using sulfuric acid (a) and hydrochloric acid
(b) as eluents during the desorption process………………………………………..…...202
Figure 9.3: Bacterial survival percentage for control reactors and after the desorption-
stabilization-sorption process using potassium chloride as eluent………………….…203

xiv
LIST OF TABLES
Table 3.1 Technologies available for phosphorus recovery. Adapted from the work of
Schick, Kratz, Adam, & Schnug, (2009) ...................................................................... 12
Table 3.2: Biochemical transformations described for the anaerobic and aerobic
phases in an EBPR process (Mino, Van Loosdrecht, & Heijnen, 1998; Seviour, Mino, &
Onuki, 2003; Oehmen, et al., 2007). ........................................................................... 21
Table 3.3: Optimal pH values proposed for nitrification, denitrification, acetate uptake
and phosphorus release processes in activated sludge systems ................................ 31
Table 4.1: Scale of nitrate and nitrite concentrations in water samples recorded by the
Quantofix Nitrate/Nitrite test strips (Macherey-Nagel Company) ................................. 49
Table 4.2: Experimental values linking the SVI-relevant stringiness and the SVI values
(Kunst et al., 2000) ..................................................................................................... 54
Table 5.1: Composition of the synthetic wastewater for VFA production. .................... 61
Table 5.2: Variation of the operational parameters during the experimental process of
VFA production. .......................................................................................................... 63
Table 5.3: DIN Norms used for collecting, preserving, storing, and analysis of the
samples during the experimental process of VFA production. ..................................... 64
Table 5.4: Constant operational parameters used in the fermentation reactor. ........... 65
Table 5.5: COD-theoretical equivalences for Volatile Fatty Acids according to Yuan, et
al., (2011) ................................................................................................................... 71
Table 5.6: VFA composition in supernatant at the end of the anaerobic phase of the
fermentation process. ................................................................................................. 74
Table 7.1: Initial basic composition of the synthetic wastewaters (Modified from Liu et
al., 2006). .................................................................................................................. 103
Table 7.2: Carbon sources and C:N:P ratios used in synthetic wastewater in each
reactor during the assessment of the performance of the EBPR process. ................. 104
Table 7.3: Characteristics of the inoculum used in the research of EBPR performance.
................................................................................................................................. 104
Table 7.4: Basic characteristics of the SBR reactors used in the EBPR process
assessment. ............................................................................................................. 105
Table 7.5: Operational parameters used in the SBR reactors during the assessment of
the EBPR process. ................................................................................................... 106
Table 7.6: DIN Norms used for collection, preservation, storage, and analysis of the
samples of the EBPR process. ................................................................................. 108
Table 7.7: Other parameters evaluated and the techniques used during the
assessment of the EBPR process ............................................................................. 108
Table 7.8: C/P, C/N and N/P ratios in the influent and the phosphorus removal
percentages obtained in the S reactors. .................................................................... 119
Table 7.9: Gradual increase of the C/P (BOD5/Ptot) and N/P (Ntot/Ptot) ratios in the
influent during the experimental process. .................................................................. 122
Table 8.1: Characteristics of the activated sludge samples at the time of sampling. . 138
Table 8.2: Distribution of the sludge samples and the number of reactors used per
eluent. ....................................................................................................................... 140
Table 8.3: Characteristics of the eluents used in the desorption process. ................. 141
Table 8.4: C:N:P ratio in the influent synthetic wastewater. ....................................... 142

xv
Table 8.5: Characteristics of the S1 and S2 sludge samples, and concentrations of the
eluents used to reach a pH of 2 or KCl concentration of 20 mmol/l during the desorption
process. .................................................................................................................... 146
Table 8.6: Characteristics of the S1 and S2 sludge samples, and concentration of the
eluents used to reach a pH of 3 or KCl concentration of 30 mmol/l during the desorption
process. .................................................................................................................... 147
Table 8.7: Characteristics of the S1 and S2 sludge samples, and concentrations of the
eluents used to reach a pH of 4 or KCl concentration of 40 mmol/l during the desorption
process. .................................................................................................................... 148
Table 8.8: Characteristics of the S1 and S2 sludge samples and eluent concentrations
used to reach a pH of 5. ............................................................................................ 149
Table 8.9: Selection criteria of the eluents for the remaining desorption-stabilization-
sorption processes. ................................................................................................... 152
Table 8.10: Characteristics of the B2 and B4 sludge samples and eluent concentrations
used to achieve a reaction pH of 3 during the desorption process. ........................... 152
Table 8.11: Characteristics of the Lüneburg-BS and Lüneburg-RS sludge samples and
eluent concentrations used to achieve a reaction pH of 3 during the desorption
process. .................................................................................................................... 153
Table 8.12: Characteristics of the Steinhorst-BS and Steinhorst-RS sludge samples
and eluent concentrations used to achieve a reaction pH of 3 during the desorption
process. .................................................................................................................... 155
Table 8.13: Phosphorus concentration (mg/l) in the aqueous phase at the end of the
desorption, stabilisation and sorption processes. ...................................................... 174
Table 8.14: Phosphorus concentration in the aqueous phase for the sludge samples
from the disposal sludge line of the Steinhorst WWTP (RS-Steinhorst) and from the
return sludge line of the Lüneburg WWTP (RS-Lüneburg). ....................................... 179
Table 8.15: Phosphorus sequestration capacity in mg of total phosphorus per gram of
TSS (mg/g) for the sludge samples before the desorption process (Initial P content)
and at the end of the sorption process (Final P content). .......................................... 180
Table 9.1: Number of repetitions in the Plate Count test according to the eluents and
reactors used during the desorption process. ........................................................... 196
Table 9.2: Bacterial survival results in CFU/ml and in percentage for the S1 sludge
sample. ..................................................................................................................... 199
Table 9.3: Bacterial survival results in CFU/ml and in percentage for the S2 sludge
sample. ..................................................................................................................... 199
Table 9.4: Bacterial survival results in CFU/ml and in percentage for the B2 sludge
sample. ..................................................................................................................... 200
Table 9.5: Bacterial survival results in CFU/ml and in percentage for the B4 sludge
sample. ..................................................................................................................... 201
Table 9.6: Bacterial survival results in CFU/ml and in percentage for the Steinhorst
WWTP sludge sample. ............................................................................................. 201
Table 9.7: Bacterial survival results in CFU/ml and in percentage for the Lüneburg
WWTP sludge samples. ............................................................................................ 202

xvi
LIST OF ABBREVIATIONS
A% Phosphorus sorption percentage
A/O Two – stage high rate PHOREDOX system
A2O Three – stage BARDENPHO system
AcCoA Acetate acetyl CoA
Anammox Anaerobic Ammonium Oxidation
BOD5 Biochemical Oxygen Demand
c(S) Total concentration of Volatile Fatty Acids (VFA) in mmol/l
C:N:P Carbon : Nitrogen : Phosphorus ratio
COD Chemical Oxygen Demand
DO Dissolved Oxygen
EBPR Enhanced biological phosphorus removal
ED Entner-Doudoroff pathway
EDX Energy Dispersive X-ray Spectroscopy
EMP Embden-Meyerhoff-Parmas pathway
F/M Food to Microorganism Ratio
FADH2 Reduce Flavin Adenine Dinucleotide
GAO Glycogen Accumulating Organism
GL Gigaliter
HRT Hydraulic retention time
IFDC The International Fertilizer Development Center
Kd Distribution coefficient
Kdes Apparent desorption coefficient
LPO Lactic Acid Producing Organisms
MCRT Mean Cell Residence Time
Mg Megagram
MLVSS Mixed Liquor Volatile Suspended Solids
Mt Megatonne

xvii
NADH2 Reduce Nicotinamide Adenine Dinucleotide
NMR Nuclear Magnetic Resonance
OLR Organic Loading Rate (mg COD/l.cycle)
PAO Polyphosphate Accumulating Organisms
PHA Polyhydroxyalkanoate
PHB Polyhydroxybutyrate
PMF Proton Motive Force
Ptot Total phosphorus concentration
RAS Return Activated Sludge
RBCOD Readily Biodegradable COD
R-D-N Regeneration-Denitrification-Nitrification process
SBR Sequencing Batch Reactor
SEM Scanning Electron Microscopy
SHARON Single Reactor System for High Rate Ammonium
Removal over Nitrite
SLR Sludge Loading Rate
SRT Sludge Retention Time
SVI Sludge Volume Index
TCA Tricarboxylic Acid Cycle
TFO Tetrad Forming Organisms
TFO Tetrad Forming Organism
TS Total Solids
TSS Total suspended solids
UCT system University of Cape Town System
VFA Volatile Fatty Acids
VFAc VFA composition
VSS Volatile Suspended Solids
WWTPs Wastewater Treatment Plants


1
CHAPTER 1: Introduction
Phosphorus from mined phosphate rock is a crucial resource in the world today.
Agricultural activities all around the world depend on the industrial production of
synthetic fertilizers and, therefore, human food production relies on mined phosphorous
(Cordell & White, 2011). According to various scholars (Tweeten, 1989; Fixen, 2009;
Smit et al., 2009), phosphate rock will be depleted quite soon, estimations for depletion
ranging from 2050 to 2100. However, notwithstanding this very negative prospect,
human use of phosphorus remains extremely inefficient, due to significant loss of
phosphorus during mining extraction, fertilizer production, and crops and livestock
production. Cordell et al., (2009) estimates that approximately the loss of phosphorous
along the route from mining to food is so large that 80% of the mined phosphorus rock
will never be consumed as human food. Similarly, according to Naidu et al., (2012),
only 20% of the phosphorus supplied to agriculture is transferred into agricultural
products. In addition to the urgent attention that the high risk of phosphorus scarcity
demands, the environmental problems caused by phosphorus loss in effluents, which
seriously affects the stability and equilibrium of the natural water bodies, is also a very
large problem. Furthermore, eutrophication due phosphorous in water bodies may
adversely affect potable water treatment making this process more difficult and more
expensive.
The nutrient removal processes used in the wastewater treatment plants (WWTP) may
represent an accessible and suitable possibility for avoiding discharge of effluents with
high phosphorus concentration into natural water bodies. At the same time, these
processes may offer the possibility of significant phosphorus recovery. According to
Cordell et al., (2009) and Rittmann et al., (2011), approximately 15% of mined
phosphorus passes through WWTPs. Thus, WWTPs represent a phosphorus source
that has a high potential to meet the agricultural demand for fertilizers. The methods
currently applied in WWTPs to remove phosphorus are focused on biological
processes such as enhanced biological phosphorus removal (EBPR) and phosphorus
precipitation using metallic salts. The EBPR process can be considered as an
environmentally and economically optimal process for phosphorus removal since it is
based only on a metabolic process. The EBPR process is able, through the
development of a specific bacterial community, to uptake more phosphorus than
needed to cover the bacterial growth process. According to Stensel (1991),
approximately 1.5 - 2% of the sludge dry mass in activated sludge consists of
phosphorus that was assimilated for normal bacterial growth requirements, but in
EBPR bacterial communities 3 - 6% of the sludge dry mass may be phosphorus. This

2
bacterial community, called the phosphorus accumulating organism (PAO), is
responsible for the excess phosphorus uptake that creates the possibility of treating
effluents to have a total phosphorus concentration as low as 0.1 mg/l. However,
despite the benefits of the EBPR process, this system can become unstable and it may
unpredictably lose its phosphorus removal performance, a possibility which remains
unexplained in the literature (Seviour & Nielsen, 2010). Phosphorus precipitation using
metallic salts is a complementary method used to compensate possible bad functioning
of the EBPR process. Thus, EBPR-WWTPs also often utilize phosphorus precipitation
methods using compounds of calcium, magnesium and iron (Tchobanoglous, Burton, &
Stensel, 2003). However, phosphorous precipitation using metallic salts is not an
unproblematic solution.
The use of metallic salts in phosphorus removal processes in WWTPs have several
drawbacks. These include the costs of the chemical compounds that must be used, the
high amount of sludge produced, the damage to subsequent bacterial growth because
of shortage of phosphorus, and the reduction of the biological treatment capacity due to
the increase of the inorganic fraction among others (van Haandel & van der Lubbe,
2012). A further important disadvantage of chemical precipitation relates to the reuse of
the sludge mass in agricultural processes since, after phosphorus precipitation as a
salt, the availability of the phosphorous as fertilizer is limited (Donnert & Salecker,
1999).
On the other hand, the phosphorus removed in an EBPR process not only corresponds
to the phosphorus uptake through metabolic process but also to the sorption process
into the exopolymeric substances (EPS) of the floc. According to Cloete & Oosthuizen
(2001), 30% of the phosphorus content in the sludge biomass corresponds to the EPS
media. Additionally, several investigations have recorded that, although the tetrad
forming organisms (TFO) commonly present in the EBPR bacterial community does not
store intracellular polyphosphate, their cell envelope (EPS) has recorded a positive
staining reaction for polyphosphate in some cases (Cech & Hartman, 1990; Blackall, et
al., 1997; Sudiana, Mino, Satoh, & Matsuo, 1998).
The present research is interested in the sorption process in activated sludge masses
for the phosphorus removal process of wastewater. To date, information about the
sorption process in activated sludge is limited, and almost completely non-existent for
specific bacterial communities.
This work does take into account more generalized information such as, for example:
the structure and composition of the EPS and the strengths involved in the sorption

3
process on activated sludge samples (Müller, 2006; Grupo de Investigación de
Recursos Hídricos - IUPA, 2009), and also the factors involved in the ion exchange
processes (Grupo de investigación de recursos hídricos – IUPA, 2009). With this
information it was possible to develop an idea of the chemical structure of the exposed
surfaces in the floc and about the floc’s superficial charges. Additionally, investigations
on the role of calcium ions in floc stability have shown that even small changes in
calcium concentration may result in the desorption of organic molecules and the
disintegration of the floc (Keiding & Nielsen, 1997).
Estuarine ecosystems are useful to study the ion exchange dynamic and the effects
that a substrate could show after facing constant processes of ion exchange. This
research therefore also looks at these processes in an estuarine ecosystem. In an
estuarine ecosystem, the constant ion exchange of Ca+2 and Na+ between the
sediment (substrate) and the aqueous phase during the high tide phase may slightly
destabilize the chemical structure of the sediment surface because of the loss of the
calcium ion. Subsequently, during the low tide phase, the sediment surface structure
can stabilize again due to the ion exchange process between the calcium bicarbonate
facies of the aqueous media and the sodium ion of the sediment surface. In this
research, it is assumed that this constant ion exchange may promote the release of
active sites in the sediment surface and that these free active sites increase the
sorption capacity of the substrate. Research by Wang & Li, (2010) into the phosphorus
desorption-sorption capacity of different sediments recorded that estuarine sediment
showed the highest phosphorus sorption capacity. The possibility of phosphorus
precipitation was also taken into account by Wang & Li, but the estuarine sediment’s
concentrations of calcium carbonate, iron and aluminum were among the lowest of all
sediments.
On the basis of such data, this research proposes that the sorption capacity of the
activated sludge may be influenced by the type of bacterial community in the sludge
biomass and by sludge environmental conditions such as the pH, aeration and stirring
conditions, which can directly affect floc stability. Additionally, it is proposed that higher
sorption capacity might be observed in substrates that undergo constant processes of
ion exchange with loss and recovery of the calcium ion. Therefore, the possibility of
subjecting the sludge samples to similar variations of ion exchange was investigated,
but using the potassium ion instead of the sodium ion as the exchangeable cation for
the calcium ion.
To test these hypotheses, the first objective was to obtain different bacterial
communities able to perform good EBPR processes. To achieve this aim several SBR

4
reactors, at lab scale, were installed and fed with synthetic wastewater, varying the
carbon source used across the different reactors. These carbon sources were glucose,
mixed VFA and propionic acid. Additionally, activated sludge samples from the
Steinhorst and Lüneburg WWTPs were used. As a secondary objective during this
stage, the EBPR stability and performance was evaluated according to the different
carbon source and the different C:N:P ratios in the influent.
Subsequently, if good EBPR processes were confirmed in the activated sludge
samples, the second objective was to evaluate their phosphorus desorption and
sorption capacity using different eluents such as organic and mineral acids and one ion
exchanger (KCl solution) during the desorption process. Then, the sludge samples
from the desorption process underwent a re-stabilization process using a solution of
CaCl2 and MgCl2. Once the sludge samples were re-stabilized, these were used as
substrates in the subsequent sorption process and a synthetic wastewater volume
containing a specific concentration of phosphorus (adsorbate) was used as contact
solution.
The third objective was the evaluation of the influence that the previous desorption
process using potassium chloride as eluent might have on the phosphorus sorption
capacity of the activated sludge samples. Therefore, after finishing the desorption–
stabilization–sorption process, the total phosphorus content in the sludge masses and
in the aqueous phase was assessed, enabling a comparison of which sludge samples
had increased their phosphorus sequestration capacity at the end of the sorption
process compared to their initial phosphorus concentrations and in relation to the
control reactors.
The possibility of increasing the phosphorus sequestration capacity of the activated
sludge by biological means is of great interest. The benefits of increasing the capacity
of the sludge to retain phosphorus are related to the possibility of reusing these sludge
masses (which are free of metallic salts) as a nutrient source in agriculture and,
additionally, to the possibility of reducing the cost of the treatment, disposal and
incineration processes due to the high phosphorus concentration and low sludge
volumes.

5
CHAPTER 2: Objectives
The information concerning the phosphorus sorption capacity of the activated sludge is
not abundant or even non-existent for specific bacterial communities.
There are some factors that may influence the sorption capacity of the activated sludge
biomasses. Among these factors the physicochemical characteristics of the influent
and the wastewater treatment applied would determine the bacterial community in the
activated sludge. In turn, this investigation proposes that the type of bacterial
community and the environmental conditions of the activated sludge masses would
influence their phosphorus sorption capacity.
To test these hypotheses the following objectives were determined:
1. First objective: To obtain different EBPR bacterial communities according to the
use of different synthetic wastewater. The variations of the wastewater
composition are related to the carbon source and to the C: N: P ratio used.
Additionally, other activated sludge samples from WWTPs are evaluated.
To achieve the first objective, SBR lab scale reactors were installed. The
experimental process was developed in several phases with the following
secondary objectives:
1.1 Secondary objective 1: To obtain effluents with high concentration of volatile
fatty acids (VFA) through the use of one SBR anaerobic reactor using glucose
as carbon source.
1.2 Secondary objective 2: To confirm the presence of the EBPR process in the
different activated sludge samples using staining techniques and the EBPR
performance results.
1.3 Secondary objective 3: To assess the influence of the different carbon
sources and C:N:P ratios in the influent on the EBPR performance.
2. Second objective: To assess the phosphorus desorption and sorption capacity
of the activated sludge samples.
To assess the phosphorus desorption capacity of the activated sludge samples,
different types of eluents were used with determined concentrations of total
suspended solids (TSS) in batch reactors. Subsequently, each sludge sample
underwent a re-stabilization process using a CaCl2 and MgCl2 solution. Finally,
the re-stabilized activated sludge samples were used as substrate in sorption

6
processes where the synthetic wastewater contained a specific concentration of
phosphorus considered as the adsorbate.
3. Third objective: To assess the influence of a previous desorption process using
potassium chloride as eluent on the phosphorus sorption capacity of the activated
sludge samples.
3.1 Secondary objective 4: To determine if the phosphorus sorption capacity of
the activated sludge samples are influenced by the bacterial community structure
and/or by the previous environmental conditions that the sludge samples faced. The
previous environmental conditions of the activated sludge samples are determined
by:
The potassium chloride concentration used during the desorption process.
The environmental conditions as pH, aeration and stirring conditions that the
activated sludge samples faced in their origin reactors.

7
CHAPTER 3: State of Knowledge
3.1 Phosphorus in aquatic systems
Phosphorus (Atomic mass = 30.974) is a chemical multivalent element which because
of its high reactive condition is not be found free in nature (Canadian Council of
Ministers of the Environment, 2004). The fundamental reserves of phosphorus are
located in the Earth's crust in the form of, for example apatite, a mineral contained in
phosphate rock. Phosphorus becomes available for plants through rock weathering or
through extraction of volcanic ash. Subsequently, the phosphorus would be leached
and dumped into the sea where part of the phosphorus would settle to the bottom to
form rocks, from which, it will take millions of years to its phosphorus content reach
again the surface of the earth (Filippelli, 2002).
Phosphorus is an essential component of the organisms. Organisms contains about
0.3% of dry weight as phosphorus (Horne & Goldman, 1994) that forms part of the
nucleic acids (DNA and RNA); ATP the principal stock of chemical energy;
phospholipids and other organic molecules. As an example, in plants a phosphorus
proportion of 0.2% (Miraj, Shah, & Arif, 2013) of dry mass is mentioned while in
animals this proportion can increase up to 1% (Vitti & Kebreab, 2010). The little
amount of phosphorus present in the organisms is not proportional to its importance
since when comparing phosphorus with the other macromolecules in living organisms,
phosphorus is the least abundant but almost always the first to limit biological
productivity (Wetzel, 2001)
3.2 Forms of phosphorus in aquatic systems
It can be generalized that unimpacted water bodies contain low phosphorus
concentrations that may range from < 1 ug/l in ultra-oligotrophic waters, to >200 ug/l in
highly eutrophic waters with an average between 10 and 50 ug/l as total phosphorus
(Wetzel, 2001).
The phosphorus in aquatic systems is present in two principal forms: Organic and
inorganic phosphorus. More in detail, inorganic phosphorus is not associated with a
carbon based molecule while the organic phosphorus can be subdivided in particulate
organic phosphorus and dissolved organic phosphorus (Canadian Council of Ministers
of the Environment, 2004). Among all these forms of phosphorus, the most significant
inorganic phosphorus form is present as orthophosphate ions (𝑃𝑂43−) and is the only

8
form of soluble inorganic phosphorus directly utilized by aquatic primary producers.
However, in fresh water up to 95% of the phosphorus is present as organic phosphate
and included or adsorbed as part of inorganic matter or organic dead matter.
Because of anthropogenic activities, the input of phosphorus into water bodies may
increase and this fact may adversely affect the aquatic ecosystems (Chambers, et al.,
2001). When a water body receives an input of phosphorus that exceeds the normal
phosphorus concentration the first response to this addition is the increase of plants
and algae productivity causing an eutrophication problem. Generally, the source of this
excess of phosphorus input are the secondary wastewater treatment methods because
the increase amount of the urbanized human population. For example, the use of
polyphosphate-based detergents has contributed to the problem (Reynolds and
Davies, 2001), the industrial effluents and runoff from fertilizers and manure spread on
agricultural areas (Ansari et al., 2011).
3.3 Problems with phosphorus excess in aquatic systems
Through the eutrophication the decomposition of the primary producers consume the
dissolved oxygen (DO) and because the oxygen depletion the aerobic organisms will
decrease in concentration. Simultaneously, as the death rate of the aerobic organisms
increase the oxygen consumption will increase so far than the oxygen concentration
becomes limiting. At this point the water bodies would change their condition from
aerobic to anaerobic. These environmental changes may cause adverse effects such
as the emergence of a dominant organism therefore the biodiversity index would
decrease. Additionally, the replacement of indigenous organisms for other more
tolerant and the high amount of organic matter in decomposition would increase the
amount of sediments and simultaneously the turbidity (Mason, 1991). Finally, under
anaerobic conditions the bloom development of cyanobacteria is reported and at the
same time the risk of toxic compounds that may cause severe effects to the organisms
(Ansari, Singh Gill, Lanza, & Rast, 2011).
Directly related to human quality life, the eutrophication may affect adversely the
potable water treatment making this process more expensive and difficult. The
recreational use of eutrophic water is affected also because taste, health or odor
problems (Van Horn, et al., 1991) and some species of fishing interest could be
displaced from their ecosystems (Mason, 1991).

9
On the other hand, phosphorus as chemical element is not considered toxic for aquatic
organisms as well as for us in concentrations and forms normally found in natural
environments therefore the limitations for this element may not be determined as for
example for heavy metals. However, the discharge of effluents to water bodies has
generally specific limitations of phosphorus concentration trying to minimize the
adverse effects aforementioned.
3.4 The problem of phosphorus starvation
Humans are highly dependent today on phosphorus from mined phosphate rock.
Although a plentiful source of highly concentrated phosphorus apparently exists,
phosphorus is still being a non-renewable resource. Phosphate rock as the principal
source of phosphorus for the fertilizer manufacturing has a renewable cycle between
the lithosphere and hydrosphere that takes a long time of “millions of years” therefore is
considered non-renewable. The economical importance of phosphorus is better
understood when is taken into account that the phosphorus cannot be obtained by
synthetic elaboration and that there is no substitute for phosphorus in crop growth,
therefore in food production.
The phosphorus consumption has increased further after the Second World War with
the industrial production of fertilizers, such a manner that fertilizer use increased six-
fold between 1950 and 2000 (International Fertilizer Industry Association - IFA, 2008).
The principal use of the phosphate rock resources is in the agricultural fertilizer
industry. The natural biochemical cycle, which recycles phosphorus back to the soil via
dead plant matter is severely injured by the mechanisms used in the Industrial
Agriculture since they remove all the crops (P source) without leaving residues for the
possibility to phosphorus recovery naturally, therefore the continuous need of
phosphorus rich fertilizer is understandable. Additionally other consequences of
mobilizing excess nutrients into the environment become evident in the past decades
as the eutrophication problems in natural water bodies (Barnard, Elimination of
eutrophication through resource recovery, 2009).
In this chapter the actual and future scarcity of phosphorus is analyzed. To determine a
scarcity problem it is necessary to determine the total amount of resource available to
be used. There are some problems to determine the remaining time of phosphate rock
availability from natural sources for meeting the future demand. According to Cordell &
White, (2011) in the earth crust should be around 4,000,000,000,000,000 tons P, thus,
geochemically this element may not be considered in scarcity situation. The
phosphorus scarcity problem is related to the depletion of high-concentration

10
phosphate rock reserves and the economic and energetic barriers of their exploitation.
The International Fertilizer Development Center (IFDC) estimate the phosphate rock
reserves in 60 tons x 109 (U.S.Billion) as product (Van Kauwenbergh, 2010) and the
US Geological Survey taking into account this last estimation updated their reserves for
Morocco from 5600 to 51000 Mt of phosphate rock (85% of the phosphate rock
reserves) considering that this estimations are preliminary (Van Kauwenbergh, 2010;
Global Phosphorus Research Initiative - GPRI, 2010).
3.4.1 Mismanagement of the phosphorus resource
As was already mentioned the phosphate rock reserves are the principal source of
phosphorus but because the extremely inefficient use of the resource the losses of it
are giving a final amount of phosphorus consumed as food of up 3 x 10⁶ tones p/year
(Cordell & White, 2011).
Phosphorus loss begins already during mining and fertilizer production where
approximately 30 – 40% of phosphorus can be lost during extraction and primary
processing (Cordell & White, 2011). Meanwhile, much of the phosphorus used in
cropping and livestock systems will remain in the soil and in manure respectively.
Additionally, according to Cordell, Drangert, & White, (2009) approximately 80% of
mineral bond phosphorus rock will never be consumed as human food and according
to (Naidu, Lamb, Bolan, & Gawandar, 2012) only 20% of the phosphorus supplied to
agriculture is transferred into agricultural products, of which, only 8% of this would be
found in municipal wastewaters. The phosphorus loss from wastewater is proportionally
low to other areas compared to mining and agricultural activities but the phosphorus
recovery from a WWTP is possible and accessible. For some countries with evident
water scarcity the reuse of wastewater provides an option of water and nutrients for
agricultural uses. As examples of the possibility to cover the phosphorus agricultural
demand with the phosphorus recovered from a WWTP, the Australia and New Zealand
cases are presented. In Australia, approximately 3300 GL of domestic effluent are
discharged into surface waters per year. The total mass of phosphorus contained in
this effluent is 5 x 10⁶ Mg P. In comparison the total phosphorus consumption of
fertilizers is 0.28 x 10⁶ Mg P thus the amount of phosphorus contained in the domestic
effluent would be able to cover the agricultural demand 20 times. Meanwhile, in New
Zealand yearly approximately 550 GL of domestic effluent is discharged into surface
waters and the total mass of phosphorus contained in this effluent is 0.4 x 10⁶ Mg P.
Similarly to the last case, the total phosphorus consume by fertilizers is 0.04 x 10⁶ Mg
P, thus the amount of phosphorus contained in the domestic effluent would cover also

11
the agricultural demand 10 times. These calculations are very simple but to recover the
phosphorus contained in the effluents it is a continuous matter of investigation that
means to improve the wastewater treatment performance. However, these calculations
present the possibility to cover the agricultural phosphorus demand of some countries
by recycling the phosphorus from the WWT systems (Naidu, Lamb, Bolan, &
Gawandar, 2012)
The demand of phosphorus is now stabilized in Europe and North America because
decades of fertilizer over-applications to soils but the demand in developing countries
and emerging economies would still increase thus the supply of high grade phosphate
rock would be constrained in the future. By dividing the total phosphate rock reserves
by the average annual consumption the lifetime of the phosphorus reserves could be
estimated. According to Tweeten, (1989); Fixen, (2009) and Smit, Bindraban,
Schröder, Conijn, & van der Meer, (2009) the estimated year of phosphorus depletion
would be around 2050 and 2100 assuming in some cases an increase in demand or
taking into account the current rate of extraction.
The evident reason for the increase of the phosphorus demand lays in the increasing
population growth (approximately 9 billion in 2050), but there are other reasons as the
change in the diet preference around the world towards more meat consumption which
require more phosphorus fertilizers per capita (FAO, 2006; Cordell, Drangert, & White,
2009) and the increasing demand of crops to be used in biofuels production
(International Fertilizer Industry Association - IFA, 2008).
3.4.2 Management and technology approaches to phosphorus recovery
To face the complex problem of phosphorus scarcity an integrated approach should be
considered. This approach may include diversifying the source of phosphorus by
investigating the production of renewable phosphorus fertilizers and the phosphorus
recovery from all sources of loss (manure, wastewater, crop and food residues).
Additionally, the reduction of the phosphorus demand by increasing the efficiency of
the phosphorus use in mining, agricultural and food chain should be considered.
As already mentioned one of the main phosphorus sources that can cause
eutrophication problems in water bodies is the phosphorus content in the urban waste
water. Therefore, the environmental impact and the loss of phosphorus would be
considerable. According to Cordell, Drangert, & White, (2009) and Rittmann, Mayer,

12
Westerhoff, & Edwards, (2011), approximately 15% of mined P is estimated to flow
through WWTPs (7 % solids, 8% discharged).
To recover the phosphorus from the wastewater the development of new systems and
the improvement of the already existing phosphorus recovering mechanisms would be
necessary as well. The phosphorus recovery process from a WWTP is performed
actually using some technological designs that are based in phosphorus precipitation,
use of chemicals and thermal process principally. These technologies can be applied
considering different locations in the wastewater treatment system, thus, can be
applied in the watery phase, the dewatered sewage sludge phase and the sewage
sludge ash phase. Table 1 shows some of these technologies and their efficiency of
phosphorus recovery.
Table 3.1 Technologies available for phosphorus recovery. Adapted from the work of Schick,
Kratz, Adam, & Schnug, (2009)
Point of P
recovery
Volume or
mass to
treat
Suitable for
application
Percentage of P
recovery
Technology
applied Specific process
Watery
phase Very high
volume Not efficient -
Precipitation
Process Berliner
Wasserbetrieb Air
Prex (Heinzmann,
2008) Effluent
Process
water
Much
lower
volume
Applicable 30 – 45% from P
imput Crystallization
DHV-Crystalactor
The Ostara Pearl
Dewatered
or dried
sewage
sludge
Reduced
mass to be
treated
Applicable
>90% of P
influent (10 g
P/kg DM)
Wet chemical Seaborne / Gifhorn
Process.
Crystallization CSH-Process
Darmstadt
Thermal Mephrec process
Sewage
sludge ash
(SSA)
Reduced
mass to be
treated
Applicable
>90% after
monoincine-
ration (64 g/kg)
Wet chemical
Sephos process
PASH process
Thermal
BAM/AshDec
processElectro
thermal P
There are some requirements that the phosphorus obtained from a recovery process
should fulfill before usage. Some of the requirements can difficult the reuse of the
phosphorus and among these the following chemical characteristics of the phosphorus
recovered are the most important as the low phosphorus content in relation to the high
amount of heavy metals, the reactivity problems in the wet chemical processes, the

13
chemical quality stability of the phosphorus and the prove of its agronomic production
efficacy. Other requirements are related to the economical viability of the technology
applied and the environmental acceptability of this technology. These last two
requirements can be limiting factors for the reuse of phosphorus (Schick, Kratz, Adam,
& Schnug, 2009)
3.5 Biological wastewater treatment for phosphorus removal
3.5.1 Phosphorus removal from wastewater using activated sludge
The biological phosphate removal was first mentioned by Srinath, Sastry, & Pillai,
(1959) in a wastewater treatment process where they observed that the sludge from
some treatment plant recorded a higher uptake of phosphorus than the normal for cell
growth during the aeration phase. To demonstrate that this higher uptake of
phosphorus was a biological process the researchers used a metabolism inhibitor.
Later this process was called enhanced biological phosphorus removal (EBPR).
Subsequently, Barnard, (1976) introduced the anaerobic/aerobic cycling in the
activated sludge system known as Phoredox principle.
The activated sludge methodology consists to obtaining a bacterial community in the
form of sludge from a wastewater treatment plant, which is responsible for removing
(through metabolic, physicochemical and other processes) the nutrients (carbon,
nitrogen and phosphorus) and other substances and compounds present in the influent
wastewater. The aim of this treatment is to obtain an effluent with a concentration of
these substances which meet the discharge or reuse requirements of the regulations.
The EBPR process, purely metabolic, promotes the development of a special bacterial
community that will be able to include in their cytoplasm a greater amount of
phosphorus in the form of polyphosphate than other bacterial communities (Stensel,
1991; Mino, Van Loosdrecht, & Heijnen, 1998). The ability to achieve a constant and
stable phosphorus removal performance of this community is one of the objectives of
the current scientific community, as this process has variations in performance of
removal which have not been clarified so far (Jenkins & Hermanowicz, 1991; Neethling
et al., 2005)

14
3.5.2 Wastewater quality – A challenge for wastewater treatment.
The activated sludge systems should be strong. The composition and amount of the
influent wastewater represents a challenge for the bacterial community as they need to
face different chemical compounds as bioactive farmaceuticals (Ternes, 1998),
surfactants (Kraigher et al., 2008), endocrine compounds (Lozada, et al., 2004) and
phthalate esters used as plasticizer (Marttinen et al., 2003). Some of this chemical
compounds would be adsorbed and/or degraded (Lozada et al., 2004) but other,
because their toxic condition, would not be degraded (Byrns, 2001).
These toxic chemicals could affect seriously the performance of the WWTP (Seviour &
Nielsen, 2010) therefore monitoring the presence of these compounds is of interest.
For example some technologies were developed to identify the presence of stress
proteins and to identify an increase in the level of the precursor 16S rRNA in cells
exposed to primary effluents. The presence of this precursor would indicate a damage
caused by chemicals in the influent or from metabolic products of less hazardous
substrates (Stroot & Oerther, 2003). The use of commercial kits that employ specific
bacterial strains are able to predict the effect of influent toxic chemicals from industrial
wastes in the WWTPs but the frequency of its use is unclear. Other compounds as
endocrine disrupters (degradation products of alkylphenol polyethoxylate, natural and
synthetic oestrogens) although do not represent a direct problem for the activated
sludge process they may affect seriously the organisms development.
After the activated sludge treatment, low but biologically active levels of endocrine
disrupters could often be found in the effluent therefore, additional treatment processes
as nanofiltration and reverse osmosis would be required to improve the removal
efficiency of these chemicals (Ternes et al., 2003).
Heavy metals may represent another challenge to the activated sludge bacterial
community as they can be present in domestic and industrial wastewater and in the
specific cases of chromium, cadmium, mercury and nickel they can affect their
adsorption to the sludge mass and the general performance of the plant (Dilek,
Gokcay, & Yetis, 1998; Vankova, Kupec, & Hoffmann, 1999; Yetis, Demirer, & Gokcay,
1999). Additionally, their biocidal effects may affect negatively the respiration process
and the nitrification rates (Madoni, Davoli, & Guglielmi, 1999).

15
3.5.3 Wastewater treatment plants configurations
The next section was prepared considering the publications of Seviour & Nielsen,
(2010), and Wiesmann, Choi, & Dombrowski,(2007).
The basic design of the activated sludge plants changed little over the preceding 100
years; the only innovation is the incorporation of more sophisticated instrumentation for
the in situ monitoring of the activated sludge process. The aerobic reactor still been a
rectangular basin with air diffusers located submersed on it, in the clarifier the solid
phase will be separated from the supernatant and this settled sludge will be recycled to
inoculate the incoming wastewater (Tchobanoglous, Burton, & Stensel, 2003). Initially
the activated sludge system was designed to remove carbonaceous material from
domestic wastewater which additionally contained organic compounds and to produce
effluents with a BOD5 concentration low enough to be discharged into natural water
bodies. Subsequently, because ammonia (NH3) was recorded to be toxic for fish its
content in the effluent had to be reduced also and the WWTPs were re-designed to
improve the nitrification process. Later, concerning about the eutrophication problems
in natural water bodies, it became necessary to re-design the WWTP to remove
nitrogen and phosphorus by biological means.
The actual designs of the WWTPs comprise the addition of some reactors with the aim
to provide different environmental conditions that are suitable for specific bacterial
communities. For example, the incorporation of anoxic zones with high concentrations
of nitrate are appropriate for denitrification processes and the anaerobic zones provide
the appropriate environment to the development of PAO microorganisms since they
would not need to compete with other bacterial groups for the carbon source.
The real situation about the phosphorus removal in wastewater treatment plants could
be summarized when taking into account that the regulations about the phosphorus
content in the effluents are achieved in most countries by applying the technology of
chemical phosphorus precipitation with metallic salts and not by improving the design
of the biological processes (Seviour & Nielsen, 2010).
Actually, most activated sludge systems run continuously but they can be differentiated
from each other from their mixing regimes (Gray, 1990; Grady, Daigger, & Lim, 1999;
Tchobanoglous, Burton, & Stensel, 2003). These can be the plug flow or completely
mixed systems.
The plug flow system, because of the absence of agitation becomes a problem of
irregular load distribution therefore the oxygen demand would be not balanced (Figure
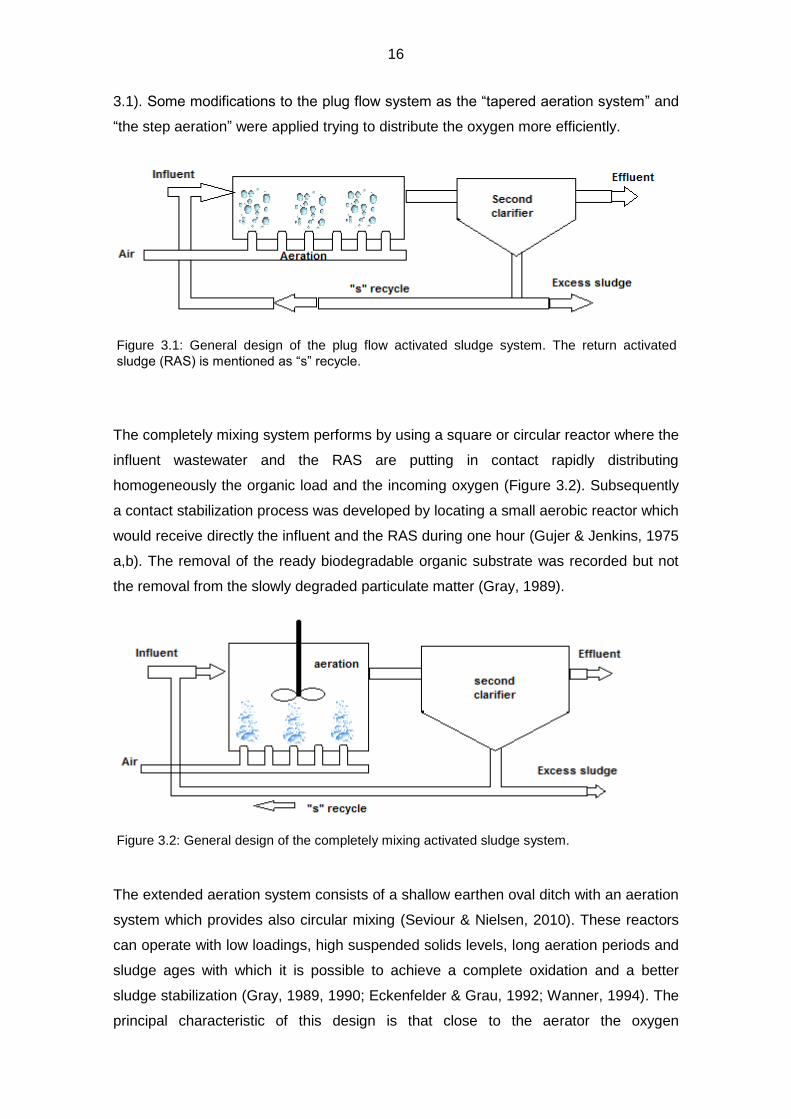
16
3.1). Some modifications to the plug flow system as the “tapered aeration system” and
“the step aeration” were applied trying to distribute the oxygen more efficiently.
The completely mixing system performs by using a square or circular reactor where the
influent wastewater and the RAS are putting in contact rapidly distributing
homogeneously the organic load and the incoming oxygen (Figure 3.2). Subsequently
a contact stabilization process was developed by locating a small aerobic reactor which
would receive directly the influent and the RAS during one hour (Gujer & Jenkins, 1975
a,b). The removal of the ready biodegradable organic substrate was recorded but not
the removal from the slowly degraded particulate matter (Gray, 1989).
The extended aeration system consists of a shallow earthen oval ditch with an aeration
system which provides also circular mixing (Seviour & Nielsen, 2010). These reactors
can operate with low loadings, high suspended solids levels, long aeration periods and
sludge ages with which it is possible to achieve a complete oxidation and a better
sludge stabilization (Gray, 1989, 1990; Eckenfelder & Grau, 1992; Wanner, 1994). The
principal characteristic of this design is that close to the aerator the oxygen
Figure 3.1: General design of the plug flow activated sludge system. The return activated
sludge (RAS) is mentioned as “s” recycle.
Figure 3.2: General design of the completely mixing activated sludge system.
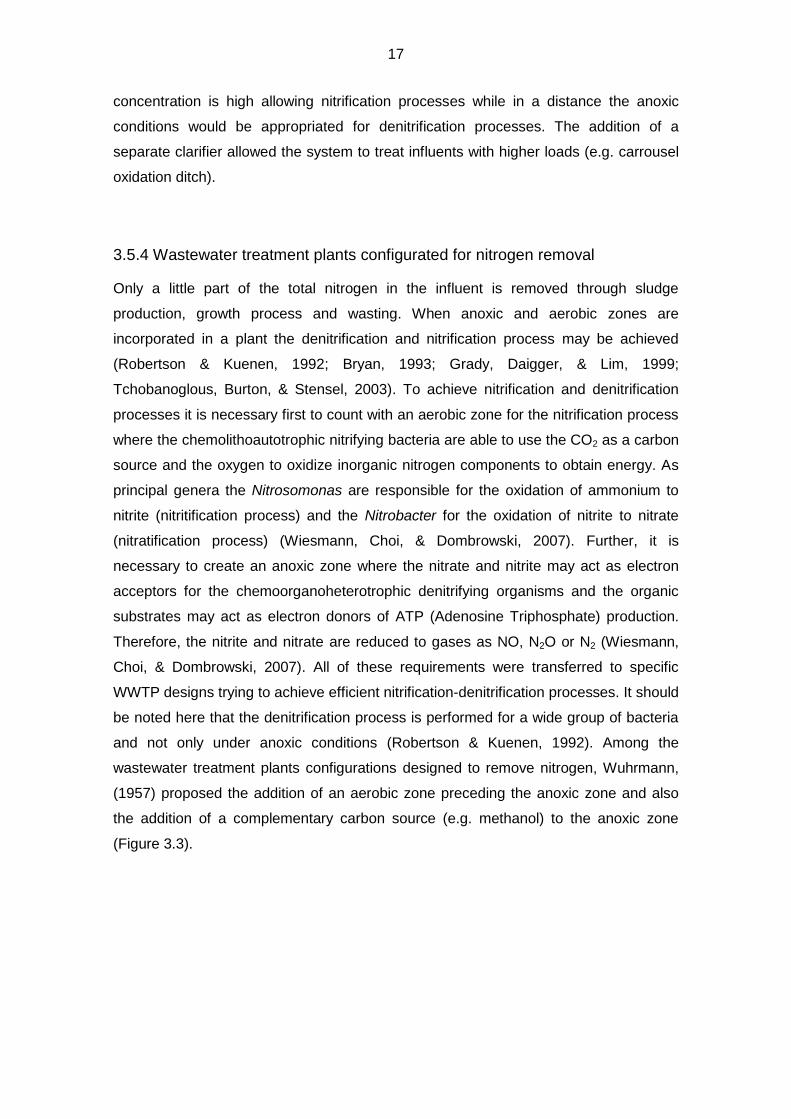
17
concentration is high allowing nitrification processes while in a distance the anoxic
conditions would be appropriated for denitrification processes. The addition of a
separate clarifier allowed the system to treat influents with higher loads (e.g. carrousel
oxidation ditch).
3.5.4 Wastewater treatment plants configurated for nitrogen removal
Only a little part of the total nitrogen in the influent is removed through sludge
production, growth process and wasting. When anoxic and aerobic zones are
incorporated in a plant the denitrification and nitrification process may be achieved
(Robertson & Kuenen, 1992; Bryan, 1993; Grady, Daigger, & Lim, 1999;
Tchobanoglous, Burton, & Stensel, 2003). To achieve nitrification and denitrification
processes it is necessary first to count with an aerobic zone for the nitrification process
where the chemolithoautotrophic nitrifying bacteria are able to use the CO2 as a carbon
source and the oxygen to oxidize inorganic nitrogen components to obtain energy. As
principal genera the Nitrosomonas are responsible for the oxidation of ammonium to
nitrite (nitritification process) and the Nitrobacter for the oxidation of nitrite to nitrate
(nitratification process) (Wiesmann, Choi, & Dombrowski, 2007). Further, it is
necessary to create an anoxic zone where the nitrate and nitrite may act as electron
acceptors for the chemoorganoheterotrophic denitrifying organisms and the organic
substrates may act as electron donors of ATP (Adenosine Triphosphate) production.
Therefore, the nitrite and nitrate are reduced to gases as NO, N2O or N2 (Wiesmann,
Choi, & Dombrowski, 2007). All of these requirements were transferred to specific
WWTP designs trying to achieve efficient nitrification-denitrification processes. It should
be noted here that the denitrification process is performed for a wide group of bacteria
and not only under anoxic conditions (Robertson & Kuenen, 1992). Among the
wastewater treatment plants configurations designed to remove nitrogen, Wuhrmann,
(1957) proposed the addition of an aerobic zone preceding the anoxic zone and also
the addition of a complementary carbon source (e.g. methanol) to the anoxic zone
(Figure 3.3).

18
Ludzack & Ettinger, (1962) placed an anoxic reactor in front of the aerobic reactor to
receive the incoming wastewater. Because most of the organic material was consumed
in the anoxic reactor, the remaining organic material available to heterotrophic bacteria
in the aerobic zone is lower. Therefore the heterotrophic community was reduced and
the competition for the dissolved oxygen also, and hence the nitrification process was
increased (Tchobanoglous, Burton, & Stensel, 2003). The mixing of anoxic and aerobic
zones was achieved using aerators, but controlling the mixing process was not always
possible (Bryan, 1993). Further, the separation of the anoxic and aerobic zones and
the recycling of the aerobic and the second clarifier sludge to the anoxic reactor was
considered by Barnard (1975 a, 1975 b, 1976). This modification was called modified
Ludzack-Ettinger process and can not remove totally the nitrate content as the
recirculation from the aerobic reactor may bring back some nitrate (Bryan, 1993).
Later, Barnard designed a four stage system called BARDENPHO PROCESS (Figure
3.4) which consists of an anoxic reactor followed by an aerobic reactor and
subsequently a second anoxic reactor followed by a re-aeration reactor. The
recirculation masses were taken from the aerobic and the second clarifier reactors to
the first anoxic reactor. In the second anoxic and the re-aeration reactors almost all the
nitrate may be removed. This system is able to remove also phosphorus.
Trying to overcome the limitations of the previous nitrogen removal process the R-D-N
process (Regeneration-Denitrification-Nitrification) was developed by Kos et al. (1992).
Figure 3.3: The Wuhrmann (1957) activated sludge configuration for nitrogen removal.
Figure 3.4: The BARDENPHO PROCESS activated sludge configuration for nitrogen removal.

19
A contact stabilization reactor for regeneration was added at the beginning of the
system (Figure 3.5) where the RAS was re-aerated. With this addition the sludge age
of the aeration phase was prolonged and the volume of the nitrification reactor was
reduced.
Lately, as a result of a joint effort between engineers and microbiologists some new
methods were developed for nitrogen removal. The SHARON (Single Reactor System
for High Rate Ammonium Removal over Nitrite) was designed to remove nitrogen over
nitrite in concentrated wastewater (Van Dongen, Jetten, & van Loosdrecht, 2001). This
process is known for not to retain sludge, since the growth and washout of sludge are
equilibrated. Additionally, it is important to maintain a low pH or low oxygen
concentrations to inhibit nitrite oxidation (Van Kempen et al., 2001). Other strategy to
limit the nitrite oxidation is to operate at temperatures higher than 25 °C which
promotes the fast growing of Nitrosomonas (regeneration time = 8 – 36 hours) in
comparison to Nitrobacter (regeneration time = 12 – 60 hours) which can be purged to
the system.
This process needs less aeration, when nitrite is the end product searched. Therefore,
only a partial nitrification occurs and a lower amount of organic substrate would be
required since only nitrite would need to be reduced to dinitrogen gas (Schmidt, et al.,
2003; Seviour & Nielsen, 2010).
The ANAMMOX (Anaerobic Ammonium Oxidation) process reduces the nitrite to
dinitrogen gas under anoxic conditions, where the ammonium (NH4+) is the electron
donor (Mulder et al., 1995; Helmer, et al., 2001). This process is performed by certain
chemolithoautotrophic bacteria that belong to the order planctomycetes. These
organisms are autotrophic and converting nitrite into nitrogen gas without using organic
carbon since the electron donor would be the ammonium. The low sludge production,
the reduction of the energy requirements during aeration (60%), the reduction in the
use of chemicals for neutralization and the considerable reduction of the CO2
emissions makes this process of a great interest since the cost reduction compared to
Figure 3.5: The R-D-N PROCESS for nitrogen removal.

20
conventional nitrogen removal systems is considerable (Van Dongen, Jetten, & van
Loosdrecht, 2001)
3.5.5 Configuration of wastewater treatment plants for phosphorus removal
3.5.5.1 Metabolic processes in the EBPR system – Metabolic models
Later some of the designs mentioned above were modified to enable the removal of
nitrogen and phosphorus simultaneously.
The phosphorus required for bacterial growth and energy source accounts for up to 2%
of the total bacterial mass. Meanwhile, through the in excess biological phosphorus
removal, some bacterial groups are able to store up to 6% of its dry mass as
phosphorus (Stensel, 1991). This in excess phosphorus removal was called Enhanced
Biological Phosphorus Removal (EBPR) and its operational requirements started to be
elucidated thanks to the efforts of Barnard (Barnard, 1994; Barnard, 1998; Wentzel et
al., 1991 a,b). In general terms these requirements can be summarized as follows:
An initial anaerobic zone which receives the raw wastewater (feed stage). This
stage would be appropriated for the development of the polyphosphate
accumulating organisms (PAO) since these microorganisms would be able to
uptake the carbon source (principally as VFA) under anaerobic conditions,
hence, the competition with the heterotrophic community for carbon sources
would be limited.
The aerobic heterotrophic bacteria are not the only competitor of PAO for
carbon sources. In presence of nitrate, during the no aerated phase, the
denitrifier community is able, as well, to use the VFA as electron donors;
therefore, controling the presence of nitrate in the anaerobic zone is necessary.
Subsequently, it is necessary to count with an aerobic zone (famine stage)
where the phosphorus is assimilated as intracellular polyphosphate chains. The
amount of phosphorus uptaken during the aerobic phase exceeds the amount
of phosphorus released during the anaerobic phase. The anaerobic – aerobic
cycles should be alternated to promote the development of PAO (Mino, Van
Loosdrecht, & Heijnen, 1998; Barnard & Abraham, 2006).
The application of the EBPR process in real scale was performed empirically (Mino,
Van Loosdrecht, & Heijnen, 1998; Tchobanoglous, Burton, & Stensel, 2003). Later, the
metabolic processes involved in the EBPR process began to be understood as the
microbiological conditions were becoming clearer. Some metabolic models were

21
developed trying to explain the biochemical dynamic in the EBPR process. These
models are based on measurements of chemical transformations in mixed liquor
(Seviour & Nielsen, 2010) and on microscopic techniques as staining techniques
(Serafim, et al., 2002). Additionally, it is assumed that a single PAO population, with
homogeneous metabolic behavior, performs the EBPR metabolic process (Seviour &
Nielsen, 2010). However, most part of the research in EBPR metabolism were
developed using mixed bacterial communities. Even though, some investigators
mentioned the use of enriched PAO sludge; this term would mean that a considerable
percentage of these biomasses were recorded as PAO but the complete composition
of the biomass stills being a mixed community.
Traditionally the EBPR biochemical behavior was described as a process that should
perform the following biochemical transformations:
Table 3.2: Biochemical transformations described for the anaerobic and aerobic phases in an
EBPR process (Mino, Van Loosdrecht, & Heijnen, 1998; Seviour, Mino, & Onuki, 2003; Oehmen
et al., 2007).
Anaerobic phase
Aerobic phase
The short chain VFA in mixed
liquor are rapidly uptaken and
converted into PHA. The specific
composition of the PHA depends
on the composition of the VFA
(e.g. if acetate is the VFA
available, the PHA obtained will be
the poly-β-hydroxybutyrate - PHB).
The intracellular polyphosphate
concentration decreases and the
orthophosphate concentration in
the aqueous phase increases.
Other intracellular storage
polymers are degraded (e.g.
glycogen).
The intracellular PHA
concentration decreases and the
biomass growth rate increases.
The intracellular polyphosphate
concentration increases as the
orthophosphate concentration in
the aqueous phase decreases.
The storage of intracellular
polymers is replenished.
Several models of EBPR metabolism have been proposed based on the biochemical
transformations above mentioned (Table 3.2) and two of them are the most widely
accepted. These models consider acetate as the ideal carbon source.

22
a. COMEAU-WENTZEL Model
The Comeau (Comeau et al., 1986) - Wentzel (Wentzel et al., 1986) model was the first
model proposed to explain the EBPR chemical transformations. In summary, this
model suggests that during the anaerobic phase in presence of a carbon source the
intracellular polyphosphate is degraded to provide ATP which will be used to
synthesize the energized form of acetate acetyl CoA (Ac CoA) and will reestablish also
the proton motive force (PMF) consumed during the substrate transport. A part of the
Ac CoA will be oxidized using the route of the Tricarboxylic Acid Cycle (TCA) and
hence the NAD will be reduced to NADH. The reducing power of the NADH should be
enough to convert the Ac CoA into PHB. Because of the degradation of the ATP, some
orthophosphate will be released to the aqueous phase and some cations as calcium
(Ca2+) and magnesium (Mg2+) will be also co-transported with the orthophosphate
(Seviour & Nielsen, 2010). Subsequently, during the aerobic phase (Phamine phase
where almost all carbon source was consumed) the stored PHA is oxidized using the
TCA route and this oxidation process will generate the PMF to produce ATP, and this
ATP will be used to replenish the intracellular polyphosphate stores.
There are some inconsistencies in this model, such as, for example, that the amount of
NADH2 produced will not be enough to produce the PHA mentioned, since the PHAs
are higher reduced than acetate. Other inconsistency lays on the fact that the FADH2
(Reduce Flavin Adenine Dinucleotide) will be accumulated in the TCA cycle during the
Figure 3.6: EBPR metabolism according to the Wentzel-Comeau model. (Redraw from
Seviour & Nielsen, 2010).

23
anaerobic phase from the oxidation of succinate to fumarate. Because during this
phase there is no oxygen available as electron acceptor, the accumulation of FADH2
will block the TCA cycle and also the PHA storage. Research by Garcia-Martin, et al.,
(2006) on metagenomic analysis of a PAO enriched sludge sample suggested how the
bacterial metabolism overcomes this FADH2 accumulation during the anaerobic phase.
In this research, the anaerobic oxidation of FADH2 was proposed using quinones as
electron acceptors; these reduced quinones would transfer the electrons to NAD (P)+.
This last process would be catalyzed by a novel cytochrome b/b6 but its role needs to
be confirmed.
b. MINO Model
As mentioned above, in the stoichiometric balance, the amount of reducing power
(NADH) obtained from the oxidation of acetate through the TCA route would not be
enough to produce the PHA stored. Therefore, other source of this reducing power
should exist.
Mino et al., (1987) proposed that the reducing power not only would come from the
acetate oxidation but also from the anaerobic degradation of the intracellular glycogen.
Part of the glycogen would be oxidized using the TCA route to CO2 and other part to
AcCoA. Further research (Arun, Mino, & Matso, 1988) supported the Mino model when
observed that intracellular carbohydrates were consumed during the anaerobic acetate
uptake and PHA production. Apparently, these carbohydrates would be degraded and
converted to AcCoA by the Embden-Meyerhoff-Parmas (EMP) pathway and from this
reaction the NADH would be obtained. Research by Hesselmann et al., (2000)
proposed that the glycogen degradation occurs using the Entner-Doudoroff (ED)
pathway but these results are not consistent with the genomic analysis proposed by
Garcia-Martin et al., (2006).
Other contribution of the Mino model refers to the energy source required for the EBPR
process (Figure 3.7). According to the Mino model, the energy required during the
anaerobic phase has several sources. As proposed, not only the degradation of the
stored polyphosphate will provide the energy required, but also the glycogen
catabolism is proposed as a source of ATP for the substrate assimilation, PHA
synthesis and cell maintenance. With these two modifications the Mino model seems to
reflect more accurately the biochemical processes that occur in the EBPR process
(Mino et al., 1998; Seviour, Mino, & Onuki, 2003).

24
Further research supported the Mino model. Research by Satoh et al., (1992), and
Smolders et al., (1994 a) reported that the anaerobic transformation of acetate, PHB,
glycogen and CO2 fitted with the stoichiometric balance proposed in the Mino model.
As mentioned above the Wentzel-Comeau model proposed that the acetate oxidation
provided the NADH reducing power, but research by Bordacs & Chiesa, (1989)
observed that the acetate was not oxidized to CO2 through the full TCA route when
used radiolabeled acetate as carbon source (Seviour & Nielsen, 2010). Additionally,
Kong, Nielsen, & Nielsen, (2004) using metabolic inhibitors and a PAO model strain
observed that the NADH obtained during the anaerobic phase came from a glycolisis
process and not from a TCA cycle. Meanwhile, according to Pereira et al., (1996) and
Hesselmann et al., (2000) the glycogen degradation alone would not be able to provide
enough NADH reducing power to produce the PHA synthesis during the anaerobic
phase, therefore it seems that both metabolic processes i.e. acetate-TCA cycle and
glycogen-anaerobic degradation will provide the reducing power required for the
synthesis of PHA. This assumption was confirmed later on a full scale EBPR research
(Pijuan et al., 2008).
3.5.6 Wastewater treatment plants configurations for EBPR processes
The metabolic models mentioned above are the most broadly accepted to explain the
biochemical procedures that occur in an EBPR process and are reflected in the
requirements for a good functioning of an EBPR system (Table 3.2). However, these
requirements were discovered empirically and on them are based most part of the full-
Figure 3.7: EBPR metabolism according to the Mino model. (Redraw from Seviour & Nielsen,
2010).

25
scale EBPR plants configurations (Mino et al., 1998; Tchobanoglous, Burton, &
Stensel, 2003).
Barnard (1994) modified the BARDENPHO or PHOREDOX systems and created the
FIVE STAGE PHOREDOX process where an additional anaerobic reactor or zone was
added to the initial part of the plant (Figure 3.8). The recycled amount of nitrate in the
RAS is minimized since the “a-recycle” is taking the possible product of nitrification
back to the anoxic zone. Meanwhile, the “s-recycle” is taking back to the anaerobic
reactor the RAS from the second clarifier where to recycle considerable amounts of
nitrate will not be possible. In consequence, the anaerobic zone will provide an
appropriate environment to the PAO group.
To simplify the FIVE STAGE PHOREDOX system, the size of the first anoxic reactor
was increased and also the denitrification efficiency; as result, the secondary anoxic
and re-aeration phases were not necessary (Bryan, 1993). This process was called the
THREE-STAGE PHOREDOX. On this basis other modifications were developed as the
THREE-STAGE BARDENPHO system also called A2O process (Barnard, 1994;
Oehmen et al., 2007). This system tends to have a long sludge age while the TWO-
STAGE HIGH RATE PHOREDOX, also called A/O, operates with a shorter sludge age
(Figure 3.9).
Figure 3.8: The FIVE STAGE PHOREDOX process.
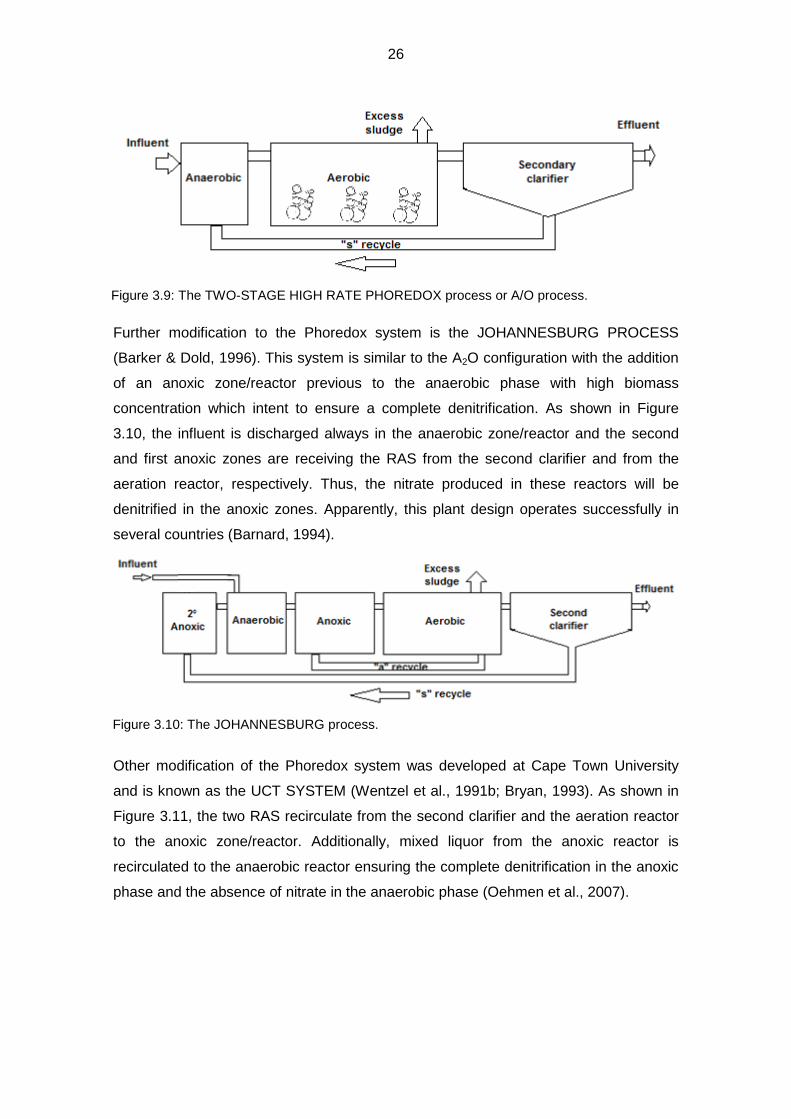
26
Further modification to the Phoredox system is the JOHANNESBURG PROCESS
(Barker & Dold, 1996). This system is similar to the A2O configuration with the addition
of an anoxic zone/reactor previous to the anaerobic phase with high biomass
concentration which intent to ensure a complete denitrification. As shown in Figure
3.10, the influent is discharged always in the anaerobic zone/reactor and the second
and first anoxic zones are receiving the RAS from the second clarifier and from the
aeration reactor, respectively. Thus, the nitrate produced in these reactors will be
denitrified in the anoxic zones. Apparently, this plant design operates successfully in
several countries (Barnard, 1994).
Other modification of the Phoredox system was developed at Cape Town University
and is known as the UCT SYSTEM (Wentzel et al., 1991b; Bryan, 1993). As shown in
Figure 3.11, the two RAS recirculate from the second clarifier and the aeration reactor
to the anoxic zone/reactor. Additionally, mixed liquor from the anoxic reactor is
recirculated to the anaerobic reactor ensuring the complete denitrification in the anoxic
phase and the absence of nitrate in the anaerobic phase (Oehmen et al., 2007).
Figure 3.9: The TWO-STAGE HIGH RATE PHOREDOX process or A/O process.
Figure 3.10: The JOHANNESBURG process.

27
Later, to improve the denitrification process the anoxic zone was divided into two
separated reactors with different dimensions where the larger received RAS from the
aerobic reactor and the little anoxic reactor received the RAS from the second clarifier.
This system was called MODIFIED UCT and apparently operates worldwide
successfully (Seviour & Nielsen, 2010).
The WWTPs configurations presented so far were developed with one main objective:
to avoid the presence of nitrate during the anaerobic feed phase but in summary they
are modifications of the PHOREDOX – BARDENPHO initial configurations. Because
the performance of the EBPR process in real scale is not stable, the use of chemical
precipitation processes as back up to the system is necessary. Apparently, the EBPR
process stability depends on several factors and not only on the presence of nitrate
during the anaerobic phase. Once the nitrate presence during the anaerobic phase is
avoided it is possible that the EBPR process is still having problems. Moreover, the
loss of EBPR performance in many plants can occur without explanations (Seviour &
Nielsen, 2010). The instability of the EBPR process in real scale is the result of the lack
of knowledge about the biochemical processes that occur in the activated sludge which
strictly depend on the characteristics of the bacterial communities.
3.6 Wastewater composition and operational parameters required to achieve good EBPR processes.
To summarize the requirements needed to achieve a good EBPR performance the
work of Mulkerrins et al., (2004) was taken into account.
Figure 3.11: The UCT system.

28
The first group of requirements is related to the wastewater composition and is
summarized as follows:
The influent flow and the loading rate of wastewater should be maintained as
much as possible stable (Shehab et al., 1996).
The VFA content in the influent should be maintained within ranges as
mentioned by Satoh et al., (1994) who worked with a biofilm system using a
COD concentration in the influent of 400 mg/l in the form of acetate. In this
research the phosphorus uptake was improved but when the acetate
concentration increased up to 600 mg/l the P-uptake started to decrease.
The control of the F/M ratio. Research by Chuang et al., (1998) recorded high
P-uptake potential when low COD-SS ratios were used. In contrast, using a
high COD-SS ratio, in the same research, a low potential of P-uptake was
recorded. Additionally, the risk of having problems with filamentous bacteria
increased when the influent contains high F/M ratios (Furumai et al., 1999).
The relation between the carbon concentration and the phosphorus
concentration in the influent is of major importance. As Stensel & Barnard,
(1992) mentioned, a BOD5/Ptot ratio lower than 20 and a COD/Ptot ratio lower
than 40 will not guarantee an appropriate performance of the EBPR process.
An agreement has been reached that the use of VFA as carbon source improves the
EBPR performance (Comeau et al., 1996; Ruel et al., 2002), but, it is also accepted
that the VFAs are not the only substrates to achieve efficient EBPR performance. Other
substrates as glucose or peptone have been used with similar successful results of
EBPR (Carucci et al., 1999).
Additionally, the adequate concentration of cations as magnesium and potassium in the
influent wastewater seems to stabilize the intracellular polyphosphate chains (Rickard
& McClintock, 1992). Even more, according to Romanski et al., (1997) in a
polyphosphate chain each phosphate group is stabilized by a positive charge, and to
release a phosphate molecule a cationic charge (K+ or Mg+2) is required. Research by
Randall et al., (1992) mentioned that generally an excess of potassium and magnesium
in municipal wastewater may be reported, therefore, limitation problems of these ions
are improbable. However, sometimes the WWTPs can face potassium shortage and
according to Brdjanovic et al., (1996), the consequence of this scarcity would be the
absence of phosphorus removal, the decrease in the intracellular polyphosphate
stores, and the adverse effect on the acetate uptake and the anaerobic phosphorus
release after several days of potassium scarcity.
29
The temperature in activated sludge systems is not only related to the phosphorus
removal performance but to all metabolic processes, gas transference and sludge
sedimentation characteristics (Metcalf & Eddy, 1991). According to Metcalf & Eddy,
(1991), the bacterial growth rate will increase to the double for each 10°C of
temperature rises. With regard to the optimal temperature for EBPR processes, the
references are contradictory. For example, McClintock et al., (1993) and Converti et al.,
(1995) reported improvements of the EBPR performance with temperatures ranging
between 20 and 37°C, while Viconneau et al., (1985) and Florentz et al., (1987) have
reported improvements with temperatures between 5 and 15°C. Additionally, Panswad
et al., (2003) suggested that PAO bacteria would be mesophilic (optimal temperature
around 20°C) or even psychrophilic. On the other hand, several studies supported the
adverse effects of low temperatures on EBPR processes. Apparently, low temperatures
between 5 and 10°C would be adverse for the oxygen consumption rate (Brdjanovic et
al., 1997), and the phosphorus release during the anaerobic phase may also decrease
with low temperatures (Converti et al., 1995). Other adverse effects, not related directly
to the PAO metabolism but affecting the development of the activated sludge
community, would be the detriment of the denitrification process at low temperatures
resulting in nitrate accumulation in the return sludge (Helmer & Kunst, 1998).
Additionally, Knoop & Kunst, (1998) reported that low temperature are appropriate for
the development of Microthrix parvicella since the optimal temperature for this
filamentous bacterium would range between 12°C and 15°C.
Another challenge for the EBPR-WWTPs is the proliferation of filamentous bacteria that
can adversely affect the settlement characteristics of the activated sludge. An indicator
of settleability is the Sludge Volume Index (SVI). Stable settlement processes are
recorded with SVI values lower than 150 ml/g (Kunst et al., 2000). The filamentous
bulking is a common problem faced in WWTPs. According to Blackbeard et al., (1988)
in South Africa approximately 80% of the WWTPs with biological nutrient removal
processes have faced bulking problems, and Eikelboom et al., (1998) concluded that
because the addition of the P-removal process to the WWTPs, the percentage of plants
with high SVI problems increased to the double. Additionally, Chang et al., (1996)
reported that it was not possible to ensure low SVI values (69 – 370 ml/g) with influents
with high COD/P ratios, but the phosphorus removal performance was up to 75%. This
last study highlighted that the excess of filamentous bacteria was directly related to the
sludge settlement capacity but not to the phosphorus removal capacity. Additionally, it
is well known, that Microthrix parvicella is a common filamentous bacteria in nutrient
removal plants (Eikelboom et al., 1998; Wagner & Loy, 2002). This microorganism was

30
recorded to predominate during the colder winter and early spring (Eikelboom et al.,
1998).
Other factors that may be mentioned are directly related to the wastewater
characteristics as the pH, the chemical composition of the wastewater and the flow and
strength fluctuations (Metcalf & Eddy, 1991). The low F/M ratios are also reported as a
risk condition for the appearance of bulking problems (Rossetti et al., 1994).
Furthermore, the oxygen demand of an activated sludge system depends on the
nutrient removal process that this system performs. For carbon oxidation and
nitrification processes, an activated sludge system requires dissolved oxygen levels
greater than 2 mg/l (Louzeiro et al., 2002). Research by Shehab et al., (1996)
mentioned that in EBPR systems the dissolved oxygen concentration in the aerobic
phase should be maintained between 3 and 4 mg/l, and Mulkerrins, Dobson, &
Colleran, (2004) mentioned that dissolved oxygen concentrations greater than 4 mg/l
seems not to improve the EBPR performance. Additionally, Brdjanovic et al., (1998)
recorded that an excess of aeration adversely affect the EBPR performance resulting in
the decrease of the PHB production. According to Scruggs & Randall, (1998), the
development of some filamentous bacteria such as Type 1863 is promoted by low
dissolved oxygen concentrations (0.1 mg/l or less), and in contrast, the growth of
Nocardia was enhanced according to the increase of the dissolved oxygen
concentrations from 1 to 5 mg/l.
On the other hand, the phosphorus content in wastewater may influence the
development of PAO and GAO bacterial communities. Research by Sudiana et al.,
(1999) reported that low phosphorus loadings would not be adequate for the PAO
development as it may result in the establishment of the GAO community. This latter
result was supported by Liu et al., (1998) who used low P/TOC ratios in the influent and
recorded, as a consequence, that the growth of PAO was suppressed. In contrast,
when high P/TOC feeding ratios were used the PAO growth seems to improve as some
research reported. Research by Converti et al., (1993), used wastewater with a
phosphate concentration of 70 mg/l, obtaining phosphorus removal percentage of more
than 90%. Additionally, research by Comeau et al., (1996) used a phosphorus
concentration of 60 mg/l in SBR at lab scale, obtaining a phosphorus removal
percentage of 88% during 193 days of operation time. On average, the domestic
wastewater contains a phosphorus media concentration of 8 mg/l (Metcalf & Eddy,
1995), and as Sudiana et al., (1999) mentioned, a mixed bacterial community of PAO
and GAO may be obtained with this concentration. Additionally, efficient EBPR
processes are commonly achieved with this phosphorus concentration. Research by

31
Randall et al., (1997) recorded that after increasing the phosphorus concentration up to
20 mg/l in the influent, a considerable increase in the phosphorus removal performance
was observed.
Several investigations reported different pH ranges as optimal for specific processes in
the removal of biological nutrients (Table 3.3).
Table 3.3: Optimal pH values proposed for nitrification, denitrification, acetate uptake and
phosphorus release processes in activated sludge systems
Process pH optimal pH limit Comments
Nitrification 7.5 - 9 6
Eckenfelder and Grau,
(1992); Surampalli et al.,
(1997)
Denitrification 7 - 8 7
pH 7 would be the limit
when nitrite concentration of
250 mg/l is reported.
Metcalf & Eddy, (1991);
Sanchez et al., (1998);
Glass & Silverstein, (1998)
Acetate uptake
and phosphorus
release
7 Acid or
alkaline
Alkaline pHs have a
negative effect for acetate
uptake but positive effect for
P release.
Converti et al., (1995); Liu
et al., (1996).
It is important to note here, that a research by Bond et al., (1998) suggested that no
control of the pH may result in a better phosphorus removal in SBR reactors.
Other operational parameters also influence the EBPR performance. The sludge
retention time (SRT) can vary between seasons in biological nutrient removal plants.
For example, in western Canada the SRT is ranging between 9 and 13 days in winter
and between 5 and 7 days in summer (Oldham & Rabinowitz, 2002). Additionally, the
SRT depends on the sludge loading rate (SLR) or the F/M ratio. For example, with low
F/M ratios and long SRT, effluents with good quality may be obtained (Metcalf & Eddy,
1991).

32
To design biological nutrient removal plants, the F/M ratios for carbon oxidation,
nitrification and denitrification processes are ranging between 0.03 and 0.06
kgBOD5/kg MLVSS/day (Crites & Tchobanoglous, 1998). As mentioned above, low F/M
ratios seem to promote the development of filamentous bacteria resulting in bulking
problems (Rossetti et al., 1994). Additionally, Knoop & Kunst, (1998) reported that
when the F/M ratio increased from 0.1 to 0.2 kg COD/kg MLVSS/day the development
of Microthrix parvicella was prevented even at low environmental temperatures. Other
reason to vary the SRT is the type of wastewater treatment that depends on the
characteristics of the influent wastewater. Mamais & Jenkins, (1992) observed efficient
EBPR performances with SRT greater than 2.9 days. Additionally, Chang et al., (1996)
recorded that with a SRT of 10 days the best phosphorus removal rates were obtained.
Similar results were obtained in a research by Choi et al., (1996) where the best
phosphorus removal performance was observed with an SRT of 10 days in comparison
to 5 and 20 days. In WWTPs with simultaneously removal process of phosphorus and
nitrogen, the right SRT should be carefully calculated to avoid problems as nitrification.
When a long SRT is applied the opportunity for the development of nitrificants are
higher (generation time = 60 h) and, as a result, the nitrate levels may increase
(Furumai et al., 1999). However, if the goal of the wastewater treatment is to remove
phosphorus, the SRT should not be so high, thus, the nitrification process could be
minimized. Research by Kargi & Uygur, (2002) recorded optimal COD, nitrogen (NH4-
N, NO3-N) and phosphate (PO4-P) removal with a SRT of 10 days.
3.7 Performance loss in EBPR processes
Although the operational parameters and wastewater composition may be appropriate,
the EBPR systems can suddenly lose the performance without an explanation, and to
recover the removal performance is not always possible (Seviour & Nielsen, 2010).
This chapter attempts to draw the attention to some basic assumptions of the
experimental design and to new approaches in EBPR research that may give some
explanations about the bad functioning of the EBPR process.
As mentioned above, the EBPR metabolic models were developed assuming that the
PAO bacterial community was a single population and additionally, that the EBPR
process is performed following an only metabolic process (Seviour & Nielsen, 2010). If
this assumption would be right, the metabolic behavior of EBPR bacterial communities
in real scale should fit with the Comeau-Wentzel model or with the Mino model;
however, several inconsistencies to these models are observed in lab and real scale.
Traditionally, it has been assumed that the amount of phosphorus released during the

33
anaerobic phase was directly related to the phosphorus uptake during the aerobic
phase (Wentzel et al., 1986; Comeau et al., 1986; Mino et al., 1987). Research by
Helmer & Kunst, (1998) mentioned that this relation was evident with environmental
temperatures between 15°C and 20°C, but with temperatures of 10°C this relation was
not so close and with 5°C no correlation between the phosphorus release during the
anaerobic phase and the phosphorus uptake during the aerobic phase was observed.
Some factors as the presence of nitrate during the anaerobic phase can adversely
affect the phosphorus release (Furumai et al., 1999). Other factor is the presence of
oxygen or other oxidizing agents during the anaerobic phase that may affect the redox
potential and as a result impair the process of phosphorus release (Mulkerrins et al.,
2004).
On the other hand, several investigations reported that working with glucose as carbon
source, good EBPR performance were achieved, but the carbon consumed was not
related to the amount of phosphorus released (Carucci et al., 1994; Jeon & Park,
2000). Other research using laboratory scale reactors reported that the relation
between the anaerobic phosphorus release and the acetate assimilation was not
constant (Seviour et al., 2003). Research by Mino et al., (1998) suggested that this
relation may depend on the pH of the mixed liquor that affects the energy demand for
the acetate transport. Additionally, Jeon & Park, (2000) proposed an EBPR metabolic
pathway using glucose as only carbon source. In this research the participation of two
bacterial communities in the EBPR process may explain the inconsistence observed
about the amount of phosphorus released during the anaerobic phase and the amount
of glucose consumed. According to this research the lactic acid producing organisms
(LPO) would be able to uptake directly the glucose during the anaerobic phase and
subsequently they would release lactate to the aqueous phase. Then, the PAO bacteria
would uptake the lactate, previously released by the LPO, and in consequence would
release an amount of orthophosphate that would not fit with the amount of glucose
initially consumed.
However, all these metabolic explanations proposed are not well supported because
the lack of the respective experimental biochemical data. Some research using Nuclear
Magnetic Resonance (NMR) attempts to follow the metabolic flux in mixed communities
in presence of different substrates under specific conditions, but even this methodology
is not able to explain the metabolic behavior of the different bacterial groups involved in
the EBPR process since the structure and the metabolic relations between them are
unknown (Seviour et al., 2003).

34
Additionally, research by Pijuan et al., (2005) reported other inconsistency to the
metabolic models, when EBPR activity was observed even during the addition of
acetate in the aerobic phase. As mentioned in the metabolic models, to achieve a high
phosphorus removal performance, the separation of an electron donor zone (anaerobic
feed stage) from the electron acceptor zone (aerobic famine stage) is necessary.
Under anaerobic conditions the PAO bacteria would be able to uptake the RBCOD
while other competitors (mostly heterotrophic microorganisms) would not be able to
metabolize the substrate since the oxidative phosphorylation would be unable to
proceed. Additionally, Pijuan et al., (2005) mentioned that the electron donor was
present during the aerobic phase and, despite it, substantial phosphorus release and
acetate uptake were observed. In this case, the phosphorus uptake was recorded once
the carbon source was consumed (Seviour & Nielsen, 2010). Research by Ahn et al.,
(2007) observed a stable phosphorus removal performance using continuous aeration,
but feeding acetate and phosphorus in different moments. Apparently, PAO
microorganisms would be able to assimilate the substrate and to release phosphorus
under aerobic conditions, but the amount of dissolved oxygen provided in the
continuous aeration phase should be mentioned. In the research of Pijuan et al.,
(2005), the dissolved oxygen concentrations in mixed liquor were maintained only
above 2 mg/l and in the research of Ahn et al., (2007) the dissolved oxygen
concentration was approximately 1 mg/l. Other research suggested that when the COD
influent is relative high (60 - 120 mg/l) and the dissolved oxygen concentration in mixed
liquor is insufficient (less than 4 mg/l), only the surface of the floc would have aerobic
conditions (Li & Bishop, 2004). Research by De Kreuk & van Loosdrecht, (2004), and
Lemaire et al., (2008) recorded the presence of PAO in granular aerobic sludge; this
could mean that, the anaerobic conditions inside the floc would be appropriated for the
growth of PAO.
It is necessary to clarify whether the separation of the electron donor and acceptor
zones is indispensable for PAO to uptake phosphorus or if this separation only would
provide PAO with a metabolic advantage to substrate uptake (Seviour & Nielsen,
2010).

35
3.8 References
Ahn, J., Schroeder, S., Beer, M., McIlroy, S., Bayly, R.C., May, J.W., Vasiliadis, G.,
and Seviour, R.J. (2007) Ecology of the microbial community removing
phosphate from wastewater under continuously aerobic conditions in a
sequencing batch reactor. Applied and Environmental Microbiology 73: 2257-
2270.
Ansari, A.A., Singh Gill, S., Lanza, G.R., and Rast, W. (2011) Eutrophication: Causes,
Consequences and Control. Dordrecht, Heidelberg, London, New York:
Springer.
Arun, V., Mino, T., and Matso, T. (1988) Biological mechanism of acetate uptake
mediated by carbohydrate consumption in excess phosphorus removal
systems. Water Research 22: 565-570. Available online:
http://www.water.ncsu.edu/watershedss/info/phos.html
Barker, P.S., and Dold, P.L., (1996) Denitrification behavior in biological excess
phosphorus removal activated sludge systems. Water Research 30 (4): 769–
780.
Barnard, J.L. (1975a) Biological nutrient removal without the addition of chemicals.
Water Research 9: 485-490.
Barnard, J.L. (1975b) Nutrient removal in biological systems. Journal of the Water
Pollution Control Federation 74: 702-720.
Barnard, J.L. (1976) A review of biological phosphorous removal in activated sludge
process. Water SA, 2(3): 136-144.
Barnard, J.L. (1994) Prejudices, processes and patents. In: Proceedings of the
Second Australian Conference of Biological Nutrient Removal from
Wastewater, Albury, N.S.W. pp. 1-14.
Barnard, J.L. (1998) The development of nutrient-removal processes (abridged).
Water and Environmental Management 12: 330-337.
Barnard, J.L. (2009) Elimination of eutrophication through resource recovery. In:
Proceedings of International Conference on Nutrient Recovery from
Wastewater Streams; Ashley, K., Mavinic, D., Koch, F., Eds.; IWA Publishing:
London, UK, 2009.
Barnard, J.L., and Abraham, K. (2006) Key features of successful BNR operation.
Water Science and Technology 53(12): 1-9.
Blackbeard, J.R., Gabb, D., Ekama, G., Marais, G.V.R. (1988) Identification of
filamentous organisms in nutrient removal activated sludge plants in South
Africa. Water SA 1988 (14):29 – 34.
Bond, P.L., Keller, J., and Blackall, L.L. (1998) Characterization of enhanced biological
.

36
phosphorus removal activated sludge with dissimilar phosphorus removal
performances. Water Science and Technology 37(4– 5):567– 571.
Bordacs, K., and Chiesa, S.C. (1989) Carbon flow patterns in enhanced biological
phosphorus accumulating activated sludge culture. Water Science and
Technology 21(4-5): 387-396.
Brdjanovic, D., Hooijmans, C.M., van Loosdrecht, M.C.M., Alaerts, G.J., and Heijnen,
J.J. (1996) The dynamic effects of potassium limitation on biological
phosphorus removal. Water Research 30(10):303– 13.
Brdjanovic, D., Slamet, A., van Loosdrecht, M.C.M., Hooijmans, C.M., Alaerts, G.J.,
and Heijnen, J.J. (1998) Impact of excessive aeration on biological phosphorus
removal from wastewater. Water Research 32(1):200–208.
Brdjanovic, D., van Loosdrecht, M.C.M., Hooijmans, C.M., Alaerts, G.J., and Heijnen,
J.J. (1997) Temperature effects on physiology of biological phosphorus
removal. Journal of Environmental Engineering 123(2):144– 53.
Bryan, A. (1993) Biological Nutrient Removal. Queensland Department of Primary
Industries, Brisbane, Qld.
Byrns, G. (2001) The fate of xenobiotic organic compounds in wastewater treatment
plants. Water Research 35:2523-2533.
Canadian Council of Ministers of the Environment (2004) Canadian water quality
guidelines for the protection of aquatic life: Phosphorus: Canadian Guidance
Framework for the Management of Freshwater Systems. In: Canadian
environmental quality guidelines, 2004, Canadian Council of Ministers of the
Environment, Winnipeg.
Carucci, A., Lindrea, K., Majone, M., and Ramadori R. (1994) Dynamics of the
anaerobic utilization of organic substrates in an anaerobic/aerobic sequencing
batch reactor. Water Science and Technology 31(2): 35±43.
Carucci, A., Lindrea, K., Majone, M., and Ramadori, R. (1999) Different mechanisms
for the anaerobic storage of organic substrates and their effect on enhanced
biological phosphate removal (EBPR). Water Science and Technology 39(6):
21– 8.
Chambers, P. A., Kent, R., Charlton, M.N., Guy, M., Gagnon, C., Roberts, E., Grove,
E., and Foster, N. (2001) Nutrients and their impact on the Canadian
environment. Environment Canada. 241 pp.
Chang, W.C., Chiou, R.J., and Ouyang, C.F. (1996) The effect of residual substrate
utilization on sludge settling in an enhanced biological phosphorus removal
process. Water Science and Technology 34(1– 2):425–30.
Choi, Y., Shin, E.B., and Lee, Y.D. (1996) Biological phosphorus removal from

37
wastewater in a single reactor combining anaerobic and aerobic conditions.
Water Science Technology 34(1– 2):179–86.
Chuang, S.H., Ouyang, C.F., Yuang, H.C., and You, S.J. (1998) Phosphorus and
polyhydroxyalkanoates variation in a combined process with activated sludge
and biofilm. Water Science and Technology 37(4 – 5):593– 7.
Comeau, Y., Hall, K.J., Hancock, R.E.W., and Oldham, W.K. (1986) Biochemical-
model for enhanced biological phosphorus removal. Water Research 20: 1511-
1521.
Comeau, Y., Lamarre, D., Roberge, F., Perrier, M., Desjardins, G., Hade, C., et al.
(1996) Biological nutrient removal from a phosphorus-rich pre-fermented
industrial wastewater. Water Science and Technology 34(1 – 2):169– 77.
Converti, A., Rovatti, M., and Del Borghi, M. (1995) Biological removal of phosphorus
from wastewaters by alternating aerobic and anaerobic conditions. Water
Research 29(1):263–9.
Converti, A., Zilli, M., Poloniecki, R.H., Del Borghi, M., Ferraiolo, G. (1993) Influence of
nutrient concentration in new operating criteria for biological removal of
phosphorus from wastewaters. Water Research 27(5): 791– 8.
Cordell, D., and White, S. (2011) Peak Phosphorus: Clarifying the Key Issues of a
Vigorous Debate about Long-Term Phosphorus Security. Sustainability 3:
2027-2049.
Cordell, D., Drangert, J.-O., and White, S. (2009) The story of phosphorus: Global food
security and food for thought. Global Environmental Change 19(2): 292-305.
Cordell, D., White, S., Drangert, J.-O., and Schmid-Neset, T. (2009) Preferred future
phosphorus scenarios: A framework for meeting long-term phosphorus needs
for global food demand. In: Proceedings of International Conference on
Nutrient Recovery from Wastewater Streams, Mavinic, D., Ashley, K., Koch, F.,
Eds.; IWA Publishing: London, UK.
Crites, R., and Tchobanoglous, G. (1998) Chapter 7: biological treatment and nutrient
removal. In: Kane, K.T., Munson, E., Haag, G., Tchobanoglous, G., editors.
Small and decentralised wastewater management systems. USA: WCB
McGraw Hill; pp. 397– 526.
D.S Nº 037-2008-PCM. Diario Oficial el Peruano, Lima, Perú, publicado el 14 de mayo
de 2008.
De Kreuk, M.K., and van Loosdrecht, M.C.M. (2004) Selection of slow growing
organisms as a means for improving aerobic granular sludge stability. Water
Science and Technology 49(11-12): 9-19.
Dilek, F.B., Gokcay, C.F., and Yetis, U. (1998) Combined effects of Ni (II) and Cr (VI)

38
on activated sludge. Water Research 32:303-312.
Eckenfelder, W.W., and Grau, P. (1992) Activated sludge process and design and
control: Theory and Practice. Lancaster, PA: Technomic Publishing Co.
Eikelboom, D.H., Andreadakis, A., and Andreasen, K. (1998) Survey of filamentous
populations in nutrient removal plants in four European countries. Water
Science and Technology 37(4– 5):281–9.
Filippelli, G.M. (2002) The global phosphorus cycle. In: Kohn, M., Rakovan, J., and
Hughes, J. (eds) Phosphates: Geochemical, Geobiological, and Materials
Importance. Reviews in Mineralogy & Geochemistry 48, pp 391-425.
Florentz, M., Caille, D., Bourdon, F., and Sibony, J. (1987) Biological phosphorus
removal in France. Water Science and Technology 19(4):1171–1173.
Food and Agriculture Organization of the United Nations (2006). Plant Nutrition for
Food Security: A Guide for Integrated Nutrient Management; FAO: Rome, Italy,
2006.
Frost, R.C. (2009) EU practice in setting wastewater emission limit values. Available
online: http://www.wgw.org.ua/
Furumai, H., Kazmi, A.A., Furuya, Y., Sasaki, K. (1999) Effect of sludge retention time
(SRT) on nutrient removal in sequencing batch reactors - Part A
Toxic/Hazardous Substances and Environmental Engineering. Journal of
Environmental Science and Health 34(2):317–28.
Garcia-Martin, H., Ivanova, N., Kunin, V., Warnecke, F., Barry, K.W., McHardy, A.C.
(2006) Metagenomic analysis of two encanced biological phosphorus removal
(EBPR) sludge communities. Nature Biotechnology 24: 1263-1269.
Glass, C., and Silverstein, J. (1998) Denitrification kinetics of high nitrate concentration
water: pH effect on inhibition and nitrite accumulation. Water Research
32(3):831– 9.
Global Phosphorus Research Initiative - GPRI (2010) GPRI Statement on Global
Phosphorus Scarcity; GPRI: Wageningen, The Netherlands, 2010. Available
online:http://phosphorusfutures.net/files/GPRI_Statement_responseIFDC_final.
pdf.
Grady, C.P.L., Daigger, G.T., and Lim, H.C. (1999) Biological Waste Water Treatment.
New York: Marcel Dekker.
Gray, N.F. (1989) Biology of Wastewater Treatment. Oxford: Oxford University Press.
Gray, N.F. (1990) Activated Sludge: Theory and Practice. Oxford: Oxford University
Press.
Gujer, W., and Jenkins, D. (1975a) Contact stabilization activated sludge process,
oxygen utilization, sludge production and efficiency. Water Research 9: 553-

39
560.
Gujer, W., and Jenkins, D. (1975b) Nitrification model for contact stabilization activated
sludge process. Water Research 9: 561-566.
Helmer, C., and Kunst, S. (1998) Low temperature effects on phosphorus release and
uptake by microorganisms in EBPR plants. Water Science and Technology
37(4– 5):531– 539.
Helmer, C., Tromm, C., Hippen, A., Rosenwinkel, K-H., Seyfried, C.F., and Kunst, S.
(2001) Single stage biological nitrogen removal by nitrification and anaerobic
ammonium oxidation in biofilm systems. Water Science and Technology. 43:
311-320.
Hesselmann, R.P.X., Von Rummell, R., Resnick, S.M., Hany, R., Zehnder, A.J.B.,
(2000) Anaerobic metabolism of bacteria performing enhanced biological
phosphate removal. Water Research 34: 3487–3494.
International Fertilizer Industry Association – IFA (2009) IFADATA; IFA: Paris, France,
2009. Available online: http://www.fertilizer.org/ifa/ifadata/search.
International Fertilizer Industry Association –IFA (2008) Feeding the Earth: Fertilizers
and Global Food Security, Market Drivers and Fertilizer Economics; IFA: Paris,
France, 2008.
Jenkins, D., and Hermanowicz, S.W. (1991) Principles of chemical phosphate
removal. In: Phosphorus and Nitrogen Removal from Municipal Wastewater:
Principles and Practices. Sedlak, R.I. (ed.). New York: Lewis Publishers, pp. 91
– 110.
Jeon, C.O., and Park, J.M. (2000) Enhanced biological phosphorus removal in a
sequencing batch reactor supplied with glucose as a sole carbon source. Water
Research 34: 2160–2170.
Judge, A. (2008) Checklist of Peak Experiences Challenging Humanity; Laetus in
Praesens. 12 August 2008. Available online:
http://www.laetusinpraesens.org/musings/
Kargi, F., and Uygur, A. (2002) Nutrient removal performance of a sequencing batch
reactor as a function of the sludge age. Enzyme and Microbial Technology
31(6):842–847.
Knoop, S., and Kunst, S. (1998) Influence of temperature and sludge loading on
activated sludge settling, especially on Microthrix parvicella. Water Science and
Technology 37(4– 5):27– 35.
Kong, Y.H., Nielsen, J.L., Nielsen, P.H., (2004) Microautoradiographic study of
Rhodocyclus-Related polyphosphate-accumulating bacteria in full-scale
enhanced biological phosphorus removal plants. Applied and Environmental

40
Microbiology 70 (9): 5383–5390.
Kos, M., Wanner, J., Sorm, I., and Grau, P. (1992) R-D-N activated sludge process.
Water Science and Technology. 25(4-5): 151-160.
Kraigher, B., Kosjek, T., Heath, E., Kompare, B., and Mandic-Mulec, I. (2008)
Influence of pharmaceutical residues on the structure of activated sludge
bacterial communities in wastewater treatment bioreactor. Water Research
42:4578-4588.
Kunst, S., Helmer, C., and Knoop, S. (2000) Betriebsprobleme auf Kläranlagen durch
Blähschlamm, Schwimmschlamm, Schaum. Springer-Verlag 2000.
Lemaire, R., Yuan, Z., Blackall, L.L., and Crocetti, G.R. (2008) Microbial Distribution of
Accumulibacter spp. and Competibacter spp. in aerobic granules from a lab-
scale biological nutrient removal system. Environmental Microbiology 10: 354-
363.
Li, B.K., and Bishop, P.L. (2004) Micro-profiles of activated sludge flocs determined
using microelectrodes. Water Research 38: 1248-1258.
Liu, W.T., Marsh, T.L., and Forney, L.J. (1998) Determination of the microbial diversity
of anaerobic – aerobic activated sludge by a novel molecular biological
technique. Water Science and Technology 37(4 – 5):417–422.
Liu, W.T., Mino, T., Matsuo, T., and Nakamura, K. (1996) Biological phosphorus
removal process-effect of pH on anaerobic substrate metabolism. Water
Science and Technology 34(1– 2):25– 32.
Louzeiro, N.R., Mavinic, D.S., Oldham, W.K., Meisen, A., Gardner, I.S. (2002)
Methanol induced biological nutrient removal kinetics in a full-scale sequencing
batch reactor. Water Research 36(11):2721–2732.
Lozada, M., Itria, R.F., Figuerola, E.L.M., Babay, P.A., Gettar, R.T., de Tullio, L.A., and
Erijman, L. (2004) Bacterial community shifts in nonylphenol polyethoxylates-
enriched activated sludge. Water Research 38: 2077-2086.
Ludzack, F.J., and Ettinger, M.B. (1962) Controlling operation to minimize activated
sludge effluent nitrogen. Journal of the Water Pollution Control Federation 34:
920-931.
Madoni, P., Davoli, D., and Guglielmi, L. (1999) Response of sOUR and AUR to heavy
metals contamination in activated sludge. Water Research 33: 2459-2464.
Mamais, D., and Jenkins, D. (1992) The effects of MCRT and temperature on
enhanced biological phosphorus removal. Water Science and Technology 25(5
–6):955–965.
Marttinen, S.K., Kettunen, R.H., Sormunen, K.M., and Rintala, J.A. (2003) Removal of
bis(2-ethylhexyl) phthalate at a sewage treatment plant. Water Research 37:

41
1385-1393.
Mason, C.F. (1991) Biology of Freshwater Pollution. 2nd Ed. Longman Scientific and
Technical. Longman Group UK Limited. 351 pp.
McClintock, S.A., Randall, C.W., and Pattarkine, V.M. (1993) Effects of temperature
and mean cell residence time on biological nutrient removal processes. Water
Environment Research 65(5):110–8.
Metcalf and Eddy Inc. (1991) Chapter 8—biological unit processes, 359– 444; Chapter
11—advanced wastewater treatment, 663– 764. In: Clark BJ, Morriss JM,
editors. Wastewater Engineering: Treatment, Disposal and Reuse. Third
Edition. New York: McGraw-Hill. pp. 359– 444 and 663 – 764.
Metcalf and Eddy, Inc. (1995) Ingeniería de Aguas Residuales. Tratamiento, vertido y
reutilización. Ed. Mc Graw Hill Interamericana de España S.A., Madrid.
Ministerio de energía y minas - Direccion general de asuntos ambientales-Perú (1997)
EVAT Cuenca del río Rímac Junio 1997. Available online:
http://www.minem.gob.pe/minem/archivos/file/dgaam/publicaciones/evats/rima
c/rimac2.pdf.
Mino, T., Arun, V., Tsuzuki, Y., and Matsuo, T. (1987) Effect of phosphorus
accumulation on acetate metabolism in the biological phosphorus removal
process. In: Ramadori, R. (Ed.), Biological Phosphate Removal from
Wastewaters. Pergamon Press, Oxford, pp. 27–38.
Mino, T., Van Loosdrecht, M.C.M., and Heijnen, J.J. (1998) Microbiology and
biochemistry of the enhanced biological phosphate removal process. Water
Research 32: 3193 – 3207.
Miraj, G., Shah, H. U., and Arif, M. (2013) Priming maize (Zea mays) seed with
phosphate solutions improves seedling growth and yield. The Journal of Animal
& Plant Sciences, 23(3): 2013, Page: 893-899.
Vitti, D. M. S. S., and Kebreab, E. (2010) Phosphorus and calcium utilization and
requirements in farm animals. Ed. Wallingford, UK ; Cambridge, MA : CABI,
©2010. Pag 114.
Mulder, A., Vandegraaf, A.A., Robertson, L.A., and Kuenen, J.G. (1995) Anaerobic
ammonium oxidation discovered in a denitrifying fluidized-bed reactor. FEMS
Microbiology Ecology 16: 177-183.
Mulkerrins, D., Dobson, A.D.W., and Colleran, E. (2004) Parameters affecting
biological phosphate removal from wastewaters. Environment International 30,
249-260.
Naidu, R., Lamb, D.T., Bolan, N.S., and Gawandar, J. (2012) Recovery and reuse of
phosphorus from wastewater sources. In: Advanced Nutrient Management:

42
Gains from the Past - Goals for the Future. (Eds L.D. Currie and C L.
Christensen). http://flrc.massey.ac.nz/publications.html. Occasional Report No.
25. Fertilizer and Lime Research Centre, Massey University, Palmerston North,
New Zealand. 5 Pages.
Neethling, J., Bakke, B., Benisch, M., Gu, A.Z., and Stephens, H.M. (2005) Factors
influencing the reliability of enhanced biological phosphorus removal. Water
Environment Research Foundation. Report 01CTS3.
Oehmen, A., Lemos, P.C., Carvalho, G., Yuan, Z., Keller, J., Blackall, L.L., and Reis,
M.A.M. (2007) Advances in enhanced biological phosphorus removal from
micro to macro scale. Water Research 41: 2271-2300.
Oldham, W.K., and Rabinowitz, B. (2002) Development of biological nutrient removal
technology in Western Canada. Journal of Environmental Engineering and
Science 1:33– 43.
Panswad, T., Doungchai, A., and Anotai, J. (2003) Temperature effect on microbial
community of enhanced biological phosphorus removal system. Water
Research 37(2):409– 15.
Pereira, H., Lemos, P.C., Reis, M.A.M., Crespo, J., Carrondo, M.J.T., Santos, H.,
(1996) Model for carbon metabolism in biological phosphorus removal
processes based on in vivo C-13-NMR labelling experiments. Water Research
30 (9): 2128–2138.
Pijuan, M., Guisasola, A., Baeza, J.A., Carrera, J., Casas, C., and Lafuente, J. (2005)
Aerobic phosphorus release linked to acetate uptake: Influence of PAO
intracellular storage compounds. Biochemical Engineering Journal 26: 184-190.
Pijuan, M., Oehmen, A., Baeza, J.A., Casas, C., and Yuan, Z. (2008) Characterizing
the biochemical activity of full-scale enhanced biological phosphorus removal
systems: a comparison with metabolic models. Biotechnology and
Bioengineering 99: 170-179.
Pitman, A.R. (1991) Design considerations for nutrient removal activated sludge plants.
Water Science and Technology 23: 781-790.
Randall, A.A., Benefield, L.D., and Hill, W.E. (1997) Induction of phosphorus removal in
an enhanced biological phosphorus removal bacterial population. Water
Research 31(11):2869–2877.
Randall, C.W., Barnard, J.L., and Stensel, H.D. (1992) Design and retrofit of
wastewater treatment plants for biological nutrient removal. Lancaster:
Technomic Publishing, pp. 25–78.

43
Reynolds, C.S., and Davies, P.S. (2001) Sources and bioavailability of phosphorus
fractions in freshwaters: a British perspective. Biological reviews of the
Cambridge Philosophical Society 76(1):27-64.
Rickard, L.F., and McClintock, S.A. (1992) Potassium and magnesium requirements for
enhanced biological phosphorus removal from wastewater. Water Science and
Technology 25(9 – 11):2203–2206.
Rittmann, B.E., Mayer, B., Westerhoff, P., and Edwards, M., (2011) Capturing the lost
phosphorus. Chemosphere 84(6): 846-853.
Robertson, L.A., and Kuenen, J.G. (1992) Nitrogen removal from water and waste. In:
Microbial Control of Pollution. Fry, J.C., Gadd, G.M., Herbert, R.A., Jones,
C.W., and Watson-Craik, I.A. (eds). Cambridge: Cambridge University Press,
pp. 227-267.
Romanski, J., Heider, M., and Wiesmann, U. (1997) Kinetics of anaerobic
orthophosphate release and substrate uptake in enhanced biological
phosphorus removal from synthetic wastewater. Water Research 31(12):3137–
3145.
Rossetti, S., Carucci, A., and Rolle, E. (1994) Survey of the occurrence of filamentous
organisms in municipal wastewater treatment plants related to their operating
conditions. Water Science and Technology 29(7):305–308.
Ruel, S.M., Comeau, Y., Heduit, A., Deronzier, G., Ginestet, P., and Audic, J.M. (2002)
Operating conditions for the determination of the biochemical acidogenic
potential of wastewater. Water Research 36:2337–2341.
Sanchez, M., Mosquera-Corral, A., Mendez, R., and Lema, J.M. (1998) Effect of
ammonia on the performance of denitrifying reactors. Proceedings of the
European Conference on New Advances in Biological Nitrogen and Phosphorus
Removal for Municipal or Industrial Wastewaters, Narbonne, France, October
12– 14; 1998. p. 119–126.
Satoh, H., Mino, T., and Matsuo, T. (1994) Deterioration of enhanced biological
phosphorus removal by the domination of microorganisms without
polyphosphate accumulation. Water Science and Technology 30(11):203 – 211.
Satoh, H., Mino, T., and Matsuo, T., (1992) Uptake of organic substrates and
accumulation of polyhydroxyalkanoates linked with glycolysis of intracellular
carbohydrates under anaerobic conditions in the biological excess phosphate
removal processes. Water Science and Technology 26 (5–6): 933–942.
Schick, J., Kratz, S., Adam, C., and Schnug, E. (2009) Techniques for P-recovery from
waste water and sewage sludge and fertilizer quality of P-recycling products.

44
Conclusions from the P-recycling conference in Berlin, 2009 “Phosphorus
Recycling and Good Agricultural Management Practice”
Schmidt, I., Sliekers, O., Schmid, M., Bock, E., Fuerst, J., and Kuenen, J.G. (2003)
New concepts of microbial treatment processes for the nitrogen removal in
wastewater. FEMS Microbiology Reviews 27:481-492.
Scruggs, C.E., and Randall, C.W. (1998) Evaluation of filamentous microorganism
growth factors in an industrial wastewater activated sludge system. Water
Science and Technology 37(4– 5):263–270.
Serafim, L.S., Lemos, P.C., Levantesi, C., Tandoi, V., Santos, H., Reis, M. A. M.
(2002). Methods for detection and visualization of intracellular polymers stored
by polyphosphate-accumulating microorganisms. Journal of Microbiological
Methods (51): 1-18.
Seviour, R., and Nielsen, P.H. (2010) Microbial Ecology of Activated Sludge. London,
UK: IWA Publishing.
Seviour, R.J., Mino, T., and Onuki, M. (2003) The microbiology of biological
phosphorus removal in activated sludge systems. FEMS Microbiology Reviews
27: 99-127.
SGS del Perú (2012) Informe de ensayo con valor oficial N º MA1206230, MA1206289
y MA41206455 – SGS del PERÚ. In: Evaluación de los resultados de la calidad
del agua en el ámbito de la cuenca del río Rímac. Autoridad Nacional del Agua.
Dirección de Gestión de Calidad de los Recursos Hídricos.
Shehab, O., Deininger, R., Porta, F., and Wojewski, T. (1996) Optimising phosphorus
removal at the Ann Arbor wastewater treatment plant. Water Science and
Technology 34(1–2):493 –499.
Smolders, G.J.F., Vandermeij, J., van Loosdrecht, M.C.M., and Heijnen, J.J., (1994 a)
Model of the anaerobic metabolism of the biological phosphorus removal
process—stoichiometry and pH influence. Biotechnology and Bioengineering 43
(6): 461–470.
Srinath, E.G., Sastry, C.A., and Pillai, S.C. (1959) Rapid removal of phosphorus from
sewage by activated sludge. Experientia 15:339.
Stensel, H.D. (1991) Principles of biological phosphorus removal. In: Phosphorus and
Nitrogen Removal from Municipal Wastewater: Principles and Practices.
Sedlak, R.I. (ed.). New York: Lewis Publishers, pp. 141-166.
Stroot, P.G., and Oerther, D.B. (2003) Elevated precursor 16S rRNA levels suggested
the presence of growth inhibitors in wastewater. Water Science and Technology
47(11):241-250.
45
Sudiana, I.M., Mino, T., Satoh, H., Nakamura, K., and Matsuo, T. (1999) Metabolism of
enhanced biological phosphorus removal and non-enhanced phosphorus
removal sludge with acetate and glucose as carbon source. Water Science and
Technology 39(6):29 –35.
Surampalli, R.Y., Tyagi, R.D., Scheble, O.K., and Heidman, J.A. (1997) Nitrification,
denitrification and phosphorus removal in sequential batch reactors.
Bioresource Technology 61(2):151– 157.
Tchobanoglous, G., Burton, F.L., and Stensel, H.D. (2003) Wastewater Engineering:
treatment and Reuse. New York, USA: Metcalf and Eddy Inc., McGraw-Hill
science Engineering.
Ternes, T.A. (1998) Occurrence of drugs in german sewage treatment plants and
rivers. Water Research 32: 3245-3260.
Ternes, T.A., Stuber, J., Herrmann, N., McDowell, D., Ried, A., Kampmann, M., and
Teiser, B. (2003) Ozonation: a tool for removal of pharmaceuticals, contrast
media and musk fragrances from wastewater? Water Research 37:1976-1982.
Van Dongen, U., Jetten, M.S., and van Loosdrecht, M.C. (2001) The SHARON –
Anammox process for treatment of ammonium rich wastewater. Water Science
and Technology 44(1): 153-160.
Van Horn, H.H., Nordstedt, R.A., Bottcher, A.V., Hanlon, E.A., Graetz, D.A., and
Chambliss, C.F. (1991) Dairy manure management: Strategies for recycling
nutrients to recover fertilizer value and avoid environmental pollution. Florida
Cooperative Extension Service Circular 1016, The University of Florida,
Gainesville, FL, USA.
Van Kauwenbergh, S. (2010) World Phosphate Reserves and Resources; International
Fertilize Development Centre (IFDC): Washington, DC, USA, 2010.
Van Kempen, R., Mulder, J.W., Uijterlinde, C.A., and van Loosdrecht, M.C.M. (2001)
Overview: Full scale experience of the SHARON process for treatment of
rejection water of digested sludge dewatering. Water Science and Technology
44: 145-152.
Vankova, S., Kupec, J., and Hoffmann, J. (1999) Toxicity of chromium to activated
sludge. Ecotoxicology and Environmental Safety 42: 16-21.
Viconneau, J.C., Hascoet, M.C., and Florentz, M. (1985) The first application of
biological phosphorus removal in France. Proc. Int. Conf. Management
Strategies for Phosphorus in the Environment, Selper, UK; 1985.
Wagner, M., and Loy, A. (2002) Bacterial community composition and function in
sewage treatment systems. Current Opinion in Biotechnology 13(3):218– 227.

46
Wanner, J. (1994a) Activated sludge population-dynamics. Water Science and
technology 30(11): 159-169.
Wentzel, M.C., Ekama, G.A., and Marais, G.V.R. (1991a) Kinetics of nitrification
denitrification biological excess phosphorus removal systems – a review. Water
Science and Technology 23(4-6): 555-565.
Wentzel, M.C., Lötter, L.H., Ekama, G.A., Loewenthal, R.E., and Marais, G.V.R.
(1991b) Evaluation of biochemical models for biological excess phosphorus
removal. Water Science and Technology 23(4-6): 567-576.
Wentzel, M.C., Lötter, L.H., Loewenthal, R.E., and Marais, G.V.R. (1986) Metabolic
behavior of Acinetobacter spp. in enhanced biological phosphorus removal – a
biochemical model. Water SA 12: 209-224.
Wetzel, R. G. (2001) Limmnology. Academic Press, New York: 1006pp.
Wiesmann, U., Choi, I.S., and Dombrowski, E.-M. (2007) Fundamentals of biological
wastewater treatment. Weinheim: Wiley-VCH. Pp: 227-243.
Wuhrmann, K. (1975) The tertiary treatment: ways and achievements in the elimination
of elements causing eutrophication. Schweiz Z. Hydrol 19: 409-427.
Yetis, U., Demirer, G.N., and Gokcay, C.F. (1999) Effect of chromium on the biomass
yield of activated sludge. Enzyme and Microbial Technology 25: 48-54.

47
CHAPTER 4: Material and methods
The main objectives of this research have been presented in Chapter 2. To achieve
these objectives the research was subdivided into five investigations. Figure 4.1 shows
the principal objectives and a general description of the experimental procedure.
RESEARCH
STUDY
PRINCIPAL
OBJECTIVE
EXPERIMENTAL
PROCESS
1. Elaboration of synthetic
wastewater using different
carbon sources: VFA,
propionic acid and
glucose.
Obtaining activated
sludge samples able to
perform EBPR
processes. These sludge
samples will be used as
substrates in
desorption/sorption
processes.
Production of VFA using
glucose as carbon source
in SBR.
2. Assessment of the
EBPR Process
3. Assessment of the
microbial composition of
the bacterial communities.
4. Desorption and sorption
of phosphorus in activated
sludge samples
5. Assessment of the
bacterial survival.
Description of the
principal morphotypes in
each bacterial
community.
Assessment of the
phosphorus desorption
and sorption capacity of
each bacterial
community.
Assessment of the
survival rates of
bacterial communities
to desorption - sorption
processes.
Assessment of the EBPR
processes using the
phosphorus removal
performance and the
results of staining
techniques.
Use of staining techniques
and SEM-EDX technology.
Kinetik studies of
adsorption and
desorption using a batch
equilibrium method.
Comparisson of the
bacterial concentrations
before and after the
desorption andsorption
process using the plate
count methodology.
Figure 4.1: Flowchart of the principal objectives and experimental processes in this research.

48
According to the different objectives pursued, the methodoly used in each research
differs from each other. However, general methodological procedures were used
repeatedly. These general methodological procedures are described below.
4.1 Chemical analysis
4.1.1 Chemical Oxygen Demand (COD) and Biological Oxygen Demand
(BOD5)
a. COD measurement:
The standard method corresponds to the DIN 38409-H41-1 Norm
(Deutsches Institut für Normung, 1980). This methodology can be used
in water samples that contain a COD concentration between 15 and 300
mg/l. The restriction of this method lies in the chloride concentration of
the sample that should be less than 1 g/l.
Oxidable substances in aqueous samples are oxidized using potassium
dichromate solution (K2Cr2O7). The potassium dichromate, which was
not consumed, is titrated with standard iron (II) ammonium sulphate
using orthophenanthroline ferrous complex (ferroin) as redox indicator.
b. BOD5 measurement:
The standard method corresponds to the DIN 38409-H51 (Deutsches
Institut für Normung, 1987 a). This methodology can be used in water
samples with COD concentrations higher than 50 mg/l where is
necessary to apply a previous dilution process. The DIN 38409-H52
(Deutsches Institut für Normung, 1987 b) is used for diluted samples
where the oxygen content is measured directly without using a
nitrification inhibitor.
BOD measures the amount of oxygen consumed because of
microbiological decomposition (oxidation) of organic material in water.
The amount of oxygen consumed, through this oxidation process in 5
days, is measured at a constant temperature of 20°C in the dark. When
the water sample has a high COD concentration, it is necessary to

49
suppress the possibility of oxygen consumption through nitrification
process. To do this, the N-allylthiourea nitrification inhibitor is used.
4.1.2 Nitrogenous compounds:
a. Total nitrogen (TN) concentration:
For total nitrogen measurements, the commercial fast test Dr. Lange
LCK 238 was used from the Hach-Lange company. This method can be
applied in water and wastewater samples which contain a total nitrogen
concentration between 5 and 40 mg/l.
The methodology corresponds to the dimethylphenol method previous
oxidation. The nitrogen contained in organic and inorganic molecules is
previously oxidized using peroxodisulphate to produce nitrate ions.
Nitrate ions react with the reagent 2.6-dimethylphenol forming 4-nitro-
2.6-dimethylphenol into an aqueous acid solution of sulfuric and
phosphoric acid. After the reaction time, total nitrogen concentration can
be measured using a spectrophotometer.
b. Nitrate (𝑁𝑂3−) and Nitrite (𝑁𝑂2
−) concentration:
For semi-quantitative measurement of nitrate and nitrite concentrations
in water samples, the Quantofix Nitrate/Nitrite test strips from the
company Macherey–Nagel were used. The strips are composed of
plastic plates with bonded reaction zones that contain the chemical
reagents.
The basic chemical reaction is the diazotization of the sulfanilamide with
nitrite or nitrate in an acid media. The color of the reaction is varying
between white and red. Water samples should have a nitrate
concentration ranging between 10 and 500 mg/l and nitrite concentration
ranging between 1 and 80 mg/l. The results of nitrate and nitrite
concentrations follow a scale shows in Table 4.1.
Table 4.1: Scale of nitrate and nitrite concentrations in water samples recorded
by the Quantofix Nitrate/Nitrite test strips (Macherey-Nagel Company)
Nitrate concentration (mg/l) Nitrite concentration (mg/l)
0, 10, 25, 50, 100, 250, 500 0, 1, 5, 10, 20, 40, 80

50
c. Ammonia-nitrogen (NH4+-N) concentration:
The standard method corresponds to the DIN 38406 - E5 Norm
(Deutsches Institut für Normung, 1983). This methodology can be
applied in water, wastewater and sludge samples with ammonium-N
concentrations between 0.03 and 1 mg/l. If the sample contains a high
concentration of suspended solids, a previous filtration process is
recommended using a millipore membrane of 0.45 µm pore size. The
initial pH of the sample should lie between 5 and 8.
In presence of natriumpentacyanonitrosylferrat (2-) (Nitroprussidnatrium)
and with a pH of approximately 12.6, the ammonium ions react with
hypochlorite and salicylat ions taking a bluish color. The color variation is
measured using a spectrophotometer.
4.1.3 Total phosphorus concentration (Ptot)
The standard method corresponds to the DIN EN ISO 6878 (Deutsches
Institut für Normung, 2004). This Norm describes the methodology to
measure the orthophosphate and total phosphorus after an oxidation
process using peroxodisulphate. This method is applicable to water
samples and wastewater. Without dilution the water sample should have
a phosphorus concentration between 0.005 and 0.8 mg/l.
For total phosphorus analysis, if the water sample contains other
phosphorus compounds, different to orthophosphate, the water sample
should be previously oxidized by boiling with peroxodisulphate.
Subsequently, orthophosphate ions will react with molybdate and
antimony ions in an acidic solution to produce an antimony
phosphomolybdate complex. When this complex is reduced with
ascorbic acid, the result is the molybdenum blue complex which can be
measured using a spectrophotometer.
4.1.4 Volatile fatty acids (VFA) concentration by titration and volatile fatty acids composition by gas chromatography.
a. Volatile Fatty Acids concentration (VFA)
The method used is described in the DIN 38414-S19 (Deutsches Institut
für Normung, 1999). The distillation apparatus used is described in the
DIN 38414-19:1999-12.

51
5 ml of phosphoric acid were added to 100 ml water sample.
Subsequently, the first distillation process, of 40 minutes in length,
started. Then, the sample faced a second reflow heating process during
10 minutes, to finally, be titrated with sodium hydroxide (NaOH = 0.1
mol/l) using phenolphthalein as indicator.
The same procedure was applied with a deionized water sample of 100
ml which represented the control.
The results were calculated in millimoles per liter (mmol/l) of volatile
organic acids according to the Formula 4.1.
𝑐(𝑆) =𝑐𝑁𝑎𝑂𝐻∗(𝑉1− 𝑉0 )
𝑉𝑝∗ 1000 ……………….. (4.1)
where:
𝑐(𝑆): Total concentration of Volatile Fatty Acids -VFA (mmol/l)
V1: Volume of sodium hydroxide used in the titration of the
sample (ml)
V0: Volume of sodium hydroxide used in the titration of the
control (ml)
VP: Sample volume (ml)
C(NaOH): 0,1 mol/l
b. Volatile Fatty Acids composition (VFAc)
The composition of VFAs was determined by Gas Chromatography (GC)
methodology. This analysis was performed in the Stadtenwässerung
Braunschweig Laboratory (Niedersachen, Germany). The results were
recorded as Acetic, Propionic, Butiric, Iso-Butiric, Iso-Valeric, and Valeric
Acids in mg/l.
4.1.5. pH, dissolved oxygen (DO) and temperature
The pH, dissolved oxygen and temperature were monitored using
multimeters WTW Multi 3430.

52
4.2 Volumetric analysis
4.2.1 Sludge Volume Index (SVI)
The standard method is described in the DIN 38414-S10 (Deutsches
Institut für Normung, 1981). SVI is an indicator of sludge settleability. By
definition, it corresponds to the volume that a gram of suspended solids
occupy after 30 minutes of settling. To perform this measurement, a
representative sample of mixed liquor of one liter should be taken and
subsequently, the sludge volume accumulated after 30 minutes of
settling should be measured.
To calculate the SVI, the sludge volume achieved should be divided by
the total suspended solids concentration contained therein (Formula
4.2).
𝑆𝑉𝐼 =𝑉𝑠
𝑇𝑆𝑆 …………… (4.2)
where:
SVI: Sludge Volume Index (ml/g)
Vs: Sludge volume after 30 minutes of settling (ml/l)
TSS: Total Suspended Solids in mixed liquor (g/l)
The following conditions should be taken into account:
If the sludge volume, after 30 minutes of settling, is greater than 250 ml/l, a
previous dilution should be performed.
The temperature difference between the sample and the environment should
not be more than 2°C, to avoid the formation of air bubbles because of
convection phenomena.
For samples with high stringiness conditions, the sample can be diluted to a
sludge volume of 100 ml/l.
When episodes of low loads (F/M <0.15 kg/kg.d) and nitrification process in the
aeration basin occur simultaneously, floating sludge during the settling phase
might be observed. This phenomenon occurs because small bubbles of
nitrogen, from the denitrification process, are released within the floc and
attached to the outer surface of the floc. In this case, the sample should rest for
two to three hours, to subsequently, being stirred and let stand it an additional
30 minutes to continue with the SVI measurement.

53
4.3 Microscopic analysis
The methodology used is described in Betriebsprobleme auf Kläranlagen (Kunst
et al., 2000) and in Methods for the Examination and Characterization of
Activated Sludge Community (Seviour & Nielsen, 2010a).
4.3.1. Floc morphology
Samples observations were performed with fresh samples according to the
following procedure:
1. The sludge sample should be homogenized gently without intense agitation
since the floc may be fragmented.
2. Place a drop of the sludge sample on the slide. The slide should be previously
cleaned with ethanol before being placed on the microscope stage.
3. Place over the sample a cover slip supporting it first with the hand and dropping
gently to the opposite, thus avoiding the appearance of large air bubbles
between the slide and the cover slip.
4. Place a piece of laboratory blotting paper on the slide slip surface, doing a bit of
pressure with the fingertips until decreasing the height of the film sample
between the slide and the cover slip.
5. Microscopic observations were performed using the microscope objectives 10x,
considering the structural characteristics of the floc.
6. The floc shape was classified according to the scale given by Jenkins et al.,
(1986).
4.3.2 Determination of the relationship between the SVI and the sludge stringiness with the aid of crystal violet staining.
Crystal violet is a cationic dye which colored through the metachromasia
method. This dye interacts with sulphate and phosphate groups in nucleic acids
and polysaccharides.
Preparation of reagent:
Solution A: Crystal Violet (Merck 9218) dissolved at 0.2% in distilled
water.

54
Procedure:
1. Clean the slide with ethanol and place a drop of sludge, previously
homogenized, on the slide. With the eyedropper spread the sample
over the entire surface of the slide and allow to air dry.
2. Add one drop of solution A directly on the dry extension.
3. Immediately after, cover the preparation with a cover slip and then,
pressing the surface thereof with a pen.
4. Wipe excess solution with a laboratory absorbent paper.
5. Observe the sample at 100x magnification - dark field.
Floc masses will stain purple while, filamentous organisms and free
microorganisms will stain yellowish orange color. When comparing the
observations with the respective reference photos (Kunst et al., 2000) it is
possible to determine the extent of SVI related to the relevant degree of
stringiness (Table 4.2).
Table 4.2: Experimental values linking the SVI-relevant stringiness and the SVI values (Kunst et
al., 2000)
SVI -Relevant stringiness ( - )
Sludge Volume Index (SVI) (ml/g)
0 – 1, 2 and 3 < 150
4 and 5 > 150
6 and 6 – 7 > 200
7 Foam alone
4.3.3 PHA staining technique
Sudan black is a lipophilic stain dissolvable in fatty materials. Therefore, this
stain is capable to identify the storage of intracellular PHA. However, sudan
black stain is not specific for PHA.
A positive reaction for the PHA staining technique includes intracellular blue-
black granules on a clear or slightly colored background (Bartholomew, 1981;
Murray et al., 1994; Seviour & Nielsen, 2010a).

55
Reagents:
Solution A: Sudan black B (IV) 0.3% in Ethanol 60%.
Solution B: Safranin O 0.5% dissolved in deionized water.
Procedure:
1. Prepare an air-dried smear.
2. Add A solution direct in the dried smear trying to cover the entire
sample. The reaction shall be allowed to continue for 12 minutes. Add
extra stain if the slide begins to dry.
3. Discard the excess of A solution and carefully rinse the slide with
water.
4. Add B solution direct in the smear trying to cover the entire sample.
Reaction time 10 - 15 seconds.
5. Discard the excess of B solution and rinse the slide with water. Leave
to air-dry. Take care about the stain rest in the other side of the slide and
when necessary, remove it with ethanol.
The stained smear should be observed at 1000X magnification with a
bright-field objective lens under oil immersion.
4.3.4 Neisser staining technique
Active stain in Neisser staining technique is the methylene blue. Because of its
cationic nature, methylene blue may link the anionic sites in polyphosphate
chains giving to them a characteristic lilac color.
A positive reaction for Neisser staining technique includes intracellular black-
purple granules distinguishable between them if the intracellular phosphorus
concentration is not so high. In case that the intracellular phosphorus
concentration is high, for example at the end of the aerobic phase, the whole
cell could be stained in black-purple color (Lindrea et al., 1999).
There are certain contradictions about the positive reaction of Neisser staining
technique. For example, for some investigators the intracellular black-purple
granules are not considered a positive reaction, but the whole cell stained in
grey blue (Jenkins et al., 1993).

56
Reagents:
Solution A: Methylene blue (0.1 g) in acetic acid glacial (5 ml), ethanol
95% (5 ml) and 100 ml deionized water.
Solution B: Crystal violet 10% w/v in 95% ethanol (3.3 ml), ethanol
95% (6.7 ml) and 100 ml deionized water.
Solution C: Chrysoidin Y 1% w/v (33.3 ml) in deionized water (66.7 ml)
Procedure:
1. Prepare an air-dried smear.
2. Mix two volumes of A solution with one volume of B solution. This new
stain can be stored for maximal four weeks. Add this solution direct in the
dried smear trying to cover the entire sample. Reaction time 10 - 15
seconds.
3. Discard the excess of solution and carefully rinse the slide with water.
4. Add C solution direct in the smear trying to cover the entire sample.
Reaction time 45 seconds.
5. Discard the excess of C solution and rinse the slide with water. Leave
to air-dry.
The stained smear should be observed at 1000X magnification with a bright-
field objective lens under oil immersion.
4.4 Gravimetric analysis
4.4.1 Total Solids (TS)
Total solids concentration is determined as the total dry matter contained in a
sludge sample, which means, the sum of suspended and dissolved solids.
Procedure:
1. Ignite and evaporate a crucible of 100 ml for 1 hour in the muffle
furnace.
2. Allow the crucible to cool to room temperature, weigh and store it until
use. Save the crucible weight data (TSB).
3. The sludge sample should be at room temperature. Place 100 ml of the
well mixed sample into the crucible.
4. Evaporate to dryness in the oven at 103 °C – 105 °C during 24 hours.

57
5. Repeat the cycle of drying, cooling and weighing until a constant weight
is achieved.
6. Record the final weight (TSA) and calculate the total solids concentration
(Formula 4.3)
𝑇𝑆 =(𝑇𝑆𝐴− 𝑇𝑆𝐵 )
𝑆𝑉∗ 1000 …………….(4.3)
where:
TS: Total solids (mg/l)
𝑇𝑆𝐴: Weight of the dried sludge and the crucible (mg)
𝑇𝑆𝐵: Weight of the crucible (mg)
𝑆𝑉: Volume of the sludge sample (ml)
4.4.2. Total Suspended Solids (TSS) and Volatile Suspended Solids (VSS)
Total Suspended Solids concentration was determined using the methodology
described in the DIN 38414-S2 (Deutsches Institut für Normung, 1985).
Similarly, Volatile Suspended Solids concentration was determined using the
methodology described in the DIN 38414-S3 (Deutsches Institut für Normung,
1985a). These methods can be applied in sludge and sediments.

58
4.5 References
Bartholomew, J.W. (1981) Stains for Microorganisms in Smears. In: Clarck, G. (Ed.).
Staining Procedures, 4th edn. Williams and Wilkins, Baltimore, pp. 375-440.
Deutsches Institut für Normung. (1980). DIN 38409 H41-1 CSB Bestimmung. Deutsche
Einheitsverfahren zur Wasser-, Abwasser- und Sclammuntersuchung.
Deutschland: WILEY-VCH; Beuth Verlag GmbH.
Deutsches Institut für Normung. (1981). DIN 38414-S10 Bestimmung des
Schlammvolumenanteil im Belebungsbecken. Deutsche Einheitsverfahren zur
Wasser-, Abwasser- und Sclammuntersuchung . Deutschland.
Deutsches Institut für Normung. (1983). Bestimmung des Ammonium - Stickstoffs DIN
38406-E5. Deutsche Einheitsverfahren zur Wasser-, Abwasser- und
Sclammuntersuchung. Deutschland.
Deutsches Institut für Normung. (1985). DIN 38414-S2 Bestimmung des
Wassergehaltes und des Trockenrückstandes. Deutsche Einheitsverfahren zur
Wasser-, Abwasser- und Schlammuntersuchung. Deutschland.
Deutsches Institut für Normung. (1985a). DIN 38414-S3 Bestimmung des Glühverlust
(Organische Substanz). Deutsche Einheitsverfahren zur Wasser-, Abwasser-
und Schlammuntersuchung. Deutschland.
Deutsches Institut für Normung. (1987). DIN 38409-H51 Bestimmung des
Biochemischen Sauerstoffbedarfs in n Tagen nach dem Verdünnungsprinzip
(Verdünnungs-BSBn). Deutsche Einheitsverfahren zur Wasser-, Abwasser- und
Sclammuntersuchung. Deutschland.
Deutsches Institut für Normung. (1999). DIN 38414-19 Bestimmung der
Wasserdampfflüchtigen organischen Säuren . Deutsche Einheitsverfahren zur
Wasser-, Abwasser- und Schlammuntersuchung. Deutschland.
Deutsches Institut für Normung. (2004). DIN EN ISO 6878 Wasserbeschaffenheit
Bestimmung von Phosphor - Photometrisches Verfahren mittels
Ammoniummolybdat (ISO 6878:2004). Deutsche Einheitsverfahren zur Wasser-
, Abwasser- und Sclammuntersuchung. Deutschland.
Deutsches Institut für Normung. (2004). Teil 3: Anleitung zur Konservierung und
Handhabung von Wasserproben (ISO 5667-3:2003). Wasserbeschaffenheit
Probenahme. Deutschland.
Deutsches Institut für Normung. (n.d.). DIN 38409-H52. Deutsche Einheitsverfahren
zur Wasser-, Abwasser- und Sclammuntersuchung.
Jenkins, D., Richard, M.G., and Daigger, G.T (1986) Manual on the causes and control
of activated sludge bulking and foaming. W.R.C., Pretoria e U.S. E.P.A.,
Cincinnati.

59
Jenkins, D., Richards, M.G., and Daigger, G.T., (1993) Manual on the Causes and
Control of Activated Sludge Bulking and Foaming, 2nd edn. Lewis, London.
Lindrea, K.C., Seviour, E.M., Seviour, R.J., Blackall, L.L., and Soddell, J.A., (1999)
Practical methods for the examination and characterization of activated sludge.
In: Seviour, R.J., Blackall, L.L. (Eds.), The Microbiology of Activated Sludge.
Kluwer Academic Publishing, Boston, pp. 257– 293.
Murray, R.G.E., Doetsch, R.N., and Robinow, C.F. (1994) Determinative and
cytological light microscopy. In: Gehardt, P., Murray, R.G.E., Wood, W.A.,
Krieg, N.R. (Eds.), Methods for General and Molecular Bacteriology. American
Society for Microbiology. Washington, DC, pp. 21-41.

60
CHAPTER 5: The production of volatile fatty acids in an SBR reactor using glucose as a carbon source
5.1 Introduction
One of the products obtained from the fermentation processes of domestic and
industrial wastewaters are volatile fatty acids (VFA).
As is well known, VFA have been identified as the carbon sources most readily
integrated in the metabolic processes of the activated sludge bacterial community.
Specifically, VFA are easily assimilated by the microorganisms involved in phosphorus
removal from wastewater through the EBPR process (Randall & Khouri, 1998; Pitman,
1999; Ruel et al., 2002).
Thus, there is significant interest in also promoting VFA production in wastewater when
phosphorus removal by biological means is being pursued. In this regard, some
WWTPs have included phases in their systems that promote the fermentation
processes that produce VFA (Maharaj & Elefsiniotis, 2001).
The most suitable operational parameters to achieve good VFA production from
wastewater have long been studied. Various research has focused on showing the
influence on VFA production of operational parameters such as Hydraulic Retention
Time (HRT), Organic Loading Rate (OLR), pH, temperature and COD concentration in
influent. However, several inconsistencies regarding these influences have been
observed (Dinopoulou et al., 1987; Alkaya & Demirer, 2010).
According other research, for specific requirements such as the EBPR process,
obtaining high concentrations of specific VFA, as acetic acid, was the most suitable.
Therefore, in this research, the effects of the operational parameters on the VFA
composition were also evaluated (Dinopoulou et al., 1987; Albuquerque et al., 2007;
Silva et al., 2013).
Previous investigations (Breure & van Andel, 1984; Dohányos et al., 1985) used
different substrates to assess VFA production and they concluded that the VFA
composition was specific to the type of substrate. Considering these contributions,
comparisons of results about the influence of operational parameters on VFA
production should only be made between studies that used similar fermentation
substrates.

61
The present research aims to achieve a stable VFA production at a high rate from
synthetic wastewater. To achieve this goal, operational parameters related to the
biomass concentration, such as TSS and the amount of substrate available for the
biomass (F/M ratio), were taken into account. Meanwhile, other parameters were
maintained at constant values such as HRT (12 hours), influent COD (600 mg/l) and
OLR (400 mgCOD/l.cycle).
In turn, the bacterial community in this investigation corresponds to an acidogenic
community maintained at an appropriate HRT which allowed the development of these
organisms and prevented the development of their competitors.
5.2 Material and methods
5.2.1 Synthetic wastewater composition.
The synthetic wastewater was elaborated with the composition shown in Table 5.1. The
synthetic wastewater was composed of three groups of chemical components:
Carbon source: α-D(+)-Glucose Monohydrat (Carl Roth-Germany) and Peptone
from casein (Merck –Germany)
Nutrients: KH2PO4-P (Merck-Germany) and NH4Cl-N (Carl Roth-Germany)
Other (sources of Mg, Cu, Ca, Mn, Zn, Cl, S)
Table 5.1: Composition of the synthetic wastewater for VFA production.
Components Initial concentration
(mg/l)
Glucose 589.5
P (KH2PO4) 7
N (NH4Cl) 30
Mg (MgCl2) 10
Cu (CuSO4) 0.1
Ca (CaCl2) 5
Mn (MnSO4) 0.1
Zn (ZnCl2) 0.1
Pepton 10
C:N:P 35:3.8:1

62
5.2.2 Inoculum
The microbial community used as inoculum came from the aeration tank of the
activated sludge system of the Uelzen WWTP (Niedersachsen - Germany).
5.2.3 Location:
The experimental process was performed at the laboratories of the Civil and
Environmental Engineering Faculty of the Ostfalia University - Campus Suderburg
(Niedersachsen, Germany) from March 2011 to June 2013.
5.2.4 Reactor design and operational parameters
The experiment was conducted in a polyethylene glass tank which worked as a
sequential batch reactor (SBR) with working volume of 30 liters. The agitation system
and the charge and discharge pumps were controlled by digital timers Theben TR 644
top2 RC.
The reactor was operated in 3 cycles of 8 hours per day. Each cycle consisted of 56
minutes of filling, 6 hours of anaerobic reaction, 35 minutes of settling, 10 minutes of
drawing and 19 minutes of idle phase.
At the beginning of each cycle, a volume of 20 liter of synthetic wastewater was added
during the filling phase, resulting in a HRT of 12 hours. The Mean Cell Retention Time
(MCRT) or Sludge Retention Time (SRT) in mixed liquor was 4.9 days to maintain a
TSS of 1000 mg/l; 7.4 days to maintain a TSS of 1500 mg/l and 9.9 days to maintain a
TSS of 2000 mg/l. The excess sludge was removed during the anaerobic phase each
Figure 5.1: Time distribution in each cycle of operation during fermentation process

63
day. The F/M ratio was ranging from 0.059 gBOD5/gTSS.cycle to 0.165
gBOD5/gTSS.cycle (Table 5.2).
Since the operating temperature was not controlled, it was varying between 18°C to
23°C depending on the season.
The biomass concentration (TSS) and the F/M ratio changed during time to show its
influence on the VFA production.
Table 5.2: Variation of the operational parameters during the experimental process of VFA
production.
Parameter Unit
Value
03.11-
12.11
Value
01.12-
05.12
Value
06.12-
11.12
Value
12.12-
02.13
Value
03.13-
04.13
Value
05.13-
06.13
COD influent mg/l 600 600 60 600 600 600
Total Volum (Vt) l 35 35 35 35 35 35
Filled volum (Vf) l 30 30 30 30 30 30
Total suspended
solids (TSS) mg/l 2000 1500 1000 2000 1500 1000
Volatile suspended
solids (VSS) mg/l 1810 1250 865 1700 1275 832
Sludge volume
index (SVI) ml/g 110 95 97 100 100 85
Hydraulic retention
time (HRT) h 12 12 12 12 12 12
Mean cell retention
time (θc) d 9.9 7.4 4.9 9.9 7.4 4.9
5.2.5 Sampling
To determine the VFA composition and the production capacity of VFA within an
operating cycle, three samples were taken of about 300 ml each of mixed liquor , at the
end of the second, fourth and sixth hour of the anaerobic phase. The mixed liquor
samples were allowed to decant and the supernatants were considered the final
samples. Additionally, a sample of the effluent of about 250 ml was taken as well. The

64
samples were taken in transparent polyethylene bottles of 250 ml and filled to the brim
to be subsequently stored at 4°C during 24 hours according to the DIN 38414-19
(Deutsches Institut für Normung, 1999), pending analysis.
5.2.6 Samples analysis
The samples were collected, preserved, stored, and analyzed following the guidelines
described in the relevant standard DIN Norms of the German Institute for
Standardization. The DIN Norms used in the experimental processes are shown in
Table 5.3.
Table 5.3: DIN Norms used for collecting, preserving, storing, and analysis of the samples
during the experimental process of VFA production.
Parameter Sampling and analysis
Preservation and storage
COD DIN 38409-H41-1 DIN EN ISO 5667 – 3
(A21) (Deutsches Institut
für Normung, 2004)
TSS DIN 38414 – S2
VSS DIN 38414 – S3
Organic acids DIN 38414 – S19
5.2.7 Stable operational conditions
Broadly speaking, two main factors affect the productivity and stability of the acidogenic
phase in anaerobic reactors. These factors are the operational parameters and the
characteristics of the organic substrate used in fermentation processess.
Based on previous research, the main operational parameters affecting the productivity
of the acidogenic phase in anaerobic reactors are HRT, temperature (T°) and COD
concentration in the influent (Dinopoulou et al., 1987; Banerjee, 1997). Other
investigators included parameters as organic loading rate (OLR) and pH (Breure and
van Andel, 1984; Donányos, 1985).
Previous investigations on the most suitable operational parameters to optimize the
productivity of the acidogenic phase were considered. From these investigations, the
operational parameters shown in Table 5.4 were controlled in an attempt to show the

65
influence of the TSS and F/M ratio in mixed liquor on the VFA production, acidification
degree (α) and acidogenic potential.
Table 5.4: Constant operational parameters used in the fermentation reactor.
Operational parameter Unit Value
pH --------------- * 4.5 - 5.5
HRT hours 12
Temperature (T°) °C * 18 - 23
COD influent mg/l 600
OLR mgCOD/l.cycle 400
* Values obtained without controlling the operational parameters.
Research by Dinopoulou et al., (1987) showed the influence of the HRT on the
acidogenic phase productivity of organic substrates, reporting that HRT and
temperature had the strongest influences on the degree of acidification and
acidification potential.
Choosing the right HRT to enhance the VFA productivity was of great importance since
it was necessary to minimize the development of the methanogenic bacterial
community, as this bacterial group consumes the VFA produced. Sun et al. (2010)
suggested that the use of short HRT would not allow the extension of the substrate
degradation process, fact confirmed through the low methane production. In turn,
Alkaya (2010) evaluated the VFA production using sugar beet wastewater as
fermentation substrate and COD influent of 6621 mg/l, obtaining the highest VFA
production with HRT of 2 days. Subsequently, the VFA production decreased and the
methane production increased significantly when the HRT was extended to 4 days.
Research by Dinopoulous et al. (1987) used beef extract as fermentation substrate and
initial COD concentration of 3 g/l, reporting a critical HRT between 6 and 8 hours. With
HRT lower than the mentioned, the acidification degree (α) decreased markedly and
with higher HRT the acidification degree reached values that did not vary significantly
when increasing the HRT.
In the present research, to avoid the VFA consumption at the end of the acidogenic
phase by the methanogenic community, the HRT was reduced to 12 hours. Previously,
a research by Elefsiniotis & Oldham, (1994) evaluated the VFA production during the
acidogenic phase using primary sludge as substrate. The results showed that the VFA
production decreased if the HRT was increased to more than 12 hours.

66
Moreover, a previous research maintained constant the HRT and varied the OLR from
9.4 gCOD/l.d to 72 gCOD/l.d, observing no significant effect on the acidification degree
(α) which remained at 56% (Dinopoulous et al., 1987). However, Alkaya and Demirer
(2010) evaluated the VFA production using sugar beet wastewater as fermentation
substrate and a constant HRT, recording that when increasing the OLR also observed
an increase in the VFA production.
With the objective of evaluating the VFA production, this research used synthetic
wastewater as substrate with a medium concentration of 600 mg/l COD (Metcalf and
Eddy, 1998). With this COD concentration OLR values of 0.1667gDBO5/l.cycle or 0.4
gCOD/l.cycle were obtained, and these values are within the appropiated range for
sequential batch reactors (Metcalf and Eddy, 1998).
There is a general consensus about the influence of temperature on acidogenic
processes of organic substrates fermenters. Research by Maharaj and Elefsiniotis
(2001) observed a decrease of the VFA production rate when the operating
temperature decreased from 25°C to 8°C, using as fermentation substrate primary
sludge supplemented with starch. However, it was also mentioned that the acidogenic
process did not stop even when the lowest temperatures were achieved. In turn, Yuan,
et al. (2011) mentioned the drop of the primary sludge fermentation rate, when the
temperature decreased from 24°C to 14°C, showing a VFA composition that was
unchanged despite the temperature drop. In this latter study, even with 4°C, VFA
production was observed. Additionally, Maharaj and Elefsiniotis (2001) suggested that
temperature variation (between 8 and 25°C) did not affect the VSS concentration, since
this parameter was stable throughout the experimental process.
In the present study, the VFA production was evaluated at room temperature (18°C -
23°C).
pH values, recorded during acidogenic phases in fermentation reactors, vary
considerably between investigations. There are contradictions regarding which pH will
be the most suitable to increase the VFA productivity. Research by Alkaya and Demirer
(2010), reported that the highest VFA production was obtained at a pH of 5.3 (tests
without additional external alkalinity) using a mix of sugar beet wastewater and pulp in
a 1:1 ratio and with HRT of two days. In this latter research, the highest VFA production
was recorded with the lowest pH values. In turn, Silva et al. (2013) reached stable VFA
production using as fermentation substrates, cheese whey, sugarcane molasses and
OFMSN (organic fraction of municipal solid wastes) separately, recording pHs of 4.4,
4.5 and 5.6, respectively. Despite the low pH values reported by Silva et al. (2013), a

67
research by Dinopoulou et al. (1987), using beef extract as fermentation substrate, and
an HRT of 8 hours, reported high production of VFA (0.829 g/l) with neutral pH.
In the present research, pH values between 4.5 and 5.5 were recorded, using synthetic
wastewater with glucose as fermentation substrate, and HRT of 12 hours. The pH
values were recorded under steady state conditions. The steady State conditions were
reached when a stable VFA production was recorded.
None of the above investigations consider the biomass as an influencing variable on
the productivity of the acidogenic phase. In this investigation, keeping constant the
operational parameters already mentioned (Table 5.4), the influence of operational
parameters directly related to biomass concentration (TSS and F/M rate) was
assessed.

68
5.3 Results and discussion
5.3.1 VFA production within an operational cycle
Initially the influent (Table 5.1) had a COD concentration of 600 mg/l, resulting in a
C:N:P ratio of 35:3.8:1.
The initial concentration of TSS was 1000 mg/l, which was then given an adaptation
period of 2 months. In each cycle of operation, a specific volume of effluent was
discharged, allowing an HRT of 12 hours to be maintained and, therefore, minimizing
the development of the methanogenic bacterial community. Additionally, to avoid the
development of undesirable microorganisms, a TSS concentration between 1 and 2 g/l
was maintained.
The VFA production increased gradually as the bacterial community developed. After 4
months of operation, a VFA production of more than 200 mg/l was recorded. With an
anaerobic phase of 6 hours, a mixed liquor sample was taken every two hours and
then analyzed for total VFA concentration. Figure 5.2 shows the production of organic
acids within a cycle of operation. In this figure, each reactor is labelled by its TSS
concentration (g/l) in mixed liquor.
VFA concentrations ranged between 175 mg/l and 282 mg/l. In general, it can be seen
that once the TSS concentration increases above 2 g/l, the VFA production decreases.
0
50
100
150
200
250
300
2 4 6
VFA
(m
g/l)
Time (Hours)
R1(TSS=1.9) R2(TSS=2.2)
R3(TSS=2.4) R4(TSS=2.6)
R5(TSS=2.8) R6(TSS=2.6)
R7(TSS=2.7)
Figure 5.2: VFA production within cycles of operation related to the TSS concentration
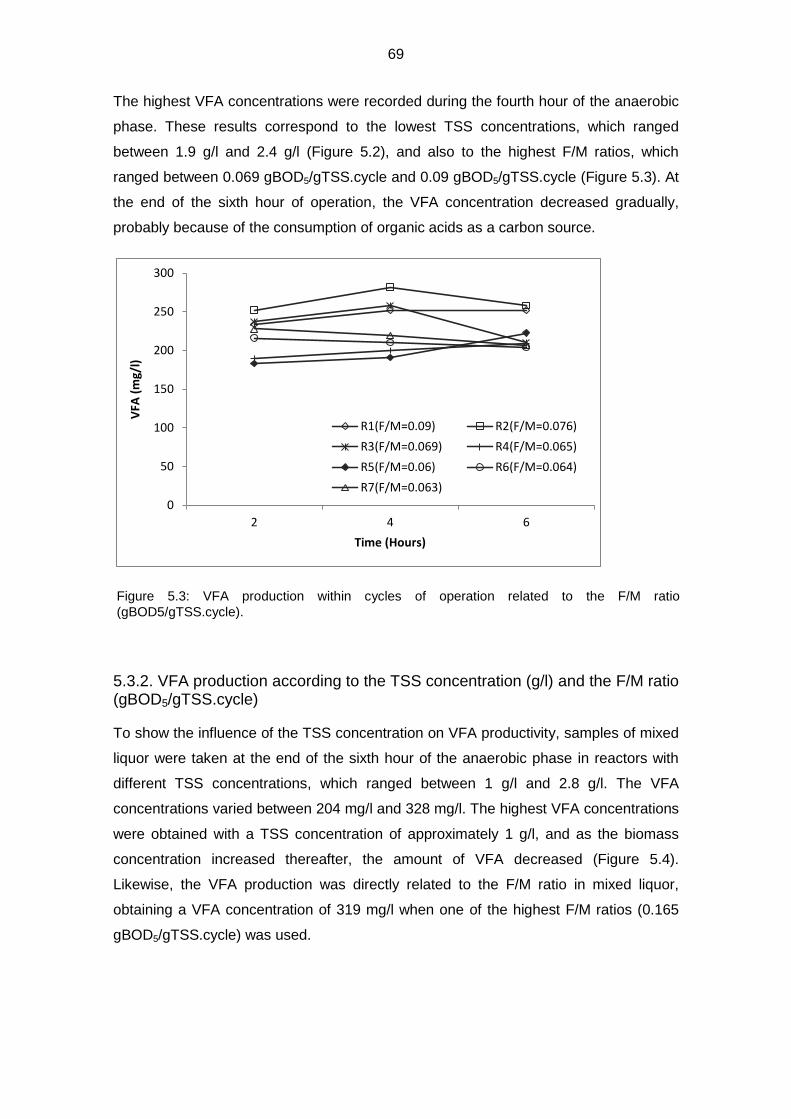
69
The highest VFA concentrations were recorded during the fourth hour of the anaerobic
phase. These results correspond to the lowest TSS concentrations, which ranged
between 1.9 g/l and 2.4 g/l (Figure 5.2), and also to the highest F/M ratios, which
ranged between 0.069 gBOD5/gTSS.cycle and 0.09 gBOD5/gTSS.cycle (Figure 5.3). At
the end of the sixth hour of operation, the VFA concentration decreased gradually,
probably because of the consumption of organic acids as a carbon source.
5.3.2. VFA production according to the TSS concentration (g/l) and the F/M ratio (gBOD5/gTSS.cycle)
To show the influence of the TSS concentration on VFA productivity, samples of mixed
liquor were taken at the end of the sixth hour of the anaerobic phase in reactors with
different TSS concentrations, which ranged between 1 g/l and 2.8 g/l. The VFA
concentrations varied between 204 mg/l and 328 mg/l. The highest VFA concentrations
were obtained with a TSS concentration of approximately 1 g/l, and as the biomass
concentration increased thereafter, the amount of VFA decreased (Figure 5.4).
Likewise, the VFA production was directly related to the F/M ratio in mixed liquor,
obtaining a VFA concentration of 319 mg/l when one of the highest F/M ratios (0.165
gBOD5/gTSS.cycle) was used.
0
50
100
150
200
250
300
2 4 6
VFA
(m
g/l)
Time (Hours)
R1(F/M=0.09) R2(F/M=0.076)
R3(F/M=0.069) R4(F/M=0.065)
R5(F/M=0.06) R6(F/M=0.064)
R7(F/M=0.063)
Figure 5.3: VFA production within cycles of operation related to the F/M ratio
(gBOD5/gTSS.cycle).

70
The high VFA production obtained with low TSS concentrations could be because the
VFA produced might be consumed as a carbon source by the same biomass; this VFA
consumption would increase as the TSS concentration increases. Additionally, it is
unlikely that the VFA consumption can be attributed to the methanogenic bacteria
community since the HRT (12 hours) was calculated to avoid this risk.
The use of low biomass concentrations in fermentation processes is mentioned in
research by Skalsky & Daigger, (1995). They suggested that VSS concentrations of
less than 10000 mg/l could improve the fermentation performance. In the light of this
suggestion, research by Banerjee (1997) and Maharaj and Elefsiniotis (2001) used
TSS concentrations of approximately 5000 mg/l. These investigations were conducted
using sludge (primary and excess sludge) and industrial wastewater as fermentation
substrate. Additionally, Cuevas et al. (1997), using domestic wastewater enriched with
molasses as fermentation substrate, TSS concentration of 900 mg/l, COD influent of
500 mg/l, F/M ratio of 1.35 gCODtotal/gTSS.d and HRT of 8 hours, obtained a
maximum VFA production of 280 mg/l. In this investigation, the maximum VFA
concentration obtained was 328 mg/l, using a TSS concentration of 1.05 g/l, COD
influent of 600 mg/l, F/M ratio of 0.381 gCODtotal/gTSS.cycle and HRT of 12 hours.
0,00
0,02
0,04
0,06
0,08
0,10
0,12
0,14
0,16
0,18
0
50
100
150
200
250
300
350
F/M
(gB
OD
5/gT
SS.c
ycle
)
VFA
(m
g/l)
TSS (g/l)
VFA (mg/l)
F/M ratio
Figure 5.4: Total VFA production at the end of the anaerobic phase against the TSS
concentration and the F/M ratio.

71
5.3.3. Influence of the TSS concentration and the F/M ratio on the acidogenic potential (gVFA/gCOD fed) and on the degree of acidification -α (%)
The degree of acidification (α) and the acidogenic potential were used as indicators of
stability of the acidification process. The degree of acidification can be defined as the
degree of acidogenic success, comparing the amount of solubilised material which was
converted to volatile fatty acids (Maharaj, 1999).
The degree of acidification is calculated according to (Alkaya & Demirer, 2010):
% Acidification degree (α) = (Sf/ Si) * 100 ……….. (5.1)
where:
Si: Initial substrate concentration as COD (mg/l)
Sf: Net production of VFA, expressed as COD-equivalent (mg/l)
To convert the VFA concentration (mg/l) to COD-equivalent (mg/l), the theoretical
equivalences (Table 5.5) reported by Yuan et al. (2011) were used.
Table 5.5: COD-theoretical equivalences for Volatile Fatty Acids according to Yuan et al. (2011)
C H O
VFA x y z mgCOD/mgCxHyOz
Acetic acid 2 4 2 1.07
Propionic acid 3 6 2 1.51
Butyric acid 4 8 2 1.82
Isobutyric acid 4 8 2 1.82
Valeric acid 5 10 2 2.04
Isovaleric acid 5 10 2 2.04
Caproic acid 6 12 2 2.21
Isocaproic acid 6 12 2 2.21
Heptanoic acid 7 14 2 2.34
The acidogenic potential is defined as the maximum VFA concentration obtained at the
end of an anaerobic fermentation process (Ruel et al., 2002). This calculation does not
consider the metabolic participation of the methanogenic bacterial community.

72
0
10
20
30
40
50
60
0,00
0,10
0,20
0,30
0,40
0,50
0,60
0,70
0,80
α (
%)
F/M
an
d a
cid
og
. p
ote
nti
al
TSS (g/l)
F/M
Acidog. Pot
Acidf.degree
The results of the degree of acidification and acidogenic potential in relation to the TSS
concentration and the F/M ratio are shown in Figure 5.5. These results correspond to
VFA concentrations (mg/l) obtained at the end of the anaerobic phase. As shown in
Figure 5.5, the lowest TSS concentration (1.05 g/l) and highest F/M ratio (0.159
gBOD5/gTSS.cycle) corresponded to the highest values of degree of acidification
(53.1%) and acidogenic potential (0.722 gVFA/gCOD).
Additionally, the highest acidogenic potential values (> 0.5 gVFA/gCOD) were obtained
with TSS concentrations of less than 2.4 g/l. After this, the acidogenic potential
decreased to 0.463 gVFA/gCOD when a TSS concentration of 2.42 g/l was used.
Research by Silva et al. (2013) using organic waste as fermentation substrates
(cheese whey, sugarcane molasses and organic fraction of municipal solid wastes-
OFMSW), VSS concentration of 2 g/l and influent COD concentration of 8000 mg/l,
resulted in degress of acidification which varied between 31% and 39.8% and
acidogenic potential values between 0.3 and 0.4 gVFA/gCODfed. These results are
consistent with the results obtained in the present research using a TSS concentration
of 2.2 g/l.
In turn, Dinopoulou et al. (1987) obtained acidification degrees between 30% and 60%,
using beef extract as fermentation substrate, HRT of 6 hours, COD influent of 3 g/l and
very low TSS concentrations (144 - 164 mg/l). Comparing the results of Silva et al.
(2013) and Dinopoulou et al. (1987) to the results here, it is possible to estimate that in
both previous investigations the F/M ratios were quite high. However, the present study
Figure 5.5: Degree of acidification (α-%) and acidogenic potential (gVFA/gCOD) against the
TSS concentration (g/l) and the F/M ratio (gBOD5/gTSS.cycle) in mixed liquor.

73
also used lower TSS concentrations, which produced better values of degree of
acidification.
Arroja et al. (2012) reported significant differences for the degree of acidification
obtained with two different bacterial communities (acidogenic biomass and
conventional mixed anaerobic biomass). This research used sugarcane molasses as
fermentation substrate, HRT of 12 hour and OLRs which were gradually increased up
to approximately 35 gCOD/l.d. The degree of acidification obtained by the acidogenic
community was 28%, while the conventional mixed anaerobic biomass obtained a
maximum degree of acidification of 14%.
In the present research, the high degrees of acidification obtained are strongly related
to low TSS concentrations (1 g/l) and to F/M ratios of approximately 0.16
gBOD5/gTSS.d. Additionally, the acidogenic bacterial community, selected from the
HRT, was a crucial factor in obtaining these results. This acidogenic bacterial
community had a typical creamy white color due to the low concentration of sulphate in
the synthetic wastewater and to suppression of the sulphate-reduction activity due to
the operational pH between 4.5 and 5.5 (Liu & Fang, 2002). These conditions were not
suitable for the development of the sulfate-reducing bacterial community (Herbert et al.,
2002).
5.3.4 Influence of TSS concentration and F/M ratio on VFA composition.
Several investigations have tried to determine the factors that influence VFA
composition in the acidogenic process of organic substrates. These investigations
evaluated the influence of operational parameters such as HRT, OLR, pH,
temperature, COD influent and type of organic substrate used.
The influence of HRT on VFA composition is not clear and different investigations have
produced different results. Cohen et al. (1984) reported that HRT has a significant
influence on VFA composition, while Breure and Van Andel (1984) stated that this
influence was negligible. Meanwhile, Dinopoulou et al. (1987), using meat extract as
fermentation substrate, reported that the proportion of acetic acid increased when the
HRT and influent COD increased simultaneously. Additionally, in this study the
proportion of propionic acid decreased as the HRT increased. However, the authors
mentioned that in no case could a quantitative relationship be statistically derived.
On the other hand, research by Dinopoulou et al. (1987) evaluated the influence of
temperature on the VFA composition. This research reported that a gradual increase of

74
temperature from 25°C to 40°C did not significantly influence the composition of the
VFA. Only a slight decrease in the percentage of propionic acid was observed as the
temperature increased, and in turn, a slight increase in the proportion of acetic acid.
The results of the analysis of the spectra of the acids in the present research are
shown below (Table 5.6).
Table 5.6: VFA composition in supernatant at the end of the anaerobic phase of the
fermentation process.
Acetic acid (mg/l)
Propionic acid (mg/l)
Butyric acid (mg/l)
VFA Total* (mg/l)
180 17 46 259
200 63 36 318
220 33 78 351
240 28 69 354
210 34 92 358
* VFA total also includes acids present in low concentrations such as Valeric acid
and/or Isovaleric acid.
Figure 5.6 shows the influence of the increase of the F/M ratio and the TSS
concentration on the VFA composition at the end of the acidogenic phase. It can be
seen that as the F/M ratio increased the VFA production increased also. Similar results
were reported in section 5.3.2. However, the VFA composition in each sample did not
vary significantly. Generally, acetic acid (58.7% - 69.5%) was the dominant VFA,
followed by butyric acid (11.3% - 25.7%), and finally propionic acid (6.6% - 19.8%). The
set of organic acids of high molecular weight (valeric acid, isovaleric acid) recorded
very low and stable concentrations (4.8% - 6.2%). It is worth noting that the only results
where propionic acid was recorded as the second most abundant organic acid was
when the highest operating temperature (23°C) was reached.

75
In turn, pH values between 4.5 and 4.8 were recorded when butyric acid was the
second most abundant VFA produced, and a pH of 5.5 was recorded when butyric acid
concentration decreased and the second most abundant VFA produced was in fact
propionic acid (Figure 5.7).
Likewise, in research by Silva et al. (2013), using sugarcane molasses as substrate,
the most abundant VFAs obtained were acetic, butyric and propionic acid.This
research confirmed that the synthesis of long chain VFAs occurs at low pHs.
Additionally, Albuquerque et al. (2007), investigated the fermentation of molasses,
observing that when pH decreased from 7 to 5, the concentration of acetic and
propionic acids decreased, and the concentration of butyric and valeric acid increased.
0
500
1000
1500
2000
2500
0
50
100
150
200
250
300
350
400
0,083 0,130 0,133 0,151 0,184
TSS
(mg/
l)
VFA
(m
g/l)
F/M
Acetic acid Propionic acid Butyric acid
Others TSS
Figure 5.6: VFA composition at the end of the anaerobic phase against the F/M ratio and the
TSS concentration in mixed liquor.

76
Dinopoulou et al. (1987) investigated the influence of certain operational parameters on
the VFA composition using meat extract as fermentation substrate. The most abundant
VFAs obtained were acetic acid (45%) and propionic acid (40%), while butyric and
valeric acid were present in concentrations between 4% and 17%. These proportions
showed no variations as pH and temperature varied. Additionally, the authors noted
that an increase of the influent COD influenced the concentration of propionic acid (R =
0.96) and an increase of the HRT and influent COD influenced the concentration of
acetic acid (R = 0.88).
Apparently, none of the operational parameters mentioned so far have had a clearly
observable influence on the VFA composition of acidogenic processes. However,
several investigations mentioned that the VFA composition might be determined by the
type of fermentation substrate used. Research by Cohen et al. (1979), Breure and van
Andel, (1984), and Dohányos et al. (1985) evaluated the acidogenic process using
glucose, sucrose, starch, pectin and gelatin as fermentation substrates, concluding that
VFA composition is dependent on the substrate used.
Regarding glucose as a fermentation substrate, Alkaya and Demirer (2010) mentioned
that the VFA composition obtained from carbohydrate fermentation included acetic,
propionic and butyric acids. These correspond to the principal VFAs obtained in the
present research. However, the high rates of acidogenic potential and high degrees of
acidificationrecorded here were achieved using the most suitable HRT, TSS and F/M
ratios.
0
1
2
3
4
5
6
0,0
0,1
0,2
0,3
0,4
0,5
0,6
0,7
0,8
0,9
1,0
16 18 19 19 21 23
pH
VFA
(%
)
Temperature
Acetic acid Propionic acid Butyric acid
Others pH
Figure 5.7: VFA composition at the end of the anaerobic phase against temperature and pH in
mixed liquor.

77
5.4 Conclusions
1. With a reaction time of six hours during the anaerobic phase, the highest VFA
production was recorded at the end of the fourth reaction hour. With operational
conditions as TSS of 1 mg/l, F/M ratio of 0.381 gCOD/gTSS and HRT of 12
hours, and using glucose as fermentation substrate, it may be concluded that
the anaerobic phase length may be reduced to four hours.
2. A total suspended solids concentration (TSS) in mixed liquor of about 1 g/l
and F/M ratio of approximately 0.4 gCOD/gTSS were the most appropriate
operational parameters to achieve the highest production of VFA. Further,
increasing the TSS concentration in mixed liquor was detrimental to the VFA
production.
It may therefore be concluded that to obtain good VFA production in
fermentation processes, the substrate requirements of the biomass should be
considered in order to avoid the consumption of the VFA by the same biomass.
3. Variations in the operational parameters TSS (g/l) and F/M ratio
(gBOD5/gTSS) showed no influence on the VFA composition at the end of the
reaction time.
4. It is possible to promote the development of the acidogenic bacterial
community when the HRT is kept constant within limits that do not permit the
completion of the fermentation process.
The VFA production of the fermentation reactor was used as a carbon source in a
subsequent study (Chapter 7) which aimed to develop different EBPR bacterial
communities using different composition in the influent.

78
5.5 References
Albuquerque, M.G.E., Eiroa, M., Torres, C., Nunes, B.R., and Reis, M.A.M. (2007)
Strategies for the development of a side stream process for
polyhydroxyalkanoate (PHA) production from sugar cane molasses. Journal of
Biotechnology 130(4): 411-421.
Alkaya, E., and Demirer, G. (2010) Anaerobic acidification of sugar-beet processing
wastes: Effect of operational parameters. Biomass and Bioenergy 35: 32-39.
Arroja, L., Capela, I., Nadais, H., Serafim, L.S., Silva, S. (2011). Acidogenic
Valorisation of High Strength Waste Products from Food Industry. Publisher: In:
Industrial Waste. Show, K.Y., and Guo, X (Eds). InTech, pp. 227-252.
Banerjee, A. (1997) The effect of hydraulic retention time (HRT) and temperature on
the acid-phase anaerobic digestion of primary sludge and industrial wastewater,
(M.Sc. thesis) The University of Manitoba, Winnipeg, Manitoba, Canada.
Breure, A.M., and van Andel, J.G. (1984) Hydrolysis and acidogenic fermentation of a
protein, gelatin, in an anaerobic continuous culture. Applied Microbiology and
Biotechnology 20:40—45.
Cohen, A., van Gemert, J.M., Zoetemeyer, R.J., and Breure, A.M. (1984) Main
characteristics and stoichiometric aspects of acidogenesis of soluble
carbohydrate containing wastewaters. Process Biochemistry 19:228 - 232.
Cohen, A., Zoetemeyer, R.J., Deursen, A., and van Andel, J.G. (1979) Anaerobic
digestion of glucose with separated acid production and methane formation.
Water Research 13:571—580.
Cuevas, G., Gonzáles, O., and Gonzáles, S. (1997) Fermentación de las aguas
residuales para la producción de AGV utilizando reactores discontinuos con
biomasa suspendida. AIDIS. Colegio de Ingenieros y Agrimensores de Puerto
Rico. Junio 1997. P.1-10.
Dinopoulou, G., Rudd, T., and Lester, J.N. (1987) Anaerobic acidogenesis of a
complex wastewater: The influence of operational parameters on reactor
performance. Biotechnology and Bioengineering 31:958-968.
Dohányos, M., Kosová, B., Zábranská, J., and Grau, P. (1985) Production and
Utilization of Volatile Fatty Acids in Various Types of Anaerobic Reactors. Water
Science and Technology 17: 191-205.
Elefsiniotis, P., Oldham, W.K. (1994) Effect of HRT on acidogenic digestion of primary
sludge. Journal of Environmental Engineering 120 (3): 645-660.
Herbert, H. P Fang., Liu, H., and Zhang, T. (2002) Characterization of a hydrogen-
producing granular sludge. Biotechnology and Bioengineering 78(1):44-52

79
Liu, H., and Fang, H.H.P. (2002) Hydrogen production from wastewater by acidogenic
granular sludge. Water Science and Technology 47(1): 153–158.
Maharaj, I., (1999) Acid-phase anaerobic digestion of primary sludge: the role of
hydraulic retention time (HRT), temperature and a starch-rich industrial
wastewater, (M.Sc. thesis). The University of Manitoba, Winnipeg, Manitoba,
Canada.
Maharaj, I., and Elefsiniotis, P. (2001) The role of HRT and low temperature on the
acidphase anaerobic digestion of municipal and industrial wastewaters.
Bioresource Technology 76(3):191 –197.
Pitman, A.R. (1999) Management of biological nutrient removal plant sludge change
the paradigms? Water Research 33(5):1141– 6.
Randall, A.A., and Khouri, T.Z. (1998) The effect of organic substrates on enhanced
biological phosphorus removal in continuous culture and batch experiments.
Advances in Environmental Research 2(2):218 –231.
Ruel, S.M., Comeau, Y., Heduit, A., Deronzier, G., Ginestet, P., and Audic, J.M. (2002)
Operating conditions for the determination of the biochemical acidogenic
potential of wastewater. Water Research 36:2337–2341.
Silva, F.C., Serafim, L.S., Nadais, H., Arroja, L., and Capela, I. (2013) Acidogenic
Fermentation Towards Valorisation of Organic Waste Streams into Volatile
Fatty Acids. Chemical and Biochemical Engineering Quarterly 27(4): 10.
Skalsky, D.S., and Daigger, G.T. (1995) Wastewater solids fermentation for volatile
acid production and enhanced biological phosphorus removal. Water
Environment Research 67: 230–237.
Sun, Y., Huang, L., Xue, L., and Mu, J. (2010) Optimization of Acidibility and Acidifying
Degree in Anaerobic Digestion. Sch. of Environ. and Chem. Eng., Dalian
Jiaotong Univ., Dalian, China. Bioinformatics and Biomedical Engineering
(iCBBE), 2010 4th International Conference.
Yuan, Q., Sparling, R., and Oleszkiewicz, J.A. (2011) VFA generation from waste
activated sludge - Effect of temperature and mixing. Chemosphere, 82: 603-
607.

80
CHAPTER 6: Assessment of the accumulation of PHA and phosphorus in EBPR bacterial communities using staining techniques and Scanning Electron Microscopy (SEM) coupled with Energy-Dispersive X-ray spectroscopy (EDX)
6.1 Introduction
In the present research, the changes observed in the storing of intracellular polymers in
different Bio-P bacterial communities were used to assess the stability of the EBPR
process.
Among the methodologies used to identify intracellular polymers in EBPR communities,
light microscopy may serve to visualize intracellular polyphosphate granules (volutine
granules) using specific staining techniques such as the Neisser staining technique, or
to identify intracellular polyhydroxyalkanoates (PHA) granules using the PHA technique
(sudan black).
Because of the incomplete information of the identity and abundance of
microorganisms in EBPR processes, the possibility of linking specific morphotypes with
their storage capacity of intracellular substances is still useful. With respect to the
morphotypes commonly found in activated sludge samples, EBPR bacterial
communities are composed of a mixed community with equitable composition of
coccus-, rod- and bacillus-shaped cells (Jeon et al., 2000). Besides identifying the
basic features of the morphotypes in EBPR systems, in this research the identification
of the Tetrad Forming Organisms (TFO) and coccus-shaped bacteria with high
phosphorus accumulation capacity was emphasized since these morphotypes were
identified as possibly related to either the socalled G-Bacteria (Sudiana et al., 1998) or,
respectively, Polyphosphate Accumulating Organisms (PAO) (Jeon et al., 2000).
According to the metabolic pathway proposed by Mino et al. (1987), the PAO bacteria
can uptake carbon sources as VFA and to store it as polyhydroxyalkanoates (PHA)
during the anaerobic phase. The energy required for this process can be met by
glicolysis of a portion of the stored glycogen and a portion of the stored polyphosphate
chains. Because of the degradation of the polyphosphate molecules, a portion of the
phosphate ions will be released to the aqueous phase. Thus, at the end of the
anaerobic phase it should be possible to visualize intracellular PHA granules and, at
the same time, a small number of polyphosphate granules. Subsequently, during the
aerobic phase, the PAO cells that are in the presence of oxygen could degrade the
stored PHA molecules to use it in growth and reproduction processes. The catabolism

81
of the PHA may provide the proton motive forces (PMF) that would be used for growth
and replenishment of polyphosphate stores (Seviour and Nielsen, 2010). Finally, at the
end of the aerobic phase, the intracellular polyphsosphate granules can be observed,
and also either the presence of only a small amount or the absence of PHA.
It is important to identify intracellular polymers in the TFO microorganisms since a
possible relation between this morphotype and PAO competitors has been proposed.
These microorganisms may compete with PAO for the carbon source during the
anaerobic phase, but during the aerobic phase they will be unable to store
polyphosphate, impairing the EBPR process. Cech and Hartmann (1993) identified a
morphotype described as tetrad-arranged cocci, called G-bacteria. Sudiana et al.
(1998) reported that the tetrads had the capacity to store lipophilic inclusions (possible
PHA), which they determined using the staining techniques sudan black B and nile blue
A. Additionally, the absence of intracellular polyphosphate granules in the tetrads was
reported in several investigations (Cech and Hartman, 1990; Blackall et al., 1997;
Sudiana et al., 1998). In order to confirm that the G-bacteria with the TFO morphotype
were PAO competitors, Cech and Hartman (1993) isolated one of the tetrad-arranged
cocci microorganisms, which was identified as Amaricoccus kaplicensis (Maszenan et
al., 1997). However, Falvo et al. (2001) showed that this microorganism was not a PAO
competitor since it was not able to uptake acetate or glucose as substrate.
Further molecular studies (Nielsen et al., 1999a) on a bacterial community which
recorded a deficient EBPR process revealed the presence of a bacterial group (35% of
the total bacterial community) with no polyphosphate accumulation capacity. These
microorganisms were related to a phylogenetic group called a cluster novel of
Gammaproteobacteria and described as a big coccus of about 3 to 4 micrometers in
diameter. Subsequent investigations showed the impossibility of relating the TFO
morphotype to the behavior of a PAO competitor (Seviour et al., 2000; Blackall et al.,
2002). GAO (glycogen accumulating organism), so-called by Mino et al. (1995), are
identified on the basis of a biochemical behavior of a microorganism group that
competes with PAO for the carbon source during the anaerobic phase but without
phosphorus assimilation during the aerobic phase. Thus, GAO is a classification based
on a biochemical behavior while the TFO classification is based on a morphological
description of a bacterial group which may or may not be related to the competitor
group of PAO. Moreover, a GAO bacterium, called Candidatus Competibacter
phosphatis (Gammaproteobacteria), has been identified that does not have a TFO
morphotype (Crocetti et al., 2002).

82
However, it is not possible to determine the metabolic role of the TFO morphotype in
the EBPR processes since this morphotype may include microorganisms from different
phylogenetic groups with different metabolic strategies.
In fact, these staining techniques are still usable for monitoring the performance of the
EBPR processes, although only visual. Techniques to visualize the intracellular PHA
using sudan black and the intracellular polyphosphate granules using methylene blue
may confirm that the EBPR process is functioning well, but it should be also considered
that the phosphorus removed may not all correspond to the EBPR metabolic process.
Investigations have shown that, in EBPR processes, the phosphorus accumulation on
the bacterial biomass is not restricted to the intracellular environment of the PAO
bacterial group but that other locations in the cell or in the floc should be considered as
well. In these locations, the phosphorus can be deposited through metabolic or
adsorption processes. Previous studies reported that, although the TFO
microorganisms were not able to store intracellular polyphosphate, their cell envelope
recorded a positive staining reaction to polyphosphate in some cases (Cech and
Hartman, 1990; Blackall et al., 1997; Sudiana et al., 1998). Additionally, He et al.
(1996), using transmission electron microscopy (TEM) coupled with energy dispersive
x-ray spectroscopy (EDX), suggested the possibility of orthophosphate adsorption as
iron hydroxide on the extracellular polymeric substances (EPS) of the activated sludge
floc. Finally, Oosthuizen and Cloete (2001), using scanning electron microscopy (SEM)
coupled with energy dispersive X-ray spectroscopy (EDX), recorded that a
considerable amount of phosphorus was removed through adsorption processes on the
EPS of the activated sludge flocs, so much so that 30% of the phosphorus content in
the sludge biomass corresponded to the EPS.
In the present research, the main objective of the SEM/EDS analysis is to identify the
principal morphotypes in the sludge samples and to determine which morphotype is
associated with the highest phosphorus accumulation capacity.

83
6.2 Material and methods
The sludge samples were taken from the S and B reactors at the end of the anaerobic
and aerobic phases. Additional sludge samples were taken from the aeration tank of
the Lüneburg WWTP (Lüneburg-BS sludge sample). The staining techniques used to
identify the intracellular storage polymers were the Neisser staining technique with
chrysoidine Y as the contrast solution (Merck 9240) for intracellular polyphosphate
granules, and the PHA staining technique with sudan black B (IV) 0.3% in ethanol
(60%) to identify intracellular granules of PHA. Detailed descriptions of the staining
techniques are presented in Chapter 4. The prepared slides were observed with a
Zeiss light microscope and the images were captured using a USB camera from the
brand BMS Systems with the Scopephoto software. The samples were observed using
the oil-immersion objective (1000 X).
Additionally, sludge samples from the S reactors were taken at the end of the aerobic
phase to perform SEM/EDX analysis in order to determine the phosphorus
accumulation capacity of the principal morphotypes.
Each sludge sample was pretreated before performing the SEM-EDX analyses. The
flowchart in Figure 6.1 shows the pretreatment procedure. This pretreatment was
performed with the aim reduce the potential distortion of the EPS in the floc in order to
maintain the phosphorus composition at exocellular level. The sludge samples were
pretreated following a centrifugation procedure (10000 rpm for five minutes) in which
they were rinsed three times using a solution of sterile double-deionized water and
centrifuged each time. Once the sludge samples dried, these were transported to the
Electron Microscopy Laboratory of the Osnabruck Hochschule (Niedersachsen-
Germany). In the laboratory, the dried sludge samples were cut into small pieces and
set on high purity carbon stubs before being coated under vacuum with a layer of high
purity carbon.
For the electron microscopy analysis, a Zeiss- EVO MA10 Scanning Electron
Microscope was used, coupled to an Oxford Inca Energy 250 EDX system.

84
Figure 6.1: Flowchart of the pre-procedure for the SEM/EDX analyses.
Analysis with SEM/EDX
Samples coated under vacuum, with a layer of high purity carbon
Dried sludge samples cut into small pieces and positioned on high purity carbon stubs .
Supernatant decanted and sample allowed to air dry for 48 hours.
Centrifuged three times (10000 rpm x 5 minutes)
The sludge sample resuspended in a proportion of 4 volumes of sterile double-deionized water and 1 volume of sludge sample.
Allowed to settle for 30 minutes; supernatant then decanted.
Sludge sample (50 ml - end of the aerobic phase)

85
6.3 Results and discussion
6.3.1. Identification of the principal bacterial morphotypes in the sludge samples using light microscopy
Figure 6.2 shows the basic appearance of each bacterial community in the sludge
samples. For the morphological characterization, the slides from the PHA staining
technique were used because of the better contrast and resolution of these images.
Figure 6.2: Basic appearance of the bacterial communities in the activated sludge samples
using the sudan black staining technique (1000 X).

86
Figure 6.2 shows that the S1 bacterial community was dominated by the TFO
morphotype but other morphotypes, such as filamentous and coccus bacillus, were
also identified. The dominant filamentous bacteria corresponded to the genus
Nostocoida (Kunst et al., 2000) but the concentration of these microorganisms did not
adversely affect the settling process. The S2 bacterial community showed a similar
composition to that observed in the S1 sludge sample, but the concentration of
filamentous bacteria was significantly lower. Because of the dominance of the TFO
morphotype in the S reactors, these sludge samples are refered to as the TFO or
glucose bacterial community. The dominance of the TFO morphotype has been
reported in: reactors fed with glucose as carbon source (Jeon et al., 2000), in reactors
fed with a mix of glucose and acetate (Cech and Hartmann, 1993), and in reactors fed
with wastewater containing high concentration of carbohydrates (Tsai and Liu, 2002).
Other research relates the use of glucose as a carbon source to the reduction of the
EBPR performance (Cech and Hartmann, 1990, 1993; Rustrian et al., 1996).
Meanwhile, however, other research has recorded good EBPR performance using
glucose as the sole carbon source (Tracy and Flaminno, 1987; Carucci et al., 1994).
According to Jeon and Park (2000), two groups of microorganisms are involved in
achieving good EBPR performance in reactors fed with glucose. One of these groups is
the LPO morphotype (lactic acid producing organism) which uptakes glucose and
simultaneously stores glycogen. To cover the energy demand of this process, the cell
metabolizes part of the glucose through glycolysis, obtaining in turn not only energy but
also lactate. Subsequently, the glycogen is converted into PHA and storage polymers.
The second group of microorganisms is the polyphosphate-accumulating organism
(PAO), which uptakes the lactate, converting it into PHA and simultaneously releasing
orthophosphate during the anaerobic phase. Finally, PAO microorganisms accumulate
polyphosphate intracellularly during the aerobic phase.
Unfortunately Jeon and Park (2000) did not have enough microbiological evidence to
support the metabolic pathway they proposed. Recently, however, Wong and Liu
(2007) have reported that Defluviicoccus vanus related GAO microorganism was able
to uptake glucose directly and according to Seviour and Nielsen (2010) Defluviicoccus
shows the TFO morphotype in FISH probes. This offers some support for the model of
Jeon and Park (2000). In the present research, even with the dominance of the TFO
morphotype, good EBPR performances were achieved, but clarifying the metabolic
pathways behind this process is difficult since the microorganisms involved are still
unknown.

87
Figure 6.2 also shows the microscopic appearance of the B2, B4 and Lüneburg-BS
sludge samples. These sludge samples corresponded to EBPR bacterial communities
fed with a mix of VFA, propionic acid, and domestic wastewater, respectively. These
bacterial communities recorded typical EBPR performance, releasing and accumulating
polymers between the anaerobic and the aerobic phases. The microscopic structure of
these sludge samples corresponds to a mixed community consisting of coccus, rod,
bacillus, cuboidals (Jeon et al., 2000) and filamentous bacteria. Additionally, none of
the mentioned morphotypes was observed to be dominant in any case. These mixed
bacterial communities are called EBPR communities in this research.
6.3.2 Storage of intracellular polymers during the anaerobic and the aerobic phases.
The confirmation of the release and storage of intracellular polymers, as part of the
EBPR process, is described below. In each reactor, a sludge sample was taken at the
end of the anaerobic and aerobic phases. These samples were subjected to staining
processes to identify intracellular PHA granules using the PHA staining technique, and
to identify intracellular polyphosphate granules using the Neisser staining technique. A
positive reaction for the Neisser staining reaction is the presence of intracellular black-
purple granules that are distinguishable from each other, and this indicates that the
intracellular phosphorus concentration is not so high. In the case that the concentration
of intracellular phosphorus is high, for example at the end of the aerobic phase, the
whole cell may be stained black-purple (Lindrea et al., 1999). In turn, a positive
reaction for the PHA staining technique is described as intracellular blue-black granules
on a clear (sometimes slightly colored) background. It should be noted that Sudan
black is a lipophylic dye and can dye all intracellular lipid material, among which is
usually PHA (Bartholomew, 1981; Murray et al., 1994; Seviour and Nielsen, 2010). For
the TFO morphotype, the staining reaction observed at the end of the anaerobic phase,
using the PHA staining technique, was the presence of intracellular black-blue granules
and, additionally, the whole intracellular space was stained with a blackish color. This
coloration was not easily observable at the end of the aerobic phase and, therefore, a
relation was established between this staining reaction and the typical PHA staining
reactions.
Figure 6.3 shows the results of the PHA and Neisser staining techniques for the S1,
S2, B2 and B4 sludge samples at the end of the anaerobic phase.

88
Figure 6.3: Results of the PHA (6.3.a, 6.3.c, 6.3.e, 6.3.g) and Neisser (6.3.b, 6.3.d, 6.3.f, 6.3.h)
staining techniques for the S1, S2, B2 and B4 sludge samples at the end of the anaerobic phase.

89
Figures 6.3.a, 6.3.c, 6.3.e, and 6.3.g show the results of the PHA staining technique at
the end of the anaerobic phase for the S1, S2, B2 and B4 sludge samples,
respectively. Figures 6.3.a (S1) and 6.3.c (S2) show the dominance of the TFO
morphotype as well as the positive reaction for the PHA staining technique. In the TFO
morphotype, the whole intracellular space was stained blue-black and areas with blue-
black granules on a clear background were also observed. In Figures 6.3.e (B2) and
6.3.g (B4), a positive reaction for the PHA staining technique was also observed but
with the form of intracellular granules on the coccus bacillus morphotype. In these
sludge samples, the absence of a positive reaction with the PHA technique in the TFO
morphotype should be noted, since this reaction confirms the difficulty this bacterial
group has uptaking VFA as a carbon source during the anaerobic phase.
Figures 6.3.b, 6.3.d, 6.3.f, and 6.3.h show the results of the Neisser staining technique
for the S1, S2, B2 and B4 sludge samples, respectively, at the end of the anaerobic
phase. In Figures 6.3.b (S1) and 6.3.d (S2) it can be seen that the TFO morphotype
does not show intracellular polyphosphate granules but an apparently positive Neisser
reaction in the cell surface can be observed, as other research has also reported (Cech
and Hartman, 1990; Blackall et al., 1997; Sudiana et al., 1998). In Figures 6.3.f (B2)
and 6.3.h (B4) the black-purple reaction was observed only in the cell surface of the
TFO morphotype and in some coccus bacillus, which were stained blackish.
Figure 6.4 shows the results of the staining tests using the Neisser and PHA staining
techniques for the S1, S2, B2, and B4 sludge samples at the end of the aerobic phase.
Figures 6.4.a (S1), 6.4.c (S2), 6.4.e (B2), and 6.4.g (B4) show the results using the
PHA staining technique. The S1 and S2 sludge samples showed positive reaction for
the PHA staining technique in the coccus bacillus morphotype, while the TFO
morphotype did not show intracellular accumulation of PHA granules. Additionally, the
B2 sludge sample showed no positive PHA reaction, but in the B4 sludge sample some
coccus bacillus showed intracellular granules of PHA.

90
Figure 6.4: Results of the PHA (6.4.a, 6.4.c, 6.4.e, 6.4.g) and Neisser staining techniques
(6.4.b, 6.4.d, 6.4.f, 6.4.h) for the S1, S2, B2 and B4 sludge samples at the end of the aerobic
phase.

91
The S1 sludge sample (Figure 6.4.a) showed a positive PHA staining reaction of blue-
black granules on a clear background, but specific morphotypes did not show any
reaction to the sudan black stain. Additionally, for the same bacterial community, a
positive Neisser staining reaction was also observed (Figure 6.4.b) as intracellular
black-purple granules in the coccus bacillus morphotype.
The S2 sludge sample showed a positive PHA staining reaction (Figure 6.4.c) in the
coccus bacillus morphotype, although this sample was taken at the end of the aerobic
phase. In reviewing the phosphorus removal performance in the S2 sludge sample, an
inefficient EBPR process was reported for this sampling date, with phosphorus content
in the effluent up to 2.3 mg/l recorded. Comparing the results of the S2 and S1 sludge
samples, a positive PHA staining reaction was also reported in the latter but with less
intensity, and the S1 reactor also recorded a phosphorus concentration in the effluent
up to 0.4 mg/l. The reason for the failure of the EBPR process in the S2 sludge sample
lies in an operational problem reported for this reactor, which had been in an anaerobic
phase for more than the previous 48 hours. Meanwhile, the consumption of the PHA
previously stored during the anaerobic phase was evident in the B2 and B4 sludge
samples, as either no or very little PHA staining reaction was observed, as shown in
Figures 6.4.e and 6.4.g, respectivelly.
Figure 6.5 shows the results corresponding to the PHA and Neisser staining
techniques for the Lüneburg-BS sludge sample at the end of the aerobic phase. In
Figure 6.5.a, a positive reaction for the PHA staining technique is observable, but only
to a small extent and only in the coccus bacillus morphotype.
Finally, Figures 6.4.b, 6.4.d, 6.4.f, and 6.4.h show the results corresponding to the
Neisser staining technique for the S1, S2, B2 and B4 sludge samples, respectively, at
the end of the aerobic phase. A positive reaction for the Neisser staining technique was
Figure 6.5: Results of the PHA (6.5.a) and Neisser (6.5.b) staining techniques for the
Lüneburg-BS sludge sample at the end of the aerobic phase.

92
recorded in all sludge samples for the coccus bacillus morphotype and also in the cell
surface of the TFO morphotype for the S1 and S2 sludge samples.
A high concentration of polyphosphate at intracellular level was observed in the S1, B2
and B4 sludge samples, where all the coccus bacillus cells were stained black-purple,
sometimes so much so that it was difficult to recognize the cell shape. Meanwhile, for
the S2 sludge sample, only black-purple granules were observed. Similar results were
obtained in the Lüneburg-BS sludge sample, where intracellular black-purple granules
in the coccus bacillus morphotype were observed, as well as complete masses of
stained cells. These staining results were consistent with the results of the EBPR
performance reported for each sludge sample, with total phosphorus concentrations in
effluent of up to 0.4 mg/l (S1), 0.7 mg/l (B2), 0.2 mg/l (B4), and 0.3 mg/l (Lüneburg-BS).
It should also be mentioned that intracellular granules of polyphosphate were not
observed in the TFO morphotypes in any sludge sample.
In summary, the typical fluctuations of the intracellular polymer storage between the
anaerobic and aerobic phases in EBPR systems were observed in all sludge samples,
except in the S2 sludge sample, where a previous operational problem has been
reported. Storage of PHA was observed during the anaerobic phase and intracellular
polyphosphate accumulation was also observed during the aerobic phase. The staining
results complement the results of the EBPR process performance, both confirming the
occurrence of the EBPR processes in the sludge samples. Additionally, the positive
PHA staining reaction on the TFO and coccus bacillus morphotype was observed, as
was the intracellular polyphosphate accumulation capacity of the coccus bacillus
morphotype. The capacity of the TFO morphotype to accumulate polyphosphate should
be noted, but it only occurred at exocellular level.
6.3.3 Assessment of phosphorus accumulation in activated sludge samples using Scanning Electron Microscopy (SEM) coupled with Energy-dispersive X-ray spectroscopy (EDX)
To estimate the amount of phosphorus deposited on each bacterial morphotype in the
activated sludge samples, a SEM/EDX analysis was performed.
In this technique, a solid sample is bombarded with a focused electron beam. This
bombardment causes a sample to emit X-ray spectra, where each X-ray spectrum is
specific to a chemical element. To quantify the chemical element concentration in the
sample, the energy of the released X-ray photons is measured. This measurement may
be performed by a detector that emits output pulses which are proportional in height to

93
the energy of the emitted photon. A pulse height analyzer (multichannel type) is used to
measure the height of the pulses.
The best SEM images were obtained with the S sludge samples. The SEM/EDX results
of the TFO, coccoid cells and filamentous morphotypes are shown in Figures 6.6, 6.7
and 6.8, respectively. The EDX spectra in Figures 6.6.b, 6.7.b, and 6.8.b show the X-
ray energy in kiloelectron volt (keV) on the X axis, and on the Y axis shows the number
of counts obtained for each chemical element. The image of the TFO morphotype was
capturered (Figure 6.6.a) before it lost its characteristic shape because of the intensity
of the bombardment of the electron beams. The EDX spectra for the TFO morphotype
(Figure 6.6.b) recorded up to approximately 2400 counts per channel for the element
phosphorus.
a
b
Figure 6.6: SEM image of the TFO morphotype (6.6.a) and EDX spectra corresponding to the
marked spectrum- points (6.6.b)

94
The other morphotype identified was a coccoid cells of less than 1 µm diameter (Figure
6.7.a). The EDX spectra of this morphotype recorded up to approximately 450 keV for
the element phosphorus.
Finally, a filamentous morphotype was identified (Figure 6.8) and its EDX spectra
recorded to up 200 keV for the element phosphorus. The identification of additional
morphotypes was not possible because of the intensity of the bombardment of the
electron beams on the sludge sample, which led to the morphotypes losing their
shapes.
b
a
a
b
Figure 6.7: SEM image of a cluster of the coccoid cell morphotype (6.7.a) and its respective
EDX spectra (6.7.b)

95
Among all the morphotypes assessed, the TFO recorded the highest amount of
phosphorus. However, the coccus bacillus morphotype, which recorded a positive
reaction for the Neisser staining technique at the end of the aerobic phase, was not
identified; therefore, it is not possible to know which of the two morphotypes would
have the highest phosphorus accumulation capacity.
b
a a
Figure 6.8: SEM image of the filamentous morphotype (6.8.a) and the EDX spectra
corresponding to the marked spectrum point (6.8.b)

96
6.4 Conclusions
1. The bacterial communities in the activated sludge samples were identified
according to their basic microscopic appearance using light microscopy and the
PHA staining technique. The bacterial communities identified were TFO,
obtained in reactors fed with glucose as carbon source (S1 and S2 reactors),
and EBPR, obtained in reactors fed with VFA and propionic acid separately (B2,
B4 and Lüneburg-BS reactors). The TFO bacterial community was dominated
by cuboidal bacteria disposed in groups of four cells, which were correspondigly
called Tetrad Forming Organisms. The appearance of the EBPR bacterial
community may be described as a mixed community, where no dominance by a
specific morphotype was observed, but rather the equal presence of coccoids,
coccus bacillus, rod shape, cuboidals and filamentous morphotypes.
2. The TFO and EBPR bacterial communities showed characteristic staining
reactions using the Neisser and PHA staining techniques during the anaerobic
and aerobic phases in the EBPR processes. Apparently, the TFO bacterial
community, in reactors fed with glucose, uptakes most of the carbon source at
the end of the anaerobic phase, as the positive PHA staining reaction was
abundant in this morphotype.
3. The bacterial communities obtained using glucose as a carbon source show the
dominance of the TFO morphotype but a coccus bacillus morphotype was also
identified. The TFO morphotype showed positive reaction to the Neisser
staining technique at exocellular level and the coccus bacillus morphotype
showed a strong positive reaction with the Neisser staining technique at the end
of the aerobic phase. These two bacterial groups showed typical accumulation
of intracellular polymers observed in efficient EBPR processes.
Bacterial communities fed with glucose as the sole carbon source are able to
show typical staining reactions observed in efficient EBPR processes.
4. Three different morphotypes were identified using the SEM/EDX technology:
TFO, coccoid and filamentous morphotypes. Of these morphotypes, the highest
counts per channel for phosphorus on the EDX spectra were recorded for the
TFO morphotype.

97
Although the results of the staining techniques showed that the TFO
morphotype had no capacity to store phosphorus intracellularly, the results
obtained using the SEM/EDX technology lead to the conclusion that this
morphotype was able to store phosphorus, it is assumed, at exocellular level.

98
6.5 References
Bartholomew, J.W. (1981) Stains for Microorganisms in Smears. In: Clark, G. (Ed.),
Staining Procedures, 4th edn. Williams and Wilkins, Baltimore, pp. 375– 440.
Blackall, L.L., Crocetti, G.R., Saunders, A.M., and Bond, P.L. (2002) A review and
update of the microbiology of enhanced biological phosphorus removal in
wastewater treatment plants. Antonie van Leeuwenhoek 81: 681-691.
Blackall, L.L., Rossetti, S., Christenssen, C., Cunningham, M., Hartman, P.,
Hugenholtz, P., and Tandoi, V. (1997) The characterization and description of
representatives of ‘G’ bacteria from activated sludge plants. Letters in Applied
Microbiology 25: 63–69.
Cech, J.S. and Hartman, P. (1993) Competition between polyphosphate and
polysaccharide accumulating bacteria in enhanced biological phosphate
removal systems. Water Research 27: 1219-1225.
Cech, J.S., and Hartman, P. (1990) Glucose induced break down of enhanced
biological phosphate removal. Environmental Technology 11: 651–656.
Cloete, T.E., and Oosthuizen, D.J. (2001) The role of extracellular exopolymers in the
removal of phosphorus from activated sludge. Water Research 35 (15): 3595-
3598.
Crocetti, G.R., Banfield, J.F., Keller, J., Bond, P.L., and Blackall, L.L. (2002) Glycogen-
accumulating organisms in laboratory-scale and full-scale wastewater treatment
processes. Microbiology 148: 3353–3364.
Falvo, A., Levantesi, C., Rossetti, S., Seviour, R.J., and Tandoi, V. (2001) Synthesis of
intracellular storage polymers by Amaricoccus kaplicensis, a tetrad forming
bacterium present in activated sludge. Journal of Applied Microbiology 91: 299–
305.
He, Q.H., Leppard, G., Paige, C.R., and Snodgrass, W.J. (1996) Transmission electron
microscopy of a phosphate effect on the colloid structure of iron hydroxide.
Water Research 30: 1345–1352.
Jeon, C.O., and Park, J.M. (2000 a) Enhanced biological phosphorus removal in a
sequencing batch reactor supplied with glucose as sole carbon source. Water
Research 34(7): 2160-2170.

99
Jeon, C.O., Lee, D.S., and Park, J.M. (2000) Morphological characteristics of microbial
sludge performing enhanced biological phosphorus removal in a sequencing
batch reactor fed with glucose as sole carbon source. Water Science and
Technology 41(12): 79-84.
Kunst, S., Helmer, C., and Knoop, S. (2000) Betriebsprobleme auf Kläranlagen durch
Blähschlamm, Schwimmschlamm, Schaum. Springer-Verlag.
Lindrea, K.C., Seviour, E.M., Seviour, R.J., Blackall, L.L., and Soddell, J.A. (1999)
Practical methods for the examination and characterization of activated sludge.
In: Seviour, R.J., Blackall, L.L. (Eds.), The Microbiology of Activated Sludge.
Kluwer Academic Publishing, Boston, pp. 257– 293.
López-Vázquez, C.M., Oehmen, A., Hooijmans, C.M, Brdjanovic, D., Gijzen, H.J.,
Yuan, Z., and van Loosdrecht, M.C.M. (2009) Modeling the PAO-GAO
competition: Effects of carbon source, pH and temperature. Water Research 43:
550-562.
Maszenan, A.M., Seviour, R.J., Patel, B.K.C., Rees, G.N., and McDougall, B.M. (1997)
Amaricoccus gen. nov., a gram negative coccus occurring in regular packages
or tetrads isolated from activated sludge and descriptions of Amaricoccus
bendigoensis sp. nov., Amaricoccus tamworthensis sp. nov., Amaricoccus
macauensis sp. nov. and Amaricoccus kaplicensis sp. nov. International Journal
of Systematic Bacteriology 47: 727– 734.
Mino, T., Arun, V., Tsuzuki, Y., and Matsuo, T., (1987) Effect of phosphorus
accumulation on acetate metabolism in the biological phosphorus removal
process. In: Ramadori, R. (Ed.), Biological Phosphate Removal from
Wastewaters. Pergamon Press, Oxford, pp. 27–38.
Mino, T., Liu, W.T., Kurisu, F., and Matsuo, T. (1995) Modelling glycogen storage and
denitrification capability of microorganisms in enhanced biological phosphate
removal processes. Water Science and Technology 31(2): 25–34.
Murray, R.G.E., Doetsch, R.N., and Robinow, C.F. (1994) Determinative and
cytological light microscopy. In: Gehardt, P., Murray, R.G.E., Wood, W.A.,
Krieg, N.R. (Eds.), Methods for General and Molecular Bacteriology. American
Society for Microbiology, Washington, DC, pp. 21– 41.

100
Nielsen, A.T., Liu, W-T., Filipe, C., Grady, L., Molin, S., and Stahl, D.A. (1999)
Identification of a novel group of bacteria in sludge from a deteriorated
biological phosphorus removal reactor. Applied and Environmental Microbiology
65: 1251–1258.
Seviour, R.J., Maszenan, A.M., Soddell, J.A., Tandoi, V., Patel, B.K.C., Kong, Y., and
Schumann, P. (2000) Microbiology of the ‘G-bacteria’ in activated sludge.
Environmental Microbiology 2: 581–593.
Sudiana, I.M., Mino, T., Satoh, H., and Matsuo, T. (1998). Morphology, in-situ
characterization with rRNA targeted probes and respiratory quinone profiles of
enhanced biological phosphorus removal sludge. Water Science and
Technology 38(8–9): 69–76.
Tsai, C.S., and Liu, W.T. (2002) Phylogenetic and physiological diversity of tetrad-
forming organisms in deteriorated biological phosphorus removal systems.
Water Science and Technology 46: 179-184.
Wong, M.T., and Liu, W.T. (2007) Ecophysiology of defluviicoccus-related tetrad-
forming organisms in an anaerobic-aerobic activated sludge process.
Environmental Microbiology 9: 1485-1496.

101
CHAPTER 7: Assessment of the performance of the EBPR process using different carbon sources and different C:N:P ratios in synthetic wastewater
7.1 Introduction
Activated sludge systems able to perform EBPR processes are among the most
efficient technologies for phosphorus removal from wastewater, achieving phosphorus
concentrations in effluent below 0.1 mg/l (Strom, 2006). However, wastewater
treatment plants (WWTP) that apply this process generally also have additional
phosphorus precipitation technology, using for this purpose compounds of calcium,
aluminium, and iron (Tchobanoglous et al., 2003). The need for an additional method
for phosphorus removal suggests that the EBPR process is not stable (Hartley and
Sickerdick, 1994; van Loosdrecht et al., 1997; Blackall et al., 2002; Seviour and
Nielsen, 2011). The metabolic mechanisms causing this instability have not yet been
explained and do not fit in the metabolic models proposed for the EBPR process
(Comeau et al., 1986; Wentzel et al., 1986; Mino et al., 1987).
So far, investigations into the stability of the EBPR process have focused on the
applied operational parameters, focussing on identifying the most suitable substrate for
the development of the polyphosphate accumulating organisms (PAO). It is often
proposed in the literature, that volatile fatty acids (VFA), mainly in the form of acetic
acid, are assimilated by PAO more efficiently, benefiting the polyphosphate uptake
during the aerobic phase (Comeau et al., 1986; Wentzel et al., 1986; Mino et al., 1987;
Satoh et al., 1996; Pitman, 1999; Mulkerrins et al., 2004).
Aditionally, research on the availability of substrate and the main nutrients required for
the development of an efficient EBPR process has also been performed. This research
focused on the proportions of carbon source (BOD5) in relation to nitrogen source
(Total Nitrogen) and phosphorus source (Total Phosphorus) in influent. The most
appropriate ratios for the EBPR process have been determined as a C:N:P ratio of
100:10:1 (Yu et al., 2007); the ratio C/N of 4 COD/N-TKN - 30 COD/Ntot (Puig Broch,
2007; Jenkins, 2003), and the ratio C/P of 40 - 140 COD/Ptot (Randall et al.,1992;
Jenkins, 2003). However, numerous experiments have recorded occasional low yields
of the EBPR process even under optimum operational conditions and even with
adequate nutritional requirements (Cech and Hartman, 1990; Seviour and Nielsen,
2010).

102
Generally, in real conditions, municipal wastewater will not have C:N:P proportions that
are optimal for the development of the EBPR process. The C:N:P proportion in
municipal wastewater will vary due to the different industrial activities performed in the
region, due to different eating habits of the community, because of the nature of the soil
and drinking water, and because of climatic variations such as the onset of the rainy
season. Because of these reasons, municipal wastewater mainly records a C:N:P ratio
of about 20:4:1 (Winkler, 2012).
In this investigation, the influence of the carbon source and the C:N:P ratios on the
EBPR performance used in influent were evaluated simultaneously. The carbon
sources used were a mixture of VFA, propionic acid, and glucose, and the C:N:P ratios
were 18.1:1.9:1; 37:2.5:1 and 45.2:4:1, respectively. The principal objective of this
investigation was to promote the development of different bacterial communities able to
perform EBPR processes. Additionally, a secondary objective was to clarify which
factors regarding influent composition are the most influential on the well-functioning of
the EBPR systems.
Subsequently, these bacterial communities were used in further research (Chapter 8),
aiming to evaluate their phosphorus sorption capacities.

103
7.2 Material and Methods
7.2.1 Composition of the synthetic wastewater
Different carbon sources (glucose, mix of VFA, and propionic acid) were employed to
produce three different types of wastewater. The compositions of the synthetic
wastewaters are shown in Table 7.1.
Table 7.1: Initial basic composition of the synthetic wastewaters (Modified from Liu et al., 2006).
Carbon source
Compound (mg/l)
Glucose (S)
Volatile fatty acids (VFA)
Propionic acid (Propionic)
Carbon source 589.5** 48.1 54.6
P (KH2PO4) 7.5 3.21 2.39
NH3-N (NH4Cl) 21 5 5
COD 600 67.2 71.9
MgCl2 10 10 10
CuSO4 0.1 0.1 0.1
CaCl2 5 5 5
MnSO4 0.1 0.1 0.1
ZnCl2 0.1 0.1 0.1
Peptone 10 10 10
C:N:P 33.3:2.8:1 9:1.6:1 12.5:2.1:1
** Initially, the synthetic wastewater was prepared using glucose as carbon source.
The so-called glucose community in S reactor was obtained using this carbon source.
In this research, the term VFA is used to describe the volatile fatty acids obtained in the
laboratory during fermentation processes using glucose as substrate. In summary, the
VFA had the following composition: 64.3% acetic acid, 19.3% butyric acid and 10.6%
propionic acid. Other organic acids, such as isobutyric acid, valeric acid and isovaleric
acid, accounted for 5.8% of the organic acid concentration. More details about the VFA
composition are discussed in Chapter 5.3.4
As shown in Table 7.2, the C:N:P ratio in each influent wastewater (Table 7.1) was
gradually changed in order to assess the effects of such modifications on the
phosphorus removal percentage (Prem %) and on the mass ratio of phosphorus uptake
per biomass unit as volatile suspended solids (MR mgPtot/gVSS).

104
Table 7.2: Carbon sources and C:N:P ratios used in synthetic wastewater in each reactor during
the assessment of the performance of the EBPR process.
C:N:P ratio
Reactor Carbon source
Month 1 - 6
Month 7 - 12
Month 13 - 18
Month 19 - 24
S Glucose 10-30:3:1 35:3:1 40:4:1 45:4:1
B1 Volatile fatty
acids ------- 10-20:2:1 35:3:1 45:4:1
B2
B3 Propionic
acid B4
7.2.2 Inoculum
The bacterial community used in this experiment was taken from the activated sludge
system of the Uelzen WWTP. Table 7.3 shows some characteristics of the inoculum at
the time it was collected. This bacterial community was moved to the laboratories of the
Faculty of Civil and Environmental Engineering of Ostfalia University and added to
reactors S, B2 and B4. After six months of operation, an inoculum of the S reactor was
used as inoculum for reactors B1 and B3.
Table 7.3: Characteristics of the inoculum used in the research of EBPR performance.
Parameter Value
Total suspended solids (TSS) 4.0 g/l
PO4-P in supernatant in aeration tank 0.35 mg/l
NH4-N in supernatant in aeration tank 0.49 mg/l
Excess sludge 483 m3/d
It should be noted that the Uelzen WWTP regularly uses iron chloride (FeCl2) as a
complementary technology for biological phosphorus removal from wastewater.
7.2.3 Location
The present research was performed in the laboratories of the Civil and Environmental
Engineering Faculty of Ostfalia University - Campus Suderburg (Niedersachsen,
Germany) from March 2011 to October 2013.
.

105
7.2.4 Reactors
Six sequential batch reactors (SBR) were used and their characteristics are presented
in Table 7.4.
Table 7.4: Basic characteristics of the SBR reactors used in the EBPR process assessment.
Reactor Material Total Volume
(l) Devices adapted*
S1, S2 Plexiglass 35 Yes
B1, B2, B3, B4 Glass 2 No
* Devices adapted refer to the systems already in reactors for loading, unloading,
mixing, and aeration.
The charge of the influent and discharge of the effluent were carried out using
peristaltic pumps. The charge and discharge levels were controlled considering the
length of each process and the pumping rates. Air injection was carried out using
membrane pumps. The agitation systems of the S reactors consisted of two blades
disposed about a central axis. For the B1, B2, B3 and B4 reactors, magnetic stirrers
were used. The daily sludge discharge was carried out manually.
All equipment was operated automatically using programmable timers. The basic
structure of a reactor is illustrated below in Figure 7.1.
Figure 7.1: Design of the SBR reactor used in the assessment of the EBPR process.

106
7.2.5 System Operation
The reactors were batchwise operated with three cycles per day, each of 8 hours. The
length and sequence of each phase in a cycle is shown below, in Figure 7.2.
Except for the organic loading rate (OLR), the other operational parameters were
maintained under stable conditions throughout the experimental process (Table 7.5).
Initially, for B1, B2, B3 and B4 reactors, low OLRs were used because of the need to
adapt the biomass to organic acids. Subsequently, the OLRs were gradually increased.
Table 7.5: Operational parameters used in the SBR reactors during the assessment of the
EBPR process.
Reactors
Parameter Units S1, S2 B1, B2, B3, B4
Organic loading rate (OLR) mg CODt/l.cycle 100 - 200 22.4 - 217.6
Total volume (Vt) l 35 2
Filling volume (Vf) l 30 1.5
Total Suspended Solids
(TSS) g/l 4 1 - 2
Sludge Volume Index (SVI) ml/g 87.4 93.5
Hydraulic Retention Time
(HRT) h 24 24
Mean Cell Residence Time
(MCRT) days 15 15
Reaction time (RT) min 383 383
Figure 7.2: Length and sequence of phases within each cycle of operation.

107
7.2.6 Sampling
At the beginning of the filling phase, samples of influent synthetic wastewater were
taken to determine its C:N:P ratio and the concentration of VFA. Within operating
cycles, mixed liquor samples were taken during and at the end of each anaerobic and
aerobic phase (Figure 7.3). The samples were immediately filtered using folded filters
and the filtrate was deposited in polyethylene bottles and stored at -20°C until analysis.
In the case of samples taken for measurement of total phosphorus content, a solution
of H2SO4 (1 Molar) was added to the samples until pH 2 was reached, at which point
they were frozen.
The samples for measurement of COD and BOD5 concentration were either analyzed
immediately or were refrigerated under temperatures between 1 and 4°C for up to 24
hours and then analyzed. Samples taken to measure the concentration of total
suspended solids (TSS) and volatile suspended solids (VSS) were analyzed
immediately.
Figure 7.3: Sampling cycle during the assessment of the EBPR process.
7.2.7 Sample Analysis
The samples were collected, preserved, stored, and analyzed following the guidelines
described in the relevant DIN Norms of the German Institute for Standardization. The
DIN Norms used are shown in Table 7.6.

108
Table 7.6: DIN Norms used for collection, preservation, storage, and analysis of the samples of
the EBPR process.
Parameter Sampling and analysis Preservation and storage
Total phosphorus DIN EN ISO 6878
DIN EN ISO 5667
– 3 (A21)
May 2004
COD DEV - H41 - 1
BOD5 DIN 38409 - H51 &
DIN 38409 - H52
NH4-N DIN 38406 T5
TSS DIN 38414 - S2
VSS DIN 38409 - 1
Organic
acids DIN 38414 - S19
Ortophosphate DIN 38405 - D - 11
Other analysis techniques were used to assess the composition of the influent
wastewater and the presence of nitrite and nitrate in mixed liquor during the anaerobic
and aerobic phases. These tests are listed in Table 7.7.
Table 7.7: Other parameters evaluated and the techniques used during the assessment of the
EBPR process
Parameter Techniques
Total nitrogen Dr. Lange LCK 238
Organic acids Dr. Lange LCK 365
Nitrite (NO3-N) Quantofix 913 13
Nitrate (NO2-N) Quantofix 913 13

109
7.3 Results and discussions
7.3.1 Stability assessment of phosphorus removal in EBPR processes considering the use of different carbon sources in the influent.
a. Effects on the phosphorus removal percentage
The analyses using volatile fatty acids (VFA) and propionic acid as carbon sources in
wastewater (Table 7.2) started after a month acclimatization period of the bacterial
communities.
To compare the phosphorus removal performance between reactors, either as
phosphorus removal percentage (Prem %) or phosphorus uptake (MR mgPtot/gVSS),
three different C:N:P ratios in the influent were considered. These C:N:P ratios were:
low - adverse (18.1:1.9:1), medium (37:2.5:1) and high (45.2:4:1).
It should be taken into account that the initial concentration of wastewater (Table 7.1)
was varied to reach each of the C:N:P proportions. The phosphorus removal
percentage was calculated considering the initial total phosphorus concentration in the
influent and the total phosphorus concentration in the effluent. This initial total
phosphorus concentration in the influent (Table 7.1) was almost constant for all three
different C:N:P ratios during the experimental process. The variations of the C:N:P
ratios were controlled by the COD/BOD concentration in the influent.
Initially, an adverse C:N:P ratio was used in all influent synthetic wastewaters. This
ratio was gradually varied as shown in Table 7.2. The results of phosphorus removal
(Prem) corresponding to the adverse C:N:P ratio in the influent are shown in Figure
7.4. With a C/P ratio of 18.1 in the influent, the reactors showed very different
percentages of phosphorus removal. The highest Prem (%) was obtained in the B2
reactor (EBPR community - VFA) followed by the B4 reactor (EBPR community -
propionic acid). In both cases, the removal percentages were much higher than those
recorded for the other reactors, and so high that a maximum difference of 58% was
observed between B2 (EBPR community - VFA) and B3 (Glucose community -
propionic acid) reactors.

110
2,4 2,5 7,6
0
10
20
30
40
50
60
70
80
90
100
18,1 37 45,2
N/P ratio P
re
mo
val (
%)
C/P ratio
S2 (Gluc-Gluc) B1 (Gluc-VFA)
B2 (EBPR-VFA) B3 (Gluc-Propion)
B4 (EBPR-Propion)
These results agree with investigations by Randall and Liu (2002), who observed that,
using acetic acid as carbon source in the influent wastewater, 3-hydroxy butyrate (3HB)
was obtained as reserve material, increasing the phosphorus uptake during the aerobic
phase. In comparison, using propionic acid as carbon source, such good results of
phosphorus uptake were not obtained. Additionally, Abu-Ghararah and Randall (1991)
showed that propionic acid was less effective than acetic acid for the EBPR system.
Both experiments were conducted in short-term batch tests.
For the B4 reactor, a similar yield but with a lesser removal percentage (58.2%) was
observed using propionic acid as carbon source. It should be mentioned that it was
assumed that the EBPR bacterial community (PAO included) was present in the
inoculum obtained from the Uelzen WWTP, which is supported by its performance of
phosphorus removal and by staining tests (Chapter 5.3). Given the presence of the
EBPR bacterial community, the results of the B4 reactor agree with the results obtained
by Hood and Randall (2001) who have suggested that propionic acid can be rapidly
assimilated by the PAO (Polyphosphate Accumulating Organisms) while not being
easily used by other microorganisms present in the activated sludge community.
Additionally, Lopez-Vasquez et al. (2009) observed a high enrichment of
Accumulibacter (PAO) when propionic acid was used as carbon source in the influent.
However, the abundance of PAO with respect to all of the microbial community should
Figure 7.4: Phosphorus removal percentages (Prem %) according to the C/P ratio (BOD5/Ptot)
and the N/P ratio (Ntot/Ptot) in the influent synthetic wastewater.

111
be considered. For example, Pijuan (2004) recorded an increase in the amount of
PAOMIX-binding cells (Accumulibacter) from 7% to 54% after 15 days of operation
using propionic acid as carbon source.
The low phosphorus removal percentage of 46% of S reactor is attributable to the
C:N:P ratio in influent which was not suitable for the EBPR process (Yu et al., 2007).
Before analyzing the phosphorus removal performance of the B1 and B3 reactors, the
relationship between the bacterial communities GAO (Glycogen Accumulating
Organism) and TFO (Tetrad Forming Organism) should be mentioned. It has been
shown that GAO and LPO (Lactate Producing Organisms) are the dominant bacterial
communities in reactors fed with glucose as carbon source (Jeon et al., 2000). The
morphotype of the LPO microorganisms is described as eight coccus-shaped cells,
when this observation was performed using SEM technology. Under light microscopy,
the LPO cell group is described as Tetrad Forming Organisms (TFO). Unlike GAO,
TFO bacteria are classified based only on their morphological characteristics (cuboidal
cells disposed in groups of four bacteria), and GAO bacteria are classified based on
their metabolic behavior (carbon source consumption during the anaerobic phase and
phosphorus uptake absence during the aerobic phase). It should also be noted that
some investigations relate some TFO organisms to GAO bacteria, but this does not
mean that all TFO should be classified as GAO (Seviour and Nielsen, 2011). In the
present research, the bacterial community in the S1 and S2 reactors (Glucose
community) was dominated by the TFO morphotype.
The lowest phosphorus removal percentages were recorded in the B1 (Glucose
community - VFA) and B3 (Glucose community - propionic acid) reactors with 34.8%
and 8.8% respectively. Regarding these results, research by Lopez-Vasquez et al.
(2009) indicates that using acetic acid and propionic acid as carbon source does not
promote the development of the GAO bacterial community which is dominant in
reactors fed with glucose (B1 and B3 reactors). Similarly, Lu et al. (2006) suggested
that the carbon source in influent should change from acetate to propionate in order to
eliminate the GAO community in lab-scale reactors. This latter study provides a
relationship that explains the detriment of the Glucose-TFO community (Figure 7.5) in
the B3 reactor and the loss of its phosphorus removal performance when receiving a
new carbon source. This relationship also raises the possibility that some TFO might
participate actively in the good performance of the EBPR process.

112
y = 2002,5x-0,383 R² = 0,958
0
0,5
1
1,5
2
2,5
0 15 22 27
TSS
(g/l
)
Time (days)
TSS - B3
After the experiment at the C:N:P ratio of 18.1:1.9:1, the carbon concentration (BOD5)
in the influent wastewater was gradually increased up to a C:N:P ratio of 37:2.5:1. The
results, summarized in Figure 7.4, show that the differences in phosphorus removal
percentage between reactors were not as large as those recorded when a C:N:P ratio
of 18.1:1.9:1 was used. For a C/P ratio of 37, the highest removal percentages were
obtained in B4 (EBPR community - propionic acid), S (Glucose community - glucose),
and B2 (EBPR community - VFA) reactors. In these reactors, the phosphorus removal
percentages recorded were up to 21.2% higher than those obtained in the other
reactors.
According to results of the microscopic tests (Chapter 5.3), the dominant bacterial
community in the S reactor was the so-called TFO community. Using staining
techniques, such as Neisser and Sudan Black, coccobacillus-shaped cells were also
observed and were in fact most abundant. This TFO bacterial community has been
consistently observed, to be most abundant in reactors fed with glucose as carbon
source. Research has repeatedly shown the ability of this community to synthesize and
store glycogen (Pijuan, 2004). Additionally, the GAO community has been identified as
unable to perform efficient EBPR processes. It should be noted that the malfunction of
the EBPR process, in reactors dominated by this community, was identified as a
response to the presence of microorganisms described as “coccoid cells in the form of
tetrads” (Cech and Hartman, 1990, 1993), i.e. the malfunction of the EBPR process
was related to the presence of a specific morphotype. However, further research
recorded that it was possible to obtain good and stable yields for EBPR processes
using glucose as carbon source in laboratory scale reactors (Carucci et al., 1994;
Wang et al., 2002).
Figure 7.5: Decrease of the bacterial concentration as TSS in the B3 reactor during the first
month of the experimental process.

113
Additionally, it should be considered that glucose as carbon source has been identified
as a substrate that allows a significant accumulation of intracellular glycogen (Pijuan,
2004) and that glycogen could play an important role in EBPR processes (Mino, 1998).
Furthermore, Jeon and Park (2000) have proposed that at least two bacterial groups
might be involved in EBPR processes in reactors fed with glucose. They suggest that
one of these groups is the LPO microorganisms (Lactic Accumulating Organisms) and
the other group is the PAO community. The first group would be able to take up
glucose directly and to transform it into glycogen, covering the energy demand of this
process with a glycolisis process that, in turn, would produce lactate. Subsequently, the
lactate produced by the LPO microorganisms would be used as carbon source by the
PAO community, which would release phosphorus during the anaerobic phase and
would take up phosphorus during the aerobic phase. This theory could explain the
phosphorus removal performance observed in the S reactors in the present research.
The good EBPR performance recorded for the S reactors was also confirmed by the
results of the Neisser staining technique (Chapter 6.3.1) which showed a considerable
amount of intracellular polyphosphate accumulation at the end of the aerobic phase for
these sludge samples.
In turn, the microscopic examination of the B2 and B4 reactors showed the same
structure of EBPR bacterial communities as previously seen at the Uelzen WWTP,
from where the sludge sample came, when the seasonally-recorded EBPR processes
were efficient. Thus, good yields of phosphorus removal were also observed in the B2
(EBPR community - VFA) and B4 (EBPR community - propionic acid) reactors,
recording phosphorus removal percentages of more than 80%. These results also
confirm the ability of the EBPR bacterial communities to improve the phosphorus
uptake when receiving VFA as carbon source.
Finally, the B3 reactor (Glucose community – propionic acid) continued to record the
lowest phosphorus removal percentages, confirming its low adaptability to using
propionic acid as carbon source.
The results obtained in the B1 reactor were not considered in this second group of
samples because of the presence of nitrate (NO3−) during the anaerobic phase,
resulting in the drastic deterioration of the EBPR process (Figure 7.6).

114
0
5
10
15
20
25
30
0
20
40
60
80
100
120
13 35,3 35,3 45,7 45,7 45,7 45,7 45,7
NO
3- c
c (
mg/
l)
P r
em
(%
)
C/P
P rem-B1 (%)
NO3- cc (mg/l)
Finally, the carbon concentration in the influent wastewater was gradually increased up
to a C:N:P ratio of 45.2:4:1. Using this C:N:P ratio, all reactors reached optimum
percentages of phosphorus removal, i.e. phosphorus removal percentages of around
90%. The results of phosphorus removal were similar in each reactor, with the largest
difference recorded between the S (98.6%) and B3 (87%) reactors. The highest
percentages of phosphorus removal were recorded again in the S reactor, followed by
the B2, B4 and B1 reactors. Again the B3 reactor recorded the lowest removal
percentage. In all cases, the reactors reached a total phosphorus concentration in
effluent of less than 0.4 mg/l.
b. Effects on the amount of phosphorus removed per mass unit of volatile
suspended solids (mgPtot/gVSS):
The results obtained in section 7.3.1.a showed the S reactor to be the most efficient in
terms of phosphorus removal percentage. However, these results do not consider the
difference between the biomass concentrations in each reactor. Based on the different
growth rates of each community, the phosphorus uptake capacity per gram of Volatile
Suspended Solids (mgPtot/gVSS) in each reactor was calculated.
Figure 7.7 shows the results obtained using an influent with a C:N:P ratio of 18.1:1.9:1.
With a C/P ratio of 18.1, the highest rates (mgPtot/gVSS) were recorded in the B2 and
B4 reactors, followed by the S, B1 and B3 reactors. These results agree with those
Figure 7.6: Deterioration of the EBPR process in the B1 reactor because of the presence of
nitrate (NO3−) during the anaerobic phase.

115
obtained for the percentages of phosphorus removal described in the previous section.
The limited capacity of phosphorus uptake showed by the B1 and B3 reactors should
be noted. Both bacterial communities recorded good yields of phosphorus removal
when receiving glucose as carbon source, but when the carbon source changed to
VFA for the B1 reactor and to propionic acid for the B3 reactor, the EBPR processes
were severely impaired.
Using a C:N:P ratio of 37:6.5:1 in the influent, the best ratio of phosphorus uptake was
obtained in the S reactor (1.47 mgPtot/gVSS) followed by the B4, B2, and B3 reactors.
Figure 7.7: Phosphorus uptake per mass unit of VSS vs the C/P (BOD5/Ptot) and N/P (Ntot/Ptot)
ratios in the influent.
Finally, using a C:N:P ratio of 45:6.6:1 in the influent, the best rates of phosphorus
uptake were recorded in the S reactor with 1.46 mgPtot/gVSS. The B1, B2, B3 and B4
reactors showed very similar results, each approximately 0.66 mg Ptot/gVSS.
With this later C:N:P ratio, a slight increase in the phosphorus uptake rate was
observed in the B3 reactor. This result may be because of the adaptation of this
bacterial community to using propionic acid as carbon source after ten months of
operation. The phosphorus uptake results for the B2 and B4 reactors decreased
considerably, a fact that contradicts the results obtained for the same reactors in terms
of removal percentage, which continued increasing during the experimental process.
The drop of the mgPtot/gVSS rates can be explained by the type of bacterial
community present in both reactors (EBPR community) and the C/P ratio in the influent
2,6 6,5 6,6
0
0,2
0,4
0,6
0,8
1
1,2
1,4
1,6
1,8
18,1 37 45,2
N/P ratio
mg
Pto
t /
g V
SS
C/P ratio
S2 B1 B2
B3 B4

116
0,00
0,10
0,20
0,30
0,40
0,50
0,60
0,70
36,7 54,6 58,6
mgP
tot/
gVSS
VFA (mg/l)
B3 reactor
0
0,05
0,1
0,15
0,2
0,25
0,3
0,35
48,1 48,5 53
mgP
tot/
gVSS
VFA (mg/l)
B1 reactor
wastewater. The phosphorus uptake decrease in the B2 and B4 reactors is explained
in more detail in section 7.3.2.c.
c. Relationship between the VFA concentration in the influent and the
phosphorus uptake capacity.
For reactors that used VFA and nutrient broth as carbon sources, the VFA
concentrations were gradually increased from approximately 36.7 mg/l to 90.9 mg/l.
During the first four months of operation for the B1 and B3 reactors (Figure 7.8), it was
observed that the mgPtot/gVSS rate generally decreased as the VFA concentration in
the influent increased, demonstrating once again the poor adaptability of the glucose
community to VFA as carbon source. The results of the biomass concentration
depletion over time in the B1 and B3 reactors (Figure 7.5) explain why the lowest
results of phosphorus removal percentages and phosphorus uptake were recorded in
these reactors.
On the other hand, the phophorus uptake ratio for the B2 and B4 reactors (Figure 7.9)
increased as the VFA concentration in the influent increased. The highest
mgPtot/gVSS rate was reached using a VFA concentration of approximately 54 mg/l in
the influent, to subsequently decrease as the VFA concentration in the influent
increased.
Figure 7.8: Effect of the VFA concentration in the influent on the phosphorus uptake capacity
of the B1 and B3 reactors (Glucose bacterial communities) during the first months of operation.

117
0,0
0,1
0,2
0,3
0,4
0,5
0,6
0,7
0,8
0,9
36,7 54,6 65,6
mgP
tot/
gVSS
VFA (mg/l)
B4 reactor
0,0
0,1
0,2
0,3
0,4
0,5
0,6
0,7
0,8
48,1 53,0 85,9 88,6
mgP
tot/
gVSS
VFA (mg/l)
B2 reactor
Similar research into the gradual increase of VFA concentration in the influent were
performed by Pijuan (2004), who recorded that increasing the propionate concentration
in the influent from approximately 1.35 mmolC/gVSS to 4.9 mmolC/gVSS did not result
in an increase of the phosphorus uptake rate, which remained at 0.012
mmolP/gVSS.min. Subsequently, when the concentration of acetic acid increased from
1.42 mmolC/gVSS to 5.3 mmolC/gVSS, the phosphorus uptake remained at 0.016
mmolP/gVSS.min to later decrease when the highest concentrations of acetate were
achieved. Other research performed under similar operational conditions (Randall and
Liu, 2002) used a VFA concentration in the influent (acetic acid and propionic acid) of
about 50 mg/l. This latter study obtained a relatively efficient EBPR process, with a
maximum phosphorus removal percentage of up to 77.2%, considering that the total
phosphorus concentration in the influent was 22 mg/l.
Additionally, according to Randall and Chapin (1997), a high concentration of acetate in
the influent may adversely affect the operation of EBPR processes, while Chuang et al.
(1998) reported that sludge samples with low COD-SS loading rates may have a high
potential for phosphorus uptake.
7.3.2 Stability assessment of phosphorus removal in EBPR processes using different C:N:P ratios in the influent.
a. Influence of the C/N (COD/Ntot) and C/P ratios (BOD5/Ptot) in the influent on
the phosphorus removal performance in EBPR processes
With regard to the necessary C/N ratio for denitrification processes in EBPR systems,
research by Puig et al. (2007) stated that values lower than 4gCOD/gN-TKN cannot
Figure 7.9: Effect of the VFA concentration in the influent on the phosphorus uptake capacity of
the B2 and B4 reactors (EBPR bacterial communities).

118
meet the carbon requirements of the denitrification process and hence nitrate ions will
accumulate in the reactor, causing the deterioration of the EBPR process. Additionally,
Jenkins (2003) showed that if the influent contains a C/N ratio equal to or greater than
30, the effects of nitrogen deficiency can be observed. These effects are: increase of
PHA production during the anaerobic phase, gradual decrease of COD and acetate
uptake, and decrease of the phosphorus release per acetate uptake ratio.
In the present research, all reactors received influents with C/N ratios higher than 4,
with values ranging between 5.7 and 109 gCOD/gN-TKN. These values are within the
nitrogen ranges identified as excess, limitation, and deficiency by Jenkins (2003).
Given the C/N ratio present in the influent, the reactors were not exposed to situations
of carbon deficiency.
Turning from nitrogen limitation to carbon limitation, research has suggested that the
EBPR process is carbon limited when the C/P ratio in the influent is low. According to
Randall et al. (1992), for settled domestic sewage, when the COD/TP ratio is less than
40, or in the case of BOD5/TP less than 20, the carbon source cannot cover the
metabolic requirements needed for the EBPR process. In case of carbon limitation, the
PHA reserves will not be enough to promote the subsequent storage of Poly-P and the
replenishment of glycogen during the aerobic phase.
In the present research, the influent wastewater did not show any phosphorus
deficiency, since the C/P (BOD5/Ptot) ratio was always less than 140 (Jenkins, 2003).
b. The influence of the N/P ratio in the influent on the performance of
phosphorus removal in EBPR processes
As mentioned above, the most suitable wastewater composition for the EBPR process
consists of the well-known C:N:P ratio of 100:10:1 as BOD5:Ntot:Ptot (Yu et al., 2007),
the C/N ratio between 4 as COD/N-TKN and 30 as COD/Ntot (Puig et al., 2007;
Jenkins, 2003), and the C/P ratio between 40 and 140 as COD/Ptot (Randall et al.,
1992; Jenkins, 2003). In the present research, it has been observed in some cases
that, although the composition of the influent was optimal for the EBPR process, low
phosphorus removal percentages were nonetheless recorded (Table 7.8).
The results presented in chapter 7.3.1.a showed the influence of the C/P ratio on the
percentage of phosphorus removal for N/P ratios between 1.9 and 4.3. Additional tests
with N/P ratios between 1.3 and 4.4 were performed in order to show the influence of

119
the N/P ratio on the phosphorus removal performance. These tests were performed
only in the S reactors.
Table 7.8: C/P, C/N and N/P ratios in the influent and the phosphorus removal percentages
obtained in the S reactors.
The results (Figure 7.10) show a direct relationship between the N/P ratio and the
percentage of phosphorous removal. Removal percentages higher than 80% were
obtained when the N/P ratio was equal to or greater than 2. Even with optimal C/P and
C/N ratios in the influent, for example 21.4 and 28.6 respectively, if the N/P ratio was
less than 2 the EBPR process was heavily impaired.
The N/P ratio can be graphed against the C/P ratio and the phosphorus removal
percentages to show the nitrogen requirement of EBPR processes. This nitrogen
requirement can be explained using the metabolic model proposed by Smolders (1994)
for PAO metabolism under aerobic conditions. According to this model, during the
aerobic phase a portion of the PHB stored is consumed for biomass formation, where
for each 1.27 mole of PHB degraded 0.2 mol of NH3 were consumed to produce 1C-
mol biomass. Additionally, 1.5 mol ATP would be required to produce 1C-mol biomass.
Figure 7.10 shows the minimum nitrogen requirement for biomass synthesis, a process
prior to phosphate transport.
C/P
(BOD5/Ptot)
C/P
(COD/Ptot)
C/N
(COD/Ntot)
N/P
(Ntot/Ptot)
Prem
(%)
55.5 133.2 28.6 4.6 92.9
21.4 51.4 28.6 1.8 59.8
22.1 53 28.2 1.9 46.0
22.1 53 27.9 1.9 45.1
36.9 88.6 9.2 4 83.6
42.4 101.8 25.1 4 98.4
43 103.2 25.6 4 98.6

120
c. Effects on the phosphorus removal percentage
The influence of the C:N:P ratio in the influent on the phosphorus removal performance
was shown in Chapter 7.3.1. In this section, the influence of the C/P (BOD5/Ptot) ratio
on the phosphorus removal percentage and phosphorus uptake ratio (mgPtot/gVSS) is
shown in more detail.
Figure 7.11 shows that as the C/P ratio in the influent was increased, the phosphorus
removal percentage increased in all cases. Initially, C/P ratios between 13.1 and 22.1
in the influent were used, with both the C/P and N/P ratios then being gradually
increased, as shown in Table 7.9.
0
10
20
30
40
50
60
70
80
90
100
0 0,5 1 1,5 2 2,5 3 3,5 4 4,5 5 5,5
C/P
rat
io &
Ph
osp
ho
rus
rem
ova
l (%
)
N/P ratio
C/P P tot removal (%)
Carbon deficiency zone
Nit
rog
en
de
fic
ien
cy
zo
ne
Optimal EBPR zone
Figure 7.10: Phosphorus removal percentage against the N/P and C/P ratios in the influent for
the S reactors.

121
y = 54,518ln(x) - 114,21 R² = 0,9698
-20
0
20
40
60
80
100
120
0 10 20 30 40 50
Ph
osp
ho
rus
rem
(%
)
C/P ratio
% Removal-B4
y = 54,969ln(x) - 133,57 R² = 0,9006
-20
0
20
40
60
80
100
0 10 20 30 40 50
Ph
osp
ho
rus
rem
(%
)
C/P ratio
% Removal-B3
y = 25,613ln(x) - 18,886 R² = 0,8512
0
10
20
30
40
50
60
70
80
90
100
0 10 20 30 40 50
Ph
osp
ho
rus
rem
(%
)
C/P ratio
% Removal-B1
y = 25,796ln(x) - 7,4459 R² = 0,9645
0
10
20
30
40
50
60
70
80
90
100
0 10 20 30 40 50
Ph
osp
ho
rus
rem
(%
)
C/P ratio
% Removal-B2
y = 57,022ln(x) - 128,17 R² = 0,8789
0
20
40
60
80
100
120
15 25 35 45 55 65
Ph
os
ph
oru
s r
em
(%
)
C/P ratio
% Removal-S
(b) (a)
(e)
(c)
(d)
(c)
(d)
(e)
Figure 7.11: Trend lines determined by the C/P (BOD5/Ptot) ratio in the influent against the
phosphorus removal percentage.

122
Table 7.9: Gradual increase of the C/P (BOD5/Ptot) and N/P (Ntot/Ptot) ratios in the influent
during the experimental process.
Ratio Month
1 - 6
Month
7 - 9
Month
10 - 12
Month
13 - 15
Month
16 - 18
Month
19 - 24
Month
25 - 27
C/P 13-22.1 22.1 35 38 40 45 56
N/P 1.9 1.9 3 4 4 4 4.1
As shown in Figure 7.11, the removal percentages between reactors become more
similar as the C/P and N/P ratios in the influent increase. Finally, when a C:N:P ratio of
45:4:1 was achieved, very similar removal percentages were recorded, at
approximately 90% in all reactors. At this point, the type of carbon source had almost
no influence on the phosphorus removal percentage.
The trend lines in Figure 7.11 show positive slope regression coefficients for all
reactors. From these coefficients, it can be seen that the increase of the removal
percentage was continuous with the increase of the C/P ratio in the influent. These
results contradict research by Liu et al., (1996) which suggested that when the loading
rate COD-SS was high, the biomass could store a large amount of poly-
hydroxyvalerate (PHV), the typical storage substance of GAO microorganisms, and
consequently the EBPR system may decrease the efficiency of phosphorus removal. It
may be significant, however, that the bacterial community in Liu et al. (1996), was
described as an "anaerobic-aerobic activated sludge culture which used a P/TOC ratio
in the influent appropriated for the development of PolyP accumulating bacteria (PAO)”.
Therefore, the decrease in the phosphorus removal efficiency observed by Liu et al.
(1996) might be a response of the EBPR community facing a high COD-SS loading
rate. In the present research, the increase of the C/P ratio in the influent up to 56/1 did
not result in the detriment of the phosphorus removal percentage, not for EBPR
communities (B2 and B4 reactors) nor in glucose communities (S, B1 and B3 reactors).
d. Effects on the phosphorus uptake per mass unit of volatile suspended
solids (mgPtot/gVSS)
Initially, when a C/P ratio of less than 20 was used, the reactors recorded significant
differences in their phosphorus uptake ratios. Subsequently, when a C/P ratio of more
than 35 was used, the S reactors achieved the highest phosphorus uptake ratio, of
approximately 1.47 mgPtot/gVSS. The difference of phosphorus uptake ratios between
reactors was considerable when a C/P ratio of more than 40 was used. The S reactors

123
0,0
0,1
0,2
0,3
0,4
0,5
0,6
3,8 13 35,3 45,7
mgP
tot/
gVSS
C/P ratio
P/VSS - B1 real
-0,1
0,0
0,1
0,2
0,3
0,4
0,5
0,6
8,6 19,3 40,3 47
mgP
tot/
gVSS
C/P ratio
P/VSS B3 real
recorded phosphorus uptake ratios up to three times higher than those observed in the
B reactors. Although remaining different from the S reactors, the phosphorus uptake
ratios obtained in the B1, B2, B3 and B4 reactors became more similar to each other
as the C/P ratio was increased. Thus, when a C/P ratio of more than 45 was reached,
only non-significant differences between phosphorus uptake ratios in the B reactors
were observed (0.44 - 0.53 mgPtot/gVSS).
In more detail, the gradual increase of the C/P and F/M ratios in the influent did not
exert the same influence on the phosphorus uptake capacity in all reactors. Unlike the
results of phosphorus removal percentage, where all reactors showed a constant
increase of the phosphorus removal as the C/P ratio in the influent increased, the
phosphorus uptake ratios did not show a constant increase with an increase of the C/P
ratio in the influent. However, it was possible to differentiate two groups of results. The
first group consisted of the B1 and B3 reactors which recorded a constant increase of
the P uptake ratio according to the increase of the C/P ratio in the influent (Figure
7.12).
The second group of results consisted of the S, B2 and B4 reactors (Figure 7.13),
which recorded an increase in their P uptake ratios when C/P ratios (as BOD5/Ptot)
greater than 20 were achieved in the influent. Subsequently, as the C/P ratio continued
increasing (35.3 for B2, 40 for B4 and 43 for S reactors) a constant decrease in the P
uptake capacity was observed. The results obtained in the B2, B4 and S reactors were
consistent with the results of research by Jenkins (2003). In Jenkins’s research, it was
observed that, during the anaerobic phase in an EBPR system, as the C/P ratio in the
influent increased the acetate uptake ratio decreased, both of which could affect the
phosphorus uptake during the incoming aerobic phase. Thus, Jenkins’s work suggests
(c)
Figure 7.12: Phosphorus uptake per mass unit of Volatile Suspended Solids (mgPtot/gVSS)
against the C/P ratio (BOD5/Ptotal) in the influent for the B1 and B3 reactors.

124
0,0
0,1
0,2
0,3
0,4
0,5
0,6
0,7
0,8
3,8 13 35,3 45,7
mgP
tot/
gVSS
C/P ratio
P/VSS B2 real
that the decrease of the P uptake capacity in the B2 and B4 reactors were to be
expected since both biomasses corresponded to EBPR bacterial communities, which
also include PAO bacteria as the most important bacterial group. For the S reactors,
similar decrease in P uptake capacity was observed although this bacterial community
corresponds to a glucose community which was dominated by the TFO morphotype.
The decrease of the P uptake ratio for the B4 and S reactors was recorded when C/P
ratios of 40.3 and 43 had been achieved, respectively.
The relation between the P uptake ratio and the F/M ratio in mixed liquor showed
similar results (Figure 7.14). For the B2 and B4 reactors, a slight and gradual decrease
of the P uptake ratio was observed as the F/M ratio increased in mixed liquor, and for
the S reactors, a slight decrease of the P uptake ratio was observed when an F/M ratio
of 183 mgBOD5/gVSS was achieved. As mentioned above, Liu et al. (1996) observed
that as the COD-SS ratio increased in mixed liquor, the EBPR performance decreased.
0,0
0,1
0,2
0,3
0,4
0,5
0,6
0,7
0,8
0,9
8,6 19,3 40,3 47
mgP
tot/
gVSS
C/P ratio
P/VSS B4 real
0,0
0,2
0,4
0,6
0,8
1,0
1,2
1,4
1,6
22,1 42,4 43 50 55,5 55,8
mgP
tot/
gVSS
C/P ratio
P/VSS S2 real
Figure 7.13: Phosphorus uptake ratio (mgPtot/gVSS) against the C/P ratio (BOD5/Ptotal) in the
influent for the B2, B4 and S2 reactors.

125
0
10
20
30
40
50
60
70
80
90
100
0
0,5
1
1,5
2
2,5
67,2 69,0 105,7 120,0 156,8
C/P
rat
io &
Pre
m (
%)
mgP
tot/
gVSS
& V
SS (
g/l)
F/M ratio
VSS (g/l) -B2 mgP/gVSS - B2 r
Prem (%) r C/P
0
10
20
30
40
50
60
70
80
90
100
0
0,5
1
1,5
2
2,5
42,8 113,5 149,7 163,2 199,9
C/P
rat
io &
Pre
m (
%)
mgP
tot/
gVSS
& V
SS (
g/l)
F/M ratio
VSS(g/l)-B4 mgP/gVSS - B4 r
Prem (%) r C/P
0
20
40
60
80
100
120
0
0,5
1
1,5
2
2,5
3
3,5
4
4,5
5
57 64 65 67 183 191 239
C/P
rat
io &
Pre
m (
%)
mgP
tot/
gVSS
& V
SS (
g/l)
F/M ratio
VSS(g/l) - S2 P/VSS r
% Removal-S2 C/P
.
Figure 7.14: Phosphorus uptake ratio (mgPtot/gVSS) against the F/M ratio (mgBOD5/gVSS) in
mixed liquor for the S, B2 and B4 reactors.
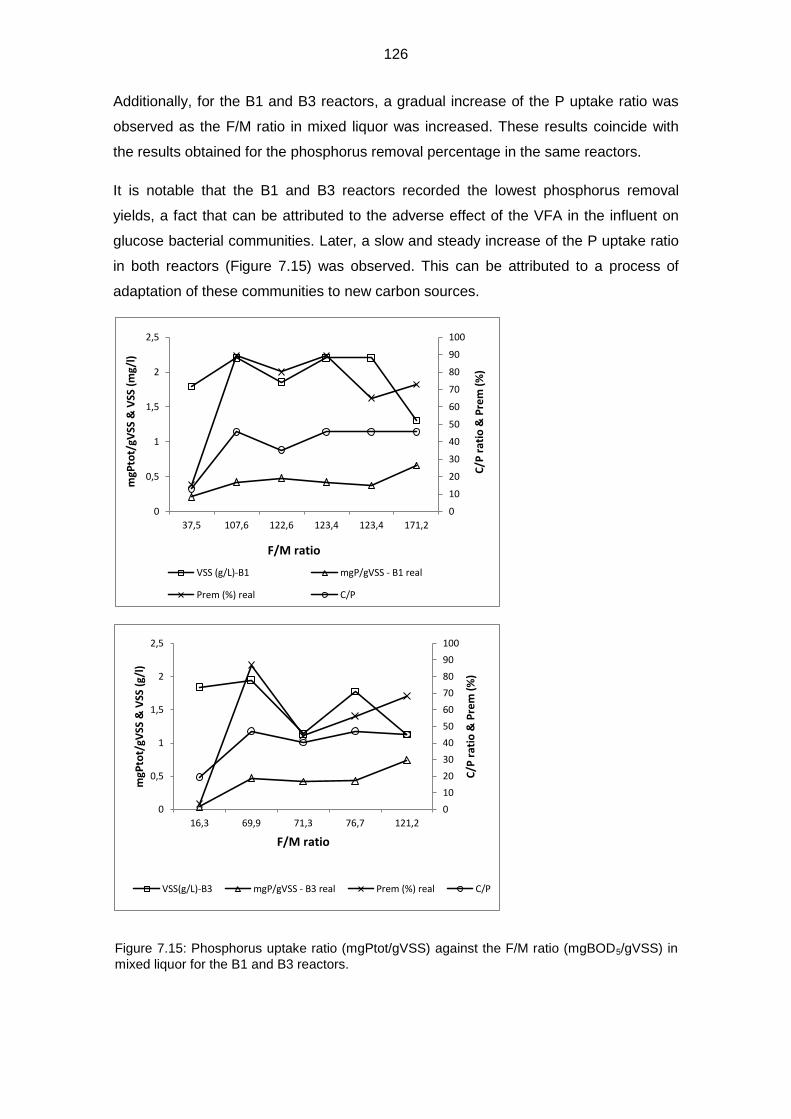
126
0
10
20
30
40
50
60
70
80
90
100
0
0,5
1
1,5
2
2,5
16,3 69,9 71,3 76,7 121,2
C/P
rat
io &
Pre
m (
%)
mgP
tot/
gVSS
& V
SS (
g/l)
F/M ratio
VSS(g/L)-B3 mgP/gVSS - B3 real Prem (%) real C/P
0
10
20
30
40
50
60
70
80
90
100
0
0,5
1
1,5
2
2,5
37,5 107,6 122,6 123,4 123,4 171,2
C/P
rat
io &
Pre
m (
%)
mgP
tot/
gVSS
& V
SS (
mg/
l)
F/M ratio
VSS (g/L)-B1 mgP/gVSS - B1 real
Prem (%) real C/P
Additionally, for the B1 and B3 reactors, a gradual increase of the P uptake ratio was
observed as the F/M ratio in mixed liquor was increased. These results coincide with
the results obtained for the phosphorus removal percentage in the same reactors.
It is notable that the B1 and B3 reactors recorded the lowest phosphorus removal
yields, a fact that can be attributed to the adverse effect of the VFA in the influent on
glucose bacterial communities. Later, a slow and steady increase of the P uptake ratio
in both reactors (Figure 7.15) was observed. This can be attributed to a process of
adaptation of these communities to new carbon sources.
Figure 7.15: Phosphorus uptake ratio (mgPtot/gVSS) against the F/M ratio (mgBOD5/gVSS) in
mixed liquor for the B1 and B3 reactors.

127
As was mentioned above, as the C/P and F/M ratios were increased in the influent and
mixed liquor, respectively, a gradual decrease of the P uptake ratio was observed in
the B2 and B4 reactors. Similar results had already been observed in research by Liu
et al. (2000) and Jenkins (2003). The results of the S reactors showed a similar
behavior, with a decrease of the P uptake ratio as the C/P and F/M ratios were
increased, although the S bacterial community was not a typical EBPR bacterial
community.
Research by Jeon and Park (2000) may explain the good EBPR performance observed
in the S reactors with bacterial communities that did not match a typical EBPR
community. The metabolic pathway proposed by Jeon and Park (2000) suggests that
there may be at least two groups of microorganisms involved in the EBPR process in
reactors fed with glucose as carbon source. The first group of microorganisms would
correspond to the Lactate Accumulating Organisms (LPO), with the following
morphotype: perpendicular cuboidal bacteria of eight coccus-shaped cells. The LPO
microorganisms would be able to assimilate glucose during the anaerobic phase and
rapidly accumulate glycogen. The energy required for this process would be obtained
by glycolysis, so that, the glucose would be transformed in lactate. Since the energy
requirement would be met by glycolisis, the stored polyphosphate would not be used.
Subsequently, the LPO would convert the stored glycogen into polymer storage and
PHA. The second group of microorganisms would correspond to the PAO group, which
would be able to uptake the lactate produced by the LPO and subsequently to
transform it into PHA, meeting the energy demand of this process through the
degradation of the stored polyphosphate and, therefore, releasing phosphate during
the anaerobic phase. It is notable that the phosphorus release during the anaerobic
phase in reactors fed with glucose seems not to correspond to the glucose consumed
(Jeon and Park 2000; Hollender et al., 2002) and that the amount of phosphorus
released is considerably less than the amount of phosphorus released during a typical
EBPR process.
The release of phosphorus observed here during the anaerobic phase of the S
(Glucose community), and B2 and B4 (EBPR community) reactors is shown in Figure
7.16. It is noticeable that the amount of phosphorus released in the B2 and B4 reactors
is almost double of the amount released in the S reactors.
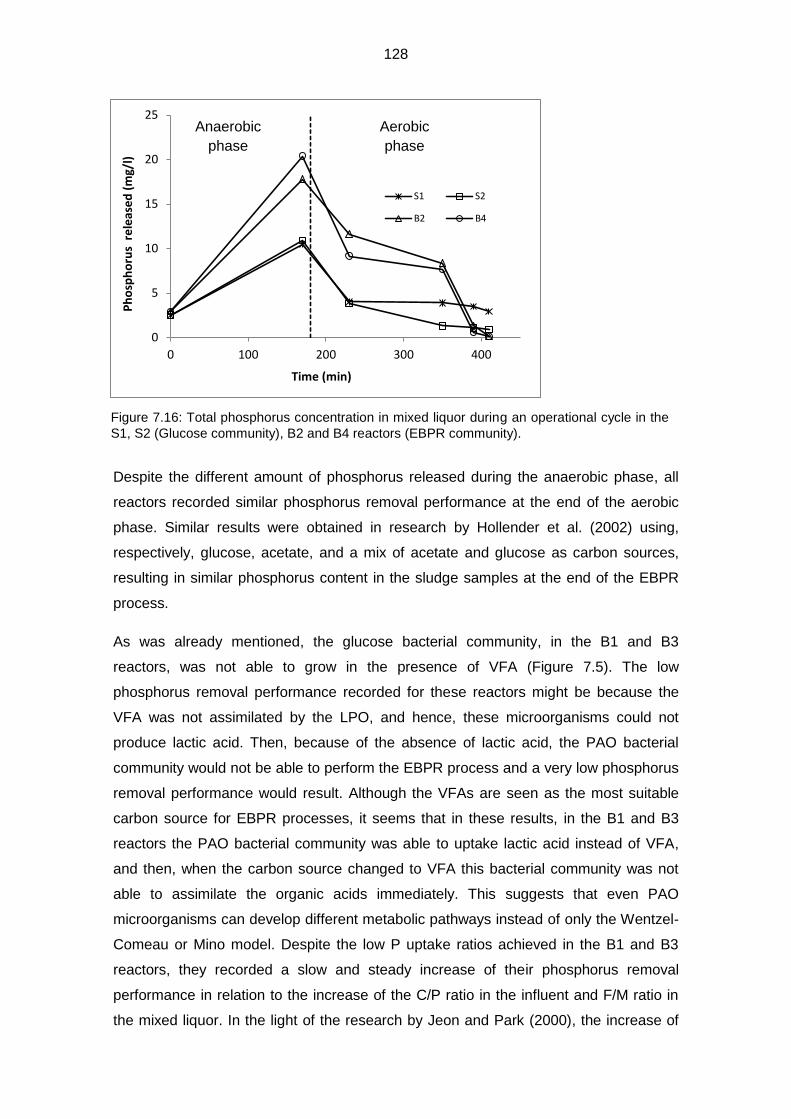
128
0
5
10
15
20
25
0 100 200 300 400
Ph
osp
ho
rus
re
leas
ed
(m
g/l)
Time (min)
S1 S2
B2 B4
Despite the different amount of phosphorus released during the anaerobic phase, all
reactors recorded similar phosphorus removal performance at the end of the aerobic
phase. Similar results were obtained in research by Hollender et al. (2002) using,
respectively, glucose, acetate, and a mix of acetate and glucose as carbon sources,
resulting in similar phosphorus content in the sludge samples at the end of the EBPR
process.
As was already mentioned, the glucose bacterial community, in the B1 and B3
reactors, was not able to grow in the presence of VFA (Figure 7.5). The low
phosphorus removal performance recorded for these reactors might be because the
VFA was not assimilated by the LPO, and hence, these microorganisms could not
produce lactic acid. Then, because of the absence of lactic acid, the PAO bacterial
community would not be able to perform the EBPR process and a very low phosphorus
removal performance would result. Although the VFAs are seen as the most suitable
carbon source for EBPR processes, it seems that in these results, in the B1 and B3
reactors the PAO bacterial community was able to uptake lactic acid instead of VFA,
and then, when the carbon source changed to VFA this bacterial community was not
able to assimilate the organic acids immediately. This suggests that even PAO
microorganisms can develop different metabolic pathways instead of only the Wentzel-
Comeau or Mino model. Despite the low P uptake ratios achieved in the B1 and B3
reactors, they recorded a slow and steady increase of their phosphorus removal
performance in relation to the increase of the C/P ratio in the influent and F/M ratio in
the mixed liquor. In the light of the research by Jeon and Park (2000), the increase of
Anaerobic
phase
Aerobic
phase
Figure 7.16: Total phosphorus concentration in mixed liquor during an operational cycle in the
S1, S2 (Glucose community), B2 and B4 reactors (EBPR community).

129
the phosphorus removal performance observed in the B1 and B3 reactors could be
because of an adaptation process to a new carbon source (VFA) by a bacterial
community (PAO) that was already adapted to uptake lactic acid as a carbon source.
Finally, other processes besides the EBPR may contribute to the observed phosphorus
removal performance. Among these processes, the adsorption capacity of each
bacterial community should be mentioned.
In research by Jenkins (2003), as the availability of COD in the influent increased, an
increase in the concentration of carbohydrates to exocellular level was also observed;
this effect may increase the adsorption capacity of these bacterial communities. The
research results concerning the phosphorus adsorption capacity of the present
bacterial communities is presented below (Chapter 8).

130
7.4 Conclusions
In summary, different types of wastewater were elaborated, varying in the carbon
source and the C:N:P ratios used. The effects of these variations on the phosphorus
removal percentage and on the phosphorus uptake ratio (mgPtot/gVSS) of different
bacterial communities were assessed.
The results are presented in two big groups. The first group of results was obtained
using three different C:N:P ratios chosen as adverse, medium and optimal for the
EBPR process. The objective was to compare, within a specific C:N:P ratio, the
difference of the phosphorus removal performance for the different carbon sources
used and for different bacterial communities. The second group of results was obtained
using different C/P and N/P ratios in the influent, maintaining optimal and constant
conditions for other operational parameters that were identified as relevant for the
EBPR process. The effects of the variations of the C/P and N/P ratios on the
phosphorus removal performance were evaluated during the experimental process.
The conclusions are presented below:
1. Good EBPR performance is obtained with the glucose (TFO) and the EBPR bacterial
communities when glucose and VFA are used as carbon sources, respectively.
It is possible to obtain good EBPR performance with different bacterial communities.
2. It is possible to obtain good EBPR performance in reactors fed with glucose as the
sole carbon source, but the C/P ratio (BOD5/Ptot) in the influent must be equal to or
greater than 20.
3. The glucose bacterial community (TFO) obtained using glucose as carbon source
recorded the lowest EBPR performance during the experimental process when
supplied as a new carbon source to VFAs.
The VFAs are not suitable as a carbon source for the EBPR process in bacterial
communities dominated by the TFO morphotype.
4. When the glucose bacterial community (B1 and B3 reactors) received VFA as a
carbon source; initially, the results of phosphorus uptake and growth of biomass were
the lowest observed during this research. Subsequently, a slow increase of their P
uptake ratios was observed.
The glucose bacterial community can slowly adapt its metabolic pathways to use other
carbon sources instead of glucose.

131
5. The EBPR bacterial community is able to perform efficient EBPR processes when
supplied with appropriate concentrations of VFA. In this research, VFA concentrations
greater than, approximately, 54 mg/l in the influent resulted in a decrease in the
phosphorus uptake capacity.
6. In this research, N/P ratios in the influent of less than two impaired the phosphorus
removal performance. This result agrees with the metabolic model proposed by
Smolders et al. (1994) which explains the risk of nitrogen shortages during the aerobic
phase.
N/P ratios (Total nitrogen/ Total phosphorus) of less than 2 in the influent can adversely
affect the EBPR performance during the aerobic phase.
7. The benefit of using VFA as a carbon source in EBPR processes was evident when
the C:N:P ratio in the influent was adverse, that is, when the system faced carbon
shortages. Thereafter, when the C:N:P ratios became more appropriate for the EBPR
process, the phosphorus removal percentage became similar across the reactors,
regardless of the carbon source used as substrate. Likewise, the phosphorus uptake
ratios in reactors fed with VFA became more similar as the C:N:P ratio in the influent
was more appropriate for the EBPR process.
As the C:N:P ratio in the influent became more suitable for the EBPR process, the
phosphorus removal performance between reactors became more similar regardless of
the carbon source used.
8. When a C/P ratio of more than 40 was used in the influent, the amount of
phosphorus released during the anaerobic phase was not directly related to the
phosphorus removal performance in the EBPR processes, since the difference of the
amount of phosphorus released between reactors were considerable but their
phosphorus removal percentages were quite similar.

132
7.5 References
Abu-gharah, Z.H., and Randall, C.W. (1991) The effect of organic compounds on
biological phosphorus removal. Water Science and Technology. 23: 585-594.
Blackall, L.L., Crocetti, G., Saunders, A.M., and Bond, P.L. (2002) A review and update
of the microbiology of enhanced biological phosphorus removal in wastewater
treatment plants. Anton. Leeuw. 81 (1–4): 681–691.
Carucci, A., Lindrea, K., Majone, M., and Ramadori, R. (1994) Dynamics of the
anaerobic utilization of organic substrates in an anaerobic/aerobic sequencing
batch reactor. Water Science and Technology 31(2): 35–43.
Carucci, A., Majone, M., Ramadori, R., and Rossetti, S. (1994) Dynamics of
phosphorus and organic substrates in anaerobic and aerobic phases of a
sequencing batch reactor. Water Science and Technology 30: 237-246.
Cech, J.S., and Hartman, P. (1990) Glucose induced break down of enhanced
biological phosphate removal. Environmental Technology 11: 651–656.
Cech, J.S., and Hartman, P. (1993) Competition between polyphosphate and
polysaccharide accumulating bacteria in enhanced biological phosphate
removal systems. Water Research 27: 1219-1225.
Chuang, S.H., Ouyang, C.F., Yuang, H.C., and You, S.J. (1998) Phosphorus and
polyhydroxyalkanoates variation in a combined process with activated sludge
and biofilm. Water Science and Technology 37(4 – 5):593– 597.
Comeau, Y., Hall, K.J., Hancock, R.E.W., and Oldham, W.K. (1986) Biochemical-model
for enhanced biological phosphorus removal. Water Research 20: 1511-1521.
Deutsches Institut für Normung. (1985). DIN 38414-S2 Bestimmung des
Wassergehaltes und des Trockenrückstandes. Deutsche Einheitsverfahren zur
Wasser-, Abwasser- und Schlammuntersuchung. Deutschland.
Deutsches Institut für Normung. (1987). DIN 38409-H51 Bestimmung des
Biochemischen Sauerstoffbedarfs in n Tagen nach dem Verdünnungsprinzip
(Verdünnungs-BSBn). Deutsche Einheitsverfahren zur Wasser-, Abwasser- und
Sclammuntersuchung. Deutschland.
Deutsches Institut für Normung. (2004). DIN EN ISO 6878 Wasserbeschaffenheit
Bestimmung von Phosphor - Photometrisches Verfahren mittels
Ammoniummolybdat (ISO 6878:2004). Deutsche Einheitsverfahren zur Wasser-
, Abwasser- und Sclammuntersuchung. Deutschland.
Deutsches Institut für Normung. (2004). DIN EN ISO 5667-3:2003 Teil 3: Anleitung zur
Konservierung und Handhabung von Wasserproben. Wasserbeschaffenheit
Probenahme. Deutschland.
Deutsches Institut für Normung. (n.d.). DIN 38409-H52. Deutsche Einheitsverfahren
zur Wasser-, Abwasser- und Sclammuntersuchung.

133
Hartley, K.J., and Sickerdick, L. (1994) Performance of Australian BNR plants. In:
Second Australian Conference on Biological Nutrient Removal, 4–6 October,
Albury, Victoria, pp. 65–73.
Hollender, J., van der Krol, D., Kornberger, L., Gierden, E., and Dott, W. (2002) Effect
of different carbon sources on the enhanced biological phosphorus removal in a
sequencing batch reactor. World Journal of Microbiology and Biotechnology 18:
355-360.
Hood, C., and Randall, A.A. (2001) A biochemical hypothesis explaining the response
of enhanced biological phosphorus removal biomass to organic substrates.
Water Research 35(11):2758–2766.
Jenkins, D.I. (2003) Use of enhanced biological phosphorus removal for treating
nutrient-deficient wastewater. Water Environment Research Foundation.
London: IWA Publishing.
Jeon, C.O., Lee, D.S., and Park, J.M. (2000) Morphological characteristics of microbial
sludge performing enhanced biological phosphorus removal in a sequencing
batch reactor fed with glucose as sole carbon source. Water Science and
Technology 41(12): 79-84.
Liu, W.T., Mino, T., Matsuo, T., and Nakamura, K. 81996) Biological phosphorus
removal process—effect of pH on anaerobic substrate metabolism. Water
Science and Technology 34(1– 2):25– 32.
Liu, Y., Xue, G., Yu, S., and Zhao, F. (2006) Role of extracellular exopolymers on
biological phosphorus removal. Journal of Environmental Science 18(4): 670-
674.
López-Vázquez, C.M., Oehmen, A., Hooijmans, C.M, Brdjanovic, D., Gijzen, H.J.,
Yuan, Z., and van Loosdrecht, M.C.M. (2009) Modeling the PAO-GAO
competition: Effects of carbon source, pH and temperature. Water Research 43:
550-562.
Lu, H.B., Oehmen, A., Virdis, B., Keller, J., and Yuan, Z.G. (2006) Obtaining highly
enriched cultures of Candidatus “Accumulibacter phosphatis” through
alternating carbon sources. Water research 40: 3838 – 3848.
Metcalf and Eddy, Inc. (1995) Ingeniería de Aguas Residuales. Tratamiento, vertido y
reutilización. Ed. Mc Graw Hill Interamericana de España S.A., Madrid.
Mino, T., Arun, V., Tsuzuki, Y., and Matsuo, T. (1987) Effect of phosphorus
accumulation on acetate metabolism in the biological phosphorus removal
process. In: Ramadori, R. (Ed.), Biological Phosphate Removal from
Wastewaters. Pergamon Press, Oxford, pp. 27–38.

134
Mino, T., van Loosdrecht, M.C.M., and Heijnen, J.J. (1998) Microbiology and
biochemistry of the enhanced biological phosphate removal process. Water
Research 32(11):3193– 3207.
Mulkerrins, D., Dobson, A.D.W., and Colleran, E. (2004) Parameters affecting
biological phosphate removal from wastewaters. Environment International, 30,
249-260.
Pijuan, M. (2004) Effect of different carbon sources and continuous aerobic conditions
on the EBPR process. (Doctoral thesis). Universitat Autònoma de Barcelona.
Spain.
Pitman, A.R. (1999) Management of biological nutrient removal plant sludges - change
the paradigms? Water Research 33(5):1141– 1146.
Puig Broch, S. (2008) Operation and control of SBR processes for enhanced biological
nutrient removal from wastewater. (Doctoral thesis). University of Girona. Spain.
Puig, S., Corominas, L.l., Balaguer, M.D., and Colprim, J. (2007) Biological nutrient
removal by applying SBR technology in small wastewater treatment plants:
Carbon source and C/N/P ratio effects. Water Science and Technology
55(7):135.
Randall, A.A. and Liu, Y.-H. (2002) Polyhydroxyalkanoates form potentially a key
aspect of aerobic phosphorus uptake in enhanced biological phosphorus
removal. Water Research 36: 3473-3478.
Randall, C.W., and Chapin, R.W. (1997) Acetic acid inhibition of biological phosphorus
removal. Water Environment Research 69(5):955–960.
Randall, C.W., Barnard, J.L., and Stensel, H.D. (1992) Design and retrofit of
wastewater treatment plants for biological nutrient removal. Lancaster:
Technomic Publishing; pp. 25–78.
Rustrian, E., Delgenes, J.P., and Moletta, R. (1996) Effect of the volatile fatty acids on
phosphate uptake parameters by pure cultures of Acinetobacter sp. Letters in
Applied Microbiology 23(4):245–248.
Satoh, H., Ramey, W.D., Koch, F.A., Oldham, W.K., Mino, T., and Matsuo, T. (1996)
Anaerobic substrate uptake by the enhanced biological phosphorus removal
activated sludge treating real sewage. Water Science and Technology 34 (1–2):
9–16.
Seviour, R., and Nielsen, P.H. (2010) Microbial Ecology of Activated Sludge. London,
UK: IWA Publishing.
Smolders, G.J.F., van der Meij, J., van Loosdrecht, M.C.M., and Heijnen, J.J. (1994)
Stoichiometric model of the aerobic metabolism of the biological phosphorus
removal process. Biotechnology and Bioengineering 44: 837-848.

135
Strom, P.F. (2006) Technologies to remove phosphorus from wastewater. Rutgers
University, USA. Available online:
http://www.water.rutgers.edu/Projects/trading/p-trt-lit-rev-2a.pdf.
Tchobanoglous, G., Burton, F.L., and Stensel, H.D. (2003) Wastewater Engineering:
treatment and Reuse. New York, USA: Metcalf and Eddy Inc., McGraw-Hill
science Engineering.
Tracy, K.D., and Flammino, A. (1987). Biochemistry and energetics of biological
phosphorus removal. Advances in Water Pollution Control 4: Biological
Phosphate Removal from Wastewaters, R. Ramadori (ed.). pp. 15–26
Pergamon Press, Oxford, England.
van Loosdrecht, M.C.M., Hooijmans, C.M., Brdjanovic, D., and Heijnen, J.J. (1997)
Biological phosphate removal processes. Applied Microbiology and
Biotechnology 48 (3): 289–296.
Wang, N., Peng, J., and Hill, G. (2002) Biochemical model of glucose induced
enhanced biological phosphorus removal under anaerobic condition. Water
Research 36: 49-58.
Wentzel, M.C., Lötter, L.H., Loewenthal, R.E., and Marais, G.V.R. (1986) Metabolic
behavior of Acinetobacter spp. in enhanced biological phosphorus removal – a
biochemical model. Water SA 12: 209-224.
Winkler, M. Practice report laboratory & process analysis wastewater treatment
nutrients. Hach Lange gmbh. Available online: http://www.hach-
lange.ma/countrysites/action_q/download%3Bdocument/DOK_ID/14786173/typ
e/pdf/lkz/MA/spkz/fr/TOKEN/QhpwM1kXz7S5QLlDEs7XbNC7-Nk/M/-XQ3zg.
Yu, X., Qi, Z., Zhang, X., Yu, P., Liu, B., Zhang, L., and Fu, L. (2007) Nitrogen loss and
oxygen paradox in full-scale biofiltration for drinking water treatment. Water
Research 41: 1455–1464.

136
CHAPTER 8: Assessment of the desorption and adsorption capacity of phosphorus in activated sludge samples
8.1 Introduction
The activated sludge system, with its specific configuration EBPR (Enhanced Biological
Phosphorus Removal), is among the most efficient technologies for phosphorus
removal from wastewater. However, this technology has been shown to be unstable
(Hartley & Sickerdick 1994), which is why, generally, WWTPs have a complementary
system which additionally achieves phosphorus removal by chemical precipitation
(Blackall et al., 2002). Apparently, the stability of the EBPR process is strongly related
to the composition of the influent wastewater, i.e. to obtain an efficient and stable
EBPR performance it is necessary that the influent wastewater have appropriate
C:N:P ratios and that these ratios be stable over time (Brdjanovic et al., 1998; Carucci
et al., 1999).
Otherwise, research has suggested that phosphorus removal in EBPR systems is not
only the result of metabolic processes but also occurs through adsorption processes
(Cloete and Oosthuizen, 2001; Liu et al., 2006). Research by Cloete and Oosthuizen,
(2001) using SEM/EDX technology, determined that, out of the total phosphorus
content in the sludge biomass, between 27% and 30% would be located in the
exopolymers (EPS).
The present research considered it of interest to evaluate the phosphorus sorption
capacity of different activated sludge samples and simultaneously to evaluate the
possibility of improving this capacity.
With regard to the phosphorus sorption capacities of different substrates, research by
Wang and Li (2010) on the phosphorus sorption capacity of different sediments
recorded the highest performance in estuarine sediments. Different physicochemical
possibilities that might be responsible for this phosphorus sorption capacity were taken
into account, including phosphorus precipitation because of the presence of metallic
salts or lime in the aqueous phase. However, the concentration of iron and aluminium
in the estuarine sediments were among the lowest in comparison to the other
sediments evaluated.
In the present research, in order to explain the higher phosphorus sorption capacity
recorded in estuarine sediments, the constant ion exchange process that the estuarine
sediments would face during tidal changes is considered.

137
The ion exchange process that takes place in an estuary may be summarized as
follows. During the low tide phase, the estuarine sediment is immersed in a freshwater
environment where the principal dissolved ion is calcium bicarbonate, but most of the
sediment free valences are compensated with calcium and, in a lower proportion, with
magnesium. Then, during the flood-tide phase, the sodium ion in the incurrent
seawater replaces the calcium ion in the sediment, with each calcium ion released to
the aqueous phase being replaced by two sodium ions. Finally, the principal ion in the
aqueous phase will be calcium chloride (Grupo de investigación de recursos hídricos –
IUPA, 2009).
Additionally, research by Keiding and Nielsen (1997), and Muller (2006) mentioned the
role of calcium ion in the structure of the sediments. These investigations suggested
that the loss of calcium ion may destabilize the structure of the sediment. For estuarine
sediments, the loss of calcium observed during the flood-tide phase may destabilize
the sediment resulting in the desorption of organic molecules. Subsequently, during the
next low tide phase a direct ion exchange process would be observed between the
calcium ion dissolved in the incurrent freshwater and the sodium ions adsorbed in the
sediment, with each calcium ion replacing two sodium ions, that would be released to
the aqueous phase. Finally, the free valences of the sediment would be compensated
again by calcium ions.
The present research aimed to apply the same ion exchange process, described for
estuarine sediments, in activated sludge samples. With this purpose three different
aqueous phases (solutions) are used: an eluent solution used during the desorption
phase, a stabilization solution and finally a solution with a specific phosphorus
concentration used during the sorption process.
At the end of the desorption-stabilization-sorption process, the phosphorus
sequestration capacity of the activated sludge samples is evaluated, comparing the
total phosphorus concentration in the sludge samples before and after the experimental
process.

138
8.2 Material and methods
The following procedure was performed in order to evaluate the capacity of adsorption
and desorption of phosphorus in the activated sludge samples.
8.2.1 Sludge sampling
The activated sludge samples were taken from the S1, S2, B2 and B4 reactors.
Additional activated sludge samples were collected from the Uelzen, Steinhorst and
Lüneburg WWTPs. Table 8.1 shows some characteristics of the sludge samples at the
time of sampling.
Table 8.1: Characteristics of the activated sludge samples at the time of sampling.
Sludge source
Reactor phase
TSS (mg/l)
EBPR activity
VFA/Metalic salt
C:N:P in influent
wastewater
Total Phosphorus in effluent
(mg/l)
S1
Anaerobic 3.8 - 7.8 - - /- 42:4.2:1 0.5
S2
Anaerobic 4.0 - 7.6 - -/- 42:4.2:1 0.32
B2
Anaerobic 3 - 3.2 + +/- 48:7.5:1 0.5
B4
Anaerobic 2.6 - 3.0 + +/- 49:9.5:1 0.2
Uelzen
UA
Aeration 4.2 - -/+ ---- -----
UF
Sludge thickener
24.1 - -/+ ----- -----
Steinhorst
BS
Aeration 3.8 - -/- 24:6.5:1 14.3
RS
Sludge disposal line
8.1 - -/- 24:6.5:1 -----
Lüneburg
-----
BS
Aeration 3.8 + -/+ -----
RS
Return sludge
7.8 + -/+ ----- -----
The sludge samples had to meet certain characteristics before the experimental
process could be started. These characteristics were important indicators of the

139
phosphorus sorption capacity, which showed it was possible to discard other
physicochemical and biological processes as responsible for the phosphorus removal.
Among these characteristics, the reactor or reactor phase that the sludge sample came
from provided information about the polyphosphate intracellular storage, when the
sludge sample corresponded to an EBPR community.
The TSS concentration in the sludge sample showed the available amount of
substrate.
The WWTPs reports about EBPR activity were confirmed in the laboratory using
microscopic observation and staining techniques. The microscopic assessment served
also to roughly characterize the morphotypes in each bacterial community.
The WWTPs reports about the addition of metallic salts to the phosphorus removal
process were used to either approve or discard the application of the desorption-
stabilization-sorption process in the sludge samples. The experimental process was
approved, if, upon confirming the use of metallic salts, these did not present a
concentration greater than 0.1 mg/l. This limit on the metallic salts concentration was
calculated considering that to remove 1 g of phosphorus, it is necessary to employ 9.6
g of aluminium sulfate as Al2(SO
4)3.14H
2O or 5.2 g of ferric chloride as FeCl3 (WERF-
Tertiary Phosphorus Removal).
The reports of the C:N:P ratio in the influent and the phosphorus concentration in the
effluent served as indicators of the efficiency of the phosphorus removal process.
8.2.2 Pre-stabilization of the activated sludge samples using solutions of CaCl2 and MgCl2
It is important to mention that the sludge samples were evaluated in different sessions.
For each sludge sample tested, before starting the desorption-stabilization-sorption
process, the following samples were taken:
Total phosphorus content in mixed liquor (mg/l)
Total phosphorus content in supernatant (mg/l)
Total phosphorus content in settled sludge (mg/l)
Subsequently, each sludge sample was distributed into glass beakers with a capacity
of one liter (reactors) in duplicate and for each eluent evaluated. The number of
reactors used per eluent is shown below (Table 8.2).

140
Table 8.2: Distribution of the sludge samples and the number of reactors used per eluent.
Eluents
Sludge sample
Control Citric acid
Sulphuric acid
Hydrochloric acid
Potassium chloride
S1 2 2 2 2 2
S2 2 2 2 2 2
B2 2 2 - - 2
B4 2 2 - - 2
Uelzen 2 2 - - 2
UA 2 2 - - 2
UF 2 2 - - 2
Steinhorst 2 2 - - 2
BS 2 2 - - 2
BR 2 2 - - 2
Lüneburg 2 2 - - 2
BS 2 2 - - 2
BR 2 2 - - 2
The sludge samples were allowed to precipitate for 45 minutes. The volumes of the
precipitated sludge samples were recorded and the supernatants were decanted. The
settled sludge samples were stabilized with a solution of CaCl2 (5 mg/l) and MgCl2 (10
mg/l) in deionized water. This solution was added to the settled sludge until a volume of
800 ml was reached.
8.2.3 Desorption process
The desorption-stabilization-sorption process was performed for the S1 and S2 sludge
samples, using the four eluents mentioned. Samples of each of the three acid eluents
were used with pHs of desorption of 2, 3, 4 and 5 in the case of acid eluents and with
potassium chloride concentrations of 20, 30, 40 and 50 mmol/l in mixed liquor. As
aforementioned, the stabilization process was performed using a solution of CaCl2 and
MgCl2 in concentrations of 5 mg/l and 10 mg/l, respectively. On the basis of the results
obtained with the S1 and S2 sludge samples regarding desorption performance,
survival of bacterial communities (Chapter 9), and sorption performance, it was decided

141
to perform the desorption-stabilization-sorption process for the remaining sludge
samples. Some characteristics of the eluents used are shown in Table 8.3.
Table 8.3: Characteristics of the eluents used in the desorption process.
Eluent Concentration Function
Citric acid 1 molar Organic acid (weak acid)
Sulphuric acid 1 molar Mineral acid (strong
acid) Hydrochloric acid 1 molar
Potassium chloride 1 molar Ion exchanger
The desorption process started with a pH of 2. The volumes of acid eluents used were
recorded. For potassium chloride, in the first test a volume of KCl (1 M) was added until
a concentration of 20 mmol/l in mixed liquor was reached. Control reactors maintained
their own supernatant and no eluents were added.
The beakers were stirred at 60 rpm and maintained at room temperature (18 - 22°C).
Mixed liquor samples of approximately 15 ml were taken at the end of the 1st, 3rd, 6th
and 24th hours of the desorption process. Each sample was filtered in folding filters
(Macherey-Nagel MN 615) and the filtrate was deposited in polyethylene bottles and
stored at -20°C until analysis.
Upon completion of the desorption process, the sludge samples were allowed to settle
for 45 minutes and the supernatants were decanted. The volumes of the precipitated
sludge samples were recorded and samples of the precipitated were also taken.
8.2.4 Stabilization of the activated sludge samples using a solution of CaCl2 and MgCl2
Subsequently, the settled sludge samples were resuspended in a solution of CaCl2 (5
mg/l) and MgCl2 (10 mg/l) reaching a volume of one liter.
Each reactor was stirred at 60 rpm for 15 minutes at room temperature (18 - 22°C).
The sludge samples were allowed to settle for 45 minutes, then samples of supernatant
were taken and filtered in folding filters and the filtrates were deposited in polyethylene
bottles and stored at -20°C until analysis. Finally, the remaining supernatants were
decanted.

142
8.2.5 Sorption process
This experimental phase sought to determine the sorption capacity of phosphorus
(adsorbate) of a substrate (adsorbent). The sludge samples previously stabilized were
used as adsorbent and a specific concentration of phosphorus diluted in synthetic
wastewater was used as adsorbate.
The C:N:P ratio in the influent synthetic wastewater was not the most suitable for
EBPR processes (Yu et al., 2007). The total phosphorus concentration (7.5 mg/l) was
within the middle range for domestic wastewater, according to Metcalf and Eddy
(1995).
Table 8.4: C:N:P ratio in the influent synthetic wastewater.
Test solution
CSB (mg/l)
BSB5
(mg/l)
Total nitrogen (mg/l)
Total phosphorus
(mg/l) C:N:P
WWp 375 156 31 7.5 20.8:4.2:1
The volume of settled sludge in each reactor (adsorbent) accounted for 67% of the total
sorption volume; thus, the synthetic wastewater accounted for the remaining 33% of
this volume. Each beaker was stirred at 60 rpm and maintained at room temperature
(18°C - 22°C). Mixed liquor samples of approximately 15 ml were taken at the end of
the 15th, 30th and 45th minutes and at the end of the 24th hour of the sorption
process. Each sample was filtered using folding filters (Macherey-Nagel MN 615) and
the filtrate was deposited in polyethylene bottles and stored at -20°C until analysis.
At the end of the sorption process, two samples of mixed liquor (20 ml) were taken: one
of them was stored at -20°C to assess the total phosphorus concentration and the
second was stored at 4°C for 24 hours to analyze bacterial survival rates. Finally, a
mixed liquor sample of about 100 ml was taken and immediately analyzed to assess
the TSS and VSS concentrations.

143
Mixed
liquor
Mixed
liquor
Control
Stir at 60 rpm
Eluents: Citric acid (1M), H2SO4 (1M), HCl (1M), KCl (1M)
No
elu
en
ts Mixed
liquor
Test
Eluent addition
Pre
serv
e n
atu
ral
su
pe
rna
tant
Sludge
sample
(1l)
Settling 45 min
and decanting
Sludge
sample
settled
Test
Sludge
sample
settled
Control
Addition of CaCl2
(5mg/l) & MgCl2
(10 mg/l) solution
Sampling of 15 ml mixed liquor each time and preserved at
-20°C
Sampling Chronogramm
1h 3h 6h 24h
Mixed liquor
x x x x
Settled sludge
- - - x
Settling and decanting
To post-stabilization
Figure 8.1: Flowchart of the first stabilization and desorption processes.

144
Mixed
liquor
Vol = 2X
ml
Addition of CaCl2 (5mg/l) &
MgCl2 (10 mg/l) solution up
to 1l of volume
Stir at 60 rpm x 15 min Second
stabilization
Mixed
liquor
Vol = 2X
ml
Settling and decanting
Sampling of 15 ml mixed liquor, filtered
and preserved at -20°C
Mixed
liquor
Vol = 2X
ml
Addition of X ml synthetic
wastewater.
pH stabilization -
pH=7 using NaOH
(1M) or HCl (1M).
Stir at 60 rpm
Mixed
liquor
Vol = 3X
ml
Sampling Chronogramm
15 min
30 min
45 min
24h
Mixed liquor X X X X
Settled sludge - - - X
TSS - - - X
Microbiology test
- - - X
Sampling of 20 ml mixed liquor,
filtered and stored at -20°C
Sampling of 20 ml mixed liquor to assess total
phosphorus content and bacterial survival
Sampling of 100 ml mixed liquor to assess
TSS and VSS
Figure 8.2: Flowchart of the second stabilization and adsorption process.

145
8.3 Results and discussion – Desorption process
Initially, the desorption-stabilization-sorption processes were performed with the S1
and S2 sludge samples using the eluents citric acid (1M), sulphuric acid (1M) and
hydrochloric acid (1M) with reaction pHs between 2 and 5. Likewise, potassium
chloride (1M) was used as eluent with concentrations ranging between 20 and 50
mmol/l in mixed liquor.
The results of the S1 and S2 sludge samples were used to determine the most
appropiate eluents and pH values to obtain good phosphorus desorption performances,
considerable bacterial survival rates, and good phosphorus sorption performances.
Table 8.2 shows the sludge samples used and the pHs and concentrations of the
eluents in each case. The choice of the eluents was based on previous investigations
such as research by Ye et al. (2011) where citric acid was identified as the best eluent
for copper in granular activated sludge. The capacity of citric acid to weaken specific
and electric adsorption was also noted by Ye et al. (2011). In the same research,
sulphuric acid was recorded as the second best eluent in terms of desorption
efficiency. Research by Kuczajowska-Zadrozna et al. (2004) on cadmium desorption
processes in activated sludge recorded that the eluents HCl (1M) and H2SO4 (1M)
showed the same desorption efficiency. Finally, research by Wang and Li (2010) using
KCl (1M) as the eluent in desorption processes on sediments of different origins
recorded a low desorption capacity for phosphorus in comparison to the results
obtained using acid eluents in the other research just mentioned.
8.3.1 Phosphorus desorption percentage vs reaction time
The results of the desorption processes for the S1 and S2 sludge samples at a pH of 2
are shown in Figure 8.3. Basic characteristics of the TSS concentration in mixed liquor,
phosphorus content per sludge mass unit before desorption process, and the eluent
concentration used in each reactor, are shown in Table 8.5.

146
0
10
20
30
40
50
0 5 10 15 20 25
De
sorp
tio
n (
%)
Reaction time (hours)
S1-Cit
S1-SO
S1-HCl
S1-KCl
S1- Kontrol
0
10
20
30
40
50
60
0 5 10 15 20 25
De
sorp
tio
n (
%)
Reaction time (hours)
S2-Cit
S2-SO
S2-HCl
S2-KCl
S2-Kontrol
Table 8.5: Characteristics of the S1 and S2 sludge samples, and concentrations of the eluents
used to reach a pH of 2 or KCl concentration of 20 mmol/l during the desorption process.
As shown in Figure 8.3, the phosphorus release into the supernatant was recorded
from the first hour of the desorption process for all reactors. The percentages of
phosphorus release varied between 22 % (7.6 mg/l) recorded in the S1-HCl reactor at
the end of the first hour, and 47.2 % (16.3 mg/l) recorded in the S1-SO reactor at the
overall end of the reaction time (24 hours). Likewise, for the S2 sludge sample, the
percentage of phosphorus release varied between 27.5 % (24.2 mg/l) recorded in the
S2-HCl reactor at the end of the first hour and 55.5 % (48.9 mg/l) recorded in the S2-
SO reactor at the overall end of the reaction time.
The desorption equilibrium was not reached in any of the S1 reactors but it was
observed in the S2 reactors at the end of the sixth hour of the desorption process.
Significant differences in desorption performance between reactors was not observed.
For both sludge samples, the highest percentages of phosphorus desorption were
achieved using sulphuric acid as the eluent.
Eluent concentration
Reactor
TSS Ptot initial Ptot/TSS Citric Ac. H2SO4 HCl KCl
(g/l) (mg/l) (mg/g) (mmol/l) (mmol/l) (mmol/l) (mmol/l)
S1 13.4 120.8 9 300 9.5 6.5 20
S2 16.4 264.2 16.1 250 7 8 20
a b
Figure 8.3: Phosphorus desorption percentages at a pH of 2 for the S1 (a) and S2 (b) sludge
samples.
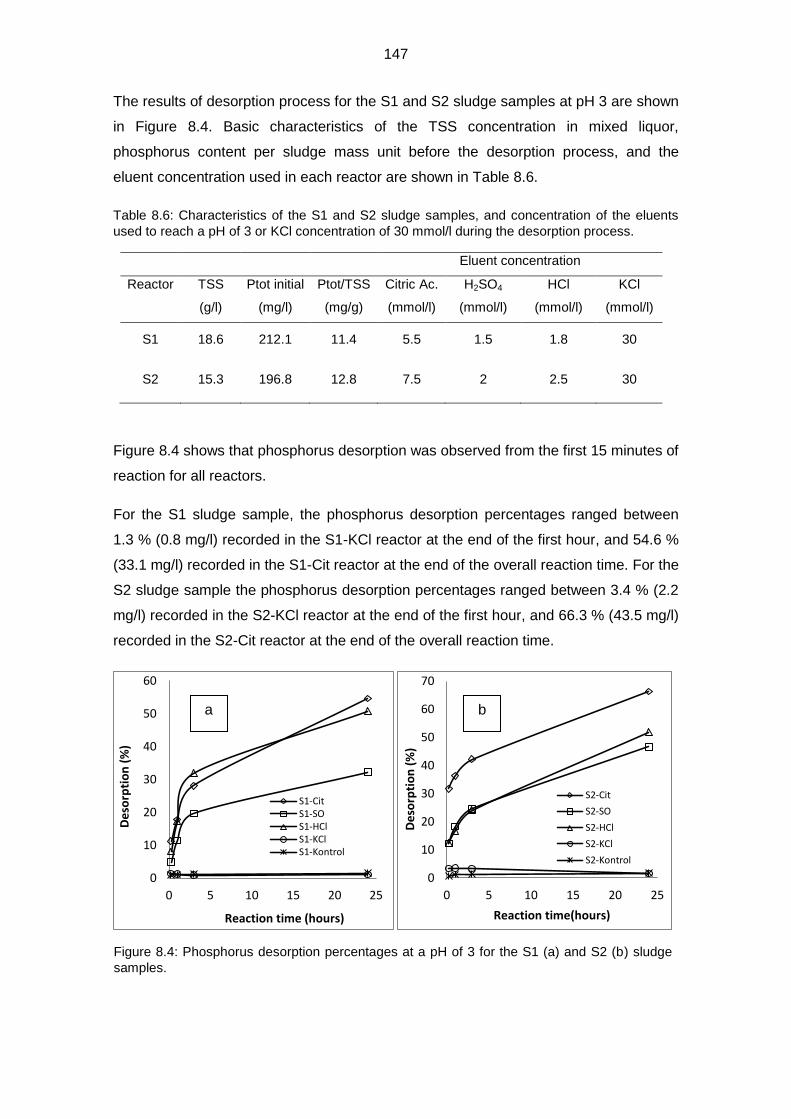
147
0
10
20
30
40
50
60
0 5 10 15 20 25
De
sorp
tio
n (
%)
Reaction time (hours)
S1-CitS1-SOS1-HClS1-KClS1-Kontrol
0
10
20
30
40
50
60
70
0 5 10 15 20 25
De
sorp
tio
n (
%)
Reaction time(hours)
S2-Cit
S2-SO
S2-HCl
S2-KCl
S2-Kontrol
The results of desorption process for the S1 and S2 sludge samples at pH 3 are shown
in Figure 8.4. Basic characteristics of the TSS concentration in mixed liquor,
phosphorus content per sludge mass unit before the desorption process, and the
eluent concentration used in each reactor are shown in Table 8.6.
Table 8.6: Characteristics of the S1 and S2 sludge samples, and concentration of the eluents
used to reach a pH of 3 or KCl concentration of 30 mmol/l during the desorption process.
Eluent concentration
Reactor
TSS Ptot initial Ptot/TSS Citric Ac. H2SO4 HCl KCl
(g/l) (mg/l) (mg/g) (mmol/l) (mmol/l) (mmol/l) (mmol/l)
S1 18.6 212.1 11.4 5.5 1.5 1.8 30
S2 15.3 196.8 12.8 7.5 2 2.5 30
Figure 8.4 shows that phosphorus desorption was observed from the first 15 minutes of
reaction for all reactors.
For the S1 sludge sample, the phosphorus desorption percentages ranged between
1.3 % (0.8 mg/l) recorded in the S1-KCl reactor at the end of the first hour, and 54.6 %
(33.1 mg/l) recorded in the S1-Cit reactor at the end of the overall reaction time. For the
S2 sludge sample the phosphorus desorption percentages ranged between 3.4 % (2.2
mg/l) recorded in the S2-KCl reactor at the end of the first hour, and 66.3 % (43.5 mg/l)
recorded in the S2-Cit reactor at the end of the overall reaction time.
a b
Figure 8.4: Phosphorus desorption percentages at a pH of 3 for the S1 (a) and S2 (b) sludge
samples.

148
At a pH of 3, the best desorption percentages were recorded using citric acid as the
eluent. Otherwise, the desorption percentages achieved for the S1-KCl and S2-KCl
reactors were similar to the low values achieved for the control reactors. The
desorption equilibrium was not reached in any reactor by the end of the reaction time.
The results of the S1 and S2 sludge samples at a pH of 4 are shown in Figure 8.5.
Basic characteristics of the TSS concentration in mixed liquor, phosphorus content per
sludge mass unit before the desorption process, and the eluent concentration used in
each reactor are shown in Table 8.7.
Table 8.7: Characteristics of the S1 and S2 sludge samples, and concentrations of the eluents
used to reach a pH of 4 or KCl concentration of 40 mmol/l during the desorption process.
Eluent concentration
Reactor
TSS Ptot initial Ptot/TSS Citric Ac. H2SO4 HCl KCl
(g/l) (mg/l) (mg/g) (mmol/l) (mmol/l) (mmol/l) (mmol/l)
S1 23.4 218.6 9.4 1 0.5 0.5 40
S2 22.7 278 12.2 1.75 0.8 1.5 40
Low percentages of phosphorus desorption were recorded for the S1 sludge sample
from the first hour of reaction. The same results were recorded for the S2 sludge
sample with the exception that, for the S2-Cit reactor, a desorption percentage of
22.7% (21 mg/l) was recorded. The phosphorus desorption percentages ranged
between 1.6 % (1 mg/l) recorded for the S1-KCl reactor at the end of the first hour, and
25.1 % (15.7 mg/l) recorded for the S1-Cit reactor at the overall end of the reaction
time. Likewise, for the S2 sludge sample the desorption percentages ranged between
0.7 % (0.7 mg/l) recorded for the S2-KCl reactor during the third hour, and 27.4 % (25.4
mg/l) recorded for the S2-Cit reactor at the overall end of the reaction time. In no case
was a considerable amount of phosphorus released.

149
0
5
10
15
20
25
30
0 5 10 15 20 25
De
sorp
tio
n (
%)
Reaction time (hours)
S1-Cit S1-SO
S1-HCl S1-KCl
S1-Kontrol
0
5
10
15
20
25
30
0 5 10 15 20 25
De
sorp
tio
n (
%)
Reaction time(hours)
S2-Cit S2-SOS2-HCl S2-KClS2-Kontrol
Again, the lowest desorption percentages were recorded in the S1-KCl and S2-KCl
reactors and these percentages were similar to the values obtained for the control
reactors. The desorption equilibrium was not achieved for either sludge sample by the
end of the reaction time.
The results of the S1 and S2 sludge samples at a pH of 5 are shown in Figure 8.6.
Characteristics of the TSS concentration in mixed liquor, phosphorus content per
sludge mass unit before the desorption process, and the eluent concentration used in
each reactor, are shown in Table 8.8.
Table 8.8: Characteristics of the S1 and S2 sludge samples, and concentrations of the eluents
used to reach a pH of 5 or KCl concentration of 50 mmol/l during the desorption process.
.
Eluent concentration
Reactor
TSS Ptot initial Ptot/TSS Citric Ac. H2SO4 HCl KCl
(g/l) (mg/l) (mg/g) (mmol/l) (mmol/l) (mmol/l) (mmol/l)
S1 27.2 284 10.5 0.5 0.3 0.3 50
S2 12 208.5 17.4 0.6 0.5 0.7 50
a b
Figure 8.5: Phosphorus desorption percentages at a pH of 4 for the S1 (a) and S2 (b) sludge
samples.

150
0
1
2
3
4
0 5 10 15 20 25
De
sorp
tio
n (
%)
Reaction time (hours)
S1-Cit S1-SOS1-HCl S1-KClS1-Kontrol
0
10
20
30
40
50
0 5 10 15 20 25
De
sorp
tio
n (
%)
Reaction time(hours)
S2-Cit S2-SO
S2-HCl S2-KCl
S2-Kontrol
Figure 8.6 shows the results of the S1 sludge sample which recorded the lowest
phosphorus desorption percentages in the experimental process. Likewise, the results
of the S2 sludge samples recorded desorption percentages that ranged between 2.3 %
(1.6 mg/l) in the S2-KCl reactor, and 39 % (27.1 mg/l) in the S2-Cit reactor.
The results noted thus far recorded the highest desorption percentages for the S2-Cit,
S2-HCl and S1-Cit reactors at a pH of 3, with phosphorus desorption percentages that
ranged between 54.6% (33.1 mg/l) and 66.3% (43.5 mg/l). Good desorption
percentages were also recorded for the S2-SO, S2-HCl, S2-Cit reactors at a pH of 2
and for the S2-KCl reactor (eluent concentration = 20 mmol/l) with percentages ranging
between 50.6% (44.6 mg/l) and 55.5% (48.9 mg/l). These results were obtained at the
end of the reaction time (24 hours).
The results obtained for the S1 and S2 reactors were used to choose the pH and
eluents for the remaining desorption-stabilization-sorption processes. The selection
criteria used to choose the type and concentration of eluents were: the phosphorus
desorption and sorption performance, the phosphorus release during the stabilization
process, and the bacterial survival rates after completion of the desorption-stabilization-
sorption process.
The phosphorus release during the stabilization process was assessed in order to
determine the finalization of the desorption process. In the stabilization process the
sludge samples were diluted in a CaCl2 (5mg/l) and MgCl2 (10 mg/l) solution with the
aim of stabilizing the sludge biomass after the desorption process. Once the
stabilization process had been completed, the total phosphorus content in the
supernatant was evaluated. The amount of phosphorus released was considered an
a b
Figure 8.6: Phosphorus desorption percentages at a pH of of 5 for the S1 (a) and S2 (b)
sludge samples.

151
indicator of incomplete desorption processes, and hence, a sludge sample which
continued releasing phosphorus to the supernatant would not be used in a subsequent
sorption process. Another criterion was the phosphorus sorption capacity of the sludge
samples. The sorption results of each sludge sample are presented in Chapter 8.3.2;
however, as they are selection criteria, the sorption results of the S1 and S2 sludge
samples at pH 2 and 3 are shown in Table 8.9.
Finally, the last selection criterion was the bacterial survival rate in each sludge sample
once the desorption-stabilization-sorption process was completed. The survival
capacity of each bacterial community was evaluated after completion of the sorption
process using the Agar Pour Plate technique. The results of the bacterial survival rates
are shown in Chapter 9; however, the results of the S1 and S2 sludge samples are
shown in Table 8.9, again, as they are selection criteria.
Table 8.9 shows that the S1-KCl and S2-KCl were the only reactors with sorption
capacity. Likewise, upon completion of the stabilization process, the amount of
phosphorus released for the S1-KCl and S2-KCl reactors was not high when the
previous desorption process used an eluent concentration of 30 mmol/l. Finally, good
bacterial survival percentages were recorded for the S1-KCl-pH3 reactor (152%), while
the S2-KCl-pH3 reactor reached 14% survival.
Considering the low bacterial survival percentages achieved upon completion of the
desorption-stabilization-sorption processes at pH 2, and also considering the low
sorption percentages obtained in all reactors which underwent previous desorption
processes at this pH, the desorption process at pH 2 was dismissed for the remaining
experimental processes.
Finally, the eluents citric acid at pH 3 and potassium chloride with concentration of 30
mmol/l were selected as desorption eluents. These eluents were choosen considering
the best desorption results using citric acid as eluents, and also because the best
sorption performances were achieved after completion of a desorption process using
potassium chloride as eluent with a concentration of 30 mmol/l. The results of the
phosphorus release during the stabilization process and the bacterial survival
percentages were also considered.

152
Table 8.9: Selection criteria of the eluents for the remaining desorption-stabilization-sorption
processes.
Stabilization process Sorption process Survival test
Re
acto
r
Eluent-acid
Eluent KCl
Ptot in supernatant (mg/l) (%) (%)
pH 2
(20 mmol/l)
pH 3
(30 mmol/l)
pH 2
(20 mmol/l)
pH 3
(30 mmol/l)
pH 2
(20 mmol/l)
pH 3
(30 mmol/l)
S1
Cit 3.8 15.2 -128 -1890.9 4.5 3
SO 3 10.2 13.4 -1175.3 3 112
HCl 3.1 14.5 -11.5 -1040.2 3 42
KCl 3.5 1.6 64.4 74.2 6.1 152
Control 0.9 1.1 20.8 7.3 45 55
S2
Cit 16.6 14.1 -78.3 -494.1 13.4 87
SO 17.4 10.8 -36.9 -600 12.6 152
HCl 16.2 12.2 -28.8 -604 10.5 70
KCl 14.9 0.3 -55.6 78.6 29.8 14
Control 0.8 0.7 20.2 24 51.3 49
The remaining processes of desorption-stabilization-sorption were perfomed with the
B2 and B4 sludge samples, and with the Lüneburg WWTP and Steinhorst WWTP
sludge samples.
The results of the phosphorus desorption percentages for the B2 and B4 reactors are
shown in Figure 8.7. Basic characteristics of the TSS concentration in mixed liquor,
phosphorus content per sludge mass unit before the desorption process, as well as the
eluent concentration used in each reactor, are shown in Table 8.10.
Table 8.10: Characteristics of the B2 and B4 sludge samples and eluent concentrations used to
achieve a reaction pH of 3 during the desorption process.
Eluent concentration
Reactor
TSS Ptot initial Ptot/TSS Citric Ac. KCl
(g/l) (mg/l) (mg/g) (mmol/l) (mmol/l)
B2 9.6 252.5 26.3 5 30
B4 7.7 248.5 32.4 5.5 30

153
00
,05
0,1
0,1
50
,20
,25
0
5
10
15
20
25
30
1 3 6 24
De
sorp
tio
n p
erc
en
tage
B4
-KC
l & B
4-C
on
tro
l
De
sorp
tio
n p
erc
en
tage
(%)
Reaction time (hours)
B4-Cit
B4-KCl
B4-Kontrol
0,0
00
,05
0,1
00
,15
0,2
0
0
5
10
15
20
25
30
35
40
45
50
1 3 6 24
De
sorp
tio
n p
erc
en
tge
B2
-KC
l & B
2-C
on
tro
l
De
sorp
tio
n p
erc
en
tage
(%)
Reaction time (hours)
B2-Cit
B2-KCl
B2-Kontrol
Figure 8.7 shows that for the B2-Cit and B4-Cit reactors, phosphorus release into the
supernatant was recorded from the first hour of desorption. For these reactors, the
phosphorus desorption percentages increased gradually, achieving 45.9% (38.6 mg/l)
for the B2-Cit reactor and 26.1% (21.6 mg/l) for the B4-Cit reactor. The B2-KCl and B4-
KCl reactors achieved very low desorption percentages, similar to the values achieved
in their control reactors. In no reactor was desorption equilibrium reached by the end of
the reaction time.
The phosphorus desorption percentages for the Lüneburg sludge sample are shown in
Figure 8.8. Basic characteristics of the TSS concentration in mixed liquor, phosphorus
content per sludge mass unit before the desorption process, as well as the eluent
concentration used in each reactor, are shown in Table 8.11. The Lüneburg-BS sludge
sample was taken from the aeration tank and the Lüneburg-RS sludge sample was
taken from the Return Activated Sludge line (RAS) of the Lüneburg WWTP.
Table 8.11: Characteristics of the Lüneburg-BS and Lüneburg-RS sludge samples and eluent
concentrations used to achieve a reaction pH of 3 during the desorption process.
Eluent concentration
Reactor
TSS Ptot initial Ptot/TSS Citric Ac. KCl
(g/l) (mg/l) (mg/g) (mmol/l) (mmol/l)
BS 19.2 452.9 23.6 6.3 30
RS 19.4 549.1 28.3 7.5 30
a b
Figure 8.7: Phosphorus desorption percentages at a pH of 3 in the B2 (a) and B4 (b) sludge
samples.

154
0
10
20
30
40
50
60
70
0 5 10 15 20 25
De
sorp
tio
n p
erc
en
tage
(%
)
Reaction time (hours)
RS-kontrol
RS-Cit
RS-KCl
0
10
20
30
40
50
60
70
80
0 5 10 15 20 25
De
sorp
tio
n p
erc
en
tage
(%
)
Reaction time (hours)
BS-kontrol
BS-Cit
BS-KCl
As shown in Figure 8.8, phosphorus release into supernatant for the BS-Cit and RS-Cit
reactors was recorded from the first reaction hour. The phosphorus desorption
percentages ranged between 1.3% (1.2 mg/l) for the BS-KCl reactor and 70.3% (63.7
mg/l) for the BS-Cit reactor. Meanwhile, for the RS sludge samples, the phosphorus
desorption percentages ranged between 1.7% (3.7 mg/l) for the RS-KCl reactor and
59.3% (130.3 mg/l) for the RS-Cit reactor. The latter values were achieved at the end
of the reaction time.
The highest desorption percentage achieved in the BS-KCl reactor was 4% (3.7 mg/l)
and in the RS-KCl reactor was 4.4% (9.6 mg/l). These results were slightly higher than
those obtained in the control reactors. Apparently, the desorption equilibrium was
achieved in the RS-KCl reactor during the sixth hour of reaction.
The phosphorus desorption percentages of the Steinhorst sludge sample are shown in
Figure 8.9. Basic characteristics of the TSS concentration in mixed liquor, phosphorus
content per sludge mass unit before the desorption process, as well as the eluent
concentration used in each reactor, are shown in Table 8.12. The Steinhorst-BS sludge
sample was taken from the aeration tank and the Steinhorst-RS sludge sample was
taken from the sludge stabilization line of the Steinhorst WWTP.
a b
Figure 8.8: Phosphorus desorption percentages at a pH of 3 for the BS (a) and RS (b) sludge
samples of the Lüneburg WWTP.

155
0
10
20
30
40
50
60
1 3 6 24
De
sorp
tio
n p
erc
en
tage
(%
)
Reaction time (hours)
RS-Cit
RS-KCl
RS-Kontrol
0
10
20
30
40
50
60
1 3 6 24
De
sorp
tio
n p
erc
en
tage
(%
)
Reaction time (hours)
BS-Cit
BS-KCl
BS-Kontrol
Table 8.12: Characteristics of the Steinhorst-BS and Steinhorst-RS sludge samples and eluent
concentrations used to achieve a reaction pH of 3 during the desorption process.
Eluent concentration
Reactor
TSS Ptot initial Ptot/TSS Citric Ac. KCl
(g/l) (mg/l) (mg/g) (mmol/l) (mmol/l)
BS 9.5 158.2 16.8 6 30
RS 13.4 253.4 18.9 7.5 30
As shown in Figure 8.9, the phosphorus release was recorded from the first hour of
desorption for the BS-Cit and RS-Cit reactors. The phosphorus desorption percentages
ranged between 2.4% (1.5 mg/l) for the BS-KCl reactor and 53.6% (33.9 mg/l) for the
BS-Cit reactor. Meanwhile, for the RS sludge sample, the phosphorus desorption
percentages ranged between 2.9% (4.4 mg/l) and 47.9% (72.7 mg/l) for the RS-Cit
reactor. It should be mentioned that at the end of the reaction time, the BS-Control and
RS-Control reactors achieved considerable desorption percentages of 35.3% (22.3
mg/l) and 25.6% (38.8 mg/l), respectively.
As can be seen, the greatest release of phosphorus was recorded when citric acid was
used as eluent (RS-Lun-Cit 130.3 mg/l; RS-Stein-Cit 89.3 mg/l; BS-Lun-Cit 63.7 mg/l;
S2-Cit 43.5 mg/l; B2 38.6 mg/l; BS-Stein-Cit 38.5 mg/l; S1-Cit 33.1 mg/l). Additionally,
the consumption of citric acid as carbon source was confirmed by the results of the
bacterial survival test (Chapter 9). Apparently, the EBPR bacterial community was able
to assimilate the citric acid during the desorption process. Therefore, the phosphorus
release during the desorption process may partly be caused by the phosphorus release
a b
Figure 8.9: Phosphorus desorption percentages at a pH of 3 for the BS (a) and RS (b) sludge
samples of the Steinhorst WWTP.

156
observed in an EBPR process during the anaerobic phase in presence of a carbon
source.
Likewise, it is unlikely that the bacterial communities in reactors S1 and S2 were able
to use citric acid as a carbon source since the results of bacterial survival recorded the
decrease of their initial bacterial concentration. Therefore, it can be confirmed that the
phosphorus release during the desorption processes for the S1 and S2 sludge samples
was caused by the eluent effect. For the B2, B4 and Lüneburg sludge samples, it was
not possible to differentiate the percentage of phosphorus released due to the eluent
effect and due to the phosphorus release during the EBPR processes.
In order to achieve a successful desorption process, the eluent used should be able to
abate the forces that bind the chemical compound (sorbat) with the flock structure
(adsorbent). Among the binding forces which were involved in sorption processes are
the electrostatic forces, van der Waals forces and chemical attractions (Grupo de
investigación de recursos hídricos - IUPA, 2009). Depending on the eluent used it
would be possible to weaken one or all these binding forces, reaching a partial or total
desorption.
The present research shows that the citric acid was able to abate more binding forces
than the KCl. The only binding forces that the ion exchanger would be able to abate are
the electrostatic forces, hence the low phosphorus desorption percentages obtained
when potassium chloride was used as eluent. Similar results were observed in
research by Wang and Li (2010) using potassium chloride as eluent. This research
recorded phosphorus retention potentials up to 95% for estuarine sediments and up to
85% for sediments from a lake and a canal. In the same research it was proposed that
the low desorption potentials recorded using potassium chloride as eluent might be due
to the slightly acidic environmental conditions (pH 5 - 6) that increase the amount of
positive charges in the sediment surface. In turn, these positives charges would
maintain the attachment of the phosphorus to the sediment surface. Finally, the
research recorded that the estuarine sediment had a high phosphorus adsorption
capacity but a low desorption potential. Additionally, Wang and Li (2010) mentioned
that the phosphorus retention capacity of a substrate is related to the density of vacant
sites on the substrate surface.
Other research has proposed that the availability of vacant sites might decrease if the
substrate was exposed over a long period of time to an aqueous media with high
phosphorus concentration. Research by Lin et al. (2009) on phosphorus sorption and
desorption capacity of Daliao River sediments (China) concluded that, because of the

157
long history of pollution in the river, the phosphorus sorption capacity of the sediment
decreased and its phosphorus desorption potential increased. Similar results were
obtained by Lin and Banin (2005) but with sediments from a WWTP.
In the present study, the phosphorus sorption capacity of the sludge samples will be
evaluated in Chapter 8.3.2. An aspect of the sorption research will seek to clarify if the
sludge samples with less phosphorus desorption potential will be those that, at the
same time, recorded the highest sorption performance.
8.3.2 Determination of the apparent desorption coefficient (Kdes)
The apparent desorption coefficient expresses the desorption behavior of substrates.
This coefficient represents the mobility of the chemical compounds in substrates
(OECD, 2000). The Kdes relates the content of the chemical substance (sorbat) that
remains sorbed in the soil and the mass concentration of the chemical substance
desorbed in the aqueous phase. Therefore, its having a lower value would be an
indicator that the amount of chemical compound desorbed was greater.
A further objective of the sorption-desorption investigations is to determine the
reversibility of the sorption process, i.e. to determine which percentage of the chemical
compound previously sorbed will be released to the aqueous phase during the
desorption process; therefore, the difference between the coefficients Kdes and Kd
(sorption distribution coefficient) is evaluated. According to Wang and Li (2010), wide
differences between both coefficients are caused by the large sorption capacity of the
substrate and by the availability of vacant sites on its surface that impede the
desorption of the chemical compound. Significant differences between both coefficients
are called adsorption/desorption hysteresis.
The equation of the Kdes coefficient (Formula 8.1) is used in research of adsorption-
desorption when a batch equilibrium method is applied (OECD, 2000).
Kdes =𝑚𝑠
𝑎𝑑𝑠 (𝑒𝑞)− 𝑚𝑎𝑞𝑑𝑒𝑠 (𝑒𝑞)
𝑚𝑎𝑞𝑑𝑒𝑠 (𝑒𝑞)
∗ (𝑉𝑡
𝑚𝑠𝑜𝑖𝑙) …….. (8.1)

158
where:
𝐾𝑑𝑒𝑠 : apparent desorption coefficient (ml/g)
𝑚𝑠𝑎𝑑𝑠 (𝑒𝑞) : mass of the chemical substance adsorbed by the soil under
adsorption equilibrium (mg).
𝑚𝑎𝑞𝑑𝑒𝑠 (𝑒𝑞) ∶ total mass of chemical substance desorbed during desorption
equilibrium (mg)
Vt: total volume of aqueous phase in contact with the substrate
during kinetic desorption tests by serial method (ml).
Msoil: amount of substrate expressed as dry mass (g).
Normally, the sorption-desorption investigations in sediments (Wang and Li, 2010),
soils (OECD, 2000) and activated sludge (EPA, 1998) are developed taking into
consideration a sequential process of sampling and pretreatment of the sludge sample
followed by the sorption and desorption process.
The experimental process in the present research considered an initial desorption
phase where different eluents were used to simultaneously, recover the phosphorus
previously sorbed and to release active sites on the surface of the floc. After the
desorption process, each sludge sample was stabilized using a solution of CaCl2 and
MgCl2.Determining the amount of phosphorus previously sorbed by the substrate was
not possible since the initial experimental process corresponded to a desorption
process. Therefore, the total phosphorus content in the settled sludge before the
desorption–sorption process may represent the amount of phosphorus previously
sorbed in the biomass. From this value, the amount of phosphorus released into
supernatant during the desorption tests was calculated. The amount of phosphorus
desorbed at the end of the reaction time (24 hours) was also used to calculate the
Kdes coefficient, although the desorption equilibrium was not reached (Appendix 1).
The results of the S1 and S2 reactors are shown in Figure 8.10. In these sludge
samples, the lowest Kdes coefficients were recorded in the S1-Cit and S2-Cit reactors
at a pH of 3. These results confirm that the best desorption performance is achieved
using as eluent citric acid at the desorption pH of 3.

159
0
200000
400000
600000
1
10
100
1000
10000
100000
2 3 4 5
Kd
es
- K
Cl &
Ko
ntr
ol (
ml/
g)
Kd
es
(ml/
g)
pH
S1-Cit S1-SO
S1-HCl S1-KCl
S1-Kontrol
0
10000
20000
30000
40000
50000
60000
1
10
100
1000
2 3 4 5
Kd
es
- K
Cl &
Ko
ntr
ol (
ml/
g)
Kd
es
(ml/
g)
pH
S2_Cit S2-SO
S2-HCl S2-KCl
S2-Kontrol
The highest Kdes coefficients, between reactors which underwent desorption
processes, were recorded in the S1-KCl (33692.4 ml/g) and S2-KCl (45566.9 ml/g)
reactors. This result indicates that potassium chloride is an inefficient eluent for
phosphorus desorption and also suggests the high potential of the S1 and S2 sludge
samples to adsorb phosphorus and to retain it.
The desorption processes for the B2, B4, Lüneburg and Steinhorst sludge samples
were performed only at a pH of 3; therefore, the resulting Kdes coefficients can be
compared.
As shown in Figure 8.11, the lowest Kdes values were obtained in the S1-Cit (165.9
ml/g), S2-Cit (104.9 ml/g), BS-Cit-Lun (110.5 ml/g), RS-Cit-Lun (146.8 ml/g) and RS-
Cit-Stein (120.9 ml/g) reactors. It should be noted here that the Lüneburg sludge
samples corresponded to an EBPR bacterial community; therefore, the amount of
a
b
Figure 8.10: Apparent desorption coefficients (Kdes) vs the pH of desorption for the S1 (a) and
S2 (b) sludge samples.

160
0
200
400
600
800
1000
1200
1
10
100
1000
10000
100000
1000000
Kd
es
- C
it
Kd
es
- K
on
tro
l
Reactors
Kdes-Kontrol
Kdes-Cit
phosphorus released by these samples during the desorption process may be partly
due to the phosphorus commonly released in an EBPR process.
With respect to the low Kdes values obtained using acid eluents, a research by
Hongthanat, (2010) on phosphorus sorption-desorption of soils and sediments reported
that the lower the PEBC (phosphorus equilibration buffering concentration in l/kg),
more susceptible the substrate sample to loss of phosphorus. At this point, it is
possible to estimate the phosphorus sorption capacity of sludge samples which were
shown to have low Kdes values during the previous desorption process.
The results of the desorption process using potassium chloride with a concentration of
30 mmol/l as eluents are shown in Figure 8.12. As can be noted, the Kdes coefficients
were so high that in some cases (S2-KCl and B4-KCl), they were similar to the Kdes
coefficients recorded for the control reactors. It is important to note here that the lowest
Kdes coefficients recorded using potassium chloride as eluent were obtained in the
RS-KCl-Lun and RS-KCl-Stein reactors. This result may be due to the effect of the
application of the eluent to sludge samples that were already destabilized since these
samples came from anaerobic and static environments (Return Activated Sludge line
and sludge stabilization line).
Figure 8.11: Kdes coefficients at the end of the reaction time. Citric acid was used as eluent
during the desorption process.

161
1
10
100
1000
10000
100000
1000000
Kd
es
- K
on
tro
l
Reactors
Kdes-KCl
Kdes-Kontrol
The Kdes coefficients of the control reactors serve as a reference point allowing for a
comparison of the efficiency of the desorption process. These Kdes coefficients are
also indicators of phosphorus retention capacity: The higher the Kdes coefficient during
the desorption process, the higher the phosphorus sorption potential during the
sorption process.
8.3.3 Relationship between the Soil/Solution ratio and the apparent desorption coefficient (Kdes)
The soil/solution ratios were plotted against the apparent desorption coefficients (Kdes)
to determine, using these graphical representations, the soil/solution ratios, that is
needed if a particular desorption percentage were sought (OECD, 2000).
The relation between the Kdes coefficient and the soil/solution ratio may be deduced
from the Equation 8.1, considering that this is a linear equation only in this case:
𝐾𝑑𝑒𝑠 =𝑚𝑠
𝑎𝑑𝑠 (𝑒𝑞)− 𝑚𝑎𝑞𝑑𝑒𝑠 (𝑒𝑞)
𝑚𝑎𝑞𝑑𝑒𝑠(𝑒𝑞)
∗ (𝑉𝑡/𝑚𝑠𝑜𝑖𝑙) ……………. (8.1)
From Equation 8.1, the logarithmic equation (Appendix 2) that link the soil/solution
ratio, the desorption percentage and the apparent desorption coefficient (Kdes) is
deduced:
Figure 8.12: Kdes coefficients obtained at the end of the desorption process using potassium
chloride as eluent.

162
𝑉𝑡
𝑚𝑠𝑜𝑖𝑙= 𝐾𝑑𝑒𝑠 (
𝑚𝑎𝑞𝑑𝑒𝑠(𝑒𝑞)
𝑚𝑠𝑎𝑑𝑠 (𝑒𝑞)− 𝑚𝑎𝑞
𝑑𝑒𝑠 (𝑒𝑞))……... (8.2)
where:
𝑅 =𝑚𝑠𝑜𝑖𝑙
𝑉𝑡𝑜𝑡 …………………………………………...……… (8.3)
𝐷𝑒𝑞 = ( 𝑚𝑎𝑞
𝑑𝑒𝑠 (𝑒𝑞)
𝑚𝑠𝑎𝑑𝑠 (𝑒𝑞)
) ∗ 100………………………… (8.4)
𝑚𝑠𝑜𝑖𝑙
𝑉𝑡𝑜𝑡= (
1
𝐾𝑑𝑒𝑠) ∗ (
𝑚𝑠𝑎𝑑𝑠 (𝑒𝑞)− 𝑚𝑎𝑞
𝑑𝑒𝑠 (𝑒𝑞)
𝑚𝑎𝑞𝑑𝑒𝑠 (𝑒𝑞)
)
𝑅 = (1
𝐾𝑑𝑒𝑠) ∗ (
1−𝐷𝑒𝑞 %100
𝐷𝑒𝑞 %100)
finally:
𝐿𝑜𝑔 𝑅 = −𝐿𝑜𝑔 𝐾𝑑𝑒𝑠 + 𝐿𝑜𝑔 [1−𝐷𝑒𝑞%100
𝐷𝑒𝑞%100]… (8.5)
In the figure describing the relationship between the soil/solution vs Kdes coefficients
(Figure 8.13), the diagonal lines correspond to specific desorption percentages. Thus,
for a specific Kdes, it is possible to estimate the desorption percentage that
corresponds to a specific soil/solution ratio. More specifically, it is possible to determine
the highest desorption percentage considering a specific Kdes coefficient and specific
soil/solution ratios.
The soil/solution vs Kdes graphic for the S1 sludge sample is shown in Figure 8.13.
The highest desorption percentages (Deq) were recorded in the S1-pH3 reactors with a
Kdes coefficient of 165.9 ml/g and soil/solution ratio of 0.00532 g/ml using citric acid as
eluent. Although the best desorption performance was obtained using citric acid as
eluent at a pH of 3, a higher soil/solution ratio compared to the soil/solution ratio
required for the S1-pH2 reactors was required.

163
For the S2 sludge sample (Figure 8.14), the best desorption percentage was obtained
in the S2-Cit reactor (65%) at a pH of 3. It is noteworthy that the S1 sludge sample at a
pH of 2 had similar soil/solution ratios but the desorption percentages reached were
lower (50% S1-Cit).
0,001
0,01
1 10 100 1000 10000 100000 1000000
Soil/
Solu
tio
n (
g/m
l)
Kdes (ml/g)
S1-pH2
S1-pH3
S1-pH4
S1-pH5
0,001
0,01
1 10 100 1000 10000 100000
Soil/
Solu
tio
n (
g/m
l)
Kdes (ml/g)
S2-pH2
S2-pH3
S2-pH4
S2-pH5
10%
25%
50%
75%
90%
10%
25%
50%
75%
90%
Figure 8.13: Soil/solution ratios vs Kdes coefficients for the S1 sludge sample.
Figure 8.14: Soil/solution ratios vs Kdes coefficients for the S2 sludge sample.
164
The desorption percentages of the S1 and S2 sludge samples at a pH of 4 and 5 were
very low even when higher soil/solution ratios were used; therefore, these results are
not considered in this analysis.
So far, it can be concluded that the type of eluent used during desorption processes
and the pH of desorption are factors determinig the phosphorus desorption
performance. The soil/solution ratio does not exert the same influence on this
performance, as even with very high ratios, high desorption percentages were not
achieved if the pH and the eluent were not appropiate.
Other factor influencing the phosphorus desorption performance is the origin of the
activated sludge sample. In this study, the origin of a sludge sample is determined by:
the wastewater treatment, the regular composition of the influent wastewater, the use
of trivalent metallic salts in phosphorus precipitation processes and the microbial
composition of the activated sludge.
Considering these factors, it is possible to explain the similarity between the results
obtained in the S1 and S2 sludge samples since both sludge samples underwent
similar wastewater treatment processes resulting in similar bacterial communities
(Chapter 6).
Additionally, the sludge samples of the B2 and B4 reactors and from Lüneburg and
Steinhorst WWTPs underwent different wastewater treatments and received influent
wastewater characterized by different compositions. In the present study, the possibility
that the microbial composition affected the phosphorus desorption-sorption capacity of
the activated sludge samples was considered. The results of the B2 and B4 reactors
(Figure 8.15) show that the soil/solution ratios used in both reactors were similar
(0.0032 g/ml for B2 and 0.00256 g/ml for B4); however, the Kdes coefficient for the B2-
Cit reactor (367.9 ml/g) was lower than the coefficient for the B4-Cit reactor (1111.7
ml/g). With these Kdes values, the B2 and B4 reactors reached phosphorus desorption
percentages of 46% and 26%, respectively.

165
From these groups of results, the B2 sludge sample was characterized by higher
desorption percentages than the B4 sludge sample even though both samples were
obtained with similar operational parameters and both bacterial communities were
described as EBPR communities. The only difference between both reactors was the
carbon source used in the influent: a VFA mixture for the B2 reactor and propionic acid
for the B4 reactor. Seviour et al. (2003) suggested that if a mix of VFA is used as
substrate, the B2 bacterial community might develop not only a normal EBPR bacterial
community but it might also further the development of the GAO community.
In this study, the presence of the GAO community was not determined, but a TFO
morphotype in high concentrations was identified in the S1, S2 and B2 reactors. Similar
concentrations of the TFO morphotype were not observed in the B4 reactor, where this
bacterial group was almost absent. The difference in the phosphorus release capacity
between the B2 and B4 reactors might then be related to their different microbial
composition.
As was mentioned above, the B2 and B4 sludge samples corresponded to EBPR
bacterial communities; hence, the phosphorus release observed during the desorption
process using citric acid as eluent might be due to the effect of the eluent and to the
phosphorus release by the EBPR process under anaerobic conditions. Research by
Lopez-Vasquez et al. (2009) showed that the increase of propionic acid in the influent
contributes to the development of the PAO bacterial group. Similar growth of the PAO
bacterial group was also expected in the B4 reactor and, thus, improved the EBPR
0,001
0,01
1 100 10000 1000000So
il/So
luti
on
(g/
ml)
Kdes (ml/g)
B2-pH3
B4-pH3
25%
10%
50%
75%
90%
Figure 8.15: Soil/solution ratios vs Kdes coefficients for the B2 and B4 sludge samples.

166
performance. However, in the present study, the results obtained in the bacterial
survival test (Chapter 9) showed that the B4 bacterial community using citric acid as
carbon source was more efficient than the B2 bacterial community. For this reason, it
was expected that the B4 bacterial community might release more phosphorus than the
B2 bacterial community through the EBPR process. However, the B2 bacterial
community released more phosphorus during the desorption process than the B4
bacterial community. This difference might be due to the effect of the eluent on different
bacterial communities.
The results of the Lüneburg sludge samples are shown in Figure 8.16. The BS-Lun and
RS-Lun sludge samples used different soil/solution ratios of approximately 0.0038 g/ml
and 0.0078 g/ml, respectively. Despite the higher mass concentration in the RS-Lun
reactors, the best Kdes value was recorded in the BS-Lun-Cit reactor (110.5 ml/g),
achieving also a desorption percentage of approximately 70%. Additionally, the RS-
Lun-Cit reactor recorded a Kdes value of 146.8 ml/g with a desorption percentage of
approximately 47%. Because they released a considerable amount of phosphorus
during the desorption process, the BS-Lun and RS-Lun sludge samples can be
considered potential sources of phosphorus recovery (63.7 mg/l for BS-Lun-Cit and
130.3 mg/l for RS-Lun-Cit reactors).
Finally, the results of the Steinhorst sludge sample are shown in Figure 8.17. Again, a
considerable difference between the soil/solution ratio used in the BS-Stein ((0.0037
0,001
0,01
1 10 100 1000 10000 100000 1000000
Soil/
Solu
tio
n (
g/m
l)
Kdes (ml/g)
Lun-BS-pH3
Lun-RS-pH3
0,001
0,01
1 10 100 1000 10000
Soil/
Solu
tio
n (
g/m
l)
Kdes (ml/g)
Stein-BS-pH3
Stein-RS-pH3
10%
25%
50%
75%
90%
Figure 8.16: Soil/solution ratios vs Kdes coefficients for the Lüneburg sludge sample.

167
g/ml) and the RS-Stein (0.0089 g/ml) sludge samples was observed. Despite the higher
sludge mass concentration recorded in the RS-Stein sludge sample, the phosphorus
desorption percentages for the BS-Stein-Cit and RS-Stein-Cit reactors at the end of the
desorption process were similar (approximately 40%).
For the Steinhorst sludge sample, the phosphorus release may be due only to the
phosphorus desorption process, as the Steinhorst WWTP was not designed to perform
EBPR processes. This inability was reflected in the results: The comparison of the
phosphorus content of the influent (13.5 mg/l) and of the effluent (14.3 mg/l) at the
moment of the sludge sampling.
It is important to note here that the Steinhorst sludge samples may be considered a
potential source of phosphorus recovery as suggested by the phosphorus desorption
performance achieved in the RS-Stein-Cit reactor (72.7 mg/l).
0,001
0,01
1 10 100 1000 10000
Soil/
Solu
tio
n (
g/m
l)
Kdes (ml/g)
Stein-BS-pH3
Stein-RS-pH3
90%
75%
50%
25%
10%
Figure 8.17: Soil/solution ratios vs Kdes coefficients for the Steinhorst sludge sample.

168
8.4 Results and discussion – Sorption process
The sorption capacity of substrates, more specifically, of soils, sludge and sediments is
closely related to the structure and composition of the mineral and organic compounds
that they contain.
For the specific structure of activated sludge, which contains organic and mineral
compounds, in made up of flocs, which, in optimal conditions, shows a rounded shape
and an average diameter between 150 and 500 µm. (Kunst, et al., 2000). The
characteristics of the floc determine the ease with which the aqueous phase is
separated from the solid phase during sedimentation. There are some physicochemical
characteristics that define the floc structure and provide its cohesion ability and
stability. One of the characteristics that influence the cohesion strength is the chemical
composition of the extracellular polymeric substances (EPS). Thus, the floc’s
composition of carbohydrates, lipids, proteins and divalent calcium will provide the
cohesion capacity between the individual molecules of the EPS and the cohesion
between the EPS and the cell surface. The chemical or physical forces that hold
together the floc components are the same forces that are involved in the sorption
process of chemical substances to the floc (Muller, 2006). These binding forces are
weak physicochemical interactions such as electrostatic interactions, and Van der
Waals forces, as stipulated by the theory of Derjaugin, Landau, Verwey, and Overbeek
(DLVO theory), and hydrogen bonds (Zita and Hermansson, 1994; Mayer et al., 1999;
Muller, 2006).
Regarding the EPS composition, studies show that a high concentration of
polysaccharides and hydrophobic substances (lipids and proteins) might be favorable
for sludge flocculation and sedimentability (Goodwin and Forster, 1985; Higgins and
Novak, 1997). Additionally, Wilen et al. (2003) mentioned that the protein content in the
EPS is directly related to the amount of superficial negative charges in the floc and to
the floc’s ability to flocculate. Finally, other studies suggests that it is more likely that
flocculation are related to the hydrophobicity, EPS composition and the superficial
charges in the floc than to the amount of EPS in the floc (Keiding and Nielsen, 1997).
An additional factor that defines the floc structure is the content of calcium ions and its
influence on the floc stability (cohesion). Previous research identified divalent calcium
ion (Ca+2) as an important bridging ion that links the negative charges in the cellular
surface and the EPS polymers (Bruus et al., 1992; Keiding and Nielsen, 1997).
Additionally, Keiding and Nielsen (1997) mentioned that even small changes in calcium

169
ion concentration might result in the desorption of organic molecules and a floc's
disintegration.
As mentioned above, the constant ion exchange process in an estuarine ecosystem
would be observed between the calcium ion on the substrate’s surface and the sodium
ion in the aqueous phase. Therefore, the estuarine sediment would be subject to
constant processes of loss and recovery of calcium ion between tides (Grupo de
Investigación de Recursos Hídricos - IUPA, 2009).
In this study, it is proposed that the loss of calcium by ion exchange may result in
sediment destabilization and, as a consequence, the desorption of other molecular
components this time not due to ion exchange but to the same sediment
destabilization. Subsequently, this sediment destabilization might result in the release
of active sites, previously saturated in the sediment. If the physicochemical processes
described above occur in an estuarine ecosystem, it may be expected that the sorption
capacity of estuarine sediments would be greater than the sorption capacity of other
natural sediments. Research by Wang and Li (2010) on phosphorus desorption-
sorption capacity of different sediments indicated that estuarine sediment showed the
highest phosphorus sorption capacity. The possibility of phosphorus precipitation was
also considered, but the calcium carbonate, iron and aluminium concentrations in the
sediment were among the lowest of all sediments examined in this article.
In this study, each sludge sample went through a desorption-stabilization-sorption
process. During the desorption phase, acids and an ion exchanger were used as
eluents. The goal of the desorption process was not only to assess the phosphorus
desorption capacity of each sludge sample but also to desorb calcium and, as a
consequence, to expose active sites on the surface of the flocs. Potassium chloride
was used as one of the eluents in the desorption process, to obtain the same effect
exerted by sodium chloride on estuarine sediments. Thus, during the first reaction
phase (desorption process), the activated sludge samples were diluted in different
concentrations of potassium chloride (20, 30, 40 and 50 mmol/l), in which the
potassium ion was expected to replace the available calcium ion on the surface of the
floc (Wang and Li, 2010). The substitution of sodium ion with potassium ion was
performed because of the high sorption affinity of calcium ion for the substrate, a
quality that due to its position in the Hofmeister liotropic series represents an obstacle
for its desorption. Therefore, the potassium ion was chosen since this ion has a higher
sorption priority than sodium ion; to the extent this cation could be irreversibly fixed in
clays due to the strong chemical interactions that it may build with the substrate (Grupo
de Investigación de Recursos Hídricos - IUPA, 2009).

170
Upon completion of the desorption process, the floc structure in particular and the
sludge sample in general were destabilized. This destabilization phase resulted in an
increase of the desorption potential, the release of some colloidal material to the
supernatant and a decrease of sludge settleability. To avoid the problems of a
destabilized sludge mass, a solution of CaCl2 (1M) and MgCl2 (1M) in concentrations
normally reported in domestic wastewater (Liu et al., 2006) was used to re-stabilize the
sludge samples. At the end of this process, the sludge samples were considered ready
for a sorption process. It was then tested whether its phosphorus sorption capacity had
improved by comparing the total phosphorus content in the sludge samples before and
after the desorption-stabilization-sorption process.
8.4.1 Phosphorus sorption percentage (A%) vs reaction time.
The sludge samples that previously underwent a desorption process using acid eluents
did not show phosphorus sorption capacity. Furthermore, the sorption percentages in
these sludge samples were negative, that is, the sludge samples released phosphorus
into the aqueous phase even during sorption process.
The results concerning the phosphorus sorption capacity of the S1 sludge sample are
shown in Figure 8.18. Negative sorption percentages were recorded in all reactors that
used acid eluents regardless of the pH of desorption. Among the sludge samples that
underwent desorption pH of 2 or KCl concentration of 20 mmol/l (Figure 8.18.a), the
S1-KCl-20 mmol/l and S1-SO-pH2 reactors reported positive sorption percentages at
the end of the reaction time of approximately 64.4% and 13.4%, respectively. The
highest negative sorption percentage was observed in the S1-Cit reactor (-128%).

171
-150
-100
-50
0
50
100
0 5 10 15 20 25
Ph
osp
ho
rus
Sorp
tio
n (
%)
Reaction time (h) pH 2
S1-Cit (%) S1-SO S1-HCl
S1-Kontrol S1-KCl
-1200
-1000
-800
-600
-400
-200
0
0 10 20
Ph
osp
ho
rus
Sorp
tio
n (
%)
Reaction time (h) pH 4
S1-Cit S1-SO S1-HClS1-KCl S1-Kontrol
-120
-100
-80
-60
-40
-20
0
20
0 5 10 15 20 25
Ph
osp
ho
rus
Sorp
tio
n (
%)
Reaction time (h) pH5
S1-Cit S1-SO S1-HCl
S1-KCl S1-Kontrol
-150
-100
-50
0
50
100
0 5 10 15 20 25
Ph
osp
ho
rus
Sorp
tio
n (
%)
Reaction time (h) pH 3
S1-Cit S1-SO S1-HCl
S1-KCl S1-Kontrol
Of the results of the S1 sludge sample that underwent a desorption pH of 3 or KCl
concentration of 30 mmol/l (Figure 18.b), the S1-KCl and S1-Control reactors recorded
positive sorption percentages of approximately 78.9% and 19.5%, respectively, at the
end of the reaction time. The S1-Cit, S1-SO and S1-HCl reactors recorded negative
sorption percentages, with the lowest value observed in the S1-SO reactor (-113.8).
For the sludge sample that underwent a desorption process at a pH of 4 or KCl
concentration of 40 mmol/l (Figure 8.18.c), positive sorption percentages were reached
in the S1-Control reactor, while for the S1-KCl reactor, the sorption percentage
increased gradually until 20.4% at the end of the reaction time. The remaining reactors
recorded negative sorption percentages, with the lowest value of -1110.7% for the S1-
Cit reactor. From the results of the S1 sludge sample that underwent a desorption
process at a pH of 5 or KCl concentration of 50 mmol/l (Figure 8.18.d), the only positive
sorption percentage was obtained in the S1-Control reactor (15%), while the remaining
reactors recorded negative sorption percentages, with the lowest value in the S1-KCl
reactor (-111.5%).
a
d c
b
Figure 8.18: Phosphorus sorption percentages vs reaction time for the S1 sludge sample.

172
-100
-80
-60
-40
-20
0
20
40
0 5 10 15 20 25
Ph
osp
ho
rus
Sorp
tio
n (
%)
Reaction time (h) pH 2
S2-Cit S2-SO S2-HCl
S2-Kontrol S2-KCl
-180
-130
-80
-30
20
70
0 5 10 15 20 25
Ph
osp
ho
rus
Sorp
tio
n (
%)
Reaction time (h) pH 4
S2-Cit(%) S2-SO S2-HCl
S2-KCl S2-Kontrol
-200
-150
-100
-50
0
50
0 10 20
Ph
osp
ho
rus
Sorp
tio
n (
%)
Reaction time (h) pH 5
S2-Cit(%) S2-SO S2-HCl
S2-KCl S2-Kontrol
-600
-500
-400
-300
-200
-100
0
100
200
0 5 10 15 20 25
Ph
osp
ho
rus
Sorp
tio
n (
%)
Reaction time (h) pH 3
S2-Cit S2-SO S2-HCl
S2-KCl S2-Kontrol
The results of the S2 sludge sample are shown in Figure 8.19. In general, positive
sorption percentages were recorded in the S2-KCl-pH3 and S2-KCl-pH4 reactors and
in all the S2-Control reactors.
For the sludge samples that underwent a previous desorption process at a pH of 2 or
KCl concentration of 20 mmol/l, the S2-KCl reactor was the only one that recorded a
positive sorption percentage (20.2%). The remaining reactors recorded negative
sorption percentages, with the lowest value achieved in the S2-Cit reactor during the
first 15 minutes of the sorption process (-95.3%). Among the sludge samples that
underwent a previous desorption process at a pH of 3 or KCl concentration of 30
mmol/l, the results concerning the phosphorus sorption percentage recorded positive
values for the S2-KCl and S2-Control reactors with 83.2% and 20.5%, respectively.
The remaining reactors recorded negative sorption percentages, with the lowest value
of approximately -500%, which was recorded for the S2-HCl and S2-Cit reactors. The
results corresponding to the sludge samples that underwent a previous desorption
process at a pH of 4 or KCl concentration of 40 mmol/l reported positive sorption
percentages in the S2-KCl (65.5%) and S2-Control (21.6%) reactors. The remaining
(d)
(c)
a
d c
b
Figure 8.19: Phosphorus sorption percentages vs reaction time for the S2 sludge sample.

173
reactors recorded negative sorption percentages, with the lowest value obtained in the
S2-HCl reactor (-124.2%). Among the sludge samples that underwent a previous
desorption process at a pH of 5 or KCl concentration of 50 mmol/l, the only reactor that
recorded positive sorption percentages was obtained in the S2-Control reactor. Among
the remaining reactors, the lowest sorption percentage was recorded in the S2-HCl
reactor (-189.8%). The results obtained in the S1-Control and S2-Control reactors were
similar, with an average phosphorus sorption percentage of approximately 20%.
The negative sorption percentages may be due to an incomplete previous desorption
process and/or to the phosphorus commonly released in EBPR processes during the
anaerobic phase and in the presence of a carbon source. As mentioned above, the
adsorbate (phosphorus) was diluted in a solution of synthetic wastewater that used
glucose as the carbon source. Furthermore, the bacterial communities in the S1 and
S2 reactors corresponded to a TFO bacterial community. The capacity of this
community to release phosphorus during the anaerobic phase in comparison to a
normal EBPR bacterial community is limited. According to Jeon and Park (2000), the
phosphorus release in this case might involve two bacterial groups: The TFO bacterial
community, that would be able to uptake the glucose during the anaerobic phase and
to produce lactate from it, and the PAO bacterial community that would be able to
uptake the lactate released by the TFO and subsequently release phosphorus to the
aqueous phase. Additionally, the S1-Control and S2-Control reactors did not record a
considerable phosphorus release but phosphorus removal during the sorption process.
Considering the results obtained in the control reactors, the phosphorus release during
the sorption process because of the EBPR process was discarded. One possible
explanation for the phosphorus release during the sorption process in the S1 and S2
sludge samples could be the destabilizing effect caused by the use of eluents during
the previous desorption process. An indication of sludge destabilization was the
release of color into the supernatant, which was observed at the end of the desorption
process. In some reactors, the release of color continued to the end of the stabilization
and sorption processes. Another indication of sludge destabilisation was the constant
release of phosphorus during the desorption, stabilisation, and sorption processes
(Table 8.13).
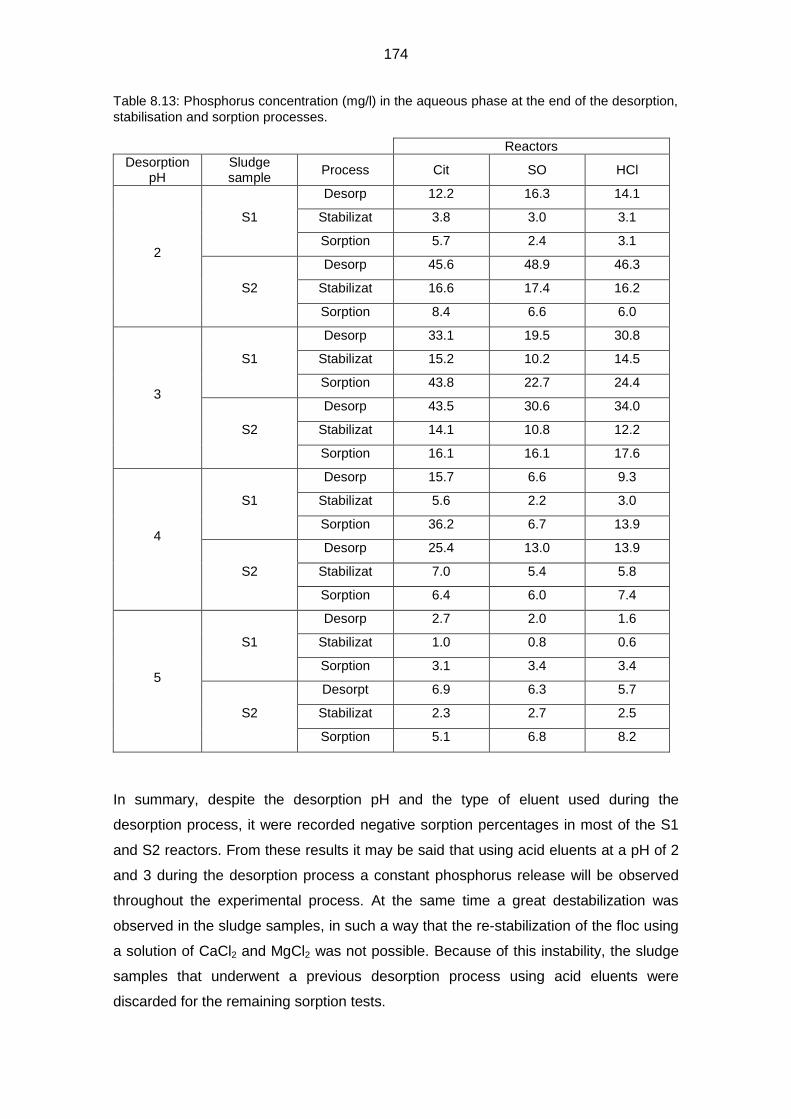
174
Table 8.13: Phosphorus concentration (mg/l) in the aqueous phase at the end of the desorption,
stabilisation and sorption processes.
Reactors
Desorption pH
Sludge sample
Process Cit SO HCl
2
S1
Desorp 12.2 16.3 14.1
Stabilizat 3.8 3.0 3.1
Sorption 5.7 2.4 3.1
S2
Desorp 45.6 48.9 46.3
Stabilizat 16.6 17.4 16.2
Sorption 8.4 6.6 6.0
3
S1
Desorp 33.1 19.5 30.8
Stabilizat 15.2 10.2 14.5
Sorption 43.8 22.7 24.4
S2
Desorp 43.5 30.6 34.0
Stabilizat 14.1 10.8 12.2
Sorption 16.1 16.1 17.6
4
S1
Desorp 15.7 6.6 9.3
Stabilizat 5.6 2.2 3.0
Sorption 36.2 6.7 13.9
S2
Desorp 25.4 13.0 13.9
Stabilizat 7.0 5.4 5.8
Sorption 6.4 6.0 7.4
5
S1
Desorp 2.7 2.0 1.6
Stabilizat 1.0 0.8 0.6
Sorption 3.1 3.4 3.4
S2
Desorpt 6.9 6.3 5.7
Stabilizat 2.3 2.7 2.5
Sorption 5.1 6.8 8.2
In summary, despite the desorption pH and the type of eluent used during the
desorption process, it were recorded negative sorption percentages in most of the S1
and S2 reactors. From these results it may be said that using acid eluents at a pH of 2
and 3 during the desorption process a constant phosphorus release will be observed
throughout the experimental process. At the same time a great destabilization was
observed in the sludge samples, in such a way that the re-stabilization of the floc using
a solution of CaCl2 and MgCl2 was not possible. Because of this instability, the sludge
samples that underwent a previous desorption process using acid eluents were
discarded for the remaining sorption tests.

175
-80
-60
-40
-20
0
20
40
60
80
0,25 0,5 0,75 24
Ph
osp
ho
rus
sorp
tio
n (
%)
Reaction time (h)
S1-KCl S2-KCl S1-Kontrol S2-Kontrol
-120
-100
-80
-60
-40
-20
0
20
40
60
80
0,25 0,5 0,75 24
Ph
osp
ho
rus
sorp
tio
n (
%)
Reaction time (h)
S1-KCl S2-KCl S1-Kontrol S2-Kontrol
-40
-20
0
20
40
60
80
100
0,25 0,5 0,75 24
Ph
osp
ho
rus
sorp
tio
n (
%)
Reaction time (h)
S1-KCl(%) S2-KCl S1-Kontrol S2-Kontrol
In contrast, positive sorption percentages were recorded for the sludge samples that
underwent a previous desorption process using as eluent to potassium chloride with
concentrations of 20, 30 and 40 mmol/l in mixed liquor (Figure 8.20).
Figure 8.20 shows that good sorption percentages were recorded in the S1-KCl-
20mmol/l, S1-KCl-30mmol/l, S2-KCl-30mmol/l, and S2-KCl-40mmol/l reactors. The
best phosphorus sorption percentages were recorded in the S2-KCl-30 mmol/l (83.2%)
and S1-KCl-30 mmol/l (78.9%) reactors.
Because of the good phosphorus sorption percentages obtained in the S1-KCl-
30mmol/l and S2-KCl-30mmol/l reactors, the test of desorption-stabilization-sorption
was repeated for the S1 and S2 sludge samples. In the repeated test during the
sorption process a phosphorus concentration of 2.5 mg/l was used in the synthetic
wastewater (Figure 8.21).
(a) 20 mmol/l KCl
(c) 40 mmol/l KCl
(b) 30 mmol/l KCl
Figure 8.20: Phosphorus sorption percentages vs reaction time for the S1-KCl, S2-KCl and
control reactors. The sludge samples underwent a previous desorption process using 20
mmol/l (a), 30 mmol/l (b), and 40 mmol/l (c) of KCl as eluent.

176
-20
-10
0
10
20
30
40
50
60
70
80
90
0,25 0,5 0,75 24
Ph
osp
ho
rus
sorp
tio
n (
%)
Reaction time (h)
S1-KCl S2-KCl S1-Kontrol S2-Kontrol
Figure 8.21 shows that the S1-KCl and S1-Control reactors recorded positive sorption
percentages of 74.2% and 7.3%, respectively. Meanwhile, the S2-KCl and S2-Control
reactors achieved sorption percentages of 78.6% and 24%, respectively. The S1-KCl
and S2-KCl reactors showed similar sorption percentages at the end of the reaction
time, but for the S1-KCl reactor high sorption percentages were recorded from the first
15 minutes of the sorption process, while for the S2-KCl reactor the increase of the
sorption percentage was gradual. In summary, the phosphorus sorption percentages of
the S1-KCl-30mmol/l and S2-KCl-30mmol/l reactors were very similar no matter if the
phosphorus concentration in the influent wastewater was 7.5 mg/l (Figure 8.20.b) or 2.5
mg/l (Figure 8.21).
The remaining sorption tests were developed with the sludge samples from the
Lüneburg WWTP (Lun-BS and Lun-RS). These sludge samples underwent previous
desorption processes using citric acid as eluents at a pH of 3, and potassium chloride
with a concentration of 30 mmol/l. The results of the Lun-BS sludge sample are shown
in Figure 8.22. As can be seen, negative sorption percentages were observed in all
reactors during the first hours of reaction. The concentrations of phosphorus released
were 12.2 mg/l for the BS-Kontrol, 103.8 mg/l for the BS-Cit and 30.4 mg/l for the BS-
KCl reactors. The BS-Cit reactor showed a constant release of phosphorus during the
sorption process, while the BS-KCl and BS-Control reactors also released phosphorus
Figure 8.21: Phosphorus sorption percentages vs reaction time for the S1-KCl, S2-KCl and
control reactors. The sludge samples underwent a previous desorption process using KCl
(30mmol/l) as eluent. The total phosphorus concentration in the influent during sorption
process was 2.5 mg/l.

177
-1200
-1000
-800
-600
-400
-200
0
0 5 10 15 20 25
Ph
osp
ho
rus
sorp
tio
n (
%)
Reaction time (h)
RS-Kontrol (%)
RS-Cit (%)
RS-KCl (%)
-3000
-2500
-2000
-1500
-1000
-500
0
0,25 0,5 0,75 24
Ph
osp
ho
rus
sorp
tio
n (
%)
Reaction time ( h)
BS-Kontrol (%)
BS-Cit (%)
BS-KCl (%)
but only during the first hour of reaction. At the end of the reaction time, the BS-KCl
and BS-Kontrol reactors recorded positive phosphorus sorption percentages of 44.1%
and 12.7%, respectively.
The results of the Lun-RS sludge sample are shown in Figure 8.23. As can be seen,
all sludge samples released phosphorus from the first hour of reaction. Negative
sorption percentages were recorded in reactors RS-Control with -443.3% (14.7 mg/l),
RS-Cit with -806.1% (63.4 mg/l), and RS-KCl with 864.1% (35.9 mg/l). Finally, at the
end of the reaction time, the RS-Cit reactor achieved the highest percentage of
phosphorus released of -1160.9% (83.3 mg/l), while the RS-KCl and RS-Control
reactors recorded positive sorption percentages of 7.2% and 76.7%, respectively.
Figure 8.22: Phosphorus sorption percentages vs reaction time for the sludge sample from the
aeration tank of the Lüneburg WWTP.
Figure 8.23: Phosphorus sorption percentages vs reaction time for the sludge sample from the
return sludge line (RS) of the Luneburg WWTP.

178
As already observed, the phosphorus release was recorded from the first hour of
sorption reaction in all reactors of the BS-Lun and RS-Lun sludge samples. This
release of phosphorus may be partly due to the phosphorus release process observed
in EBPR systems during anaerobic phase and in presence of a carbon source. As was
already mentioned, the Luneburg WWTP recorded a functional EBPR process during
the sludge sampling. Another reason that might explain the phosphorus release is the
destabilization of the sludge samples during the previous desorption process using as
eluents to citric acid and potassium chloride. The phosphorus release due to the EBPR
process, should be discussed, since the bacterial community in the Lüneburg sludge
sample is a typical EBPR community (PAO bacterial community); that means, that this
bacterial community is able to uptake VFA as carbon source during the anaerobic
phase but not to glucose directly (Kong et al ., 2004). Additionally, research by Wentzel
et al. (1991) and Oehmen et al. (2007) mentioned that sugars among other carbon
sources should be previously fermented before being assimilated by PAO
communities. For the Lüneburg sludge samples, the phosphorus release was recorded
from the first hour of the sorption process. Therefore, if previous glucose fermentation
has been considered, this fermentation process should happen during this first hour of
the sorption process. Additionally, the highest concentrations of phosphorus released
for control reactors were recorded during the first hour of the sorption process with 12.2
mg/l of phosphorus released for the BS-Control and 14.7 mg/l for the RS-Control
reactors. For the BS-Lun sludge sample, if the phosphorus release due to EBPR
processes is considered, this phosphorus release may correspond to the amount of
phosphorus released in control reactors, since this sludge sample did not underwent a
previous desorption process. Therefore, the amount of phosphorus released in control
reactors may be considered as result of the usual phosphorus release observed during
the anaerobic phase in EBPR processes. In contrast, the high concentrations of
phosphorus released in the BS-Cit, BS-KCl, RS-Cit and RS-KCl reactors may be due to
the eluent effect during the previous desorption process and also to the usual
phosphorus release observed in EBPR processes.
The differences of the phosphorus sorption percentages between the BS-KCl and RS-
KCl reactors may be explained when considering the origin of these sludge samples.
As was aforementioned, the sludge floc stability is influenced for several factors.
Among these factors, the pH and the ionic strength in mixed liquor may be influenced
by operational conditions as the TSS and DO concentrations. The BS-Lun and RS-Lun
sludge samples have undergone different operational conditions in their reactors of
origin. The origin of the BS-Lun sludge sample was the aeration tank of a WWTP with
an almost neutral pH and a TSS concentration up to 4 g/l. Meanwhile, the RS-Lun

179
sludge sample has its origin in the return sludge line of a WWTP where the sample was
exposed to anaerobic conditions in the secondary clarifier and the TSS concentration in
mixed liquor was up to 8 g/l. The anaerobic environment and the high TSS
concentration in mixed liquor may be appropriate conditions to promote a hydrolysis
process which may result in the decrease of the pH and hence destabilization of the
floc. In this study, the destabilization of the sludge samples from anaerobic
environments (return activated sludge and sludge disposal line) was observed previous
to start the experimental process. These sludge samples during the desorption process
released high amounts of phosphorus, but subsequently to re-stabilize the sludge
samples was not possible since the phosphorus release was recorded throughout the
experimental process (Table 8.14).
Table 8.14: Phosphorus concentration in the aqueous phase for the sludge samples from the
disposal sludge line of the Steinhorst WWTP (RS-Steinhorst) and from the return sludge line of
the Lüneburg WWTP (RS-Lüneburg).
Phosphorus release (mg/l)
WWTP Reactor Desorption Stabilizat. Sorption EBPR
Steinhorst RS-Cit 89.3 25.4 63.1
No RS-KCl 58.7 10.2 24.7
Lüneburg RS-Cit 103.3 33.7 88.3
Yes RS-KCl 9.6 6.9 3.5
In contrast, the DO and TSS concentrations in aeration reactors are appropriated to
maintain a stable floc structure. In consequence, the Lun-BS sludge sample was
composed for stable flocs, able to support a previous desorption process using as
eluent to potassium chloride and subsequently it was possible to re-stabilize this sludge
sample using a solution of CaCl2 and MgCl2. Finally, during the sorption process the
Lun-BS-KCl sludge sample recorded an increase of its phosphorus sorption capacity
and also an increase on the amount of phosphorus sequestered in the sludge biomass
in comparison to the initial phosphorus amount per sludge mass unit recorded (Table
8.15). The results presented below (Table 8.15) consider only the reactors which
recorded positive sorption percentages after to undergo a previous desorption process
using potassium chloride as eluents with a concentration of 30 mmol/l.

180
Table 8.15: Phosphorus sequestration capacity in mg of total phosphorus per gram of TSS
(mg/g) for the sludge samples before the desorption process (Initial P content) and at the end of
the sorption process (Final P content).
Reactor Initial P content Phosphorus
release Final P content
(mg/g) (mg/l) (mg/g)
Lun-BS-Control
23.6
0.3 24.5
Lun-BS-KCl 1.7 28.2
S1-Control
11.4
0.7 11.8
S1-KCl 0.7 15.2
S2-Control
12.8
0.4 11.9
S2-KCl 0.3 18.7
As can be seen in Table 8.15, the sludge samples in control reactors did not increase
significantly their phosphorus sequestration capacity. In contrast, the reactors which
underwent a previous desorption process using potassium chloride as eluent with
concentration of 30 mmol/l, increased their phosphorus sequestration capacity in all
cases. The S2-KCl reactor increased its phosphorus sequestration capacity in 46.1%
while an increase of about 33.3% was recorded for the S1-KCl reactor and of 19.5% for
the Lun-BS-KCl reactor.
The special case of the Lun-RS-Control reactor should be mentioned as this reactor
recorded an increase of 28.6% of its phosphorus sequestration capacity, and this
increase was not observed for the Lun-RS-KCl reactor. To explain these results it is
necessary to mention the purpose of using potassium chloride as eluent. Potassium
chloride was not used only as an eluent but also as a light destabilizer of the floc. As is
proposed in this study, this destabilization process might release, through desorption
process, some active sites on the floc surface that were previously saturated. The
increase of the free active sites on the sludge samples might increase its sorption
capacity. Another process that might destabilize the floc structure is the light hydrolysis
process observed in an anaerobic environment as for example the environment of the
RAS line (Lun-RS). In summary, the increase of the phosphorus sequestration capacity
recorded in the Lun-RS-Control reactor might be due to the fact that this sludge sample
was already slightly destabilized.
As mentioned above, the high sorption capacity of phosphorus observed in estuarine
sediments in comparison to other sediments from rivers, lakes, sea or channels (Wang

181
and Li, 2010), might be explained considering the constant and permanent ion
exchange process observed between the Ca+2 ion present in the sediment and the Na+
ion present in the aqueous phase during the tidal change. This foundament was
applied in the present study using instead of sodium chloride to potassium chloride.
Thus, using a potassium chloride concentration in mixed liquor of 30 mmol/l during the
desorption process it was possible to observe during the sorption process, positive
sorption percentages and an increase of the phosphorus sequestration capacity of the
sludge samples. It is also important to highlight that the concentration of potassium
chloride used in the desorption process was within the range of the sodium chloride
concentrations recorded in estuarine ecosystems. In contrast, the sludge samples
which underwent a desorption process using potassium chloride concentrations of 40
and 50 mmol/l in mixed liquor recorded a slight higher phosphorus desorption capacity
than using other KCl concentrations. However, these sludge samples recorded
negative sorption percentages due to the constant release of phosphorus throughout
the experimental process.
8.4.2 Relationship between the distribution coefficient (Kd) and the soil to solution ratio
The Kd coefficient relates the distribution of a chemical compound between a solid and
an aqueous phase (EPA, 1999). This coefficient may be obtained through a study of
adsorption kinetic, and in this case the coefficient is known as distribution coefficient, or
through a study of adsorption isotherms in which case the coefficient may take different
names according to the best mathematical model that explain the distribution of the
data. The aim of a study of adsorption kinetic or adsorption isotherms is to determine
the sorption potential of a substrate to remove specific chemical compounds (EPA,
1998). In the present study, the activated sludge biomass was considered as the
substrate and the total phosphorus content in a sample of synthetic wastewater was
considered the adsorbate. In this study, a linear distribution coefficient (Kd) was
calculated with the aim to perform an adsorption kinetic investigation (OECD, 2000).
The linear Kd coefficient used in this investigation, accurately describe the adsorption
behavior in soils and represents an expression of the inherent mobility of the chemical
compound in the soil. The basic equation for the linear Kd coefficient is shown below
(Equation 8.6) as the result of the ratio between the content of the chemical substance
in the solid phase and the concentration in mass units of the chemical substance in the
aqueous phase when the adsorption equilibrium was reached (Appendix 3).

182
𝐾𝑑 =𝐶𝑠
𝑎𝑑𝑠(𝑒𝑞)
𝐶𝑎𝑞𝑎𝑑𝑠(𝑒𝑞)
= (𝑚𝑠𝑎𝑑𝑠(𝑒𝑞))/𝑚𝑎𝑞
𝑎𝑑𝑠(𝑒𝑞)) ∗ (𝑉𝑜
𝑚𝑠𝑜𝑖𝑙) ………… (8.6)
where:
𝐶𝑠𝑎𝑑𝑠(𝑒𝑞) : Content of the chemical substance adsorbed on substrate at
adsorption equilibrium (mg/g).
𝐶𝑎𝑞𝑎𝑑𝑠(𝑒𝑞) : Mass concentration of the chemical substance in the aqueous
phase at adsorption equilibrium (mg/ml).
𝑚𝑠𝑎𝑑𝑠(𝑒𝑞) : Mass of the chemical substance adsorbed on substrate at adsorption
equilibrium (mg).
𝑚𝑎𝑞𝑎𝑑𝑠(𝑒𝑞) : Mass of the chemical substance in the aqueous phase at adsorption
equilibrium (mg).
𝑚𝑠𝑜𝑖𝑙 : Amount of solid phase expressed in dry mass of substrate (g).
𝑉𝑜: Initial volume of the aqueous phase in contact with the substrate
during the adsorption test (ml).
To develop an adsorption isotherm, it is required an experimental design to evaluate
the adsorption capacity of a substrate respect to a chemical compound. This
experimental design may use various substrate concentrations with a stable
concentration of the chemical compound in the aqueous phase, or may use various
concentrations of the chemical substance in the aqueous phase with a stable
concentration of substrate. Among the mathematical models that describe the
adsorption isotherms, the Freundlich model may be considered as the most widely
used to describe the adsorption processes in diluted wastewater systems (EPA, 1998).
The Kd coefficients obtained for each sludge sample and their adsorption potential may
be compared.
The Kd coefficients obtained in the adsorption kinetic study are shown in Figure 8.24,
where is possible to observe that as the reaction time passed the Kd values also
increased. As was aforementioned, upon completion the reaction time the sorption
equilibrium was not achieved since the sorption percentages continued to increase.

183
The sludge samples which underwent a previous desorption process using KCl as
eluent with a concentration in mixed liquor of 30 mmol/l recorded generally an increase
in their phosphorus sequestration capacity during the adsorption process in
comparison to the control reactors. An exception to these results was observed in the
Lun-RS-KCl reactor which recorded a very low Kd coefficient of 8.3 ml/g in comparison
to the Lun-RS-Control reactor which achieved a Kd coefficient of 332.1 ml/g.
According to the Kd coefficients obtained, the sludge samples can be arranged as
follows:
S2-KCl > Lun-RS-Control > S1-KCl > Lun-BS-KCl
471.5 ml/g 332.1 ml/g 254.8 ml/g 74.4 ml/g
In a research by Wang and Li (2010) on the phosphorus sorption capacity of different
sediments, the estuarine sediment recorded the highest phosphorus sorption capacity;
however, the Kd value achieved with this sediment was not the highest among the
substrate samples.
-100
-80
-60
-40
-20
0
20
40
60
80
100
0,01 0,25 0,5 0,75 24
Kd
(m
l/g)
Reaction time (hours)
Lun-BS-Ktrl
Lun-BS-KCl
-150
-100
-50
0
50
100
150
200
250
300
350
400
0,01 0,25 0,5 0,75 24
Kd
(m
l/g)
Reaction time (hours)
Lun-RS-Ktrl
Lun-RS-KCl
-100
0
100
200
300
400
500
0,01 0,25 0,5 0,75 24
Kd
(m
l/g)
Reaction time (hours)
S1-KCl (26.06)
S1-Ktrol (26.06)
-50
0
50
100
150
200
250
300
350
0,01 0,25 0,5 0,75 24
Kd
(m
l/g)
Reaction time (hours)
S2-KCl (26.06)
S2-Kntrl (26.06)a b
c d
Figure 8.24: Kd coefficients vs reaction time for the S1 (a), S2 (b), Lun-BS (c), and Lun-RS (d)
sludge samples.

184
8.4.3 Determination of the optimum soil to solution ratio:
The possibility to use the activated sludge biomasses as potential phosphorus
adsorbents and simultaneously to increase its phosphorus sequestration capacity was
considered. Once determined the sorption potential capacity of a sludge sample, it
might be possible to determine also the sorption percentage that may be reached if a
specific soil to solution ratio is applied. In this case, the graphics that show the relation
between the soil to solution ratios and the Kd coefficients can be used to predict the
phosphorus sorption percentages.
In a WWTP, specific soil to solution ratios should be considered since these ratios
correspond to specific TSS concentrations in each reactor. Thus, the TSS
concentration varies between 1.5 and 5 g/l during the aeration phase if the sludge
sample of a Sequencing Batch Reactor (SBR) is used and between 8 and 13 g/l for the
settled sludge of a secondary clarifier that is purged as excess sludge (Metcalf and
Eddy, 1985).
In the present study, according to the TSS concentrations it was possible to calculate
graphically what might be the maximal sorption percentages for each sludge sample.
Figure 8.25 shows the relation between the soil to solution ratios and the Kd
coefficients for the S1, S2, Lun-BS and Lun-RS sludge samples as well as their
respective control reactors.

185
0,01
0,10
1,00
0,1 1,0 10,0 100,0 1000,0So
il/so
luti
on
(g/
ml)
Kd (ml/g)
S1-KCl (22.05) S1-Kontrol
0,001
0,01
0,1
1,00 10,00 100,00 1000,00 10000,00
Soil/
Solu
tio
n (
g/m
l)
Kd (ml/g)
S2-KCl (22.05) S2-Kontrol (22.05)
0,001
0,01
0,1
1 10 100 1000 10000
Soil/
Solu
tio
n (
g/m
l)
Kd (ml/g)
S1-KCl (26.06) S1-Kontrol
0,001
0,01
0,1
0,1 1 10 100 1000 10000
Soil/
Solu
tio
n (
g/m
l)
Kd (ml/g)
S2-KCl (26.06) S2-Kontrol (26.06)
0,001
0,01
0,1
1,00 10,00 100,00 1000,00 10000,00
Soil/
Solu
tio
n (
g/m
l)
Kd (ml/g)
Lun-RS-Kontrol Lun-RS-KCl
0,001
0,01
0,1
1,00 10,00 100,00 1000,00 10000,00
Soil/
Solu
tio
n (
g/m
l)
Kd (ml/g)
Lun-BS-KCl Lun-BS-Kontrol
For the S1-KCl-2.5 and S1-Control-2.5 reactors the TSS concentration in the origin
SBR reactor was up to 5 g/l and before to undergo the desorption-stabilization-sorption
process the sludge sample was settled and decanted achieving a TSS concentration of
a
75%
50%
25%
10%
25%
10%
90%
75%
50%
25%
10%
25%
50%
75%
90%
90%
75%
50%
10%
90%
75%
10%
25%
50%
75%
90%
(d)
90%
25%
50%
25%
f e
d c
b
Figure 8.25: Soil/solution ratios vs Kd coefficients considering the potential phosphorus sorption
percentages for the S1-KCl-2.5 (a), S2-KCl-2.5 (b), S1-KCl-7.5 (c), S2-KCl-7.5 (d), Lun-BS-KCl
(e) and Lun-RS-KCl (f) reactors.

186
13 g/l or 0.013g/ml (Figure 8.25.a). Whit this amount of substrate a Kd coefficient of
254.8 ml/g and a sorption percentage of 77% was achieved for the S1-KCl reactor.
Additionally, a Kd coefficient of 5.4 ml/g and a sorption percentage of 7% was achieved
for the S1-Control reactor. These sorption percentages were the highest that may be
achieved with this sludge sample since the substrate concentration in the origin reactor
(SBR) was the highest according to Metcalf and Eddy (1995).
The difference between the Kd coefficients obtained for the S1-KCl and S2-KCl
reactors may be due to the higher phosphorus adsorption capacity of the S2-KCl
sludge sample. This higher phosphorus sorption capacity was observed when the S2-
KCl sludge sample with a TSS concentration in mixed liquor of 7.8 mg/l achieved a
phosphorus removal percentage of 78%. Similar phosphorus removal percentage was
recorded in the S1-KCl reactor but with a TSS concentration of 13 g/l. The reason why
the S1-KCl and S2-KCl sludge samples recorded different Kd coefficients may be
based in the differences observed between both bacterial communities. In both
bacterial communities the dominance of the TFO morphotype (Glucose community)
was observed. However, the S1 bacterial community showed always a considerable
amount of filamentous bacteria, generally of the gender Nostocoida (Chapter 6). The
results of the amount of phosphorus accumulated in filamentous bacteria obtained by
the SEM-EDX technology (Chapter 6.3.2) showed that this morphotype recorded the
lowest amount of phosphorus accumulated in comparison to the other morphotypes
identified i.e. TFO and cocobacillus. Therefore, if the biomass of the S1-KCl reactor
showed an important amount of filamentous bacteria then the phosphorus
sequestration capacity in this reactor might decrease in comparison to the S2-KCl
reactor.
Additionally, to increase the phosphorus sorption percentage of the control reactors
until reach the same percentage (approximately 78%) achieved in the S1-KCl or S2-
KCl reactors, it would be necessary to increase the soil to solution ratios until 0.6 g/ml
(600 g/l of TSS) for the S1-Control reactor and until 0.1 g/ml (102.9 g/l of TSS) for the
S2-Control reactor.
Figures 8.25.e and 8.25.f show the results of the sludge samples from the aeration tank
(Lun-BS) and the return sludge line (Lun-RS) of the Luneburg WWTP, respectively.
The TSS concentration in the Lun-BS sludge sample was up to 3.8 g/l and for the Lun-
RS sludge sample up to 7.8 g/l. These sludge samples were allowed to settle to
concentrate the sludge biomasses to finally obtain TSS concentrations of 9.8 g/l for the
BS-Control, 10.6 g/l for the BS-KCl, 9.7 g/l for the RS-Control, and 9.3 g/l for the RS-
KCl reactors.

187
With these TSS concentrations, Kd coefficients of 14.6 ml/g for the BS-Control and
74.4 ml/g for the BS-KCl reactors were obtained. The phosphorus sorption percentages
recorded for both reactors may be considered as the maximal reached percentages
since the TSS concentration in the origin reactor was 3.8 g/l that is close to the
maximal value of TSS described for aeration tanks in complete mixing activated sludge
systems (Metclaf and Eddy, 1995). The BS-Control reactor might reach a similar
phosphorus sorption percentage than the BS-KCl reactor when increase its soil to
solution ratio to more than 0.08 g/ml or 80 g/l.
Figure 8.25.f shows the results for the sludge sample from the return sludge line of the
Luneburg WWTP. With a Kd coefficient of 332.1 ml/g and a soil to solution ratio of
0.0097 g/ml (9.7 g/l) the sorption percentage achieved for the RS-Control reactor was
of 76.7% at the end of the reaction time. The maximal TSS concentration for the return
sludge line is 13 g/l according to Metcalf and Eddy (1995) therefore, it is possible to
determine graphically that when increasing the soil to solution ratio to 0.0013 g/ml, the
new phosphorus sorption percentage may be greater than 80% considering that the Kd
is the same.

188
8.5 Conclusions:
1. In desorption processes of phosphorus in activated sludge samples, good
desorption results may be obtained when citric acid is used as the eluent at a
desorption pH of 3.
2. In desorption processes of phosphorus in activated sludge samples able to
perform EBPR processes, the phosphorus release to supernatant may be due
to the effect of the eluent during the desorption process and/or due to the
phosphorus release observed in EBPR bacterial communities under anaerobic
conditions and when a carbon source is present.
3. The most influential factors on the phosphorus release during the desorption
processes are the type of eluent applied, the pH of desorption, and the type of
microbial community in the sludge samples.
4. Desorption processes that use potassium chloride as eluent may increase the
desorption performance when the sludge samples are previously destabilized,
for example, samples from static, anaerobic and slightly acid environments (e.g.
sludge samples from the RAS line).
5. The most influential factors on the phosphorus sorption capacity of activated
sludge samples are related to the characteristics of the source of the sludge
biomass. In this research, the following characteristics of the source were taken
into account: the type of wastewater treatment, the origin reactor and the
general characteristics of the influent wastewater.
6. The phosphorus sorption percentages and the Kd coefficients achieved were
higher in the S2 and S1 bacterial communities which were dominated by the
TFO morphotype.
The phosphorus sorption capacity of a sludge sample may be related also to
the abundance of the TFO morphotype in the bacterial community.
7. Other factor influencing the phosphorus sorption capacity of activated sludge
samples is related to the structural stability of the floc. In this research, the
capacity of a sludge sample to bear a desorption process and subsequently be

189
used successfully as sorbent was related with the presence of stable flocs in
the sludge sample.
8. The phosphorus sorption capacity of activated sludge samples able to perform
EBPR processes, may be improved when previously the sludge sample is
subjected to desorption processes using potassium chloride as eluent with a
concentration of 30 mmol/l in mixed liquor and subsequently being subjected to
stabilization processes using a solution of CaCl2 and MgCl2 with concentrations
of 5 mg/l and 10 mg/l, respectively.

190
8.6 References
Blackall, L.L., Crocetti, G.R., Saunders, A.M., and Bond, P.L. (2002) A review and
update of the microbiology of enhanced biological phosphorus removal in
wastewater treatment plants. Antonie van Leeuwenhoek 81: 681-691.
Brdjanovic, D., Slamet, A., van Loosdrecht, M.C.M., Hooijmans, C.M., Alaerts, G.J.,
and Heijnen, J.J. (1998) Impact of excessive aeration on biological phosphorus
removal from wastewater. Water Research 32(1):200–208.
Bruus, J.H., Nielsen, P.H., and Keiding, K. (1992) On the stability of activated sludge
flocs with implications to dewatering. Water Research 26: 1597-1604.
Carucci, A., Kuhni, M., Brun, R., Carucci, G., Koch, G., Majone, M., et al. (1999)
Microbial competition for the organic substrates and its impact on EBPR
systems under conditions of changing carbon feed. Water Science and
Technology 39(1):75– 85.
Cloete, T.E., and Oosthuizen, D.J. (2001) The role of extracellular exopolymers in the
removal of phosphorus from activated sludge. Water Research 35 (15): 3595-
3598.
EPA - United States Environmental Protection Agency (1998) Fate, Transport and
Transformation Test Guidelines OPPTS 835.1110 Activated Sludge Sorption
Isotherm. Prevention, Pesticides and Toxic Substances (7101).
EPA – United States Environmental Protection Agency (1999) Understanding Variation
in Partition Coefficient, kd, values. EPA 402-R-99-004A.
Goodwin, J.A.S., and Forster, C.F. (1985) A further examination into the composition of
activated sludge surface in relation to their settlement characteristics. Water
Research 19: 527-533.
Grupo de investigación de recursos hídricos – IUPA, (2009) Lección 17: Procesos de
adsorción. Universidad Jaume I de Castellón, España.
Hartley, K.J., and Sickerdick, L. (1994) Performance of Australian BNR plants. In:
Second Australian Conference on Biological Nutrient Removal, 4–6 October,
Albury, Victoria, pp. 65–73.
Higgins, M.J., and Novak, J.T. (1997) Characterization of extracellular protein and its
role in bioflocculation. Journal of Environmental Engineering 123: 479-485.

191
Hongthanat, N. (2010) Phosphorus sorption-desorption of soils and sediments in the
Rathbun Lake watershed. (Graduate Theses and Dissertations). Graduate
College at Digital Repository- Iowa State University. Iowa, USA.
Keiding, K., and Nielsen, P.H. (1997) Desorption of organic macromolecules from
activated sludge: effect of ionic composition. Water Research 31(7): 1665-1672.
Kong, Y.H., Nielsen, J.L., and Nielsen, P.H. (2004) Microautoradiographic study of
Rhodocyclus-Related polyphosphate-accumulating bacteria in full-scale
enhanced biological phosphorus removal plants. Applied and Environmental
Microbiology 70 (9): 5383–5390.
Kuczajowska-Zadrozna, M., Klimiuk, E., and Wojnowska-Baryla, I. (2004) Cyclical
cadmium adsorption and desorption by activated sludge immobilized on
alginate carriers. Polish Journal of Environmental Studies 13(2): 161-169.
Kunst, S., Helmer, C., and Knoop, S. (2000) Betriebsprobleme auf Kläranlagen durch
Blähschlamm, Schwimmschlamm, Schaum. Springer-Verlag.
Lin, C., and Banin, A. (2005) Effect of long-term effluent recharge on phosphate
sorption by soils in a wastewater reclamation plant. Water, Air, and Soil
Pollution 164:257–273.
Lin, C., Wang, Z., He, M., Li, Y., Liu, R., and Yang, Z. (2009) Phosphorus sorption and
fraction characteristics in the upper, middle and low reach sediments of the
Daliao river systems, China. Journal of Hazardous Materials 170:278–285.
Liu, Y., Xue, G., Yu, S., and Zhao, F. (2006) Role of extracellular exopolymers on
biological phosphorus removal. Journal of Environmental Science 18(4): 670-
674.
Mayer, C., Moritz, R., Kirschner, C., Borchard, W., Maibaum, R., Wingender, J., and
Flemming, H.C. (1999) The role of intermolecular interactions: Studies on model
systems for bacterial biofilms. International Journal of Biological
Macromolecules 26: 3-16.
Metcalf and Eddy, Inc. (1995) Ingeniería de Aguas Residuales. Tratamiento, vertido y
reutilización. Ed. Mc Graw Hill Interamericana de España S.A., Madrid.

192
Müller, E. (2006) Bacteria and Extracellular Polymeric Substances in Activated Sludge
Scum Formation. (Doctoral thesis). Technischen Universität München.
Germany.
OECD, (2000) OECD Guideline 106. Guideline for the testing of chemicals: Adsorption-
desorption using a batch equilibrium method.
Oehmen, A., Lemos, P.C., Carvalho, G., Yuan, Z., Keller, J., Blackall, L.L., and Reis,
M.A.M. (2007) Advances in enhanced biological phosphorus removal from
micro to macro scale. Water Research 41: 2271-2300.
Seviour, R.J., Mino, T., and Onuki, M. (2003) The microbiology of biological
phosphorus removal in activated sludge systems. FEMS Microbiology Reviews
27: 99-127.
Wang, Q., and Li, Y. (2010) Phosphorus adsorption and desorption behavior on
sediments of different origins. Journal of Soils and Sediments 10: 1159-1173.
Wentzel, M.C., Ekama, G.A., and Marais, G.V.R. (1991) Kinetics of nitrification
denitrification biological excess phosphorus removal systems – a review. Water
Science and Technology 23(4-6): 555-565.
Wentzel, M.C., Lötter, L.H., Ekama, G.A., Loewenthal, R.E., and Marais, G.V.R.
(1991b) Evaluation of biochemical models for biological excess phosphorus
removal. Water Science and Technology 23(4-6): 567-576.
WERF- Water Environment Research Foundation (n.d). Tertiary Phosphorus Removal.
Available online: http://www.google.com.mx/url?sa=t&rct=j&q=&esrc=s&
source=web&cd=1&ved=0CBwQFjAA&url=http%3A%2F%2Fwww.werf.org%2F
c%2FKnowledgeAreas%2FNutrientRemoval%2Fcompendium%2F06-
Tertiary_Phosphorus_Removal.aspx&ei=OgiBVKnHBsbiO4CJgbgI&usg=AFQjC
NGYkvCbb6ipqgAHmtKuZ21VKyYi0Q&bvm=bv.80642063,d.ZWU.
Wilen, B. M., Jin, B., and Lant, P. (2003) The influence of key chemical constituents in
activated sludge on surface and flocculating properties. Water Research 37:
2127-2139.
Ye, X., Cai, M., Wu, S., and Liu, L. (2011) Study on biosorption and desorption of
copper-containing wastewater by anaerobic granular sludge. Computer
Distributed Control and Intelligent Environmental Monitoring, International
Conference on 01/2011; DOI: 10.1109/CDCIEM.2011.476.

193
Yu, X., Qi, Z., Zhang, X., Yu, P., Liu, B., Zhang, L., and Fu, L. (2007) Nitrogen loss and
oxygen paradox in full-scale biofiltration for drinking water treatment. Water
Research 41: 1455–1464.
Zita, A., and Hermansson, M. (1994) Effects of ionic strength on bacterial adhesion and
stability of flocs in a wastewater activated sludge system. Applied and
Environmental Microbiology 60: 3041-3048.

194
CHAPTER 9: Bacterial survival assessment in activated sludge samples subjected to desorption – sorption processes
9.1 Introduction
The desorption-stabilization-sorption tests (Chapter 8) were performed with the aim of
determining the desorption and sorption capacity of phosphorus of different sludge
samples.
It was considered the possibility to reuse sludge samples with high phosphorus
sorption capacity. Therefore, the assessment of the bacterial survival rates in the
activated sludge samples was also of interest.
With the aim of evaluating the survival capacity of the bacterial communities in the
activated sludge samples, the count of viable microorganisms by the Plate Count -
Agar Pour Plate technique was used. This technique was recommended for water
samples and wastewater analysis (US FDA, 2014). Using this method, the number of
colonies is counted as bacterial colony forming units (CFU/ml) after to inoculate a given
volume of diluted or undiluted sample in a determined nutrient medium. Then, this
bacterial culture will be incubated at a given temperature during a specific time period.
The results are presented as colony forming units per milliliter of initial sample (CFU /
ml).
The current methodology for estimating viable biomass parameters, including the
concentration of viable microorganisms, comprise microbiological techniques such as
culture media (Plate Count, NMP-Most Probable Number), staining techniques -
counting of viable microorganism (Trypan Blue), biomolecular tests as DNA analysis,
Fluorescence in Situ Hybridization (FISH), probes of fluorescents sequences for
ribosomal RNA and ribosomal DNA (Oosthuizen, 2001).
The results of these techniques are not conclusive. For example, for a sample of
activated sludge, high percentages (> 90%) of Acinetobacter, using the technique of
Plate Count, were reported, while for the same type of sample, FISH technique showed
only small amounts of this gender (3 - 6%) (Atkinson, 1999).
The Plate Count Technique may underestimate the concentration of viable
microoganisms, because several factors such as the selectivity of the culture medium,
the temperature of application of the medium (45°C) and because the difficulties to
homogenize the sludge sample.

195
Despite these constraints, the Plate Count – Agar Pour Plate technique may be used to
count viable microorganisms in activated sludge samples as the results will be
comparable.
To assess the bacterial survival rates of the sludge samples, the concentration of
microorganisms (CFU/ml) before and after the desorption-stabilization-sorption process
are compared.
.

196
9.2 Materials and methods
9.2.1 Sampling
The sludge samples were taken at the end of the desorption-stabilization-sorption
process (Chapter 8) and immediately transported to the microbiology laboratory to be
evaluated using the Plate Count – Agar Pour Plate technique.
Each survival test was labeled with the initials of the eluents used in the previous
desorption process, and the name of the source reactor. Table 9.1 shows the sludge
samples or reactors and the eluents used for each sample.
During the desorption process, the following eluents were used: citric acid (Cit),
sulphuric acid (SO), hydrochloric acid (HCl), and potassium chloride (KCl).
Table 9.1: Number of repetitions in the Plate Count test according to the eluents and reactors
used during the desorption process.
Desorption pH pH = 2,3,4 pH = 2,3,4 pH = 2,3,4 20,30,40
mmol/l of KCl
Eluent
Sludge sample
Control Acetic
acid
Sulphuric
acid
Hydrochloric
acid
Potassium
chloride
Reactors
S1 2 2 2 2 2
S2 2 2 2 2 2
B2 2 2 - - 2
B4 2 2 - - 2
Steinhorst WWTP 2 2 - - 2
BS 2 2 - - 2
BR 2 2 - - 2
Lüneburg WWTP 2 2 - - 2
BS 2 2 - - 2
BR 2 2 - - 2

197
9.2.2 Plate Count – Agar Pour Plate method
The culture medium was the Agar Plate Count (APHA, ISO 4833:2003 - Karl Roth).
The dilutions were performed using sterile water until a dilution factor of 10-5 for each
sludge sample. Subsequently, 1 ml of the dilutions 10-4 and 10-5 were plated separately
with about 15 ml of the fluidized medium. Then, the sample and the fluidized medium
were mixed by gentle agitation of the plate. Each sample dilution was plated by
duplicate (US FDA, 2014).
The culture medium was left to solidify at room temperature and then incubated at
37°C. The counting of the colony forming units (CFU) was performed at the end of 24
hours and 48 hours after starting the incubation.
For colony counting, the plates with 25-250 colonies were selected and counted
including those of pinpoint size.
If the plates from all dilutions exceed the 250 colonies, count colonies in
representative portions of the plates and estimate the total.
If plates from all dilutions reported less than 25 colonies, report the colonies
number with the lowest dilution.
The results are obtained multiplying the number of colonies by the dilution factor. If
consecutive dilutions yield 25-250 colonies, the counting should be performed using
the Formula 9.1 (US FDA, 2014).
𝑁 =(Ʃ 𝐶)
((1∗𝑛1)+ (0.1∗𝑛2)) 𝑑 ………. (9.1)
where:
N: Number of colonies per milliliter
Ʃ C: Sum of all colonies in all plates counted
n 1: Plates number in the lowest dilution counted
n 2 : Plates number in the next highest dilution counted.
d: Dilution in the first count obtained.

198
The survival percentage was calculated considering the initial microorganism
concentration in the sludge samples, i.e. the concentration before the desorption-
stabilization-sorption process, and comparing these results with the concentration
obtained at the end of the sorption process.
9.3. Results and discussion
9.3.1 Survival percentage of bacterial communities at the end of the desorption-stabilization-sorption processes.
The results of viable microorganisms concentration (CFU/ml) and survival percentage
before starting the desorption process (control sample) and after the sorption process
are shown below.
The S1 reactor showed an initial concentration of 33 x 105 CFU/ml (Table 9.2). After
the desorption-stabilization-sorption process at a pH of 2, the concentration of
microorganisms showed a survival rate of about 4% when acid eluents were used. For
the sludge samples that underwent desorption process using KCl as eluent, the
survival percentage was 6%. At the end of the experimental process at a pH of 3, an
increase in the survival rate was recorded, and even percentages of bacterial growth in
the S1-SO (112 %) and S1-KCl (152%) reactors. At the end of the experimental
process at a pH of 4, some bacterial populations showed a gradual increase of the
survival percentages according to the increase of the pH (S1-Cit and S1-KCl). It was
expected the increase of the bacterial concentration according to the pH increase, but
for the S1- SO and S1- HCl reactors the highest percentages of survival were obtained
at a pH of 3. In order to explain this fact, the different TSS concentrations of the sludge
samples at the end of the sorption process should be considered. Additionally, for the
S1-SO reactor, the use of sulphuric acid as eluent may result in the development of
sulphur oxidising bacteria, as this microorganisms are able to oxidize reduced
inorganic sulphur compounds (H2S, 𝑆2𝑂32− ) or elemental sulphur (Seviour and Nielsen,
2010).

199
Table 9.2: Bacterial survival results in CFU/ml and in percentage for the S1 sludge sample.
The S2 sludge sample recorded an initial concentration of 238 x 105 CFU/ml (Table
9.3). After the desorption(pH=2)-stabilization-sorption process survival percentages
ranging between 10.5% and 13.4% were recorded in case of reactors that used acid
eluents. For the S2-KCl reactor the survival percentage was about 30% at the end of
the experimental process. At the end of the desorption(pH=3)-stabilization-sorption
process the sludge samples showed an increase in the survival percentages, recording
population growth percentages up to 152% for the S2-SO reactor. Finally, at the end of
the desorption(pH=4)-stabilization-sorption process, a gradual increase in the survival
percentage of the S2-Cit reactor was observed, while the S2-SO and S2-HCl reactors
showed the highest survival percentages at a pH of 3. The S2-KCl reactors showed low
survival percentages in all cases. The survival percentages for the S1-Control and S2-
Control reactors ranged between 42% and 55%.
Table 9.3: Bacterial survival results in CFU/ml and in percentage for the S2 sludge sample.
M.O concentration (CFU/ml) at Dilution 10-5
Sludge
sample
Initial
concent. pH
Citric
acid H2SO4 HCl KCl Control
S2 238x105
2 32 30 25 71 122
% survival 13.4 12.6 10.5 29.8 51.3
3 206 362 166 34 116
%survival 87.0 152.0 70.0 14.0 49.0
4 196 60 115 57 99
%survival 82.0 25.0 48.0 24.0 42.0
M.O concentration (CFU/ml) at dilution 10-5
Sludge sample
Initial concent.
pH Citric acid H2SO4 HCl KCl Control
S1 33x105
2 1.5 1 1 2 15
% survival 4.5 3.0 3.0 6.1 45.0
3 1 37 14 50 18
% survival 3.0 112.0 42.0 152.0 55.0
4 9 3 6 42 16
% survival 27.0 9.0 18.0 127.0 48.0

200
The remaining processes of desorption-stabilization-sorption were performed for the B2
and B4 sludge samples, using as eluents to citric acid at desorption pH of 3 and 4, and
potassium chloride with eluent concentrations of 30 mmol/l and 40 mmol/l. For the
sludge samples from Steinhorst and Lüneburg WWTPs the desorption-stabilization-
sorption processes were performed using as eluents to citric acid with a desorption pH
of 3 and potassium chloride concentration of 30 mmol/l.
The B2 sludge sample recorded an initial concentration of 28 x 105 CFU/ml. After the
desorption(pH=3)-stabilization-sorption process, the survival percentages recorded
bacterial growth up to 204% for the B2-Cit reactor.
Finally, at the end of the desorption(pH=4)-stabilization-sorption process no bacterial
growth was recorded in any case.
Table 9.4: Bacterial survival results in CFU/ml and in percentage for the B2 sludge sample.
M.O concentration (CFU/ml) at Dilution 10-5
Sludge sample
Initial concent.
pH Citric acid KCl Control
B2 28x105
3 57 3 16
%survival 204 11 57
4 14 3 15
%survival 50 11 54
The B4 sludge sample recorded an initial concentration of 164 x 105 CFU / ml (Table
9.5). As for the B2 sludge sample, after the desorption(pH=3)-stabilization-sorption
process the B4 sludge sample recorded a considerable bacterial growth up to 1234%
for the B4-Cit reactor, while for the B4-KCl reactor the survival percentage was 2%.
At the end of the desorption(pH=4)-stabilization-sorption process the bacterial
community in the B4-Cit reactor continued showing population growth but this time of
only 183%, while for the B4-KCl reactor a survival rate of 2% was recorded. For the B2-
Control and B4-Control sludge samples, the survival percentages ranged between 43%
and 57%.

201
Table 9.5: Bacterial survival results in CFU/ml and in percentage for the B4 sludge sample.
M.O concentration (CFU/ml) at Dilution 10-5
Sludge sample
Initial concent.
pH Citric acid KCl Control
B4 164x105
3 2024 4 79
%survival 1234 2 48
4 300 4 71
%survival 183 2 43
The bacterial survival rates were also evaluated in samples from the aeration tank (BS)
and sludge disposal line (RS) of the Steinhorst WWTP and from the aeration tank (BS)
and return sludge line (RS) of the Lüneburg WWTP.
The sludge sample from the Steinhorst WWTP recorded an initial concentration in the
aeration tank of about 11 x 105 CFU/ml and in the sludge disposal line of about 19x105
CFU/ml (Table 9.6). After the desorption(pH=3)-stabilization-sorption process, the St-
BS-Cit reactor recorded a bacterial growth up to 1045%, while the St-BS-KCl reactor
showed a survival rate of 64%. Meanwhile, the return sludge sample (RS) recorded
bacterial growth rate up to 4342% for the St-RS-Cit reactor and of 132% for the St-RS-
KCl reactor. The control reactors recorded around 50% of bacterial survival.
Table 9.6: Bacterial survival results in CFU/ml and in percentage for the Steinhorst WWTP
sludge sample.
M.O concentration (CFU/ml) at dilution 10-5
Sludge sample
Initial concent.
Reactor Citric acid KCl Control
Steinhorst
(St)
11x105 BS 126 7 5
%survival 1145 64 47
19x105 RS 844 44 10
%survival 4442 232 53
The sludge sample from the Lüneburg WWTP recorded an initial concentration in the
aeration tank of about 8x10⁵ CFU/ml and in the return sludge line of about 12x105
CFU/ml (Table 9.7).
After the desorption(pH=3)-stabilization-sorption process, bacterial growth of
approximately 688% was recorded for the Lu-BS-Cit reactor and a survival percentage
of 75% for the Lu-BS-KCl reactor. Similar percentage of bacterial growth was recorded

202
1
10
100
1000
10000
1 2 3 4 5
Surv
ival
(%
)
pH during desorption process
S1
S2
B2
B4
Steinhorst - BS
Steinhorst - RS
Lüneburg - BS
Lüneburg - RS
for the Lu-RS-Cit reactor (500%) while for the Lu-RS-KCl reactor a survival rate of 75%
was recorded. The survival percentage for the control reactors ranged between 42%
and 50%.
Table 9.7: Bacterial survival results in CFU/ml and in percentage for the Lüneburg WWTP
sludge samples.
M.O concentration (CFU/ml) at dilution 10-5
Sludge sample
Initial concent
Reactor Citric acid KCl Control
Lüneburg
8x10⁵ BS 63 6 4
%survival 788 75 50
12x105 RS 72 9 5
%survival 600 75 42
Figure 9.1 shows the survival percentages in relation to the desorption pH. For the
sludge samples that underwent a desorption process using citric, sulphuric and
hydrochloric acids at pH of 3 were recorded the highest values of survival percentages.
After the desorption(pH=3)-stabilization-sorption process with citric acid, the S1 and S2
sludge samples recorded the lowest survival percentages (S1 = 3% and S2 =87%).
However, with this eluent, other biomasses showed bacterial growth as for example the
St-RS-Cit reactor (4342%). The high survival percentages and bacterial growth
obtained using citric acid as eluent was one of the reasons to use this eluent in the
remaining desorption-stabilization-sorption processes.
Figure 9.1: Bacterial survival percentages after the desorption-stabilization-sorption process
using citric acid as eluent during the desorption process.

203
0
20
40
60
80
100
120
140
160
1 2 3 4 5
Bac
teri
al S
urv
ival
(%
)
pH
S1
S2
0
10
20
30
40
50
60
70
80
1 2 3 4 5
Bac
teri
al S
urv
ival
(%
)
pH
S1
S2
The desorption-stabilization-sorption processes that used hydrochloric and sulphuric
acid as eluents were performed only with the S1 and S2 sludge samples at pH 2, 3 and
4.
At the end of the desorption(pH=3)-stabilization-sorption process using sulphuric acid
as eluent (Figure 9.2.a), the S1 and S2 reactors recorded bacterial growth of about
12% and 52%, respectively. Meanwhile, at the end of the experimental process using
hydrochloric acid as eluent (Figure 9.2.b), none of the two reactors recorded bacterial
growth, but survival rates of 41% and 70% for the S1 and S2 reactors, respectively.
At the end of the experimental process using potassium chloride as eluent during the
desorption process (Figure 9.3.a) bacterial growth was not recorded in any case, but
with an eluent concentration of 30 mmol/l the survival percentages remained almost
constant for the Lu-BS-KCl and Lu-RS-KCl reactors in comparison to their initial
bacterial concentration.
For the control reactors (Figure 9.3.b) the survival percentages in all cases showed
values of approximately 50%, considering that these reactors did not receive eluents
solutions.
Figure 9.2: Bacterial survival percentages for the S1 and S2 sludge samples after the
desorption-stabilization-sorption process using sulphuric acid (a) and hydrochloric acid (b) as
eluents during the desorption process.
a b

204
In summary, after the completion of the desorption-stabilization-sorption processes, the
best bacterial survival results were obtained using citric acid and sulphuric acid as
eluents at a pH of 3.
30
35
40
45
50
55
60
Control 2 Control 3 Control 4
Surv
ival
Pe
rce
nta
ge (
%)
S1 S2 B2
B4 Steinhorst - BS Steinhorst - RS
Lüneburg - BS Lüneburg - RS
1
10
100
1000
20 30 40
Surv
ival
Pe
rce
nta
ge (
%)
KCl (mmol/L)
S1 S2 B2
B4 Steinhorst - BS Steinhorst - RS
Lüneburg - BS Lüneburg - RS
Figure 9.3: Bacterial survival percentage for control reactors and after the desorption-
stabilization-sorption process using potassium chloride as eluent

205
9.4 Conclusions
1. The highest survival percentages and bacterial growth rates at the end of the
desorption-stabilization-sorption processes were reached for sludge samples
with typical EBPR bacterial communities that underwent desorption processes
using citric acid as eluent at a pH of 3.
The mentioned bacterial communities might be able to uptake citric acid as
carbon source during the desorption process resulting in a considerable
bacterial growth increase. The highest survival and growing rates observed at a
pH of 3 indicate that this pH resulted not so aggressive to stop the bacterial
metabolism and, at the same time, that this concentration of citric acid covered
the metabolic requirements of the bacterial communities to increase their
concentrations.
2. The S1 and S2 sludge samples did not show bacterial growth after the
desorption-stabilization-sorption process at any pH or with any eluent.
3. The average survival percentages reached in control reactors were
approximately 50%. The decrease of the bacterial concentration may be due to
the exponential death phase observed when the bacterial communities
underwent long periods (24-36 hours) without a carbon source.

206
9.5 References
Atkinson, B.W. (1999) Identification of polyphosphate accumulating bacteria from a
pilot and full-scale nutrient removal activated sludge. (Master Thesis).
Department of Biotechnology - Technikon Natal. Durban, South Africa.
Oosthuizen, D.J. (2001) The role of activated sludge extracellular polymers and aerobic
biomass in the removal of phosphorus from wastewater. (Master Thesis).
University of Pretoria. South Africa.
Seviour, R., and Nielsen, P.H. (2010) Microbial Ecology of Activated Sludge. London,
UK: IWA Publishing.
US FDA, (2014) FORM FDA 2400a Standard Plate Count and Coliform Plate Count
Rev. 4/12 (FDA—2400 Series). US Food and Drug Administration. Available
online:http://agriculture.vermont.gov/sites/ag/files/pdf/lab/2400a%20Standard%
20and%20Coliform%20Plate%20Count%20Rev%204-12.pdf.

207
CHAPTER 10: Conclusions
1. Good and stable VFA production (328 mg/l) may be obtained in glucose
fermentation reactors when the HRT (12 hours) is controlled to avoid the
development of methanogenic bacteria and when the F/M ratio is maintained
under values (0.4 gCOD/gTSS.cycle) that not promote the overdevelopment of
the bacterial community and therefore avoid the consumption of the VFA as
carbon source.
This conclusion considered the amount of VFA produced per gram of COD
consumed that recorded a maximum value of 0.722 gVFA/gCOD.
2. The bacterial communities TFO and EBPR showed different bacterial structure.
While the TFO community was dominated by the TFO morphotype, the EBPR
bacterial community showed a mixed microbial composition without dominance
of a specific morphotype. However, both bacterial communities recorded good
and stable EBPR processes. The effluents obtained with both bacterial
communities recorded total phosphorus concentrations of less than 1 mg/l and
the results of the staining techniques confirmed the storing and release of
polymers typical of the EBPR process during the anaerobic and aerobic
phases. The highest differences of phosphorus removal performance between
the bacterial communities, were recorded when the C: N: P ratio in the influent
was adverse for the EBPR process (18.1:1.9:1) to subsequently the more
suitable was the C: N: P ratio in the influent (45.2:4:1), the phosphorus removal
performance between reactors became more similar regardless the carbon
source used. At this point all the reactors reached a total phosphorus
concentration of less than 0.5 mg/l in the effluent.
It is possible to obtain bacterial communities in activated sludge samples with
different microbiological characteristics able to perform efficient and stable
EBPR processes.
3. During the phosphorus desorption test the best desorption performance were
obtained with the sludge samples corresponding to the EBPR bacterial
community and using to citric acid as eluent with a desorption pH of 3. The
highest phosphorus desorption performance (70.3%) was reached with the
Lüneburg-WWTP sludge sample with a maximum phosphorus release up to
130.3 mg/l. Additionally, with this sludge sample the highest concentration of
208
phosphorus released per gram of sludge dry mass was recorded (16.8
mgP/gTSS). However, the phosphorus release to the aqueous phase observed
during the desorption process would correspond not only to the eluent effect of
the citric acid but also to the typical phosphorus release observed in the EBPR
process under anaerobic conditions and in presence of a carbon source.
During desorption processes of phosphorus in activated sludge samples, the
release of phosphorus to the aqueous phase due to the EBPR process should
be also considered combined to the phosphorus release due to the eluents
effect.
4. The most influential factors on the phosphorus desorption process of an
activated sludge sample are the type of bacterial community present, the eluent
used, the desorption pH and the environmental conditions of the origin reactor.
In summary, the phosphorus release performance may be increased when the
activated sludge mass corresponds to an EBPR bacterial community, using to
citric acid as eluent, with a desorption pH of 3 and when the sludge sample
previously underwent anaerobic, slightly acid and static conditions in its origin
reactor.
5. At the end of the desorption-stabilization-sorption processes the sludge
samples underwent a survival test. The highest survival rates and even
bacterial growth rates were recorded in the EBPR bacterial communities which
underwent previous desorption processes using to citric acid as eluent.
From this result it is possible to conclude that the EBPR bacterial community is
able to use the citric acid as carbon source under anaerobic conditions but this
capacity is not reported for the glucose-TFO bacterial community.
6. The highest phosphorus sorption capacity were recorded in the S1, S2 and
Lüneburg-BS activated sludge samples which correspond to the TFO, TFO +
filamentous and mixed EBPR bacterial communities, respectively. The highest
phosphorus sorption percentage (78.6%) was reached in the S2-KCl reactor
(TFO bacterial community) and considering the initial phosphorus concentration
in the mixed liquor. The phosphorus adsorbed per mass of total solids was up
to 0.23 mgPtot/gTSS. Apparently, the phosphorus sorption capacity of an

209
activated sludge sample would be directly related to the abundance of the TFO
morphotype.
7. The phosphorus sorption capacity of an EBPR - activated sludge sample may
be improved when previously to the sorption process the sludge sample
undergoes a desorption process using to potassium chloride as eluent with a
concentration of 30 mmol/l and subsequently a stabilization process using a
MgCl2 and CaCl2 solution with 10 and 5 mg/l respectively. Thus, considering the
initial phosphorus concentration (before the desorption process) the Lüneburg-
KCl sludge sample increased in 19.5% its phosphorus concentration while the
S2-KCl sludge sample increased its phosphorus concentration in 46.1% at the
end of the sorption process.
8. The phosphorus sorption capacity of an EBPR - activated sludge sample would
be influenced by:
The dominant bacterial community in the sludge sample since the
highest phosphorus sorption performance was recorded when the
dominant bacterial morphotype was the TFO.
The floc stability in the sludge sample which was influenced by the
environmental conditions of the origin reactor. Apparently, sludge
samples from anaerobic, static and slightly acid environments would
present destabilized flocs that cannot be used as substrate in sorption
processes.

210
APPENDIX
APPENDIX 1: Calculation of the apparent desorption coefficient (Kdes) using the batch equilibrium method in activated sludge samples

211

212
APPENDIX 2: RELATIONSHIP BETWEEN THE SOIL/SOLUTION RATIO, DESORPTION PERCENTAGE (Deq) AND APPARENT DESORPTION COEFFICIENT (Kdes) IN A LOGARITHMIC LINEAR EQUATION

213

214

215
APPENDIX 3: Calculation of the distribution coefficient (Kd) using the batch equilibrium method in activated sludge samples.
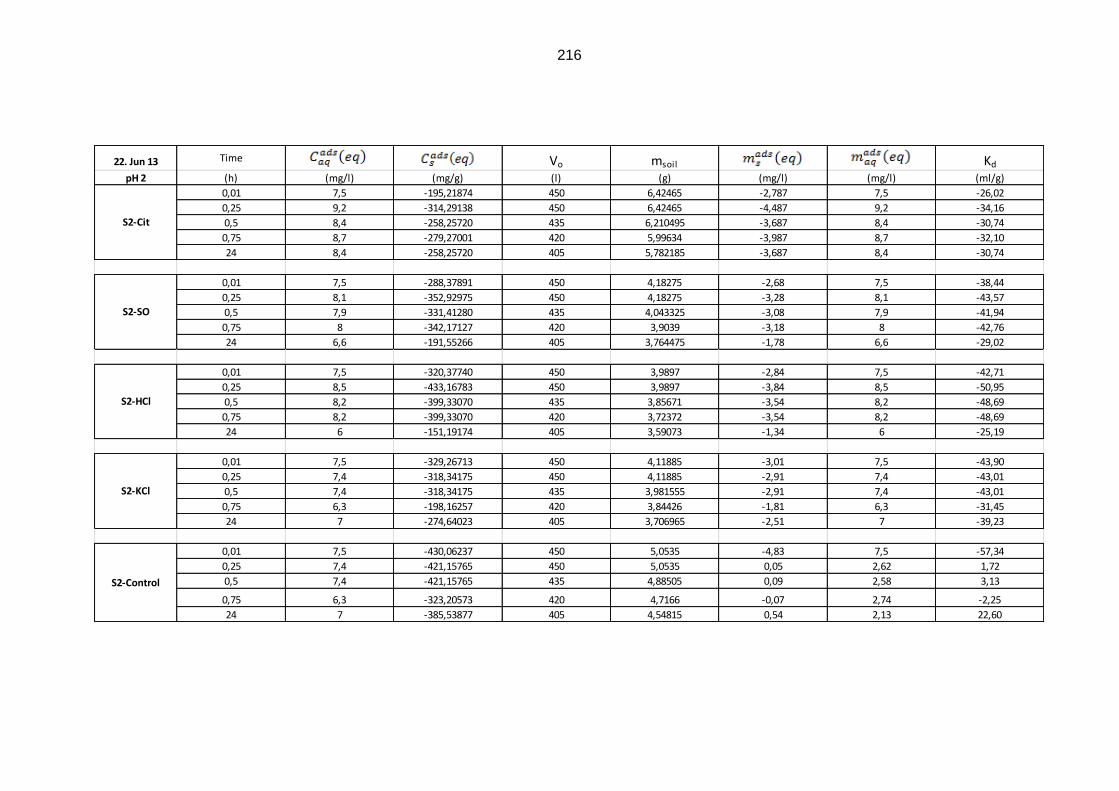
216
22. Jun 13 Time Vo msoil Kd
pH 2 (h) (mg/l) (mg/g) (l) (g) (mg/l) (mg/l) (ml/g)
0,01 7,5 -195,21874 450 6,42465 -2,787 7,5 -26,02
0,25 9,2 -314,29138 450 6,42465 -4,487 9,2 -34,16
0,5 8,4 -258,25720 435 6,210495 -3,687 8,4 -30,74
0,75 8,7 -279,27001 420 5,99634 -3,987 8,7 -32,10
24 8,4 -258,25720 405 5,782185 -3,687 8,4 -30,74
0,01 7,5 -288,37891 450 4,18275 -2,68 7,5 -38,44
0,25 8,1 -352,92975 450 4,18275 -3,28 8,1 -43,57
0,5 7,9 -331,41280 435 4,043325 -3,08 7,9 -41,94
0,75 8 -342,17127 420 3,9039 -3,18 8 -42,76
24 6,6 -191,55266 405 3,764475 -1,78 6,6 -29,02
0,01 7,5 -320,37740 450 3,9897 -2,84 7,5 -42,71
0,25 8,5 -433,16783 450 3,9897 -3,84 8,5 -50,95
0,5 8,2 -399,33070 435 3,85671 -3,54 8,2 -48,69
0,75 8,2 -399,33070 420 3,72372 -3,54 8,2 -48,69
24 6 -151,19174 405 3,59073 -1,34 6 -25,19
0,01 7,5 -329,26713 450 4,11885 -3,01 7,5 -43,90
0,25 7,4 -318,34175 450 4,11885 -2,91 7,4 -43,01
0,5 7,4 -318,34175 435 3,981555 -2,91 7,4 -43,01
0,75 6,3 -198,16257 420 3,84426 -1,81 6,3 -31,45
24 7 -274,64023 405 3,706965 -2,51 7 -39,23
0,01 7,5 -430,06237 450 5,0535 -4,83 7,5 -57,34
0,25 7,4 -421,15765 450 5,0535 0,05 2,62 1,72
0,5 7,4 -421,15765 435 4,88505 0,09 2,58 3,13
0,75 6,3 -323,20573 420 4,7166 -0,07 2,74 -2,25
24 7 -385,53877 405 4,54815 0,54 2,13 22,60
S2-Cit
S2-SO
S2-HCl
S2-KCl
S2-Control

217

218
22. Mai 13 Time Vo msoil Kd
pH 3 (h) (mg/l) (mg/g) (l) (g) (mg/l) (mg/l) (ml/g)
0,01 7,5 -468,5788 450 3,6945 -4,79 7,5 -77,74
0,25 5,5 -224,9734 450 3,6945 -2,79 5,5 -61,71
0,5 6,1 -298,0551 435 3,5714 -3,39 6,1 -67,62
0,75 6,5 -346,7761 420 3,4482 -3,79 6,5 -70,96
24 16,1 -1516,0819 405 3,3251 -13,39 16,1 -101,28
0,01 7,5 -488,7189 450 4,1499 -5,23 7,5 -75,57
0,25 13,5 -1139,3370 450 4,1499 -11,23 13,5 -90,18
0,5 6,4 -369,4390 435 4,0116 -4,13 6,4 -69,92
0,75 6,7 -401,9699 420 3,8732 -4,43 6,7 -71,64
24 16,1 -1421,2715 405 3,7349 -13,83 16,1 -93,13
0,01 7,5 -456,1340 450 4,1702 -5,04 7,5 -72,52
0,25 5,6 -251,1054 450 4,1702 -3,14 5,6 -60,51
0,5 7 -402,1791 435 4,0311 -4,54 7 -69,99
0,75 6,8 -380,5972 420 3,8921 -4,34 6,8 -68,87
24 17,6 -1546,0229 405 3,7531 -15,14 17,6 -92,83
0,01 7,5 -850,8176 450 3,4898 -6,57 7,5 -112,96
0,25 0,91 -1,0432 450 3,4898 0,02 0,91 2,83
0,5 0,93 -3,6222 435 3,3734 0,00 0,93 0,00
0,75 0,87 4,1147 420 3,2571 0,06 0,87 8,89
24 0,19 91,8001 405 3,1408 0,74 0,19 502,22
0,01 7,5 -687,1636 450 4,2030 -6,50 7,5 -92,72
0,25 0,91 18,4038 450 4,2030 -0,12 1,12 -11,03
0,5 0,93 16,2625 435 4,0629 0,02 0,98 2,69
0,75 0,87 22,6865 420 3,9228 0,12 0,88 15,17
24 0,19 95,4916 405 3,7827 0,24 0,76 34,47
S2-HCl
S2-KCl
S2-Kontrol
S2-Cit
S2-SO

219
26. Jun 13 Time Vo msoil Kd
pH 3 (h) (mg/l) (mg/g) (l) (g) (mg/l) (mg/l) (ml/g)
0,01 7,5 -259,5832751 300 3,4368 -3,65 7,5 -42,47
0,25 4,56 -2,949196927 300 3,4368 -0,71 4,56 -13,57
0,5 4,58 -4,695006983 285 3,26496 -0,73 4,58 -13,89
0,75 4,52 0,542423184 270 3,09312 -0,67 4,52 -12,92
24 4,45 6,65275838 255 2,92128 -0,60 4,45 -11,75
0,01 7,5 -450,5985889 300 2,4237 -4,09 7,5 -67,56
0,25 4,54 -84,21661097 300 2,4237 -1,13 4,54 -30,90
0,5 4,71 -105,2588192 285 2,302515 -1,30 4,71 -34,25
0,75 4,44 -71,83884144 270 2,18133 -1,03 4,44 -28,81
24 7,29 -424,6052729 255 2,060145 -3,88 7,29 -65,94
0,01 7,5 -384,4941707 300 2,3931 -3,71 7,5 -62,03
0,25 5,02 -73,60035101 300 2,3931 -1,23 5,02 -30,74
0,5 4,82 -48,52826877 285 2,273445 -1,03 4,82 -26,82
0,75 4,86 -53,54268522 270 2,15379 -1,07 4,86 -27,63
24 6,18 -219,018428 255 2,034135 -2,39 6,18 -48,50
0,01 7,5 -524,0790453 300 2,7402 -4,86 7,5 -70,91
0,25 2,04 73,68754106 300 2,7402 0,60 2,04 32,32
0,5 1,84 95,58375301 285 2,60319 0,80 1,84 47,73
0,75 1,58 124,0488286 270 2,46618 1,06 1,58 73,60
24 0,57 234,6246989 255 2,32917 2,07 0,57 398,02
0,01 7,5 -458,9330622 300 3,0978 -4,83 7,5 -62,31
0,25 2,04 69,8292853 300 3,0978 -0,18 2,85 -5,97
0,5 1,84 89,19786946 285 2,94291 -0,47 3,14 -14,37
0,75 1,58 114,3770289 270 2,78802 -0,25 2,92 -8,15
24 0,57 212,1883788 255 2,63313 0,52 2,15 23,61
S1-Cit
S1-SO
S1-HCl
S1-KCl
S1-Kontrol

220
Lüneburg
30. Aug 13 Time Vo msoil Kd
pH 3 (h) (mg/ml) (mg/g) (ml) (g) (mg/l) (mg/l) (ml/g)
0,01 0,0075 257,9010 375 3,68 -4,97 7,5 -67,51
0,25 0,0122 257,4184 375 3,68 -9,71 12,24 -80,80
0,5 0,0098 257,6719 360 3,54 -7,22 9,75 -75,43
0,75 0,0083 257,8247 345 3,39 -5,72 8,25 -70,63
24 0,0022 258,4397 330 3,24 0,32 2,21 14,61
0,01 0,0075 450,5556 300 2,69 -3,97 7,5 -59,07
0,25 0,0694 443,6501 300 2,69 -65,85 69,38 -105,92
0,5 0,0705 443,5251 285 2,55 -66,97 70,5 -106,01
0,75 0,0753 442,9873 270 2,42 -71,79 75,32 -106,36
24 0,1038 439,8079 255 2,29 -100,28 103,81 -107,80
0,01 0,0075 251,2537 300 3,17 -4,89 7,5 -61,81
0,25 0,0304 249,0824 300 3,17 -27,81 30,42 -86,62
0,5 0,0285 249,2671 285 3,01 -25,86 28,47 -86,06
0,75 0,0222 249,8649 270 2,85 -19,55 22,16 -83,59
24 0,0015 251,8259 255 2,69 1,15 1,46 74,40
0,01 0,0075 281,616 600 5,82 -4,84 7,5 -66,52
0,25 0,0130 281,053 600 5,82 -10,30 12,96 -81,93
0,5 0,0147 280,877 585 5,68 -12,01 14,67 -84,39
0,75 0,0153 280,808 570 5,53 -12,68 15,34 -85,21
24 0,0006 282,324 555 5,38 2,03 0,63 332,12
0,010 0,008 1157,485 450 3,59 -0,50 7,50 -8,42
0,250 0,063 1150,476 450 3,59 -56,43 63,43 -111,51
0,500 0,061 1150,740 435 3,47 -54,32 61,32 -111,03
0,750 0,066 1150,192 420 3,35 -58,69 65,69 -111,98
24,000 0,088 1147,364 405 3,23 -81,26 88,26 -115,39
0,01 0,01 464,53 600 5,59 -3,77 7,50 -53,97
0,25 0,04 461,50 600 5,59 -31,99 35,72 -96,06
0,50 0,04 461,48 585 5,45 -32,23 35,96 -96,14
0,75 0,03 461,72 570 5,31 -29,98 33,71 -95,40
24,00 0,00 464,96 555 5,17 0,27 3,46 8,25
RS-KCl
BS-Control
BS-Cit
BS-KCl
RS-Kontrol
RS-Cit

221
APPENDIX 4: : RELATIONSHIP BETWEEN THE SOIL/SOLUTION RATIO, SORPTION PERCENTAGE (A%) AND DISTRIBUTION COEFFICIENT (Kd)
Time Vo msoil P cc initial Kd A Soil/Solution
(h) (l) (g) (mg/l) (mg/l) (mg/l) (ml/g) (%) (g/ml)
0,01 300 3,9021 0,9922 -6,5078 7,5000 -66,7105 -6,5588 0,0130
0,25 300 3,9021 0,9922 0,6422 0,3500 141,0718 0,6473 0,0130
0,5 285 3,7070 0,9922 0,7122 0,2800 195,5601 0,7178 0,0130
0,75 270 3,5119 0,9922 0,7622 0,2300 254,7866 0,7682 0,0130
24 255 3,3168 0,9922 0,7122 0,2800 195,5601 0,7178 0,0130
0,01 300 4,1550 1,4944 -6,0056 7,5000 -57,8152 -4,0186 0,0139
0,25 300 4,1550 1,4944 -0,1156 1,6100 -5,1822 -0,0773 0,0139
0,5 285 3,9473 1,4944 0,0044 1,4900 0,2154 0,0030 0,0139
0,75 270 3,7395 1,4944 -0,0256 1,5200 -1,2139 -0,0171 0,0139
24 255 3,5318 1,4944 0,1044 1,3900 5,4253 0,0699 0,0139
0,01 450 3,4898 0,9300 -6,5700 7,5000 -112,9594 -7,0645 0,0078
0,25 450 3,4898 0,9300 0,0200 0,9100 2,8340 0,0215 0,0078
0,5 435 3,3734 0,9300 0,0000 0,9300 0,0000 0,0000 0,0078
0,75 420 3,2571 0,9300 0,0600 0,8700 8,8930 0,0645 0,0078
24 405 3,1408 0,9300 0,7400 0,1900 502,2227 0,7957 0,0078
0,01 450 4,2030 1,0047 -6,4953 7,5000 -92,7242 -6,4652 0,0093
0,25 450 4,2030 1,0047 -0,1153 1,1200 -11,0253 -0,1148 0,0093
0,5 435 4,0629 1,0047 0,0247 0,9800 2,6949 0,0246 0,0093
0,75 420 3,9228 1,0047 0,1247 0,8800 15,1677 0,1241 0,0093
24 405 3,7827 1,0047 0,2447 0,7600 34,4679 0,2435 0,0093
Sampling date
22
May
20
13
S1-Control
S2-KCl
S2-Control
Reactor
S1-KCl

222
Time Vo msoil P cc initial Kd A Soil/Solution
(h) (l) (g) (mg/l) (mg/l) (mg/l) (ml/g) (%) (g/ml)
0,01 300 2,7402 2,6422 -4,8578 7,5000 -70,9113 -1,8385 0,0091
0,25 300 2,7402 2,6422 0,6022 2,0400 32,3196 0,2279 0,0091
0,5 285 2,6032 2,6422 0,8022 1,8400 47,7327 0,3036 0,0091
0,75 270 2,4662 2,6422 1,0622 1,5800 73,6033 0,4020 0,0091
24 255 2,3292 2,6422 2,0722 0,5700 398,0159 0,7843 0,0091
0,01 300 3,0978 2,6742 -4,8258 7,5000 -62,3123 -1,8046 0,0103
0,25 300 3,0978 2,6742 -0,1758 2,8500 -5,9729 -0,0657 0,0103
0,5 285 2,9429 2,6742 -0,4658 3,1400 -14,3654 -0,1742 0,0103
0,75 270 2,7880 2,6742 -0,2458 2,9200 -8,1513 -0,0919 0,0103
24 255 2,6331 2,6742 0,5242 2,1500 23,6127 0,1960 0,0103
0,01 450 3,1469 2,5347 -0,1453 2,6800 -7,7547 -0,0573 0,0070
0,25 450 3,1469 2,5347 0,0047 2,5300 0,2638 0,0018 0,0070
0,5 435 3,0420 2,5347 0,2247 2,3100 13,9080 0,0886 0,0070
0,75 420 2,9371 2,5347 0,5647 1,9700 40,9885 0,2228 0,0070
24 405 2,8322 2,5347 1,8947 0,6400 423,3400 0,7475 0,0070
0,01 450 4,7084 2,5200 -0,3100 2,8300 -10,4693 -0,1230 0,0105
0,25 450 4,7084 2,5200 -0,2600 2,7800 -8,9387 -0,1032 0,0105
0,5 435 4,5514 2,5200 -0,1500 2,6700 -5,3694 -0,0595 0,0105
0,75 420 4,3945 2,5200 -0,1700 2,6900 -6,0400 -0,0675 0,0105
24 405 4,2375 2,5200 0,2700 2,2500 11,4690 0,1071 0,0105
Sampling date Reactor
26
. Ju
n. 1
3
S1-KCl
S1-Control
S2-KCl
S2-Control

223
Time Vo msoil P cc initial Kd A Soil/Solution
(h) (l) (g) (mg/l) (mg/l) (mg/l) (ml/g) (%) (g/ml)
0,01 375 3,6829 2,5271 -4,9729 7,5000 -67,5143 -1,9679 0,0098
0,25 375 3,6829 2,5271 -9,7129 12,2400 -80,8004 -3,8436 0,0098
0,5 360 3,5356 2,5271 -7,2229 9,7500 -75,4316 -2,8582 0,0098
0,75 345 3,3882 2,5271 -5,7229 8,2500 -70,6332 -2,2647 0,0098
24 330 3,2409 2,5271 0,3171 2,2100 14,6084 0,1255 0,0098
0,01 300 3,1668 2,6067 -4,8933 7,5000 -61,8079 -1,8772 0,0106
0,25 300 3,1668 2,6067 -27,8133 30,4200 -86,6153 -10,6701 0,0106
0,5 285 3,0085 2,6067 -25,8633 28,4700 -86,0593 -9,9220 0,0106
0,75 270 2,8501 2,6067 -19,5533 22,1600 -83,5895 -7,5013 0,0106
24 255 2,6918 2,6067 1,1467 1,4600 74,4021 0,4399 0,0106
0,01 600 5,8206 2,6598 -4,8402 7,5000 -66,5248 -1,8197 0,0097
0,25 600 5,8206 2,6598 -10,3002 12,9600 -81,9263 -3,8725 0,0097
0,5 585 5,6751 2,6598 -12,0102 14,6700 -84,3923 -4,5154 0,0097
0,75 570 5,5296 2,6598 -12,6802 15,3400 -85,2086 -4,7673 0,0097
24 555 5,3841 2,6598 2,0298 0,6300 332,1245 0,7631 0,0097
0,01 600 5,5944 3,7261 -3,7739 7,5000 -53,9663 -1,0128 0,0093
0,25 600 5,5944 3,7261 -31,9939 35,7200 -96,0623 -8,5863 0,0093
0,5 585 5,4545 3,7261 -32,2339 35,9600 -96,1370 -8,6508 0,0093
0,75 570 5,3147 3,7261 -29,9839 33,7100 -95,3952 -8,0469 0,0093
24 555 5,1748 3,7261 0,2661 3,4600 8,2494 0,0714 0,0093
Sampling date Reactor
Lün
ebu
rg W
WTP
BS-Control
BS-KCl
RS-Control
RS-KCl