Phosphorus-31 of Sediment Phosphoüpids · 2005. 2. 12. · Phosphorus-31 NMR of Sediment...
121
Phosphorus-31 NMR of Sediment Phosphoüpids by Emma EIizabeth Watts Department of Chemistry submined in partiai fulfilment of the requirements for the degree of Master of Science FacuIty of Graduate Studies The University of Western Ontario London, Ontario August 1999 Q Emma E. Watts 1999
Transcript of Phosphorus-31 of Sediment Phosphoüpids · 2005. 2. 12. · Phosphorus-31 NMR of Sediment...

Phosphorus-31 NMR of Sediment Phosphoüpids
by
Emma EIizabeth Watts
Department of Chemistry
submined in partiai fulfilment of the requirements for the degree of
Master of Science
FacuIty of Graduate Studies The University of Western Ontario
London, Ontario August 1999
Q Emma E. Watts 1999
National Library 1+1 ,,nada Bibibthèque nationale du Canada
Acquisitions and Acquisitlans et Bibliographie Services serviees bibliographiques
395 Wellington Street 395, me Wellington Ottawa ON KI A ON4 OmwaON K l A W canada CaMda
The author has gtlmted a non- exclusive licence allowing the National Lhrary of Canada to reproduce, loan, distniute or seU copies of this thesis in microform, paper or electronic formats.
The author retains ownership of the copyright in this thesis. Neither the thesis nor substantiaf extracts £kom it may be printed or otherwise reproduced without the author's permission.
L'auteur a accordé une licence non exclusive permettant à la Bibliothèque nationale du Canada de reproduire, prêter, distribuer ou vendre des copies de cette thèse sous la forme de microfiche/frlmy de reproduction sur papier ou sur format électronique .
L'auteur conserve la propriété du droit d'auteur qui protège cette thèse. Ni la thèse ni des extraits substantieIs de celle-ci ne doivent être imprimés ou autrement reproduits sans son autorisation,
Abstract
Phosphorus-3 1 nuclear magnetic resonance spectroscopy (NMR) has been used to
examine sedunent phospholipids which ate believed to be indicative of the sediment
microbial community. Two isolated watersheds in southwestern Ontario were investigated
for phospholipid abundance and richness. The resuits obtained show seasonal variations
consistent with the existing fiterature on soil microbes. Both abundance and richness aIso
show well-de£ined spatial variation. The two sites show remarkably different phospholipid
patterns. Generaily, atypical behaviour in any sample set may be attributed to human
disturbance but some differences appear to be due to physical characteristics such as
turbidity. In general, the results show that NMR is a promising technique to monitor changes
in soif microbid communities.

The signincant problems we face cannot be solved at the same ievel o f thinkuig we were at when we created them.
Albert Einstein

1 would like to thank Dr. Ron Martin for his guidance and support throughout the
course of this thesis. A special th& to Dr. Phü Dean and Dr. Sammy Sammynaiken for
their instruction and advice with the NMR T would iike also Like to thank Dr, Kee
Dewdney, Dr. Anwar Maun, Dr. Rob Schincariol and A n k a Williamson for their
coliaborative research and insights into the two study areas. This work would not have been
possible without the guidance of Mr. Ross Davidson, ML Mark Biesinger and Ms. Mary
Jane Walzak on the various instruments at Surface Science Western. FinaiLy, a special
thanks to Mark, Gina and Dave whose support and fnendship made the whole process so
much easier.

Table of Contents
. . Certi£icateofExamination . . . . . . . . . . . . . . . . . . . . . . . . . . . . . . . . . . . . . . . . . . . . . . . . u
... Absixact ...-.....,.....-...........--.-............-..------..-.......iir
Acknowledgements ...................-...--.-œœœ..-.---...~...-........~v
....................................................... Tableofcontents vi
ListofFigures . . . . . . . . . . . . . . . . . . . . . . . . . . . . - . . . . . . . - . . . . . . . . . . . - . . . . . . . . xi
-.- ListofTables ......-..........-...-.--..........-....-.---.-.-.--...--xrrr
ListofAbbreviations ................................-.-................ xiv
1,Introduction . . . . . . . . . . . . . . . . . . . - . . . . . . . . .~. . , . . . . . . . -- . . . -- . . . . . . - . . . - l
1.1 Background . . . . . . . . . . . . . . . . . . . . . . . . . . . . . . - . . . . . . . . . . . . . t . . . . . . 1
1.2 The History of Nuclear Magnetic Resonance Spectroscopy of Soils ...... - 4
............................. 1.3 Phosphorus in Freshwater Ecosystems - 5
1.4 TheStudyAreas . . . . . . . . . . . . . . . . . . . . . . . . . . . . . . . . . . . . . . . . . . . . . . . .
1.4.1 The OId Ausable River Channel .......................... - 7
1.4.2 The Kirk Cousins Management Area ....................... -9
.......................................... 1.5 Research Objectives - 1 1
................................................... 1.6 References 13
2. Instnimentation . . œ . . . . . . . . . . . . . - . . . . . . . . . . - . . . . . . . . - . . . . - . . . . . . œ - . . - . l 6
................. 2.1 Nuclear Magnetic Resonance (NMR) Spectroscopy -16
........... 2.2 Inductively Coupled Plasma - Mass Spectrometry (ICP-MS) 19
.......................... 2.3 X-ray Photoelectron Spectroscopy W S ) -21

...................................... 2.4 Ion Chromatography (IC) -23
................................. 2.5 Electrospray Mass Spectrometry -23
....................................... 2.6 X-ray Diffraction (XRD) -24
2.7 Static Secon dary Ion Mass Spectrometry (SIMS) .................... -25
................................................... 2.8 References 25
............................................... 3 . Phospholipid Analysis -27
.................................. 3.1 Site Seleciion and Description -27
.......................... 3.1.1 The Old Ausabie River Channel 27
...................... 3.1.2 The Kirk Cousins Management Area -28
3.2 Experimental ................................................. 28
.................................... 3.2.1 Sediment Collection 28
................................. 3.2.2 Phospholipid Extraction 30
............................ 32.3 "P NMR ~eagent Preparation 31
................. 3 .2.4 Sample Preparation for "P NMR Analysis -31
................................ 3 .2.5 "P NMR Spectroscopy - 3 2
............................ 3.2.6 Phospholipid Quantincation - 3 2
.............................. 3.2.7 Phospholipid Identification 33
...................................... 3.2.8 X-ray Dfiaction 36
............................................ 3.2.9 Matenals 37
........................................ 3.3. Resuits and Discussion 37
3.3.1 The Old Ausable River Channel .......................... 37
...................... 3.3.2 The Kirk Cousins Management Area -41
vii

.................................... 3 -4 Phospholipid Quantification -46
3 -5 Phospholipid Identification ..................................... -48
3.6 Conchsions .................................................. 49
.................................................. 3.7 References - 5 0
................................ 4 . Water Analysis for Dissolved Phosphonis -52
4.1 Introduction .................................................. 52
................................................. 4.2 Expehental 52
.................................... 4.2.1 Sample Collection -52
4.22 Sample Preparation for ICP-MS Analysis ................... 53
........................................ 4.3 Results and Discussion -53
4.3.1 The Old Ausable River Channel ......................... -53
4.3.2 The Kirk Cousins Management Area ...................... - 5 5
4.4 Conclusions ................................................. - 5 8
................................................... 4.5 References 58
...................................... 5 . Ancillary Identification Techniques 60
.................................................. 5-1 Introduction 60
5.2 Experimental ................................................. 60
............................ 5.2.1 Thin Layer Chromatography 60
......................... 5.2.2 Electrospray Mass Spectrometry - 6 1
........................ 5.2.3 X-ray Photoelectron Spectroscopy -61
................... 5.2.4 Static Secondary Ion Mass Spectrometry - 6 2
............................................ 5.2.5 Materials 62

5.3 Results and Discussion ........................................ -62
5.3.1 Thui Layer Chromatography ............................ - 6 2
5.3.2 Electrospray Mass Spectrometry ......................... -63
5.3.3 X-ray Photoelectron Spectroscopy ......................... 65
5.3.4 Static Secondary Ion Mass Spectrometry ................... - 6 5
5.4 Conclusions ................................................. -67
5.5 References .................................................. -67
6 . Phosphoiipid . Calcite Interactions ....................................... 68
6.2 Experime rital ................................................. 68
6.2.1 Methodoiogy ........................................ -68
6.2.2 Ion Chromatography .................................. -69
6.2.3 Materiais ........................................... -70
6.3 Results and Discussion ........................................ -70
6.3.1 Standards and Controls ................................ - 7 0
.............. 6.3.2 Potassium Acid Phosphate, Proof of Principle - 7 2
6.3.3 Phosphatidic Acid ..................................... 74
6.3 -4 Diethyl Phosphate ..................................... 77
6.4 Conclusions .................................................. 77
................................................... 6.5 References 78
7 . Conclusions and Future Work .......................................... - 7 9
7.1 Conclusions .................................................. 79

.................................................. 72FutureWork 81
.......................... Appendix 1: Individual Phospholipid Concentrations - 8 2
AppendixII:NMRSpectra ............................................... 85
....................................................... CUmculumVita 108

List of Finures
Figure Description page
1.1 Stnicture of Phosphatidic Acid ...................................... - 3
1.2 Major Classes of Phospholipids ............... ,, ..................... - 4
.................... ........... 1.3 Map of the Old Ausable River Channel ,, 8
1.4 Map of the Kirk Cousins Management Area ............................ 10
2.1 Schematic of an KP-MS .......................................... -20
2.2 The photoelectric effect, iliustrated for the emission of a phosphorus 2pelectron ....................................................... 22
...................... 2.3 Schematic of an X-ray photoelectron spectrometer -22
3.1 NMR spectra of phosphofipid standards; run 9 and nin 10 with the . .................................. addition of phosphatidylinositoL .. 35
3 -2 NMR spectra of Mudhoie South. s p ~ g 98. Mudhoie South. sumrner 98. and Burley Bridge North, summer 98 .............................. -40
3 -3 NMR spectra of a sample fiom Canoe Docks North, autuma and same sample foilowing 100 days outside in OARC water (Balcony
......................................................... sample) 42
3.4 XRD spectrum of suspended particdate matter fkom Pond Mu in summer98 ....................................................... 45
3.5 NMR spectni of Canoe Docks North samples; amalgamated sample. s p ~ g 98. single sampie. spring 98. spring 99 .......................... -47
4.1 Typical relationship between dissolved phosphorus and phospholipid .......................................... abundance in the OARC - 5 4
4.2 Relationship between dissolved phosphorus and phospholipid abundance at each site within the KCMA ............................. -57
5.1 Electrospray mass spectrum of unknown phospholipid foliowing TLC ....................................................... separation 64

6.1 XPS nwey scans showing the increase in adsorbed phosphate as the concentration of KH2P04 in solution increases _ - . . , . - - - - . , . , . . . ,. .. . .. . -73
6.2 Raman spectra of a cfean calcite crystal and a crystai exposed to a solution of KH,PO,. Adsorbed phosphate is ùidicated on the exposed sample by the peak at 927.7 cm-' . . . . . . . . . . . . . . . . . . . . . . . . . . . . . . . . . . . . -75
6.3 High resolution XPS spectra of the phosphorus (2p) peak for the standard sample of phosphatidic acid (PA) and for a calcite d a c e exposed to 10 ppm solution of PA for 24 hours. The fitted peak is the overd contribution fiom both the P(2pd and the P(2p3,3 peaks . . . . . . . . -76

Table Description page
3.1 Seasonal and spatial patterns of total phospholipid abundance and ............................................. nchness in the OARC 38
3 -2 Seasonal and spatial patterns of total phospholipid abundance and ............................................ richness in the KCMA .44
4.2 Seasonal and spatial changes in total dissolved phosphorus in the ......................................................... KCMA 56
5.1 Signifïcant mass hgments and their assignments fiom the positive ....................................... secondary ion mass spectrum -66
6.1 Surface composition of standard samples in atomic percent as determioed by X-ray photoelectron spectroscopy (WS). Phosphorus (2p) binding energies for each sample are presented in the far right
........ column. Binding energies are referenced to carbon (1s) at 285.0 eV 71

List of Abbreviations
amu BBN BBS CDN CDS EDTA ESCA ES1 FAA FID GPC IC ICP-MS KCMA LPA LPC LPG MHN MHS MU NMR OARC 3'P PA PC PE PG PI rf Rc RMM RMS SIMS SM TLC TP u XPS XRD
atomic mass unit Burley Bridge North Burley Bridge South Canoe Docks North Canoe Docks South ethylenediaminetetraacetic acid electron spectroscopy for chernical anaiysis electrospray ionization fatty acid analysis fiee induction decay greatest phospholipid abundance ion chromatography inductively coupfed plasma - mass spectrometry KUk Cousins Management Area lysophosphatidic acid Lysophosphatidylcholine iysophosphatidylglycerol Mudhole North Mudhole South Pond Mu nuclear magnetic resonance spectroscopy Old Ausable River Channel phosphonis-3 1 phosphatidic acid phosphatidylcholine phosphatidy Iethanolamine phosphatidylglycerol phosphatidylinositol radio fiequency retardation factor Regina Mundi Middle Regina Mundi South secondary ion mass spectrometry sphingomy elin thin layer chromatography Turtle Pond unknowll X-ray photoelectron spectroscopy X-ray diffraction
xiv

1- Introduction
1.1 Background
Sediment microorganisms play an important role in the decomposition of organic
material,' the degradation of po~utants'" and the recychg ofnutrients? An evahation of
the biomass and composition ofthe microbial community is therefore essentid in assessing
soil quality and pollution impacts on an ecosystem The direct quantification of microbiai
biomass in sediment is constrained by the difnculty of isolatïng the microbes? Moreover,
the time involved in isolathg and identifjing Merent bacteria, h g i , algae and protozoa
makes it unreaiistic to process the nurnber of samples required to adequately define a redistic
ecosystem. However, the cellular membranes of microorganisms are largely composed of
phospholipids which are, in principle, characteristic of each celi type? A profile of sediment
phospholipids might therefore be used to fingerprint the microbial community. Since
phospholipids have a short haKlife in sedunent they can provide good estimates of viable
biomass at any given time as there should be no caq-over nom year to year.' In this way,
phospholipids may be usefiil short term indicators of ecosystem health.
There is sigdicant iïterature on pollution induced changes in the microbial
co~nmuniSh)~~~ and on a varîety of analytical methods used for its evaluation?None of
the traditional methods is completely satisfactory.
Culture methods, for instance, have many limitations. In fact, it is estimated that ody
a small percentage of soiI microorganisms can be cultured in the laboratory and these
analyses have o&n underestimated microbial populations in soil.' Culture studies have

2
however aided in the interpretation of results obtained by other methods. Culturing samples
has helped to elucidate the phosphoiipid and the phospholipid fatty acid composition of
specific microorganisms under a variety of external ~tresses.~ This work needs to be taken
out of the laboratory and tested under naturd condit io~s.~~
The popular fatty acid analysis (FAA) has proven to be one of the most useftl
methods available to evaiuate a microbid ~omrnuni ty .~ '~ This analysis examines microbial
Lipids indirectiy through their fatty acid compositioa FAA is a sensitive technique consisting
of severai separations of the iipid extracts as weii as the derived fatty acid methyl esters.
Zelies and Bai4 give a detaiied account of the solid phase extractions, chemical
derivatizations and of the h a 1 measurements by gas chromatography - mass spectrometry
required for F M
Unfortunately, FAA tends to examine the total iipid content of a sample rather than
solely its phospholipid content (aithough it is sometimes referred to as the phospholipid fatty
acid analysis). Phospholipids are generally regarded as providing a better characterization
of the current microbiai community. The phospholipids are degraded rapidly followiog cell
death compared to other cell iipids.' As a result, the fatty acids present may represent an
integration of materiai fiom the current living microbes and those previously deposited in the
sample. In addition, the many chernical steps involved in the FAA procedure rnight destroy
the integrity of the onginal soi1 sample. A method capable of faster sample turnover with
fewer chemical manipulations is necessary.
'lP nuclear magnetic resonance (NMR) spectroscopy is a powedùl tool capable of
analysing phospholipids extracted nom sediment directly. "P is the ody stable isotope of

phosphorus and has a nuclear spin of 95, making it sensitive to NMR Each phospholipid
contains a single phosphoms atom in its polar head group that can be detected. Structures
of typical phospholipids are shown in Figure 1.1 and 1 -2. NMR spectroscopy investigates
the nature of the phosphorus atom by monitoring the interaction of its nuclear magnetic
moment with radio fkequency electromagnetic radiation in a strong magnetic field In
p"ciple, each phospholipid species may be identifiai and quantiited. "P NMR wiII be
discussed in detail in chapter 2.
Figure 1.1 : Structure of Phosphatidic Acid
Phosphatidic acid is the simplest form ofa phospholipid. The length of the fatty acid
side chains and the degree of unsaturation Vary, t in Figure 1.1. Additional classes of
phospholipids are characterized by the substituent es teaed to the phosphate group of the
acid, $ in Figure 1.1. Some examples are shown in Figure 1 -2.

Phosphatidy lserine
Figure 1.2: Major Classes of Phospholipids. The classes listed above are obtained by the addition of the accompanyhg groups to phosphatidic acid.
1.2 The History of Nuclear Magnetic Resonance Spectroscopy of Soi1
Nuclear magnetic resonance spectroscopy was discovered over 50 years ago.lL
Although it was weil established for organic chernical analysis by 1965, only recent
technologicd advancements have permitted its routine application in soil studies.ll Early
work using NMR to investigate soil organic matter was carried out in 1963 when Barton and
S~hnitzer'~ pubiished their analysis of methylated humic acids ushg proton NMR Since
then, superconducàng magnets with high fields and the computing power of Fourier
transform techniques have extended the application of NMR to less sensitive nuclei such as

5
lL These developments aiso permitted the analysis of cornplex, heterogeneous soi1
smplesl 1, 13'14 and dihite phospholipid sediment extracts.' Early phospholipid experiments
using NMR did not provide sutncient resolution for the accurate quantification of
individual phospholipids. This poor resolution is caused by the presence of paramagnetic
cations CO O rdinated to the phosphodiester fùnctional groups of the p hospholipids. l5 These
ions may broaden or quench the resonance si@ by inducing "P NMR relaxationL6
Improvements in the sediment extraction process have Wtuaily eliminated this problem by
using phosphate and ethylenediaminetetraacetic (EDTA) acid as chelating agents to remove
cations.* There are as yet few Literature references that may be used to assess the quantitative
reliability ofNMEL when phosphate aud EDTA are used in sample preparation. This research
seeks to add to the limited information available on the use of 31P NMR in the identification
and quantification of sediment phospholipids.
1.3 Phosphorus in Freshwater Ecosystems
Phosphorus is an essential nutrient for plants and is ofien the limiting nutrient in
freshwater systems.17 Its importance in the process of eutrophication has been emphasized
repeatedly.lbLg Anthropogenic inputs represent the greatest contribution of phosphorus to
natural waters." Sewage, agricultura1 runoff and detergents are ali major contributors.
Naturaliy, in the absence of direct human impact, atmospheric deposits and mineral
weathering represent its principal s0urces.l
Phosphoms exists in fieshwater bodies in both the organic and inorganic particdate
and dissolved forms. It ia primarily the dissolved inorganic phosphorus that is viewed as

6
bi~available.'~ The retention of available phosphorus is a important part of the phosphoms
cycle, con t rohg both water quality and soil fertiiity. Biotic factors contrr'buting to its
retention include uptake by vegetation, plankton, periphyton and micr~or~anisms.'~ Abiotic
processes such as sedimentation, chemicai precipitation and chernical adsorption also aid in
the attenuation of phosphorus in aqyatic systems." An explanation of the phosphoms cycle
wilI not be provided here. The interesteci reader might note that VymazalZL and Kramef7
give a comprehensive review of the processes involved. Reddy et ai-" also give a detailed
account of phosphorus retention in streams and wetlands-
This research will focus on phosphorus sequestration by the microbiai community
and its relation to phosphorus in the water column In systerns with high organic inputs such
as waste effluent loadings and detrital plant matter deposition, microorganisms play a major
role in phosphoms retention?O Newbold et aLn demonstrated that microbial uptake could
be responsible for up to 91% of the total phosphorus retention in a woodland Stream. This
excessive up take of phosphate by bacteria and its subsequent release under unfavourable
conditions have been weil documented? The knowledge has now been put to use as a
cheap and natural alternative for phosphorus removal f?om water in sewage treatment
plants.526
1.4 The Study Areas
Study areas were selected to minimize extraneous variables such as multiple pollution
sources. Two very dEerent isolated watersheds were investigated. The Old Ausable River
Channel has been shown to be a phosphorus poor system with precipitation and groundwater

7
seepage as its ody water sources.* The Kidr Cousins Management Area consists ofover 20
kettle ponds in wetland, forest and meadow ecosystems." Other than atmospheric
deposition, the oniy possible sources of phosphoms in this system are local- This area has
some sampling sites presumed to be pristine while others are impacted by human efnuent
inputs. A single, direct source of human effluent fiom Regina Mun& College at the Kirk
Cousins site is the major Merence between this site and the Old Ausable River ChannelI
1.4.1 The Old Ausable River Channel
The Old Ausable River Channel (OARC) was chosen as it is a relatively simple,
isolated system that is vulnerable to eutrophication. It is only 14 km in length, with a flow
rate averaging less than 1 cm/s and a maximum depth of 2.5 metres." A map of the Old
Ausable can be found in Figure 1 -3.
The Old Ausable River Channel begins in Grand Bend, Ontario, and flows southwest,
parallel to Lake Huron In 1892, the construction of a canal completely separated the old
channel fiom the Ausable River." Today, the Old Ausable is fed exclusively by precipitation
and groundwater seepage? Its water level is maintained by a series of culverts and a dam
The channel travels through the rare oak savanna ecosystem of the Pinery Provincial Park
and continues southwest to the park boundary, just south of Port Franks. It then rejoins the
Ausable River, flowing West into Lake Huron_
An interdisciplinary study of the Old Ausable was initiated due to concems
surroundhg the abundant plant life in the river during the summer. The Pinery boasts over
a million visitors each year and the deterioration of the Old Ausable threatens the Park's

Figure 1.3: Map of the Old Ausable River Channel." Produced under Licence h m Her Majesty the Queen in Rîgk of Canada. with permission of Natural Resources Canada.

9
annual incorne. The underwater vegetation is often so dense that most aquatic actMties are
unappealuig. Many private houses also Iine the baaks of the Old Ausable between Grand
Bend and the noahem boundary ofthe Park Overflow fiom septic tanks, nuiofffkom lawns
and driveways and the increased human activity within the Park may be affecting water
q~ality.~O
Favourable growing conditions are provided by the slow ruovin& shdow waters
which receive ample sunlight and remain warm aii summer. D7Ulisse and ~ a u n ~ ' have
shown that some areas of the channel are stagnant and in faet, show signs of a lentic
ecosystem. Large sections ofthe river have low turbidlty, aüowiag sunlight to reach the river
bottom and causïng waterternperatures to nse. Therefore, even modest nutrient inputs could
cause accelerated vegetative growth. The Old Ausable is akeady showing more advanced
signs of natural eutrophication. The taste and odour problems associated with anoxie water
are apparent.
1.4.2 The Kirk Cousins Management Area
The Kirk Cousins Management Area (KCMA) is located in London, Ontario, just
south of Highway 401, east of Wellington road. The KCMA, established in May 1982,
consists of 25 ha of si@cant wetland and 16 ha of meadow. It represents an important
headwater source for the Kettie Creek watershed. There are over 20 kettle ponds in the area,
established by successive glacier melts 13,000 - 11,000 years ago? They occupy the height
of land between Lake Erie and Lake Huron and are therefore isolated fiom al1 but local
pollution sources. A map of this region c m be found in Figure 1-4.


I l
In 1963, Regina Mundi Coiiege was built on the edge of the management area as a
junior semhuy- In 1965, it was expanded to admit residentiai, non-seminary students and
by 1973, student enrollment totalied 152- Raw sewage fiom the coiiege once entered a pond
in the management area but it now passes through a treatment plant designed for phosphorus
removd and ultraviolet disinfection prior to discharge into the adjacent pond. Aithough a
treatment plant had been in place since the schooI was bd t , it was poorly maintaineci and
out of s e ~ c e for many years. An upgraded treatment p l a t was approved in August 1995.
The Ministry of the Environment now requires routine operational testïng of the fàcility and
enforces etnuent discharge requirements. In 1983, Regina Mundi was converted fkom a
residentid school to a day school. Its current staff and student population is 1426.~' Since
precipitation is the sole source of water for this area, the impact of the wastewater on the
pond's microbid cornxnety can be examined.
1.5 Research Objectives
The phospholipid distribution in sediments can, in principle, serve as an indicator of
the composition and health of the microbial biomass. Since NMR may be the most powemil
technique currently available to probe phosphoiipids, the fist objective of this study is (1)
to evaluate the utility of "P NMR in the qualitative and quantitative assessrnent of sediment
phosphoiipids in two weli defhed, distinct and environmentally important systems. This
evaluation will be achieved in part by (2) detennining whether or not seasonal and spatial
changes c m be observed at either of the rtudy areas usiag NMR. Since seasonai changes in
the microbial biomass are well docu~nented?~~ any fdure of NMR spectra to show

12
systematic changes would suggest that the techaiwe is seriously flawed. Ifseasonal changes
are detected by NMR, spatial changes c m be interpreted as changes in the microbial
comunity. Both richness and abundance of phospholipids will be considered. These terms
are given the foliowing narrow definitions for the purpose of this study. Abundance is
d e h e d as the total amount ofphospholipid present while richness represents the number of
different phosphofipids present in the sample-
The choice of study sites in the KCMA will d o w (3) a cornparison of the
phospholipid abundance and richaess in ponds r e c e h g human effluent with that in ponds
not exposed to a comparable pollution source.
(4) A single expennient is also camed out to explore the rate of naturai degradation
of phospholipids to determine which phospholipids, if any, niMve the winter.
Since the positive identification of a phospholipid revealed by NMR c m only be
obtained by standard addition, (5) attempts will be made to identay individual phospholipids
both by standard addition and by other techniques uicluding electrospray mass spectrometry.
(6) The relationship between the abundance of sediment phospholipids and the
concentration of dissolved phosphorus in the water co lum will be examined. ICP-MS is
combined with NMR in this portion of the research.
Finally, X-ray photoelectron spectroscopy facilities are available and (7) will be used
to explore phospholipid adsorption onto calcium carbonate, one of the most abundant
minerals in each study area.

1.6 References
1. O. A. Chadwick, L. A Derry, P. M, Vtousek, B. J- Huebert, and L. O. Hedin. Naf~re,
397,49 2 (19W).
2- T. Pemanen, H- Fritze, P. Vanhaia, O. Kïikkiiii, S. Newonen, and E. AppL E m
Microbiol., 64,2173 (1998)-
3. E. B u M. Diaz-Ravlna, k Frosteghd and C. Campbell, AppL Env. Microbid, 64,
238 (1998).
4. L. Zeiles and Q. Baï, Sait BioL Biochem., 25,495 (1993)-
5- D. C. White, Microbes in their Natural Environments, J. H- Slater, R Whittenbury and
J. W. T. Wmpenny, Eds., Cambridge University Press, Cambridge, 37-66, 1983.
6- D. Langworthy, R Stapieton, G. Sayler, and R Findlay, Appt- E m Microbiol., 64,3 422
(1998).
7. S. M. PfXher, A V. Palumbo, T. Gibson, D. B. Ringelberg, and J. F. McCarthy, Appl.
Biochern. Biotech., 63, 775 (1997).
8. L. Bardygula-Nonn, J. L. Kaster and T. Glonek, Lipirls, 30, 1047 (1 995).
9. N. Rajendran, O. Matsuda, Y. Urushigawa, and U. Simidu, Appl. Em. Microbid, 60,
248 (1994)-
10. N. Rajendran, O. Matsuda, N. hamura, and Y. Urushigawa, Appl. Env. Microbiol., 58,
562 (1992).
I 1. C . M. Preston, Soil Science, 161, 144 (1996).
12. D. H. R Barton and M. Schnitzer, Nahrre, 198, 217 (1963).
13. 2. R Hinedi, A C . Chang, and R W. K- Lee, J Environ. Q d , 18,323 (1989).

14
14. M. Nègre, M. Gennarï, C. Crechio, and P. RuggÏero, Soli Sci-, 159, 199 (1 995).
15. T. Glonek, "P NMR Spectral Properties in Compound Characterization and Structural
Anaiysis, L- D. Quin and J. G. Verkade, Eds., VCH Publishers, New York, 283-294,
1994.
16. T. O. Henderson, A- W. Kruski, L. G. Davis, T. Glonek, and A M. Scanu,
Bfucherni.sfry, 14, I9 15 (1975).
17. J. R Kramer, S- E. Herbes, and H- E- Men, Nutnents in Natural Waters, H- E. Ailen
and J. R Kramer, Eds., John Wdey& Sons Inc., New York, 51-100, 1972.
18. A F. Bartsch, Role of the Federal Govemment in Controhg Nutrïents in Naturai
Waters presented at the American Chernical Society Symposium on Nutrients in Nitturat
Waters, Los Angeles, Mach 28-Apd 2, 1972.
19. J. R Valentyne, Cm- Res. Dev., 49,36 (1 970)
20. K. R Reddy, R H. Kadlec, E. Flaig, and P. M. Gale, Critical Reviews in Environmental
Science anci Technologv, 29, 83 (1999).
21, J, Vymazal, Algae and EIement Cycling: in Wetlaads, Lewis Publishers, London, 257-
271, 1995,
22. D. J. Newbold, J. W- Elwood, R V. O'Nedi, and A L. Sheldon, Ecology, 64, 1249
(1983).
23. M. H. Deinema, M. Van Loosdrecht, and A Scholten, Water Sci. Technol., 17, 119
(1985).
24. Y. Corneau, K. J. Hall, R E. W- Hanrock, and W. K- Oldham, Water, 20, 15 11 (1986).
25. Fuhs, G. W. and M. Chen, Microb. E c d , 2, 119 (1975)-

26. G. V. R Marais, R E. Loewenhal, and B. M- Simon, Wder Sci- T e c h i - , 15, 15
(1983).
27. J. N. Steinbach, Hvdmeolow of the Old Ausable River Channel (OARCI Watershed,
Grand Bend Ontario, MSc- Thesis, University of Western Ontario, London, Ontario,
1999,
28. Public records fiom the Ministry of Environment and Energy-
29. M. A- Maun, RA Schiacariol and R R Martin, Biolow. Hvdrogeolow and Chemistry
of the Old Ausable River Channel Watershed, Unpublished Progress Report for the
Acadernic Development Fund, The University of Western Ontario, London, Ontario,
1998.
30, A. D'Ulisse and M- A Maun, The Ecolow of The Old Ausable River Channel Flowinq
Throueh the Grand Bend and Pinerv Dune Svstem, Unpublished Report, Department
of Plant Sciences, University of Western Ontario, London, Ontario, 1993.
3 1. Mapping SeMces Branch of Geomatics Canada, Natural Resources Canada, 40 Pf4 O
6" edition and 40 P/5 Q 4h edition, 1985.
32. D. A. Bossio, K. M- Scow, N. Gunapala, and K J. Graham, Microb. Ecol., 36,1(1998).
33. M. Wood, Soi1 Biolow, Blackie and Sons Ltd-, New York, 80-82, 1989.
2. Instrumentation
2.1 Nuclear Magnetic Resonance (NMR) Spectroscopy
Nuclei with non-integer nuclear spins assume quantized orientations in strong
magnetic fields. Transitions between these orientations can be induced with a radio
fiequency electrornagnetic field. The fiequencies at which absorption of radio fiequency
energy occurs can be used to ident* individual atoms and their chernicd state. These
properties are exploited in NMR. An excellent review of the basic principles of NMR
spectroscopy is given by R S. Macornber' and by R K. Harris?
NMR takes advantage of the magnetic properties of certain nuclei. Nuclei with
unpaired (or odd numbers of) protons or neutrons wili have a spin associated with them.
Nuclei with a net spin, such as hydrogen-1 (nuclear s p i . O = %), deuterium (I = l), carbon-
13 (I = %), and phosphorus-3 1 (I = %), have a magnetic moment. When nuclei (I + 0) are
placed in a strong magnetic field (Bo), they wiii adopt 21 + 1 energy States, For nuclei with
I = %, tWO states wi l l occur, parailel (I = %) and antipardel (I = - 54) to the magnetic field.
Since the antiparaliel arrangement is energeticdy less favourable, there wiIl be slightly more
atoms aligned paralle1 to the field than anti-parallel, according to the Boltzmann distributioe
The energy difference (AE) between the two states (EL for the +% state and E, for the -%
state) is equal to:
AE=&- E,=)iyB,
where h is Planck's constant divided by 2x, Bo is the magnetic field, and y is the
gyrornagnetic ratio. This ratio, a collection of nuclear properties, descnbes how much spin

17
state energies of a given nucleus vary 6 t h changes in an extemai magnetic field. The
gyromagnetic ratio is different for a l l magnetic nuclei. Therefore, by v q i n g the field
strength @,), one may huie the NMR experiment to specifk nuclei and M. The sïze of y
plays an important role in the sensitivity of a nucleus, with a larger y (such as that for 'H)
giving a larger AE than a smaiier y (such as that for 3'P).
Before nuclei in these Herent spin states cm absorb electromagnetic radiation, they
must be osciüating in a periodic motion. The nuclei, although statisticaily h e d up with Bo,
are actudy arranged at some angle fiom it. Each nucieus precesses around the axis of Bo
at a characteristic fiequency calied the Larmor fiequency (a).
o = yB,
If a second magnetic field (BI) is generated perpendicular to Bo and this field is oscillating
at the Larmor frequency, the magnetic moments of the nuclei wili Line up and precess with
BI about Bo. When this occurs, the precession of the net magnetic moment can be detected
by Faraday induction within the receiver coil. During irradiation by B,, energy will be
absorbed by the nuclei, prornoting E, to E, by a spin f ip. When the rate of promotion of
nuclear spins fiom the Iower to the higher energy state equals that of r e m to the lower
energy state, as by stimulated emission, no M e r absorption of energy occurs and the
system is said to be saturated. BI is pulsed to prevent saturation, ailowing the nuclei to retum
to their normal Boltzmann distribution in between pulses. The time needed to retum to this
state is known as the spin-Iattice or longitudinal relaxation tirne (T,). Another relaxation
process also occurs; spin-spin relaxation. This is the individual nuciear magnetic moments
rehirning to a random arrangement around the axis of B, The time required to do this is

18
cailed the spin-spin or trausvene relaxation tirne (Ta.
The magnitude of the external magnetic fie'd that the nucleus experiences is aEected
by shielding ftom the surrounding electron cloud and also by electron density in other parts
of the molecule. Changes in electron shielding give rise to nuclei with different Larmor
precession fiequemies which in turn give rise to the chemicai shift In the earlier years of
NMEt, these different nuclei were detected by sweeping B,. With the advent of more
powemil cornputers, al1 fiequencies are analyzed si.multaneously using a brief but powerful
pulse of monochromatic radio fiequency (rf) electromagnetic radiation (Fourier transform
m). A complex rf signal (interference pattern) that incorporates the precession and
relaxation of al1 nuclei is received. This is the fiee induction decay (FID) signal. The
Fourier transform is then employed to convert this signal ftom the time domain to the
fiequency domain, which gives the normal NMR spectm.'
The effective magnetic field that a nucleus experiences can also be affected by the
rnagnetic spin state of neighbourbg atoms. A neighbouring atom with 1 = % will slightly
increase the magnetic field felt by the nucleus and vice versa for an atom with 1 = - % . In
a sarnple, roughly equivalent amounts of each spin state will be found. This will give rise
to two equal peaks for this nucleus. More neighbours (with 1 + O) will give rise to more
combinations of the effective magnetic field experienced by the nucleus, resulting in
additional resonance signals. This is known as coupling. In this work we wish to avoid
coupling of our target nuclei C'P) vvîth surrounding protons. A decoupler is used to this end.
Another magnetic field is added that targets the range of proton resonance fkequencies. This
field causes proton spin flips to occur very rapidly so that the neighbouring ''P experiences

19
only an average of the two magnetic fields, yielding only one signai for each chemically
different phosphorus nucleus-
2.2 Inductive& Coupled Plasma - Mus Spectrometay (ICP-MS)
hductively coupled plasma - mas spectrometry is weU suited for the analysis of
elements at trace levers. This is particuiarly useful in this study since concentration of
phosphorus in water samples c m be very low. The detection I imits for phosphorus for the
ICP-MS instrument used are currently in the 50 ppt range?
The liquid sample is pumped into a nebulizer where it is transformed into an aerosol.
Spray droplets smailer than 10 microns in diametter (to promote high efficiency desolvation,
volatilization, and atomhtion) are then passed on through to the plasma torch. Larger
droplets condense ont0 the walls of the water cooled spray chamber. The inductively
coupied plasma torch then heats the aerosol to approximately 5700 to 6300 K. The ICP torch
consists of three concentric quartz tubes that are surrounded by an induction or load coil. An
inert gas phsrna is used so that Little reaction between analyte and the gas occurs. The quartz
tubes shape and constrain the plasma as well as direct the aerosol through its centre. The
load coil supplies radio fiequency (rf) power which is coupled to the plasma inductively and
maintains the plasma The plasma is initially generated with the introduction of energetic
electrons by the bnef application of a Tesla coil. Within the torch, the aerosol loses solvent,
bonds are broken and the excitation and ionization of the elements occur. Ions are then
extracted fiom the plasma torch, focussed, and accelerated toward the entrance of the mass
spectrometer. Within this interface region, differential pumping reduces the pressure of the

Figure 2.1 : Schematic of an ICP-MS6
1. ICP ion source; 2. interface, including sampler and skimmer cones; 3. transfer and focussing optics; 4. acceleration and beam focussing; 5. entrance slit; 6. electromagnet; 7. electrïc sensor; 8. exit slit; 9. conversion dynode; 10. electron multiplier.
Reprinted with the permission of The Amencan Chernical Society.

21
system. Ions enter a double focussing, reverse geometry magnetic sector m a s spectrometer
for mass separation and detection (Figure 2.1)-
2.3 X-ray Photoelectron Spectroscopy (XPS)
X-ray photoelectron spectroscopy (XPS) , d s o known as electron spectroscopy for
chemical analysis (ESCA), provides chemical information about the d a c e of a sample.
Probing depths range fiom about three to five nanometres and ail elements with an atomic
number greater than three (lithium) cm be detected,
In WS, a monochromatic beam of X-rays is directed at the d a c e of a sample. An
X-ray striking the sarnple can penetrate to a depth of a seveml micrometers. This incident
photon can Uiteract with an electron, causing it to be emitted (Figure 2.2). An electron
ejected fkom depths greater than a few nanometres is usually attenuated by the bulk of the
sample. However, an electron emitted nom a depth of less than a few nanometres can exit
the surface without signincant loss of kinetic energy. The kinetic energy of this
photoelectron c m then be measured using a concentric hemispherical analyser (Figure 2.3)
and the original binding energy of that electron c m be obtained using the following equation:
E,=hu - Eb- @,
where Eb is the binding energy of the electron, hu is the energy of the incident photon, E, is
the kinetic energy of the exiting electron and & is the spectrorneter work fünction.
The resulting electron bindiog energies can be related to specifk orbitals ofelements,
allowing for elemental identification of species on the surface of a sample. The binding
energies are ais0 indicative of the chemical state of the elements present Changes in the

Phosphorus
O vacuum
d 3p - binding 14 3s ---v O
energy - - - - * -photoelectron (eV) 130 2p - -
photoelectron process
Figure 2.2: The photoelectric effect, illustrated for the emission of a phosphorus 2p electron.
. . - (Monochromator) - - - e-Xf
\ -- - - - \: -t------==;;i(?smple -L&------- Gr: ' \ \ \
Detector
I Cornputer
Figure 2.3: Schematic of an X-ray photoelectron spectrometer.
23
electronic configuration of the valence electrom due to bonding will affect the binding
energy of the core electrom. These changes can be detected and allow for chernical state
information to be obtained?
2.4 Ion Chromatography (IC)
Ion chrornatography involves the separation of ions through their distribution between
two phases, a mobile phase (the eluent) and a stationary phase (the column). As the anaiyte
ions in the eluent proceed through the column they replace eluent ions on the stationary
phase. The strength of the ion-stationary phase interaction wiil determine the length of stay
of the ion on the column. As the analyte ion is replaced by an eluent ion, the analyte ion
rnoves M e r d o m the length of the coiumn. This continuai process results in the
separation of the various analyte ions?
At the end of the column, the ions are usually detected by a conductivity detector.
Quantification is achieved by cornparison to a calibration curve made fiom the analysis of
standard solutions of the ions of interest,
2.5 Electrospray Mass Spectrometry
Electrospray ionkation ('SI) is a relatively new method of ionization that permits
the formation of charged ions of high molecular weight molecules such as peptides or
proteins. Multiple charges on these molecules bring them into the analysis range of standard
mass spectrometes. Wiîh ESI, a solution of the anaLyte molecules are moved tbrough a
needle that carries a high voltage (t5.5 kV). At the end of the needle the solution is

24
nebulued into smaü charged droplets that are expelled into a s m d vacuum chamber.
Solvent ions evaporate into the vacuum leaving the analyte ions behind. The analyte ions are
then directed, using a series of lenses, into a quadruple mass spectrometer for analysis?
2.6 X-ray Dinraction @RD)
X-ray difEaction is a powerful tool used to characterize crystalline substances such
as geologic materiais, metals and cerami~s.'~ X-ray powder *action is usefid for geologic
materials in that it c m distinguish between different forms of chemically sunilar compouods
@olymorphs). in XRD, an X-ray beam is used to interogate the sample. As the beam
passes through the crystal lattice of the sample, the X-rays will be diaacted. DBkction is
defined as "a divergence of light fiom its initial line of tra~el".~~ When the X-rays are
scattered by the atoms in the crystal, most of the X-rays will interfere destructively.
However, some will interfere constructively giving bright areas of X-rays in a specinc
pattern, a d-action pattern. This pattern can be captured either by film or electronic
means. Using Bragg's Law, information about the type of various crystal structures in a
sample can be deduced." Bragg's law is as follows:
d = 2d sin0
where n is an integer, A. is wavelength of the incoming X-ray, d is the interplaner distance
in the crystal and 8 is the angle of incidence (and diffraction).

2.7 Static Secondary Ion Mass Spectrometry (SIMS)
Static SIMS uses a focussed ion beam to sputter the rippermost monolayers of a soiid
surface. Sputtered elemental and molecuiar ions are then focussed into a suitable mass
spectrometer to be analysed. Fragmentation patterns can then be used to determine the
species present Detection limits for most species are in the Low ppm range.13
2.8 References
1. R. S. Macornber, A Com~lete Introduction to Modem NMR Soectrosco~~, Wiley, New
York, 1-103, 1988,
2. R. K. h r r i s , Nuclear Mametic Resonance S~ec t rosco~v~ Longman Scientific &
Technical, Essex, 1986.
3. D. A. S koog and J. J. Leary, Princi~les of Instrumental Analysis, Saunders, Fort Worth,
3 17, 1992.
4. 1. B. Lamert, H- F. Shurvell, D. Lightner and R. G. Cooks, Introduction to Organic -
Suectroscoti~, Macmillan, New York, 9-99, 198%
5. W. A. Strobel and W. R. Heineman, Chemicai Instrumentation: A Svstematic A~~roach ,
John Wiley & Sons, New York, 673-722, 1989.
6. L. Moens and N. Jakubowski, Ana[ytical Chemistry News & Features, 25 lA-Z6A,
Apnl 1, 1998.
7. D. Briggs, and M. P. Seah, Eds., Practicai Surface Analvsis: Vol. 1, Wiey, New York,
1-83, 1983-

8. H. A. Strobel and W. R Heineman, Chernical Instnunentation: A Systematic A~~roach,
John Wiley & Sons, New York, 863-959,1989.
9. R C . Cole, Ed., Electromrav Ionization Mass S-pectrometry: Fundarnentals,
hstrumentation & Ab~lications, Wiley, 4-60, 1997-
10. ASM Handbook Conmittee, Metds Handbook. Vol. 1 O. Materials Characterizaiion,
Amencan Society for Metais, Metals Park, 325-343, 1 986.
I 1. R. A. Sherway, Ph~sics for Scientists and Eneineers, Saunders, Philadelphia, 870,1986.
12. B. D. Cullity, Elements of X-ray Difiction, Addison-Wesley, Reading, 1 - M , I 978.
13. D. Briggs, A. Brown, and J. C. Vickerman, Handbook of Static Second- Ion Mass
Spectrometrv (SIMS), John Wiley & Sons, Chichester, 3-1 1, 1989.

3.1 Site Selection and Description
3.1.1 The Old Ausable River Channel
Three sampling sites were chosen based on their accessibility and location dong the
Iength of the river- These sites are indicated in Figure 1.3 - Samples were coliected on both
the north and south side of each site.
The source of the river is locally cailed the Mudhole. This name is retained to
ident* this site throughout this thesis. It was chosen due to its residential location in Grand
Bend where pollution inputs fiom septic systems are suspected to be hi&. A road traverses
the river at this point, Iirnitîng its fiow. The waters are shalIow however, reaching a
maximum depth of only 0.5 metre during the spring. As a result, the Mudhole North, located
on the no& side of the road, experiences dramatic changes throughout the year. The
riverbed fieezes during the winter and in Iate summer may dry out completely. The Mudhole
South is much deeper (maximum depth, 2.5 metres) and is heavily lïttered with detntal plant
material.
The second sampiing site, the Canoe Docks, is located at the river's only dam. The
water level is highest at this site and an accumulation of organic material behind the dam is
evident. Anthropogenic activity is Likely also greatest at this site within the Pinery Provincial
Park since it provides river access for canoeing, fishing and swimming. The Canoe Docks
South also has facilitated access in the fonn of a small dock,
A third sampling site was chosen close to the mouth of the river at the Burley Bridge.

28
Water levels at this site remain fiirly constant throughout the year and a culvert prevents an
interruption to the river's flow.
3.1.2 The Kirk Cousins Management Area
Three kettle ponds were chosen for study in this region; Regina Mundi Pond, Pond
Mu and Tude Pond- Figure 1-4 indicates the location of these ponds in the area.
Regina Mundi Pond, the largest of the three, is located directly behind Regina Mundi
Coilege. Aithough it now receives treated sewage fiom the school, waste once entered the
pond without treatment, One sampling site was chosen near the waste effluent output and
another about 300 metres fiom this site, at the southern most tip of the pond.
Pond Mu is the smaliest of the three ponds. It is surrounded by meadow and was
chosen due to its apparent isolation fiom Regina Mundi Pond.
Turtle Pond is located in a forested area of the KCMA and also appears isoIated fiom
Regina Mundi Pond.
3.2 Experimental
3.2.1 Sediment Collection
Sediment corers were designed in consultation with Dr. M. Powell fiom the
Department of Earth Sciences, They were made fiom polyvinylchlox-ide tubing, two metres
in length and 5.7 centimetres in diameter. Each corer was bevelled on the inside at one end
by Irold Schmidt in the machine shop of the Physics and Astronomy Department to create a
thin, sharp edge.

29
Sediment cores were coilected fkom the OARC in the second month of every season
fiom October 1997 until April1999. The Kirk Cousins ponds were sampled from October
1998 un61 July 1999. The corer was driven into the sediment and the bevel ensured that the
sample remained intact when the corer was subsequendy removed Ideally, these samples
were collected fiom a water depth of 0.5 me= The top 5 cm of sediment was retained for
analysis. There was some selection however. Grave1 portions of the nverbed &en darnaged
the corers and prevented m e r penetration of the nverbed and on occasion evaporation
reduced water levels to such an extent that the water depth critenon could not be met- As a
result, in the second year of sampling, a shovel was used for sample collection.
Generally, several samples fiom any given site were amalgamated into a single
sample both to ensure that sufncient phospholipid could be extracted for subsequent analysis
and to produce a sample that was representative of a selected area. Once each season
additionai samples were coilected and analysed for cornparison. Al1 sediment specimens
were seaied in plastic and fiozen in-situ with dry ice to ensure the preservation of the material
before analysis,
Phospholipids are regarded as short term biomarkers with a comparatively short h a -
life in the environment. Since the sampling protocol used in this work required sampling
over a twelve month period, a simple experiment was designed to establish which, if any,
phospholipids swvived the winter andor what degradation products could be identified in
the sample. Ln the fd of 1998, an amalgamated Canoe Docks North sample was divided in
haK One portion was analysed immediately while the other was left outside in a bucket of
O A K water for 100 days before analysis, the "balcony sampleyy.

30
3.2.2 P hosp holipid Extraction
The phospholipid extraction procedure used in thîs study is based on the method that
was modined for sediment analysis by Bardyguia-Nonn et ai- The original procedure was
developed for biological tissue analysis by Foich et al.' It provides a quantitative separation
of a phospholipid mixture that may be used to ident* sediment types and to monitor
pollution.
Sediment specimens were airdriedand passed through a 500 jun soii sieve to remove
any detrital plant material and macrouivertebrate fauna. 40 g samples of drïed sediment were
then added to 600 ml of a chloroform / methanol(2:l) solution and mixed vigorously for 24
hours using a Burreil Wrist Action Shaker. The mixture was filtered in two steps through
VWR Scientific qualitative filters and Gelman nylon membrane nIters (pore size, 0.45 pm).
This two step process ensured the removal of suspended particdates which decreased the
signal to noise in the nuclear magnetic resonance spectrum. 120 ml of scrubbing reagent (0.2
M K-EDTA and 0.2 M KH2P0,) were added to the extract and the mixture was shaken for
five days. The scrubbing reagent is required to remove any ofthe paramagnetic ions that may
broaden or quench the NMR resonance signals. M e r scrubbing, the mixture was placed into
a separatory funne1 for 24 hours to completely separate the organic and aqueous phases. The
organic phase was then collected and evaporated to dryness at 37°C. The sample was
redissolved in 3 0 ml of the chloroform / methanol mixture and then placed hto a separatory
b e l . 6 ml of 0.2 M K-EDTA were added and the mixture was shaken and left to separate.
Any residual K-EDTA in the chloroform phase was compietely removed in this second
scmbbing step. The organic phase was recovered a second time and nui through a Varian

31
Bond Elut silica column to concentrate the phospholipid. The column was prepared and the
phosphoiipids were eluted according to the procedure outhed by Zeiles and ai? The
sample was once again evaporated to dryness in preparation for 3'P EIEYIR analysis. A yellow
to dark brown extract is produced.
33.3 "P NMR Reagent Preparation
The Cs-EDTA was prepared by titrating a suspension of the acid with cesium
hydroxide until the last crystal of EDTA dissolved. A final pH of 6.0 was determined using
a Corning 220 pH meter. The solution was then evaporated to dryness. The Cs-EDTA was
redissolved in distilled, deionized water to produce a 1 .O M solution. This reagent is reported
to be stable indefinitely at C?
3.2.4 Sample Preparation for "P NMR Analysis
The phospholipid sample was prepared in a 10 mm NMR tube in deuterated
chloroform at a concentration of 25 mg/ml. 0.5 ml of rnethanol and 0.5 ml of aqueous
Cs-EDTA were then added. Tetraphenylphosphonium bromide was used as an interna1
standard for chemicd ski? reference and quantification. The mixture was shaken thoroughly
and the aqueous layer of methanol and Cs-EDTA was left to separate to the surface of the
sarnple. The aqueous layer need not be removed as it does not affect the experiment and
serves to minimize the evaporation of the organic solvents durhg analy sis. Samples may be
stored refrigerated at 5 OC for up to four months and still produce identical NMR spectra.

32
3.2.5 3'P NMR Spectroscopy
The NMR instrument used in this study was a Varian XL-300 system operating at
12 1 -42 MHz for "P with a magnetic field of 7.2 Tesla The spectra were recorded at ambient
temperature and at a spin rate of 15 Hz. A proton broadband decoupler was applied to
prevent any mutliplets due to 'H - 3'P interactions. Each resonance signai represents one
phosphoiipid species-
The spectrometer scan conditions used were: single pulse sequence; pulse width, 8-6
ps (74 O); spectral window, S000 Hz; fiee-inductiondecay size, 12,800 channels; acquisition
tirne, 1.28 s; number of acquisitions, 40,000 - 70,000; line broadening, 1.000. The total
andysis thne per sample is 12 - 24 hours.
3.2.6 Phospholipid Quantification
The material extracted fkom the sediment contains phospholipids, otherceli iipids and
organic material which is soluble in the chioroform/methanol mixture. Accordingiy, a simple
weighing of the extract does not provide a good mesure of the mass of phospholipid in the
sediment.
Unfortunately, an accurate quantification of total phospholipid cannot be obtained by
integrating the entire spectral region for phospholipids. Some spectra have broad baselines
which are not iniproved by M e r scmbbing. The baseline is reported to be characteristic
of polymenzed and crosslinked phospholipids.' An integration incorporating this baseiine
will elevate concentrations. It c m however be corrected with modem NMR instruments.
Individual phospholipid concentrations were determined through the spectral

33
integration of each resonance signal foliowed by cornparison to a suitable reference under
f U y relaxed NMR conditions. Totai abundance was determined by adding the individuai
phospholipid concentrations in each sample. In this thesis, concentration is reported in moles
of phosphorus per gram of dry sediment Appendix 1 presents the individuai phospholipid
concentrations at each site thmughout the year. Total moles or mass of a particuiar
phosphofipid cannot be reported without c o ~ t i o n of phospholipid identity- In addition,
the fatty acid side chaîns do not affect the chemical shift of phosphorusL and as such each
resonance signal represents a particuiar phospholipid with a variety of side chains of dieerent
molecular weight. An estimation of average molecular weight would be necessary to provide
the approximate mass of each phospholipid present.
Some phospholipids were not quantified due to the integration ditFculties
encountered fiom extensive spectral overlap- In these cases, their concentrations are included
in the value reported for the main peak. Appendk II provides the complete spectral library
for the sites in this study. The spectra should not be compared visudy for relative
phospholipid concentrations as peak widths Vary and vertical scales ciiffer. These spectra
shouid only be used for a cornparison of chexnical shifts and sample richness.
3.2.7 Phospholipid Identification
The experimental and instrumental parameters used in this study are not identical to
those reported in the literahire and consequentiy the chemical s h f i reported here do not
correspond to fiterature values. Phosphoiipid identification was therefore attempted by
standard addition.

34
In the chIorofodmethanol reagent, chemicai shift does not depend on the length of
the fatty acid side chahs of the phospholipids ifthey are longer than six carbon atoms or on
the presence of double bonds.' Shifts c m Vary however, dependhg on a number of other
factors- NMR field strength and analysis temperatures have an effect on chemical shift.
Phosphatidic acid aiso shows a chemical shift dependence with changes in pH between pH
5 and 13.' The increase in solution acidity hcreases the shielding of the phosphorus
nucleus ,6
Some lipids exhibit a linear shift with the log of total phospholipid concentration
where chemical shifk decreases with increasing concentration. Lipids that are negatively
charged show this dependence as well as ethanolamine plasmaIogen. Zwitterionic and
neutrai lipids do not demonstrate thk dependence?
Small differences in sample environment evoke substantial NMR shift changes.
Figure 3.1 shows the effect of adding phosphatidylinositol to a mixture of pure phosphoiipids
in chloroform- The chemicai shifts of these standards are not comparable to the sample
spectnim due to the complex matrix composition of sediment which may alter shifts
substantially ,
The presence of cations in solution can aiso cause shift variations. Ammonium and
the allcali metals cause only rninor shift changes but the effects of sodium on phosphatidic
acid can be c~nsiderable?*~' Shifts Vary widely with the alkaline earth cations and can cause
broadening, especially with magnesium.7*8 Transition metais and trivalent cations have k e n
shown to cause extensive broadenuig or q~enching"'~ by paramagnetic relaxati~n.'~ In the
case of soils and sediment, iron is &en the principle cation involved. This can complicate

LPA 6 = 1.977 pprn LPG 6 = 1.905 pprn PG S = 1.348 pprn PA 6 = 1224 ppm PE 6 = 0.898 pprn S M 6 =0.838 pprn LPC 6 = 0.627 pprn PC 6 = 0.03 1 pprn
LPA 6 = 2.052 pprn LPG 6 = 1.860 pprn PG 6 = 1.330 pprn PA 8 = 1.252 pprn PE S =0.876 pprn S M 6 = 0.830 pprn LPC S = 0.616 pprn PI 6 = 0.325 pprn PC 6 = 0.030 pprn
-- --
Figure 3.1 : NMR spectra of phosphoiipid standards; (top) nin 9 and (bottom) run 1 O with the addition of phosphatidylinositol.

36
quantification as well as identification due to peak overlap and the difficulties in the accurate
determination of integration Limits. Fortunately, very s m d changes in solvent composition
c m cause substantid chemicai s W . Studies altering the ratios of chlorofom to methanol
to water have found that adequate separation of broad, overlapping resooance signals can be
achieved, ' Changes in the countercation of the EDTA salt in the aqueous layer of the NMR
reagent alters the chernical shifts of anionic phospholipids. However, phosphoiipids
containing a covalentiy bonded positively charged group do not show a countercation
dependent shift.' The Cs-EDTA salt is used exclusively in the NMR reagent in this study.
Many of these chemical shift problems may be prevented. Field strength, temperature
and solution pH can al i be controiled. Moreover, scrubbing with EDTA and phosphate
should minimize the cations in solution. The greatest concern in this work is the variability
of phospholipid concentration and matrix composition in environmental samples since the
phospholipid NMR signals are dependent on these uncontrolled variables,
3.2.8 X-ray Diffkaction
Suspended particdate material fiom the Kirk Cousins ponds was finely ground for
XRD analysis. Analyses were performed by Ms. K. Law fiom the Department of Earth
Sciences. A Rigaku X-ray Diffractometer equipped with a copper X-ray tube source was
used for the analyses presented in this work. The copper cathode was held at 20 kV and the
tube current was 40 mA-

37
3.2.9 Materiais
Reagent grade extraction solvents were purchased fkom Caledon Laboratories Inc.
99 % pure phospholipid standards were provided by Sigma Chemical Company with the
exception of phosphatidylinositol which was suppiïed by Fluka Biochimika. Deuterated
chloroforrn fiom Cambridge Isotope Laboratories, tetraphenylphosphonium bromide and
cesium hydroxide fiom Aldrich Chemical Company Inc. and ethyf enediaminetetraacetic acid
fkom BDH Inc. were also purchased for these experiments. AU reagents were used as
received fiom the suppliers.
3.3 Results and Discussion
3.3.1 The OId Ausable River Channel
An examination of Table 3.1 reveals a seasonal phospholipid pattern in both total
rïchness and total abundance- A minimum is observed for both indicators in winter which
caries into spring, with a maximum during the summer and autumn. Microbial activity,
measured using soi1 respiration rates, has been shown to slow considerably duriog the winter
months in temperate climates while the comrnunîty thrives under warm conditions." That
is not to Say that some types of microbes cannot survive cold temperatures. Some bacteria
thive in arctic environments while others are able to flourish in hot, arid ~limates.'~ Studies
suggest that it is the temperature fluctuations that have a more pronounced effect on the
microbial cornmunity than constant extceme condition^.'^ In temperate climates, few
microbes survive the cold of winter but wann nimmer temperatures provide optimal growing
conditions. Plant litter in the fâll supplies additional nutrients to the microbes for ce11
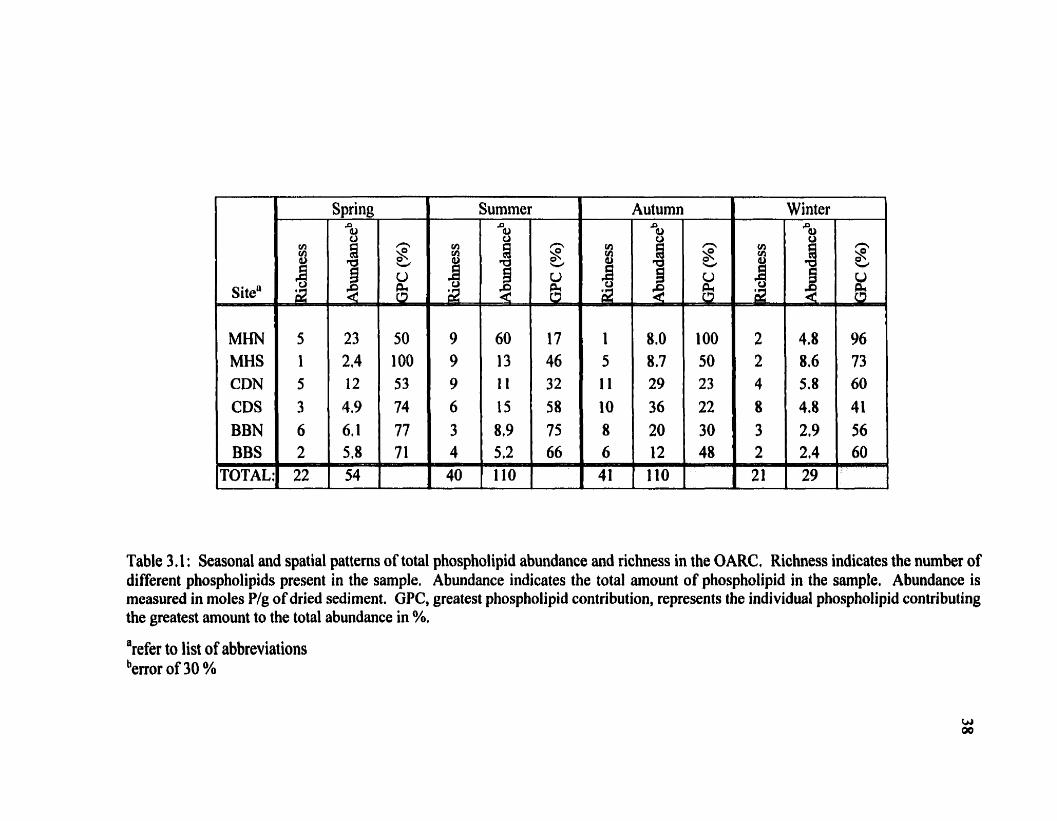
1: TOTAL
Spring Autumn 1 Winter 1
Table 3.1: Seasonal and spatial patterns of total phospholipid abundance and richness in the OARC, Richness indicates the number of different phospholipids preçent in the sample. Abundance indicates the total amount of phospholipid in the sample. Abundance is measured in moles P/g of dried sediment. GPC, greatest phospholipid contribution, represents the individual phospholipid contributing the greatest amount to the total abundance in %, a refer to list of abbreviations berror of 30 %

39
maintenance, growth and repli~ation.'~ An increase in the amount of organic material is
generaily indicative of an increase in microbial biorna~s.'~ Variations in the organic content
of the d a c e sediment at each site may also suggest spatial variation in microorganisms
within the OARC. Figure 3.2 ilIustrates the seasonal and spatial changes in richness
observed in the Old Ausable River Channel-
Aimost every sampling site in the OARC exhi'bits the same richness and abundance
pattern as shown in Table 3.1. The Mudhole is an anomaiy. This site is most impacted by
humau activity and experiences dmmatic changes in water content throughout the year. It
often dries completely by the end of the summer and the sediment fieezes during the winter.
Drying and re-wettuig have been s h o w to cause more pronounced changes in the rnicrobial
community than fieezuig and thawing. Drying kiiis some of the microbial population while
re-wetting causes rapid growth." The Mudhole North exhibits drylwet cycles. When the
system dries out completely, as it did in September 1998, there is a marked drop in
phospholipid abundance and richness. Re-wetting under favourable growth conditions wodd
not have occurred until the temperatures rose in the spring. It might be noted that the
Mudhole sites are also compromised by drainage tiles and locd road work.
The Canoe Docks sequence exhibits the highest richness and abundance in this
system. This may be attributed to the interrupted flow at the river's dam. Sedimentation
above the dam, at the Canoe Docks North site, creates an environment rich in organic
material which resuits in greater abundance and richness in the microbial biomass. Increased
oxygenation and material dispersion around the dam spillway favours a vigorous microbial
commmity at the Canoe Docks South site.

Abundance: 2-4 nmol P/g dry sediment Richness: 1
--
Abundance: 12.8 nmol P/g dry sediment Richness: 9
Abundance: 8.9 nmol P/g dry sediment Richness: 3 E
I
Figue 3 -2: NMR spectra of (top) Mudhole South, spring 98, (Iniddle) Mudhole South, sumnier 98, and (bottom) Burley Bridge North, sumoier 98.

41
GPC in Table 3.1 indicates that it is possible for two samples to have the same
richness while one sample is dominated by a single phospholipid. It is tempting to subdivide
rkhness into two categones but it is important to note that GPC may sirnply be a samphg
artifact. Nevertheless, phospholipid richness may be a good measure of the diversity of the
microbial community.
A detaïied quantification of all the phospholïpids appearing in the NMR spectra is
provided in Appenduc 1. Phospholipids that have not been identined have been assigned a
letter for later reference. Those for which a positive identification has ken obtained are
labelled with an abbreviation of their chemical name. A List of the names correspondhg to
these abbreviations is found on page xiv.
E and K are the most abundant and persistent phosphoiipids. Figure 3.3 compares the
autumn Canoe Docks North sample analysed in October to the same Canoe Docks North
sample which was ieft outside in OARC water for 100 days. K persists weH into the winter
while the ten other phospholipids present appear to have decomposed.
3.3.2 The Kirk Cousins Management Area
The Kirk Cousins Management Area is a more complex system than the Old Ausable.
The ponds thernselves are not equivalent as they dEer in d a c e area, depth, and shade
cover, as well as in flora and fauna. DBerences in system turbidity and evaporation M e r
complicate the phospholipid results fiom each pond. In addition, Regina M u d i Pond
receives waste effluent, one of the reasons we chose this site.
The overall pattern shows the greatest phospholipid abundance in spring and winter

Richness: I I Abundance: 28.8 nmol P/g dry sediment E
I
Abundance: Richness: 1
2.4 mol P/g dry sediment
Figure 3 -3 : NMR spectra of a sample fkom (top) Came Docks North, autumn and (bottom) same sample following 100 days outside in OARC water (Balcony sample).

43
and the greatest richness in summer, autumn and winter (TabIe 3 2 ) . This behaviour con-
with that observed in the OARC. We attn'bute this ciifference partly to the hirbidity caused
by wind and wave action observed in each of the ponds. Smali bottom dweliïng catfïsh
called madtoms (Notuncs *nus) may also contribute to the resuspension of the fine cIay
sedirnents. Dr. K. Dewdney 6rom the Department of Zoology has identified a population of
madtoms which may be unique to Pond Mu.
Figure 3 -4 is an X-ray dif5action pattern of the suspended particuiate material in Pond
Mu in the Sumner. Silica, calcite, feldspars and clays are some of the major mineral
components. This particuiate matter provides abundant surface area to scavenge microbes.
Many species of bacteria, caiied penphytes, characteristicdy grow while attached to solid
surfaces'" and clays are known to provide adsorption sites for microbes.l5 This results in a
decrease in the observed sediment phospholipid. In addition, turbidity reduces light intensity
which affects the photosynthetic zone. As this study deah with the littoral-benthic zone, a
region dong the shore where light ofien penetrates to the pond bottom, light reduction may
result in a decline in mauy sediment microorganisms. The effect of light on the microbiota
in estuarine sediment was an increase in biomass in many microbial classes, with the greatest
effect on the population of diatoms, a type of algae.16 In winter, when the ponds fieeze, wave
action ceases and the suspended particdates settle out, frnally contributing to the mass of
sediment that is collected and analysed.
The second perturbation to this system is effluent fiom Regina Mundi College. This
has two effects on the neighbouring pond. It adds bactena and phosphorus and maintains the
water level even when the other ponds are aected by drought. Abundance is always higher

Spring
Table 3.2: Seasonal and spatial patterns of total phospholipid abundance and richness in the KCMA. Richness indicates the number of different phospholipids present in the sample. Abundance indicates the total amount of phospholipid in the sample. Abundance is measured in moles P/g of dried sediment. GPC, greatest phospholipid contribution, represents the individual phospholipid contributing the greatest amount to the total abundance in %. a refer to list of abbreviations benor of 30 % 'net detected

D - dolomite G - gypsum M - muscovite 1 - illite
- -
Q-9- F - feldspars C - calcite Q
C
Figure 3.4: XRD spectnun of suspended particdate matter fiom Pond Mu in summer 98.

46
at one of the sampIiag sites withui this pond, no doubt because of the input.
Pond Mu and Turtie Pond are the most difficult to explain. It would appearthat Pond
Mu was most afEected by drought, It is the smallest, possibly the warmest pond and the most
susceptible to evaporation. Pond Mu is also very shdow, making it especiaüy vulwrable
to hirbidity. Turtle Pond is the le& turbid and appears to contain the most detrita1 0rgan.k
matter- It is aIso the most shaded in summer which might explain the low richness found at
thïs site. Sampling artifacts may confise our interpretation.
Appendix 1 shows the quantification of the individual phosphoiipids fond in each
sample from the KCMA. Once again, phospholipids K and E are the most abundant and
persistent. Ln fact, unlike the OARC, no other phospholipids show a strong presence in these
ponds.
3.4 Phospholipid Quantification
Concentration variability in samples fiom the same site in the same season is to be
expected in environmental studies. An estimation of sampling error was obtained through
the anaiysis of multiple Canoe Docks samples. The analysis of five samples fkom the Canoe
Docks North during the spring gave a sampling error of 10 %. This error might only be
reduced by additional sampling. Figure 3.5 iiiustrates the sample consistency seen in richness
and abundance for the Canoe Docks site. One M e r sample was collected in the subsequent
spring of 1999 for comparison. Although abundance has increased, the richness and relative
phospholipid concentrations are surprisingly consistent.
Determinate or systematic error was assessed at 20 %. The greatest contribution to

- . - -
Abundance: 11.8 m o l P/g dry sedhent Richness: 5
Abundance: 13.8 nmol P/g dry sediment Richness: 6
Abundance: 21 -8 nmoI P/g dry sediment Richness: 7
Figure 3.5: NMR spectra of Canoe Docks North samples; (top) amalgamated sample, spring 98, (middle) single sarnple, spring 98, (bottom) spring 99.

48
this was in weighuig the s m d mass of intemal standard. Integration e m r is inciuded in this
value and is based on five integrations of a siugle sample. Integration problerns inciude the
poor baselines encountered in severai spectra and peak overlap due to broad resonance
signals. Once again, s m d changes in solvent composition c m elicit substantial shift changes
in some phospholipids. This c m be used to achieve better separation of resonance signais
for accurate quantification"
The quantincation procedure was verifïed in the sediment matrix. 1 mg of 99 % pure
phosphatidylcholine was added to the Mudhole North winter sample due to its low nchness.
Normal extraction and quantification procedures were used yieIding a 93 % recovery.
3.5 Phospholipid Identification
It is now possible to distinguish between many of the major groups of microbes by
their signature lipids." Phosphatidylglycerol is found predominantly in bacteria whiie
phosphosphingolipids are rare in bacteria but have k e n found among the anaerobic
fermenters. Plasmalogens are signature lipids for anaerobic bacteria and are rarely found in
higher plants, fish or moliuscs. Methane fonning bacteria predominantly contain
phosphatidy linositol and the di and tetra-phytanyl gl y cerol ether phospholipids. '' The identification of signature iïpids, used in the Lipid fatty acid analysis, has aiiowed
researchers to leam a great deal about the effects of pollutants on the microbial community.
For example, soi1 acidity has been shown to have a greater effect on bacterid biomass than
on fbngi and some reports have even shown an increase in fungi.I8 PAH contaminated
sediments were discovered to be nch in aerobic gram-negative bacteria and in the

49
heterotrophic microeukaryotes which feed on thm. Ambient sedlments were emiched in
gram-positive bacteria and anaerobic gram-negative bacteri;t19
Before any conclusions may be drawn about the health of the OARC or the KCMA,
phospholipid identification must be complete. So far, phosphatidylethanolamine,
phosphatidylcholine and lysophosphatidylcholine have been identified by standard addition.
Further attempts at identification are outlined in chapter 5.
3.6 Conclusions
The Old Ausable River Channel shows strong variation in microbial activity witb a
maximum in the summer/autumntumn This agreement with the existing literatm on temperate
zone microbes shows that NMR phospholipid andysis provides a means of monitoring the
microbid communïty.
The Kirk Cousins Management Area shows anomalous seasonal behaviour. We
believe the major cause is the high turbidity of the water either because of wind and wave
action a d o r bioturbation by bottom dweliïng fish.
The Regina Mundi Middle and South sites show the greatest abundance in the Kirk
Cousins system. We attribute this primarily to effluent input but note that the flow fiom
Regina Mundi College maintains the water level in this pond so it is not subject to drought.
Pond Mu is the most subject to drought while Turtle Pond is more shaded. These
factors may explai. our observations in these ponds.
Phosphatidylethanolamine, phosphatidylcholine and lysophosphatidylcholine have
been positively identified. E and K, the most persistent and widespread phosphoiipids, have

yet to be identified- This may uidicate a persistent rnicrobid source.
FinaIly, the baicony sample c o n f b s that the phospholipids have a rapid turnover in
sediments, Future work will focus on monitoring short-term changes in phospholipid
profiles.
3.7 References
I
L. Bardygula-Nom, J. L. Kaster and T. Glonek, LipiriS, 30, 1047 (1995).
J. Folch, M. Lees, and G. H. SIoane Stanley, J Biol- Chern-, 226,497 (2957).
L. Zeiles and Q- Bai, Soil BioL Biochem-, 25,495 (1993).
P. Meneses and T. Glonek, J. Lipid Res., 29,679 (1988).
T. Glonek, Phos~horus-3 1 NMR Spectral Properties in Cowound Characterization and
Structural Analvsis, L- D. Quin and J. G. Verkade, Eds., VCH Publishers, Inc., New
York, 283-294,1994-
M. M. Crutchfield, C. H. Dungan, J. H. Letcher, V. Mark, and J. R Van Wazer, 3 ' ~
Nuclear Mametic Resonance: Topics in Phos~honis Chemistrv. Volume 5, John Wiley
and Sons, Inc., New York, 1967.
T. E. Merchant and T. Glonek, Lipiak, 27,551 (1992).
K. Panchaluigam, S. Sachedina, J. W. Pettegrew, and T. Glonek, Int J. Biochem., 23,
1453,1991.
A. J. R. Cosello, T. Glonek, and J. R Van Wazer, Inorg. Chern., 15,972 (1976).
T. O. Henderson, A. W. Druski, L, G. Davis, T. Glonek, and A. M. Scanu, Biochemisby,
14. 1915 (1975).

51
1 1. M. Branca, N- Cdeddu, M- Fnrianu, and M. V. Serra, Anal- Biochem., 232,1(1995).
12- M. Wood, So2 Biolom, Blackie and Sons Ltd,, New York, 80-82, 1989.
13. N. S. Subba Rao, Soil Microoreanisms and Plant Growth, 3" Edition, Science
Publishers, Inc,, New Delhi, 21-50, 1995.
14. M. J. PeIczar, Jr., R. D. Reid, E. C. S. Chan, Microbiotoa: 4h Edition, McGraw-Hill,
Inc., New York, 724-746, 1977.
15. S. J- MaIcohn and S. O, Stanley, Sediment Mi~robiolow~ D. B. Nedwell and C. M.
Brown, Eds., Academic Press, London, 2, 1982.
16. R. J. Bobbie, J. S. Nickels, G. A. Smith, S. D. Fazio, R H. Findiay, W. M. Davis, and
D. C. White, Appl. Env- Microbiol., 42, 150 (198 1).
17. D. C . White, Microbes in their Natutal Environments, J. H. Slater, R. Whittenbury and
5. W. T. Wimpenny, Eds., Cambridge University Press, Cambridge, 37-66, 1983.
18. T. Pennanen, H. Fritze, P. Vanhala, O. Kukkilii, S. Neuvonen, and E. BiZth, Appl. Em-
Microbiol., 64,2 173 (1 998).
19. D. E. Langworthy, R. D. Stapleon, G. S. Sayler, and R. H. Findlay, Appl. E m
Microbiol., 64,3422 (1998).

4. Water Anaivsis for Dissoived Phos~horus
4.1 Introduction
Dissolved phosphorus is defined as that portion of phosphorus in the water column
that wili pass through a 0.45 pm filter.' Aithough the dissolved inorganic phosphorus is
generaily considered to be available to plants, both the inorganic and organic forms may be
assimilated by the microbial commUnity.l Microorganisms play a major role in the
sequestration of dissolved phosphorus in systems receiving high inputs of organic matter.
Systems such as the OARC receive significant leaf litter nom the shoreline littoral zone
whiie the KCMA has organic and phosphorus loading problems associated with waste
effluent Under these conditions, microorganisms are capable of incorporating phosphorus
into theïr cellular components to form polyphosphate, allowing them to survive alternathg
oxidizing and reducing environments.' Under conditions that disrupt the microbial
community, a rapid release of phosphorus has been observed?
Inductively coupled plasma mass spectrometry has been employed to determine the
total dissolved phosphorus at each site in the two study areas. These data have been used to
explore the relationship between dissolved phosphorus and microbial community abundance.
4.2 Experimental
4.2.1 Sample Collection
125 ml water samples were collected at each sarnpling site in the Old Ausable River
Channel in the second month of every season fiom April1998 mtil January 1999. The Kirk

53
Cousins Management Area was sampled nom July 1998 untii April 1999. Samples were
coliected fkom a water depth of 0.25 metre, halfway between the surface of the water and the
sedimedwater interface. The samples were coiiected in the same sampihg locations as the
sediment collection. Clean nalgene bottles were rinsed several times in the river prior to
being fïiied and capped. Gloves were wom to prevent phosphorus contamination.
43.2 Sam ple Preparation for ICP-MS Analysis
Water samples were fltered through Gelman nylon nIter membranes (pore size, 0.45
pm) to remove suspended particdates. After filtration the samples were analyzed by C.
Bradley on a Finnigan MAT ELEMENT ICP-MS at the London Health Sciences analytical
facility at University Hospital.
4.3 Results and Discussion
4.3.1 The Old Ausable River Channel
Disso lved phosphorus is negatively correlated with phospholipid abundance. When
phospholipid abundance is high, aqueous dissolved phosphorus is relatively low. Figure 4.1
illustrates the typical relationship observed at each of the sampling sites? The dissolved
phosphorus data can be found in Table 4.1. In spring, as the system begins to regenerate,
phosphorus is slowly removed fkom the water column and is assimilated by the microbial and
plant communities. Dissolved phosphorus is at a minimum during the autumn when
' There is a displacement in the dissolved phosphorus maxima af the Mucihole site. Due to this anomalous behaviour, attributed to drying, fieezhg and human activity, the behaviour of the other sites is considered to be typical of the undisturbed Old Ausable system,

54
the microbiai community is most active. Findy, during the winter rnonths, plants and
microorganisms die, releasing phosphorus back into the water column. Dissolved
phosphorus reaches a maximum during the spring which resttvts the cycle.
Total Dissolved Phosphorusb @pb) I ( Fall -
DRY 24 4.3 2.8 6.8 23
Table 4.1 : Seasonal and spatial changes in total dissolved phosphorus in the OARC.
"refer to list abbreviations benor of 15 %
- -
Dissolved Pl Phospholipid Relationship Buriey Bridge North
Season - R - e - Dissolved Phosphorus Phospholipid
Figure 4.1 : Typical relationship between dissolved phosphorus and phospholipid abundance in the OARC.

55
4.3.2 The Kirk Cousins Management Area
The pattern of dissolved phosphorus in the KCMA contrasts that observed in the
OARC. Values soar during the autumn as seen in Table 4.2. This atypical behaviour is
partially due to the high turbidity in the ponds during the summer and autumn. The
suspended particdate materiai provides adsorption sites for both periphytes and
orthophosphates. ' Investigations into the exchange ofphosphorus across the sedimentlwater
interface have shown that wave action and wind-induced turbidity can cause a substantiai
release of phosphorus into the water column.' Both the iiberation of adsorbed phosphate as
well as the mWng of sediment pore water with the water column contribute to the large
increase in total dissolved phosphorus-' Moreover, the suspension ofsediment particles with
signifïcant phosphorus buiding capacity may aid in its subsequent re-sedimentation, causing
a substantial decrease during the whter months when wave action has ceased. The hirbidity
induced death of the microbiai community, resulting fkom the reduction in light intensity,)
may aIso cause a large release of phosphorus. Figure 4.2 austrates the relationship between
phospholipid abundance and dissolved phosphorus at each of the sampling sites in the
KCMA. Almost every site shows a negative correlation with maximum dissolved
phosphorus and minimum phosphoiipid in the autumn.
However, the Regina Mundi South site shows a positive correlation. Both total
dissolved phosphorus and phospholipid abundance reach a maximum in the autumn. There
may be a reduction in turbidity at this site because extensive reed beds damp out wave action,
resulting in a local increase in sediment phospholipid (as discussed in section 3.3.2). The
trend in dissolved phosphonis foliows that of the entire pond due to diffision. Further

sampling wïii be required to adequately explain this anomaiy.
It should aiso be noted (see Table 4.2) that Pond Mu contains the highest levels of
dissolved phosphorus in the autumn, up to eight times higher than the other two ponds. The
death and decay of the madtom catnsh that inhabit this pond may be a contributhg factor.
Their deaîh has been linked to a toxin produced by a blue-green aigae, Aenrginosa sp., that
was identified Î n water samples fiom the pond by Dr. K. Dewdney . Regina Mundi and Tuale
Ponds do not have a madtom population.
The high temperatures and low precipitation rates in the summer of 1998 resulted in
a substantiai decrease in the volume of Pond Mu thus increasing the concentration of
dissolved phosphorus species. Evaporaîion did not have a marked effect on either of the
other ponds. Regina Mundi's water Levels are artifïcidy maintained by the effluent fiom
Regina Mundi Coiiege and Turtle Pond is &cientiy sheltered by surrounding trees to
reduce water Ioss by evaporation.
RMM RMS MU TP
Total Disaolved Phosphomsb (ppb)
Table 4.2: Seasonal and spatial changes in total dissolved phosphorus in the KCMA.
"refer to List of abbreviations benor of 15 %

Dissolved P/ Phospholipid Relationship Regina-Mundi Middle A
T i
- Season - z
+ Dissolved Phosphorus . Phospholipid
DissoIved P/ Phospholipid Relationship Pond Mu
Season - DissoIvcd Phosphonrs . PhosphoIipid
Dissolved P/ Phosphoiipid Relationship Regina-Mundi South w A
-- a
Season h - Dissoived Phosphorus Phospholipid
Dissolveci P/ PhosphoIipid Relaüonship Turtle Pond
- Dissolved Phosphonis Phospholipid
Figure 4.2: The relationship between total dissolved phosphonis and phospholipid abundance at each site within the KCMA.

4.4 Conclusions
There is good negative correlation between phospholipid abundance and aqueous
phosphorus in the Old Ausable system. This is consistent with seasonal cycles in sediment
microbiai activity.
The Old Ausable exhibits minimum aqueous dissoIved phosphorus and maxUnum
phospholipid abundance in the autuInn. This is consistent wïth maximum plant and
microbiai growth prior to the omet of winter.
The Mudhole represents an anomalous site both because of direct human impacts
such as road building as weli as fieezing and drying of the shaüow water and sediment at this
site.
n i e KCMA sites also show a negative correlation between aqueous dissolved
phosphorus and sediment phospholipid abundance- However, the dissolved phosphorus
maximum occurs in the autumn. We attribute this singular behaviour to turbidity caused by
wave action with a strong interaction between dissolved phosphorus and suspended mineral
matter. The Regina Mundi South site alone shows a positive correlation. We suggest this
effect is due to a reduction in turbidity at this site fiom wave damping by reed beds.
4.5 References
1. K. R. Reddy, R H. Kadlec, E. Flaig, and P. M. Gale, Critical Reviews in Environmental
Science and Technology, 29,83 ( 1 999).
2. B. Bostrom, J. M. Andersen, S. Fleischer, and M. Jansson, HydrobioZoga, 170,229
(1988).

59
3- R. J, Bobbie, J. S. Nickels, G. A- Smith, S. D. Fazio, R H. Finàiay, W. M. Davis, and
D. C. White, Appl. Env. Microbiol, 42, 150 (1981).

5. Ancillarv Identification Techniaues
5.1 Introduction
Since NMR is a poor technique for identifLing phospholipids unless standards are
readily available, other techniques have been employed for identification. Attention has
been focussed on phospholipids E and K because of their abundance and persistence. An
autumn Mudhole North sample showed the simplest spectrum, containing only one
concentrated phospholipid corresponding to E. Significant effort was expended on its
purification and identification.
5.2 Esperimental
5.2.1 Thin Layer Chromatography
Following the phosphoiipid extraction procedure, the phospholipid mixture was
dissolved in a smali volume of chlorofonn to produce a concentrated solution of 50 mg/ml.
Silica gel 60F, TLC plates were suppiied by EM Science in 20 X 20 cm sheets. The plates
were eut into strips 3 cm wide and 20 cm long. The concentrated solution was spotted onto
the TLC stnps 2 cm fiom the bottom of the plate using glas capillary tubes. The
phospholipids were eluted in a developing chamber containing a solvent mixture of 30 mi
chloroform, 34 ml ethanol, 8 mi distilled water and 35 mi triethylamine.' The TLC plate was
withdrawn after 2-3 hours, when the solvent fiont was 1 cm fkom the top of the plate. The
plate was lefi to air dry for 24 hours and was then cut in half dong its length. One half of
the plate was developed with Dittmer and Lester phosphorus spray.' Compounds containhg

61
a phosphate ester stained blue with a v i d detection Iimit reported at 5 nmol phospholipid?
The plate was allowed to dry for at least one hour until the blue colour was M y developed.
A phospholipid standard was also run to test the procedure. The two halves of the TLC plate
were then compared. The upper and lower llmits of the location of the blue stain was marked
on the unsprayed half of the plate, The phospholipid sample dong with the silica were
scraped fiom the unsprayed plate and placed ioto a test tube. Chloroform was added to
dissolve the phospholipid. Findy, the mixture was filtered through a Gelman nylon
membrane (pore size, 0-45 jm) to remove the silica The filtrate was then ready for M e r
andysis.
5.2.2 Electrospray Mass Spectrometry
The phospholipid separated by 1ZC was prepared in a 0.5 mM NaOH solution of
chioroform, methanol and water (45:45: 10). These reagents were added only just pnor to
analysis to prevent the hydrolysis of the phospholipid. The spectrometer used was a TOBY
prototype instrument made by Sciex, Concord, Ontario, a single quadrupole electrospray
mass spectrometer-
5.2.3 X-ray Photoelectron Spectroscopy
An aliuninum stub was metallographically polished with a 3 p m diamond grit paste
and sonicated in methanol. One &op of the filtered phospholipid sample nom TLC was
dried onto the polished aliiminum stub. The stub was mounted onto a . XPS sample holder
for analysis. The SSL-100 ESCA Spectrometer at Surface Science Western equipped with

62
an electron flood gun for charge neutralization and an Ai Ka X-ray source was used.
5.2.4 Static Secondary Ion Mass Spectrometry
The same sample that was initidy analysed by XPS was transferred to a custom buiit
static SIMS for analysis- This instrument is based on the VG ZAB-2F reverse geometry
magnetic sector mass spectrometer and uses an fei gal.Lum ion source. The primary ion beam
was run at 25 keV with a current of 0- 1 UA (static conditions)- A 0.5 mm x 0.5 mm area of
the surface was anaiysed. The mass resolution was set low (apertures at widest setting) to
obtain the largest signal possible. Positive secondary ions fkom mass 0-600 amu were
analy sed-
5.2.5 Materials
The solvents used for thin layer chromatography and electrospray mass spectrometry
were supplied by Caledon Laboratories Ltd. 99 % pure phospholipid standards were
purchased fiom Sigma Chemical Company and used as received-
5.3 Results and Discussion
5.3.1 Thin Layer Chromatography
The initial extracted phospholipid was light brown in colour. Foliowing separation
by TL,C, the phospholipid / chIoroform solution was colourless. The pigmented components
in the original extract can be seen near the solvent fiont on the TLC plate. A mixture of
phospholipids may require additional separations as the deeply pigmented samples may

63
o v e m the top haif of the plate. A retardation factor (Rd of 0.35 was determîned for
phospholipid E in the autumo Mudhole North sample. No other blue stained matenal was
obsewed.
5.3.2 Electrospray Mass S pectrometry
Earlier work using eiectrospray mass spectrornetry for an weparated sample gave
a spectrum containing a broad background around the central peak. It was felt that an
improved spectnun couid be obraiwd ifa purified sample was used. The autumn Mudhole
North sample that had k e n separated by TLC was analysed (Figure 5.1). One sharp peak
at 502.5 amu was found and the broad background had been removed Two very minor
peaks were detected at 474.5 and 518.5 m u . These two peaks may be representative of
changes in the fatty acid side c h a h of the phospholipid. The peak at 5 18.5 amuis indicative
of the addition of an oxygen atom to the molecule. The peak at 474.5 amu ciiffers fiom the
main peak by a mass of 28 amu which is indicative of a CO m e n t .
It should be noted that the mass of a sodium atom has been subtracted iÎom the mass
values on the observed spectrum to give the values mentioned above. The addition of
sodium hydroxide to the analysed solution gives nse to an added sodium in the molecule.
Previous work by Dr. Fred Possmayer using this procedure has shown that only one sodium
atom is associated with each phospholipid.'

Figure 5.1 : Electrospray mass spectmm of unknown phospholipid following TLC separaîïon.

65
5.3.3 X-ray Photoelectron Spectroscopy
XPS survey analysis of the dned TLC phospholipid extract was undertaken to explore
the possibüity that heteroatoms, such as nitrogen or sulphur were present. None were
detected. This hnits the possible phospholipids to those without heteroatoms. Simiificant
amounts of silicon were detected- This is attribut& to silica fkom the TLC plate.
5.3.4 Static Secondary Ion Mass Spectrometry
Electrospray mass spectrornetry gives information on only the parent mass peak,
accordingly static secondary ion mass spectrometry (SIMS) was employed to obtain a mass
fragment pattern- If a suitable mass hgrnent pattern codd be acquired, the structure of
various side chains, fùnctional groups and perhaps the entire molecule might be elucidated-
Although most peaks in the spectnim c m be related to organic fiagments, strong
peaks at 23 and 28 amu reveal the presence of sodium and possibly siiicon respectively.
Mass 28 could also be CO but silicon is more liicely based on the previous XPS results. The
majority of the intense fhgments are below 60 a m . A list of some of the more prominent
peaks and possible assignments are given in Table 5.1. Most peaks are indicative of
hydrocarbon fiagments, however some mass fragments are indicative of the incorporation
of oxygen into the organic portion of the molecule (mas 45 and 59). Higher molecdar
weight fiagments, in particular a cluster of fiagments at 1 89,19 1, and 193 (unassigned), are
indicative of the larger fatty acid side chah of the molecule. However, assignment of these
peaks are difEcult without other significant hgments.

1 14 (CH,
Mass Assignment
117 (Unknown
191 1 Unknown
193 1 Unknown
Table 5.1 Significant mass fragments and their assignrnents fiom the positive secondary ion mass spectnim,

67
5.4 Conctusions
No positive identification of phospholipids was made other than those for which
NMR standards were available. Electrospray MS suggests that phospholipid E has a mass
o f 502.5 amu.
5.5 References
1. J. C. Touchstone, 5. C. Chen, and K. M. Beaver, Lipidr, 15,61 (1980).
2. 1. C . Dittmer and R. L. Lester, J. Lipid Res., 5, 126 (1964).
3. L. Konermam, Department of Chemistry, personal communication.

6. Phos~boü~id - Calcite Interactions
6.1 Introduction
An X-ray photoelectron spectroscopy @PS) study of the interaction of a calcite
surface with various phospholipids was undertaken to investigate the possible adsorption of
phospholipids on mineral d a c e s . Such adsorption would change the nature of the
sedirnent/water interface and might help explain the mechanism of phosphorus
muieralization. XPS was employed because ofits surface sensitivity and its ability to detect
changes the chemical state of elements. h addition, W S has been used previously to study
phosphate adsorption onto goethite.'" Calcite (CaCOJ was used in this study because it is
a major mineral in both the Old Ausable River Channel and in the various ponds Ui the Kirk
Cousins Management Area-
6.2 ExperimentaI
6.2.1 Methodology
A crystal or powder sample of calcite was placed in a 50 ml solution of varying
concentration for varying tune periods. Potassium acid phosphate, phosphatidk acid, and
diethyl phosphate solutions ranging fiom 0.01 ppm to 10 ppm were used as possible
adsorbent. Exposure times of solid CaCO, to solutions containing the adsorbing species
ranged fiom 10 minutes to 4 weeks. The solution was saturated with CaCO, to minimize the
dissolution of the adsorbing calcite crystals and adjusted to a pH of 8 to simulate conditions
at the two study areas. The sample was shaken using a Burrell Wrist Action Shaker to ensure

69
uniform distribution of the various solutes over the entire d a c e of the calcite sample. The
crystai was then removed fiom the solution. It was washed bnefly (5 seconds) with distilled
deionized water, dried, placed on a vacuum compatible, conductive carbon based adhesive
for analysis by X-ray photoelectron spectroscopy W S ) . Control caicite samples were
prepared in the sarne rnanner as above without the addition of the adsorbing species. A
nickel grid was placed approximately 1 mm over the sample. The nickel grid in conjunction
with an electron flood guo is used for sample charge compensation! For survey analyses,
a pass energy of 150 eV and a spot size of 600 Pm was used. For high resolution spectra, a
pass energy of 50 eV and a spot sùe of 600 Pm was used. Standard samples of various
phospholipids and powdered calcite samples were mounted for XPS analysis by pressing the
solids samples into indium foil. The SSL-100 ESCA Spectrometer at Surface Science
Western equipped with an eiectron flood gun for charge neutralization and an Al Ka X-ray
source was used.
6.2.2 Ion Chromatography
Following the removai of the calcite crystals, the tiltrate was analyzed by ion
chromatography to examine the remaining ionic species. A Dionex DX-100 Ion
Chromatograph equipped with a Dionex IonPac AS 14 4 mm anion exchange column was
used for this work. A suppressor membrane was used to neutralize buffer s a k in the eluent
solution. The use of a suppressor wili Iower background conductivity, thereby increasing
analyte sensitivity.

6.2.3 Materials
Nahiral calcite samples were supplied by Dr. M. Powell fkom the Department of
Earth Sciences. Synthetic calcite and pure phospholipid samples were suppiied by Sigma
Chernical Company in 99 % purity and used as received Potassium acid phosphate was
purchased fiom Caledon Laboratories Ltd,
6.3 Resuïts and Discussion
6.3.1 Standards and Controls
Standard samples of phospholipids were anaiyzed by XPS (see Table 6.1). It was
hoped that heteroatoms (atoms other than carbon, oxygen and phosphorus), such as nitrogen
in L-a-Phosphatidylethanolamine, couid aid in the identification of the adsorbed
phospholipid species. Phosphorus (2p) binding energies are simdar for all standard samples
ranging from 133.8 to 134.5 eV. This range is too narrow to ailow for identification of
phospholipids from P(2p) binding energies. This was expected but was an important
exercise nonetheless. Changes in these values should be observed if any reaction on the
surface or decomposition of the phosphate group takes place. These baseline values will
help to determine if chernical changes have occurred.
Initial investigations were also carried out to determine if a suitable sample of calcite
could be found. Most minerals are far fiom king pure cornpounds, thus, other species are
often found. This will be especialiy tme at grain boundaries where many species wiU
accumulate. Two samples of calcite were chosen; Iarger crystals (-3-5 mm diameter) o f
Iceland spar, considered to be the purest nahval calcite available,' and a powder of a 98%

71
pure synthetic calcite. XPS anaiysis of a fieshly fÏactured surface of Iceland spar gave a clean
calcite spectnim containhg o d y carbon, oxygen and calcium- However, spectra of
unfiactured surfaces of Iceland spar varied in theïr relative cleanIiness. SmaU arnounts of
sodium, silicon, nitrogen, and sulphur on the outer surface of the sampie were occasionally
detected. The use of extra elements, such as nitrogen and sulphur, for the identification of
some phospholipids may prove ciifficuit ifthey are present on the d a c e of the untreated
calcite. Analysis of the synthetic calcite powder revealed only carbon, oxygen and calcium.
Sample C O
L-a-Phosphatidic Acid (Sodium 81.8 12.0 Salt)
L-a-Lysophosphatidic Acid, Oleoy L 73 -2 16-1 (Sodium Salt)
Sphuigomyelin
L-a-Phosphatidylethanolamine
(Sodium Salt)
1 Palmitoyl (Sodium Salt) 1 1
Table 6.1 : Surface composition of standard samples in atomic percent as determined by X- ray photoeiectron spectroscopy (XE'S). Phosphorus (2p) binding energies for each sample are presented in the farright column. Binding energies are referenced to carbon (1s) at 285.0 eV-

6.3.2 Potassium Acid Phosphate, Proof of Principle
Phosphate minerai adsorption has k e n studied extensively and is weii known?'
Potassium acid phosphate (=?Po4) solutions were used to determiue ifadsorbed phosphate
couid be detected on the calcite surface by XPS. Phosphou was detected on both calcite
samples after exposure to 1 O-* M to 1 Od M solutions with exponire times ranging fiom 10
minutes to 5 days- As exposure times and concentrations increased so did the amount of
phosphonis detected on the sample d a c e s (see Figure 6.1). One important observation was
that significantly more phosphorus was detected on the surface of the Iceland spar than on
the powdered calcite sample. There are three possible explmations for this. The larger
surface area of the powdered sample ailows for more adsorption of the phosphate, effectively
Iowering the phosphate concentration of the solution at a faster rate. The phosphate becomes
thinly spread over the large d a c e area of the powder. The crystal sample adsorbs much
less total phosphate and as such, is exposed to a higher solution concentration for a longer
period of tirne. This allows a more complete coverage of phosphate on its surface.
Secondly, fieshly cleaved Iceland spar surfaces may be more reactive as the crystals tend to
cleave dong defect boundaries. Finally, this observation may also be due to the way each
sample is analysed by the XPS. Only the nirface of the crystal sample is analyzed with the
IceIand spar but with the powdered sarnple, some of the background indium foii surface may
be analyzed as well. The adventitious carbon component of ihe indium foi1 then adds to the
amount of carbon detected, effectively l o w e ~ g the amount of phosphorus- Use of the
powder was also more tedious because the powder had to be filtered foilowing adsorption.
In addition, very srnail amounts of powder were used and loss of sample during filtration and

Control CaCO,
300 275 250 225 200 175 150 125 1 O0
Binding Energy (eV)
Figure 6.1 : XPS survey scans showing the increase in adsorbed phosphate as the concentration of KH,PO, in solution increases.

handling can be a problem.
A Raman spectrum of a treated calcite surface confirmed the presence of adsorbed
orthophosphate (yp04). A strong broad peak centred at 930 cm-' was found on the reacted
surface that was not present on the unreacted surface of calcite (Figure 6.2)- A literature
value of 938 cm-' is given for orthophosphate?
6.3.3 Phosphatidic Acid
Phosphatidic acid (PA) consists of a phosphate head group and two fatty acid side
chains (see Figure 1.1). The presence of fatty acid side c h a h mean that steric factors wili
play a role in the molecule's reactivity on calcite surfaces. Beyond the detection of the
adsorbed phospholipid it was hoped that d a c e changes and perhaps adsorbed degradation
products might be detected. PA was first detected using a 10 ppm solution and 24 hours of
exposure. No phosphorus was detected at lower concentrations even for much longer periods
of exposure (up to 4 weeks). The weak phosphorus (2p) signal was at approximately 134.2
eV, essentiaily unchanged from the standard sarnple (Figure 6.3). Since the concentrations
used were well above those encountered in the natural system, this research avenue was
abandoned.
In retrospecf the adsorbed species could be phosphate and not phosphatidic acid.
High resolution scans of other elements (carbon, oxygen and calcium) did not provide any
further information. Ion chromatography of the solution could have confirmed the presence
of phosphate and therefore the hydrolysis of phosphatidic acid. In addition, M e r XPS
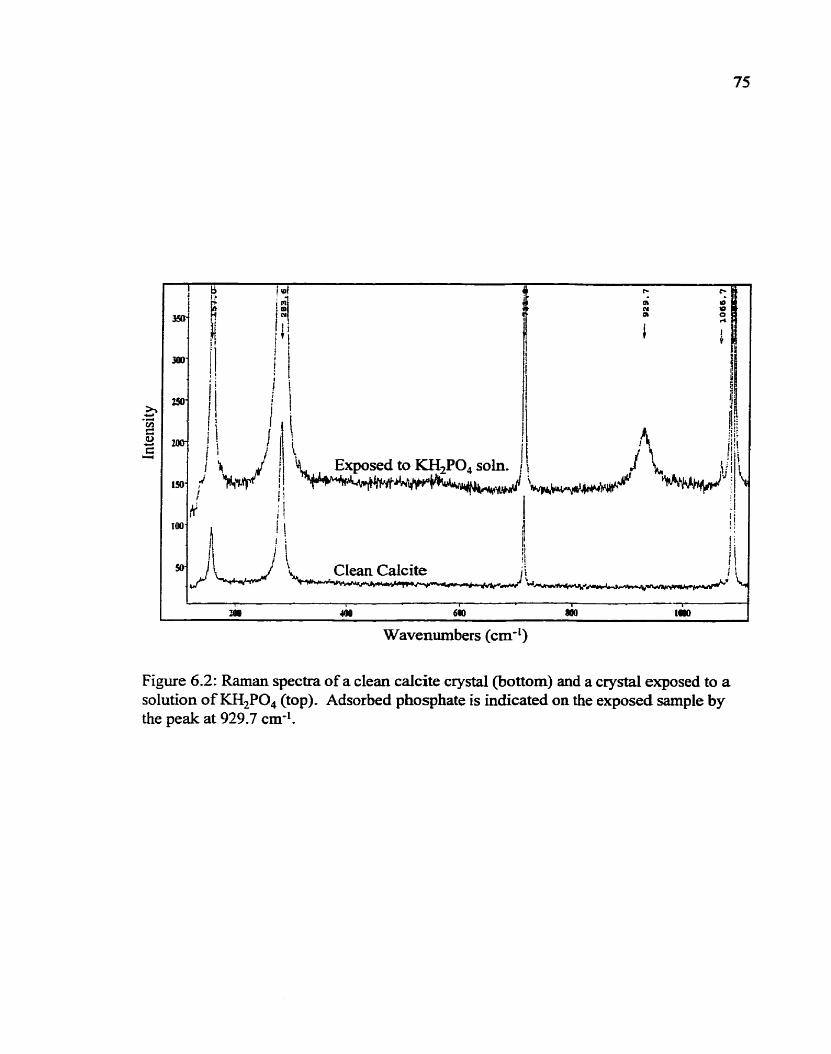
Wavenumbers (cm-')
Figure 6.2: Raman spectra of a clean calcite crystal (bottom) and a crystal exposed to a solution of -PO, (top). Adsorbed phosphate is indicated on the exposed sarnple by the peak at 929.7 cm-l.

Binding Energy (eV)
Figure 6.3 : High resolution XPS spectra of the phosphom (2p) peak for the standard sarnple of phosphatidic acid (PA) and for a calcite d a c e exposed to 10 ppm solution of PA for 24 hours. The fitted peak is the overaU contribution fiom both the P(2p,,-J and P ( 2 ~ 3 d peaks.

77
experiments might show slight differences in phosphorus (2p) binding energies,
distinguishing between adsorbed phosphate and phosphatidïc acid.
63.4 Diethyl Phosphate
It was then decided to attempt adsorption with the smaitest phosphate ester that could
be obtained, diethyl phosphate. It was speculated that adsorbed species could be detected on
the calcite surface fiom solutions at realistic concentrations. Initial experiments with low
concentrations and short exposure times failed to reveal any adsorbed phosphom species.
It was not until longer exposure times were used that adsorbed phosphom was detected (1
ppm, 4 week exposure). Phosphorus (2p) binding energies for the adsorbed species ranged
fiom 133.4 to 133 -7 eV. This is on the lower end of the values obtained for the standard
samples.
The long exposure times and the low bînding energy obtained for the phosphonis (2p)
peak suggested that the diethyl phosphate ester had hydrolyzed in the slightly basic solution.
Ion chromatography of the solution revealed an orthophosphate ion peak. It is therefore
likely that the adsorbed phosphorus species is orthophosphate and not diethyl phosphate.
Literature binding energy values for phosphate range nom 132.4 to 134.2 eV.'' This
corresponds to the observed binding energies.
6.4 Conclusions
XPS yields adsorption data consistent with the known behaviour of the phosphate1
calcite system. The attempts reported here to use W S to study the possible adsorption of

78
phosphoiipids on calcite are inconclusive. In the cases where phosphorus was detected, IC
analysis of the solutions used showed the presence of phosphate, a probable hydrolysis
product.
6.5 References
1- R. R. Martin, and R. S t C. Smart, Soil Sci Sc. Am. J,, 51,54 (1987).
2. R. EL Martin, R St C. Smart, and K. Tazaki, Soi2 Sci. Soc. Am. J., 52,1492 (1988).
3. R G. Jonasson, R. R Martin, M. E. Giuliacci, and K. Tazaki, J Chem. Soc., Fmu&y
Trans. 1,84,2311 (1988).
4. B. V. Crist, Handbooks of Monochromatic XPS S~ectra: Vol. 1. - The Elements and
Native Oxides, XPS International Inc., Kawasaki, lapan, xïii, 1997.
5. M. Powell, Department o f Earth Sciences, personal communication.
6. C. Colombo, V. Barr&, J. Torrent, Geochimica et Cosmochimica Acta, 58,126 1 (1 994).
7. M. A. Maiiti, R. A. Fassam, 1. R. Henderson, J. Chem Tech. Biotechnol-, 58,3 87 (1993).
8. E. Gonzalez-Pradas, M. Villafranca-Shchez and A. Gallego-Campo, J. Chem Tech.
Biotechnol., 54,29 1 ( 1 992)-
9. W. P. Griffith, Inf'rared and Raman S~ectrosco~v of Lunar and Terrestriai Mllierals, C.
Karr, Ed., Academic Press, New York, 3 17, 1975.
10. J. F. Moulder, V. F, Stickle, P. E. Sobol, and K. D. Bomber, Handbook of X-ray
Photoeiectron SDectrosco~v, Perkin-Elmer, Eden Prairiey Minnesota, 1992-

7. Conclusions and Future Work
7.1 Conclusions
NMR analysis of phospholipids in the OARC show seasonai changes consistent with
the existing üterature. This may be taken as validation of the NMR anaiysis of
sediment phospholipids as an indicator of the microbial comrnunïty.
The spatial distribution of phosphoiipids in the Old Ausable system can be readiiy
explained in terms of hown sediment characteristics. This may be taken as furthet
c o ~ a t i o n of the utility of3'P NMR as a monitor of secliment mlcrobial commmities.
The Mudhole North site, known to undergo anomalous fieezing and drying events as
well as being subjected to human impacts, shows a discontinuity in the established
phospholipid pattern.
The phospholipid richness also shows seasonal variation with maximumrichness in the
autumn,
Sediment phosphoiipids in the K M . . do not display a we1l defined seasonai cycle.
This behaviour is attributed to the extreme turbidity observed in this system as well as
phosphate input to Regina Mundi Pond fiom the coiIege.
XRD of the suspended matter in the Kirk Cousins ponds system confkms the presence
of mineral matter known to interact strongly with dissolved phosphorus species.
In the Kirk Cousins system, phosphoiipid richness is significantly Iower than in the
OARC. W e it is tempting to attribute this ciifference either to effluent fiom Regina
Mundi College and/or water turbidity, the ponds studied each have unique, individual
characteristics. This diversity argues against any simple interpretation of these results.

80
8. In the Old Ausable River Channel there is a negative correlation between sediment
phospholipid abundance and aqueous dissolved phosphorus. This is consistent with a
mechanism where microbiota sequester phosphorus during optimum growing
conditions. Phosphorus is subsequentiy released when the microbiota die in winter.
9. In the Kirk Cousins Management Area the same negative correlation is obsenred,
however, the maximum dissolved phosphorus concentration is dispIace& occurring in
autumn rather than wiuter/sprhg. This is almost certainly due to maximum turbidity
in autumn. Both bioturbation and ememe reductions in water levels in one of the ponds
may be contributing factors.
10. Regina Mundi South represents the only site with a positive correlation between
aqueous dissohed phosphorus and sediment phospholipid abundance. We suggest this
effect is due to a reduction in turbidity at this site fiom wave damping by reed beds.
1 1. Phoqhatidyiethanolamine, phospha t idy lcho l Lysophosphatidylcholine have been
identified by standard addition.
12. Phospholipids K and E are the most persistent and abundant.
13. The balcony sample confirms the suggestion that phospholipids are short-lived in the
environment.
14. XPS shidies of possible phospholipid adsorption suggest that there is no direct
interaction between p hospholipids and calcium carbonate. However, phosphatidk acid
appears to be adsorbed at concentrations in the order of 10 ppm.

81
7.2 Future Work
Nattuaiiy fhture work shouid include additionai sampling at the study sites. The
balcony sample suggests that a weii defiued experiment shouid be designed to monitor the
rate of phospholipid loss between the auhunn and spring.
Now that we are confident that individuai phosphoiïpids can be extracted by thin
Iayer chromatography, an attempt should bernade to i d e n e these species using ion trapping
and laser hgmentation foiiowed by mass spectrometry. Such an experiment is being
designed and wïii be undertaken with Dr- G, Wiiiett, University of South Waies, Australia-

&mendix 1
Individuai Phosphoiipid Concentrations

Seasonal and spatial changes in individual phospholipid concentrations for the Old Ausable River Channel, Phospholipid concentration is reported in nmol P/g dry sediment with an error of 30 %. OL - overlapping peak. Iis concentration is included in the value for the main peak (see Appendix II), arefer to list of abbreviations

a 1 ni* 1 swa / wlva d , ~ ntu swli w~lr d ~ , MI smlr I

A ~ ~ e n d k
NMR Spectra

G 6 = 1.471 pprn J 6 = 1.180 pprn K 6 = 1.081 pprn M 6 = 0,975 pprn PC 6 = 0.064 pprn
MudhoIe North, Spring 98
U 8 = 1.833 pprn E 6 = 1.643 pprn F 6 = 1.588 ppm H 6 = 1.390 pprn 1 8 = 1.277 pprn J 8 = 1.198 pprn K 6 = 1,109 pprn M 6 = 1.010 pprn PC 6 = 0.079 pprn
Mudhole North, Summer 98

Mudhole North, Autumn 98
E 6 = 1.699ppm PC 6 = 0.070 ppm
Mudhole North, Wmter 98

K S = 1,165 pprn
Mudhole South, Spring 98
E S = 1.688 pprn F 6 = 1.613 ppm H 6 = 1.426ppm 1 6 = 1.342 pprn J 6 = 1.232 pprn K 6 = 1.139ppm PE S = L.100ppm M 6 = 0.969 pprn PC 6 = 0.079 pprn
Mudhole South, S u m e r 98

D 6=1,722ppm E 6 = 1.588 ppm F 6 = 1.490 ppm K 6 = 1,075pprn PC 6 = 0,055 ppm
Mudhole South, Autumu 98
E 8 = 1.647 ppm K 8=1.121 ppm
- . - -
Mudhole South, Winter 98

E 6 = 1.522ppm J 6 = 1.191 pprn K 6 = 1.095 ppm PE 6 = 1.050 ppm M 6 = 0.904 pprn
Canoe Docks North, Spring 98
D 6 = 1.718 pprn E 6 = 1.624 pprn G 6=1.462ppm H 6 = 1.361 pprn J 6 = 1.180ppm K 6 = 1.081 pprn PE 8 = 0.988 pprn Q 6=0.127ppm PC 6 = 0.075 pprn
. -- --
Canoe Docks North, Sumer 98
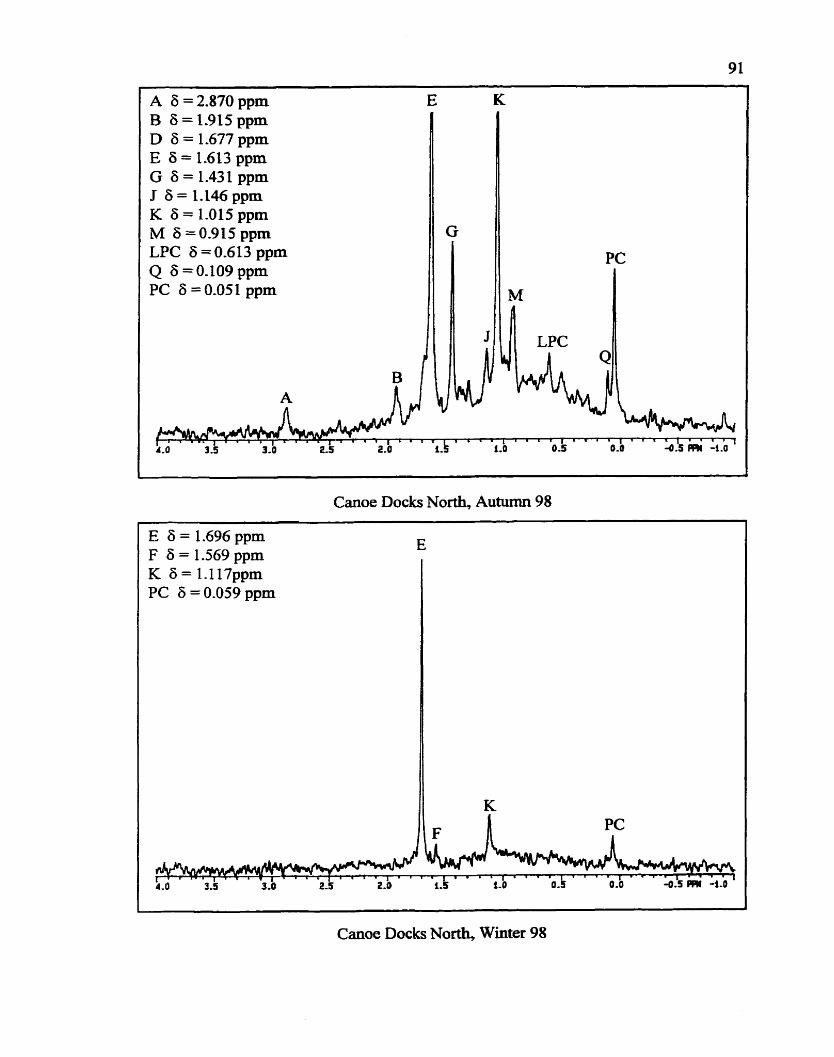
A 6 = 2.870 ppm E B 6=1.915ppm D 6 = 1.677 ppm E 25 = 1.613 pprn G 8 = 1.431 pprn J 6 = 1.146 pprn K 6 = 1.015 pprn M 6 =O.gIS pprn LPC 8 = 0-613 pprn Q 6 =0.109ppm PC 6 = 0.051 pprn
Canoe Docks North, Autumn 98
E 8 = 1.696 ppm c
K 6 = 1.117ppm PC 6 = 0.059 ppm
-
Canoe Docks North, Winter 98

E 6 = 1.673 pprn K 6 = 1.167 pprn PE 6 = 1.140 pprn
Canoe Docks South, Sprïng 98
B 6 = 1.859 pprn E 6 = 1.554ppm F 6 = 1.450 pprn K 6 = 1.043 pprn Q 6 = 0.095 pprn PC 6 = 0.043 pprn
Canoe Docks South, Summer 98

93
B 6 = 1.895 pprn C 6 = 1.768 pprn D 6 = 1.661 ppm E 6 = 1,580 pprn G S=1,404ppm J 6 = 1.219 ppm K 6 = 1.033 pprn M 6 = 0.884 pprn Q 8=0.115ppm PC 6 =0.041 pprn
Came Docks South, Autumn 98
E S = 1.733 ppm F 6 = 1.673 pprn K 6 = 1.165 pprn PE 6 = 1.124 pprn N S = 0.93 1 pprn P S = 0.627 pprn Q 8 = 0.135 pprn PC 6 = 0.075 pprn
-
Canoe Docks South, Winter 98

E 6=1.628ppm J 6=1.226ppm K K 6 = 1,128 ppm PE 6 = 1.083 pprn LPC 8 = 0.703 ppm PC 6 = 0.066 ppm
I ~ ' ~ ~ l = - g L ~ " " r ~ ' ' ~ I B " ' I " " I ' ~ " I = ~ l B ~ ~ . . . ~ " ' . ( 4.0 3.5 3-0 2-5 2.0 i-5 1.0 0 -5 O .O -0.5 PRI
Burley Bridge North, Sprïng 98
E 6 = 1.633 ppm K 6 = 1.095 ppm PC S = 0.069 ppm
Burley Bridge North, Summer 98

O 8 = 1.689 pprn E 6 = 1.588 ppm E G 6 = 1.443 pprn H 6=1.335ppm J 6=1.149ppm K 6=l.O53 pprn M 6 = 0.905 pprn PC 6 = 0.049 pprn
~ " " I ' " ' i ~ . c = l ~ ' - . ~ . - . . r . . r - l - - m = I - . ' . J ' . . . , ' . . , 4.0 3.5 3.0 2-5 2. O 1.5 1.0 0.5 0.0 4 - 5 PP)I -1.0
Burley Bridge North, Autumn 98
E 6 = 1.752ppm K 8 = 1.213 pprn PE 6 = 1.195 pprn
Burley Bndge North, Winter 98
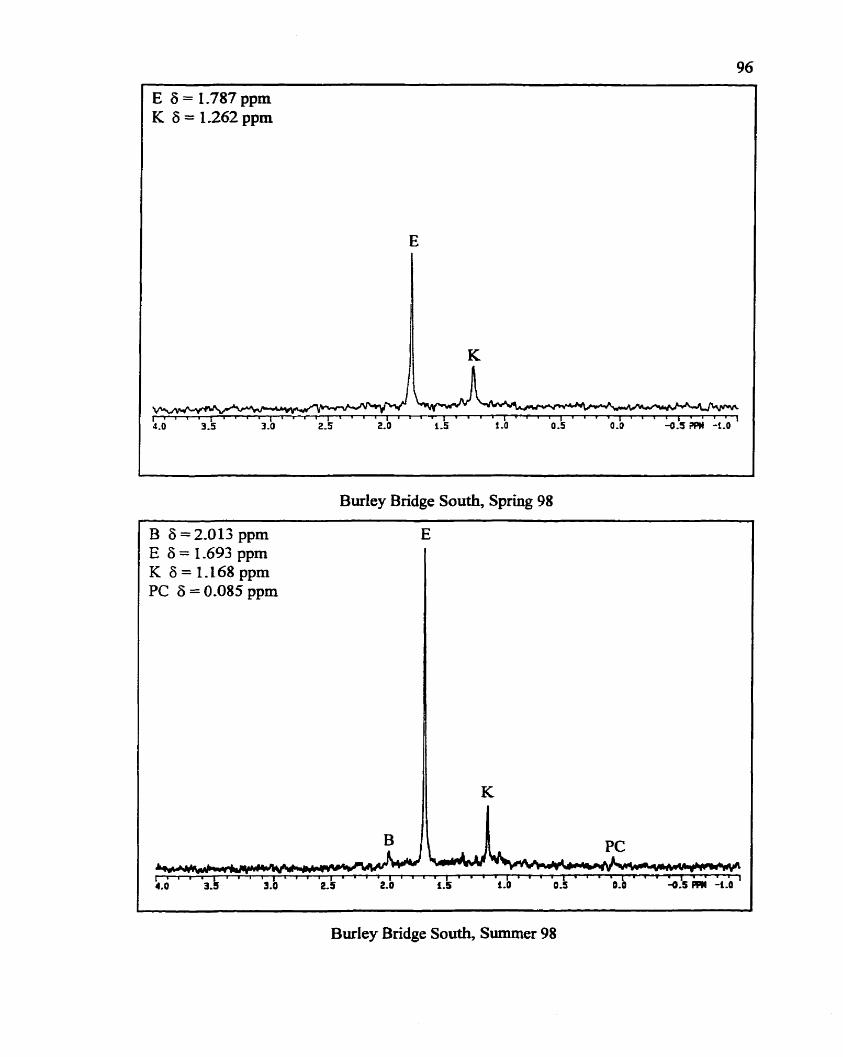
K S = 1.262 ppm
Budey Bridge South, Sprhg 98
B 6 =2.013 ppm E E 6 = 1-693 ppm K 6 = 1.168 ppm PC 6 = 0.085 ppm
--
Burley Bridge South, Summer 98

B 6 = 1.933 pprn E 6 = 1.653 ppm G 6 = 1.517 pprn H 6 = 1.367 pprn 1 6 = 1.231 pprn K 6 = 1.095 pprn
-
Burley Bridge South, Autumn 98
E 6 = 1.736 pprn K 8 = 1.165 pprn
Burley BrÏdge South, Winter 98

E 6 = 1.629 pprn J 6 = 1.232 pprn K 6=1.138ppm PE S = 1 .OS9 pprn M 6 = 0.998 ppm PC S = 0.079 ppm
Canoe Docks North, Single Sample, Sprhg 98
E 6 = 1.722 pprn H 6 = 1.426 ppm J 8 = 1.260 pprn K 6 = 1.188 pprn M 6 = 1.043 pprn Q 6 =O.l58 pprn PC 6 = 0.098 pprn
Canoe Docks North, Spring 99

Balcony Sample

K 6 = 1.080 ppm
Regina Mundi Pond Middle, Spring 99
D 6 = 1.717ppm E 6 = 1.609ppm G 6 = 1.477 ppm J 6 = 1.221 ppm K 6 = 1.085 ppm M 6 = 0.979 ppm
Regina Mundi Pond Middle, Summer 98

Regina Mundi Pond Middle, Autumn 98
E 6 = 1.617 ppm K 6 = 1.095 ppm
Regina Mundi Pond Middle, Witer 98

K S= 1.195 ppm L 6 = 1-180 ppm
Regina Mundi Pond South, Spring 99
E 6 = 1.624 ppm K 8 = 1.090 ppm
Regina Mundi Pond South, Summer 98

K 6 = 1.095 ppm
Regina Mundi Pond South, Autumn 98
E 6 = 1.629 ppm K 6 = 1.100ppm
Regina Mundi Pond South, Whter 98

E 6 = 1,792 ppm K 8 = 1.241 ppm
--
Pond Mu, Spring 99
E 8 = 1.617ppm K 6 = 1.060 ppm
Pond Mu, Srunmer 98

E 6=1-732ppm K 6 = 1.154 ppm PE 6 = 1.122 ppm
Pond Mu, Autumn 98
E 6 = 1.683 ppm F 6 = 1-635 pprn K 8 = 1.141 ppm
Pond Mu, Winter 98

K 6 = 1.079 ppm
Turtie Pond, Spring 99
Turtle Pond, Sumer 98

Turtle Pond, Autumn 98
K 6 = 1-138 ppm
TurtIe Pond, Winter 98