Coherent potential theory for interacting bands: Phonons ...
Surface Science 268 (1992)418-431 North-Holland
sur face science
Phonons on fcc (100), (110), and (111) surfaces using Lennard-Jones potentials II. Tempera tu re dependence of surface phonons studied with molecular dynamics
D.D. Koleske and S.J. b loener The Department of Chemistry and The James Franck Institute, The University of Chicago, 5640 South Ellis Avenue, Chicago, IL 60637, USA
Received 20 September 1991; accepted for publication 18 November 1991
In this paper we present temperature dependent studies of the surface phonon dispersion relations for fcc (100), (110), and (111) faces using molecular dynamics (MD) simulations and Lennard-Jones potentials. This study was conducted in order to investigate how anharmonic potential terms influence the dynamical properties of the surface. This was accomplished by examining the temperature dependence of the Q-resolved phonon spectral density function. All phonon frequencies were found to decrease linearly in T as the temperature was increased, while at low temperatures the phonon linewidths increased linearly with T. At higher temperatures, some of the phonon linewidths changed from having a linear to a quadratic dependence on T. The temperature at which this T to T 2 change occurs is surface dependent and occurs at the lowest temperature on the (110) surface. The T 2 dependence arises from the increasing importance of higher-order phonon-phonon scattering terms. The phonons which exhibit T z dependence tend to be modes which propagate perpendicularly or nearly perpendicularly to the direction of maximum root-mean-squared displacement (RMSD). This is especially true for the iinewidth of the S 1 mode at X on the (110) surface where, at T = 15-23% of the melting temperature, the RMSD perpendicular to the atomic rows become larger than the RMSD normal to the surface. Our results indicate that the dynamics on the (110) surface may be significantly influenced by anharmonic potential terms at temperatures as low as 15% of the melting temperature.
1. Introduction
Many recent studies on the (110) faces of fcc metals have focussed on the changes in surface structure that occur as the surface is heated, specifically how the surface roughens and melts [1-9]. Most of these experimental and theoretical studies have concentrated on the static structural changes that occur at high temperatures, for ex- ample, the proliferation of steps as the roughen- ing transition proceeds [1-4]. With the advent of surface vibrational spectroscopies such as high- resolution electron energy loss spectroscopy (HREELS) and helium atom scattering (HAS), several studies have been conducted on the ther- mal dependence of surface vibrations [9-13]. Mechanistically, these studies indicate that tem- perature-induced structural changes at the sur- face cannot be considered independently from
temperature-induced anharmonic ci,anges that occur in the surface vibrational properties [9-13].
An example of this are the two alternate inter- pretations that have been proposed to explain the high temperature behavior of the (110)surfaces of Ni and Cu, one interpretation being based on a structural change, and the other being based on a dynamical change in the surface vibrations. These two alternate interpretations have been proposed to explain the dramatic increase in the mean-square displacements (MSD) that have been observed on Cu(ll0) near T--= 870 K. Previ- ous X-ray studies have measured the decrease in specularly reflected signal, which was interpreted as an increase in the MSD normal to the surface [2]. The stronger than normal Debye-Waller in- crease in surface normal MSD was iv, turn at- tributed to an increase in the step density, at the surface. However, the possible role that anhar-
()039-6()28/92/$05.00 1992 - Elsevier Science Publishers B.V. All rights rer, er~'ed

D.D. Koleske, S.J. Sibener / Phonons on fcc (100), (110), and (111) surface. H 419
monic potential terms, play at elevated tempera- tures could not be ruled out [2]. Similar changes in MSD on Ni(ll0) were also observed in a high-Q-resolution low-energy electron diffraction (LEED) study at about half the melting tempera- ture, Tin, of Ni [8]. In this study the authors concluded that the M3D palallel to the surface were 5 times larger than the MSD normal to the surface.
A similar drop in elastically scattered signal was also observed in HAS experiments on Cu(110) [9]. As the surface was heated up to ca. 700 K the reflected He signal dropped "rapidly" with in- creasing temperature [9]. However, HAS meas- urements of the diffuse elastic intensities on Cu( l l0) did not show an increase in tile number of steps or defects up to T = 900 K [9]. The HAS results clearly indicate that no roughening occurs up to 900 K, and that the gradual drop in the intez.~:,izy of the specularly reflected beam is most likely attributed to increased anharmonicity for this surface [9]. Also, no increase in the step density or adatom-vacancy pair defects were ob- served in MD simulations using effective- medium-theory (EMT) based potentials up to T = 100~q K [14]. Not until T > 1000 K are adatom-vacancy defect pairs observed on the simulated Cu(ll0) surface [I~], with similar re- suits being found at 1400 K for Ni( l l0) [15]. These studies clearly indicate that the initial in- crease in the MSD occurs becau3e the surface atoms begin to significantly sample regions of the anharmonic potential at elevated temperatures.
The capability now exists to measure the pbonon linewidth changes as a function of in- creasing temperature using HAS and HREELS. One recent example is the measurements of Bad- dorf arid Plummer, who have directly monitored the increase in surface anharmonicity on Cu( l l0) by monitoring the phonon frequency decrease and iinewidth dependence at F and Y [i0,i i] . From these measurements it was determined that the anharmonic influence at the surface is 4.1-4.8 times greater than in the bulk [10,11]. In another study, the one-phonon and multiphonon contri- butions to inelastic HAS intensities were calcu- lated as a function of temperature on Cu( l l0) [16] and Cu(00i) [17]. In both of these studies
[16,17] the MSD were found to be influenced by phonon-phonon scattering terms proportional to temperature, but at temperatures near 600 K higher-order phonon-phonon interactions be- come significant, which have a quadratic temper- ature dependence. A larger anharmonic effect was found for the Cu(l l0) surface than for Cu(001) [16,17]. However, up to 600 K, the width of the S 3 mode Y on Cu( l l0) increased only linearly with temperature [I0,II] and not quadratically.
In order to study and further quantifs the influence that the anharmonic potential terms have on surface dynamics, we have performed molecular dynamics (MD) simulations using Lennard-Jones (LJ) potentials for fcc (100), (110), and (111) surfaces. These studies are similar in nature to our earlier studies on LJ(511) and LJ(533) stepped surfaces [18]. These earlier stud- ies on stepped surfaces followed the energy width increase of the "edge modes" (E: and E 2 [19]) and Rayleigh wave (S 1) as a function of increas- ing temperature. In this earlier study the edge modes, which are localized on the step atoms, showed a greater increase in width than those of the terrace [18]. This indicates that a correlation exists between increased anharmonic effects and reduced coordination. From this we concluded that at elevated temperatures the increased im- portance of anharmonicity will influence phe- nomena ranging from surface melting and rough- ening to chemical transformations of the surface.
In a preceding paper referred to as paper I we outlined the method used to calculate the surface phonon spectral densities using MD simulations and compared these low-temperature results to calcu!ations using the slab technique [20]. In this paper we focus on the dynamical changes which occur in the surface phonon spectral densities (i.e., frequency and linewidth changes) and root- mean-square displacements (RMSD) as a func- tion of increasing temperature. Several authors
1 have reported that at about ~T m the (110) surface begins to disorder through the creation of adatom-vacancy pair defects. We will show how this disordering mechanism modifies the RMSD, and that adatom-vacancy pair creation reduces stress at the surface. We also compare the trends

420 D. D. Koleske, S.J. Sibener / Phonons on fee (ZOO), (ZlO), and (I II) surface. IP
seen in our results for LJ solids to the effective- medium theory (EMT) simulations [14] and HREELS measurements for Cu(l10) [lo,1 11.
FCC( 100)
2. Molecular dynamics method
Previous MD studies using LJ potentials have concentrated on the thermally induced changes in surface str-ucturc that OCCXi GS the SWfZXe iS
heated [21-251. The temperature dependence of the surface vibrational properties averaged over all Q-vectors was previously studied [21,26], and in another study the Q-resolved phonon modes were calculated for the (100) surface at x for two temperatures [27]. Of the iwo temperatures re- ported, the S, (Rayleigh wave) mode at 53% T, was noticeably wider than at 38% TI [27]. This paper presents a much more extensive survey of how temperature influences the surface dynami- cal behavour of the (1001, (HO), and (111) sur- faces. Our work also differs from previous work both in the total number of atoms simulated (3100 total) and the number of simulations (up to 40) performed to obtain the surface phonon spec- tral densities.
iii
L4 r x
T ‘s
i-9 r x
For each of the MD simulations the si paral~el~iped slab (I, x I,. x ZZ) was 10 x
A total of 3100 atoms were simulated with 100 atoms residing on each surface. The surface ge- ometries, reciprocal lattices and major directions are shown in fig. 1. The lattice constant was assigned at the start of the simulation taking into account the thermal expansion of the lattice as previously discussed in paper I. All temperatures reported in this paper will be scaled to the melt- ir,g temperature, T = T */T,*, where T: = 0.655 ]28], and T* is the scaled temperature defined in paper I. For simulations with T= 0.0015, 8192 time steps were used with integration step size
s a frequency resolution of r the higher temperature
ations, 4096 time steps were used with h = for T = 0.02-0.45, and h = 0.0035 for T =
0.45-0.63, Which give frequency resoiuttons oi
368~ and AU,,, = 0.43830, respec- educhg the time ste from h = O.Ooj f0
FCC(110)
FCC(111)
_/ <211>
Fig. i. Plotted in the left hand column of this figure are the geometric arrangement of atoms for fee (loo), (1 lo), and (111) surfaces. In the middle column, are plotted the reciprocal lattice or surface Brillouin zone corresponding to each direct lattice. On the right-hand side are plotted the major direc- tions in the surface plane. Note the (110) direction is always
chosen in the nearest-neighbor direction.
h = 0.0035 at T = 0.45 does not alter the spectral density shape or linewidth. Details of how the
resolved phonon spectral densities were calcu- ted during the MD simulations can be found in
paper I. In some of the high-temperature (T = 0.45-0.63) simulations 30 to 40 runs were added together to resolve phonon lineshape features. These runs were taken consecutively, with the final. coordinates from the preceding run provid-
e initial coordinates r the next run. For each temperature (except < 0.10) at least two initial starting conditions were equilibrated for 5000 time steps for T = 0.02-0.10, and 10000 time steps for g = 0.10-0.63. Upon completion of the simuiation, the atomic iiions were &t~kt;d to make sure that they not moved out of their assigne attice positions.

D.D. Koleske, S.J. Sibener / Phonons on fcc (100), (110), and (111) surface. H 421
3. S imulat ion results 0.30 ' ' ' i ' ' ' :'" ' ' i ' ' ' i . , ,
0.25
The changes in the surface phonon spectra 0.20 and the mean-square displacements were moni- tored as a function of increasing temperature. _ - o . 15 The phonon linewidths should have delta-func-
~" 0.10 tion widths near T = 0.0 since, in the harmonic approximation, there is no mechanism for broad- o.o5 ening. The z-polarized Rayleigh wave at T = 0.0015 is shown_ in fig. 2 for all three surfaces: the o.30 $4 ._mode at X on the (!00)surface, the S i mode at X on the (110) surface, and the St mode near 0.25 K on the (111) surface. Because of the way the
0.20 2D Fourier transform of the velocity vectors is calculated, the Sl mode at K on the (111) surface _~ 0.15 is not sampled, but the St mode at 90% of the
~ ' 0.10 surface Brillouin zone (SBZ) is sampled. This $1 mode along the F - K direction is the closest Q- o.o5 vector to X, and will be denoted as K*. These points of the SBZ were chosen since they corre-
0.30 spond to vibrations between nearest- neighbor atoms. In fig. 2 the open circles are the MD o.25 calculated spectral density functions and the solid
,_, 0 .20 line is a fit to the MD data. The peaks were fit with a scaled Lorentzian function using a nonlin- _~ 0.15 ear least-squares fitting routine. These low-tem- perature simulations were run to make sure that ~ 0 l0 the phonon widths were not artificially broad- ened by the periodic boundary conditions, or by integrator-induced round-off error. All three spectra have FWHM at the resolution of the simulation, and are essentially delta-functions at this low temperature. The frequency of each spectral density feature shown in fig. 2 agrees well with the frequency obtained using the slab technique as shown in paper I.
The effect of increased temperature on the line shapes of these phonons is shown in fig. 3. Three representative spectra for each surface are shown. For the (111) surface, temperatures up to T = 0.6ii were simulated, while on the (110) sur- face only temperatures up to T = 0.458 were sim- ulated (above this temperature the (110) surface starts disordering). A total of 35 simulation runs were used to calculate T=0.458 on the (110) . . . . . . g . . . . . . ~ _ ~ . ~ ! . _ g A N I . t S l ~ U LtL.P I , , , O t l l , , , u l a l . l i ~ a U t l l t a k , c , t i t t o t a l O l ~ U I ' U H S were . . . . a . . . . ,_..,-,^ the (111) surface at T = 0.611, and a total of 30 runs were used to calculate the (100) surface at
L J(100)
T=O.O015
' ' ' I ' ' ' I ' ' I ' ' ' I ' ' '
~t . . . . . . . . . . . . 1_~ . . . . . . . . . . . . . . . . "....._ . . ~
LJ(110)
T=0.0015
' ' ' 1 ' ' ~ 1 ' ' I ' ' ' 1 ' ' '
L J ( l l l )
T=0.0015
0.05
0.00 0 4 8 12 16 20
Energy (co)
Fig. 2. Plot of the low-temperature (Rayleigh wave) phonon modes at X for the (100) surface, X for the (110) surface, and F,,* (see text) for the (111) surface. These reciprocal space points correspond in direct space to nearest-neighbor vibra-
tions.
T = 0.534. Each of the solid lines in fig. 3 were calculated using a nonlinear least-squares fitting program, where the surface phonon features were fit with Lorentzian functions and the background to the right of the phonon peak was fit by a Gaussian function. This Gaussian background is due to multiphonon and bulk phonon contribu- tions to the surface spectral density, as observed in HAS and HREELS experiments [29,30].

422 D.D. ,,,,.,,~,,.,.,'" . . . . . S . o,,.,.,,,..ca" . . . . / . . . . . . p~,,-,n,~n., on fcc (100), (110), and ( l l D surface. II
The t empera tu re dependenc ies of the frequen- cies for the modes plotted in fig. 3 are shown in fig. 4. The solid dots are the f requencies obta ined from the Lorentz ian fits to the spectral densities. The f requencies of all three modes decrease lin- early with tempera ture . This decrease is primarily caused by the increase in latt ice spacing which occurs as T is increased, i.e., f rom thermal expan- sion. The decrease in f requency can also be par- tially a t t r ibuted to anharmonie effects at elevated tempera tures .
The t e m p e r a t u r e dependencies of the frequen- cies shown in fig. 4 were leas t -squares fitted to w = o~ 0 -~o~T, where oJ is the f requency of the mode, ~o o is the frequency at T = 0.0, and co~ is the slope. W e have tabulated the slopes and intercepts f rom these fits in table 1. In this table the phonon modes are grouped according to their velocity component ; k, ~, or ~. T h e first column of the table shows the surface for each mode. In the second co lumn of table 1 the surface mode assignment as derived by Allen, Al ldredge and de
0 . 1 8
0.14
0.09
c2 0.05
0.10
• ' ' I" * ' ' I ' ' ' I ' ' ' I ' • '
a
t LJ(100)
T=0. ! 53
~ . . . . . . . . . . . . : . . . . .
3 0.06
0 .04
' ~ ' I L 1"' ~ I t "r-- t I ~ , , ] ~ t ,
0.08 ~1 LJ(100) . T=0.305
0.08 ~ , . , ~ , , , ~ , . , c , ' "~ " ' ' ~
_~ o.04
0.02
0.00 i ,
0.15
0.11
3
._b 0.08 ° , , .
0 . 0 4
0.07
0.06
0.05
3 0.04 " N
0.03
0.02
0.01
0.06
0.05
~, 0.04 S .A N 0.03
L I . k / / .
001
0.00
~ b ' ' I ' ' ' I " ' ' • I ' ' ' I ' ' " '"
O LJ(110) 1
i . , ~ . ~ R . t , , S D ~ , , , t , . , t , 7"~. .s.kkkkkt~Gc~z' t t 'n '~
LJ(110)
T-0.458
0 4 8 12 16 20 0 4 8 12 16 20
Energy (co) Energy (o3)
Fig. 3. The effect of increased temperature on the modes plotted in ~i~ 2. The left side of the figure is S~ at X for the (ll)l)) surface. S, at X for the (110) surface, and S~ at ,~( : (see tc×tl for th(~ ( 11 ! ) surface.

D.D. Koleske, S.J. Sibener / Phonons on fcc (I00), (110), and (111) surface. H 423
0 . 1 6 ' ' ' , ' ' ' I ' ' , , , , , 1 . . . .
~ C ~ L J ( 1 1 1 ) :
02. /t ,._, T = 0 . 1 5 3
~ o.u8 oo4 ..... 0 . 0 6 ~ , , , ' ' ' ' ' ' O ' ' ' ' ' ' ~ ' ' '
0 . 0 5 r L J ( I 11)
~ , 0 . 0 4 = .
3
..2~ 0.03
~ " 0 . 0 2
0 . 0 1
0 . 0 5 l , , , , , , , , , ' ' , ' ' ' I ' ' ' /
004i I "~ 0 . 0 3 f 7 Y~ T = 0 ' 6 1 1 !
..2,, ~ : ~ ~ ~ ( ~ 0 . 0 2
0 . 0 1
0 . 0 0 , , , , , t . . . . . .
0 4 8 1 2 1 6 2 0
Energy (to) Fig. 3. C o n t i n u e d .
Wette is shown (these same assignments are used in fig. 2 of paper I). The third column of table 1 shows the high-symmetry reciprocal lattice points for each of the modes. In the fourth column, the T = 0.0 frequencies, co o, are shown, in the fifth column the slopes, oJ~, are shown, a.~d in the last column the scaled slopes, ~o~/~oa, are shown. We scale the slopes in this way so that the slopes of different des can be directly compared to each other inaependent of the T = 0.0 frequency (which varied from 25.52-6.8009). The scaled slopes for the three modes in fig. 4 are nearly
identical, which is expected since these vibrations are the Rayleigh waves for these surfaces, all propagating along the (110) direction.
In an attempt to explain this decrease in fre- quency as the temperature is increased, slab tech- nique (ST) calculations for the modes in fig. 4 were calculated as a function of temperature (the lattice spacing is changed to account for thermal expansion) and revealed scaled slopes equal to ~o~/~o 0 = 0.25 _+ 0.01 for all three surface modes. These scaled slopes calculated using the ST are about 17-30% less than the MD calculated scaled slopes shown in table 1. This discrepancy be- tween the two methods occurs because all higher-order potential terms are included in the MD method, whmeas only the first and second derivatives of the pair-potential are used in the ST calculation. Similar disagreement has also been observed in the MD simulations and ST calculations on Cu(110) [ 14].
Because the decrease (o)~/o9 o) in frequency occurs both from thermal e-:pansion of the lattice and anharmonic terms, an attempt was made to quantify the relative contribution of each. The anharmonic contril-,ution to the frequency de- crease will most likely be stronger for modes that are localized to the surface, since these vibrations will be more strongly effected by the temperature induced increase in atomic displacements. This measure was obtained using the: eigenvector dis- placements, ]e"(Q; l~)l z, which for vibrations
! 1 . 0 ~ ; ' l . . . . , . . . . Y . . . . I . . . . ~ . . . . , . . . .
[ ] - L J ( I O 0 ) at X
1 0 . 5 ~ " - i - ~ A - L J ( I l O ) at X
, ~ 1 0 . 0 - L J ( I I 1 ) at K*
9.5 -
9 . 0
8.5 ! "~ +
8 . 0 .......... L, . . . . . J ........... J ........... J . . . . . . ~ .......... l ........ .~
0 0 .1 0 .2 0 . 3 0 . 4 0 . 5 0 . 6 0 . 7
T e m p e r a t u r e (T)
Fig. 4. P lo t o t t h e f r e q u e n c y d e c r e a s e fo r m o d e s in fig. 3 as z
f u n c t i o n o f i n c r e a s i n g t e m p e r a t u r e . T h e in te rcep t s , s l t ; /=s,
a n d s c a l e d s l o p e s for these m o d e s ~. e : ,hown in tab le 1.

424 D.D. Koleske, S.J. Sibener / Phonons on fcc (100), (I10), and ( l i d surface. H
Table 1 This table contains the linear fitting parameters of the phonon frequency as a function of temperature, T
Surface Mode Q Intercept Slope Scaled slope oJo (w) col (,,.,) oJi/'COo
Localization to surface
component modes 100 $6 ~ 22.,7,0 5.74 0.253 0.10
110 S7 X 22.72 6.38 0.281 0.38
110 $2 Y 8.67 3.15 0.363 0.87
111 S 4 M 25.52 5.00 0.196 0.15
component modes 100 S~ X 6.96 4.52 0.649 1.49
110 S 2 X 12.34 4.87 0.395 0.06
110 S t S 10.20 4.89 0.479 0.27
1 I0 S ~ Y 6.80 3.36 0.494 0.37
~. component modes 100 $4 ,X 10.51 3.15 0.300 0.23
100 S ! M 11.59 4.16 0.359 0.96
110 S~ X 10.17 3.63 0.357 0.16
110 S 2 S 10.61 3.76 0.354 0.13
110 S 3 Y 9.36 4.29 0.459 0.36
111 S l M 10.52 3.41 0.324 0.23
111 S I K, * 11.13 4.35 0.391 0.53
The modes are grouped according to their velocity component; .~, .~ or £. The first three columns show the surface, the mode assignment given in ref. [48], and the Q vector where the mode was sampled. The fourth and fifth column give the intercept and negative slope of the linear fit to the temperature dependence data. The sixth column shows the scaled slope, to~/'to 0. The seventh column contains the mode's degree of localization to the surface, i.e., the larger the value the more localized the mode is to the surface. Its derivation is explained in the text.
localized to the surface decays exponentially into the bulk, i.e., increasing l~. 1'he rate of this decay or A(logle'~(Q; l:)12)/Alz is shown in table 1. The larger this decay the more localized this mode is to the surface. On the (100) and (111) surfaces, modes which have a large scaled slope tend to have a large localization to the surface. This correlat ion between scaled slope and local- ization to the surface is less t rue for the modes on the ( ' ""~ ----~- -- '- . . . . . . . . . . '- -' ~xuj ~u~acc hi part u~,:au~c the ~cal~u slopes, wh 'ch on average are the largest, are more likely influence by anharmonic terms than modes on the (100) or (111) surfaces. The scaled slopes also tend to be larger on the (110) surface than the (lf~0) or (111). The larger decrease of the S t mode on the (i00) su~--~--,~,.c ;¢.o mo~t likely at-
8
1.60
1.20
0.80
0.40
0.00
. . . . I . . . . I . . . . I . . . . I ' ' I . . . . I ' ' ' '
[] -LJ(IO0) at X ~ / ~
A -IA(IIO) at X ~ /
e -LJ(III) at K* m
[]
0 0.1 0.2 0.3 0.4 0.5 0.6 0.7
Temperature (T)
Fig. 5. Plot of the phonon width increase for the modes in fig. 3 as a function of increasing temperature. The phonon width's slope for the linear regien for all three modes are shown in ~able 2. The quadratic fit for the (110) surface is also shown in
table 2.
D.D. Koleske, S.J. Sibener / Phonons on fcc (100), (110), and (111) surface. H 425
tributed to the increased localization to the sur- face (A(log [ e'~(Q; l~)l 2)/AI~ - 149).
The temperature dependencies of the line- widths shown in fig. 4 are plotted in fig. 5. Since the Rayleigh wave frequencies shown in fig. 4 are roughly the same, the widths plotted in fig. 5 were not scaled by the zero temperature fre- quency, to 0, for each mode. In fig. 5, a straight line of slope W~ was fit to the Rayleigh wave FWHM on the (111) and (100) surfaces, and on the (110) at low temperature. The intercepts here are zero, since the linewidths should be zero at T = 0. This linear dependence of the linewidths with increasing T worked well for S 4 on the (100) surface and S~ on the (111) surface. However, this linear trend does not fit the temperature depend- ence o f S t on the (110) surface at temperatures greater than T = 0.25. At these temperatures, this mode is better fit by a quadratic function given by
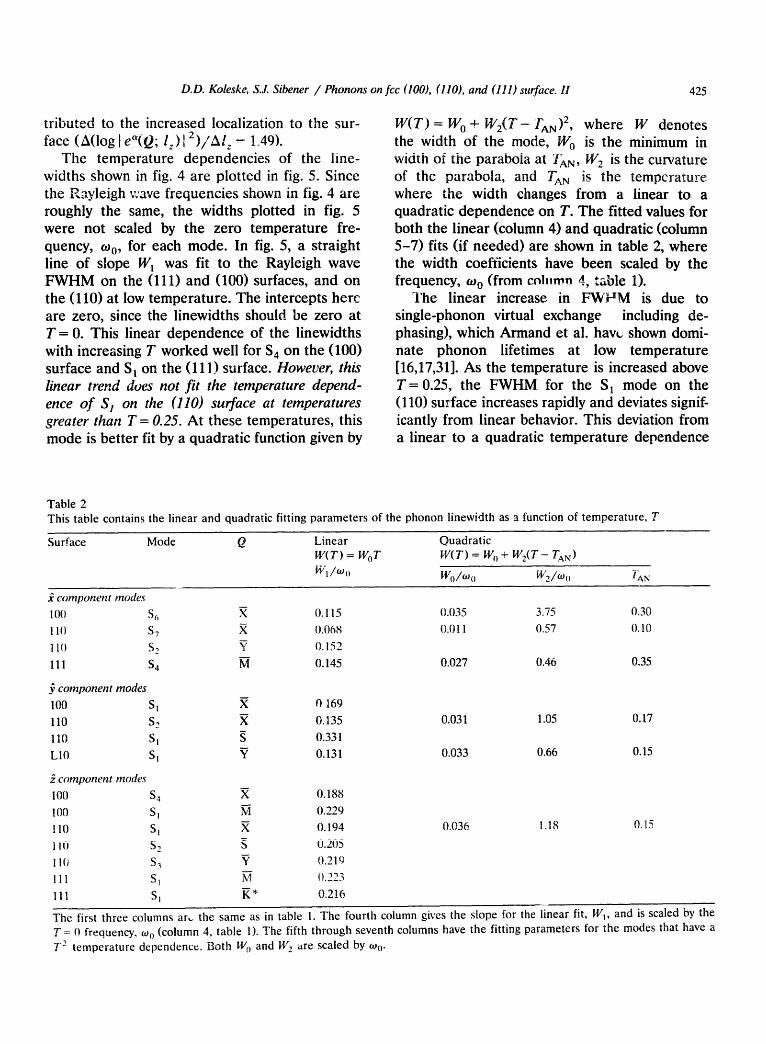
W(T) = W 0 + WE(T --/'AN)2, where W denotes the width of the mode, W 0 is the minimum in width of the parabola at I~,~, W 2 is the curvature of the parabola, and TAN is the temperature where the width changes from a linear to a quadratic dependence on T. The fitted values for both the linear (column 4) and quadratic (column 5-7) fits (if needed) are shown in table 2, where the width coefficients have been scaled by the frequency, ~o (from column 4, table 1).
The linear increase in F W ~ M is due to single-phonon virtual exchange including de- phasing), which Armand et al. havt~ shown domi- nate phonon lifetimes at low temperature [16,17,31]. As the temperature is increased above T - 0 . 2 5 , the FWHM for the S~ mode on the (110) surface increases rapidly and deviates signif- icantly from linear behavior. This deviation from a linear to a quadratic temperature dependence
Table 2 This table contains the linear and quadratic fitting parameters of the phonon linewidth as a function of temperature, T
Surface Mode Q Linear Quadra t ic W(T) = WoT W(T) = W o + W2(T - TAN)
Wl/w. Wol~,l ~2/oJ. JAN
.~ component modes
100 S
110 S 7
110 S~
111 S 4
2~ component modes
100 S l
110 S-,
110 S 1
L10 S I
P. component modes
100 S 4
!00 Si
110 S I
i i0 S 2
11{) S 3
111 S I
111 S I
,X 0.115 0.035 3.75 0.30
0.068 0.011 0.57 0.10
Y 0.152
0.145 0.027 0.46 0.35
X 0 169
R 0.135 0.031 1.05 0.17
0.331
0.131 0.033 0.66 0.15
X 0.188
M 0.229 w
X 0.194
g 0.205 Y 0.219
M {).223 w
K * 0.216
0.036 1.18 0.15
The first three columns ar,. the same as in table 1. The fourth column gives the slope for the linear fit, W 1, and is scaled by the T = 0 frequency, w 0 (column 4, table 1). The fifth through seventh columns have the fitting parameters for the modes that have a
T 2 t empera ture dependence . Both W 0 and W 2 are scaled by to o.

426 D.D. Koleske, S.J. Sibener / Phonons on fcc (100), (110), and ( l i d surface. II
p - ,
8
13 .0
12 .0
11 .0
10 .0
9 . 0
8
7 . 0
.... .... .... .... . L I ( I I I ) , , ', , I ~ i l I .... ~ ....
[]-U(100) at M
a -U(II0) at Y -
# -U(II0) at S A
at M
- 1 , , i t
0 0 . I 0.2 0 .3 0 . 4 0.5 0 .6 0 .7
T e m p e r a t u r e (T)
Fig. 6. Plot o f the frequency decrease as a funct ion of increas- ing t e m p e r a t u r e for Rayleigh modes at various high-symmetry
points.
is due to increased contribution from p h o n o n - phonon virtual exchanges [16,31]. These higher- order virtual-phonon exchanges begin to occur on the (110) surface at lower temperatures than on the (100) and (11 l) surfaces because of the larger thermally activated d:~placements which occur perpendicularl, y to the direction in w~ich this mode prop~.gates. The temperature at which the T 2 dependence begins to "turn-on" fer S l at on the (110) surface is TAN = 0.15. We will pre- sent more on how the KMSD change with in- creasing temperature later in this paper.
The frequency dependencies of four other ~- polarized modes are plotted in fig. 6: S~ at M on the (100) su~ace, S 2 at S on the (110) surface, S 3 at Y on ~he (110) surface, and Sl at M on the (111) ~urface. The intercepts, slopes, and scaled slopes for these modes are tabulated in table 1. The temperature dependence of these modes
ge have rou~nly the same slope as as the modes in f'g. 4. The temperature dependence of these modes' FWHM are not plotted, but the tempera-
shown in table 2. This change in the phonon width, -rn T to F 7
dependence also occurs on the (100) and (111) surfaces, but at significantly higher temperatures than on the (110) surface. T z dependent width changes were also observed in the .~ and .~ com- ponent spectra as shown in table 2. Two modes
that with an J~ component of motion were found to have a T 2 temperature dependence. These modes are the $6 at X on the (100) surface and the S 4 at M on the ( l i d surface. Both cf these modes involve shear vertical motion and propa- gate perpendicular ($4) or nearly perpendicular (S 6) to the direction of largest RMSD. Three additional modes were found on the (110) surface that displayed T 2 temperature dependence. These are the S 2 and S 7 at X, and the S~ at Y. In fact, all three major modes, S 1, S 2 and $7 at X on the (110) surface change to a T 2 temperature dependence. Each of the modes that display T 2 temperature dependence propagates perpendicu- lar or nearly perpendicular to a direction of maxi- mum RMSD, except the S~ at Y. (This mode is only weakly quadratic in temperature.) The tem- peratures at which the mode's FWHM changes from T to T 2 dependence is TAN = 0.30 for the (100) surface, TAN=0.15 for the (110) surface and TAN = 0.35 for the (111) surface.
Because the amount of the anharmonic poten- tial the surface atoms sample depends on how far apart they move from each other, the root-mean- square dlspmcements were also monitored during the simulation. The directional components of the RMSD for all three surfaces are plotted in fig. 7. On the (110) surface near T=O.15, the RMSD ()-component) perpendicular to the rows become larger than the surface normal RMSD ~.- component). This is not surprising, since along this direction the nearest-neighbor distance is q~ larger than in the .~-direction. Experimental measurements of the MSD on Ni( l l0) indicate that the MSD perpendicular to the rows are larger than the MSD parallel to the rows [32]. Clark et al., using a simple force constant model, have found that the MSD perpendicular to the rows are 33% larger than the MSD parallel to the rows [33]. This larger RMSD perpendicular to the
along the row. When the RMSD perpendicular to the rows become larger than those normal to the surface, the probability for this mode to scatter into other modes increases. For comparison, the S 3 mode at Y, which propagates perpendicular to the atom rows, does not show T 2 dependence, because the RMSD parallel to the rows are

D.D. Koleske, S.J. Sibener / Phonons on fcc (100), (110), and ¢111) surface. H 427
0 .10 l ' ' i ' l ' ' ' ' l . . . . 1 . . . . 1' ' ' ' 1 . . . . I . . . .
,L x direction 1
'~ 0 .08 y direction ,.e _ -1
1 6 / z direction
0 .06 L d . .,r" " ~
9 " O A. , , , ,~
m__~ 0.040.02 ; l l f~ i / ~
L J ( 1 0 0 )
0 .10 . . . . , . . . . , . . . . ; . . . . , . . . . , . . . . I . . . .
'-" i i X direction jm ,., 0 .08 y direct ion . g / . D gl
z direction /
f / , / - "~ 0 .04 . I
. . . . . . . . . . . . | , t t I i i , , , i | i i i , , i i , i i * , , | : t
0 .10 . . . . , . . . . , . . . . , . . . . ' . . . . I . . . . I . . . . O A x direction .,
"" m y direction . . . , / a o.o8
o z direction ... ...-O / j .aL
0 .04 ~ " A .
0.02 LJ(1 1 1)
0 . 0 0 ! . . . . ' . . . . ' . . . . ' . . . . ' . . . . ' . . . . ' . . . .
0 0.10 0.2 0.3 0.4 0.5 0 .6 0.7
Temperature (T)
Fig. 7. Plot of tile directional components RMSD for the (100), the (110), and the (111) surfaces. The x-component RMSD are represented by triangles, the y-component RMSD are represented by squares, and the :-component RMSD are
represented by circles.
face and a slightly disordered (110) surface. We perform this comparison to better understand the difference between the temperature induced structural changes and the temperature induced anharmonic changes in the RMSD and surface stress.
The disordering mechanism we observed, called an adatom-vacancy pair defect, is shown in fig. 8. It is created when one surface atom is promoted to the next surface layer, while the atom originally next to it in the lattice shifts in the i-direction to take the adatoms' original posi- tion. Several authors have proposed that the cre- ation of this defect is a possible initial disordering stage for surface melting and roughening [14,15,34]. Previously, de Lorenzi et al. estimated for two surface temperatures the frequency of adatoms single jumps were larger perpendicular to the atom rows on the (110) surface than along the atom rows [35]. These authors indicate that the adatoms which are promoted to ontop of the surface remain relatively fixed until the next dif- fusion event [351.
In our simulations, we witnessed the creation of one of these adatom-vacancy pair defects for a simulation size of 12 x 12 x 41 at T = 0.458. The defect appeared during the simulation near the 58000th integration time step and no further defect pairs were observed up to the completion of the simulation at the, 123000th time step. For a slightly smaller sized simulation 10 x 10 x 31 at T = 0.458, no defect pairs were observed up to
smaller than both the RMSD normal to the sur- face and perpendicular ,o the rows.
For work discussed up to this point, we have simulated surfaces where all atoms have main- tained registry with the initial sinmlation p,;si- tions; i.e., no diffusion events have occurred. At this point, we will discuss simulations were we have monitored the surface stress as a function of increasing te~r.perature for an ordered (110) sur-
o r d e r e d d i s o r d e r e d
Fig. 8. Plot of the adatom-vacancy defect-pairs creation mechanism observed on the (110) surface. The left-hand side shows the directions that the atoms are displaced and the right hand side shows the final arrangement of atoms. The striped circle denotes the adatom and the black ciccle denotes
the vacancy.

428 D.D. Koleske, S.J. Sibener / Phonons on fcc (100), (I10), and ( l i d surface. H
Table 3 This table contains the first- and second-layer RMSD for the ordered and disordered surface depicted in fig. 8 (the simulation
temperature was T = 0.453)
Layer Type Mean-square displacements ( x 102o')
k .~ ~ Total
1 st Ordered 5.93 8.82 7.74 I3.14 Disordered 6.13 9 07 7.87 13.49
2 nd Ordered 4.82 5.39 5.95 9.37 Disordered 4.80 5.48 6.02 9.44
the 123000th time step. This indicates that the creation of one of these defects is a rare event. However, this cannot rule out the possibility that the periodic boundary conditions or different sizes of the simulations might also be playing a signifi- cant role.
Because the creation of this defect is rare at this temperature, it was not studied in detail but a surface that contains one defect pair or was simulated. In table 3 we show the changes in the 2.5 first- and second-layer RMSD (all three direc- tional components) for an ordered (110) surface r~ 2.3 and a "disordered" (110) surface that contains ~, one adatom-vaeancy pair defect. All RMSD val- ~ ues for the "disordered" (110) surface are slightly ~ -. larger than RMSD for the ordered surface, ex- cept for the .~-component in the second layer.
1.9 When aceraged over the 100 surface atoms, the o.l first-layer surface normal RMSD are 2.6% larger on the disordered surface than on the ordered surface. This implies that the increase in the RMSD on the disordered surface is small com- -0.20 pared to the relative increase in the RMSD from the anharmonic potential terms. Over the entire -024 integration time the 12 × 12 × 41 dimensioned e. (110) surface was simulated, we estimate that the ~ -02s creation of only one adatom-vacancy defect pair
".~ -0.32 is possible. If the creation cf additional defect = pairs v~ere possible, we believe that the creation ~ -o.36 of additional defects should occur fairly rapidly after the crcaqon of the initial defect. However, -0.40 no additional defects were observed between the 58000th and 123 000th time step.
Even though the increase in the RMSD for the creation of one adatom-vacancy pair defect is small compared to the anharmonic contribution,
the creation of just one of these defects relieves a substantial amount of in-plane surface stress. Previous studies of the calculated surface stress on the (110) surface show that a positive tensile stress exists along the rows (.~-direction) and a negative compressive stress exists pe~endicular ly
~ " " - ~ xx-eomponent
O-ordered x i:
- m-disordered
. : . . • . . . . . ~ , . ~ " ~ _ . . . . , . , "*
0.2 0.3 0.4 0.5
Temperature (T)
,_ yy-component
: I F ~- e - o r d e r e d ~
r u -disordered
0.1 0.2 0.3 0.4 0.5
Temperature (T)
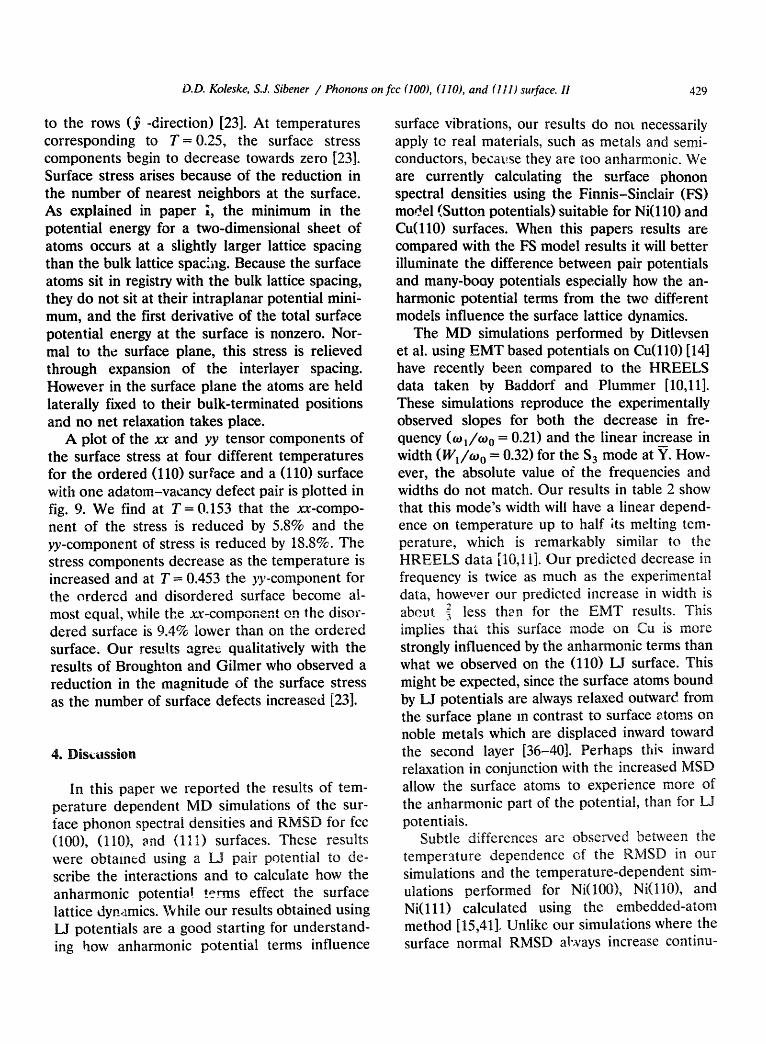
Fig. 9. Plot of the xx ,~nd yy tensor components of the surface stress as a *,~r,,~t:.. i temperature for the two configurations
, h~wn in fig. 8.
D.D. Koleske, S.J. Sibener / Phonons on fcc (100), (110), and (111) surface. H 429
to the rows (j3 -direction) [23]. At temperatures corresponding to T=0.25 , the surface stress components begin to decrease towards zero [23]. Surface stress arises because of the reduction in the number of nearest neighbors at the surface. As explained in paper i, the minimum in the potential energy for a two-dimensional sheet of atoms occurs at a slightly larger lattice spacing than the bulk lattice spacing. Because the surface atoms sit in registry with the bulk lattice spacing, they do not sit at their intraplanar potential mini- mum, and the first derivative of the total surface potential energy at the surface is nonzero. Nor- mal to the surface plane, this stress is relieved through expansion of the interlayer spacing. However in the surface plane the atoms are held laterally fixed to their bulk-terminated positions and no net relaxation takes place.
A plot of the x.r and yy tensor components of the surface stress at four different temperatures for the ordered (110) surface and a (110) surface with one adatom-vacancy defect pair is plotted in fig. 9. We find at T = 0.153 that the xx-compo- nent of the stress is reduced by 5.8% and the yy-component of stress is reduced by 18.8%. The stress components decrease as the temperature is increased and at T = 0.453 the yy-component for the ordered and disordered surface become al- most equal, while the xx-component on the disor- dered surface is 9.4% lower than on the ordered surface. Our results agree qualitatively with the results of Broughton and Gilmer who observed a reduction in the magnitude of the surface stress as the number of surface defects increased [23].
4. Discussion
In this paper we reported the results of tem- perature dependent MD simulations of the sur- face phonon spectral densities and KM~t9 Ior fcc (100), (110), and (111) surfaces. These results were obtained using a LJ pair potential to de- scribe the interactions and to calculate how the anharmonic potential terms effect the surface lattice dynamics. Vuhile our results obtained using LJ potentials are a good starting for understand- ing how anharmonic potential terms influence
surface vibrations, our results do not necessarily apply te real materials, such as metals and semi- conductors, because they are too anharmonic. We are currently calculating the surface phonon spectral densities using the Finnis-Sinelair (FS) model (Sutton potentials)suitable for Ni(110)and Cu(ll0) surfaces. When this papers results are compared with the FS model results it will better illuminate the difference between pair potentials and many-booy potentials especially how the an- harmonic potential terms from the two different models influence the surface lattice dynamics.
The MD simulations performed by Ditlevsen et al. using EMT based potentials on Cu(ll0) [14] have recently been compared to the HREELS data taken by Baddorf and Plummer [10,11]. These simulations reproduce the experimentally observed slopes for both the decrease in fre- quency (wl /w o = 0.21) and the linear increase in width (W~/w o = 0.32) for the $3 mode at Y. How- ever, the absolute value of the frequencies and widths do not match. Our results in table 2 show that this mode's width will have a linear depend- ence on temperature up to half its melting tem- perature, which is remarkably similar to the HREELS data [10,1i]. Our predicted decrease in frequency is twice as much as the experimental data, however our predicted increase in width is
2 abeut 3 less th~n for the EMT results. This implies that this surface mode on Cu is more strongly influenced by the anharmonic terms than what we observed on the (110) LJ surface. This might be expected, since the surface atoms bound by LJ potentials are always relaxed outward from the surface plane in contrast to surface e, toms on noble metals which are displaced inward toward the second layer [36-40]. Perhaps thi~ inward relaxation in conjunction with the increased MSD allow the surface atoms to experience more of the anharmonic part of the potential, than for LJ potentials.
Subtle differences are observed between the temperature dependence Gf the RMSD in our simulations and the temperature-dependent sim- ulations performed for Ni(106), Ni(II0), and Ni ( l l l ) calculated using the embedded-atom method [15,41]. Unlike our simulations where the surface normal RMSD always increase continu-

430 D.D. Koleske, S.J. Sibener / Phonons on fcc (100), (110), and ( l i d surface. II
ously from the bulk to the surface, the Ni(l l0) first layer RMSD normal to the surface are lower then the second-layer RMSD normal to the sur- face [15]. This effect is due to the increase in the embedding potential as a consequence of the ~!ecreased atomic surface density [42]. However, the RMSD normal to the atomic rows on the N:(l l0) surface are larger than the RMSD along the atomic rows or normal to the surface plane [15], which is it: agreement with our simulation results. This implies that at X on Ni(ll0) the surface phonon modes might display a T to T 2 change in linewidth as the temperature of the surface is heated.
5. Conclusions
We have reported how increased temperature effects the surface phonon spectral densities of LJ solids. We find that as the temperature is increased, the frequency of all modes decrease linearly in temperature, while the modes' widths increase linearly at low temperature, and for some modes quadratically at higher temperatures. The temperature at which the transition from linear to quadratic T dependence dominates the linewidth depends on the surface face. These temperatures are approximately TAN = 0.30 for the (100) surface, T~N=0.15 for the (110) sur- face, and TAn = 0.35 for the (111) surface. The linear temperature dependence of the linewidth is believed to be dominated by single phonon- phonon scattering while the quadratic depend- ence is due to the increase of a single phonon into higher-order phonon scattering events [16,17]. Adso, the linear to quadratic temperature dependence change of the linewidth occurs for modes which propagate normal or nearly normal to the direction of maximum RMSD.
The change from linear to quadratic width dependence occurs on the (110) surface at a lower temperature (TAN =0.15) than the (100) and (111) surfaces. Near this temperature the RMSD perpendicular to tbe rows on the (110) surface become larger than the RMSD normal to the surface plane at T = 0.15. Because of the increased RMSD perpendicular to the rows, the
m
Rayleigh wave's width at X changes from a linear to a quadratic temperature dependence, as seen in fig. 5. Our results support claims [9] that in- creases ;n measured RMSD for some systems can be due to increased surface anharmonicity rather than from surface roughening. In a forthcoming paper we will examine whether similar tempera- ture dependent changes occur for Ni(ll0) and Cu(110) using a Finnis-Sinclair potential model [43,44].
Although the initial decrease in the RMSD is due to the anharmonic potential terms, small amo~_,ts of surface disorder will further increase the RMSD. We have shown that the amount of RMSD increase for a "disordered" surface that has one adatom-vacancy defect pair is small compared to the anharmonic contribution [14,15,34]. The kMSD on the "disordered" sur- face which contains one adatom defect pair are only 2.6% larger when averaged over 100 surface atoms than the RMSD for an ordered surface. However the creation of this defect on the (110) surface relieves a substantial amount of in-plane surface stress. The creation of this defect pair reduces the xx-component of the stress by 5.8% and the yy-component of stress is reduced by 18.8% when compared to the ordered 100 atom surface r t. the same temperature. Stress reduction as a consequence of this defect creation may be important for a more thorough understanding of temperature driven phenomena at surfaces such as melting, the initial stages of epitaxial growth, and reductions in chemisorption energies upon adsorption due to geometric relaxatior~ of the surface [ 15,45-47].
Acknowledgements
We wish to acknowledge many helpful conver- sations with P.A. Knipp. We also thank D.L. Mills, D.F. Padowitz, L. Brown, S.F. King and T. Curtiss. This work was supported, in part, by the Air Force Office of Scientific Research and the National Science Foundation Materials Research Laboratory at The University of Chicago.

D.D. Koleske, S.J. Sibener /Phonons on(co (100), (110), and ( l i d surface. II 431
References
[1]
[2] [31
[4] [5]
[61
[7]
[8] [9]
[101
[111
[12]
[13]
[141
[151
[161
[171
[181
[19] [201 [21]
[22]
[231
[24]
[251
G.A. Held, J.L. Jordan-Sweet, P.M. Horn, A Mak and R.J. Birgeneau, Phys. Rev. Lett. 59 (1987) 2075. S.G.J. Mochrie, Phys. Rev. Lett. 59 (1987) 304. B. Salanon, F. Fabre, D. Gorse and J. Lapujoulade, J. Vac. Sci. Technol. A 6 (1988) 655. J. Lapujoulade, Surf. Sci. 178 (1986) 406. U. Breuer, O. Knauff and H.P. Bonzel, Phys. Rev. B 41 (1990) 10848. J.W.M. Frenken, R.J. Hamers and J.E. Demuth, J. Vac. Sci. Technol. A 8 (1990) 293. H. Yang, T. Lu and G. Wang, Phys. Rcv. B 43 (1991) 4714. Y. Cao and E.H. Conrad, Phys. Rev. Lett. 64 (1990) 447. P. Zeppenfeld, K. Kern, R. David and G. Comsa, Phys. Rev. Lett. 62 (1989) 63. A.P. Baddorf and E.W. Plummer, J. Electron Spec. Rei. Phenom. 54/55 (1990) 541. A.P. Baddorf and E.W. Plummer, Phys. Rev. Lett. 65 (1991) 2770. R. Franchy, M. Wuttig and H. lbach, Surf. Sci. 203 (1988) 489. K. Kern, U. Becher, P. Zeppenfeld, G. Comsa, B. Hall and D.L. Mills, Chem. Phys. Lett. 167 (1990) 362. P.D. Ditlevsen, P. Stoltze and J.K. Norskov, Phys. Rev. B (1991), submitted. E.T. Chen, R.N. Barnett and U. Landman, Phys. Rev. B 41 (1990) 439. G. Armand and P. Zeppenfeld, Phys. Rev. B 40 (1989) 5936. G. Armand, D. Gorse, J. Lapujoulade and J.R. Manson. Europhys. Lett. 3 (1987) 1113. D.D. Koleske and S.J. Sibener, J. Electron Spectrosc. Relat. Pheqom. 54/55 (199f))363. P. Knipp, Phys. Rev. B 43 (1991) 6908. D.D. Koteske and S.J. Sibener, Surf. Sci. 268 (1991) 406. M.R. Mruzik and G.M. Pound, J. Phys. F (Metal Phys.) 11 (1981) 1403. J.Q. Broughton and L.V. Woodcock, J. Phys. C (Solid State) 11 (1978) 2743. J.Q. Broughton and G.H. Gilmer, J. Chem. Phys. 79 (1933) 5105.
"9 J.Q. Broughton and G.H. Giimer, J. Chem. Phys. / (T, 983) 5095. 3.Q. Broughton and G.H. Gilmer, J. Chem. Phys. 79 (1983) 5119.
[26] R.E. Allen, F.W. de Wette and A. Eahman, Phys. Rev. 179 (1969) 887.
[27] A.R. McGurn, A.A. Maradudin, R.F. Wallis and A.J.C. Ladd, Phys. Rev. B 37 (1988) 3964.
[28] W. Schommers, in: Structure and Dynamics of Surfaces I, Eds. W. Schommers and P. yon Blackenhagen (Springer, Berlin, 1986).
[29] K. Kern and G. Comsa, in: Molecule Surface Interac- tions, Ed. K.P. Lawley (Wiley-Interscience, Chichester, 1989).
[30] H. Ibach and D.L. Mills, Electron Energy Loss Spec- troscopy and Surface Vibrations (Academic Press, New York, 19821.
[31] G. Armand, J.R. Manson and C.S. Jayanthi, Phys. Rev. B 34 (1986) 6627.
[32] A.U. MacRae and L.H. Germer, Phys. Rev. Lett. 8 (1962) 489.
[33] B.C. Clark, R. Herman and R.F. Wallis, Phys. Re-,. 139 (1965) 860.
[34] V. Rosato, G. Ciccotti and V. Pontikis, Phys. Rev. B 33 (1986) 1860.
[35] G. de Lorenzi, G. Jacucci and V. Pontikis, Surf. Sci. 116 (1982) 391.
[36] S. Lehwald, J.M. Szeftei, H. Ibach, T.S. Rahman and D.L. Mills, Phys. Rev. Lett. 50 (1983) 518.
[37] S. Lehwald, F. Wolf, H. lbach, B.M. Hall and D.L. Mills, Surf. Sci. 192 (1987) 131.
[38] W. Menezes, P. Knipp, G. Tisdale and S.J. Sibener. Phy. Rev. B 41 (1990) 5648.
[39] P.D. Ditlevsen and J.K. Ncrskov, J. Electron Spe~.trosc. Relat. Phenom. 54/55 (1990) 237.
[40] J.S. Nelson, E.C. Sowa and M.S. Daw, Phys. Rev. Lett. 61 (1988) 1977.
[411 E.T. Chen. R.N. Barnett and U. Landman. Phys. Rev. B 40 (1989) 924.
[42] J.S. Nelson, M.S. Daw and E.C. Sowa, Phys. Rev. B 40 (1989) 1465.
[43] M.W. Finnis and J.E. Sinclair, Philos. Mag. A 50 (1984) 45.
[44] A.P. Sutton and J. Chen, Philos. Mag. Lett. 61 (1990) 139.
[45] P. Stoltze, J.K. Ncrskov and U. Landman, Phys. Rev. Lett. 61 (1988) 440.
[46] P.J. Feibelman, J. Vac. Sci. Technol. A 8 (1990) 2548. [47] P.J. Feibelman, Phys. Rev. Left. 63 (1989) 2488. [48] R.E. Al'en, G.P. Aildredge and F.W. de Wette. Phys.
Rev. B 4 (1971) 1661.