PHNOM PENH - Knight Frank · demand in Phnom Penh, Food & Beverage retailers comprise a majority of...
23
Transcript of PHNOM PENH - Knight Frank · demand in Phnom Penh, Food & Beverage retailers comprise a majority of...


2
P H N O M P E N H O F F I C E S E C TO R
P H N O M P E N HO F F I C E S E C T O R
Four new office buildings (comprising 53,342 sq m of NLA) completed during H2 2019, increased Phnom Penh’s overall office supply to 517,043 sq m of NLA, an 11.5% increase from H1 2019.
Of the four new buildings, Star City (Q3 2019) and The Fortune Tower (Q4 2019), pumped in 45,059 sq m of NLA to the strata-title office stock, totalling 79,636 sq m of NLA, a drastic increase of 130% from H1 2019.
However, supply growth for centrally-owned office segment decelerated significantly with an increment of 2% from H1 2019. Chip Mong Bak Touk and Alpha Tower, both completed during H2 2019, added 8,283 sq m of NLA; bringing the total stock count up to 437,407 sq m of NLA.
Office vacancy rate continues to rise to 18.2% (a 5.3 percentage point y-o-y increase from H2 2018) mainly due to the higher vacancy rates in suburban combined with low occupancy of stratified office space.
As the market faces a softening occupier market, downward adjustment for rental rates are expected as the building owners and individual investors of strata-title offices compete for tenants.
Key findings
Overall supply for Grade B offices in Phnom Penh now surpasses Grade A whilst centrally-owned offices still remains dominant as strata-title office supply is increasingly coming online
by Chip Mong Group, located within
a commercial catchment area in close
proximity to the Olympic Stadium and the
Olympia City mixed development.
The current flexible space trend is
influencing landlords to redesign their
traditional office space to match the
needs of the ever changing labour force.
This is evident when Alpha Tower
ceased operation during first half of
2018 for renovation and reconfiguration
and re-opened during Q3 2019. To
ensure its marketability, the landlord is
offering additional options ranging from
traditional office space to furnished office
space, co working space and virtual office.
With the addition of various Grade
B buildings over 2019, Grade B now
dominates the entire office supply with
48% market share, followed by Grade C
(42%) and Grade A (10%).
Location continues to be the main pull
factor for most office tenants, hence, 91%
of the office supply is located within the
city centre whilst the remaining 9% is in
suburban. Within the city centre, Daun
Penh District still represents the most
office space with 28% of the total market
share, followed by Chamkarmon (23%)
and 7 Makara (21%). The rest are spread
amongst Boeung Keng Kang (14%), Sen Sok
(7%), Toul Kork (5%) and Mean Chey (2%).
More Grade B offices to come online
between Year 2020 and 2021.
Between Year 2020 and 2021, assuming
all our monitored projects complete
as scheduled, an additional 165,232 sq
m of NLA will be added to the supply.
52% of this additional supply will be
Supply and Demand
Four completions of office buildings
during H2 2019; Chip Mong Bak Touk,
Alpha Tower, The Fortune Tower and
Star City, have pushed cumulative
supply of office NLA to 517,043 sq m.
As at H2 2019, the cumulative supply
of Phnom Penh’s overall office supply
stood at 517,043 sq m of net lettable area
(NLA), a y-o-y increase of 24% from
the second half of 2018. Over the next
three years, the supply is forecasted to
increase to 1,216,448 sq m of NLA, a 135%
increase from the current stock count.
During H2 2019, Chip Mong Bak Touk
and Alpha Tower have inaugurated,
contributing 3,883 sq m (Grade B)
and 4,400 sq m (Grade C) of NLA,
respectively, to the centrally-owned office
space existing stock. Whilst Star City and
The Fortune Tower, both Grade B, have
each contributed 20,221 and 24,838 sq m
of NLA to the strata-title office supply.
Chip Mong Bak Touk is a wholly-owned
retail cum office development; comprising
a 3-storey retail podium with 5-storey
office atop. This project is developed
Source: Knight Frank Research
Daun Penh28%7 Makara21%Chamkarmon23%
Boeung Keng Kang14%Toul Kork5%
1%
Sen SokChroyChangva 7%
Mean Chey1%
Figure 1:Existing Supply by District
Chip Mong Bak Touk, Phnom Penh

3
P H N O M P E N H O F F I C E S E C TO R
Grade B space whilst Grade A and C will
comprise 18% and 30%, respectively.
Three new projects were introduced/
launched during H2 2019; One Central
Tower (centrally-owned), Amass
Tower (centrally-owned) and KVBC
Centre (strata-title). Both Amass Tower
and KVBC Centre are Grade B class
contributing 7,511 and 5,357 sq m of
NLA, respectively. One Central Tower
which is located in the suburban, Chbar
Ampov District, will be a Grade A
office. No information of its NLA can be
obtained to-date.
Post 2022 will see the supply of Grade A
offices surpassing Grade B and C.
Construction of new buildings continues
unabated, with 699,405 sq m of NLA due
to come on stream between 2020 and
2022, marking a 135% increase from the
current stock.
Prince Huan Yu Centre and Prince
Financial Tower, both of which were
introduced during the first half of 2019,
have been added to our basket. Both
Prince Huan Yu Centre (strata-title) and
Prince Financial Tower (centrally-owned)
comprise Grade A offices and are the main
contributors of the future majority of
Grade A office. They will comprise 49,010
and 91,000 sq m of NLA, respectively.
Post 2022, the cumulative Grade A
office supply is forecast to reach
638,466 sq m (52%) of NLA followed
by Grade B offices with 372,293 sq m
of NLA (31%) and Grade C offices with
205,689 sq m of NLA (17%).
Centrally-owned offices performed
relatively well with an average
occupancy rate of 86% as at H2 2019.
Lower rents remain attractive and Grade C
offices continue to outperform with 87.5%
average occupancy rate, followed by Grade
B offices at 86.4% and Grade A at 80.1%.
There were no new Grade A offices
completed during the second half of 2019,
thus the average occupancy rate recorded a
slight uptick and improved by 3.4 percentage
points (to 80.1%) compared to H1 2019.
The impending supply of office space
will continue to pressure the office rental
market, with vacancy rates expected
to rise. Upcoming new office buildings
in prime locations with better grades,
quality building features and competitive
rents will continue to be well received,
compared to older buildings.
Strata-title offices recorded an
occupancy rate of 54% during H2 2019.
Conversely, the average occupancy rate for
strata title offices was monitored at only
54%, largely due to their recent completion
and generally, strata-title offices do not
compete well with the remaining en-bloc
space available in the market.
Occupied spaces of strata-title offices were
predominantly Grade B with 46.5% followed
by Grade C with 7.4%. To-date, there were no
new Grade A strata-title offices completed.
Prices and Rental
Demand kept in pace with supply
during 2019. Despite the incoming and
impending supply in the pipeline, rentals
have remained resilient with a slight
improvement. The lower band of Grade
A rental slightly increased from US$29 to
US$40 per sq m per month (exclusive of
service charges and tax). Whilst Grade B
and C both are now commanding rental
rates of US$21 to US$23 and US$13 to
US$14 per sq m per month, respectively.
The newly completed Chip Mong Bak
Touk, The Fortune Tower and Star City,
all within the Grade B category, had
asking rentals ranging between $18 to $26
per sq m. The Fortune Tower stratified
office units are available for sale with
prices ranging from US$3,000 to as high
as US$4,000 per sq m of the NLA.
Office Sector Outlook
Rapid growth in co-working space and
serviced office noted in Phnom Penh.
Demand for office space has grown
in tandem with the incoming supply
to-date. However, the high impending
supply of office space is likely to cause
a subdued-to-negative effect on rental
rates and office vacancy rates are
expected to rise. To attract better quality
tenants, apart from offering greater rental
incentives, landlords will be expected
to offer other inducements such as
favourable lease terms for prospective
tenants and longer fit-out period.
To ensure marketability, landlords are also
seeking co-working space operators and
serviced office operators to enhance their
offerings and provide better amenities
within their buildings. Traditionally
favoured by start-ups and SME’s, major
multinational companies are viewing
coworking / serviced office space as a viable
alternative vis-à-vis a traditional corporate
office, and this trend looks set to stay.
By the end of 2019, there were
approximately nine existing co-working
space / serviced offices, spread over 8,190
sq m of net lettable area in Phnom Penh
city centre. Over the next three years, this
supply is forecasted to double.
Figure 2: Cumulative Supply By Year
-200,000400,000600,000800,0001,000,0001,200,0001,400,000
20082009
20102011
20122013
20142015
20162017
20182019
2020f2021f
Post 2022f
Grade A Grade B Grade C Total
Source: Knight Frank Cambodia

4
P H N O M P E N H R E TA I L S E C TO R
P H N O M P E N HR E T A I L S E C T O R
Retail space in Phnom Penh increased by 11,584 square metres during H2 2019 with the completion of Chip Mong Noro Mall, The Point Community Mall and Chip Mong Bak Touk
The overall retail space in Phnom Penh was recorded at 339,254 square metres of NLA (excluding Sovanna Shopping Centre), a nominal 0.2% increase over H1 2019, due to the temporary suspension of Sovanna Shopping Centre to undergo a major revamp and renovation.
Despite consumers’ cautious approach to retail spending, new malls in the pipeline continue opening unabated.
By 2022, Phnom Penh will see an additional 498,056 sq m of retail space NLA, if all monitored projects complete as scheduled, out of which 85% will be prime grade.
Robust take-up rates by retailers noted in Chip Mong Bak Touk and Chip Mong Noro Mall on opening improved the overall occupancy rate in 2019; recorded at 85.3%.
Prime grade shopping malls witnessed a slight regression of rentals ranging between US$27 to US$31 per sq m of NLA whilst secondary mall rentals remained unchanged.
Key findings
As supply is mounting up, mall operators and developers will have a big task on hands to carve out a niche market positioning for their mall and alternative tenant mixes ensuring marketability of their shopping mall and reduce tenant turnover
community mall contributing 7,400 sq m
of NLA. As the main driver of retail space
demand in Phnom Penh, Food & Beverage
retailers comprise a majority of the tenant
mix, interspersed with a number of
specialties, services, a hypermarket and
entertainment. Chip Mong Bak Touk is a
three-storey retail podium within a mixed
office cum retail building contributing
1,984 sq m of retail space NLA.
Incoming retail supply in Phnom Penh
is projected to grow at a compounded
annual growth rate (CAGR) of 34%
between 2020 and 2022. By the end of
2022, existing stock could accumulate to
approximately 830,000 sq m of NLA if all
monitored projects launched or under
construction are completed on schedule.
The current ratio distribution of retail space
between the city centre and suburban
districts stood at 64 : 36. This ratio is set to
even out by 2022 with the completion of
the 26 monitored projects as the majority
of upcoming supply (65% of total supply) is
focused in suburban districts.
Supply and Demand
The retail space supply recorded a 26%
y-o-y growth during 2019. Cumulative
retail space supply increased to 339,254
square metres of NLA as at the end of 2019.
Toward the second half of 2019, two
new community malls and a new retail
podium officially opened; namely Chip
Mong Noro Mall, The Point Community
Mall and Chip Mong Bak Touk.
The Point Community Mall is an office
cum retail development. Officially
opened during Q3 2019, the retail section
is a community mall totaling 2,200 sq m
of NLA.
Chip Mong Retail, a subsidiary of local
conglomerate, Chip Mong Group, further
enforced its retail market offering with
the entrants of Chip Mong Noro Mall
and Chip Mong Bak Touk, both securing
healthy take-up rates of 70% and 90%,
respectively, upon opening.
Chip Mong Noro Mall is a standalone
Figure 3: Phnom Penh Supply and Demand of Retail Space
0
5
10
15
20
25
30
35
0
100,000
200,000
300,000
400,000
500,000
600,000
700,000
2010 2011 2012 2013 2014 2015 2016 2017 2018 2019 2020f 2021f
%Sq. m.
Source: Knight Frank Research
Supply (LHS) Vacancy Rate (RHS)
Chip Mong Noro Mall, Phnom Penh

5
P H N O M P E N H R E TA I L S E C TO R
Despite two new entrants of shopping
centres in Boueng Keng Kang District
during H2 2019, retail space supply by
district remained unchanged. Sen Sok
recorded the most supply with 27%,
followed closely by 7 Makara (25%),
Chamkarmon (22%). The rest are
distributed within Daun Penh, Toul Kork,
Boueng Keng Kang, Chbar Ampov and
Mean Chey.
With 4 new projects set to complete
during 2020, Toul Kork will gain a larger
representation of retail space supply with
an additional 83,002 square m of NLA,
followed by Daun Penh with 23,800 sq m
and Sen Sok with 3,600 sq m. The volume
of Toul Kork’s upcoming retail space
supply is largely made up from Phnom
Penh Megamall, expected to complete by
Q3 2020. During H2 2019, an additional
six new malls were announced; namely
Khalandale Mall, HCN Mall & Residence,
The One Mall, B2B Park, K-Mall (KMH
PARK) and Chip Mong Mall 598.
During H2 2019, Parkson Group, a regional
Malaysian retail mall operator, announced
it would withdraw from the Cambodian
market altogether, and terminated its
anchor space lease agreement of 30,000 sq
m within the Phnom Penh Mega Mall due
to continued construction delays and will
no longer be developing their own mall
(Aeropod Mall) opposite the Phnom Penh
International Airport. This withdrawal has
been taken into account in our monitored
basket for future supply.
Despite the overall occupancy rate
declining by 3.6 percentage points to
85.3% since 2018, occupancy rate during
the second half of 2019 improved by 4.5
percentage points, largely attributed by
the removal of Sovanna Shopping Centre
from our monitored basket (recording
a 50% occupancy rate at the time of
closure) and also the robust occupancy
rates from Chip Mong Noro Mall and Chip
Mong Bak Touk upon opening.
Prices and Rental
Rentals for prime grade shopping malls
witnessed a slight regression, ranging
between US$27.00 to US$31.50 per sq m
of NLA (excluding service charges and
tax). However, rentals for secondary grade
malls remained unchanged at US$21.00 to
US$31.50 per sq m of NLA.
The large amount of upcoming retail
supply is anticipated to further restrict
rental growth for both prime and
secondary grade malls in both city centre
and suburban districts.
Additionally, monetary incentives are
being provided during pre-lease period
specifically to established tenants within
the entertainment and food & beverage
segments to entice tenants; these segments
remain the main crowd-pullers to increase
footfall while providing venues for social
and economic interactions.
Retail Sector Outlook
Based on a population in Phnom Penh
of 2,129,371 as at 2019 (based on General
Population Census 2019), the retail space
per capita as at H2 2019 was 0.16 per sq m. If
all retail space in the development pipeline
comes on line as scheduled, Phnom Penh
is expected to enter into an oversupply
situation with shopping malls facing
downward pressure on both occupancy and
rental rates impacting on bottom lines for
owners and developers. However, the issue of
retail oversupply is usually location-specific.
For retailers, the increase in retail supply
will meant further dilution to the market
as most malls will be offering similar
goods and services; worsening their
already challenging environment. Despite
millennials being poised to be the biggest
spender in the near future, the growth of
e-commerce outpacing traditional physical
stores will only further exacerbate retailers’
current challenges.
Future incoming shopping complexes
are also better planned in terms of design
and concept to attract shoppers which
will increase challenges to ageing malls.
Older malls are stepping up by undergoing
refurbishment and repositioning to meet
ever-changing consumer behaviour and
retailer requirements.
Another primary concern for the retail
sector is the consumer spending power in
Cambodia. With the rising cost of living, the
retail sector is anticipated to be adversely
affected as consumers, mainly from the
lower income group, will be cautious with
spending, specifically with big ticket items,
leading to high tenant turnover due to poor
business performance and the high rents
not being sustainable.
With the majority of consumer spending
within Phnom Penh’s retail malls being
on food & beverage and entertainment
and these tenants typically paying a much
lower rent than other types of retailers; mall
operators will be required to take this into
account for conceptualising their market
positioning and tenant mix.
Figure 4: Distribution of Existing Retail Space by DistrictDaun Penh 13% 7 Makara 25% Chamkarmon 22% Boeung Keng Kang 3%Toul Kork 2% Sen Sok 27% Chbar Ampov 3% Mean Chey 5%
Source: Knight Frank Research

6
P H N O M P E N H H OT E L S E C TO R
P H N O M P E N HH O T E L S E C T O R
The Great Duke Hotel (formerly the InterContinental), announced its official closure, deducting 374 rooms from our existing Luxury & Upper Upscale supply.
The cumulative supply of hotel was climbed to 11,335 with the completion of four new hotels, despite a major closure.
Vide the Ministry of Tourism statistics, tourist arrivals recorded positive growth of 6.6% y-o-y, reaching 6.6 million, with the majority of arrivals from China (35%).
Average occupancy rates for hotels across Cambodia for the past three years remained stable at 55% despite the increasing supply.
Key findings
A key contributor to economy over the past decade, tourist arrivals in Cambodia experienced an average annual growth of 11.8% between 2009 and 2019.
Daun Penh, a highly concentrated area
for commercial activities and tourist
attractions, dominates the location
preference for hotel operators with 4,181
keys (37% of the overall supply), followed
by Chamkarmon district (23%), Boueng
Keng Kang (10%), Chroy Chongva (9%), 7
Makra (8%), Sen Sok (6%), Toul Kork (4%),
Mean Chey (2%) and Porsenchey (1%).
Hotels in Phnom Penh are still dominated
by Midscale & Economy with 49% of the
total supply being in this category, followed
by Luxury & Upper Upscale (5 star) with 26%
and Upscale & Upper Midscale (4 star) 25%.
Several International brands are
scheduled to open between 2020 to
2022, including Hyatt Regency, Novotel,
Fairfield Marriott and Hilton Hotel.
Both Hyatt Regency and Fairfield Marriott
are being developed by local conglomerate,
Chip Mong Group, providing an aggregate
550 keys with expected completions in
2020 and 2022, respectively.
Meanwhile, Novotel, under Accor Hotels, is
under construction in Boeung Keng Kang
District and scheduled for completion by
2022, providing 200 keys to the future stock.
Supply
NagaCorp continued rigorously with
the announcement of Nagaworld 3
in Phnom Penh, adding 4,720 keys
representing 66% of the total future
pipeline.
The Great Duke Hotel (formerly managed
under InterContinental brand) officially
ceased operation at the end of 2019,
withdrawing 374 keys from the Luxury &
Upper Upscale inventory.
2019 saw an additional 884 keys across
six hotels completed in Phnom Penh. The
total cumulative supply stood at 11,335
keys at the end of 2019, reflecting an
increase of 5% y-o-y.
The latest entries during H2 2019 were Tian
Yi International Hotel (208 keys), Thai Xing
Long (128 keys), Olympia City by Dara (166
keys) and HM Grand Central (87 keys).
Tian Yi International Hotel and Olympia
City by Dara are both within the Upscale &
Upper Midscale (4 stars) whilst Thai Xing
Long and HM Grand Central are both
within Midscale & Economy (3 stars).
Figure 5: Phnom Penh Supply and Demand of Retail Space Cumulative Supply New Supply
Source: Knight Frank Research
02,0004,0006,0008,00010,00012,00014,00016,00018,00020,000
2011 2012 2013 2014 2015 2016 2017 2018 2019 2020f 2021f 2022f
No. Rooms
Hayatt Regency, Phnom Penh

7
P H N O M P E N H H OT E L S E C TO R
International hotel, Hilton Hotels
& Resorts, executed a management
agreement with a real estate company
based in Phnom Penh to operate under
one of their flagship brands.
An additional 7,189 keys are expected
to complete in Phnom Penh between
2020 to 2022, largely attributed by Naga
World Casino 3 located in Chamkarmon
(providing more than 4,000 rooms).
If all monitored projects complete as
scheduled, the total cumulative supply of
hotel rooms will reach to 18,524 rooms in
2022, reflecting an increase of 63% from
the current supply.
Occupany rate and room rates
Tourist activities continued growing with
international tourist arrivals during 2019
recorded at 6.6 million, reflecting a 6.6%
y-o-y increase from 2018.
As Cambodia’s tourism sector continues
expanding, international tourist arrivals
kept an upward trajectory with a CAGR
growth of 11.8% between 2009 and 2019.
Among the international tourists and
business travellers, China remained the top
source at 36%, followed by Vietnam at 14%.
By airports, Phnom Penh International
Airport recorded a consistent growth of
tourist arrivals at 6 million during 2019,
reflecting an increase of 11% from 2018.
Despite the increase of international tourist
arrivals in Cambodia, more specifically in
Phnom Penh, the average hotel occupancy
of Luxury & Upper Upscale remained
relatively flat y-o-y at 55%.
To remain competitive with new
upcoming hotels, operators of existing
hotels are expected to lower their room
rates to sustain their hotel occupancy
level this leading to a decrease in Average
Daily Rates (ADR).
The overall ADR of monitored hotels
during 2019 declined 13% from US$138
in 2018 to US$121 in 2019. As a result,
Revenue per Available Room (RevPAR)
also registered a 12% decrease from US$76
in 2018 to US$66 in 2019.
Hotel sector outlook
Hotel sector in Phnom Penh to remain
healthy for the foreseeable future but
ADR is expected to remain flat.
As the city continues developing, there
is an increasing number of foreign
companies setting up in Cambodia
alongside with other global businesses
establishing a presence in Phnom Penh.
Beside the influx of these businesses,
specifically from China, the growth of the
tourism industry contributed to the need for
additional luxurious accommodation which
stimulated development activity, evidenced
by the piqued interest by global hotel
operators such as Hilton, Hyatt and Marriott.
However, sustainability of the hotel sector
is dependent on the city’s continuing
establishment of tourism products such
as international standard conference
and exhibition centre (MICE) and market
diversification of tourist arrivals.
Demand for the city’s serviced apartment
and condominium is increasingly weary
and saturated. Owners and operators of
these properties are now increasingly
open to short stays and they are generally
a cheaper option compared to hotel
accommodation, providing tourists and
business travellers with wider options.
On top of that, the increasing supply
of upcoming hotels will exacerbate
the already stiff competition faced by
existing hotel operators in sustaining their
occupancy rates.
Figure 7: ANNUAL ADR, REVPAR & OCCUPANCY RATE (LUXURY & UPPER UPSCALE )ADR (LHS) Rev Par (LHS) Occupancy (RHS)
4647484950515253545556
2013 2014 2015 2016 2017 2018 2019
%
020406080100120140160180US$
Source: Knight Frank Research
Figure 6: International Tourist Arrivals (2008 – 2019)International Tourist Arrivals (LHS)
0
1,000
2,000
3,000
4,000
5,000
6,000
0
1,000,000
2,000,000
3,000,000
4,000,000
5,000,000
6,000,000
7,000,000
2008 2009 2010 2011 2012 2013 2014 2015 2016 2017 2018 2019
Tourist Receipts (US$ mil) (RHS)
Source: Ministry of Tourism

8
P H N O M P E N HS E R V I C E D A PA R T M E N T
S E C T O R
Key findings
Average occupancy and rental rates remained resilient in Phnom Penh’s serviced apartment sector during H2 2019 despite new condominiums and serviced apartments continuing flood the market.
Precious Serviced Apartment was
previously added to our basket with only
nine units opened for public use due to its
partial completion. Now, it has been fully
completed with an additional 36 units.
Millennial Apartment, sited in BKK
District, added 84 High-end serviced
apartment units to the existing supply.
Along with three other newly completed
locally-operated serviced apartments,
the aggregate units added to BKK District
was 221. Hence BKK District remains the
district with highest concentration of
serviced apartments with 36% of the total
market supply, followed by Chamkarmon
(18%), Daun Penh (13%), Toul Kork (12%), 7
Makara (11%), Chroy Chongva (6%), Sen Sok
(3%) and Mean Chey (1%).
Overall, the majority of the existing serviced
apartment units were located within the city
centre (90%) and the remaining (10%) were
located in the Suburban area.
An additional 1,205 serviced apartments
have been identified and will be added
Supply
An additional 516 serviced apartments
units completed and were added to
Phnom Penh’s overall supply, the
overall supply stood at 5,999 units as at
H2 2019.
The total serviced apartment stock was
recorded at 5,999 units at the end of H2
2019, equating to a 13% y-o-y increase
comparing the same period in 2018.
As at H2 2019, 516 serviced apartment
units across nine projects opened
operation, namely; Precious Serviced
Apartment, Boss Apartment, Lumiere
Residence, Ly Heng, Millennial
Apartment and four projects of locally-
operated serviced apartments (unnamed).
Of the total supply, 48% of newly
completed projects were classified
as High-end apartments (250 units),
followed by 29% Affordable apartments
(148 units) and 23% of Mid-tier
apartments (118 units).
Figure 8: Cumulative Supply of Serviced Apartments (2009 - 2020f)Existing Supply New/Added Supply
Source: Knight Frank Research
No. Units
0
1,0002,000
3,0004,000
5,000
6,0007,000
8,000
2009 2010 2011 2012 2013 2014 2015 2016 2017 2018 2019 2020f 2021f
The existing supply of serviced apartments was recorded at 5,999 units spread across 161 projects as at H2 2019.
Mid-tier serviced apartments maintained its dominant share in the market with 54% of the overall supply, followed by High-End 23% and Affordable 23%.
As the most sought-after and preferred location to stay, Boeung Keng Kang (BKK) District continues to have the highest concentration of serviced apartments; approximately 42% of the new incoming supply is located within this district.
The occupancy rate for serviced apartments remained generally flat at 73%; over the past three years, the serviced apartment occupancy has been stable ranging between 70% to 75%.
Landlords/operators of existing serviced apartments commanding healthy occupancy rates will be looking into ways of retaining their existing tenants by providing additional enticements
Lumiere Residence, Phnom Penh
P H N O M P E N H S E R V I C E D A PA R T M E N T S E C TO R

9
P H N O M P E N H S E R V I C E D A PA R T M E N T S E C TO R
to the supply over the next two years,
reflecting an increase of 20%, assuming all
identified projects complete as scheduled.
Rental
As at H2 2019, rental rates for High-
end units inched down to US$22 per
sq m whilst the remaining segments
stabilised.
Rental rates for serviced apartments in
Phnom Penh have remained resilient
despite competing with incoming
condominiums and extended stay hotels,
with only the High-end category having
inched down to US$22 per sq m from US$23
during H1 2019. Whilst the Mid-tier and
Affordable categories remained flat as in
H1 2019, recorded at US$13 per sq m and
US$7 per sq m, respectively.
The latest notable entry a within the High-
end category, Millenial Apartment, sited in
BKK district, recorded average asking rents
between US$21 to US$ 26 per sq m per month.
Occupancy
The latest occupancy rate for serviced
apartment in Phnom Penh of 73%
did not reveal any signs of market
saturation.
The significant increase of condominium
supply and also serviced apartments to the
market over the second half of 2019 led in
occupancy rate to a slght decline 73%, a
one percentage point drop from H1 2019.
This did not reveal any signs of market
saturation and indicated that demand for
serviced apartments is still stable.
Over the past three years, demand for
serviced apartments has fared relatively
well hovering between 70% to 75% despite
the significant increase in developments
for all types of residential dwellings.
Location wise, BKK and Daun Penh
Districts each commanded the highest
average occupancy rate of 78%, being
the preferred location to stay among
expatriates, followed by Toul Kork (77%),
an increasingly sought-after district to
stay, 7 Makara (73%) and Chamkarmon
(72%). Chroy Changvar and Sen Sok,
suburban districts, recorded slightly
lower occupancy rates at 68% and 61%,
respectively.
Apart from location, the market is also
price sensitive. Affordable and Mid-
tier categories enjoyed commendable
average occupancy rates of 82% and 79%,
respectively, across all districts whilst
High-end recorded an average of 57%.
Serviced Apartment Sector Outlook
Historically a well performing sector,
demand for serviced apartment is holding
firm, for now.
Although the supply of serviced
apartments and increased significantly in
2019, occupancy rates have remained
robust throughout. With demand
mainly stemming from expatriates
working in Phnom Penh, serviced
apartments may still be the preferred
choice over traditional condominiums
due to their additionoal serviced and
facilities.
However, this may shift towards a
tenanst’ market as the increasing
supply also means that tenants will be
gradually more selective due to a wider
variety of choices. In order to sustain a
healthy occupancy rate, landlords and
operators will most likely look to retain
existing long-term tenants by providing
additional benefits such as discounted
rental or additional free-of-charge
facilities or services.
Similar to any other tenanted properties,
landlords and operators of serviced
apartments will be expected to provide
increasingly competitive pricing and
flexibility on tenancy tenure. By far,
the influx of foreigners and expatriates
working in Phnom Penh has been
sustaining demand for serviced
apartments. However, if this reduces,
serviced apartment operators may be
faced with intensified competition
among completed condominiums and
other extended-stay hotels, competing
for tenants.
1,000
1,500
2,000
2,500
3,000
3,500
4,000
Q1 2017 Q2 2017 Q3 2017 Q4 2017 Q1 2018 Q2 2018 Q3 2018 Q4 2018 Q1 2019 Q2 2019 Q3 2019 Q4 2019
Figure 10: Quaterly Monthly asking rents for high-end units
Source: Knight Frank Research
1Bed 2Bed 3Bed
Figure 9: Existing Supply By District
Chamkarmon 18%Boueng Keng Kang 36%
Toul Kork 12%Sen Sok 3%
7 Makara 11%Daun Penh 13%
Chroy Changvar 6%Mean Chey 1%
Figure 16: Cumalative Supply of Land Housing Units (2009-2021f)
Source: Knight Frank Research

1 0
P H N O M P E N H C O N D O M I N I U M S E C TO R
P H N O M P E N HC O N D O M I N I U M S E C T O RKey findings
Notwithstanding the slow down of the global economy, condominium developers’ confidence remained positive with 15 new off-plan projects launched during H2 2019.
Chamkarmon is the most preferred and
popular residential area within the city
due to its close proximity to the CBD and
commercial areas, resulting in its largest
concentration of condominium projects,
representing 38% of the overall market
share. The partial completion of Star
City which contributed 800 units to Sen
Sok has raised this district to the second
highest condominium concentration with
15%, followed by 7 Makara (13%), Boeung
Keng Kang (10%), Chroy Changvar (10%)
and Toul Kork (6%). The remaining 5% are
scattered among Daun Penh, Russey Keo,
Chbar Ompov and Mean Chey.
The ratio of High-end vs Mid-tier segment
condominiums has slightly nudged up as
there were more High-end condominiums
completed from the total four new completed
projects with 63% and 37%, respectively.
The numeral split between High-end and
Mid-tier segment condominium now stood
at 12,110 units and 7,126 units, respectively.
To-date, our monitored basket does not
comprise any Affordable segment (below
US$800 per sq m).
15 new off-plan condominium projects
were launched during H2 2019, of which
nine of them are within the High-end
segment, namely Wealth Mansion (1,158
units), La Cozii TK (76 units), Huang
Shan International (670 units), Morgan
Enmaison (4,840 units), Mesong (1,270
units), One Park S-G (166 units), Garden
One (271 units), The Flora Suites (198
units) and Royal Skyland (1,476 units).
The remaining six Mid-tier projects
launched during H2 2019 were namely
Time Square III (280 units), Vue Aston
(895 units), M Residence (378 units), City
Gem (456 units), The Hexa (500 units)
and Lotus Land (180 units).
Supply and Demand
The cumulative completed
condominium developments in
Phnom Penh climbed up to 71, with the
completion of four projects.
The second half of 2019 saw the addition
of 1,704 condominium units spread over
four newly completed projects. The
total existing supply of condominiums
in Phnom Penh soared to 19,236 units, a
y-o-y increase of 124% from H2 2018.
The abovementioned four new projects
were Star City (800 units), One Park (166
units), The Penthouse Residence (458
units) and Prince Modern Plaza (280
units). Star City is within the High-
end segment comprising a total 1,600
units, out of which 800 units completed
during Q3 2019. Whilst One Park and The
Penthouse Residence, both also within
the High-end segment, were completed
during Q4 2019. The only Mid-tier
segment condominium completed was
Prince Modern Plaza.
The Penthouse Residence and Prince
Modern Plaza are both located within
the prestigious District of Chamkarmon
while One Park is within Daun Penh and
Star City within Sen Sok.
Figure 11: Sales of Newly LaunchedCondominium units by Quarters
Unites SoldAverage Price USD per sq m
0Q1 Q2 Q3 Q4 Q1 Q2 Q3 Q4 Q1 Q2 Q3 Q4
500
1,000
1,500
2,000
2,500
3,000
01,0002,0003,0004,0005,0006,0007,0008,0009,00010,000
20172017
20172017
20182018
20182018
20192019
20192019
Unites Launched
Source: Knight Frank Research
As at H2 2019, existing supply of condominiums in Phnom Penh stood at 19,236 units, up by 10% as compared to H1 2019, following the completion of 4 new developments.
Sales rate for new off-plan launches during H2 2019 declined to 7% as condominium sector activity remained lackluster – demand from Chinese investors/buyers was adversely impacted from the weakening of Yuan currency as the US-China trade war continues.
Chamkarmon remained top of the list with highest concentration of condominiums representing 38% of overall condominium stock in Phnom Penh.
Condominium developers continued resiliently with 15 new off-plan launches, out of which 79% are High-end units.
Majority of the new off-plan launches identified during the second half of 2019 were focused in outer city districts, mainly Toul Kork and Chroy Changvar.
With the increasing supply entering the market, condominium rents and occupancy rates are expected to face downward pressure as it also competes with existing serviced apartments in the city.
The Penthouse Residence, Phnom Penh

1 1
P H N O M P E N H C O N D O M I N I U M S E C TO R
Taking these new launches into account,
over the next three years, upcoming
completed condominiums will continue
flooding the market with a projected
growth of 259% to 69,036 units assuming
that all the launched projects and those in
the pipeline are completed as scheduled.
Scarcity of lands is driving up land price,
thus pushing developers to begin shifting
their projects outwards. The future
geographic distribution of condominium
concentration three years from now will
shift to Chamkarmon, Chroy Changvar,
Sen Sok, Mean Chey and Toul Kork.
Expectedly, sales rate of High-end
condominium launches during H2 2019
halved to 7% as compared to the sales
rate during H1 2019 which was monitored
at 15%. The devaluation of Yuan currency
and the on-going US-China trade war
adversely impacted demand for High-end
condominiums from Chinese investors/
buyers, whom previously made-up the
large majority of buyers for this segment.
Prices and Rental
The average selling price of existing
condominiums and new launches
during H2 2019 saw a slight
appreciation
Although the average selling prices of
both the Mid-tier and High-end segments
does not differ significantly since H1 2019,
a slight appreciation was noted toward
the end of 2019 due to the increased
number of new off-plan launches for
High-end condominiums and launches
in prime residential locations.
Generally, the average selling price for
the Mid-tier condominium segment
hovered between US$1,250 to US$1,800
per sq m over the net saleable area whilst
the High-end condominium segment
was between US$2,000 to US$4,000 per
sq m over the net saleable area.
A notable Mid-tier condominium launch
was Time Square III, located in Toul
Kork District, an increasingly popular
residential district. Offering 230 units
of Mid-tier condominiums, this project
achieved a sales rate of approximately
80% during the first quarter of launching.
Another notable launch was The Royal
Skyland Condominium, a 47-storey High-
end condominium. This condominium
is sited in Toul Tompong, Chamkarmon
District and comprises 1,476 units
ranging from one to five bedrooms.
Selling price starts from US$1,850 per sq
m over the net saleable area.
Additionally, two skyscraper
condominiums were launched in the
core of the city centre namely, Mesong
by Wonder Development and Huangshan
International by Huibang International
Real Estate Co. Ltd. Priced towards the
High-end segment, Mesong will extend
to 71 storeys with an average selling
price is US$4,000 per sq m over the
net saleable area whilst Huangshan
International will extend to 47 storeys
with an average selling price of US$2,500
per sq m over the net saleable area.
Meanwhile in Chroy Changvar, Wealth
Mansion and Morgan Enmaison are
both High-end segment condominiums.
The latter is a large-scaled project. Both
were priced similarly ranging between
US$2,000 to US$2,200 per sq m over the
net saleable area.
Condominium Sector Outlook
Developers remained optimistic over
the future of the condominium market
with the apparent growth of domestic
demand
Although 2019 ended on a slower note
for the condominium sector and also
the global economy in general, the
continuous optimistic launches showed
that developers remained confident with
the condominium sector.
Condominium sector is very price
sensitive as the idea of condominium
living only cushions in specifically
among the domestic market due to the
rapid increase of landed house pricing.
Therefore, the Mid-tier segment will be
more sought-after.
Understanding condominium buyers
appetite in consonance with product
positioning and offering is vital for a
developer. The continuous provision and
launches of High-end condominiums
priced above average and beyond
affordability parameters will mostly
likely register poorer sales rate as it will
be largely dependent on foreign buyers.
Attempts to improve sales rate would
involve price correction for their new
launch if such developers want to compete
with other completed projects with unsold
inventories or overhang units.
Moving forward, condominium pricing is
expected to remain flattish over the short
to medium term, as supply continues
streaming in. Newer marketing strategies
will be expected to entice condominium
buyers as they will be increasingly
selective with wider varieties. Apart
from location, other main appeal for
condominium buyers are competitive
pricing, lower downpayment, interest
free loans and longer repayment periods.
Figure 13: Cumulative Supply of Condominiumunits (2009-Post2023)
Existing Incoming Supply
-
10,000
20,000
30,000
40,000
50,000
60,000
70,000
80,000
2019
2010
2011
2012
2013
2014
2015
2016
2017
2018
2019
2020
f
2021
f
2022
f
2023
f
Post20
23f
Source: Knight Frank Research
Figure 12: Quarterly Sales of Monitored andAvailable condominium units (Q12016-Q42019)
Q1 2016
Q2 2016
Q3 2016
Q4 2016
Q1 2017
Q2 2017
Q3 2017
Q4 2017
Q1 2018
Q2 2018
Q3 2018
Q4 2018
Q1 2019
Q2 2019
Q3 2019
Q4 2019 0%
5%
10%
15%
20%
25%
-
5,000
10,000
15,000
20,000
25,000
30,000
Units Available andMonitored (LHS)
Unites Sold(LHS)
Sales Rate (RHS)
Source: Knight Frank Research

1 2
P H N O M P E N H L A N D E D H O U S I N G S E C TO R
P H N O M P E N HL A N D E D H O U S I N G
S E C T O R
Key findings
The landed housing sector continues growing exponentially with 34 new off-plan projects launched during 2019; real estate developers are increasingly tapping into the landed housing sector due to attractive returns and commendable sales rate.
From our monitored projects,
approximately 52% of the landed housing
supply are flat houses whilst link houses
comprise 14% followed by twin villas with
13%, shop houses with 11% and villas with
11%. Generally, flat houses remained the
more popular and sought-after type of
landed house, commanding a higher sales
rate as compared to the other types.
By 2022, Phnom Penh’s cumulative
landed housing supply will increase
to 76,405 units if all our monitored
developments are completed as
scheduled, an increase of 20,473 units.
Within the continued future supply of
20,473 units across all districts, 64% are
categorised as Mid-tier developments
whilst the remaining is divided between
Affordable (28%) and High-end (8%).
Suburban continues to be the major areas
earmarked for landed housing with 98%
of future upcoming supply whilst the
remaining 2% will be in the city centre.
As one of the fast developing countries
in the Association of Southeast Asian
Nations (ASEAN), Cambodia is under-
going major transformation. Developers
continuously seek to provide more
landed residential housing to keep pace
with the growing demand stemming from
the population increase in Phnom Penh.
The second half of 2019 saw 16 new
off-plan projects launched in both
suburban and city centre, adding a total
future incoming supply of 2,675 units
to our monitored developments. 10
Supply and Demand
The second half of 2019 observed a
rapid increase in landed housing (gated
and guarded community); total existing
supply soared to 55,932 units.
TThe cumulative supply for landed
housing was recorded at 55,932 units,
spread across 142 developments in the
city, as at H2 2019, reflecting a y-o-y
increase of 21% from the same period
of 2018.
Out of the existing 55,932 units, only
2,012 units (4%) are located in the city
centre whilst the remaining 53,920 units
(96%) are located in the suburban areas of
Phnom Penh, which is largely due to the
higher land cost in prime areas of the city.
Location wise, Sen Sok District continued
to constitute the bulk of existing landed
housing supply with 26% of the overall
supply, followed by Dangkor and
Kamboul (12% each) and Russey Keo
(11%). The rest are distributed among
Mean Chey (10%), Chbar Ampov (9%),
Por SenChey (7%), Chroy Changvar (6%),
Prek Pnov (3%), Chamkarmon (2%), Daun
Penh (1%), and Toul Kork (1%). Boeung
Keng Kang and 7 Makara only accumulate
1% of the total existing supply.
By segment, Mid-tier landed housing
accounts for 28,744 units (51%), followed
by High-end with 6,033 units (11%) and
the remaining Affordable segment with
21,155 units (38%).
Figure 14: Future Supply by Year and ClassificationHigh-End Mid-Tier Affordable
0
1,000
2,000
3,000
4,000
5,000
6,000
7,000
8,000
2020f 2021f 2022f
Source: Knight Frank Research
Figure 15: Distribution of ExistingLanded Housing Supply by District
Chamkarmon 2%Daun Penh 1%
Russey Keo 11%Sen Sok 26%
Prek Pnov 3%
Por Senchey 7%Mean Chey 10%
Kamboul 12%Dangkor 12%
Toul Kork 1%
Source: Knight Frank Research
Chroy Changvar 6%Chbar Ampov 9%
11 new boreys were completed during the second half of 2019 contributing an additional 4,654 units to the existing stock.
Cumulative existing supply of landed housing rose to 55,932 units, spread across 142 borey developments.
By 2022, Knight Frank estimated the total cumulative supply of landed housing to be 76,405 units; an additional 20,473 from the existing stock; reflecting an increase of 37%.
16 new off-plan launches were identified during H2 2019, with the average selling prices ranging between US$759 to US$1,070 psm.
Average sales rate of new launches during 2019 declined by two percentage points to 41% from 2018.
1 3
P H N O M P E N H L A N D E D H O U S I N G S E C TO R
developments were launched during Q3
2019 whilst the balance 6 developments
launched during Q4 2019.
Projects launched during Q3 2019 were
Golden Avenue (300 units), Borey Willian
(165 units), KMH Park (40 units), Borey
Angkor Oudom (135 units), The Varina
– The Styles Sen Sok (313 units), Borey
Ratanak 5 (136 units), Borey Chue Pom
(228 units), Borey Rith (305 units), Borey
Romchek Toul Pongro (360 units) and
Borey LJ 137K (85 units).
Whilst projects launched during Q4
2019 were Lotus Property (60 units), PH
Platinum Eco Melody (289 units), PH
Platinum Eco Delta (646 units), Borey
Kim Soing The Laken (355 units), Borey
Golden Park (170 units) and last but not
least, Royal Skyland (23 units).
The overall sales rates of 2019 new off-
plan launches was recorded at 41%. The
first half of 2019 saw a more robust sales
rate of 44%, which decelerated toward
the second half of 2019 to 34%.
Borey Rattanak 5, Borey LJ 137K, Borey
Chue Pom and Golden Avenue, all of
which were launched during Q3 2019,
achieved sales rate ranging between
40% to 50% which is commendable as
landed housing sales rate tends to be slow
and steady increase. Golden Avenue,
developed by Mekong Royal, is located
in a rapidly changing Prek Pnov District.
This optimistic sales rate however,
declined toward the end of 2019 with only
Lotus Property in Russey Keo and Borey
Kim Soing The Laken in Chbar Ampov
achieving sales rates of 45% and 41%,
respectively.
Prices and Rental
Average selling price saw a considerable
leap from 2018 to 2019, moving from
US$683 to US$914 per sq m (34%
increase).
The average price of the new launches
during H2 2019 was recorded at US$840 per
sq m. The only High-end project monitored
during H2 2019 was Royal Skyland with
an average selling price of US$3,500
per sq m. Whilst the remaining Mid-tier
launches recorded selling price ranging
from US$800 to US$1,200 per sq m (over 11
projects) and Affordable recorded selling
price ranging from US$532 to US$660 per
sq m (over 4 projects).
Overall selling price saw a y-o-y increase
of 34% from 2018 to 2019 with the average
selling price in 2019 recorded at US$914
per sq m.
Landed Housing Sector Outlook
The landed housing sector is mostly
driven by domestic purchasers due to
restrictions imposed on foreigners owning
landed properties in Cambodia. As the
population of millennials in Phnom Penh
is increasingly moving into the work force,
demand for landed housing is increasing,
due to preference towards landed
properties as is in any other cities.
On top of the commendable sales rate,
the saturating condominium and retail
sectors are prompting more developers
to tap into the landed housing market,
including developers with track records
of condominiums.
Location wise, suburban districts will
still be the preferred locations as they’re
more viable to provide Affordable and
Mid-tier housings, at the same time
sustain a commendable sales rate whilst
maintaining their profit margin. City
centre locations are only suited for high-
rise developments due to the explicitly
high land cost. Along with affordable
pricing, developers now also look into
providing a lower down payment and
longer repayment schemes to attract
young families seeking their first home.
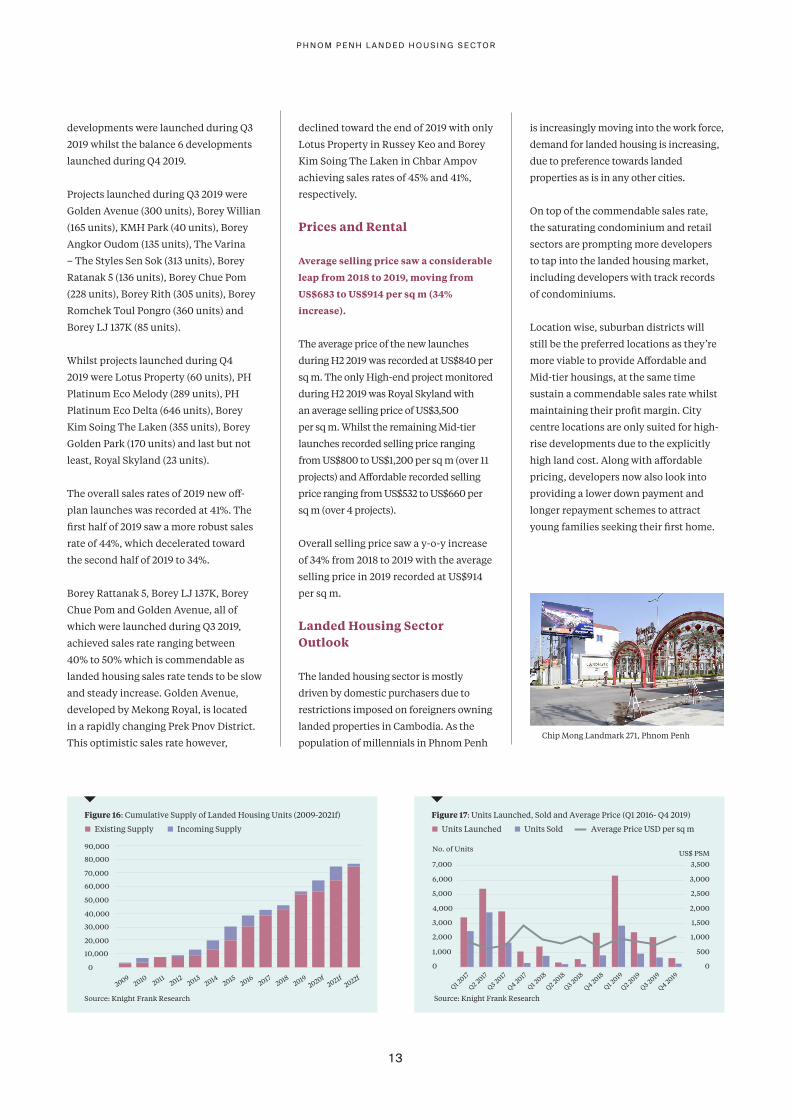
Figure 17: Units Launched, Sold and Average Price (Q1 2016- Q4 2019)
Units Launched Units Sold Average Price USD per sq m
Source: Knight Frank Research
0
500
1,000
1,500
2,000
2,500
3,000
3,500
0
1,000
2,000
3,000
4,000
5,000
6,000
7,000
Q1 2017
Q2 2017
Q3 2017
Q4 2017
Q1 2018
Q2 2018
Q3 2018
Q4 2018
Q1 2019
Q2 2019
Q3 2019
Q4 2019
US$ PSMNo. of Units
Figure 16: Cumulative Supply of Landed Housing Units (2009-2021f)
Existing Supply Incoming Supply
Source: Knight Frank Research
0
10,000
20,000
30,000
40,000
50,000
60,000
70,000
80,000
90,000
20092010
20112012
20132014
20152016
20172018
20192020f
2021f2022f
Chip Mong Landmark 271, Phnom Penh

1 4
S I E M R E A P H 2 2 0 1 9 R E V I E W
economic diversification is much needed
in the province. The lack of commercial
and residential developments piqued
interest among local developers.
A few notable residential projects launched
during 2019 include Angkor Grace, Vnom
Empire and Bakong Village.
Bakong Village, is a mixed use
development comprising shophouses and
three-storey walk-up apartments. The
height restriction of a maximum of four
storeys imposed for developments within
the Apsara Zone is hindering developers
eyeing to provide high-rise condominiums
and apartments.
Another condominium, Sky Park Condo,
launched during H2 2019, comprises 40
units of one, two and three bedrooms
aimed to entice investors with guaranteed
rental returns.
The sustainability of the tourism sector
in Siem Reap will rely heavily on the
government infrastructure improvement;
three outer ring roads which will improve
accessibility in and around the town,
along with the new international airport
project are in the pipeline or already under
construction.
Although the latest 2019 statistical report
from the Ministry of Tourism recorded
an overall tourist arrival increase to
Cambodia, Siem Reap International
Airport recorded a drop of 15% due to a
major shift of tourist destinations to the
coastal province of Sihanoukville. The
shift was evidenced by a remarkable
surge of tourist arrivals in Sihanoukville
International Airport by 158% for both
domestic and international arrivals and
186% for international arrival only.
During 2017, the amount of tourist arrivals
and visitors to Angkor Archaeological Park
surged, subsequently leading to admission
fees to the park increasing during 1Q 2017.
The same year saw a revenue increase
of 72%. However this was short-lived as
the growth rate of tourist arrivals and
visitors the following year moderated,
followed by a negative growth rate in 2019.
As a result of Siem Reap’s tourist arrival
deterioration, admission fee sales for
Angkor Archaelogical Park followed suit
and declined by 15% to US$99m in 2019,
compared to US$116m during 2018.
The latest population count in Siem Reap
based on the General Population Census
2019 was recorded at 1,006,512; equating
to a CAGR of 1.1% between 2008 and 2019.
With the tourism sector slowing down,
Overview
The hospitality and tourism industry
remains the main driver for this province
which houses the country’s main tourist
attraction. However, this industry
correlates strongly with the stability of the
geopolitical landscape and global economy.
Since 2010, Siem Reap International
Airport consistently recorded a year
on year growth of tourist arrivals (both
domestic and international) leading to a
flurry of business and investment activities
in the province.
However, the resilient growth of tourist
arrival abruptly cut short during 2019
recording a 12% decrease, concurrently
slowing down the pace of business and
investment activities. International
tourist arrival growth to Siem Reap
International Airport itself dropped by 15%
in comparison to year 2018.
Travellers from China generally made-up
the large majority of tourist in the entire
of South-East Asia destinations and Siem
Reap was no exception. Historical statistics
showed that Chinese tourists accounted for
up to 45% of the total international tourists
in Siem Reap during 2018.
Figure 19: Number of International Tourists to Angkor Wat and Total Revenue (2010-2019)
Total Intl. Visitors Total Revenue
Source: Angkor Enterprise
0
500,000
1,000,000
1,500,000
2,000,000
2,500,000
3,000,000
0
20,000,000
40,000,000
60,000,000
80,000,000
100,000,000
120,000,000
140,000,000
20102011
20122013
20142015
20162017
20182019
No. of TouristsUS$
Figure 18: Number of Passengers and Aircraft Movement Through Siem Reap Airport (2008 to 2019)
Total Passengers Total Aircraft Movement
Source: Cambodia Airport
05,00010,00015,00020,00025,00030,00035,00040,00045,00050,000
0500,000
1,000,0001,500,0002,000,0002,500,0003,000,0003,500,0004,000,0004,500,0005,000,000
2008 2009 2010 2011 2012 2013 2014 2015 2016 2017 2018 2019
S I E M R E A P H 2 2 0 1 9 R E V I E W

1 5
S I E M R E A P H 2 2 0 1 9 R E V I E W
H O T E L S E C T O R
As at H2 2019, the total supply of existing
hotel room were recorded at 12,148 rooms
across 88 hotels, reflecting a 3% Y-o-Y increase
compared with the same period last year.
The Upscale & Upper Midscale (4-Star) stock
remains the major offering in Siem Reap
with 64% of the overall supply, followed by
Luxury & Upper Upscale (5-Star) (23%) and
Midscale & Economy (3-Star) (13%).
Approximately, twelve (12) hotel projects
with a room inventory below 50 keys
were opened during H2 2019, with room
inventories ranging from 12 to 48 keys.
Mane Family Vacation, managed by Mane
Boutique Hotel & Spa, opened its doors
during the second half of 2019.
Boosting a number of other boutique hotels
under its management across Siem Reap and
Phnom Penh, this latest addition comprises
48 keys of a variety of room collections.
Other newly opened hotels included Angkor
Aurora, Araya Angkor Residence, GZ Premier
Luxury Residence and etc.
Since the entrance of international hotel
chain, ibis Styles in 2019, other international
hotel chains are expected to make an entry
into the market, including Angsana Siem
Reap, managed by Banyan Tree. This hotel
will add 158 keys in the future pipeline.
Post 2021, an estimated 740 keys (only
considering projects with 50 keys and
above) will be entering the hotel supply
pushing the total supply up to 12,888
keys. The majority of upcoming hotel
rooms are categorised as Luxury & Upper
Upscale (5-Star) followed by Upscale &
Upper Midscale (4-Star).
Figure 20: Cumulative Supply of Hotel Rooms (2005 - Post 2021f)
Cumulative Supply
Source: Ministry of Tourism / Knight Frank Research
New Supply
02,0004,0006,0008,000
10,00012,00014,000
20052006
20072008
20092010
20112012
20132014
20152016
20172018
20192020f
2021f
Post 2022
No. RoomsLuxury & Upper Upscale 23%
Upscale & Upper Midscale 64%
Midscale & Economy 14%
Figure 21:Distribution of Hotels by Classification
Source: Knight Frank Research
Since 2009, Siem Reap’s tourism industry has
been flourishing year on year, maintaining
its upward growth trajectory, except for year
2015. CAGR growth of international tourist
arrivals was recorded at 9% per annum
between 2008 and 2018. Despite the increase
in commercial developments during 2018,
2019 was somewhat more toned down.
International tourist arrival growth dipped
15% whilst the growth for both domestic and
international tourist arrivals declined 12%,
leading to a decline in admission fee sales to
Angkor Archaeological Park by 15%.
No new hotels or developments with a
room inventory above 50 keys were noted
during H2 2019. However, we identified
three additional hotel projects with 50 keys
and above to include in the existing stock
as at H2 2019 including; Kulen Resort (66
keys), Memoire Palace Resort (64 keys) and
Hotel De la Renaisance (170 keys).
Outlook: Housing one of the world’s leading tourist attractions, Angkor Archaeological Park, Siem Reap’s hospitality sector stands to benefit
largely as it remains in most travellers’ “must-visit” list. However, repeated visitation is uncommon by the same traveller due to its limited
offering of tourist attractions, apart from the Angkor Archaeological Park. The tourism industry in Siem Reap can only be sustained with
additional establishments and developments of tourism offerings such as shopping malls, theme parks and iconic buildings to entice
repeat visitations and compete with its regional neighbours.
The entry of Courtyard by Marriott and IHG and the recently opened ibis Styles, piqued additional interest of more renown hotel
chains, the upcoming Angsana Siem Reap by Banyan Tree. However, with the declining tourist arrivals, coupled with the excess in
accommodation offerings and saturated hotel market, operators will be faced with increased pressure on profitablity as they attempt to
remain competitive by lowering room rates to increase occupancy rates.

1 6
R E T A I L S E C T O R
food & beverage segment, which is the
main crowd-puller for most malls. Still in
its infancy stage, the reduced international
tourist arrivals and consumers being
held back by lack of income and eroded
purchasing power due to rising cost of living
contributed to the brakes on consumer
spending. Once a busy mall when it first
opened, it is now evidently recording lowere
volume foot traffic. Notwithstanding, with
a total net lettable area of 11,989 sq m, this
standalone shopping centre managed
to secure a healthy occupancy rate of
approximately 80%.
Other smaller-scaled malls located in the
town which are also tourist offerings are
T-Galleria by DFS, CDF Angkor Duty Free
Store, Lucky Mall, Angkor Trade Centre,
King Road Angkor, etc. Lucky Mall and
Angkor Trade Centre are both the pioneer
of Siem Reap shopping malls since 2008.
However, both malls were small-scale
projects; comprising net lettable areas
of approximately 2,500 to 2,900 sq m,
respectively.
International tourist arrivals typically
has a direct correlation and effect on the
retail sector, as tourists typically make-up
the largest footfalls in most major cities.
During 2019 when the growth rate of
international tourist arrivals declined, the
reduced foot traffic around Siem Reap’s
retailers was apparent.
Thai-based cash & carry wholesale retailer,
Makro, which opened early 2019, targets
small businesses, vendors, hotels and
restaurants as their main source alongside
with the local populace. Lately, with the
reduced tourist arrivals, which are the
main driver for Siem Reap, created a
less optimistic consumer and business
sentiment. As a result, foot traffic and
business was affected in Makro, with small
businesses, vendors, hotels and restaurants
taking in less supplies. On top of that, the
majority of the local populace is still more
inclined to patronise retails in traditional
formats such as shophouses and markets.
Heritage Walk, on the other hand, faired
better, as it is more centrally-located and
most of its retailers are skewed toward the
With the increase in higher value tourists,
the retail landscape in Siem Reap is slowly
evolving and transforming to include
modern retail formats. Currently still
dominated by traditional shophouses
and markets as the main retail offering,
the town is starting to witness a growing
number of shopping malls, supermarkets,
convenient stores and cash & carry
wholesale retailers.
However, in contrast to Phnom Penh or
Sihanoukville Province, the rate of retail
development and advancement is at a much
slower pace. As at H2 2019, there were no
new completion of purpose-built shopping
mall in Siem Reap. The cumulative retail
space stood at 49,914 sq m of net lettable
area as at the second half of 2019.
Makro, the cash & carry wholesale retailer,
and The Heritage Walk, a shopping centre,
retained their latest entrance of modern
retail format, both opened between late
2018 and early 2019, offering a different
retail format.
Food & Beverage 42%Health & Beauty 3%Lifestyle 4%Books, Stationery & Toys 2%Entertainment 30%Fashion 6%Supermarket 8%Telecommunication 1%Services 4%
Figure 23:Tennat Mix Within Heritage Walk
Source: Knight Frank Research
Figure 22: Cumulative Supply of Retail Space in Siem Reap
Cumulative Supply
Source: Knight Frank Research
Newly Completed
010,00020,00030,0004,00050,00060,00070,00080,000
2010 2011 2012 2013 2014 2015 2016 2017 2018 2019 2020f
Sqm
Outlook: As part of the transformation of traditional retail outlets to modern formats, it is expected that additional new malls will be introduced.
Kulen Central Mall, a retail development comprising 20,580 sq m of NLA together with The Century Road and the Colossus has been
added to our basket of future supply. Disparity in performance between newer, better planned malls with older malls is anticipated to be
increasingly obvious in the future. Competition is also expected to intensify once the new complexes come online.
To-date, the retail sector remains subdued in Siem Reap. The rapid advancement of e-commerce will only challenge traditional shopping
further as the millennial generation is inclined to online shopping and e-payment, further exacerbating physical retailers’ profitability.
Optimism in the retail sector is premised on a recovery of the tourism industry with a bleaker outlook anticipated should the tourist arrival
continues decreasing.
S I E M R E A P H 2 2 0 1 9 R E V I E W

1 7
R E S I D E N T I A L S E C T O R
Les Bijoux D’Angkor Apartment which
was initially announced in 2016, has
been placed on hold until today despite it
being in a sought-after location.
The tourism sector has been driving up
commercial values around Siem Reap’s
prime location and it is no longer feasible
for developers to provide landed housing
within prime locations at affordable
prices, thus most borey developments
were launched outside the town centre,
the most recent being Bakong Village.
Sited in Prasat Bakong District, the
Phnom Penh based developer, Urban
Living Solution, proposed 245 units of
three-storey walk-up apartments along
with 105 units of shophouses.
Other on-going projects in Siem Reap
include The Premier Angkor Palace,
Angkor Grace, Vnom Empire, Borey
Ear Heng 3, Sky Park. Borey Nagara and
Borey VK Angkor. Upon completion of all
the projects as scheduled, the Siem Reap
residential sector will be more diversed.
Majority of land in Siem Reap’s town
locality is restricted by a maximum
height limit as they are located in the
Apsara Zone. To-date, there are no
proposed or announced purpose-built
condominium projects.
Tapping on the success of their initial
project, Goldia Park, comprising two
rows of terraced houses which was
anecdotally sold out to holiday home
purchasers by city workers in Phnom
Penh, the same developer launched the
first low-rise condominium, Sky Park,
with units varying from one bedroom
to three bedrooms during H2 2019.
Comprising a total 40 condominiums, the
condominium is sited opposite Goldia
Park, within Svay Dangkum District,
extending to a land area of 5,600 sq m.
Pricing for Sky Park range from US$67,000
to US$145,000 per unit with size ranging
between 55 sq m to 121.7 sq m of NSA.
This five-storey building is scheduled
to complete over the next two years. To
proliferate additional enticement the
developer is offering a guaranteed rental
return (GRR) of 12% per annum and also
providing loan options to 15 years.
Siem Reap is the most well known tourist
hub of Cambodia, attracting visitors
globally to its archaeological park. Since
2018, the flurry of investment activities
were apparent in Cambodia since the entry
of Chinese companies in Sihanoukville
Province. Siem Reap is of no exception as it
gradually begin to attract local investments.
Although sluggish, progression in Siem
Reap’s residential sector is gradually
increasing. Recent notable launches
include Sky Park (condominium) and
Bakong Village (landed housing).
Existing modern housing developments
in Siem Reap include Borey Tourism City
(the largest borey development in Siem
Reap), Borey Angkor Palace, Borey Prem
Prey, Borey Seang Nam and Borey Ear Heng.
The Siem Reap residential sector (landed
housing) is dominated by owner-occupiers.
Demand from foriegn purchasers remains
limited as residential investment in Siem
Reap is yet to boom.
Due to very limited demand, price
sensitivity remains high in Siem Reap.
Outlook: Landed housing will continue spearheading Siem Reap’s residential sector, due to a strict height restriction (Apsara Zone) in Siem Reap.
The proposed land use map publicised during 2018, outlining proposed land use up to year 2035, showed that the majority of land is zoned
for residential, specifically the southern portion of National Road 6, which remains viable to develop residential projects as land pricing in
this region remains affordable.
Still off the radar of foreign investors, the residential sector remains driven by owner-occupiers by the local populace, although the
new launches managed to attract investors from city dwellers of Phnom Penh. Infrastructure improvements of the new Siem Reap
International Airport (50 kilometres due east of the city) and proposed ring roads will hopefully assist to increase traffic volume and
business sentiment around the town.
Architect Rendering Master Plan of Land Used Map in Siem Reap Issued 2018, MLMUPC
Sky Park Project Yellow- Residential Zone
S I E M R E A P H 2 2 0 1 9 R E V I E W

1 8
S I H A N O U K V I L L E H 2 2 0 1 9 R E V I E W
Sihanoukville International Airport (Kong
Keng International Airport) is one of the
country’s three main airports. With the
increase in international flights, mainly
to China, passenger movements achieved
a record growth of 158%, with 1.68 mil
passengers movements during 2019.
Subsequent to the online gambling ban
there has been a noticeable decline of
tourists in Sihanoukville and the once busy
streets have suffered a significant reduction
of footfall, impacting on tourism-centric
businesses. The situation is exacerbated
by the on-going road construction
improvements across the entire city adding
to business owners’ struggles. However,
upon completion of the road restorations,
accessibility in and around Sihanoukville
will be greatly improved.
Externally, the on-going US-China trade
war has devalued the Yuan currency,
leading to a dampened investment
activity across the province, more
so on an individual level. Corporate
investments continue to rise cautiously
as businesses operating in other
industries and sectors continue to seek
opportunities supported by major on-
going infrastructure projects, i.e. the
Phnom Penh-Sihanoukville Expressway
which will greatly improve connectivity.
Statistically, total approved projects across
Cambodia during 2019 was recorded
at 436, out of which 203 projects were
focused in Sihanoukville. Construction
approvals in Sihanoukville peaked during
2018 with 297 projects.
Overall, the online gambling ban may have
had a short term negative impact on the local
economy and across a number of real estate
sectors, however, it is anticipated that this
will strengthen the long term fundamentals
and sustainability of the province.
The scarcity of apartment buildings,
hotels and casinos enticed many local
landowners to leverage their lands with
banks and financial institutions to build
and provide accommodation to meet the
demand in the market. In turn, many
Chinese businesses which are not able to
own land in Cambodia due to restrictions
on foreign ownership, entered into
agreements with these landowners to
rent the properties en-bloc (the whole
building) to run their operation.
However, the announcement of the
online gambling ban, which purportedly
was the main operation of these
businesses, left many landowners over
leveraged as these businessmen left
abruptly, effectively terminating any
executed leases and forfeiting deposits.
The fear of not being able to secure other
tenants to takeover the leases led to many
landlords mothballing their on-going
construction projects.
As at the end of H2 2019, many on-going
projects were being offered for rent on
an en-bloc basis at quoting prices up to
50 percent lower than rent being quoted
during H1 2019
Overview
Since 2015, Chinese investors have
established a permanent presence
in Sihanoukville, transforming the
underdeveloped coastal town into a
fledgling city with the development of
commercial (retail and office), residential
(condominiums and boreys), industrial
hubs, hotels and casinos.
Online gambling was a key driver of
development underpinning demand
across several real estate sectors. However,
the Government of Cambodia placed
a moratorium on license renewals and
announced an outright ban from continuity
of operation by the end of 2019, leaving
a sharp increase of departures for many
Chinese nationals returning to China.
Prior to this, land prices had skyrocketed
due to competition between developers,
which greatly benefited landowners, whilst
the lack of apartments and condominiums
pushed rentals in beachfront locations to
be on par with Phnom Penh. However, the
exodus of Chinese nationals due to the
online gambling ban impacted the entire
Sihanoukville economy and affected all
stakeholders in the province.
Figure 24: Number of Passengers and Aircraft Movement Through Sihanoukville Airport (2012 to 2019)
Total Passengers Total Aircraft Movement
Source: Cambodia Airport
0
5,000
10,000
15,000
20,000
0
500,000
10,00,000
15,00,000
20,00,000
2012 2013 2014 2015 2016 2017 2018 2019
S I H A N O U K V I L L E H 2 2 0 1 9 R E V I E W

1 9
S I H A N O U K V I L L E H 2 2 0 1 9 R E V I E W
R E S I D E N T I A L S E C T O RBlue Sky Tower comprises 182 condominiums, sited in Sangkat Pir, which is located inland. Launched during the second half of 2016, this project contributed 182 condominiums to the Mid-tier category, with commercial lots on the ground floor.
The completion of Blue Bay shifted the concentration of existing condominium projects, placing Sangkat Bei with the most distribution, representing 87% of the total existing supply, followed by Sangkat Pir with 13%. Sangkat Pir has its own advantages and is also sought-after as this is a commercialised location which is highly populated with various business activities.
Over the next three years, Sangkat Bei will sretain its position with the most condominium distribution, representing 65% of the overall supply, followed by Sangkat Boun (33%) and the remaining within Sangkat Pir (2%).
Despite the departure of many Chinese workers and expatriates in Sihanoukville stemming from the online gambling ban, developers continued with project launches; nine off-plan condominium projects were launched during the second
half of 2019 with a majority of the new launches being large-scale projects providing between 1,500 to 2,500 units.However, average selling price for newly launches recorded a decline of 20% to US$1,968 per sq m of the NSA.
Post 2022, assuming all identified projects are completed as scheduled, the total supply of condominiums will swell to 31,131 units, which is 15 fold from the existing supply.
As a coastal city, high-rise residential condominiums remains a preferred option among investors and holiday home purchasers. New off-plan landed housing projects were quite minimal, with only two projects namely Borey VIP (4,000 units) and Lashen The Lord Garden (315 units). The high land pricing has made it not feasible to provide landed housing within the city centre, thus both these projects are located at the city fringe.
By segment, the majority of the launched and on-going condominiums are categorised as High-end with 61% of the overall supply and the remaining 39% are within the Mid-tier category. To-date there have been no launched or completed affordable condominiums in the market.
Figure 25: Average Launch Price in Sihanoukville (2015- H2 2019)
Source: Knight Frank Research
0
500
1,000
1,500
2,000
2,500
3,000US$
2015 2016 H1 2017 H2 2017 H1 2018 H2 2018 H1 2019 H2 2019
Figure 26: Sihanoukville Condominium Cumulative Supply (2018-Post 2022f)
Cumulative Supply
Source: Knight Frank Research
Newly Completed
0
5,000
10,00015,000
20,000
15,00030,000
25,000
2018 2019 2020f 2021f 2022f Post 2022f
No. Units
Capitalising on its advantageous coastal location, the residential sector has been one of the most active sectors, specifically condominiums, attracting mostly foreign purchasers. The growing demand prompted developers to launch a slew of new high-rise projects, particularly in the city centre and sea front locations whilst landed housing moved outwards to city fringe locations to cater to domestic demand due to exorbitant land prices.
By the end of 2019, the number of existing condominium supply stood at 2,159 units, spread across 6 projects namely Civik Apartment 1, Civik Apartment 2, Classic Condo, Sunshine Bay, Blue Bay and Blue Sky Tower.
Blue Bay and Blue Sky Tower were the latest entries to the existing supply, which contributed an aggregate 1,622 units to the existing pipeline, with Blue Bay being the provinces first large-scale project, itself alone contributing 1,440 units. Fronting onto Independence Beach, this project was classified as High-end; launch prices ranged between US$3,200 to US$4,000 per sq m of NSA.
Outlook: The year ended unfavorably for landlords providing long- term accommodation to Chinese expatriates and workers, which will no doubt
have a negative impact on the condominium sector. With the ban on online gambling and the repatriation of many Chinese expatriates
and workers in this industry, owners of existing and ongoing condominiums will be faced with increased competition to secure tenants
and buyers for their units, and will be required to increase flexibility in terms of pricing and lease terms.
Although to-date there is no evidence of a glut, the high impending supply (15 fold) of completions over the next three years may lead to a
state of consolidation due to an excess in supply.

2 0
H O T E L S E C T O R
Midscale & Economy (3-Star) dominated
the market share with 45% of the overall
hotel supply (3,220 keys), followed by
Upscale & Upper Midscale (4-Star) with
43% (3,104 keys) and Luxury & Upper
Upscale (5-Star) with 12% (896 keys).
An additional 6,749 keys have been
identified and will be added to the supply
over the next three years, reflecting a 93%
increase from 2019, assuming all identified
project complete as schedule. 50% of
the future supply are Upscale & Upper
Midscale (4-Star), 37% are Luxury & Upper
Upscale (5-Star) whilst the remaining 13%
are Midscale & Economy (3-Star).
By location, Sangkat Bei has the highest
concentration of existing hotels with 46%
of the overall supply, followed by Sangkat
Boun (45%) and the remaining 9% are
distributed across Sangkat Pir, Sangkat
Mouy, Koh Rong and Ream.
in the hospitality sector. There was a
significant increase of hotels during the past
three years to cater to growing demand.
As at H2 2019, our basket of monitored
hotels (hotels with with 50 keys and above)
was recorded at 65 providing 7,220 keys,
reflecting a 38% Y-o-Y increase compared
with H1 2019.
Many of the latest additions are operated by
hotel chains originating from China, which
expanded into Sihanoukville to cater to the
growth in Chinese tourists. These included
Zhong Hua Wei International Hotel
comprising a casino on its lower floors and
220 keys on the upper floors and AZ Crowne
Plaza (Huang Guan Jia Ri) providing 291
keys. Both hotels were classified as Upscale
& Upper Midscale (3-Star).
Of the new supply, 1,050 keys were
categorised as Upscale & Upper Midscale
(4-Star) and 932 keys as Midscale &
Economy (3-Star). By overall distribution,
Overview
According to the Tourism Statistics Report
Year 2019 published by the Ministry of
Tourism, Kong Keng International Airport
(Sihanoukville’s main airport) recorded
666,723 international tourist arrivals,
reflecting a 186% growth compared with the
previous year which was expected in line with
the increase in international direct flights
between Sihanoukville and international
routes. Chinese tourists made up the largest
proportion of international arrivals.
Coastal regions of Cambodia welcomed
1,204,374 foreign visitors during 2019, a
37% increase from the previous year thus
indirectly leading to a spike in passenger
traffic for Kong Keng International Airport
with 1.68 mil passenger movements, a
growth of 158% compared with 2018.
The boom in the tourism industry over the
past three years has been driving growth
Upscale & UpperMidscale (4-star) 43%Midscale & Economy(3-star) 45%Luxury & UpperUpscale (5-star) 12%%
Figure 27:Existing Hotel Supply by Classification
Source: Knight Frank Research
Figure 28: Distribution by Year and Classification
Midscale & Economy
Source: Knight Frank Research
Upscale & Upper Midscale Luxury & Upper Upscale
0 200 400 600 800 1,000 1,200 1,400 1,600
2020
2021
Post
202
1
Outlook: The significant influx of tourists to Sihanoukville enabled hoteliers to command high room rates whilst maintaining favourable occupancy
rates, leading to a greater number of newly launched mixed use projects incorporating hotel components within their project mix. By 2022,
international operators including Accor (Novotel), Wyndham and IHG (Intercontinental) are scheduled to make an entrance into the market.
Whilst the online gambling ban has certainly impacted short term demand for hotel rooms, there is an opportunity for Sihanoukville to
cement its position as Cambodia’s secondary economic hub whilst also developing into an emerging coastal resort destination, and the
medium to long term outlook remains promising.
However, there is a need for an overarching framework and planning policy for future development in Sihanouk Province to ensure its
long term sustainability.
S I H A N O U K V I L L E H 2 2 0 1 9 R E V I E W

2 1
R E T A I L S E C T O R
Subsequently, a number of developers
incorporated retail podiums in their mixed use
projects to tap into this anticipated demand.
Future incoming retail developments
which are currently under construction
will contribute an additional 86,711 sq
m of NLA, spread across seven projects
including D’Seaview, Ocean City, La Tree,
Sihanoukville City View, Prince Tian Xi
Wan, New Landmark and Prince Huan Yu
Mall. All of these projects are scheduled
to complete between 2020 and 2022.
Prince Huan Yu Mall, slated to open during
2020, makes up 35% of the future supply,
adding 30,000 sq m of NLA into the retail
pipeline in Sihanoukville. This five storey
mall forms part of a mixed development
which also comprises 2,100 condominiums.
With a population in Sihanoukville of
302,887 as at 2019 (based on the General
Population Census 2019), the retail space
per capita as at H2 2019 was 0.02 per sq
m, a relatively low figure comparing to
other regional neighbouring cities.
Sihanoukville’s booming tourism sector
has attracted a number of international
brand retailers to debut in this province.
Although Furi Time Square Mall has
registered an occupancy rate of close
to 100% upon its debut, consumer and
business sentiment was noted to be
relatively weak, with the exception for
its Food & Beverage retailers. Initially
slated for Legend Cinema in its pre-
leased period, the main anchor tenant
within Entertainment segment has now
changed to Major Cinema, which is a
major Thai-based cinema brand.
Existing Food & Beverage tenants include
Starbucks, Café Amazon, HGB Little
Sheep, Koi, Miniso, The Pizza Company
and Kentucky Fried Chicken (KFC).
Bank 1%Food & Beverage 34%Health & Beauty 7%Entertainment 32%Fashion 10%Supermarket 13%
Figure 29:Tenants Mix Within Furi Time Square Mall
Source: Knight Frank Research
Telecommunication 1%Services 1%
In line with the growth in the number
of residential and hotel developments
launched in Sihanoukville, several new
retail offerings are in the pipeline and
scheduled for completion by 2022.
As at the end of H2 2019, there was one
existing shopping mall which completed
during the second half of 2018, Furi
Time Square Mall, jointly developed
by a Singaporean-Cambodian-Chinese
consortium. No additional stock was added
during 2019. This project was the first
shopping mall in Sihanoukville, comprising
a net lettable area of 6,000 sq m.
With the significant growth in tourist
arrivals recorded between 2017 and 2019,
developers saw a gap in the market for
international standard retail formats
catering to the increasing number of high
value tourists in the city.
Outlook: The exodus of Chinese expatriates and workers seemed to have grounded the entire local economy to a halt. Buildings, rooms, apartments
and condominiums have been vacated and on-going constructions abandoned. This abrupt slow down has affected the all business
owners, families and workers locally with the town being no longer a thriving port city that it was just 6 months prior.
Shopping and household demand has declined sharply with the reduction in purchasing power, directly impacting retailers’ revenue.
Despite being in its infancy stage and with an undersupply of existing retail shopping malls, business sentiment was already weak and
now the short term out looks is bleak. The completion of new incoming shopping malls is likely to be delayed until the tourism sector
stabilizes. Additionally, E-commerce will continue challenging the retail sector, even for Sihanoukville, as most millennial generation
prefer online shopping. Future incoming shopping mall operators should re-invent themselves as retail spend continues to shift online
or consider employing professional mall operators with the experience to undertake continuous marketing efforts effective to increase
footfalls and boost sales.
Furi time square mall, sihanoukville
S I H A N O U K V I L L E H 2 2 0 1 9 R E V I E W

2 2
I N D U S T R I A L S E C T O R
The entire SEZ accommodates a large
proportion of factories covering from textiles
to garment, bags and leather products,
hardware and machinery and wooden
products. This SEZ extends to a land area of
1,113 hectares, with the 1st phase covering
528 hectares. Price of vacant industrial plots
on long-term lease is available from US$85 to
US$108 per sq m for lease ranging between
50 years to 90 years. Ready-built standard
warehouse are also available to lease by the
operator with prices ranging from US$2.00
to US$2.50 per sq m over the gross floor
area. Other properties available for lease
by tenants are markets, apartments, rooms
(worker accommodation) and office.
According to the Ministry of Commerce, as at
H2 2019, there were 184 registered companies
within SSEZ whilst SPSEZ recorded four
registered companies. Overall, 121 of the
companies are operational, 36 have ceased
operation and 31 are non-operational.
Stueng Hav SEZ has been approved with
a license for a second international deep
sea port. Launched during 2006 by LCH
Investment Group, land on long lease is
available at US$45 to US$70 per sq m for lease
ranging between 10 years to 50 years.
Cambodian Zhejiang Guoji SEZ is a
relatively new SEZ located in Prey Nob
District. It was initially approved by Council
of Development of Cambodia (CDC) in 2018
and commenced operation in 2019. Selling
price for prepared industrial land on long
lease is available from US$50 per sq m over
the land area for 50 years with the option to
extend for a further 50 years.
stage of completion at the end of 2019 at
approximately 7% according to the Public
Works and Transport Minister.
Despite the issue of Everything But Arms (EBA)
agreement hanging on the line, new factories
continued entering Cambodia to operate. Data
from the Ministry of Commerce shows that
the number of garment production factories
increased to 51, a 24% increment from 2018.
With the preferential treatment and tax
incentive through Everything But Arms
(EBA) agreement, Cambodia’s largest
export is garment and textile products,
with most production within Sihanoukville
Special Economic Zone (SSEZ) due to its
close proximity to the deep sea port and
international airport.
As at H2 2019, there are four existing
operational SEZs in Sihanoukville;
Sihanoukville SEZ (SSEZ), Sihanoukville
Port SEZ (SPSEZ), Steung Hav SEZ and
Cambodian Zhejiang Guoji SEZ. A proposed
Free Trade Zone (FTZ) is also on-going by the
same developer / operator of Steung Hav SEZ.
SSEZ is one of China’s “Belt and Road”
initiatives and most prominent projects.
Being the country’s only deep sea port,
Sihanoukville’s logistic traffic responded
to rapid growth, underpinned by the
expansion of the deep sea port terminal at
the Sihanoukville Autonomous Port (SAP).
Accessibility remains the main criteria for
logistic companies and currently, SAP is the
only operational deep sea port in Cambodia.
The country has four main logistic gateways;
the Sihanoukville Autonomous Port, Phnom
Penh Autonomous Port, Bavet Border
and Poipet Border. According to Asian
Development Bank’s report on Cambodia
Transport Sector Assessment 2019, among
the four main gateways, Sihanoukville
Autonomous Port accounted for majority of
the import/export activities for the nation,
70% of total exports and 66% of total imports.
Infrastructre is also key to logistic players and
the country’s first expressway is currently
undergoing construction. The expressway
will connect Phnom Penh and Sihanoukville,
allowing for ease of traffic thus saving time
and cost for goods transportation.
The Phnom Penh – Sihanoukville
Expressway is a four-lane expressway,
scheduled for completion in 2023 with the
Outlook: Infrastructure and accessibility remains a critical point for industrial players when considering locations for expansion. With the entire road
networks in Sihanoukville undergoing restoration and the on-going Phnom Penh – Sihanoukville Expressway, accessibility will tremendously
improve upon completion. Industrial restructuring, upgrade and development in line with Cambodia Industrial Development Policy
2015 – 2025 is well underway, evidently by the commissioning of Shenzhen Urban Planning and Design Institute late 2019 to undertake
a Sihanoukville transformation masterplan. The move to shift the main economic driver away from an over reliance on its gaming sector
provides this province to diversify and bloom over its industrial, tourism, commercial and residential sectors.
Developments Lease TenureLease Price Per Sq M Premium Over the Land Area
Sihanoukville SEZ 50 years - 90 years US$85 - US$108
Sihanoukville Port SEZ 10 years - 50 years US$55 - US$65
Stueng Hav SEZ 10 years - 50 years US$45 - US$70
Cambodian Zhejiang Guoji SEZ 50 years / 50 + 50 years US$50
S I H A N O U K V I L L E H 2 2 0 1 9 R E V I E W

Knight Frank Research provides strategic advice, consultancy services and forecasting to a wide rangeof clients worldwide including developers, investors, funding organisations, corporate institutions andthe public sector. All our clients recognise the need for expert independent advice customised to theirspecific needs. Important Notice: © Knight Frank LLP 2018 This report is published for general information only and not to be relied upon in any way. Although high standards have been used in the preparation of the information, analysis, views and projections presented in this report, no responsibility or liability whatsoever can be accepted by Knight Frank LLP for any loss or damage resultant from any use of, reliance on or reference to the contents of this document. As a general report, this material does not necessarily represent the view of Knight Frank LLP in relation to particular properties or projects. Reproduction of this report in whole or in part is not allowed without prior written approval of Knight Frank LLP to the form and content within which it appears. Knight Frank LLP is a limited liability partnership registered in England with registered number OC305934. Our registered office is 55 Baker Street, London, W1U 8AN, where you may look at a list of members’ names.
Knight Frank Research Reports are available atknightfrank.com/research
Recent Market-Leading Research Publications
Eric Y H OoiChairman
[email protected]+855 23 966 878
The Global Ultra-Prime Market 2019
The London Report 2020
Ross Wheble Country Head
[email protected]+855 23 966 878
Law Kheng FongValuation Manager & Advisory
[email protected]+855 23 966 878
Socheata EarResearch Analyst
[email protected]+855 23 966 878
Hakim LySenior Analyst
[email protected]+855 23 966 878
Jonathan BaxterResidential Sale & Leasing Manager
[email protected]+855 23 966 878
We like questions, if you've got one about our research, or would likesome property advice, we would love to hear from you.
Knight Frank Research provides strategic advice, consultancy services and forecasting to a wide rangeof clients worldwide including developers, investors, funding organisations, corporate institutions andthe public sector. All our clients recognise the need for expert independent advice customised to theirspecific needs. Important Notice: © Knight Frank LLP 2018 This report is published for general informationonly and not to be relied upon in any way. Although high standards have been used in the preparation ofthe information, analysis, views and projections presented in this report, no responsibility or liabilitywhatsoever can be accepted by Knight Frank LLP for any loss or damage resultant from any use of, relianceon or reference to the contents of this document. As a general report, this material does not necessarilyrepresent the view of Knight Frank LLP in relation to particular properties or projects. Reproduction of thisreport in whole or in part is not allowed without prior written approval of Knight Frank LLP to the form andcontent within which it appears. Knight Frank LLP is a limited liability partnership registered in England withregistered number OC305934. Our registered office is 55 Baker Street, London, W1U 8AN, where you maylook at a list of members’ names.
Knight Frank ResearchReports are available atknightfrank.com/research
The Global Ultra-Prime Market 2019
The London Report 2020
BREXITW H A T W IL L IT S I M P A C T B E O N
T H E E U R O P E A N R E A L E S TA TE M A R K E T S ?
#3
T H E
W E A LT H R E P O R T
T H E G L O B A L P E R S P E C T I V E O N P R I M E P R O P E R T Y & I N V E S T M E N T
2020 — 14TH EDITION
RE
THE LONDON REPORT 2O2OHIGHLIGHTS
The Wealth Report 2020
Senior Living Survey
Recent Market-Leading Research Publications
Eric Y H [email protected]+855 23 966 878
Ross Wheble
Country Head
+855 23 966 878
Law Kheng Fong
Valuation Manager & Advisory
+855 23 966 878
Jonathan Baxter
Residential Sale & Leasing [email protected]
+855 23 966 878
Hakim Ly
Senior Analyst
+855 23 966 878
Socheata Ear
Research Analyst
+855 23 966 878
The Wealth Report 2020
Senior Living Survey
Knight Frank Research provides strategic advice, consultancy services and forecasting to a wide rangeof clients worldwide including developers, investors, funding organisations, corporate institutions andthe public sector. All our clients recognise the need for expert independent advice customised to theirspecific needs. Important Notice: © Knight Frank LLP 2018 This report is published for general informationonly and not to be relied upon in any way. Although high standards have been used in the preparation ofthe information, analysis, views and projections presented in this report, no responsibility or liabilitywhatsoever can be accepted by Knight Frank LLP for any loss or damage resultant from any use of, relianceon or reference to the contents of this document. As a general report, this material does not necessarilyrepresent the view of Knight Frank LLP in relation to particular properties or projects. Reproduction of thisreport in whole or in part is not allowed without prior written approval of Knight Frank LLP to the form andcontent within which it appears. Knight Frank LLP is a limited liability partnership registered in England withregistered number OC305934. Our registered office is 55 Baker Street, London, W1U 8AN, where you maylook at a list of members’ names.
Knight Frank ResearchReports are available atknightfrank.com/research
The Global Ultra-Prime Market 2019
The London Report 2020
BREXITW H A T W IL L IT S I M P A C T B E O N
T H E E U R O P E A N R E A L E S TA TE M A R K E T S ?
#3
T H E
W E A LT H R E P O R T
T H E G L O B A L P E R S P E C T I V E O N P R I M E P R O P E R T Y & I N V E S T M E N T
2020 — 14TH EDITION
RE
THE LONDON REPORT 2O2OHIGHLIGHTS
The Wealth Report 2020
Senior Living Survey
Recent Market-Leading Research Publications
Eric Y H [email protected]+855 23 966 878
Ross Wheble
Country Head
+855 23 966 878
Law Kheng Fong
Valuation Manager & Advisory
+855 23 966 878
Jonathan Baxter
Residential Sale & Leasing [email protected]
+855 23 966 878
Hakim Ly
Senior Analyst
+855 23 966 878
Socheata Ear
Research Analyst
+855 23 966 878