
PHM for nuclear applications -...
62
PHM for nuclear applications Enrico Zio
Transcript of PHM for nuclear applications -...

PHM for nuclear applications
Enrico Zio
Condition Monitoring andPrognostics and Health Management
2
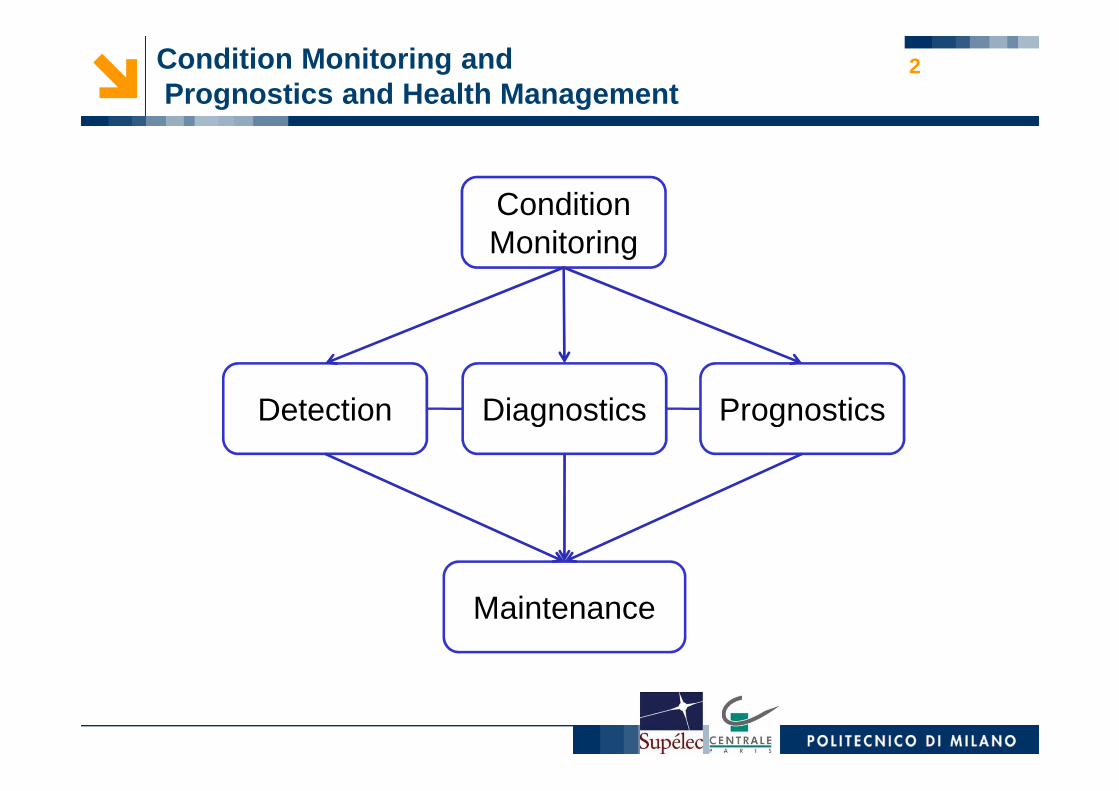
Detection Diagnostics Prognostics
Condition Monitoring
Detection Diagnostics Prognostics
Maintenance
Outline 3
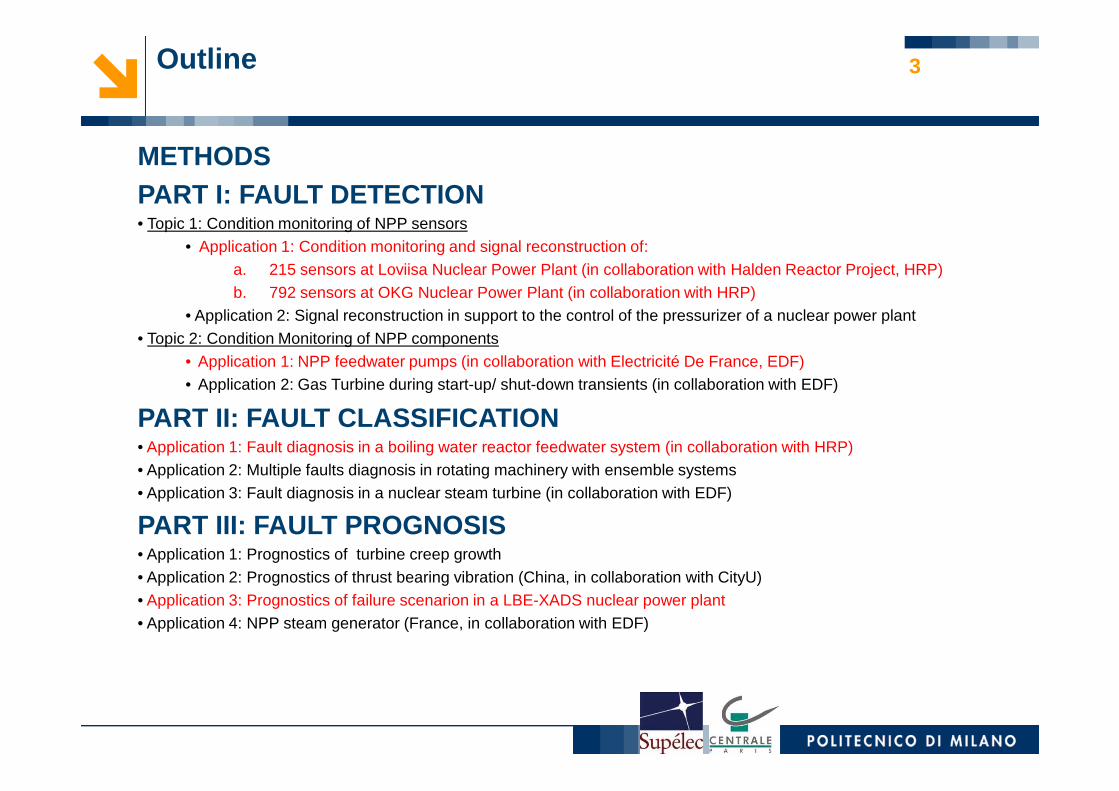
METHODSPART I: FAULT DETECTION• Topic 1: Condition monitoring of NPP sensors
• Application 1: Condition monitoring and signal reconstruction of:a. 215 sensors at Loviisa Nuclear Power Plant (in collaboration with Halden Reactor Project, HRP)b. 792 sensors at OKG Nuclear Power Plant (in collaboration with HRP)
• Application 2: Signal reconstruction in support to the control of the pressurizer of a nuclear power plant• Topic 2: Condition Monitoring of NPP components
• Application 1: NPP feedwater pumps (in collaboration with Electricité De France, EDF)• Application 2: Gas Turbine during start-up/ shut-down transients (in collaboration with EDF)
PART II: FAULT CLASSIFICATION• Application 1: Fault diagnosis in a boiling water reactor feedwater system (in collaboration with HRP)• Application 2: Multiple faults diagnosis in rotating machinery with ensemble systems• Application 3: Fault diagnosis in a nuclear steam turbine (in collaboration with EDF)
PART III: FAULT PROGNOSIS• Application 1: Prognostics of turbine creep growth• Application 2: Prognostics of thrust bearing vibration (China, in collaboration with CityU)• Application 3: Prognostics of failure scenarion in a LBE-XADS nuclear power plant• Application 4: NPP steam generator (France, in collaboration with EDF)
Methods (I) 4
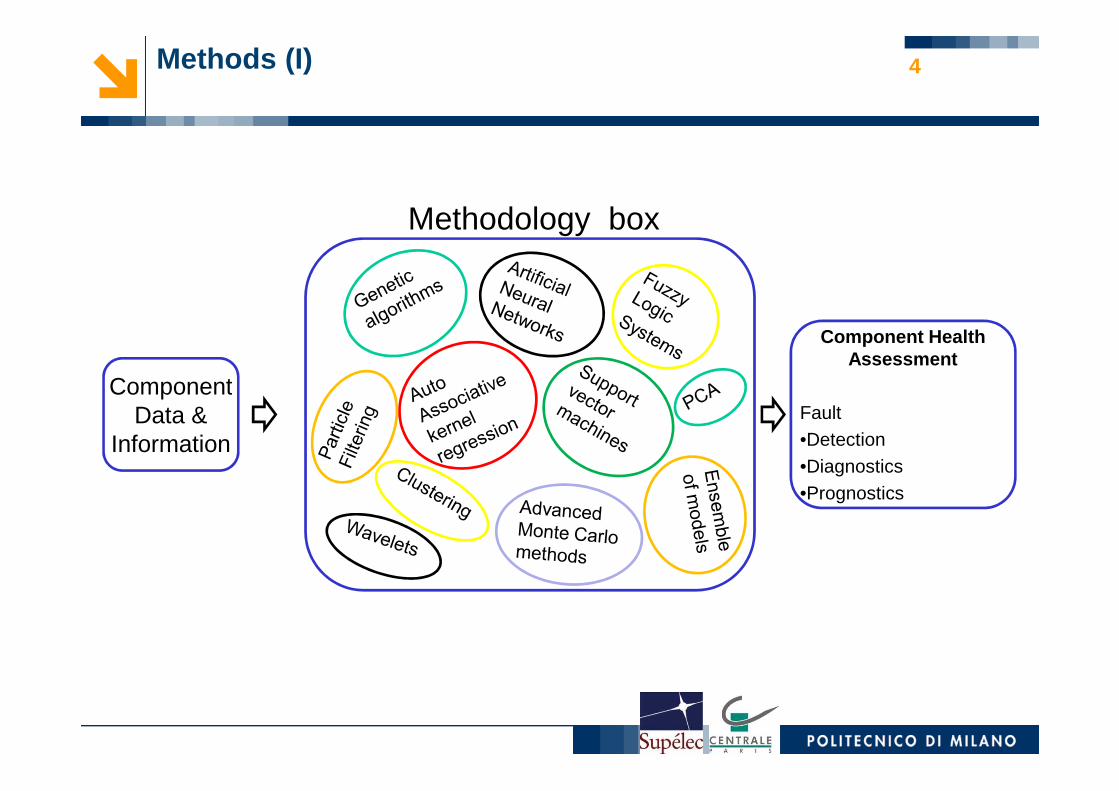
Component
Methodology box
Component Health Assessment
ComponentData &
InformationFault •Detection•Diagnostics•Prognostics
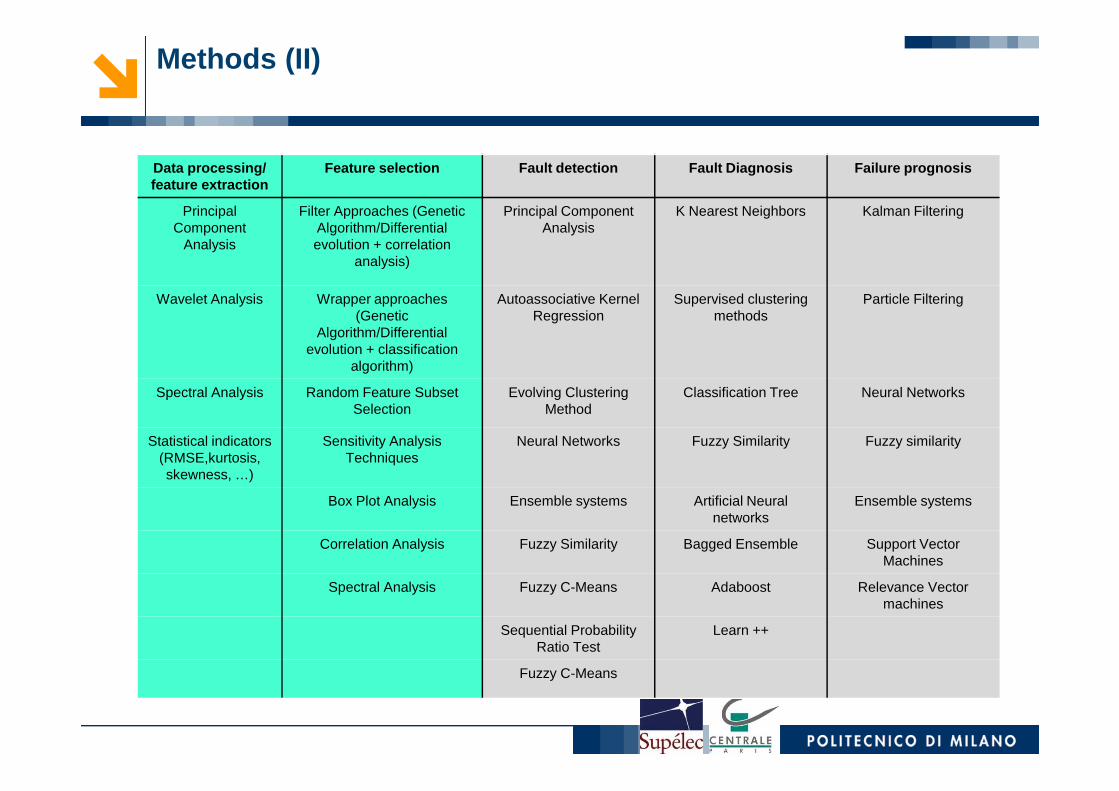
Data processing/ feature extraction
Feature selection Fault detection Fault Diagnosis Failu re prognosis
Principal Component
Analysis
Filter Approaches (Genetic Algorithm/Differential evolution + correlation
analysis)
Principal Component Analysis
K Nearest Neighbors Kalman Filtering
Wavelet Analysis Wrapper approaches(Genetic
Algorithm/Differential evolution + classification
algorithm)
Autoassociative KernelRegression
Supervised clustering methods
Particle Filtering
Spectral Analysis Random Feature Subset Evolving Clustering Classification Tree Neural Networks
Methods (II)
Spectral Analysis Random Feature Subset Selection
Evolving Clustering Method
Classification Tree Neural Networks
Statistical indicators(RMSE,kurtosis, skewness, …)
Sensitivity Analysis Techniques
Neural Networks Fuzzy Similarity Fuzzy similarity
Box Plot Analysis Ensemble systems Artificial Neural networks
Ensemble systems
Correlation Analysis Fuzzy Similarity Bagged Ensemble Support Vector Machines
Spectral Analysis Fuzzy C-Means Adaboost Relevance Vector machines
Sequential Probability Ratio Test
Learn ++
Fuzzy C-Means

FAULT DETECTION
6
TOPIC 1: SENSOR CONDITION MONITORING
Practical Applications Of Sensor Condition Monitoring
1. Condition monitoring and signal reconstruction of:a. 215 sensors at Loviisa Nuclear Power Plant (Finland, in
collaboration with HRP)b. 792 sensors at OKG Nuclear Power Plant (Sweden, in
collaboration with HRP)
2. Signal reconstruction in support to the control of the pressurizerof a nuclear power plant
7
of a nuclear power plant
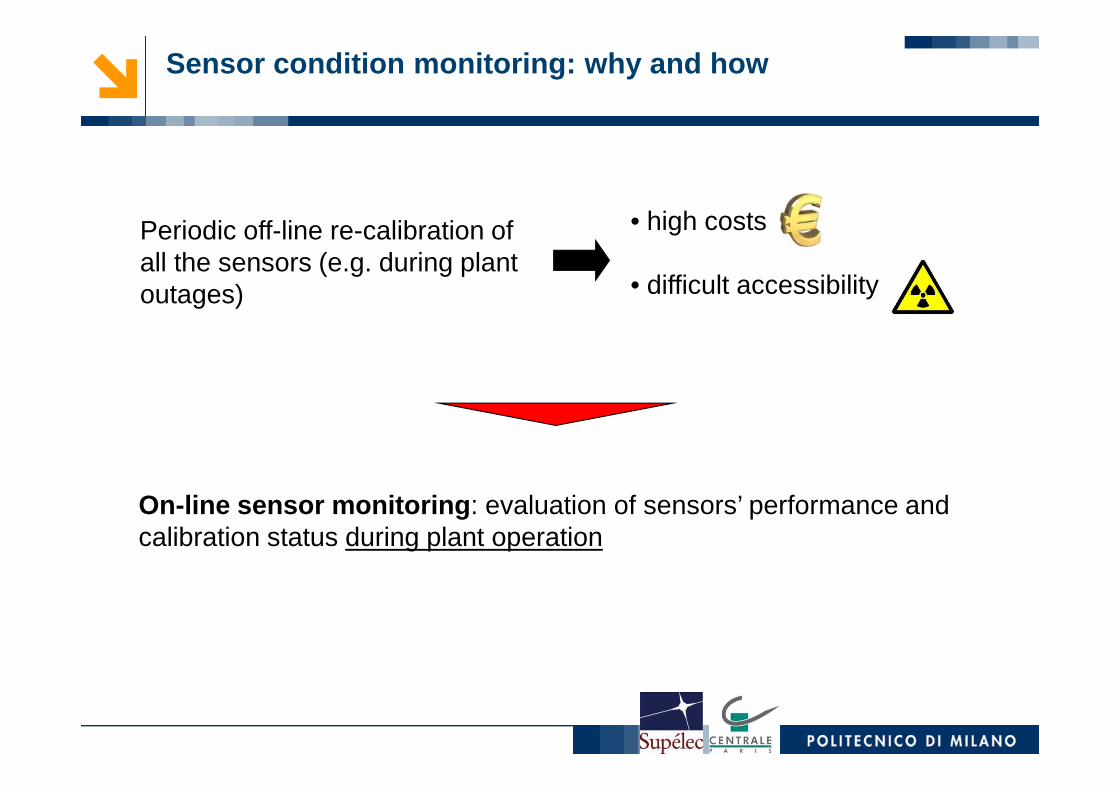
Periodic off-line re-calibration of all the sensors (e.g. during plant outages)
• high costs
• difficult accessibility
Sensor condition monitoring: why and how
On-line sensor monitoring : evaluation of sensors’ performance and calibration status during plant operation
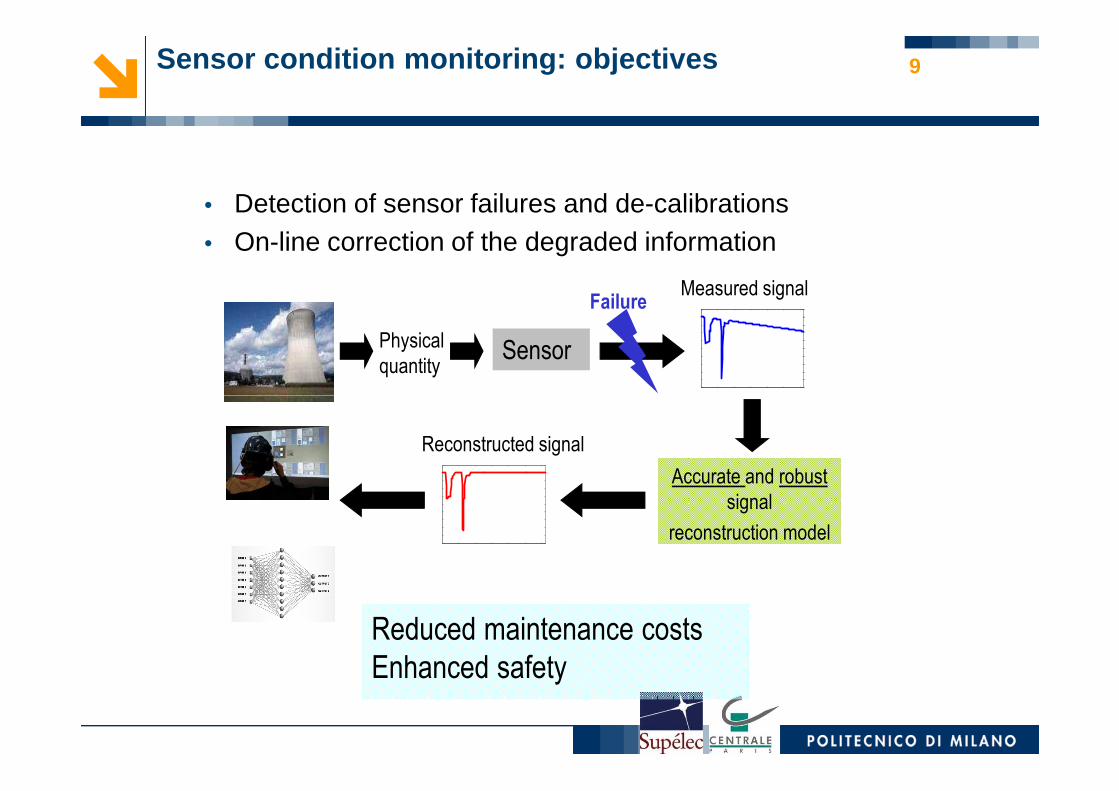
Sensor condition monitoring: objectives
• Detection of sensor failures and de-calibrations• On-line correction of the degraded information
9
Physical
quantity
Measured signal
Sensor
Failure
Accurate and robust
signal
reconstruction model
Reconstructed signal
Reduced maintenance costs
Enhanced safety
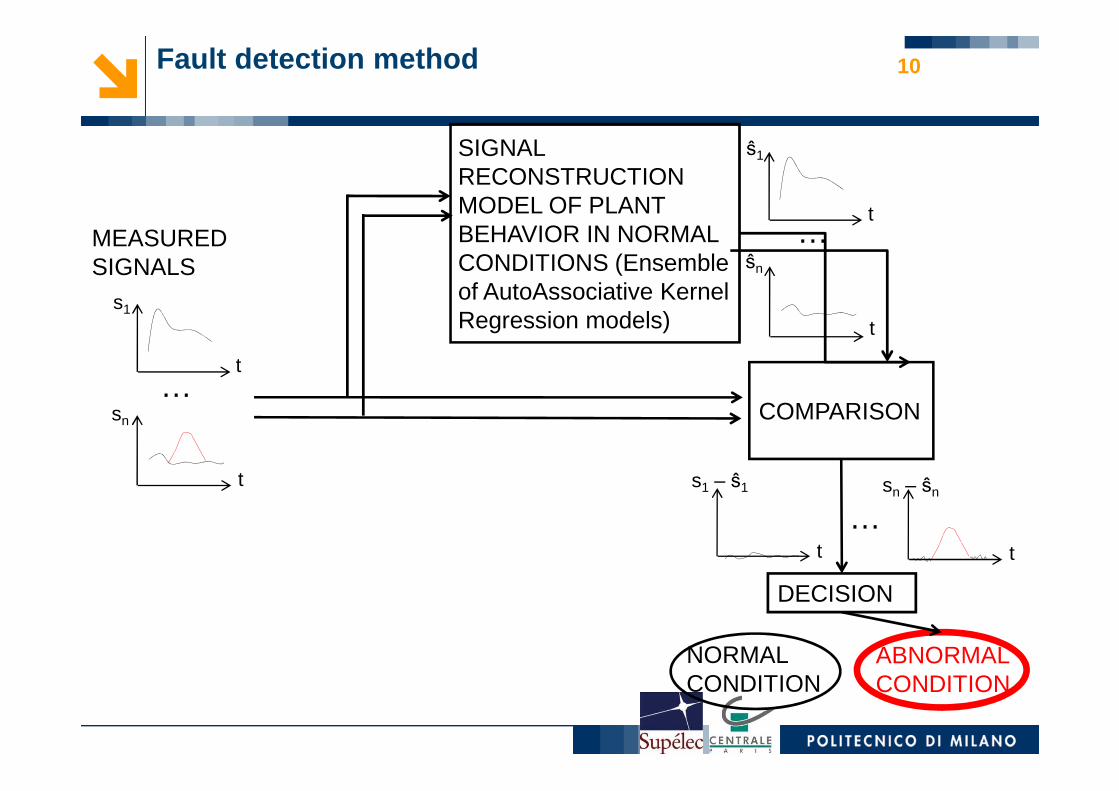
10Fault detection method
SIGNAL RECONSTRUCTION MODEL OF PLANT BEHAVIOR IN NORMAL CONDITIONS (Ensemble of AutoAssociative Kernel Regression models)
ŝ1
t
t
ŝn
s1
t
MEASURED SIGNALS
…
…
COMPARISON
DECISION
t t
s1 – ŝ1 sn – ŝn
sn
t
…
NORMALCONDITION
ABNORMALCONDITION
…
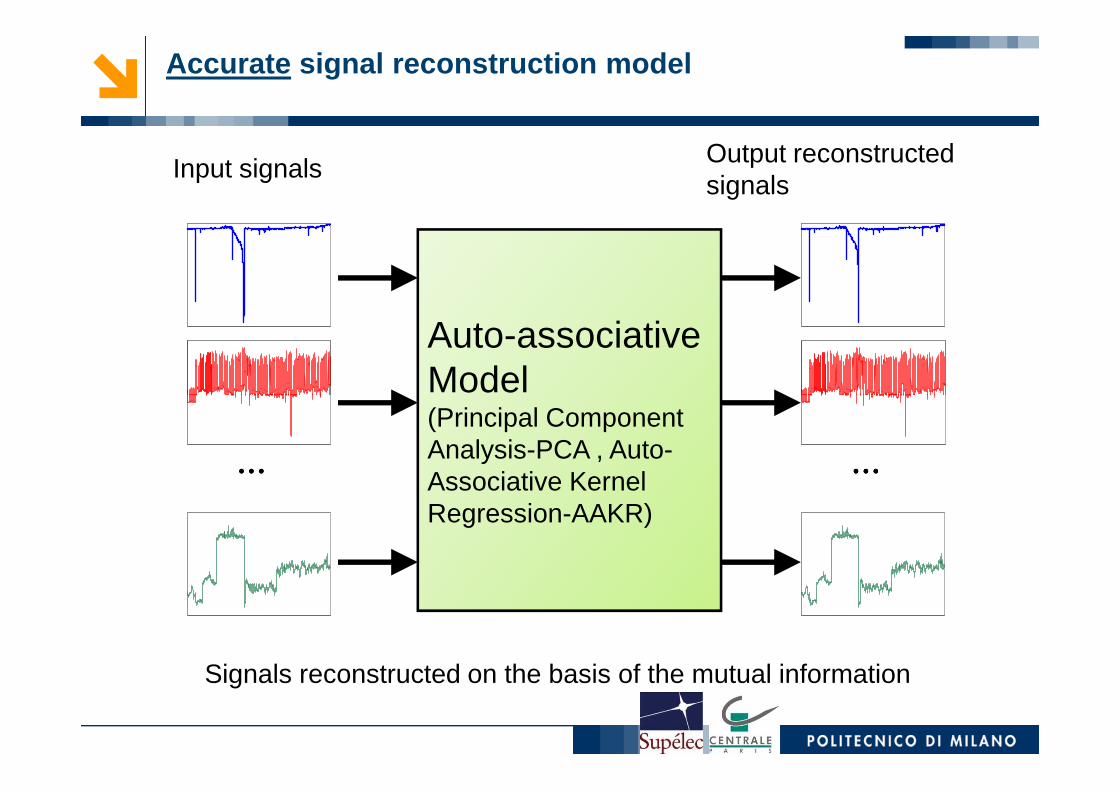
Auto-associative Model
Input signals Output reconstructed signals
Accurate signal reconstruction model
Model(Principal Component Analysis-PCA , Auto-Associative Kernel Regression-AAKR)
………… …………
Signals reconstructed on the basis of the mutual information

Auto-associative Model
Input signals Output reconstructed signals
Robust signal reconstruction model
Model (Principal Component Analysis-PCA , Auto-Associative Kernel Regression-AAKR)
………… …………
Failed signal reconstructed on the basis of the information coming from the non-faulty signals
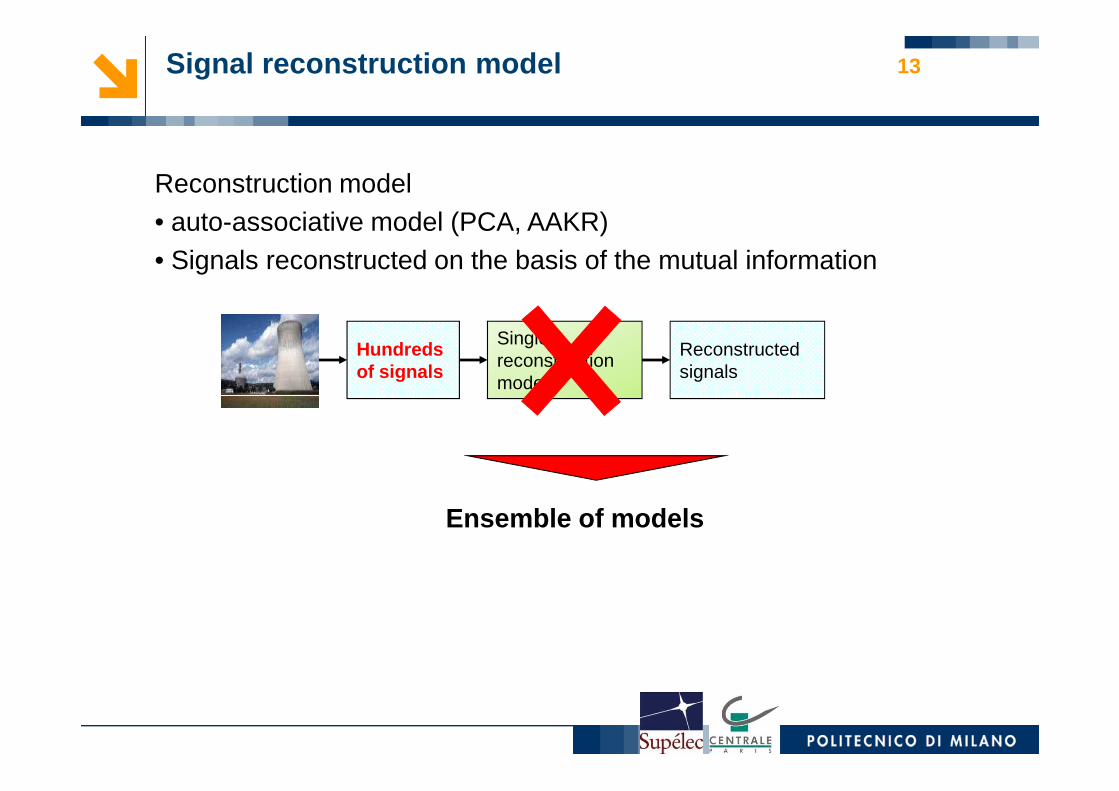
Signal reconstruction model
Hundreds of signals
Single reconstruction model
Reconstructed signals
Reconstruction model• auto-associative model (PCA, AAKR)• Signals reconstructed on the basis of the mutual information
13
Ensemble of models
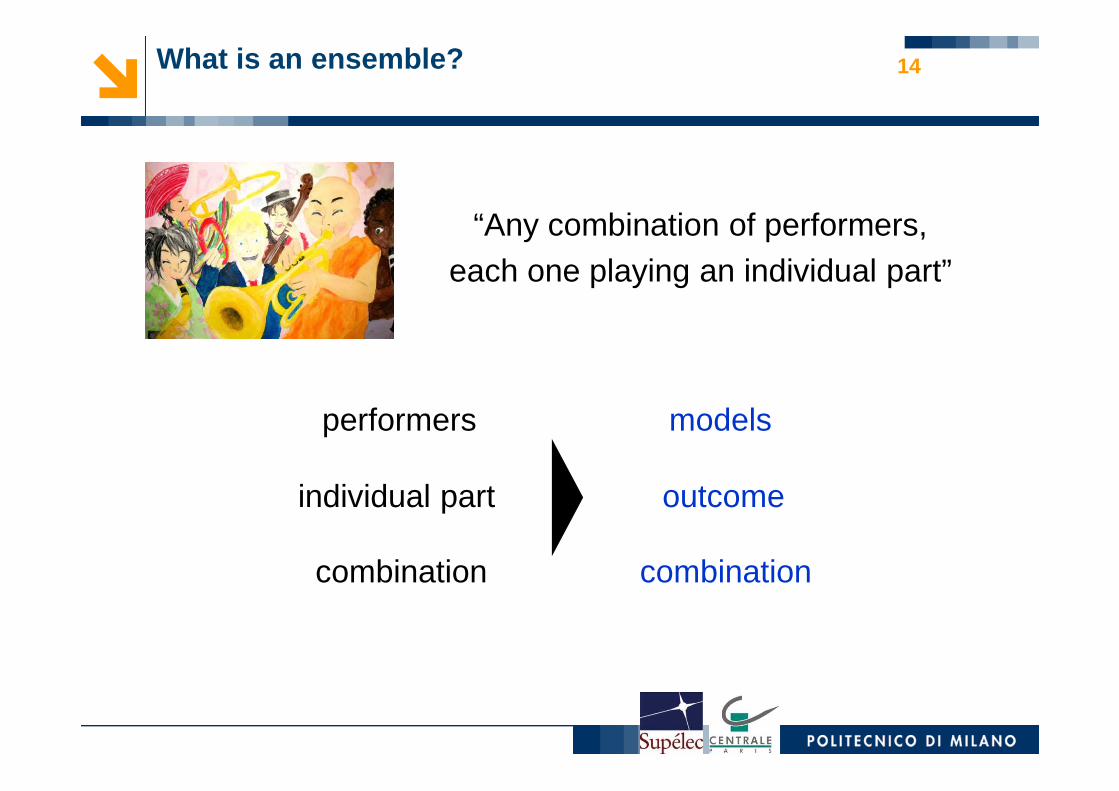
“Any combination of performers, each one playing an individual part”
What is an ensemble? 14
combination
performers
individual part
combination
models
outcome
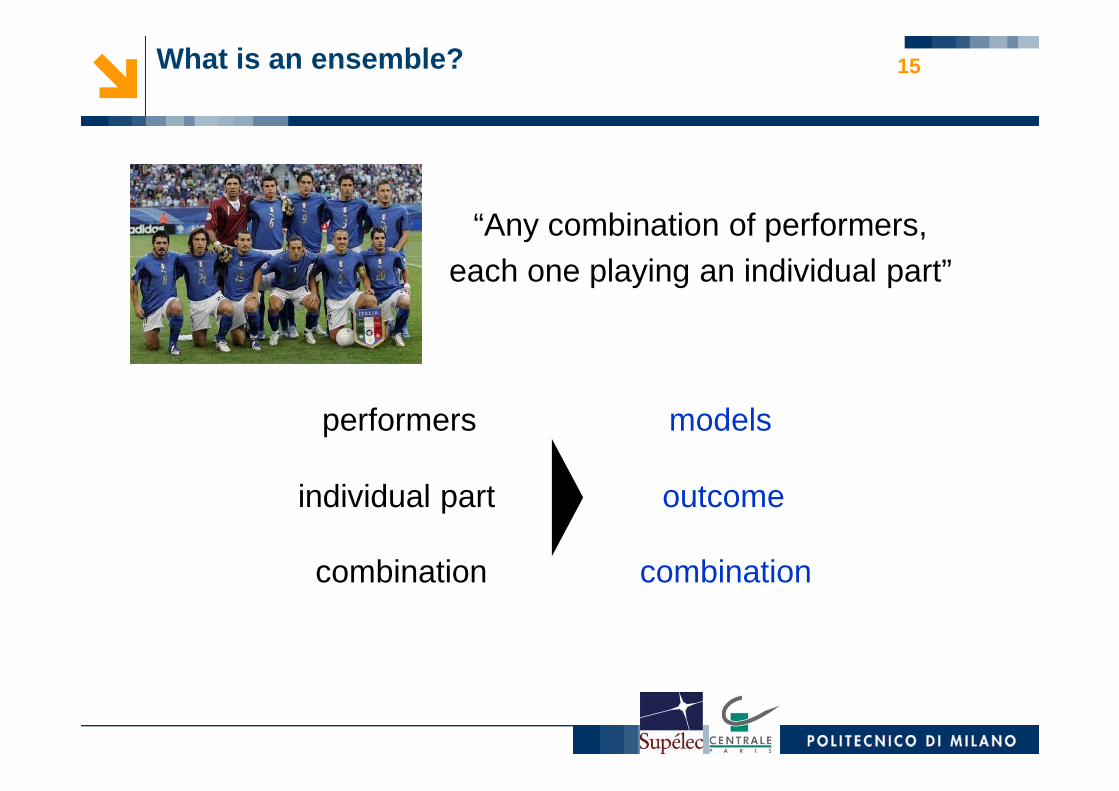
“Any combination of performers, each one playing an individual part”
What is an ensemble? 15
combination
performers
individual part
combination
models
outcome
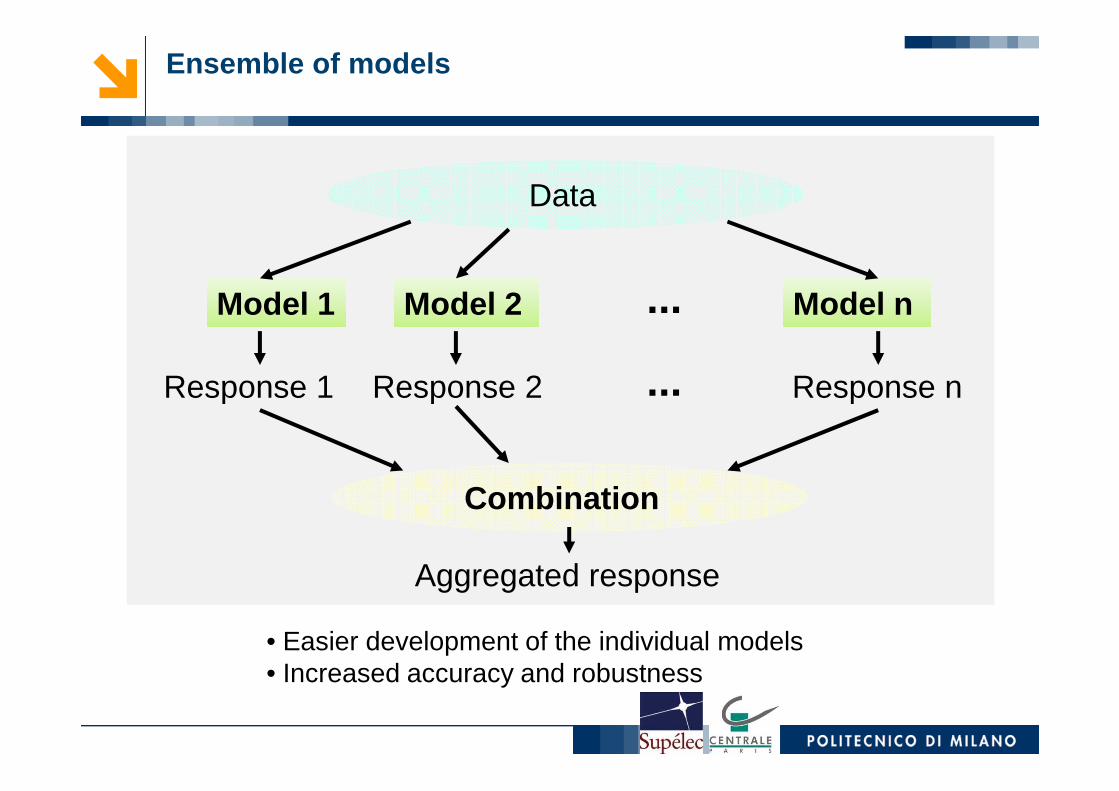
Data
Model 1 Model 2 Model n...
Response 1 Response 2 Response n...
Ensemble of models
• Easier development of the individual models• Increased accuracy and robustness
Response 1 Response 2 Response n...
Combination
Aggregated response
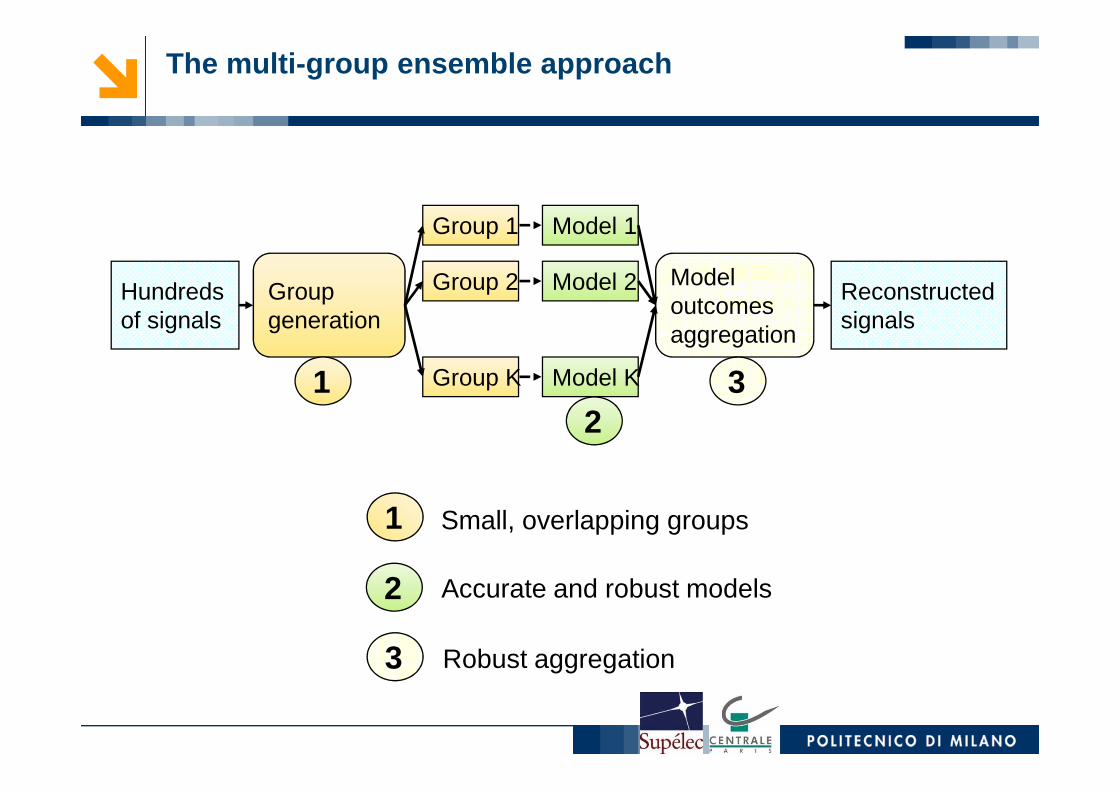
Hundredsof signals
Group generation
Model 1
Model outcomes aggregation
Reconstructed signals
Model 2
Model K
Group 1
Group 2
Group K1 3
The multi-group ensemble approach
12
3
1 Small, overlapping groups
3
2 Accurate and robust models
Robust aggregation

1Group
generation
2Reconstruction Principal
Random group generation
AutoAssociative
Fast reconstruction models
The multi-group ensemble approach: issues and techn iques
2Reconstruction
model
3 Ensemble
aggregation
Principal
Components
Analysis (PCA)
Statistical approach
Simple
mean
Trimmed
mean
Median
AutoAssociative
Kernel
Regression (AAKR)
Performance approach
Global
weighted
Local fusion
Applications
• Condition monitoring and signal reconstruction of:• 215 sensors at Loviisa Nuclear Power Plant (Finland) [1,2]
• 792 sensors at OKG Nuclear Power Plant (Sweden) [1,3]
19
[1] P. Baraldi, E. Zio, G. Gola, D. Roverso, M. Hoffmann, "Robust nuclear signal reconstruction by a novel ensemble model aggregation procedure", International Journal of Nuclear Knowledge Management, Vol 4 (1), pp. 34-41, 2010.[2] P. Baraldi, G. Gola, E. Zio, D. Roverso, M. Hoffmann, "A randomized model ensemble approach for reconstructing signals from faulty sensors". Expert Systems With Application, Vol. 38 (8), pp. 9211-9224, 2011[3] P. Baraldi, E. Zio, G. Gola, D. Roverso, M. Hoffmann, "Two novel procedures for aggregating randomized model ensemble outcomes for robust signal reconstruction in nuclear power plants monitoring systems", Annals of Nuclear Energy, Vol. 38 (2-3), pp. 212-220, 2011.
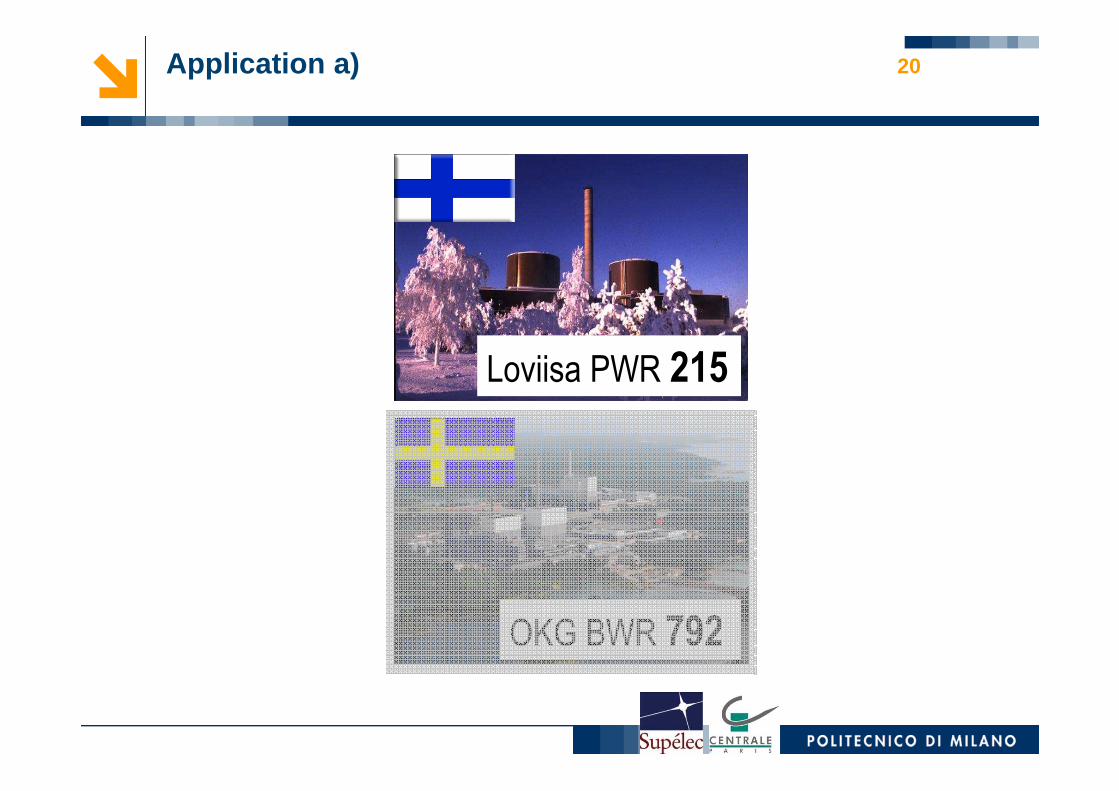
Loviisa PWR 215
Application a) 20
OKG BWR 792

21
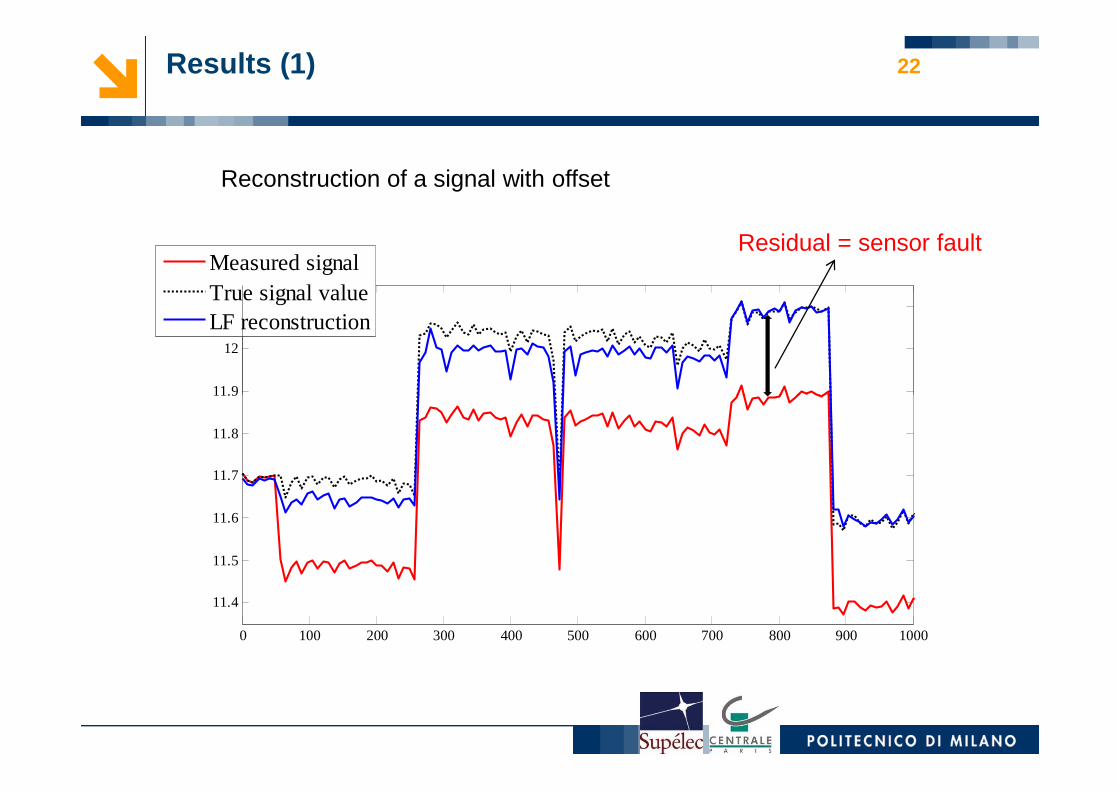
• Number of signals in each group: m = 38• Number of groups in the ensemble: K = 40• Each signal is included in R = 7 groups
• Groups generation: pure random approach1
Loviisa, 215 signals
• reconstruction model: PCA
• Model outcomes aggregation: local fusion
2
3
22
11.9
12
12.1
Measured signalTrue signal valueLF reconstruction
Results (1)
Reconstruction of a signal with offset
Residual = sensor fault
0 100 200 300 400 500 600 700 800 900 1000
11.4
11.5
11.6
11.7
11.8
11.9
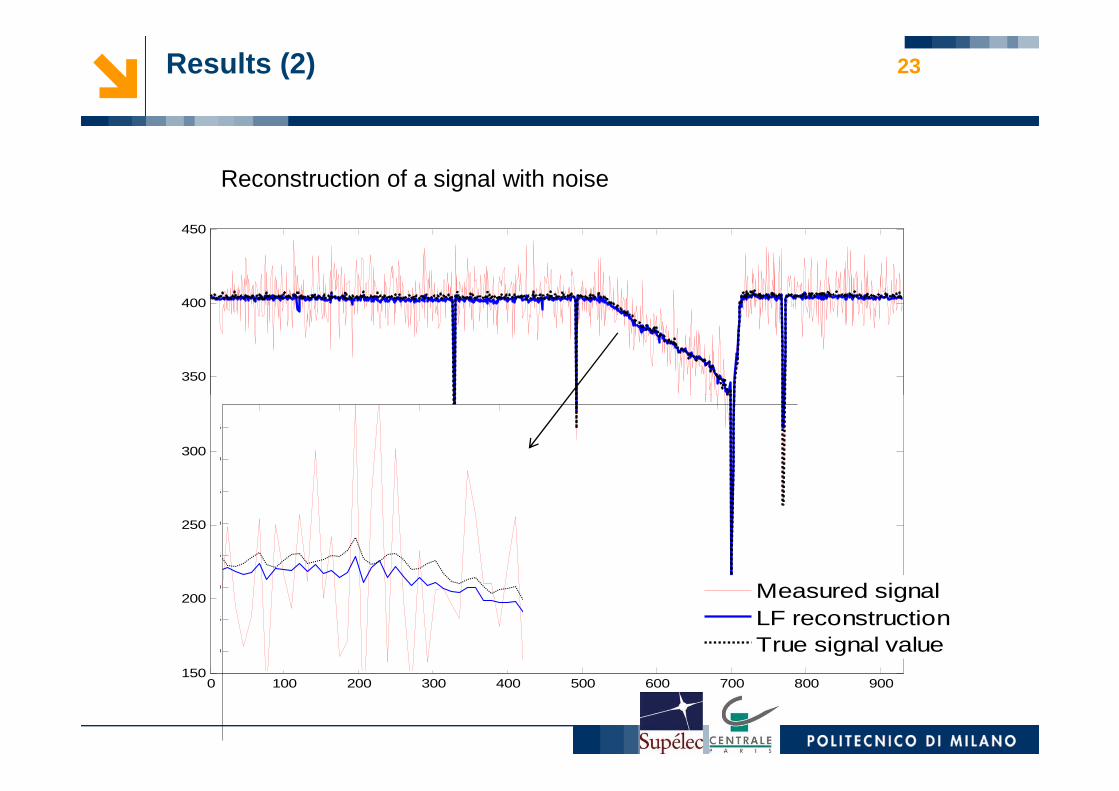
23Results (2)
Reconstruction of a signal with noise
350
400
450
0 100 200 300 400 500 600 700 800 900150
200
250
300
Measured signalLF reconstructionTrue signal value390
395
400
405
410
415
420
425
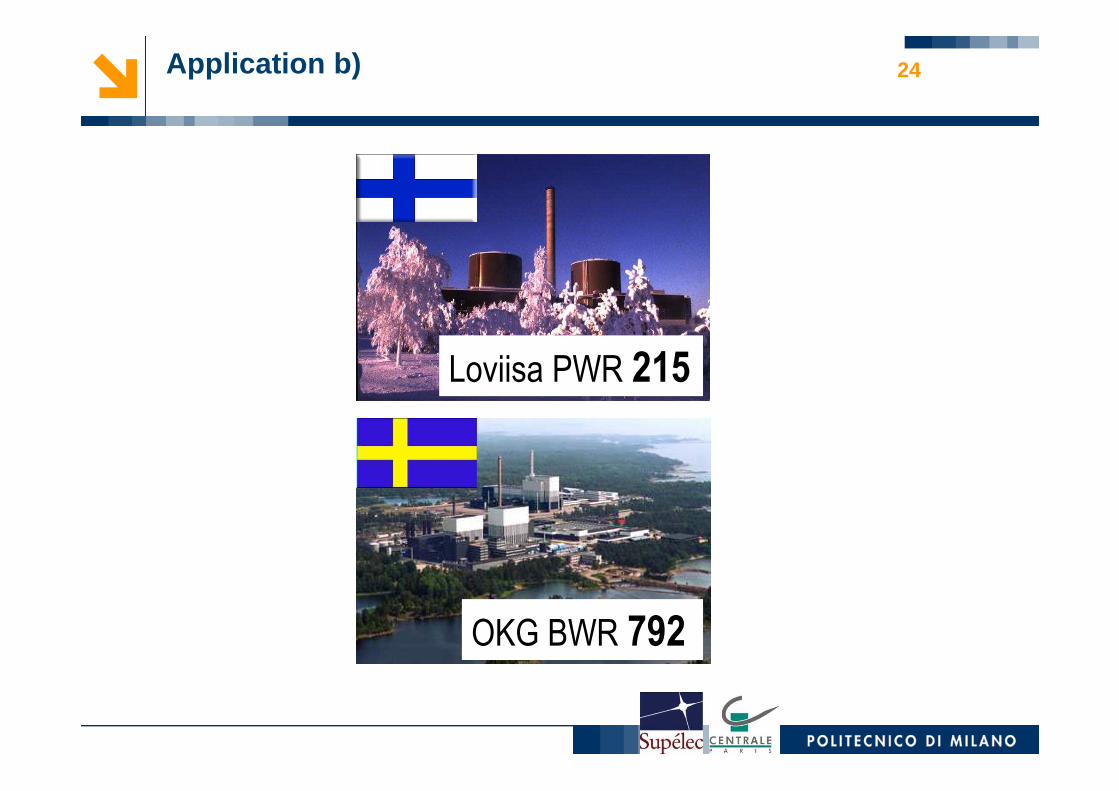
Loviisa PWR 215
Application b) 24
OKG BWR 792

25
• Number of signals in each group: m = 50• Number of groups in the ensemble: K = 111• Each signal is included in R = 7 groups
• Groups generation: random approach1
Oskarshamn, 792 signals
• Reconstruction model: AAKR
• Model outcomes aggregation: median
2
3
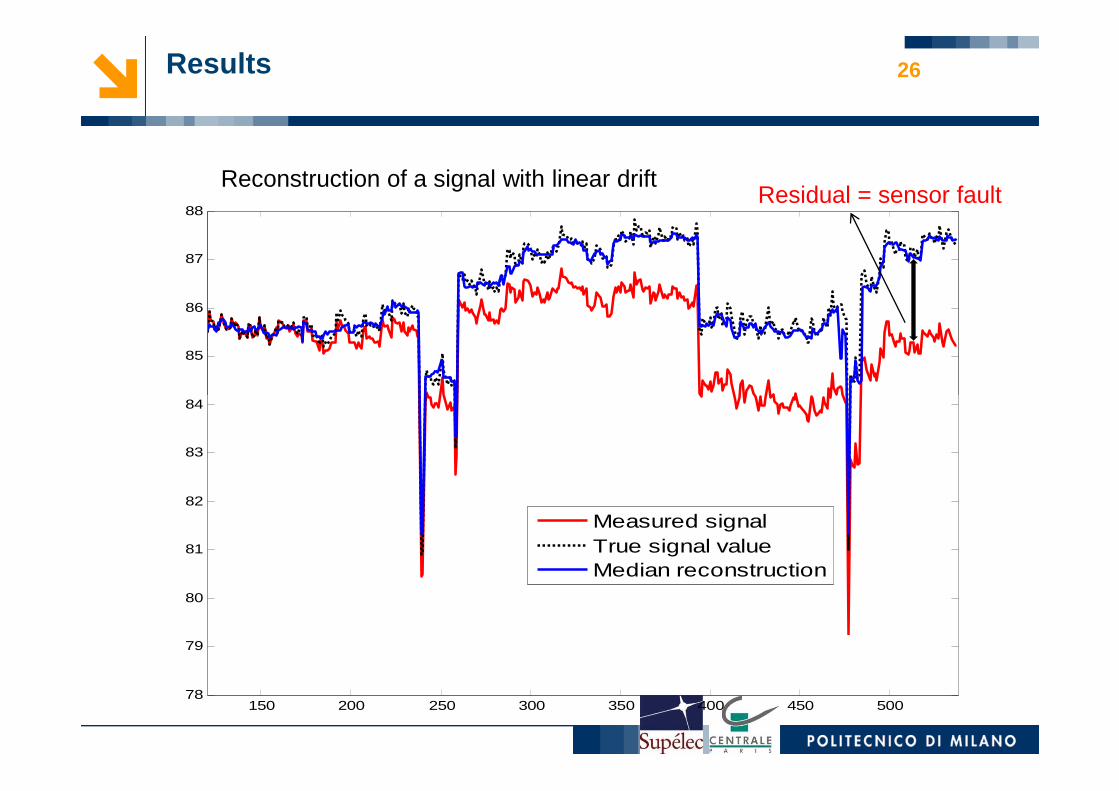
Results
Reconstruction of a signal with linear drift
85
86
87
88 Residual = sensor fault
26
150 200 250 300 350 400 450 50078
79
80
81
82
83
84
Measured signalTrue signal valueMedian reconstruction

27
FAULT DETECTION
TOPIC 2: CONDITION MONITORING OF NPP COMPONENTS
Practical Applications of Condition Monitoring of NPP components
• Application 1: NPP feedwater pumps (France, in collaboration with EDF)
• Application 2: Gas Turbine during start-up/ shut-down transients (France, in collaboration with EDF)
• Application 3: Sequential Probability Ratio Test for abnormal conditions detection (France, in collaboration with EDF)
28
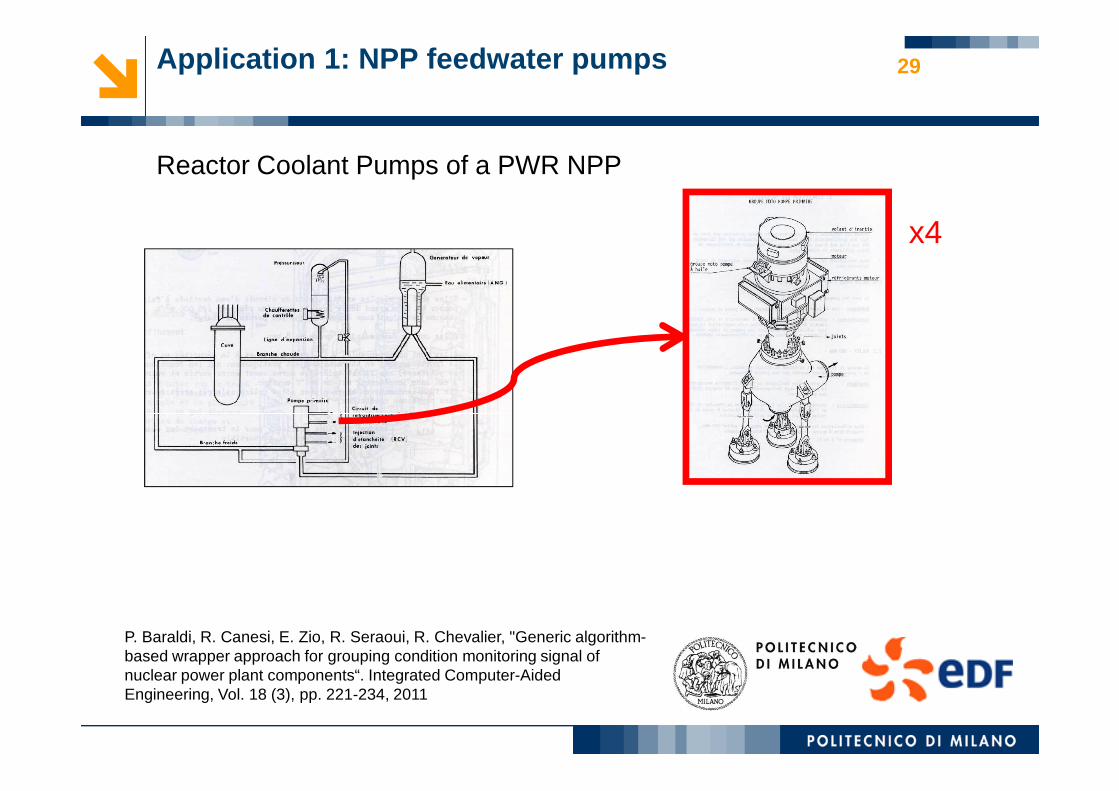
Application 1: NPP feedwater pumps
Reactor Coolant Pumps of a PWR NPP
29
x4
[
P. Baraldi, R. Canesi, E. Zio, R. Seraoui, R. Chevalier, "Generic algorithm-based wrapper approach for grouping condition monitoring signal of nuclear power plant components“. Integrated Computer-Aided Engineering, Vol. 18 (3), pp. 221-234, 2011

Available information
• Historical measurements of 94 stationary signals during 1 year of operation
• EDF experts have considered 48 of the 94 measured signals as the most important for the component condition monitoring
30
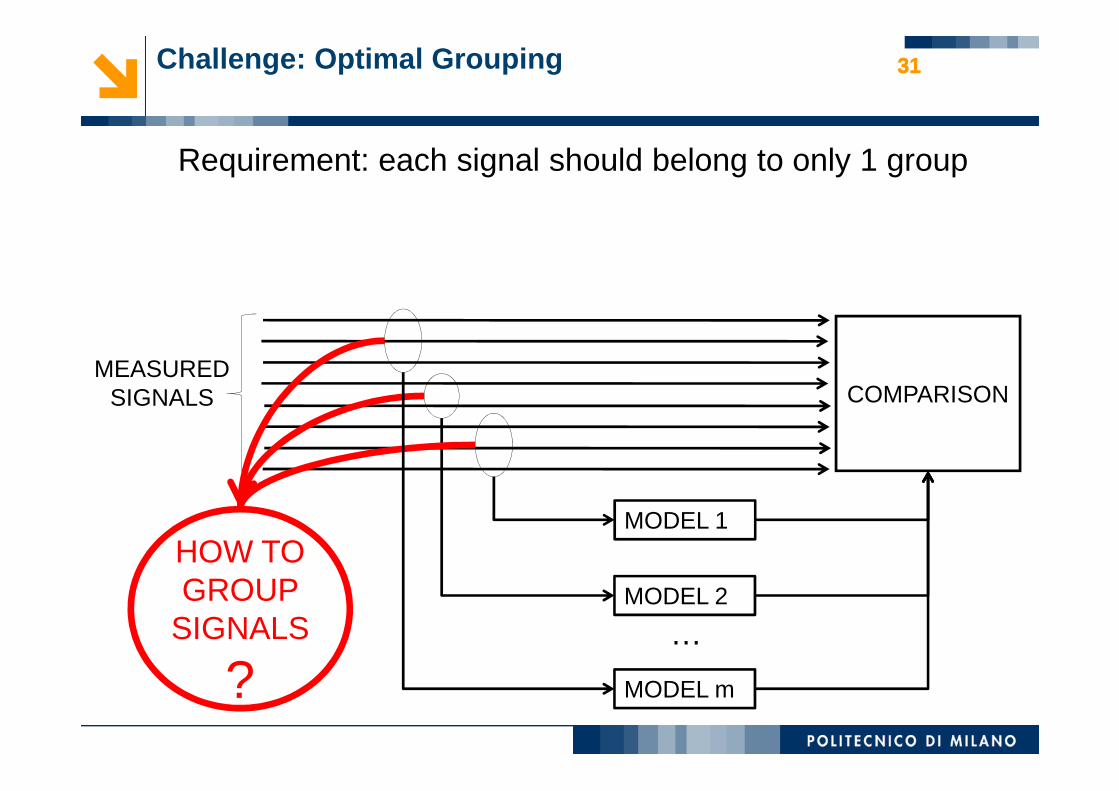
31Challenge: Optimal Grouping 31
COMPARISONMEASURED
SIGNALS
Requirement: each signal should belong to only 1 group
COMPARISON
MODEL 1
MODEL 2
HOW TO GROUP
SIGNALS
?
SIGNALS
MODEL m
…
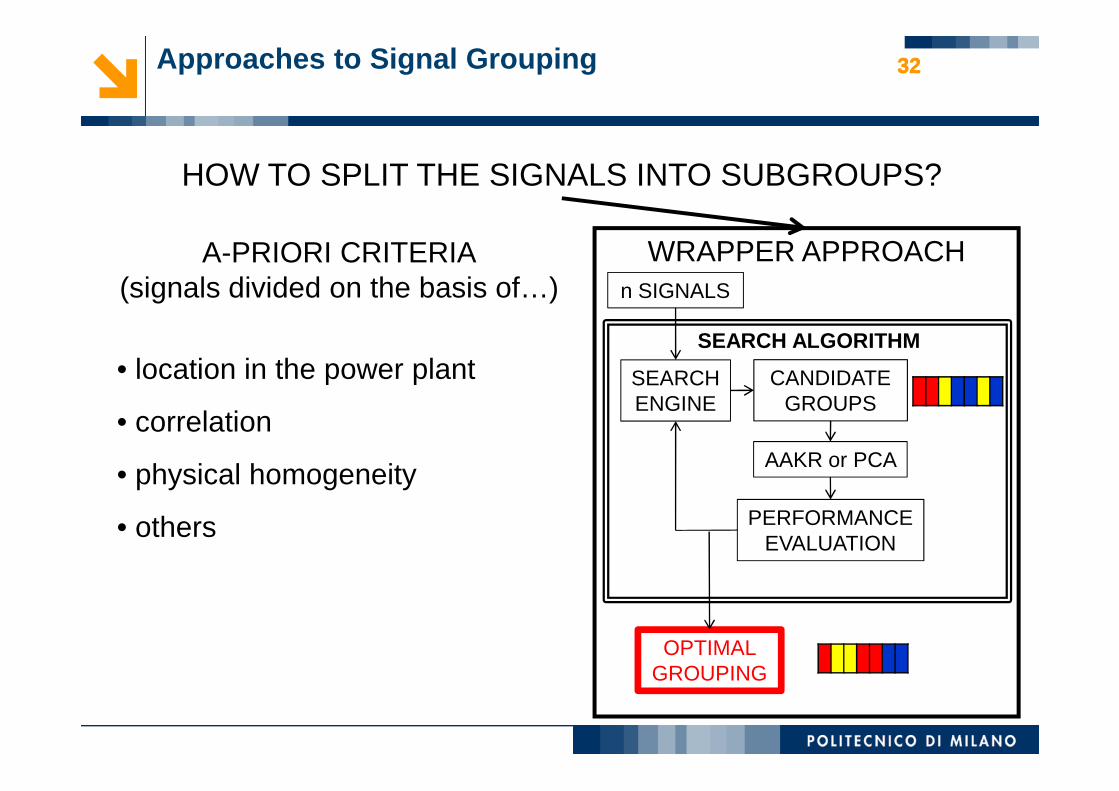
32Approaches to Signal Grouping 32
WRAPPER APPROACHn SIGNALS
SEARCH ENGINE
CANDIDATE GROUPS
SEARCH ALGORITHM
HOW TO SPLIT THE SIGNALS INTO SUBGROUPS?
A-PRIORI CRITERIA(signals divided on the basis of…)
• location in the power plantENGINE GROUPS
PERFORMANCE EVALUATION
OPTIMAL GROUPING
AAKR or PCA
• correlation
• physical homogeneity
• others
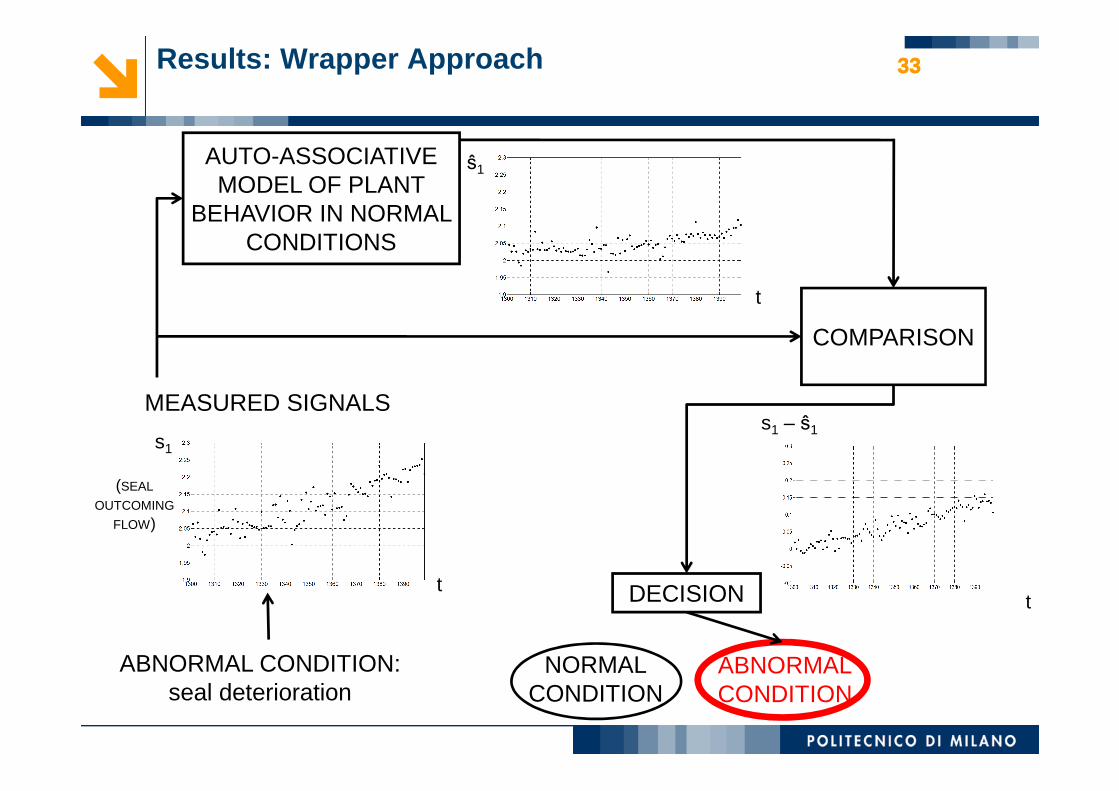
33Results: Wrapper Approach 33
COMPARISON
ŝ1
t
MEASURED SIGNALS
AUTO-ASSOCIATIVE MODEL OF PLANT
BEHAVIOR IN NORMAL CONDITIONS
DECISION t
s1 – ŝ1
t
s1
ABNORMAL CONDITION: seal deterioration
(SEAL
OUTCOMING
FLOW)
MEASURED SIGNALS
NORMALCONDITION
ABNORMALCONDITION

34
FAULT CLASSIFICATION
Applications
• Application 1: Fault diagnosis in a boiling water reactor feedwater system (Norway, in collaboration with HRP)
• Application 2: Multiple faults diagnosis in rotating machinery with ensemble systems
• Application 3: Fault diagnosis in a nuclear steam turbine (France, in collaboration with EDF)
35
36
FAULT CLASSIFICATION
APPLICATION 1: BOILING WATER REACTOR FEEDWATER SYSTEM
FAULT CLASSIFICATION

Problem statement: BWR feedwater system (Swedish Forsmark-3)
F18F16
37
F11F12
F13F15
F14
F17
[1] E. Zio, P. Baraldi, G. Gola, D. Roverso, M. Hoffmann “Diagnosing faults in nuclear components by an ensemble of feature-diverse fuzzy classifiers”, International Journal of Nuclear Knowledge Management (IJNKM), Vol. 2 (3), pp 224-238, 2007.[2] P. Baraldi, R. Razavi-Far, E. Zio, "Classifier-Ensemble Incremental-Learning Procedure for Nuclear Transient Identification at Different Operational Conditions", Reliability Engineering and System Safety, Vol. 96, pp. 480–488, 2011.
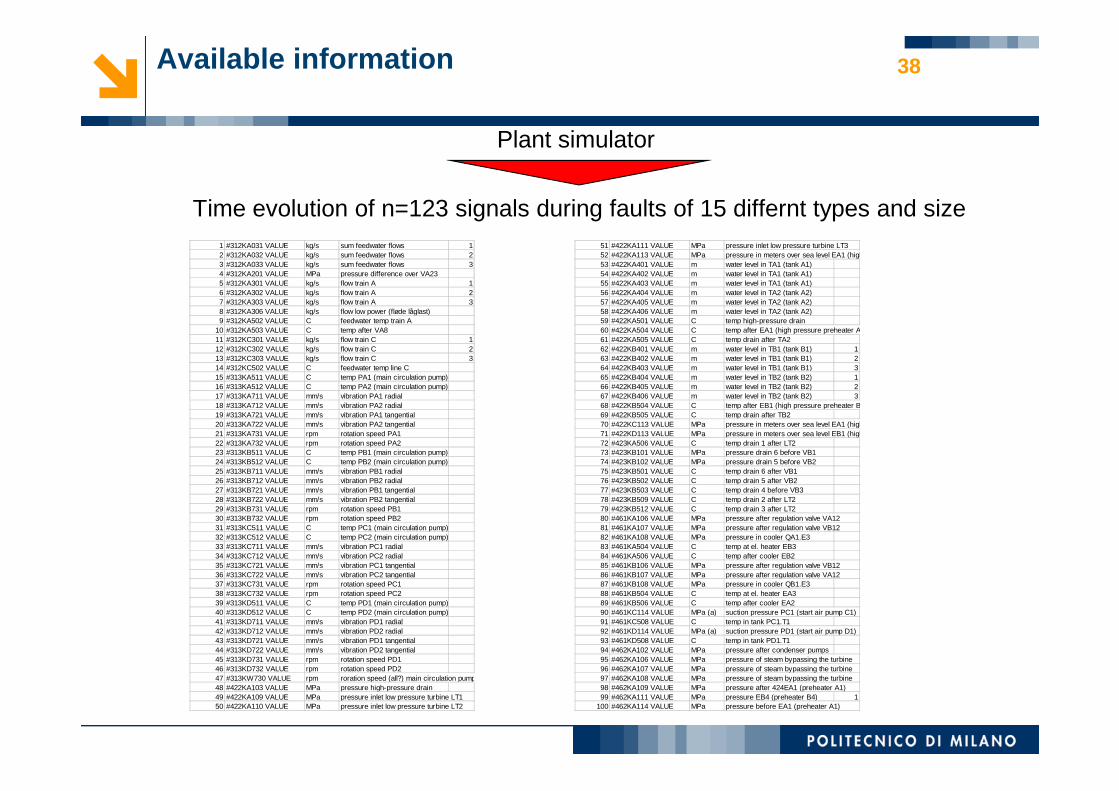
Available information
Plant simulator
Time evolution of n=123 signals during faults of 15 differnt types and size51 #422KA111 VALUE MPa pressure inlet low pressure turbine LT352 #422KA113 VALUE MPa pressure in meters over sea level EA1 (high pressure preheater A1)53 #422KA401 VALUE m water level in TA1 (tank A1)54 #422KA402 VALUE m water level in TA1 (tank A1)55 #422KA403 VALUE m water level in TA1 (tank A1)56 #422KA404 VALUE m water level in TA2 (tank A2)57 #422KA405 VALUE m water level in TA2 (tank A2)58 #422KA406 VALUE m water level in TA2 (tank A2)59 #422KA501 VALUE C temp high-pressure drain60 #422KA504 VALUE C temp after EA1 (high pressure preheater A1)61 #422KA505 VALUE C temp drain after TA262 #422KB401 VALUE m water level in TB1 (tank B1) 163 #422KB402 VALUE m water level in TB1 (tank B1) 264 #422KB403 VALUE m water level in TB1 (tank B1) 365 #422KB404 VALUE m water level in TB2 (tank B2) 166 #422KB405 VALUE m water level in TB2 (tank B2) 267 #422KB406 VALUE m water level in TB2 (tank B2) 3
1 #312KA031 VALUE kg/s sum feedwater flows 12 #312KA032 VALUE kg/s sum feedwater flows 23 #312KA033 VALUE kg/s sum feedwater flows 34 #312KA201 VALUE MPa pressure difference over VA235 #312KA301 VALUE kg/s flow train A 16 #312KA302 VALUE kg/s flow train A 27 #312KA303 VALUE kg/s flow train A 38 #312KA306 VALUE kg/s flow low power (fløde låglast)9 #312KA502 VALUE C feedwater temp train A
10 #312KA503 VALUE C temp after VA811 #312KC301 VALUE kg/s flow train C 112 #312KC302 VALUE kg/s flow train C 213 #312KC303 VALUE kg/s flow train C 314 #312KC502 VALUE C feedwater temp line C15 #313KA511 VALUE C temp PA1 (main circulation pump)16 #313KA512 VALUE C temp PA2 (main circulation pump)17 #313KA711 VALUE mm/s vibration PA1 radial
38
67 #422KB406 VALUE m water level in TB2 (tank B2) 368 #422KB504 VALUE C temp after EB1 (high pressure preheater B1)69 #422KB505 VALUE C temp drain after TB270 #422KC113 VALUE MPa pressure in meters over sea level EA1 (high pressure preheater A1)71 #422KD113 VALUE MPa pressure in meters over sea level EB1 (high pressure preheater B1)72 #423KA506 VALUE C temp drain 1 after LT273 #423KB101 VALUE MPa pressure drain 6 before VB174 #423KB102 VALUE MPa pressure drain 5 before VB275 #423KB501 VALUE C temp drain 6 after VB176 #423KB502 VALUE C temp drain 5 after VB277 #423KB503 VALUE C temp drain 4 before VB378 #423KB509 VALUE C temp drain 2 after LT279 #423KB512 VALUE C temp drain 3 after LT280 #461KA106 VALUE MPa pressure after regulation valve VA1281 #461KA107 VALUE MPa pressure after regulation valve VB1282 #461KA108 VALUE MPa pressure in cooler QA1.E383 #461KA504 VALUE C temp at el. heater EB384 #461KA506 VALUE C temp after cooler EB285 #461KB106 VALUE MPa pressure after regulation valve VB1286 #461KB107 VALUE MPa pressure after regulation valve VA1287 #461KB108 VALUE MPa pressure in cooler QB1.E388 #461KB504 VALUE C temp at el. heater EA389 #461KB506 VALUE C temp after cooler EA290 #461KC114 VALUE MPa (a) suction pressure PC1 (start air pump C1)91 #461KC508 VALUE C temp in tank PC1.T192 #461KD114 VALUE MPa (a) suction pressure PD1 (start air pump D1)93 #461KD508 VALUE C temp in tank PD1.T194 #462KA102 VALUE MPa pressure after condenser pumps95 #462KA106 VALUE MPa pressure of steam bypassing the turbine96 #462KA107 VALUE MPa pressure of steam bypassing the turbine97 #462KA108 VALUE MPa pressure of steam bypassing the turbine98 #462KA109 VALUE MPa pressure after 424EA1 (preheater A1)99 #462KA111 VALUE MPa pressure EB4 (preheater B4) 1
100 #462KA114 VALUE MPa pressure before EA1 (preheater A1)
17 #313KA711 VALUE mm/s vibration PA1 radial18 #313KA712 VALUE mm/s vibration PA2 radial19 #313KA721 VALUE mm/s vibration PA1 tangential20 #313KA722 VALUE mm/s vibration PA2 tangential21 #313KA731 VALUE rpm rotation speed PA122 #313KA732 VALUE rpm rotation speed PA223 #313KB511 VALUE C temp PB1 (main circulation pump)24 #313KB512 VALUE C temp PB2 (main circulation pump)25 #313KB711 VALUE mm/s vibration PB1 radial26 #313KB712 VALUE mm/s vibration PB2 radial27 #313KB721 VALUE mm/s vibration PB1 tangential28 #313KB722 VALUE mm/s vibration PB2 tangential29 #313KB731 VALUE rpm rotation speed PB130 #313KB732 VALUE rpm rotation speed PB231 #313KC511 VALUE C temp PC1 (main circulation pump)32 #313KC512 VALUE C temp PC2 (main circulation pump)33 #313KC711 VALUE mm/s vibration PC1 radial34 #313KC712 VALUE mm/s vibration PC2 radial35 #313KC721 VALUE mm/s vibration PC1 tangential36 #313KC722 VALUE mm/s vibration PC2 tangential37 #313KC731 VALUE rpm rotation speed PC138 #313KC732 VALUE rpm rotation speed PC239 #313KD511 VALUE C temp PD1 (main circulation pump)40 #313KD512 VALUE C temp PD2 (main circulation pump)41 #313KD711 VALUE mm/s vibration PD1 radial42 #313KD712 VALUE mm/s vibration PD2 radial43 #313KD721 VALUE mm/s vibration PD1 tangential44 #313KD722 VALUE mm/s vibration PD2 tangential45 #313KD731 VALUE rpm rotation speed PD146 #313KD732 VALUE rpm rotation speed PD247 #313KW730 VALUE rpm roration speed (all?) main circulation pumps48 #422KA103 VALUE MPa pressure high-pressure drain49 #422KA109 VALUE MPa pressure inlet low pressure turbine LT150 #422KA110 VALUE MPa pressure inlet low pressure turbine LT2
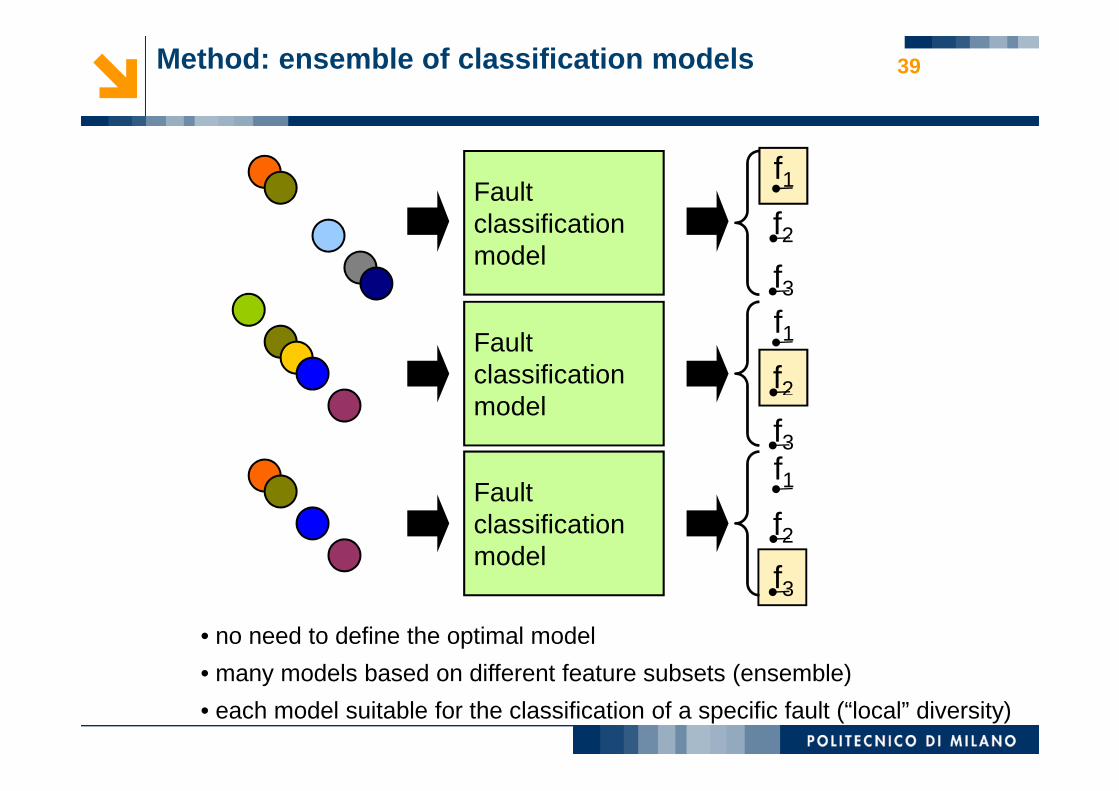
Method: ensemble of classification models 39
f1
f2f3f1
f2
Fault classification model
Fault classification model
f3f1
f2f3
• no need to define the optimal model
• many models based on different feature subsets (ensemble)
• each model suitable for the classification of a specific fault (“local” diversity)
model
Fault classification model
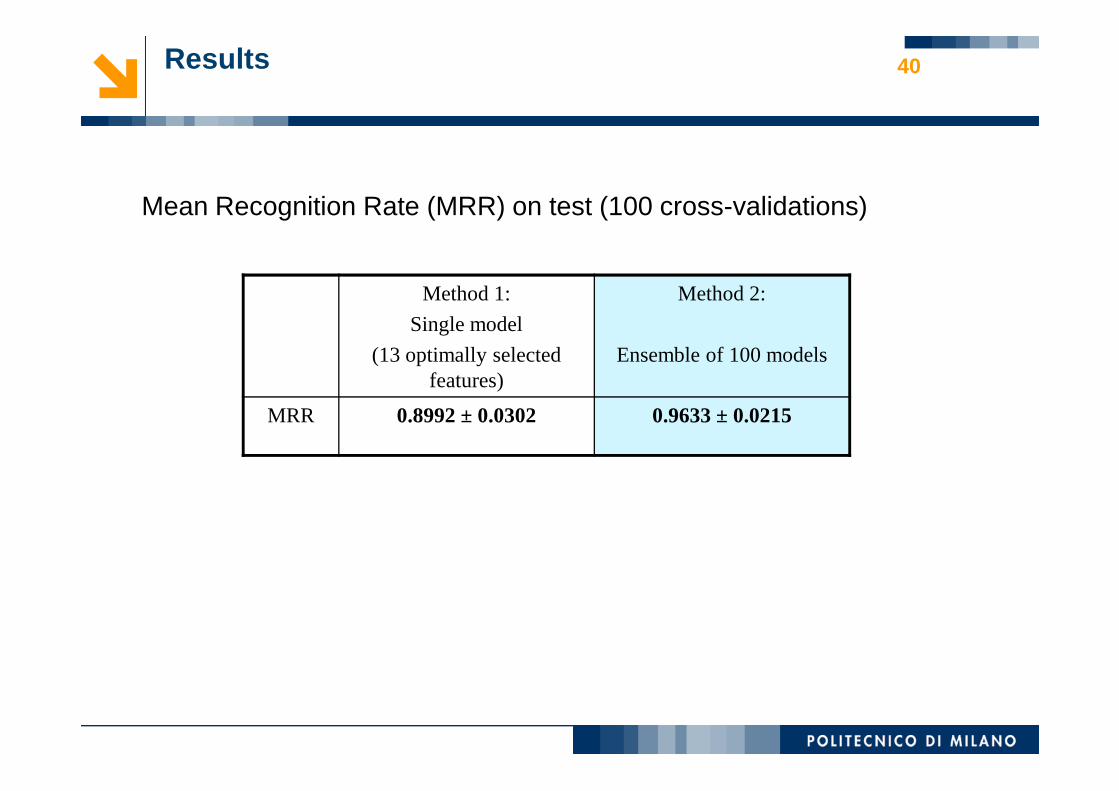
Results
Method 1:
Single model
(13 optimally selected features)
Method 2:
Ensemble of 100 models
Mean Recognition Rate (MRR) on test (100 cross-validations)
40
MRR 0.8992 ± 0.0302 0.9633 ± 0.0215
APPLICATION 3: FAULT DIAGNOSIS IN
41
FAULT CLASSIFICATION
A NUCLEAR STEAM TURBINE (UNSUPERVISED CLUSTERING)
Ongoing contract funded by EDF - Eletricite de France R&D

42
FAULT PROGNOSIS
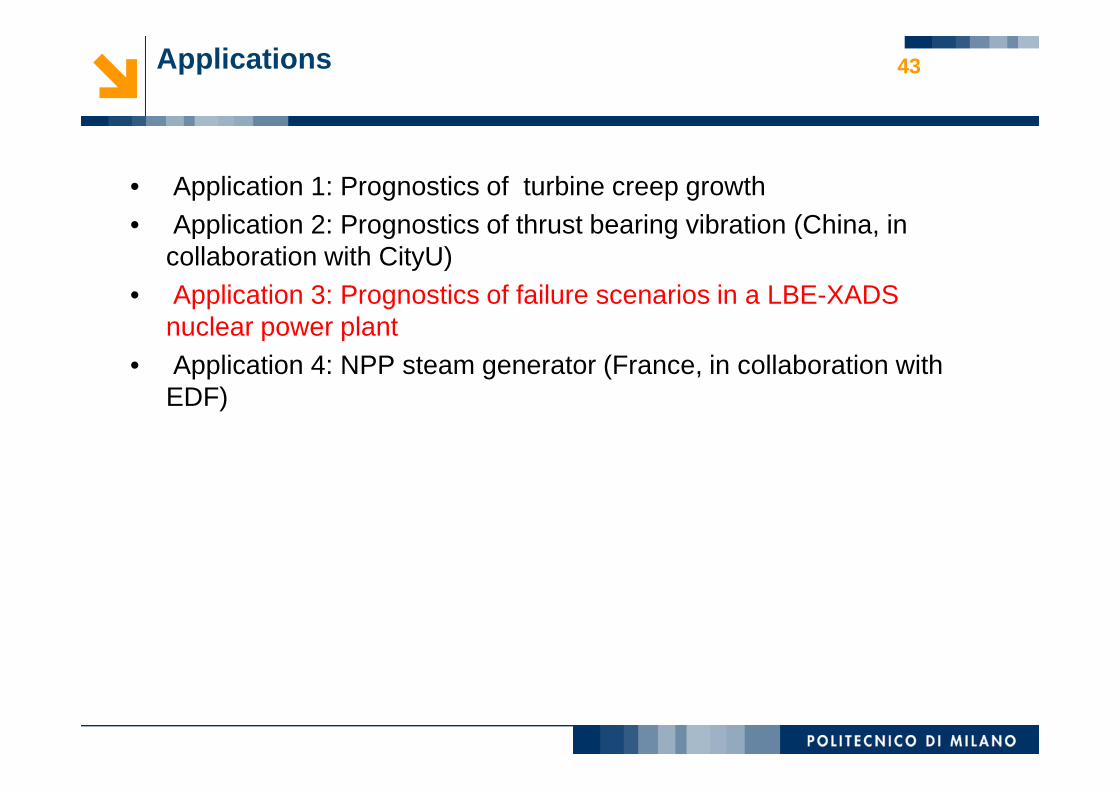
Applications
• Application 1: Prognostics of turbine creep growth• Application 2: Prognostics of thrust bearing vibration (China, in
collaboration with CityU)• Application 3: Prognostics of failure scenarios in a LBE-XADS
nuclear power plant• Application 4: NPP steam generator (France, in collaboration with
EDF)
43
EDF)
FAULT PROGNOSIS
44
APPLICATION 3: PROGNOSTICS OF FAILURE SCENARIOS IN A LBE -XADS NUCLEAR POWER PLANT
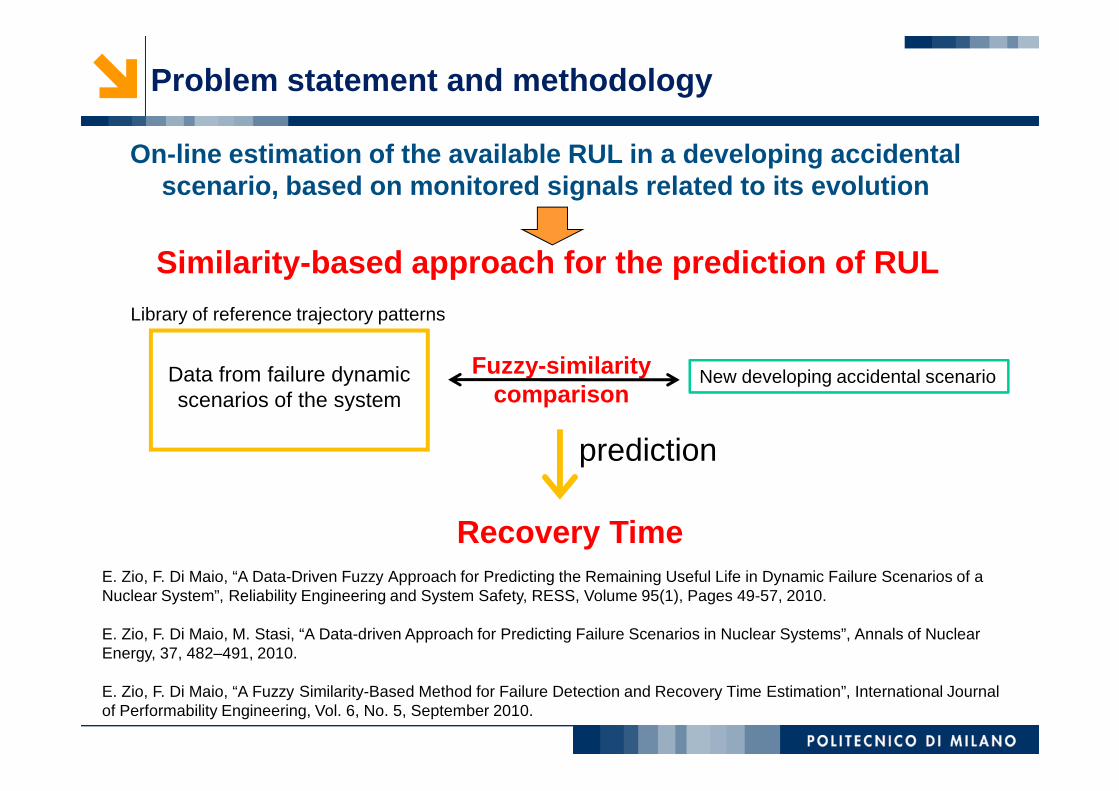
Similarity-based approach for the prediction of RUL
Problem statement and methodology
Data from failure dynamic scenarios of the system
Library of reference trajectory patterns
New developing accidental scenarioFuzzy-similarity comparison
On-line estimation of the available RUL in a developing accidental scenario, based on monitored signals related to its evolution
Recovery Time
scenarios of the system comparison
prediction
E. Zio, F. Di Maio, “A Data-Driven Fuzzy Approach for Predicting the Remaining Useful Life in Dynamic Failure Scenarios of a Nuclear System”, Reliability Engineering and System Safety, RESS, Volume 95(1), Pages 49-57, 2010.
E. Zio, F. Di Maio, M. Stasi, “A Data-driven Approach for Predicting Failure Scenarios in Nuclear Systems”, Annals of Nuclear Energy, 37, 482–491, 2010.
E. Zio, F. Di Maio, “A Fuzzy Similarity-Based Method for Failure Detection and Recovery Time Estimation”, International Journal of Performability Engineering, Vol. 6, No. 5, September 2010.
46
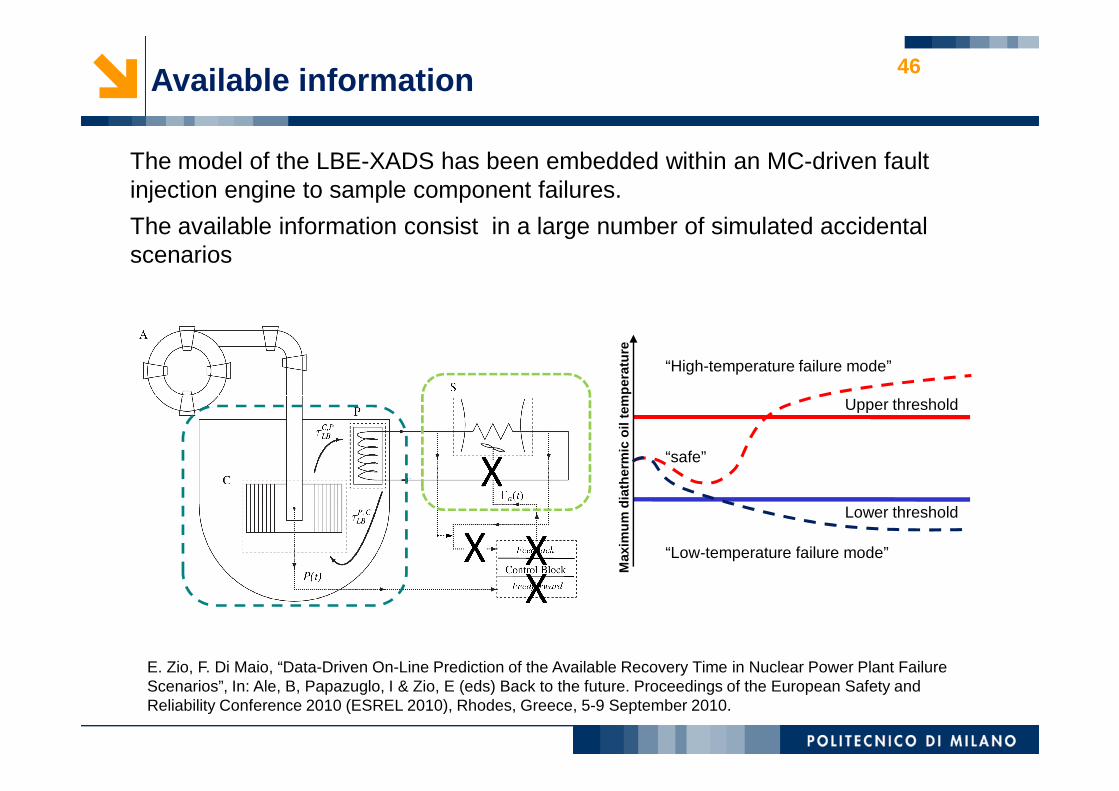
The model of the LBE-XADS has been embedded within an MC-driven fault injection engine to sample component failures.
The available information consist in a large number of simulated accidental scenarios
Max
imum
dia
ther
mic
oil
tem
pera
ture
Upper threshold
“High-temperature failure mode”
Available information
Max
imum
dia
ther
mic
oil
tem
pera
ture
Upper threshold
Lower threshold
“Low-temperature failure mode”
“safe”
E. Zio, F. Di Maio, “Data-Driven On-Line Prediction of the Available Recovery Time in Nuclear Power Plant FailureScenarios”, In: Ale, B, Papazuglo, I & Zio, E (eds) Back to the future. Proceedings of the European Safety and Reliability Conference 2010 (ESREL 2010), Rhodes, Greece, 5-9 September 2010.
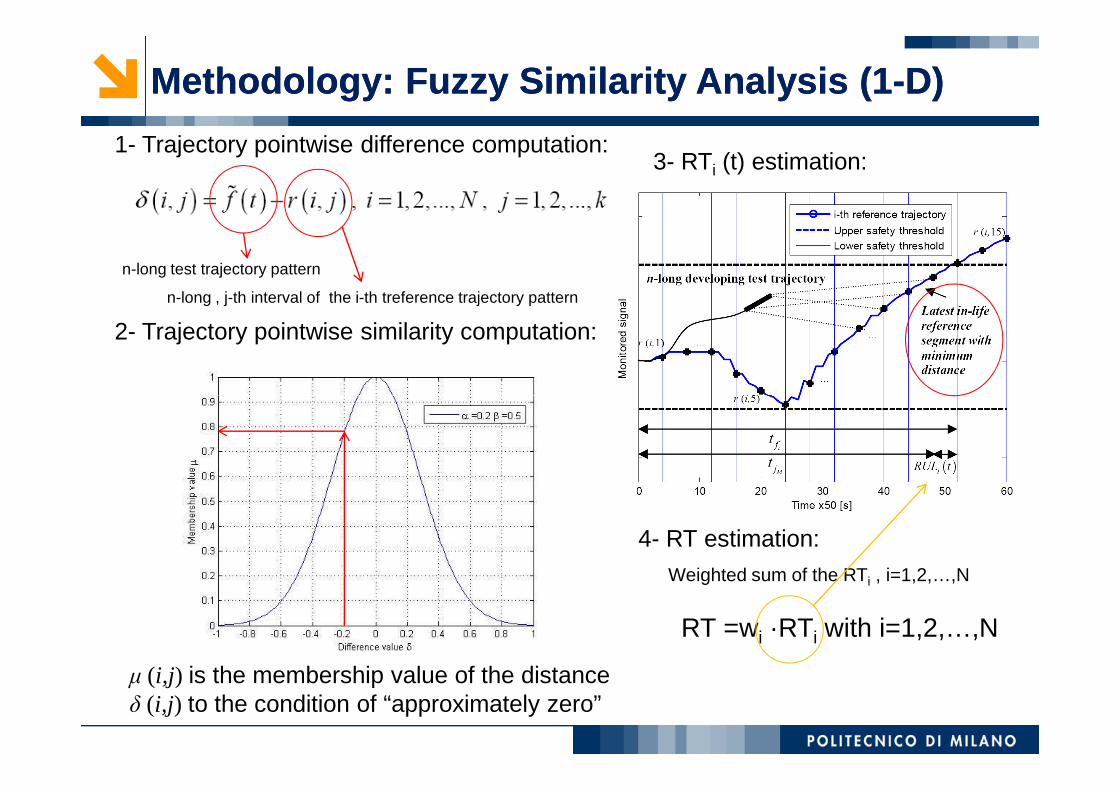
Methodology: Fuzzy Similarity Analysis (1Methodology: Fuzzy Similarity Analysis (1--D) D)
1- Trajectory pointwise difference computation:
n-long test trajectory pattern
n-long , j-th interval of the i-th treference trajectory pattern
2- Trajectory pointwise similarity computation:
3- RTi (t) estimation:
µ (i,j) is the membership value of the distanceδ (i,j) to the condition of “approximately zero”
4- RT estimation:Weighted sum of the RTi , i=1,2,…,N
RT =wi ·RTi with i=1,2,…,N
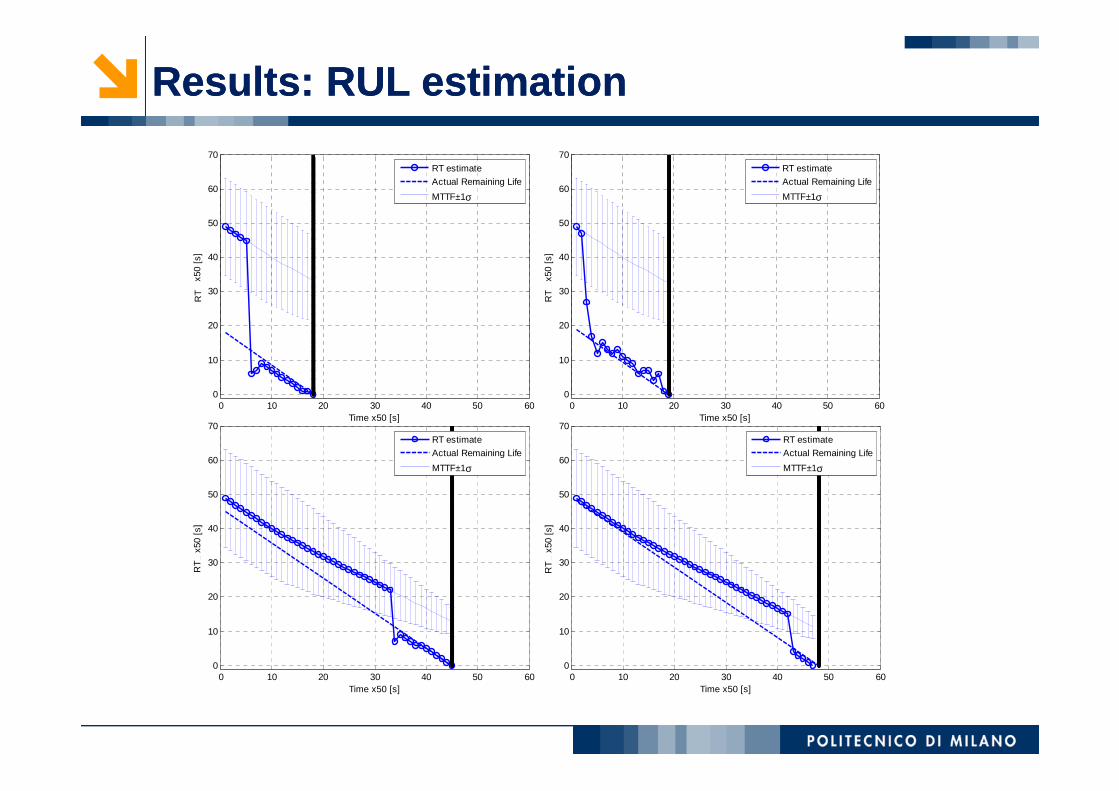
Results: Results: RUL RUL estimationestimation
0
10
20
30
40
50
60
70
RU
L x5
0 [s
]
RT estimate
Actual Remaining Life
MTTF±1σ
0
10
20
30
40
50
60
70
RU
L x5
0 [s
]
RT estimate
Actual Remaining Life
MTTF±1σR
T
RT
0 10 20 30 40 50 600
Time x50 [s]
0 10 20 30 40 50 60
0
Time x50 [s]
0 10 20 30 40 50 600
10
20
30
40
50
60
70
Time x50 [s]
RU
L x5
0 [s
]
RT estimate
Actual Remaining Life
MTTF±1σ
0 10 20 30 40 50 600
10
20
30
40
50
60
70
Time x50 [s]
RU
L x5
0 [s
]
RT estimate
Actual Remaining Life
MTTF±1σ
RT
RT

49
CONCLUSIONS

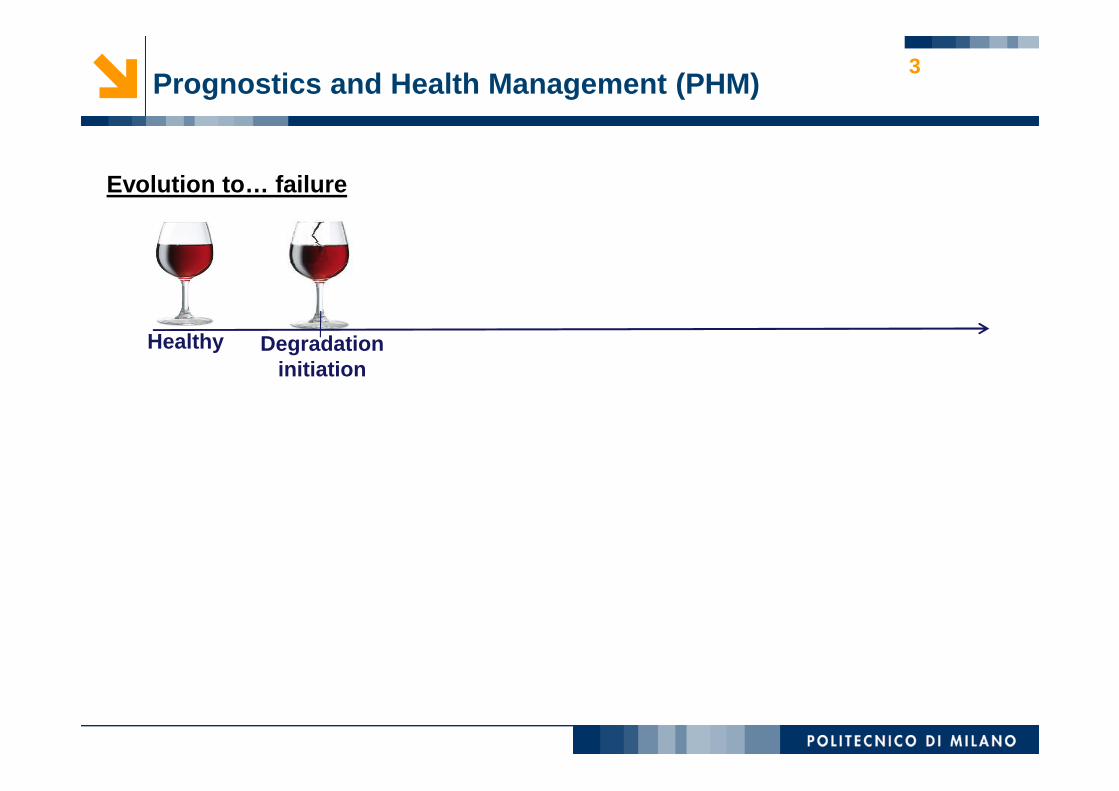
Prognostics and Health Management (PHM)50
Healthy
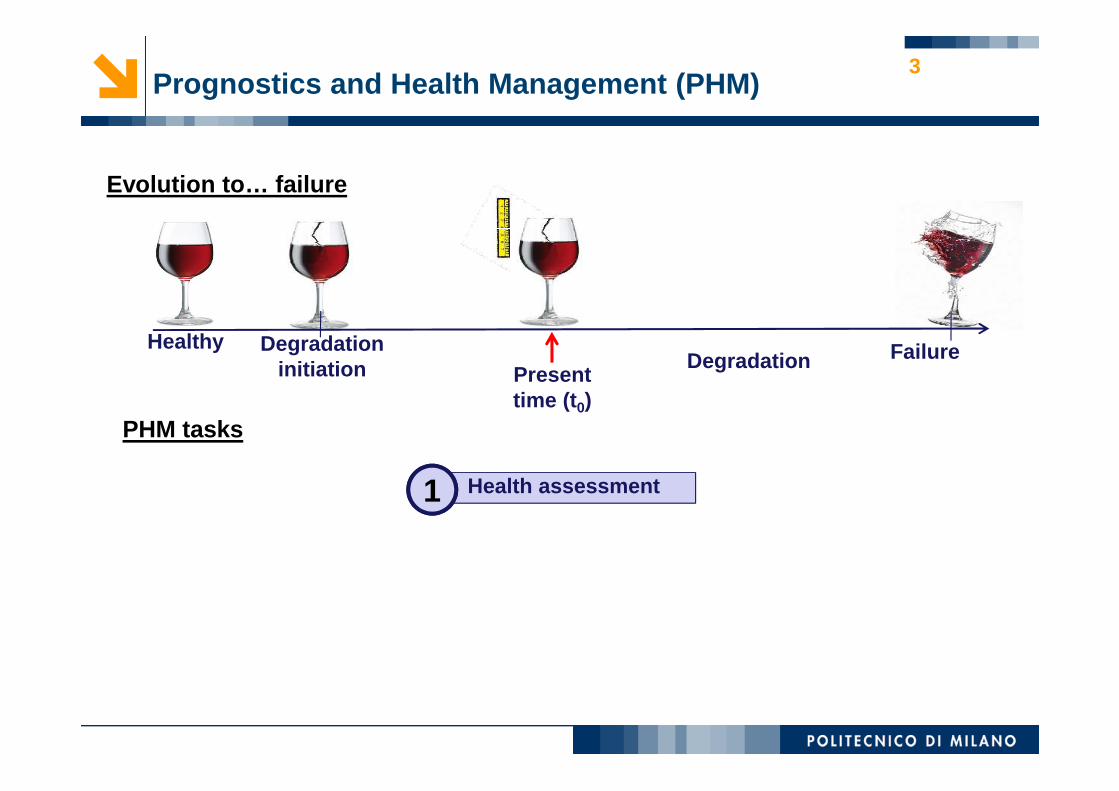
Evolution to… failure
Prognostics and Health Management (PHM)
Healthy Degradation initiation
Evolution to… failure
3
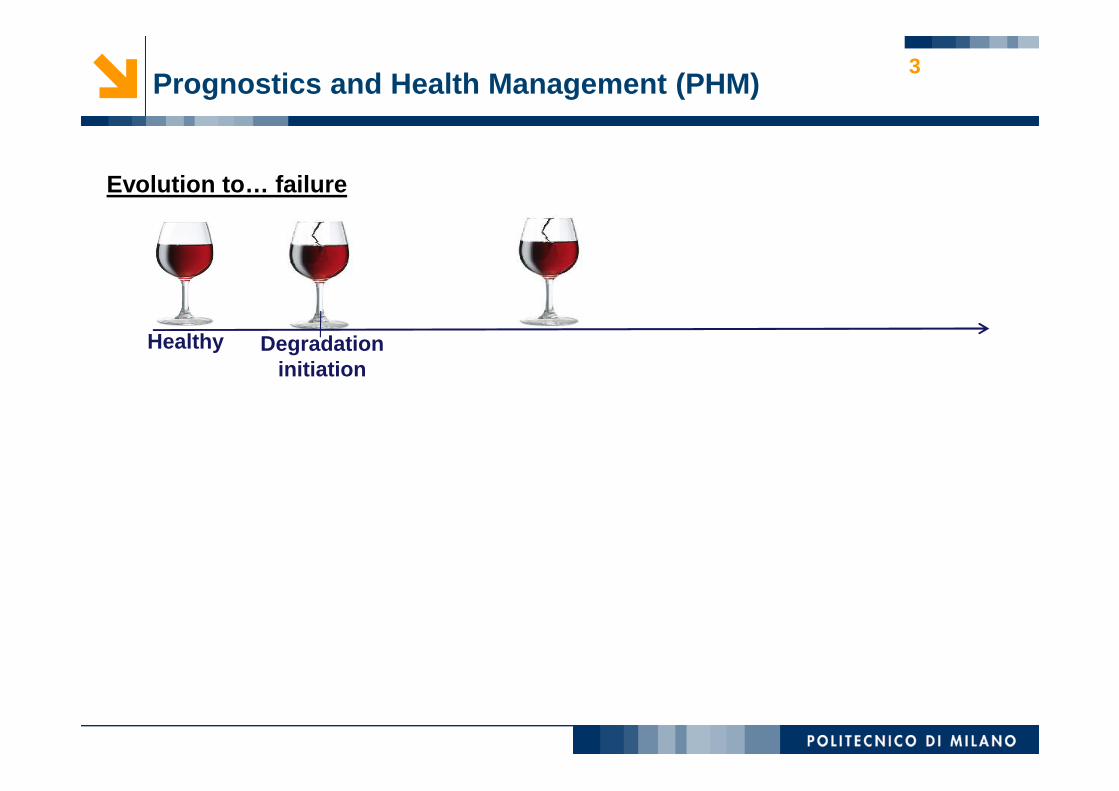
Prognostics and Health Management (PHM)3
Healthy Degradation initiation
Evolution to… failure
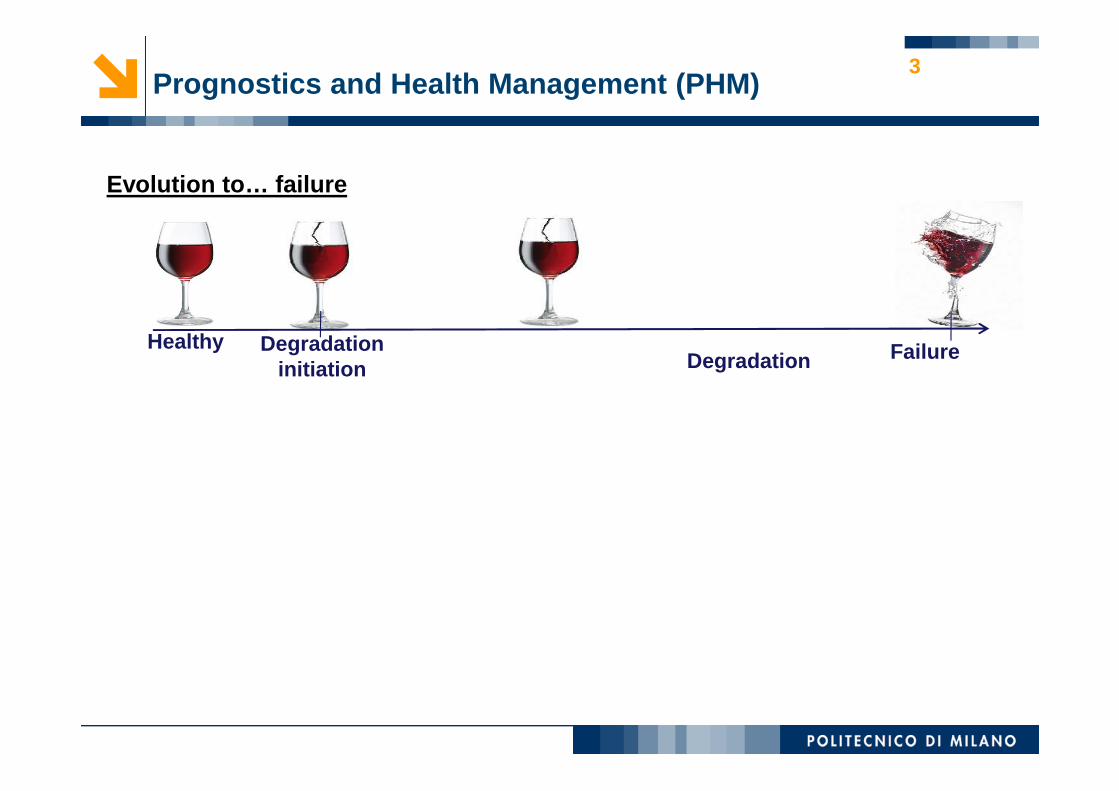
Prognostics and Health Management (PHM)3
HealthyDegradation
Degradation initiation
Evolution to… failure
Failure

Degradation Failure
Prognostics and Health Management (PHM)3
Healthy Degradation initiation
Evolution to… failure
Present time (t )time (t0)
PHM tasks
Prognostics and Health Management (PHM)3
Healthy Degradation initiation
Evolution to… failure
Present time (t )
Degradation Failure
PHM taskstime (t0)
Health assessment1
Prognostics and Health Management (PHM)3
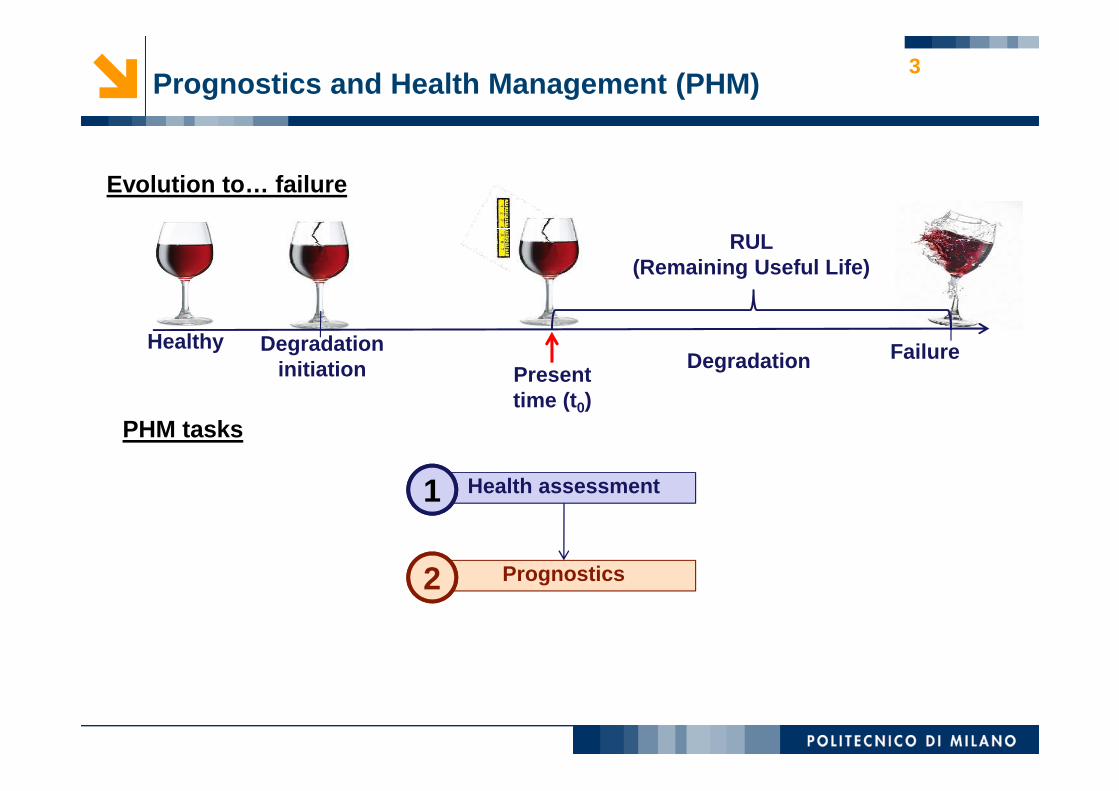
HealthyDegradation
Degradation initiation
Evolution to… failure
FailurePresent time (t )
RUL (Remaining Useful Life)
PHM taskstime (t0)
Health assessment
Prognostics
1
2
Prognostics and Health Management (PHM)3
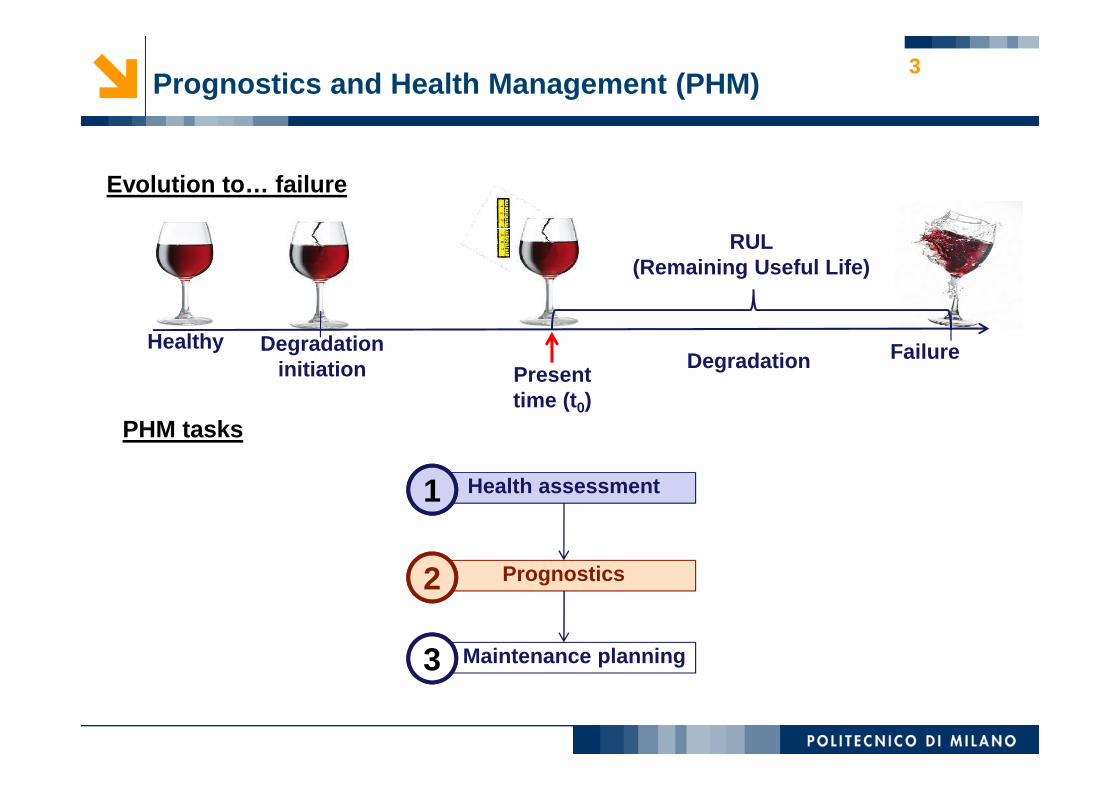
HealthyDegradation
Degradation initiation
Evolution to… failure
FailurePresent time (t )
RUL (Remaining Useful Life)
PHM taskstime (t0)
Health assessment
Prognostics
Maintenance planning
1
2
3

“Nuclear” Characteristics
� Large number of signals measured
� Fault information scarcely available
58
� Fault information scarcely available
� Safety requirements

59
PERSPECTIVES

PHM in current nuclear installations
Current power plants:� license extension
• Most operating NPPs have obtained, are applying, or intend to apply for a 20 years license extension
• In 2030-2040 they will begin reaching the end of their first license extension• 2nd license extension?
60
� degradation and obsolescence � decrease power production & safety
� condition-based and predictive maintenance approaches
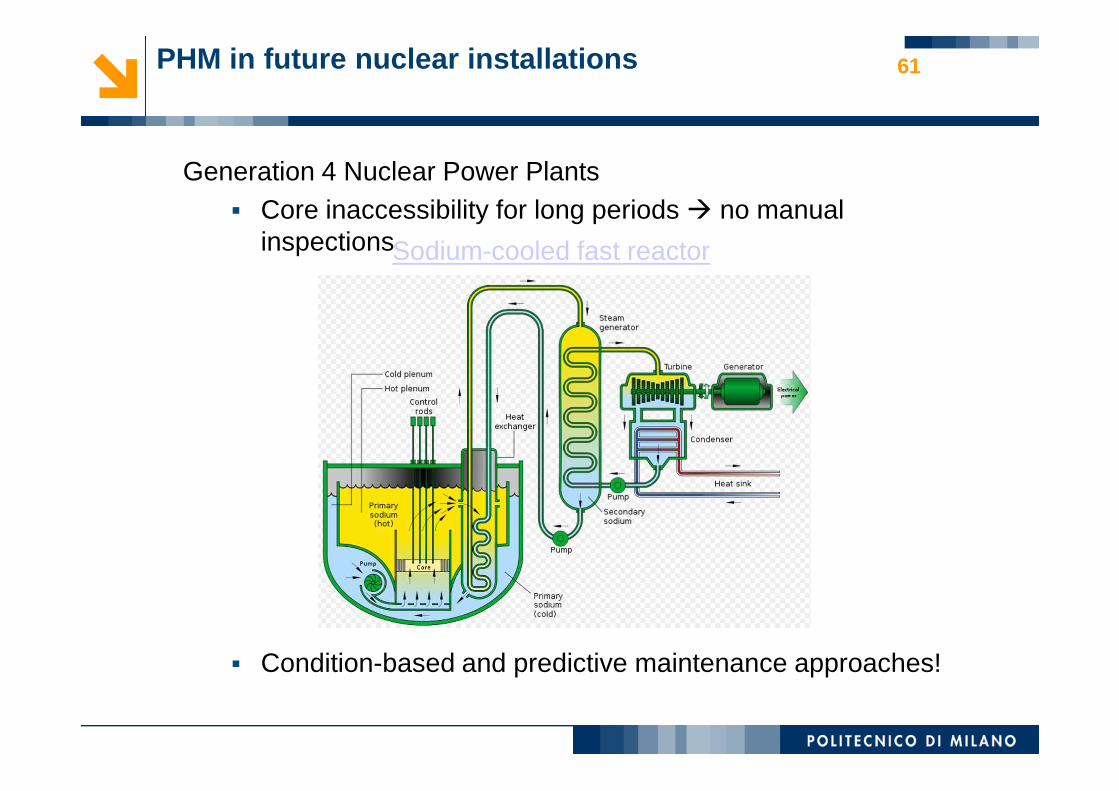
PHM in future nuclear installations
Generation 4 Nuclear Power Plants� Core inaccessibility for long periods � no manual
inspections
61
Sodium-cooled fast reactor
� Condition-based and predictive maintenance approaches!

62


![NASA Prognostics[1]](https://static.fdocuments.in/doc/165x107/547f2aaab4af9fa5158b5833/nasa-prognostics1.jpg)


