Graphic Communication Colour Theory. Primary Colours Red Yellow Blue.

How to distinguish elastically scattered light from Stokes shifted light for solid-state
lighting?
M. Meretska,1 A. Lagendijk,1 H. Thyrrestrup,1 A. P. Mosk,1 W. L. IJzerman,2 and W.
L. Vos1
1)Complex Photonic Systems (COPS), MESA+ Institute for Nanotechnology,
University of Twente, P. O. Box 217, Enschede 7500 AE,
The Netherlands
2)Philips Lighting, High Tech Campus 44, Eindhoven 5656 AE,
The Netherlands
(Dated: 3 November 2015)
We have studied the transport of light through phosphor diffuser plates that are used
in commercial solid-state lighting modules (Fortimo). These polymer plates contain
YAG : Ce+3 phosphor particles that elastically scatter light and Stokes shifts it in the
visible wavelength range (400-700 nm). We excite the phosphor with a narrowband
light source, and measure spectra of the outgoing light. The Stokes shifted light is
separated from the elastically scattered light in the measured spectra and using this
technique we isolate the elastic transmission of the plates. This result allows us to
extract the transport mean free path ltr over the full wavelength range by employing
diffusion theory. Simultaneously, we determine the absorption mean free path labs
in the wavelength range 400 to 530 nm where YAG : Ce+3 absorbs. The diffuse
absorption µa = 1labs
spectrum is qualitative similar to the absorption coefficient
of YAG : Ce+3 in powder, with the µa spectrum being wider than the absorption
coefficient. We propose a design rule for the solid-state lighting diffuser plates.
PACS numbers: 45.15.Eq Optical system design, 42.25.Fx Diffraction and scattering,
42.25.Dd Wave propagation in random media
1
arX
iv:1
511.
0046
7v1
[ph
ysic
s.op
tics]
2 N
ov 2
015

I. INTRODUCTION
Energy efficient generation of white light is attracting much attention in recent years,
since it is important for lighting and for medical and biological applications1–10. One of the
main directions is the technology of solid-state lighting6–8,10, that was recognized with the
2014 Nobel Prize in physics11. Solid-state lighting provides superior energy efficiency and
flexibility in terms of color temperature. Conventional solid-state lighting employs a blue
semiconductor light emitting diode (LED) in combination with a phosphor layer to realize
a white-light emitting diode. The phosphor layer plays two important roles in a white LED:
first, the phosphor layer absorbs blue light emitted by the LED, and efficiently converts part
of the blue light into the additional colors green, yellow and red light. The desired mixture of
blue, green, yellow and red light results in white outgoing light. Secondly, the phosphor layer
multiply scatters all colors, thereby diffusing the outgoing light, resulting in an even lighting
without hot spots, and with a uniform angular color distribution, as required for lighting
applications. In addition the scatterers enhance the color conversion by increasing the path
blue light travels in phosphor layer. In state-of-the art solid-state lighting technology the
phosphor layer is engineered to have a complex internal structure8,10. Light inside this layer
may be multiply scattered not only by phosphor, but also by other scatterers.
In spite of the wide use of solid-state lighting in everyday life, and the apparent simplicity
of the physical processes occurring in the phosphor layer, there is no analytical theory that
predicts the spectra of white LEDs. The main challenge arises from the lack of physical
understanding of systems, where multiple scattering and absorption of blue light coexist with
emission of light in a broadband wavelength range. Typically, numerical methods such as ray-
tracing and Monte Carlo techniques are used10,12–14, that do not have the predictive power
of analytical theory. These simulations require a set of heuristic parameters that is derived
from measurements on LEDs with a wide range of structural and optical parameters. The
resulting heuristic parameters are often adjusted, thereby further hampering the predictive
power of these methods. Moreover, simulations are time consuming and computationally
demanding. All these aspects hamper the efficient design of new white LEDs.
In this paper we - for the first time - extract optical properties of the phosphor layers
typically used for the solid-state lighting in the visible wavelength range (400-700 nm). We
use a narrowband light source and record the spectra of the transmitted light through the
2

phosphor layer. The transmitted light contain both elastically scattered light and Stokes
shifted light; they are separated spectrally. We extract the diffuse transmission from the
elastically scattered light, and calculate the optical properties of the phosphor layer using the
diffusion theory. Using a broadband light source a similar approach was previously applied
to calculate optical properties of the diffuser plates15, and phosphor plates16. This approach
fails when Stokes shifted light overlaps spectrally with the elastically scattered light. In
Fig. 1(c) we show the overlap region for the plates studied here in x − y chromaticity
diagram. This spectral range correspond to the green part of the white LED spectrum
where the human eye is most sensitive17. We present a new measurement technique that
allow us to separate the elastically scattered and Stokes shifted light in the overlap range
for phosphor diffuser plates that are used in commercial white LEDs. As a result we now
close the ”the green gap” and extract the relevant transport and absorption parameters for
solid-state lighting in the whole visible spectral range.
We use analytical theory originating from nanophotonics, wherein propagation of light
is described from first principles18–22. Such ab initio theory supplies fundamental physical
insights on the light propagation inside solid-state lighting device15,16. Extracting the optical
parameters from theory are less time consuming than performing many simulations, and
more importantly, the resulting parameters are robust and predictions can be made beyond
the parameter range that was initially studied. For instance, knowledge of the absorption
spectra provides us with the design guidelines for the solid-state light units. The design
parameters such as the thickness of the diffuse plates and the phosphor concentration can
be directly extracted from the absorption spectra depending on the blue pump wavelength
of a white LED.
II. THEORY
A. Total transmission with energy conversion
Multiple light scattering is usually studied by measuring the total transmission through a
slab of a complex, multiple scattering medium23,24. Total transmission, or diffuse transmis-
sion, is the transmission of an incident collimated beam with intensity I0(λ) that is multiple
scattered and integrated over all outgoing angles at which light exits from a medium. The
3

total transmission carries information on the transport mean free path ltr and on the ab-
sorption mean free path labs, which are the crucial parameters that describe multiple light
scattering20,25–29. The transport mean free path ltr is the distance it takes for the direction
of light to become randomized while performing a random walk in a scattering medium. The
absorption mean free path labs is the distance it takes for light to be absorbed to a fraction
(1/e) while light performs a random walk in a scattering medium.
Phosphor particles do not only scatter light, but also convert blue light into other colors
by absorbing blue and re-emitting other colors of light. Therefore, from here on we will refer
to the measured total transmission in presence of energy conversion as the total relative
intensity Trel(λ)
Trel(λ) =Itot(λ)
I0(λ), (1)
where Itot(λ) is the integrated intensity that is collected at the back side of the diffusion
plate. In the emission range of a phosphor (λ ≥ λl) the collected intensity Itot(λ) can be
written as a sum of the diffuse intensity I and the Stokes shifted intensity Iem(λ). Thus, the
total relative intensity can be separated into two parts16
Trel(λ) = T (λ) + Tem(λ) =I(λ) + Iem(λ)
I0(λ), (2)
where the first term T is the total transmission, and the second term Tem(λ) is the emission
that accounts for the energy conversion of light in the diffuse absorptive medium. In Ref. 16
these two terms could not be distinguished in the overlap range λl < λ < λr.
The central question in this paper is how to distinguish the total transmission T (λ) from
the total relative intensity Trel(λ) as this allows one to obtain both the transport mean free
path ltr and the absorption mean free path labs. To access the total transmission we employ
a tunable narrowband light source and spectrally resolve the narrowband transmitted light.
Since the light that is converted by the phosphor exhibits a Stokes shift Iem(λ), this part
Tem(λ) of the total relative intensity is filtered, hence we obtain the desired total transmission
T (λ) that we interpret with diffusion theory.
B. Total transmission in absence of energy conversion
According to diffusion theory for light, the total transmission T (λ) through a slab, even
in the presence of absorption, is a function of the slab thickness L, the wavelength λ, the
4

transport mean free path ltr, and the absorption labs mean free path, and can be expressed
as2530:
T (L, λi, ltr, labs) = Q−1 [sinh (µazp) + µazecosh (µazp)] , (3)
with
Q (L, λi, ltr, labs) ≡(1 + µ2
az2e
)sinh (µaL) + 2µazecosh (µaL) , (4)
where the extrapolation lengths are equal to
ze1 (ltr) = ze2 (ltr) = ze (ltr) =2
3ltr
1 +R1,2
1 −R1,2
. (5)
Here zp is the diffuse penetration depth of light, µa ≡ 1/labs the inverse absorption mean free
path, R1,2 is the angular and polarization averaged reflectivity of the respective boundaries31.
For a normal incident collimated beam the penetration depth becomes zp = ltr32, and
R1,2=0.57 for polymer plates with an average refractive index n = 1.533. For samples
with no absorption (µa = 0), Eq. (3) simplifies to the optical Ohm’s law18
T (L, λi, ltr) =ltr + zeL+ 2ze
. (6)
In the range of zero phosphor absorption the total transmission is a function of the
sample thickness L, the incoming wavelength λi, and the transport mean free path ltr,
T = T (L, λi, ltr). Therefore, we can extract ltr using Eq. (6) from measurements of the
total transmission T (λ) in the range of no absorption (λi ≥ λr). In the range of strong
phosphor absorption (λi ≤ λr) the total transmission also depends on the absorption mean
free path labs: T = T (L, λi, ltr, labs). Therefore the transport mean free path ltr has to be
derived separately, which we can do by extrapolating the ltr values extracted in the zero
absorption wavelength range (λi ≥ λr) into the strong absorption wavelength range, since
ltr is a monotoneously increasing function of λ for size-polydisperse scatterers15,22,34. By
measuring the total transmission in the range of strong absorption, we thus obtain labs using
extrapolated values of ltr, by using Eq. (3).
III. EXPERIMENTAL DETAILS
We have studied the light transport through polymer plates that are used in Fortimo
solid-state lighting units35. The polymer plates consist of a polycarbonate matrix (Lexan
5
143R) with YAG : Ce+3 ceramic phosphor particles that are widely used in white LEDs.
The phosphor particles have a broad size distribution with center around 10 µm16, and a
Ce3+ concentration in the YAG : Ce+3 of 3.3 wt %.
The emission and absorption spectra of the YAG : Ce+3 in powder form, which was used
in the polymer diffusion plates are shown in Fig. 1(a). The absorption and emission bands
have peaks at 458 nm and 557 nm, respectively, and overlap in the spectral range between
λl=490 nm and λr=520 nm. As a result, we distinguish three spectral ranges in the visible
spectrum where different physical processes are taking place: (1) in the spectral range up to
λl =490 nm, light is partly elastically scattered and partly absorbed. This range has already
been studied in Ref. 16. (2) In the spectral range between λl =490 nm and λr =520 nm,
externally incident light is elastically scattered and absorbed, while light is also emitted by
the internal phosphor, and subsequently elastically scattered. This is the overlap range that
is central to the present work. (3) In the spectral range beyond λr =520 nm, output light
is the sum of externally incident light that is elastically scattered and of internally emitted
light by the phosphor that is also elastically scattered. This range has also already been
studied in Ref. 16.
Here we present the transmission measurements on five such polymer plates with a phos-
phor concentration ranging from φ = 2.0 to 4.0 wt%. The corresponding volume fractions
range from φ = 0.5 to 1 vol%, which is in the limit of low scatterer concentration. The plates
were prepared using injection molding where a powder of YAG : Ce+3 particles is mixed with
the polymer powder and the mixture is melted and pressed into a press-form. The polymer
plates, shown in Fig. 2(a), are circular with a diameter of 60 mm and a thickness of 2 mm.
Figure 2(b) shows a drawing of the setup for measuring the spectrally resolved total
transmission Ttot(λ) with a narrowband incident light beam. We illuminate the sample with
two different light sources: a tunable narrowband light source and a broadband light source.
The narrowband light source consists of a Fianium supercontinuum white-light source (WL-
SC-UV-3), which is spectrally filtered to a bandwidth of less than ∆λ =2.4 nm by a prism
monochromator (Carl-Leiss Berlin-Steglitz). The wavelength of the narrowband source is
tunable in the wavelength range between 400 and 700 nm, as shown in Fig 3. The infrared
part above 700 nm of the supercontinuum laser source is filtered by a neutral density filter
(NENIR30A) and a dichroic mirror (DMSP805). The spectrum of the supercontinuum
source after filtering the infrared light is shown in Fig. 3. The spectrum vary drastically in
6

intensity at different wavelengths.
The incident beam illuminates the phosphor plate at normal incidence and the plate is
placed at the entrance port of an integrating sphere. We verified that the entrance port
of the integrating sphere is sufficiently large to collect all intensities that emanated from
the strongest scattering sample. The intensity of the outgoing light entering the integrating
sphere is analyzed with a fiber-to-chip spectrometer (AvaSpec-USB2-ULS2048L) with a
spectral resolution of ∆λ =2.4 nm.
An example of the measured spectra for three incident wavelengths λi=527, 550 and 634
nm are shown in Fig. 3 with the red squares and red dotted lines. The peak intensity varies
significantly across the spectral range as a result of the spectral variation of the supercon-
tinuum source. The integration time is changed at every wavelength during measurements
to maintain a fixed reference intensity.
The alternative broadband light source consist of a white LED (Luxeon LXHL-MW1D)
(see Fig. 2) with an emission spectrum covering the range from 400 nm to 700 nm as shown
in Fig. 3. This source is not filtered.
For all phosphor plates, we measured the transmission spectra with both the narrowband
and the broadband light source to check the consistency in the spectral range where both
methods can be applied (λ ≤ λl and λ ≥ λr). For the broadband light source the total
transmission is obtained by normalizing the measured spectrum I(λ) to a reference spectrum
I0(λ) measured in the absence of a sample. For the narrowband light source the total
transmission is determined as the ratio of the transmitted intensity I(λi) and a reference
intensity I0(λi) without the sample at the designated wavelength λi that is set with the
monochromator. The total transmission is reproducible to within a few percent points on
different measurements with different light sources.
IV. RESULTS
A. Transmission measurements
In order to measure the total transmission T (λ) of the polymer plates we tune the nar-
rowband light source to an incident wavelength λi, and measure the transmitted intensity of
the outgoing light. In Fig. 4 we show the normalized transmitted intensity for three incident
7

wavelengths λi. For an incident wavelength λi=490 nm, we see a pronounced peak with the
maximum at λ=490 nm. This peak contains mostly elastically scattered photons, because
inelastically scattered photons are Stokes shifted to longer wavelengths. Indeed between
500 nm and 650 nm the intensity profile reveals a broad peak that represents the Stokes
shifted intensity, since the intensity profile has a shape similar to that of the YAG : Ce+3 in
powder form (black dashed curve). Both emission spectra have a maximum at 557 nm. For
YAG : Ce+3 in powder form the intensity is slightly higher at longer wavelengths λ > 600 nm
than for the phosphor plate. The peak value of the Stokes shifted light amounts to 3 % of
the transmitted intensity at the incident wavelength λi=490 nm. We calculated the amount
of Stokes shifted light Iem(λ) in the elastic peak at λi=490 nm by extrapolating the emis-
sion curve to this wavelength range. We find that Iem(λ) amounts to less than 1 % of the
transmitted intensity I(λ), and can be neglected safely. The total Stokes shifted intensity
decreases drastically for longer incident wavelengths λi inside the overlap range, and can
thus be neglected too. For incident light in the middle of the overlap range at λi=505 nm,
we see that the emitted intensity is even weaker with a normalized intensity Iem(λ) less than
1% of I(λ). At the edge of the absorption band at the incoming wavelength λi=520 nm we
observe an even smaller Stokes shifted intensity Iem(λ). The reason for this decrease is that
the absorption cross section decreases drastically in the overlap range, and only a very little
amount of light is being absorbed, and as a result is Stokes shifted. Throughout the overlap
range the contribution from the Stokes shifted light Iem(λ) is less then 1 % of I(λ) at the
incident wavelength λi. We thus conclude that the Stokes shifted intensity contribution can
be neglected throughout the overlap range. Therefore, we have distinguished the elastically
scattered (or absorbed) fraction of light from the Stokes shifted light. As a result we can
now measure total transmission at any desired wavelength.
We have scanned the incident wavelength λi through the wavelength range of interest. In
Fig. 1(c) the total transmission for the slab with 4 wt% of YAG : Ce+3 has been obtained
from these scans (red). The total relative intensity Trel(λ) measured with the broadband
source is also shown in Fig. 1(c) for comparison (blue). For short wavelengths, both trans-
mission spectra coincide within a few percent. The blue spectrum reveals a deep trough
with a minimum at 458 nm. The trough matches well with the peak of the absorption
band of YAG : Ce+3 in Fig. 1(a), and reveals that a significant fraction of the light in this
wavelength range is absorbed by the phosphor. At wavelengths longer than λr=520 nm
8

both transmission spectra are flat, but the spectrum measured with the broad band light
source is 10 % larger than the spectrum measured with the narrowband light source. The
blue triangle spectrum contains a significant contribution of the Stokes shifted light Iem(λ)
in this spectral range, as most of the emission occurs in this spectral range (see Fig. 1(a)).
The narrowband spectrum on the contrary does not have this contribution. The difference
in transmission between these two spectra at long wavelengths is equal to Tem(λ), in Eq. (2).
In the overlap region (λl = 490 nm< λ < λr = 520 nm) both spectra reveal a sharp rise.
The total relative intensity spectrum deviates from the total transmission spectrum due to
the contribution of the Stokes shifted light Iem(λ) in this wavelength range. In Ref. 16 it
was not possible to separate elastically scattered and Stokes shifted light.
Finally, we filtered the broadband light source with a longpass filter at λ=520 nm, which
ensures that the phosphor is not excited (we thus have zero emitted intensity Tem(λ)=0).
Hence, the measured total relative intensity equals the total transmission Trel(λ) = T (λ) in
this spectral range. In Fig. 1(b) we compare the total transmission measured with the filtered
broadband light source (green), and the total transmission measured with the narrowband
light source (red). The total transmission measured with the narrowband light source agrees
within a few percent points with the total transmission measured with the filtered broadband
light source (see Fig. 1(c)) for λi ≥ λr. In summary, we have for the first time extracted
the total transmission T (λ) for a diffuser plate with phosphor in the whole visible range,
including the previously inaccessible16 overlap range.
B. Transport mean free path
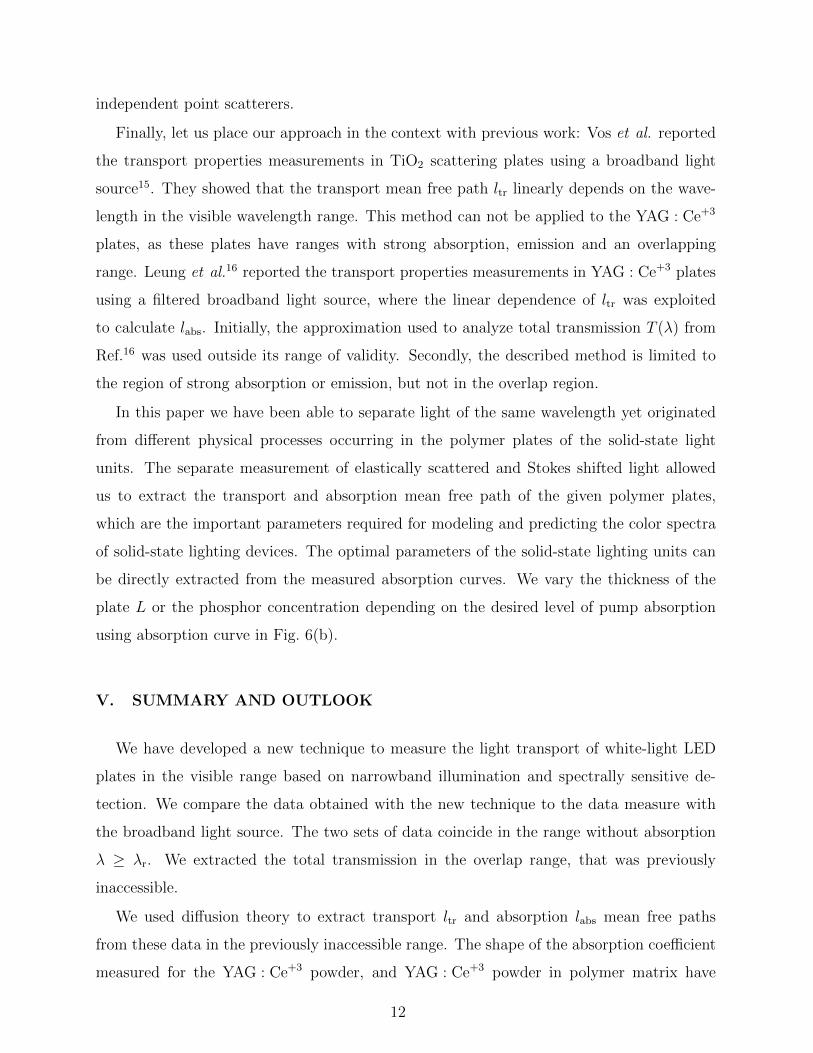
In the range of low absorption we have extracted the transport mean free path from the
transmission data using Eq. 6 and plotted the result in Fig. 5(a). We see that the trans-
port mean free path increases linearly with wavelength at constant phosphor concentration.
In highly polydisperse non-absorbing media, a similar relationship between the transport
mean free path and wavelength was found and interpreted15. Therefore, we have fitted
the transport mean free path with a line for every phosphor concentration. Parameters of
the linear fits are listed in appendix. We linearly extrapolate ltr to the absorption range
λ ≤ λr = 520 nm, and use the extrapolated values of the transport mean free path ltr to
obtain the absorption mean free path labs in the range of strong absorption.
9

C (wt%) a b
2 -0.57 ± 0.07 0.00358 ± 0.00001
2.5 -0.55± 0.05 0.00305 ± 0.00008
3 -0.43± 0.03 0.00225 ± 0.00055
3.5 -0.47± 0.02 0.00214 ± 0.00038
4 -0.54± 0.02 0.00218± 0.00038
TABLE I. Parameters of the linear models of the transport mean free path versus wavelength:
ltr = a + bλ. The parameters a and b depend on the phosphor concentration C, and are shown
with their standard errors.
In the limit of low concentration each scatterer can be treated independently. In this
case 1/ltr is proportional to the concentration of the scatterers36. Indeed in Fig. 5(b) we
see that the transport mean free path increases inversely proportional with the increasing
phosphor concentration at a fixed wavelength. We observe that with increasing wavelength
the scattering cross section increases similarly to what was obtained earlier16.
C. Absorption mean free path
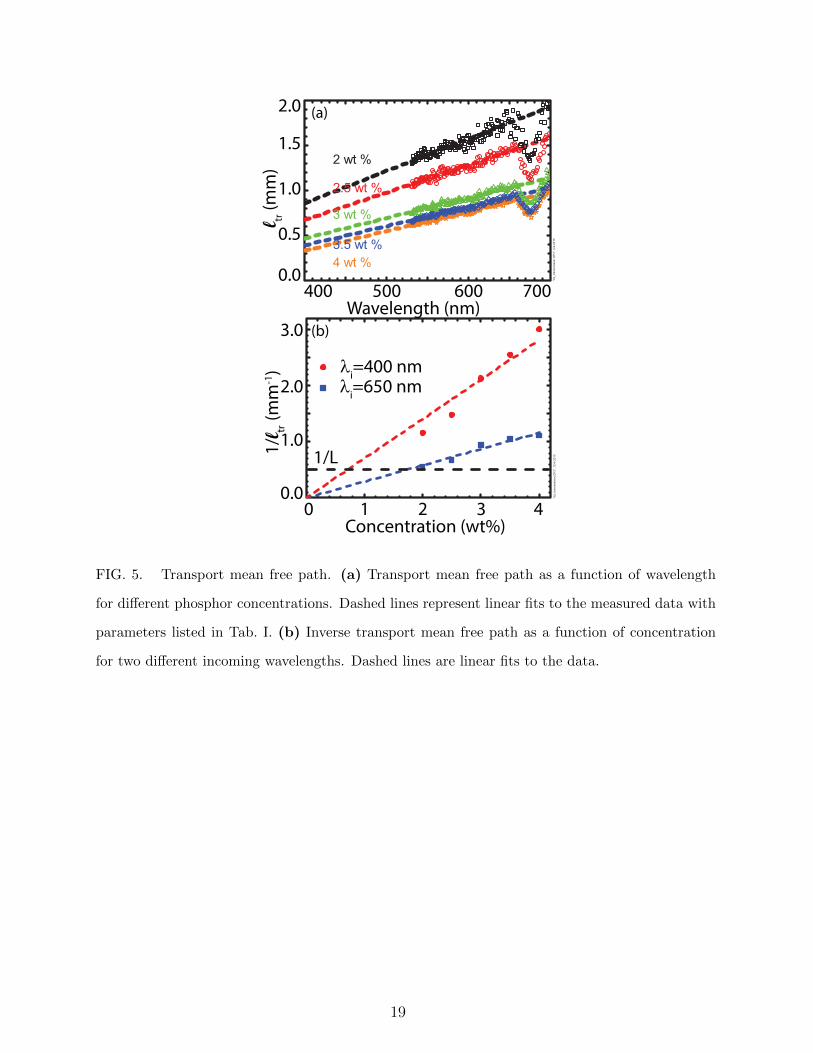
By using the transport mean free path ltr extrapolated to the wavelength range between
400 and 530 nm where the phosphor absorbs light, we now derive the absorption mean
free path labs from the measured total transmission (see Fig. 1(c)). Since we do not have
analytic inverse function of Eq. (3) , we have solved the inversion numerically and made look-
up tables for each phosphor concentration and at each wavelength. Fig. 6(a) shows three
inverted curves of µa versus total transmission for three different wavelengths (λ =430, 450,
510 nm) at a phosphor concentration C=4 wt%. We plot µa - rather then labs - since this
quantity tends to zero for vanishing absorption. Fig. 6(a) shows that µa (and thus the
absorption) increase. In the limit of strong absorption, all total transmission curves tend to
zero. In the limit of vanishing µa, the total transmission equals the (extrapolated) values
that decrease with decreasing wavelength (Fig. 6(a)). The vertical dashed lines indicate the
measured total transmission, and the intersections with the curves yield the corresponding
µa for each wavelength at this phosphor concentration.
10

Fig. 6(b) shows the extracted absorption profile µa for the polymer plate with the highest
phosphor concentration C=4 wt% studied here. The FWHM of this curve is 64.5 nm. The
dashed purple line in Fig. 6(b) indicates the inverse thickness of the sample. The absorption
mean free path labs is shorter than the thickness of the sample L between 418 and 501
nm. This means that incident light is effectively absorbed in the volume of the sample,
and the density of the phosphor is optimized for use in a white-light LED. At the edges
of the absorption range at 400 and 530 nm µa tends to zero, as expected from the known
absorption (Fig. 1(a)). We note that our present µa values differ from previous results
obtained on the same samples16 (see Fig. 6(b)). The absorption mean free path varies
significantly with wavelength in our case. We notably attribute the difference to the use of
an incorrect diffusion equation in Ref. 16. The spectral shape obtained at present is in much
better agreement with the phosphor absorption spectra than previously, which is gratifying.
In Fig. 7(a) we have plotted µa(λ) for three wavelength λ = 430, 460 and 500 nm as
a function of phosphor concentration. We see that µa(λ) increases linearly with increasing
phosphor concentration, which agrees with the assumption that each absorber is indepen-
dent. Figure 7(a) shows that the steepest slope appears at the wavelength λ=460 nm, which
corresponds to the peak of the absorption curve. The maximum absorption cross section
is σabs =30 µm2, which agrees reasonably well with the typical measured absorption cross
section for YAG : Ce+3 of the order of 10 µm2 (Ref. 13, 37–41).
Figure 7(b) shows the extracted normalized absorption spectrum of µa for the polymer
plates with different phosphor concentrations. All absorption curves are normalized to their
maximum, and they coincide with each other within a few percent points. Absorption mean
free path labs scales linearly with the phosphor concentration. All absorption curves tend to
zero outside 400 < λ < 530 nm.
In Fig. 7(b) we also compare the shape of the absorption curve of the phosphor in powder
form that was used to manufacture the samples to µa curves. The black dot-dashed line shows
absorption spectra of the YAG : Ce+3 in powder. These two sets of data were normalized to
their maxima, so the positions of maximums of these two graphs coincide. The µa spectrum
appear to have broader tails compared to the YAG : Ce+3 in powder form. The absorption
spectra of YAG : Ce+3 in powder has a FWHM=54 nm, that is 10 nm smaller than the
FWHM of the measured absorption spectra. One possible reason is that light is multiply
internally reflected in the YAG : Ce+3 particles13, so particles can not be treated as an
11
independent point scatterers.
Finally, let us place our approach in the context with previous work: Vos et al. reported
the transport properties measurements in TiO2 scattering plates using a broadband light
source15. They showed that the transport mean free path ltr linearly depends on the wave-
length in the visible wavelength range. This method can not be applied to the YAG : Ce+3
plates, as these plates have ranges with strong absorption, emission and an overlapping
range. Leung et al.16 reported the transport properties measurements in YAG : Ce+3 plates
using a filtered broadband light source, where the linear dependence of ltr was exploited
to calculate labs. Initially, the approximation used to analyze total transmission T (λ) from
Ref.16 was used outside its range of validity. Secondly, the described method is limited to
the region of strong absorption or emission, but not in the overlap region.
In this paper we have been able to separate light of the same wavelength yet originated
from different physical processes occurring in the polymer plates of the solid-state light
units. The separate measurement of elastically scattered and Stokes shifted light allowed
us to extract the transport and absorption mean free path of the given polymer plates,
which are the important parameters required for modeling and predicting the color spectra
of solid-state lighting devices. The optimal parameters of the solid-state lighting units can
be directly extracted from the measured absorption curves. We vary the thickness of the
plate L or the phosphor concentration depending on the desired level of pump absorption
using absorption curve in Fig. 6(b).
V. SUMMARY AND OUTLOOK
We have developed a new technique to measure the light transport of white-light LED
plates in the visible range based on narrowband illumination and spectrally sensitive de-
tection. We compare the data obtained with the new technique to the data measure with
the broadband light source. The two sets of data coincide in the range without absorption
λ ≥ λr. We extracted the total transmission in the overlap range, that was previously
inaccessible.
We used diffusion theory to extract transport ltr and absorption labs mean free paths
from these data in the previously inaccessible range. The shape of the absorption coefficient
measured for the YAG : Ce+3 powder, and YAG : Ce+3 powder in polymer matrix have
12

similar trends. Although for the polymer plates the curve is broader then for the YAG : Ce+3
powder. Both µa and 1/ltr are proportional to the concentration of phosphor, which reveals
that elastic and inelastic processes do not influence each other.
By exploiting narrow band light source and interpreting the resulting total transmission
by diffusion theory, we are able to extract for the first time light transport parameters for
white LEDs in the whole visible wavelength range. However, theory only gives an analytical
solution for simple sample geometries, such as a slab, a sphere, or a semi-infinite medium.
Therefore, to efficiently model a real white LED with a complex geometry we must in the
end supplement an ab initio theory with a numerical method, such as ray-tracing.
Acknowledgments
We would like to thank Cornelis Harteveld for technical support, Vanessa Leung for contri-
bution early on in the project and Teus Tukker, Oluwafemi Ojambati, Ravitej Uppu, Diana
Grishina for discussions. This work was supported by the Dutch Technology Foundation
STW (contract no. 11985), and by FOM and NWO, and the ERC (279248).
REFERENCES
1M. H. Schmidt, K. W. Reichert, K. Ozker, G. A. Meyer, D. L. Donohoe, D. M. Bajic,
N. T. Whelan, and H. T. Whelan, Pediatr. Neurosurg. 30, 225 (1999).
2H. T. Whelan, J. M. Houle, N. T. Whelan, D. L. Donohoe, J. Cwiklinski, M. H. Schmidt,
L. Gould, D. L. Larson, G. A. Meyer, V. Cevenini, and H. Stinson, AIP Conference
Proceedings 504, 37 (2000).
3D. Malakoff, Science 296, 1782 (2002).
4J. T. Eells, M. T. T. Wong-Riley, J. VerHoeve, M. Henry, E. V. Buchman, M. P. Kane, L. J.
Gould, R. Das, M. Jett, B. D. Hodgson, D. Margolis, and H. T. Whelan, Mitochondrion
4, 559 (2004).
5T. Taguchi, Y. Uchida, and K. Kobashi, Phys. Status Solidi A 201, 2730 (2004).
6E. F. Schubert, Light-Emitting Diodes , 2nd ed. (Cambridge University Press, 2006).
7M. Krames, O. Shchekin, R. Mueller-Mach, G. O. Mueller, L. Zhou, G. Harbers, and
M. Craford, J. Disp. Tech., 3, 160 (2007).
8H. Bechtel, P. Schmidt, W. Busselt, and B. S. Schreinemacher, Proc. SPIE, 7058, 70580E
(2008).
13

9D. N. Breslauer, R. N. Maamari, N. A. Switz, W. A. Lam, and D. A. Fletcher, PLoS
ONE 4, e6320 (2009).
10C. Sommer, J. R. Krenn, P. Hartmann, P. Pachler, M. Schweighart, S. Tasch, and F. P.
Wenzl, IEEE J. Quantum Electron., 15, 1181 (2009).
11I. Akasaki, H. Amano, and S. Nakamura, See http://www.nobelprize.org/ (2015).
12C. Gilray and I. Lewin, Illuminating Engineering Society of North America Annual Con-
ference Technical Papers (IESNA). Paper no. 85, pp. , 65 (1996).
13Z. Liu, S. Liu, K. Wang, and X. Luo, Appl. Opt. 49, 247 (2010).
14T. Tukker, SPIE International Optical Design Conference 2010 (SPIE,2010), Paper no.
ITuE2 (2010).
15W. L. Vos, T. W. Tukker, A. P. Mosk, A. Lagendijk, and W. L. IJzerman, Appl. Opt.
52, 2602 (2013).
16V. Y. F. Leung, A. Lagendijk, T. W. Tukker, A. P. Mosk, W. L. IJzerman, and W. L.
Vos, Opt. Express 22, 8190 (2014).
17D. Malacara, Color vision and colorimetry: theory and applications (SPIE, Washington,
2011).
18A. Lagendijk and B. A. van Tiggelen, Phys. Rep., 270, 143 (1996).
19M. C. W. van Rossum and T. M. Nieuwenhuizen, Rev. Mod. Phys. 71, 313 (1999).
20E. Akkermans and G. Montambaux, Mesoscopic Physics of Electrons and Photons (Cam-
bridge University Press, 2007).
21P. D. Garcia, R. Sapienza, J. Bertolotti, M. D. Martin, A. Blanco, A. Altube, L. Vina,
D. S. Wiersma, and C. Lopez, Phys. Rev. A 78, 023823 (2008).
22O. L. Muskens and A. Lagendijk, Opt. Express 16, 1222 (2008).
23H. van de Hulst, Multiple Light Scattering (Academic Press, Leiden, 1980).
24A. Kokhanovsky, Light Scattering Reviews 9 (Springer-Verlag, Berlin Heidelberg, 2015).
25A. Ishimaru, Wave propagation and scattering in random media (Academic, Vols. I and
II, 1978).
26N. Garcia, A. Z. Genack, and A. A. Lisyansky, Phys. Rev. B 46, 14475 (1992).
27D. J. Durian, Appl. Opt. 34, 7100 (1995).
28R. Elaloufi, R. Carminati, and J.-J. Greffet, J. Opt. A: Pure Appl. Opt. 4, S103 (2002).
29R. Sarma, A. Yamilov, S. F. Liew, M. Guy, and H. Cao, arXiv:1507.07861 (2015).
30In Ref. 26 an approximation was used, that is only valid for very small absorption. This
14

approximation lead to the slightly different result in Ref. 16. Here we use exact expression
and our results are valid for very high µa.
31A. Lagendijk, R. Vreeker, and P. D. Vries, Phys. Lett. A 136, 81 (1989).
32J. G. Rivas, R. Sprik, C. M. Soukoulis, K. Busch, and A. Lagendijk, Europhys. Lett. 48,
22 (1999).
33J. X. Zhu, D. J. Pine, and D. A. Weitz, Phys. Rev. A. 44, 3948 (1991).
34O. L. Muskens and A. Lagendijk, Opt. Lett. 34, 395 (2009).
35“See catalog at: http://www.lighting.philips.co.uk/pwc_li/gb_en/subsites/oem/
fortimo-led-catalogue,” (2014).
36K. Busch, C. M. Soukoulis, and E. N. Economou, Phys. Rev. B 50, 93 (1994).
37S. M. Kaczmarek, G. Domianiak-Dzik, W. Ryba-Romanowski, J. Kisielewski, and J. Wo-
jtkowska, Cryst. Res. Technol. 34, 1031 (1999).
38G. J. Zhao, X. H. Zeng, J. Xu, S. M. Zhou, and Y. Z. Zhou, Phys. Status Solidi A 199,
355 (2003).
39J. A. Mares, A. Beitlerova, M. Nikl, N. Solovieva, K. Nitsch, M. Kucera, M. Kubova,
V. Gorbenko, and Y. Zorenko, Radiat. Meas. 42, 533 (2007).
40E. Mihkov, M. Nikl, J. Mare, A. Beitlerov, A. Vedda, K. Nejezchleb, K. Blaek, and
C. DAmbrosio, J. Lumin. 126, 77 (2007).
41M. Kuera, P. Hasa, and J. Hakenov, J. Alloy Compd. 451, 146 (2008).
15

Ov
erl
ap
re
gio
n
(b)
Wavelength (nm)
No
rmalize
d e
missio
nEmissionAbsorption
1.0
0.8
0.6
0.4
0.2
0.0N
orm
aliz
ed
1/l
ab
s
60
40
20
0400 500 600 700
60
40
20
0
Tot. re
l. inte
nsity (%
)Tota
l tra
nsm
issi
on
(%
)
(a)
broadband
narrowband
long pass !lterO
ve
rla
p r
eg
ion
λlλ
r
x
y
0.8
0.6
0.4
0.2
0.0
0.80.60.40.20.0
520 nm530 nm
540 nm
550 nm
560 nm
570 nm
580 nm
590 nm
600 nm
620 nm650 nm
770 nm
450 nm
380 nm
480 nm
490 nm
500 nm
510 nm
(c)
1.0
0.8
0.6
0.4
0.2
0.0
FIG. 1. (a) Normalized absorption spectra (blue circles) and emission spectrum (green squares)
of the YAG : Ce+3 phosphor used in our study. The spectral range where emission and absorption
spectra overlap is indicated with a green bar between λl and λr. (b) Transmission spectra obtained
by using the narrowband (red squares) and the broadband light sources (green circles) for the
polymer plate with 4 wt % phosphor particles. Arrows point to the relevant ordinate for the data.
(c) CIE 1931 (x,y) chromaticity diagram6. Monochromatic colors are located at the perimeter
of the diagram. In the middle of the diagram the white color is located. The dashed gray area
represent the region where emission and absorption of YAG : Ce+3 overlap. The overlap range was
previously inaccessible and it is made accessible in this work.
16

Narrowband
light source
Sample
L2
300 mm 65 mm
2 mm
L1DM
NDF
M
dump
Broadband
source
S
P
I
(a) (b)
FIG. 2. Narrowband measurement setup. (a) A polymer slab with a 4 wt% YAG : Ce+3 compared
to a 1 coin. (b) Supercontinuum white light source Fianium, NDF: neutral density filter, DM:
dichroic mirror, L1: achromatic doublet (AC080-010-A-ML, f=10 mm), L2: achromatic doublet
(f=50 mm), M: mirror, I: integrating sphere, S: spectrometer, P: prism spectrometer (f] = 4.6).
17

No
rma
lize
d in
ten
sity
0.0
0.4
0.8
0.2
1.0
0.6
400 500 600 700Wavelength (nm)
BSSS
NS
FIG. 3. Normalized reference spectra of the light sources used in the experiment. Blue circles -
normalized reference spectrum of the supercontinuum source (SS) after being filtered by a neutral
density filter and a dichroic mirror that removes the infrared part of the spectra. Black squares
- normalized reference spectrum of a broadband source (BS) that was not filtered. Red squares -
spectrally filtered narrowband light source (NS) normalized to the initial BS spectrum represent.
We show narrowband spectra for three incident wavelengths λi = 486, 551, 634 nm. Intensity
normalized to the SS.
λi=490 nm
λi=505 nm
λi=520 nm
400 450 500 550 600 650Wavelength (nm)
No
rma
lize
d in
ten
sity
1E-3
0.01
0.1
1
700
FIG. 4. Intensity profile of the signal that we measure in the range where emission and absorption
overlap for three different pump wavelengths. The orange dashed line is the emission spectra from
Fig. 1(a). The blue curve was normalized to 7791 counts and the green and the red curves to 15480
and 20297 counts respectively.
18
l tr (
mm
)
2.0
1.0
0.5
1.5
Wavelength (nm)
λi=400 nm
λi=650 nm
1/l
tr (
mm
-1)
0 1 2 3 4
400 500 600 700
Concentration (wt%)
(a)
(b)
1/L
2.0
1.0
0.0
3.0
0.0
FIG. 5. Transport mean free path. (a) Transport mean free path as a function of wavelength
for different phosphor concentrations. Dashed lines represent linear fits to the measured data with
parameters listed in Tab. I. (b) Inverse transport mean free path as a function of concentration
for two different incoming wavelengths. Dashed lines are linear fits to the data.
19

FIG. 6. Determination of the absorption mean free path. (a) Look-up tables presented in a form
of plots for the Eq. 3 for three different wavelengths, and 4 wt% concentration of the phosphor.
(ltr=0.40;0.44;0.57 mm respectively) (b) Absorption mean free path extracted from the look-up
tables for the plate with 4 wt% phosphor concentration. Red circles and red dashed lines indicate
the process of mapping µa from look-up table to the Fig. 6(b). Blue triangles indicate the inverse
absorption length measured in Ref.16
(b)
No
rma
lize
d 1
/la
bs
Wavelength (nm)
0.0
0.2
0.4
0.6
0.8
1.0
No
rma
lized
α
(a)
0.0
0.2
0.4
0.6
0.8
1.01.5
1.0
0.5
0.0
1/l
ab
s (m
m-1
)
Concentration (wt%)
λ=460 nmλ=430 nm
1/L
0 2 4 400 450 500 550
λ=500 nm
FIG. 7. Absorption mean free path. (a) µa as a function of concentration is shown for the three
different wavelength. (b) Line shapes of the absorption coefficient is shown for the phosphor in
powder (dot-dashed black line) and in polymer plates with different phosphor concentrations.
20