PHILIPPINES QUARTERLY UPDATE FROM TABILITY...
60
PHILIPPINES QUARTERLY UPDATE FROM STABILITY TO PROSPERITY FOR ALL March 2012 Poverty Reduction and Economic Management Unit East Asia and Pacific Region Document of the World Bank
Transcript of PHILIPPINES QUARTERLY UPDATE FROM TABILITY...

PHILIPPINES QUARTERLY UPDATE FROM STABILITY TO PROSPERITY FOR ALL
March 2012
Poverty Reduction and Economic Management Unit East Asia and Pacific Region
Document of the World Bank

Preface The Philippines Quarterly Update provides an update on key economic and social developments, and policies over the past three months. It also presents findings from recent World Bank studies on the Philippines. It places them in a longer‐term and global context, and assesses the implications of these developments and policies on the outlook for the Philippines. Its coverage ranges from the macro‐economy and financial markets to indicators of human welfare and development. It is intended for a wide audience, including policymakers, business leaders, financial market participants, and the community of analysts and professionals engaged in the Philippines. The Philippines Quarterly Update is a report of the World Bank’s Philippine Poverty Reduction and Economic Management (PREM) team. It was prepared by Karl Kendrick Chua (Country Economist and Task Team Leader), Marianne Juco (Research Analyst and Co‐Task Team Leader), and Joseph Louie Limkin (Research Assistant), under the general guidance of Rogier van den Brink (Lead Economist). Karl Kendrick Chua led the editing of the report. The following contributed to the special focus sections and boxes: Catherine Vidar for disaster and risk management, Edward Bell for conflict and displacement, Soonhwa Yi for real estate market, Annalyn Sevilla and Lotis Quiao for disbursement and absorptive capacity, Akira Murata for foreign direct investments, and Rosa Alonso i Terme for revenue and expenditure review. Additional research assistance by Paul Mariano and secretarial and publication support by Nenette Santero and Rose Buenaventura are gratefully acknowledged. The report benefited from advice, comments, and views of various stakeholders in the World Bank, the government, business, academe, and civil society. The team is very grateful for their time and inputs. The findings, interpretations, and conclusions expressed in this Update are those of World Bank staff and do not necessarily reflect the views of its management, Executive Board, or the governments they represent. For information about the World Bank and its activities in the Philippines, please visit www.worldbank.org/ph. To be included in the email distribution list of the Philippines Quarterly Update and related publications, please contact Nenette Santero ([email protected]). For questions and comments on the content of this publication, please contact Karl Kendrick Chua ([email protected]). Questions from the media can be addressed to David Llorito ([email protected]).
TABLE OF CONTENTS
PREFACE ............................................................................................................................................................ 2 EXECUTIVE SUMMARY ....................................................................................................................................... 5 RECENT ECONOMIC AND POLICY DEVELOPMENTS .............................................................................................. 7
OUTPUT AND DEMAND ...................................................................................................................................................................... 7 EMPLOYMENT AND POVERTY ............................................................................................................................................................... 9 EXTERNAL ACCOUNTS ...................................................................................................................................................................... 11 FINANCIAL MARKETS ....................................................................................................................................................................... 16 INFLATION AND MONETARY POLICY ..................................................................................................................................................... 16 FISCAL POLICY ................................................................................................................................................................................ 17
PROSPECTS ....................................................................................................................................................... 19
OUTPUT, DEMAND, AND EMPLOYMENT ............................................................................................................................................... 19 EXTERNAL ACCOUNTS ...................................................................................................................................................................... 20 INFLATION AND MONETARY POLICY ..................................................................................................................................................... 21 FISCAL POLICY ................................................................................................................................................................................ 22 THE MEDIUM TO LONG‐TERM AGENDA ............................................................................................................................................... 26
SPECIAL FOCUS 1 ............................................................................................................................................... 29 Financing the Economic Costs of Disasters in the Philippines ...................................................................................... 29 SPECIAL FOCUS 2 ............................................................................................................................................... 36 Cycles of Conflict and Displacement in Mindanao ....................................................................................................... 36 SPECIAL FOCUS 3 ............................................................................................................................................... 43 The Philippine Real Estate Market: A Cause for Concern? ........................................................................................... 43 SPECIAL FOCUS 4 ............................................................................................................................................... 49 Stepping‐up Disbursements by Improving Absorptive Capacity in Agencies ............................................................... 49 DATA APPENDIX ................................................................................................................................................ 56 PREVIOUS EDITIONS AND SPECIAL FOCUS SECTIONS .......................................................................................... 58 SELECTED RECENT WORLD BANK PUBLICATIONS ON THE PHILIPPINES ............................................................... 59

FIGURES FIGURE 1. PHILIPPINE ECONOMIC GROWTH .............................................................................................................................. 8 FIGURE 2. HIGHER CONSUMPTION GROWTH BUOYED GDP ......................................................................................................... 8 FIGURE 3. SERVICES BUOYED GROWTH .................................................................................................................................... 8 FIGURE 4. MORE PEOPLE ARE FORCED TO FIND WORK IN Q4 ....................................................................................................... 8 FIGURE 5. MORE PEOPLE EXPERIENCED HUNGER ..................................................................................................................... 11 FIGURE 6. DIFFERENCES IN MEASURING UNEMPLOYEMENT ....................................................................................................... 11 FIGURE 7. ELECTRONICS IMPORTS HAVE STARTED TO CONTRACT. ............................................................................................... 12 FIGURE 8. GREATER DIVERSIFICATION CAN HELP BUFFER AGAINST ELECTRONICS SLOWDOWN ........................................................... 12 FIGURE 9. REAL PESO REMITTANCES ..................................................................................................................................... 13 FIGURE 10. FDI LARGELY CAME FROM REINVESTED EARNINGS AS EQUITY INVESTMENTS RETREAT. .................................................... 13 FIGURE 11. THE YIELD CURVE CONTINUES TO FLATTEN. ............................................................................................................ 16 FIGURE 12. THE RECOVERY IN NET FOREIGN BUYING LIFTED THE PSEI ......................................................................................... 16 FIGURE 13. SLOWER FOOD AND TRANSPORT INFLATION ........................................................................................................... 17 FIGURE 14. OUTSTANDING LOANS ARE STILL AT COMFORTABLE LEVELS ........................................................................................ 17 FIGURE 15. REMITTANCE ORIGIN HAS SHIFTED TO ASIA ............................................................................................................ 21 FIGURE 16. PHILIPPINE DEBT SUSTAINABILITY ANALYSIS ............................................................................................................ 24
TABLES TABLE 1. NATIONAL GOVERNMENT FISCAL GAP ....................................................................................................................... 18 TABLE 2. GROWTH PROJECTIONS ......................................................................................................................................... 20 TABLE 3. IMPACT OF GOVERNMENT SPENDING ON 2012 GDP GROWTH ..................................................................................... 23 TABLE 4. PHILIPPINES: SELECTED ECONOMIC INDICATORS, 2008‐13 .......................................................................................... 56 TABLE 5. PHILIPPINES: NATIONAL GOVERNMENT CASH ACCOUNTS (GFS BASIS), 2008‐12 ........................................................... 57
BOXES BOX 1. EXPLAINING THE DIFFERENCE BETWEEN SWS AND OFFICIAL UNEMPLOYMENT RATES .......................................................... 10 BOX 2. REAL INCOME AND HUNGER INCIDENCE ...................................................................................................................... 14 BOX 3.PHILIPPINE FDI PERFORMANCE.................................................................................................................................. 15 BOX 4.PHILIPPINE PUBLIC EXPENDITURE AND REVENUE OVERVIEW ............................................................................................ 25

5
Executive Summary The Philippine economy grew slower than expected at 3.7 percent in 2011, held back by weak public spending and external demand. In the fourth quarter (Q4), growth slightly improved at 3.7 percent. As in past quarters, growth was driven by remittance‐fueled household consumption, which grew by 6.7 percent. The government’s Disbursement Acceleration Plan was partially successful and contributed 1.3 percentage points (ppt) to GDP growth in Q4, up from 0.3 ppt in Q3, but this was not enough to push growth up to the targeted level of around five percent. On the production side, the services sector, including the fast‐growing business process outsourcing (BPO) industry, continued to drive growth. Industry, in particular manufacturing exports, was buffeted by weaker demand, while agriculture suffered from typhoon damages, highlighting the need to improve disaster and risk management. The labor market saw some improvements in the latter part of the year, though poverty, hunger, and informality remain high. The labor market improved markedly in Q4, with a rising share in wage and salaried workers and a two‐fold increase in the number of new jobs. The result is lower unemployment and underemployment rates of 6.4 and 19.1 percent, respectively. However, more than 80 percent of new jobs were created in the informal sector and real wages have not increased. This, together with high self‐rated poverty and hunger incidences, point to structural weaknesses in the labor market. In addition, the majority of workers have little or no protection against job losses and few opportunities to enhance their future job prospects. Last year’s respectable growth amid the weak external environment and lower public spending underscores the economy’s resiliency to external shocks. Strong macroeconomic fundamentals manifested by low and stable inflation, falling debt ratios, healthy current account surpluses, higher reserves, and a stable banking sector have worked to ensure macroeconomic stability that have shielded the country in the last crisis. In January, the government successfully raised USD 1.5 billion in global bonds, after Standard & Poor raised its outlook from stable to positive. However, strong headwinds from the second global slowdown are bringing significant downside risks to the economy, hence the need to be prepared. Should the global slowdown persist, domestic demand, in particular investment and government spending, could boost growth to around 4.2 and 5 percent in 2012 and 2013, respectively. However, such a stimulus can only be sustained if matched by higher tax revenues. The Executive’s effort to strengthen tax administration and push for the immediate passage of the tobacco and alcohol excise and fiscal incentives bills are steps in the right direction. In addition, the country needs to focus on generating higher, sustained, and more inclusive growth. Philippine growth has lagged behind its regional peers, while poverty, inequality, and labor market outcomes have not improved as much. More than a quarter of the population lives below the official poverty line and another quarter vulnerable to poverty. The middle class

6
remains small at about 15 percent of the population of which about a third resides or works abroad. Inequality has worsened in the last decade and the quality of employment remains much weaker relative to the country’s potential and when compared to countries with similar levels of development. The urgent task now is to address the key impediments to accelerating inclusive growth in order to bring the country to a higher level of development and bring prosperity to all Filipinos. Three key areas of reform need to be addressed: i) strengthening public financial management (PFM), ii) raising tax revenues efficiently and equitably, and iii) enhancing competitiveness to attract more investment. Successful PFM reforms would allow the public to see more tangible improvements in governance and convince them that their taxes are being spent wisely. This crucial reform would help make a better case for tax policy reforms. Successful implementation of public sector reforms would allow the country to increase public investment and pro‐poor spending and take advantage of new opportunities arising from the global economic rebalancing, given rising production costs in the rest of the region, including China. A window of opportunity currently exists to get these critical reforms started. The country is benefiting from strong macroeconomic fundamentals, political stability, and a popular government that is seen by many as committed to improving governance and reducing poverty. Several reforms have successfully started, notably in public financial management. However, the window of opportunity is narrowing given elections in 2013 and 2016 and the historical difficulty of moving forward with reforms when the campaign period kicks in. Now is the time to implement the reforms needed to accelerate growth, create jobs, and reduce poverty.

7
Recent Economic and Policy Developments Output and Demand
1. The Philippine economy grew slower than expected at 3.7 percent in 2011, held back by weak public spending and external demand. Growth was buoyed by strong household consumption as fixed capital investments and government spending were subdued, and net exports pulled down by the global slowdown. Growth was slightly lower than its ASEAN1 neighbors and only ahead of Thailand, which saw its economy fall by nine percent in the fourth quarter (Q4) as a result of severe flooding in the second half of 2011 (Figure 1). 2. In Q4, GDP growth slightly improved at 3.7 percent, 0.1 percentage points (ppt) higher than the previous quarter.2 As in past quarters, growth was driven by remittance‐fueled household consumption, which grew by 6.7 percent, much higher than its 4.4 percent average growth in the last decade3 (Figure 2). Full year investment growth was “artificially” lifted by a 70‐fold increase in inventory as firms were unable to sell their goods given weaker external demand, supply chain disruptions (e.g., Japan tsunami in Q1 and Thai flooding in Q4), and weaker construction demand. The government’s Disbursement Acceleration Plan (DAP) was partially successful and contributed 1.3 ppt4 to GDP growth in Q4, up from 0.3 ppt in Q3, but this was not enough to push growth up to the targeted level of around five percent. A faster pick‐up in spending is expected in 2012 given base effects and continued efforts to accelerate project implementation. 3. On the production side, the services sector continued to drive growth as agriculture and industry were buffeted by typhoon damages and weaker demand for construction and manufactured goods. Growth of the services sector was sustained at above five percent, contributing 3.2 ppt to growth in Q4 (Figure 3). The real estate, renting, and business activities sub‐sector, which includes the fast growing business process outsourcing (BPO) industry, contributed 0.9 ppt to growth. The BPO industry’s total (i.e., direct plus indirect) contribution to growth through real estate, construction, retail trade, and telecommunications is estimated to account for some 11 percent of GDP in 2011,5 roughly the same as merchandise exports value‐added as a share of GDP.6 Though industry growth was muted, the construction sub‐sector rebounded in Q4, with public construction growing by almost 50 percent—a result of the DAP.
1 This refers to the Association of South East Asian Nations. 2 Third quarter growth was revised from 3.2 to 3.6 percent, largely due to an upward adjustment in durable equipment. 3 Since Q4 2010, household consumption has been growing above its 1999‐2009 average growth rate of 4.4 percent. Household consumption growth accelerated to above five and six percent in the first and second half of 2011, respectively, rates last seen in 2003‐04. 4 This is computed as the contribution of government consumption and public construction to GDP growth. 5 This is estimated as 60 percent of gross value‐added (GVA) of renting and other business activities, 60 percent of real estate and ownership of dwelling, 30 percent of construction, 10 percent of retail trade, and 10 percent of transportation and communications, all as percentages of GDP. See the special focus section on real estate for more discussion on the BPO industry’s contribution to the economy. 6 This is estimated at around 11 percent of GDP in 2010.

8
The agricultural sector suffered from damages inflicted by Typhoons Pedring, Quiel, and Sendong, which destroyed over PHP 8.6 billion worth of agricultural produce,7 taking away 0.3 ppt of Q4 growth, not counting large‐scale damages to properties and lives. The section on disaster and risk management (Special Focus 1) highlights the need for the country to improve its disaster and risk management policies and programs to mitigate the costly economic and social consequences of recurring natural disasters.
Figure 1. Philippine economic growth is broadly in line with its neighbors.
Figure 2. Higher consumption growth buoyed GDP as exports and government spending contracted.
Source: Haver Analytics
Source: National Statistical Coordination Board (NSCB)
Figure 3. Services buoyed growth as industry and agriculture slowed.
Figure 4. More people are forced to find work in Q4.
Source: NSCB Source: National Statistics Office (NSO)
4. Last year’s respectable growth amid the weak external environment and lower public spending underscores the economy’s resiliency to external shocks given strong macroeconomic fundamentals as a result of past reforms. These reforms, notably the banking sector reform after the Asian Financial Crisis and the fiscal reform in 2004 to avert the
7 Source: Department of Agriculture
‐15
‐10
‐5
0
5
10
15
20
Q1 Q2 Q3 Q4 Q1 Q2 Q3 Q4 Q1 Q2 Q3 Q4
2009 2010 2011
Percent
Regional GDP Growth Rates (%)
China Indonesia Malaysia
Philippines Thailand Vietnam
‐10
‐5
0
5
10
15
Q1 Q2 Q3 Q4 Q1 Q2 Q3 Q4 Q1 Q2 Q3 Q4
2009 2010 2011
Percentage
point
Demand Side: Contribution Growth
Discrepancy Net ExportsInvestment Govt ConsumptionPrivate Consumption GDP growth
‐2
0
2
4
6
8
Q1 Q2 Q3 Q4 Q1 Q2 Q3 Q4 Q1 Q2 Q3 Q4
2009 2010 2011
Percentage
point
Supply Side: Contribution to Growth
Agriculture Industry Services
50
52
54
56
58
60
0.0
0.5
1.0
1.5
2.0
2.5
Oct 07 Oct 08 Oct 09 Oct 10 Oct 11Percent
Millions
Labor Force and Job Creation
Change in actual labor force
Job Creation
Share of formal employment (rhs)

9
impending fiscal crisis, have strengthened the country’s fundamentals as evidenced by lower borrowing costs by as much as 500 basis points, healthy current account surpluses, a five‐fold increase in international reserves, falling debt ratios, and stable and low inflation. These reforms have helped the country withstand the impact of the previous and current global slowdown. However, without further reforms to address critical constraints to growth, sustained growth at above five percent will be very difficult to achieve. We return to this topic in the section of the report on the medium to long‐term agenda.
Employment and Poverty 5. The labor market saw some improvements last year. The number of people with jobs improved markedly in Q4, with a two‐fold increase in jobs. However, the increase is largely attributed to the unusual increase in the labor force participation rate, by 2.1 ppt, instead of new job demand (Figure 4).8 Of the 2.1 million new jobs recorded between October 2010 and October 2011, the bulk was recorded in services (1.2 million) while agriculture saw 0.6 million new jobs, a turnaround from the 0.1 million job losses in October 2010. In addition, the share of wage and salaried workers increased by 0.7 ppt. These developments contributed to a lower underemployment rate of 19.1 from 19.6 percent and lower unemployment rate of 6.4 percent from 7.1 percent. While the results are encouraging, the Social Weather Stations (SWS), an independent survey organization, reported that unemployment was much higher at about 24 percent. Box 1 attempts to explain the differences between the official and SWS unemployment statistics. The fall in the unemployment rate despite the increase in the labor force participation rate suggests either an improving elasticity of employment to growth or some deterioration in welfare that forces more people to find work to maintain real household income. The latter more likely explains the real state of the labor market. Box 2 discusses two indicators that support this argument. 6. A second level analysis, however, reveals that the quality of jobs remains weak despite the improving headline numbers. More than 80 percent of new jobs were recorded in the informal sector, mostly in retail trade, and real wages have not increased from its low levels. This, together with high self‐rated poverty and hunger incidences (discussed below) and high perceived levels of unemployment, point to structural weaknesses in the labor market. Majority of Filipino workers are informally employed9 and have little or no protection against job losses and have few opportunities to enhance their future job prospects. The forthcoming Philippine Development Report 2012 will discuss the state of Philippine employment and discuss some options on how the country can generate more and better jobs.
8 As of press time, preliminary employment numbers for January 2012 show that the labor force participation rate went back to 64.3 percent (from 66.3 percent in October 2011), the unemployment rate returned to 7.2 percent, and the underemployment rate improved slightly to 18.8 percent. 9 Informal employment is proxied by workers under own account and unpaid family workers, whereas formal employment is proxied by wage and salary workers.

10
Box 1. Explaining the Difference between SWS and Official Unemployment Rates
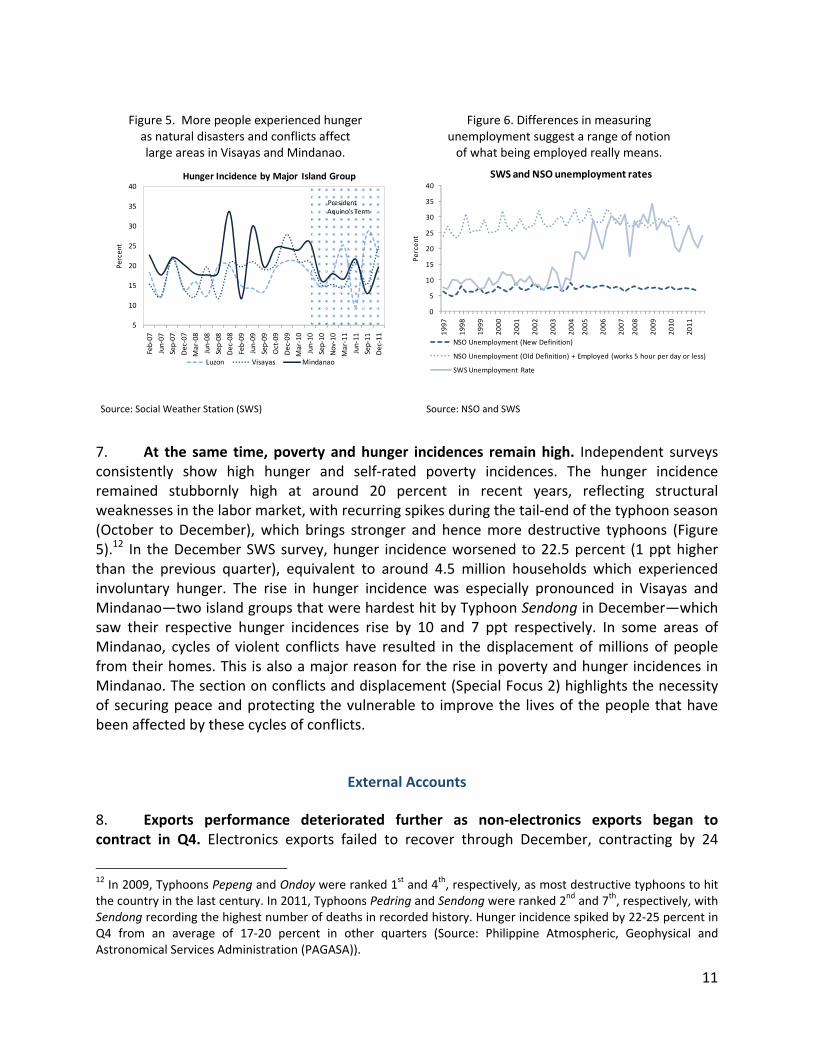
While the official unemployment rate is around six to eight percent, the actual number of people without jobs may be much higher. According to a recent survey by SWS, the unemployment rate reached 24 percent in December 2011—much higher than official statistics by about 18 ppt (or 14 ppt under the old definition in used before 2005). The discrepancy between the two statistics is a result of several factors, including i) different definitions10 and sampling designs11, ii) some non‐sampling errors which could affect the significance of the results, and iii) possibly varying notions over time of what being employed really means. For example, a person who worked for at least an hour is considered employed by official statistics but the same person may not consider this as real work. Our analysis shows that the discrepancy may be caused by difference in the definition of work in terms of hours of work—a proxy indicator that we use to measure the subjective definition of what employment really means to the respondents. If the definition of official employment is adjusted from at least an hour of work to around five hours of work per day, then the official unemployment rate increases to the level reported in the SWS survey (Figure 6). From these results, we can also infer that there is a gray intersection between unemployment and underemployment.
10 SWS defines an unemployed individual as an adult (18 years and above) who is not working but looking for work. The exact question in the survey is: Kayo po ba ay may trabaho sa kasalukuyan, walang trabaho ngayon pero mayroon dati, o hindi pa nagtrabaho kahit minsan? Kung walang trabaho, kayo po ba ay naghahanap ng trabaho o nagbabalak magtayo ng negosyo, o hindi? (Are you working at present, not working at present but used to work, or have never worked? If not working, are you looking for work or planning to establish a business or not?) Respondents who answered yes in the second question are the unemployed. On the other hand, NSO (largely following the International Labor Organization [ILO] definition) defines an unemployed as those between 15 and 65 years who are i) without work, ii) currently available for work, and iii) seeking work. Starting April 2005, the new unemployment definition was adopted per NSCB Resolution No. 15 dated October 20, 2004. The new definition defines the unemployed as those who are 15 years old and over as of their last birthday and are reported as: i) without work and currently available for work and seeking work, or ii) without work and currently available for work but not seeking work for the following reasons: a) tired/believe no work is available, b) awaiting results of a job application, c) temporarily ill/disabled, d) bad weather, and e) waiting for rehire/job recall. 11 The SWS sample covers 1,200 individuals, which are nationally representative, while the NSO sample covers about 50,000 households, which are regionally representative.
11
Figure 5. More people experienced hunger as natural disasters and conflicts affect large areas in Visayas and Mindanao.
Figure 6. Differences in measuring unemployment suggest a range of notion of what being employed really means.
Source: Social Weather Station (SWS) Source: NSO and SWS
7. At the same time, poverty and hunger incidences remain high. Independent surveys consistently show high hunger and self‐rated poverty incidences. The hunger incidence remained stubbornly high at around 20 percent in recent years, reflecting structural weaknesses in the labor market, with recurring spikes during the tail‐end of the typhoon season (October to December), which brings stronger and hence more destructive typhoons (Figure 5).12 In the December SWS survey, hunger incidence worsened to 22.5 percent (1 ppt higher than the previous quarter), equivalent to around 4.5 million households which experienced involuntary hunger. The rise in hunger incidence was especially pronounced in Visayas and Mindanao—two island groups that were hardest hit by Typhoon Sendong in December—which saw their respective hunger incidences rise by 10 and 7 ppt respectively. In some areas of Mindanao, cycles of violent conflicts have resulted in the displacement of millions of people from their homes. This is also a major reason for the rise in poverty and hunger incidences in Mindanao. The section on conflicts and displacement (Special Focus 2) highlights the necessity of securing peace and protecting the vulnerable to improve the lives of the people that have been affected by these cycles of conflicts.
External Accounts 8. Exports performance deteriorated further as non‐electronics exports began to contract in Q4. Electronics exports failed to recover through December, contracting by 24
12 In 2009, Typhoons Pepeng and Ondoy were ranked 1st and 4th, respectively, as most destructive typhoons to hit the country in the last century. In 2011, Typhoons Pedring and Sendong were ranked 2nd and 7th, respectively, with Sendong recording the highest number of deaths in recorded history. Hunger incidence spiked by 22‐25 percent in Q4 from an average of 17‐20 percent in other quarters (Source: Philippine Atmospheric, Geophysical and Astronomical Services Administration (PAGASA)).
5
10
15
20
25
30
35
40
Feb‐07
Jun‐07
Sep‐07
Dec‐07
Mar‐08
Jun‐08
Sep‐08
Dec‐08
Feb‐09
Jun‐09
Sep‐09
Oct‐09
Dec‐09
Mar‐10
Jun‐10
Sep‐10
Nov‐10
Mar‐11
Jun‐11
Sep‐11
Dec‐11
Percent
Hunger Incidence by Major Island Group
Luzon Visayas Mindanao
PresidentAquino's Term
0
5
10
15
20
25
30
35
40
1997
1998
1999
2000
2001
2002
2003
2004
2005
2006
2007
2008
2009
2010
2011
Percent
SWS and NSO unemployment rates
NSO Unemployment (New Definition)
NSO Unemployment (Old Definition) + Employed (works 5 hour per day or less)
SWS Unemployment Rate

12
percent in 2011. The contraction in electronics exports pulled down total merchandise exports by 21 percent in December, resulting in a seven percent contraction for the full year. Imports of electronics parts followed suit, contracting by two percent through December. On the brighter side, the North American book‐to‐bill ratio13 improved to 0.95 in January 2012 from a low of 0.7 in September 2011, suggesting that a partial recovery may be underway (Figure 7). Non‐electronics exports, which have been resilient up to Q3, began to contract in November, weighed down by the slowing global economy although prospects remains positive in the near‐term. Further diversification of the exports basket and market, which until recently has been dominated by semiconductors and advanced countries, and enhancing the competitiveness of local manufacturers are key to reviving exports performance (Figure 8).14 9. Remittances continued to provide the much needed boost to the current account amid a growing trade deficit, though they are becoming vulnerable to the external environment. Nominal dollar remittances grew by seven percent to USD 20.1 billion in 2011 (nine percent of GDP), fueling household consumption. In real peso terms, remittances have begun to grow in September 2011, a turnaround from a 12‐month contraction since August 2010, thanks to the depreciating peso (Figure 9). Saudi Arabia’s Nitaqat program, which limits the issuance of new work permits to Filipinos, appears to have limited impact on remittances as remittances from Saudi Arabia grew by 11 percent in Q4, up from three percent in Q3. Remittances from the US likewise grew by 11 percent, reflecting the partial recovery of the US economy. In contrast, remittances from Europe contracted by one percent in Q4.
Figure 7. Electronics imports have started to contract, though recent upticks in the book‐to‐bill ratio and volume of production index suggest some
hope for recovery.15
Figure 8. Greater diversification in both product and market bases can help buffer
against further electronics slowdown.
Source: NSO and semi.org
Source: NSO
13 The North American book‐to‐bill ratio refers to the ratio of global billings and bookings of North American headquartered semiconductor equipment producers. All billings and bookings are in millions of dollars and based on a three‐month moving average. 14 See the special focus section on exports in the December 2011 PQU for more discussion. 15 VOPI refers to volume of production index produced by NSO monthly.
0.0
0.2
0.4
0.6
0.8
1.0
1.2
1.4
‐40
‐20
0
20
40
60
80
Feb‐10
Apr‐10
Jun‐10
Aug‐10
Oct‐10
Dec‐10
Feb‐11
Apr‐11
Jun‐11
Aug‐11
Oct‐11
Dec‐11
Percent
Electronics imports, book‐to‐bill ratio & VOPI
Electronics imports growth
Book‐to‐bill
Volume of production index (rhs)
‐60
‐40
‐20
0
20
40
60
80
100
0
1
2
3
4
5
6
7
8
Feb‐09
Apr‐09
Jun‐09
Aug
‐09
Oct‐09
Dec‐09
Feb‐10
Apr‐10
Jun‐10
Aug
‐10
Oct‐10
Dec‐10
Feb‐11
Apr‐11
Jun‐11
Aug
‐11
Oct‐11
Dec‐11
Percen
t
USD billion
Merchandise exports performance
Non‐electronics exports (lhs) Electronics exports (lhs)
Electronics growth Non‐electronics growth
Total exports

13
10. Despite some volatility, foreign portfolio investments (FPI) continued to buoy the financial accounts in 2011. Net FPI in November and December amounted to USD 630 million, closing the year at USD 4.1 billion, 12 percent lower than last year. In January 2012, FPI reached almost USD 600 million, more than triple the inflows in the same period last year as investors seek higher returns given large earnings differentials. In contrast, net foreign direct investment (FDI)16 from January through November was marginal at less than USD 800 million17 (0.3 percent of GDP), driven by reinvested earnings18 of around USD 400 million (Figure 10). While investors, especially European investors,19 are holding back on FDI given large uncertainties, the perennially low level of Philippine FDI is reflective of the country’s weak investment climate, which is able to attract only 10 to 20 percent of what its neighbors receive on average (see Box 3 for more discussion on FDI.) 11. Robust remittances and capital inflows have resulted in record‐high reserves accumulation. Overseas Filipino workers’ (OFW) remittances and foreign investment inflows have allowed the country to further accumulate reserves amounting to another record‐high of USD 75 billion in end‐2011, covering more than 11 months of imports and up to six times the country’s short‐term external liability by residual maturity. In February, gross international reserves further improved to USD 78 billion thanks to proceeds from the USD 1.5 billion global bonds issuance in January 2012.
Figure 9. Real peso remittanceshave started to grow again.20
Figure 10. FDI largely in the form of re‐invested earnings as equity investments retreat.
Source: Bangko Sentral ng Pilipinas (BSP)
Source: BSP
16 BSP definition 17 Preliminary numbers show that full year 2011 FDI inflows amounted to USD 1.3 billion. 18 This is defined as the portion of foreign investors’ earnings that is not distributed as dividend and retained in the local enterprise. 19 From January through November, the Philippines registered net FDI outflows from Europe amounting to USD 303 million, resulting in a total equity investment of only USD 134 million. 20 Three (3) MMA refers to three‐month moving average.
‐10
‐5
0
5
10
15
20
25
Jan‐09
Jun‐09
Nov‐09
Apr‐10
Sep‐10
Feb‐11
Jul‐11
Dec‐11
Percent
Remittance Growth, 3 mma
Nominal USD Nominal PhpReal Php
‐0.5
0.0
0.5
1.0
1.5
2.0
2.5
3.0
‐1
0
1
2
3
1999
2000
2001
2002
2003
2004
2005
2006
2007
2008
2009
2010
YTD Nov
‐11
Percen
t
USD
billion
Philippine FDI flows
Other capital Reinvested earnings
Equity Percent of GDP (rhs)

14
Box 2. Real Income and Hunger Incidence
An examination of real average wage21 reveals two important trends. First, growth in real average wage was mostly negative in the past eight years (2003‐2011) in contrast to positive (though low) growth in GDP per capita (Box Figure 2.1). This means that real income lagged behind economic growth as evidenced by the downward sloping ratio of daily real average wage to daily GDP per capita (Box Figure 2.2). Falling real wage have resulted in higher food expenditure as a share of GDP. From 2003 to 2011, the estimated ratio of food expenditure to GDP almost doubled from 0.31 to 0.52. With higher food cost, hunger incidence worsened remarkably in the same period, from 7 to 20 percent. As real wages shrink, an increasing share of household income is spent on food, leaving less disposable income for other necessities, including human capital investment (i.e., education and healthcare), which adversely affects skills development and retention, and hence, future employment prospects.
Box Figure 2.1. Real wages have fallen despite economic growth.
Box Figure 2.2. Falling real income have led to higher food expenditure ratio and hunger.
Sources: BLES, NSO, NSCB
Sources: BLES, NSO, NSCB, SWS, and WB staff estimates
21 This refers to average daily basic pay in real terms of all workers in all industries (both agricultural and non‐agricultural). Data are sourced from the Bureau of Labor and Employment Statistics (BLES). Data exclude basic pay of wage and salary workers paid on commission basis (e.g. bus drivers), honorarium, and boundary system as in the case of jeepney and tricycle drivers. Boundary system refers to a fixed amount paid by drivers to owners in exchange for using the vehicle to make a living.
‐15
‐10
‐5
0
5
10
2003 2004 2005 2006 2007 2008 2009 2010 2011
Percent
Real wage and GDP per capita growth
Real Wage Growth Rate GDP per Capita Growth Rate
0.0
0.2
0.4
0.6
0.8
1.0
1.2
0
5
10
15
20
25
2003 2004 2005 2006 2007 2008 2009 2010 2011
Percent
Real household income and overall hunger
Overall hunger incidence
Ratio of real wage to GDP per capita per day (rhs)
Ratio of food expenditure to GDP (rhs)

15
Box 3. Philippine FDI Performance Global foreign direct investment (FDI) inflows rose modestly by five percent to USD 1.24 trillion in 2010 after a big fall in 2009. However, the 2010 level was still below pre‐crisis levels indicating that investment confidence has not fully recovered. The resurgence of FDI inflows in 2010 is attributed to increased FDI flows into and among developing countries, which grew by 12 percent. FDI inflows to South East Asia, with the exception of the Philippines, have recovered after the 2009 slowdown. In 2010, FDI inflows to the region more than doubled to USD 80 billion, surpassing its record‐high of USD 76 billion in 2007. Among South East Asian countries, the Philippines was the only country which experienced a decline in FDI in 2010. Philippine FDI has clearly underperformed in the last 15 years. Average annual FDI amounts to only USD 1‐2 billion, well below its neighbors which attract more than USD 5 billion annually. As a percent of fixed capital formation, the country’s FDI flow has also been very low at six to eight percent (vis‐à‐vis Vietnam, for example, at above 20 percent) (Box Table 3.1). The Philippines was ranked 116th in terms of inward FDI performance index in 2010, meaning that the Philippines received a much lower amount of FDI considering its level of development.
Box Table 3.1. Historical and post‐2009 global FDI flows
Notwithstanding the country’s strong fundamentals that have insulated it from past crises, low levels of FDI and relatively lower economic growth point to serious structural weaknesses in the domestic economy. As such, it is imperative for the country to address critical constraints to growth. Improving the investment climate requires structural reforms to reduce the cost of doing business, improve governance, and raise revenues to allow the country to accumulate more physical and human capital to improve competitiveness. These in turn will help the country attract more FDI and spur domestic investment, allowing the country to sustain growth at above five percent in the decades to come.
Selected References Association of Southeast Asian Nations. (2011) “Sustaining FDI Flows in a Post‐Crisis World.” ASEAN
Investment Report. Jakarta, November. International Monetary Fund. (2011) International Financial Statistics. Washington D.C., November. International Monetary Fund. (2011) World Economic Outlook. Washington D.C., September. United Nations Conference on Trade and Development. (2011) World Investment Report. Geneva.
Region/Country1995-2004 (average)
2005-2007 (average)
2008 2009 20101995-2004 (average)
2008 2009 2010
World 718.5 1,471.8 1,744.1 1,185.0 1,243.7 9.8 12.5 9.5 9.1Developing economies 199.8 444.9 658.0 510.6 573.6 11.8 13.4 10.2 9.6South-East Asia 26.7 57.7 46.9 38.0 79.4 15.7 12.5 9.8 16.4
Indonesia 0.8 6.7 9.3 4.9 13.3 1.7 6.6 2.9 5.8Malaysia 4.1 6.2 7.2 1.4 9.1 14.2 16.5 3.7 18.9Philippines 1.2 2.6 1.5 2.0 1.7 8.0 6.3 8.3 5.8Singapore 13.0 27.3 8.6 15.3 38.6 45.7 16.4 29.9 71.3Thailand 4.5 9.6 8.4 5.0 5.8 11.1 11.3 7.7 7.3Viet Nam 1.6 3.7 9.6 7.6 8.2 17.8 30.4 23.4 22.9
Source: UNCTAD, World Investment Report 2011
FDI flows (USD billion) Percent of gross fixed capital formation

16
Figure 11. The yield curve continues to flatten. Figure 12. The recovery in net foreignbuying lifted the PSEi to a new record high.22
Source: Philippine Dealing & Exchange Corp. (PDEX) Source: Philippine Stock Exchange (PSE)
Financial Markets
12. Philippine bonds and equity markets are riding on the country’s positive outlook. The Philippine government successfully raised USD 1.5 billion in global bonds in early January, fetching a rate of five percent (around 200 basis points above comparable US treasuries). The issuance came after Standard & Poor’s raised its outlook for the Philippines from stable to positive in December 2011. Despite some volatility in sovereign spreads brought about by heightened Euro Zone debt concerns, borrowing costs for the government remain low. The yield curve has flattened further in January, suggesting expectations of further monetary policy easing and increasing confidence in the country’s ability to pay its debts (Figure 11). Meanwhile, the equity market closed at a high note in 2011, lifted by a surge in net foreign buying from a net sell‐out in Q3. The stock market index continued to rally, reaching an all‐time high of 5,000 in early March 2012 (Figure 12).
Inflation and Monetary Policy
13. CPI inflation averaged 4.8 percent in 2011, near the high‐end of the BSP’s target range. Food inflation eased to 4.1 percent in December, the lowest in 2011, due to ample supply of rice and muted global food prices despite some crop damages brought by Typhoon Sendong. Lower food inflation was accompanied by downward adjustments in the price of fuel and lower electricity charges in the National Capital Region. Inflation further slowed to 2.7 percent in February 2012, as food inflation decelerated to 1.4 percent as domestic supply of vegetables and global rice stocks increased (Figure 13). Transport inflation slowed to three percent from an average of six percent last year, as the effect of regulated fare hikes waned. 14. With benign inflation and expected slower growth, the Monetary Board cut policy rates twice in Q1 2012. The Monetary Board reduced its policy rates in January and March,
22 This refers to the Philippine Stock Exchange index.
0
2
4
6
8
10
1M 3M 6M 1Y 2Y 3Y 4Y 5Y 7Y 10Y 20Y 25Y
Percent
Tenors
Yield Curve (Treasury Reference Rates)
Oct‐10 Nov‐10 Apr‐11
11‐Nov 12‐Jan
(15)
(10)
(5)
‐
5
10
15
20
25
30
‐
1,000
2,000
3,000
4,000
5,000
6,000
Mar‐09
Jun‐09
Sep‐09
Dec‐09
Mar‐10
Jun‐10
Sep‐10
Dec‐10
Mar‐11
Jun‐11
Sep‐11
Dec‐11
Mar‐12
PHP billion
Philippine Stock Market Performance
Net Foreign Buy (rhs) PSEi

17
each by 25 basis points, bringing the overnight borrowing rate to four percent and the overnight lending rate to six percent. In February, the reserve requirement was cut by three ppt to 18 percent to rationalize the BSP’s reserve requirement policy and allow banks to recoup forgone interest income from the termination of interest payments on reserves. The move was seen by some analysts to negatively affect bank profits and hence credit standing, although the BSP asserts that the lower reserve requirement, which frees up around PHP 100 billion (around one percent of GDP), will allow banks to offset some losses.23
Figure 13. Slower food and transport
inflation brought down overall inflation.
Figure 14. Outstanding loans are still at comfortable levels, despite the accelerated growth last year.
Source: BSP Source: BSP
15. Coming from a low base, the growing loans portfolio of Philippine banks24 remains sustainable given banking reforms instituted in the last 15 years. The banking sector has maintained a conservative stance on lending, especially to the real estate sector, guarding against an expanding lending portfolio and from possible lowering of bank credit standards. Credit growth, which has been accelerating since the start of 2011, remains manageable as manufacturing and real estate loans are still small relative to GDP, at five and four percent of GDP, respectively (Figure 14). Banks’ exposure to real estate stands at around 10 percent, more conservative than the BSP’s 20 percent ceiling while total credit to the private sector stood at 35 percent of GDP in December 2011, much lower compared to 43 percent of GDP a decade ago and when compared to levels in other countries.
Fiscal Policy
16. Government spending in 2011 was lower than programmed despite accelerated spending in Q4. In Q4, disbursement grew by 33 percent from last year, with significant increases posted in subsidies to government‐owned and controlled corporations (GOCCs),
23 Prior to the change, interest rate amounts to four percent per annum on 40 percent of “statutory reserves” or reserves kept at the BSP, which comprise 10 ppt out of the previous 21 ppt reserve requirement. The interest rate on “liquidity reserves” or reserves kept in bank vaults, which comprise the remaining 11 ppt, is equivalent to 50 basis points below comparable government securities. According to the February 2012 Global Source study entitled “Reserve Requirement Change,” the estimated net losses of banks amount to around PHP 5 billion. 24 This refers only to universal and commercial banks.
0
2
4
6
Jan‐11
Feb‐11
Mar‐11
Apr‐11
May‐11
Jun‐11
Jul‐11
Aug‐11
Sep‐11
Oct‐11
Nov‐11
Dec‐11
Jan‐12
Feb‐12
Percent
Contribution to YoY InflationOthers Transport
Fuel, Light and Water Food and Beverage
Inflation Rate
0
2
4
6
8
10
12
14
Q1 Q2 Q3 Q4 Q1 Q2 Q3 Q4 Q1 Q2 Q3 Q4 Q1 Q2 Q3 Q4 Q1 Q2 Q3 Q4
2007 2008 2009 2010 2011
Percen
t
Production and household loans (in percent of GDP)
Households Real estate Manufacturing

18
maintenance and other operating expenditures, and personnel services—the areas targeted by the Disbursement Acceleration Plan (DAP). Full year capital outlays fell by 12 percent against last year despite the noticeable spending catch‐up in Q4. As explained in the December 2011 edition of the Philippines Quarterly Update, under‐spending in infrastructure was largely on account of institutional reforms to improve transparency and cost‐effectiveness of spending. The DAP closed the full year gap between programmed spending25 and disbursement by 0.8 ppt of GDP after three quarters of under‐spending, resulting in a gap between actual and programmed deficit equivalent to 1.1 percent of GDP (Table 1) or a full year deficit of two percent of GDP. 17. To ensure that growth is not compromised again in 2012, the government has committed to fast‐tracking the implementation of government programs and projects identified in the 2012 Budget. For example, the Department of Public Works and Highways (DPWH) has already bid out 85 percent of its infrastructure projects (a total of 1,818 projects) as of mid‐February 2012. DPWH confirms that it has issued the notice to proceed to almost 70 percent of the 1,818 projects, allowing implementation to commence early during the dry season with completion expected within the year for projects with shorter gestation periods.
18. Tax effort improved in 2011 largely on account of tax administration efforts but more taxes are needed to support spending this year. In particular, policy reforms are needed to plug holes in the tax system. Tax effort improved to 12.3 percent of GDP, a 0.2 ppt of GDP improvement from last year, largely on account of improved tax administration. However, the actual contribution of tax administration effort is estimated to be higher by around 0.5 ppt of GDP as the present tax system is designed to lose around 0.3 ppt of GDP annually due to non‐indexation of excise taxes and losses from various tax incentives.
Table 1. National government fiscal gap
25 This refers to the Development Budget Coordination Committee’s (DBCC) programmed expenditure for the year.
Q1 Q2 Q3 Q4 Year
GAP1 (PHP billion)
Total Revenues 3.8 ‐8.6 ‐18.9 ‐27.6 ‐51.4
Total Expenditure ‐82.0 ‐57.7 ‐65.4 51.5 ‐153.6
Interest Payment ‐10.5 ‐9.5 ‐9.1 ‐13.5 ‐42.7
Primary Spending ‐71.5 ‐48.2 ‐56.3 65.0 ‐110.9
Capital Outlays ‐25.0 ‐48.1 ‐29.0 32.7 ‐69.4
Net Gap (fiscal balance) 85.8 49.1 46.5 ‐79.1 102.2GAP (% of Annual GDP)
Total Revenues 0.0 ‐0.1 ‐0.2 ‐0.3 ‐0.5
Total Expenditure ‐0.8 ‐0.6 ‐0.7 0.5 ‐1.6
Interest Payment ‐0.1 ‐0.1 ‐0.1 ‐0.1 ‐0.4
Primary Spending ‐0.7 ‐0.5 ‐0.6 0.7 ‐1.1
Capital Outlays ‐0.3 ‐0.5 ‐0.3 0.3 ‐0.7
Net Gap (fiscal balance) 0.9 0.5 0.5 ‐0.8 1.1
Source: Department of Finance, Bureau of Treasury, and Department of Budget
and Management, and WB staff calculations.
2011
1/ Actual less programmed.

19
PROSPECTS
Output, Demand, and Employment 19. While Philippine fundamentals remain strong as evidenced by its resiliency in the last crisis, strong headwinds from the second global slowdown are bringing significant downside risks to the economy, hence the need to be prepared. Slower growth in large middle income countries and financial turmoil in Europe are generating large uncertainties for global growth. The most recent projections indicate a recession in Europe and some recovery in USA and Japan for 2012 (Table 2). China’s growth is expected to decelerate further—growth projection was lowered in early March to 7.5 percent, down from the GEP projection of 8.3 percent. This will have a significant impact on the Philippine economy given strong trade links between the two countries. A protracted recession in the Euro Zone and slower growth in other advance and large developing economies are estimated to pull down our base case growth projection of 4.2 percent to around 1 percent.26 A deepening of the Euro Zone debt crisis may also lead to a rise in sovereign spreads and possible credit tightening, which could significantly curtail investments and increase borrowing costs. 20. Higher growth in 2012 will be very much dependent on the ability of the government to ramp up spending. The gap between budgeted and actual spending in 2011 was equivalent to 1.6 percent of GDP compared to an average of 0.8 percent of GDP in 2008‐10. Under a protracted global slowdown, domestic demand, in particular investments and government spending will have to play a bigger role in achieving the country’s growth targets for 2012 and beyond, especially in light of weak public spending in 2011. Appropriate fiscal and monetary policy responses are expected to boost growth to 4.2 and 5 percent in 2012 and 2013, respectively, assuming sustained growth in consumption and some improvement in investments and exports. However, a stimulus can only be sustained if matched by higher tax revenues. The Executive’s effort to strengthen tax administration and push for the immediate passage of the tobacco and alcohol excise and fiscal incentives bills are steps in the right direction. 21. Employment prospects this year will see some improvements given higher public spending and continued growth in some acyclical industries. Higher infrastructure spending is expected to create hundreds of thousands of new jobs in the construction and trade sub‐sectors while continuous growth of the BPO industry is expected to generate 100,000 new jobs this year, although industry expansion is being slowed down by the diminishing supply of qualified workers.27 On the downside, the global slowdown is expected to significantly affect employment prospects in the exports sector, in particular electronics, which accounts for
26 See the December 2011 edition of the Philippines Quarterly Update for more details on the low case scenario. 27 BPO firms have expressed the need for a more qualified talent pool to reduce training costs currently amounting to PHP5,000 per employee (source: Business Processing Association Philippines (BPAP)).

20
around half of the estimated one million direct jobs in the sector.28 Slower deployment of overseas Filipino workers could also dampen employment prospects in the coming quarters. Over the medium‐term, no significant changes in the level and quality of employment are expected unless structural reforms to address critical growth constraints are implemented.
Table 2. Growth projections
External Accounts 22. Trade prospects, especially for electronics, face large uncertainties given the projected recession in Europe and slowdown elsewhere. The most recent indicators of trade (e.g., North American book‐to‐bill ratio, import of electronic parts, and partner country GDP and import growths) suggest a slow recovery for electronics and modest growth for non‐electronics. Greater dependency on regional production chains also makes Philippine exports more susceptible to supply chain disruptions. The combined impact of external developments plus the low base effect in 2011 are estimated to lead to low growth for merchandise exports. However, overall exports growth is projected to be higher due to the strong performance of the BPO industry, which continues to grow at above 15 percent. To spur growth, further diversification in exports products and markets, higher productivity, and lower production costs are needed.29 A welcome development for capital‐intensive exporters in economic zones (primarily electronics manufacturers) is the one year extension of the special discount on generation rates previously set to expire in December 2011. The discount, which the government has committed to subsidize, is estimated at PHP 1.2 billion. 23. Despite higher trade deficit, the balance of payments is expected to remain in healthy surplus, driven by robust remittances and strong capital inflows. The current account surplus is projected at 1.7 percent of GDP in 2012 aided by robust, albeit slowing, remittance growth. Remittances are projected to grow slower at 5 and 5.5 percent in 2012 and 2013, respectively,
28 Sources: 2009 World Bank Enterprise Survey and Semiconductor and Electronics Industries in the Philippines, Inc. (SEIPI) 29 See the December 2011 edition of the Philippines Quarterly Update for more discussion on the state of Philippine exports.
20111/
2012 2013 2011 2012 2013
USA 1.7 2.2 2.4 0.2 0.4 ‐0.3
EU 1.6 ‐0.3 1.1 0.0 ‐1.4 ‐0.6
Japan ‐0.9 1.9 1.6 ‐0.4 ‐0.4 ‐1.9
China 9.1 8.4 8.3 ‐0.4 ‐0.6 ‐5.2
Asean 5.2 5.5 5.6 ‐0.1 ‐0.1 ‐2.8
World 3.7 3.4 4.0 0.1 ‐0.3 ‐1.6
1/Estimated full year growth
Source: World Bank's Global Economic Prospects January 2012
Forecast Change from October 2011

21
as deployment of overseas workers slows due to i) the country’s more stringent implementation of its migrant workers’ bill of rights, ii) political uncertainties in several host countries, and iii) continued slowdown in advance economies. As a share of GDP, remittances have been falling, from 10.5 percent in 2005 to 9 percent in 2011 given slower remittance growth relative to GDP in all regions except Asia (Figure 15). These developments suggest the need to rely less on remittances to drive growth and the need for policymakers to rebalance growth away from consumption to investment and exports over the medium‐term.
Figure 15. Remittance origin has shifted to Asia from elsewhere.
Source: BSP
24. Capital inflows will largely be driven by foreign portfolio investment (FPI). FPI inflows are expected to remain strong due to investor expectation of higher returns from emerging markets including the Philippines. In 2012 FPI can easily reach USD 4 billion but FDI is projected to remain modest, possibly reaching USD 1.5 billion in 2012. In the medium‐term, FDI is projected to double to around USD 3 billion as public‐private partnership (PPP) projects accelerate and as current reforms to address investment climate issues bear results. The Joint Foreign Chambers (JFC), under its “Arangkada Philippines” initiative, estimates that the Philippines must attract USD 7.5 billion in FDI annually for the country to grow twice as fast at seven to eight percent. This will only be possible if critical constraints to growth are addressed.
Inflation and Monetary Policy
25. CPI Inflation for the year is projected at 3.5 percent, at the low‐end of the BSP’s three to five percent target range, before accelerating to four percent in 2013 as the output gap narrows. Prices of food as well as fuel, light, and water (FLW) have started to fall in Q4 2011 and early 2012, and are expected to remain low and stable this year given lower commodity prices as the global economy slows. Moreover, the lifting of trade restrictions such as India’s export ban on rice should help keep rice prices stable. While average crude price is projected at USD 98 per barrel in 2012,30 recent supply disruptions in Saudi Arabia that pushed crude price up to USD 128 per barrel clearly point to upside risks to inflation. Supply shocks in global
30 World Bank. (2012) “Global Economic Prospects January 2012.”
‐0.8 ‐0.6 ‐0.4 ‐0.2 0 0.2
ASIA
AMERICAS
EUROPE
MIDDLE‐EAST
Percentage points
Change in remittances (percent of GDP)by origin, 2007 vs 2011 (est.)

22
commodity markets due to weather disturbances, production chain disruptions, as well as political tensions in the Middle East and North Africa, also pose upside risks to inflation. 26. Monetary policy easing, which has begun in January 2012, is expected to continue if downside risks to growth persist. While helpful to growth, the efficacy of further monetary policy easing is much less relative to expansionary fiscal policy given the already low interest rate regime and subdued investor appetite as several structural issues remain unresolved. Moreover, there is some risk that lower interest rates for a prolonged period of time can lead to asset bubbles and credit risks, which could dampen long‐term growth prospects.31 To mitigate any risks arising from credit‐induced domestic overheating, a closer monitoring of domestic credit markets—both household and corporate borrowings—is needed to help ensure healthy balance sheets and avoid any credit crunches, particularly in the fast growing real estate sector. The section on real estate market discusses this area in detail (Special Focus 3). While the consensus among banks and the BSP is that the banking sector as a whole remains healthy in part due to past reforms and existing prudential measures, a watchful eye is still needed in case of unexpected external shocks that can significantly affect the credit market.
Fiscal Policy
27. Higher levels of public spending that leads to actual capital formation are needed to help boost growth this year and in the years ahead. In 2012, national government spending is projected to improve to 16.9 percent of GDP (17.4 percent of GDP if a stimulus is enacted) from 16.0 percent of GDP in 2011, on account of spending against 2011 continuing appropriations and accelerated spending of the 2012 Budget. Unobligated 2011 appropriations32 worth PHP 333 billion (equivalent to about 3.4 percent of GDP) can act as a pseudo‐stimulus package if and when disbursed fully in 2012. Moreover, to ensure faster disbursement of the 2012 Budget, the Department of Budget and Management (DBM) has released 47 percent of the budget early in the year. It expects to fully release the remaining balance in the coming months. 28. A sensitivity analysis reveals that changes in total government spending have a significant impact on economic growth. A five ppt increase in the average disbursement‐to‐appropriations ratio of 85 percent33 to 90 percent results in an additional 0.6 ppt increase in GDP growth (Table 3). A higher ratio of 95 percent (i.e., stimulus included) could push growth further by an additional 0.6 ppt to 5.4 percent. A very large stimulus where actual disbursement equals total appropriations can potentially lift growth to six percent. However, a repeat of the 2011 scenario where the ratio falls below 85 percent would lower the base case growth projection from 4.2 to as low as 2.9 percent (not counting the impact of a large external shock).
31 See the December 2011 edition of the Philippines Quarterly Update for more discussion on credit‐induced crisis. 32 This pertains to unobligated appropriations from total 2011 available appropriations of PHP 1.891 trillion, which includes current appropriations (PHP 1 trillion), continuing appropriations (PHP 0.179 trillion), and automatic appropriations (PHP 0.712 trillion). 33 The historical average ratio of around 80 percent is a result of i) low agency absorptive capacity to spend their budget and ii) under‐utilization of un‐programmed and automatic appropriations due to either revenue shortfalls or savings from various sources such as projected interest payments.

23
Table 3. Impact of government spending on 2012 GDP growth34
29. To support the government’s spending program and achieve the targets set forth in the Philippine Development Plan 2011‐16, the government urgently needs to raise tax revenues. Given that the decline in tax effort in the last 15 years is largely rooted in policy weaknesses, in particular excise tax rates that have significantly fallen behind current prices and the frequent granting of tax incentives, many of which are redundant, increasing excise taxes to levels at par with international levels and rationalizing tax incentives are urgently needed to boost revenues and increase spending. If these reforms are not implemented, inflation will continue to erode real tax revenues, and real spending will have to be cut anew, resulting in further deterioration in the country’s economic and social prospects. Enactment of the two crucial tax reforms, together with further improvements in tax administration, is projected to add around 0.5 and 0.6 ppt of GDP in additional tax revenues in 2012 and 2013, respectively, resulting in a tax effort of 12.8 and 13.4 percent of GDP (compared to 12.4 to 12.5 percent of GDP if no policy reforms are enacted). Taking past experience into account, the coming 2013 general elections makes tax legislation much more difficult, hence the urgency of getting these key tax reform measures passed by mid‐year. Box 4 gives a summary of the World Bank’s recent review of public expenditure and revenues which reveals a large revenue and hence spending gap that needs to be bridged to attain the country’s development targets. 30. The country’s debt stock remains broadly sustainable but long‐term sustainability critically depends on raising revenues, which would allow the country to attain investment‐grade credit rating sooner and lower borrowing costs for both the government and the private sector.35 The balance of payments projections shown in Table 4 show a healthy reserve position and a gradually declining external debt to GDP ratio from 36.3 percent of GDP in 2010
34 The analysis assumes total appropriations of PHP 2.1 trillion in 2012, which includes PHP 1.969 trillion in current and automatic appropriations, and PHP 0.127 trillion in continuing appropriations. Actual spending as percentage of total appropriations is defined as cash disbursement as percentage of total appropriations as defined above. Government spending under the national accounts is defined as government consumption and public construction. The relationship between expenditures in the fiscal accounts and government spending in the national accounts is estimated using linear regression for the period 1998‐2011. Results are significant at the 5 percent level with an R‐square of 0.80. 35 The Philippines has managed to improve most of its fiscal indicators (e.g., public debt‐to‐GDP ratio, external debt‐to‐GDP ratio, fiscal deficit, interest payments, etc.) with the exception of the tax effort, which continues to be much lower relative to potential and when compared to countries at similar levels of development.
Fiscal accounts
75 0.4 0.0 2.9
80 5.8 0.7 3.6
85 11.3 1.3 4.2
90 16.7 1.9 4.8
95 22.2 2.5 5.4
100 27.6 3.1 6.0
Source: Bureau of Treasury (BTr), DBM, NSCB, World Bank s ta ff estimates
GDP growth (%)
National income accounts
Actual spending as %
of total appropriations
Government spending
growth (%)
Contribution to GDP
growth (ppt)

24
to 32.1 percent in 2013 (World Bank definition) on account of strong nominal economic growth, higher primary balance, and stronger peso. Similarly, the projected trajectory of the national government (NG) debt exhibits an even more pronounced downward trend, with the debt ratio falling from 52.4 percent of GDP in 2010 to 48 percent of GDP in 2013, barring any unexpected shocks. Figure 16 illustrates a gradually declining NG debt ratio in the base case projection, as well as broad resiliency to a variety of shocks. A 0.5 and 1.0 standard deviation shock on real growth rate, interest rate, and primary balance would increase the debt stock to between 51 and 55 percent of GDP – a level that would still be manageable but would expose the country to vulnerabilities. Further reduction in the debt stock via increased revenues would allow the country to attain investment grade credit rating on its sovereign debt sooner, and consequently allow the private sector to borrow at lower cost, improve profitability, and spur more investments.36
Figure 16. Philippine debt sustainability analysis
Using one‐half SD shock to interest rate, growth rate, and primary balance
Using one SD shock to interest rate, growth rate, and primary balance
Sources: World Bank staff estimates 1/ Shaded areas represent actual data. Individual shocks are permanent 0.5 or 1 standard deviation shocks. Figures in the boxes represent average projections for the respective variables in the baseline and scenario being presented. Ten‐year historical average for the variable is also shown. 2/ Permanent shocks is applied to real interest rate, growth rate, and primary balance.
36 If the excise tax reform takes place, the private sector, including tobacco and alcohol producers, can expect to see lower borrowing costs as higher tax revenues arising from the excise tax reform would help the country attain a credit rating upgrade, leading to lower borrowing cost for the government and private sector.
51
Baseline 46
30
40
50
60
70
80
2005 2007 2009 2011 2013 2015
Per
cen
t of G
DP
Combined shock 2/
combined shock 55
Baseline 46
30
40
50
60
70
80
2005 2007 2009 2011 2013 2015
Per
cen
t of G
DP
Combined shock 2/
combined shock

25
Box 4. Philippine Public Expenditure and Revenue Review The Philippines is caught in a low‐revenue, low‐expenditure, low growth, and slow poverty reduction trap. The average public spending gap compared to other East Asian countries is 2.5 percent of GDP in basic education, 0.7 percent of GDP in health, and 4 percent of GDP in infrastructure. Between 1997 and 2005, revenues declined continuously, pulling down expenditures, and hence a worsening of education and health outcomes and a stagnation of infrastructure. The 2005 tax reforms temporarily halted this decline, resulting in lower fiscal deficits, a decline in the public debt ratio, and a slight increase in priority expenditures, which helped to improve some social outcomes. However, with the passage of several revenue eroding measures beginning 2009, the declining trend resumed.
Philippine health and education spending efficiency is similar to the East Asian average but lower in terms of transport spending efficiency. The efficiency to which the Philippines translates public spending in basic education into primary and secondary school net enrollment ratios, primary completion rates, and literacy tests ranks third among eight countries. Similarly, efficiency in translating public health spending into sector outcomes such as life expectancy, child, infant, and maternal mortality ranks fourth out of eight countries. On the other hand, the efficiency to which public spending on transport is translated into paved roads and railways is significantly below that of other middle income countries, which is likely due to the fact that about one‐third of that spending is lost through various leakages.
Revenues, expenditures, and development outcomes across Philippine regions are becoming more unequal. Since 2000, incomes, wage levels, and poverty rates have been diverging. Indicators on basic education, access to basic infrastructure, and health indicators with the exception of infant and child mortality rates, have also been diverging. This overall trend in development outcomes is due to growing disparity in local government units (LGUs) spending, especially in education, but also in health and housing. Growing inequality in spending across regions, in turn, reflects rising inequity in the distribution of local government revenues due to the lack of an equity‐enhancing factor in the internal revenue allotment (IRA) formula and that NG transfers do not systematically or sufficiently compensate for inequality in the regions’ own resources.
The Philippines tax system does not generate enough resources for its development needs. Tax collections have been chronically below government plans and budgets, mainly due to the enactment of revenue‐eroding measures by Congress. Between 1997 and 2009, the tax effort declined by about four percentage points of GDP, with a brief interruption in 2005‐2007. Two‐thirds of this revenue decline is attributable to the erosion of excise tax collections, which are not indexed to inflation, while the remaining third is due to declining corporate and personal income tax revenues, largely due to various tax incentives granted by Congress.
The tax system is also inequitable across sectors and employment categories and does not generate enough resources from its top income earners. The tax wedge between companies benefitting from tax incentives and those that do not benefit at all is a high of 20 percentage points—among the highest in the world, while tax evasion among the self‐employed and professionals is so high that they pay only 20 percent of income tax collections although they account for 60 percent of non‐corporate income. The remaining 80 percent of personal income taxes is paid by wage earners whose taxes are automatically withheld by their employers. According to the Family Income and Expenditure Survey, the top decile pays less than three percent of their income in personal income taxes. Tax administrative measures such as mandating third party information sharing to enhance taxpayer audit could significantly enhance the equity of the tax system.
Source: World Bank. (2011) “Strengthening Public Finance for More Inclusive Growth.” Public Expenditure Review. Washington D.C.
26
The Medium to Long‐term Agenda: Reforms to Bring Long‐Term Prosperity to All Filipinos
31. While Philippine growth has been higher in the last decade, poverty, inequality, and labor market outcomes have not improved as much. More than a quarter of the population lives below the official poverty threshold and another quarter vulnerable37 to poverty. The middle class38 remains small at about 15 percent of the population of which about a third resides or works abroad. Inequality has worsened in the last decade and the quality of employment remains much weaker relative to the country’s potential and when compared to countries with similar levels of development. These pressing issues rightfully demand urgent attention. 32. Given these pressing issues, the urgent task now is to begin addressing the remaining impediments to growth to bring the country to a higher level of development and bring prosperity to all Filipinos.39 Three key areas of reforms are needed: i) strengthening public financial management, ii) raising tax revenues efficiently and equitably, and iii) enhancing competitiveness to attract more investment.40 Successful implementation of these reforms would allow the country to increase public investment and pro‐poor spending and take advantage of new opportunities arising from the global economic rebalancing, given rising production costs in the rest of the region, including China. Strengthening public finances
Improving public financial management. The new administration has begun to significantly improve public financial management. These include reforms to i) institutionalize zero‐based budgeting and evaluation of government programs to improve the efficiency and effectiveness of the budget, ii) harmonize the chart of accounts and link the financial management information systems of DBM, the Bureau of Treasury (BTR), and the Commission on Audit (COA) to allow end‐to‐end tracking of budget items from appropriations to disbursement, iii) allow for the comprehensive release of allotments to all agencies at the start of the year to fast‐track budget execution, and iv) limit lump‐sum funds only to special purpose funds under conditions of strict disclosure of its use at disaggregated levels. These reforms, if strengthened further and institutionalized beyond the current administration, would allow the public to see more tangible improvements in
37 This is defined as those living below USD 2 a day (in constant PPP terms). 38 This is defined as households with disposable income of at least PHP 30,000 a month (or about USD 700) to meet basic needs and wants. 39 According to the 2012 HSBC publication entitled “The World in 2050,” the Philippines is predicted to become the 16th largest economy by 2050. While ambitious, this is possible if the country embarks on key structural reforms today and ensures that reforms will live through successive governments. 40 These are based on key recommendations from the World Bank’s series of Philippine Development Reports (PDR) from 2005 to 2011, in particular the 2005 PDR entitled “From Short‐term Growth to Sustained Development,” and the 2004 and 2010 discussion briefs for the new administration. The recommendations in the last eight years remain valid up to this day.

27
governance and convince them that their taxes are being spent wisely. This crucial reform would help make a better case for tax policy reforms.
Raising tax revenues. The Philippines is not in a position to choose between tax administration and tax policy adjustments. Both are needed. On the policy side, raising tobacco and alcohol excise tax revenues and rationalizing the granting of tax incentives are critical starting points. Over the medium‐term, a comprehensive tax reform is needed to simplify and improve the efficiency and equity of the tax system towards a broad‐based and low‐rate tax regime. In addition, indexing petroleum excise taxes (frozen since 1996) once petroleum prices have stabilized is also needed to boost revenues and improve the overall progressivity of the tax system. These measures can increase tax effort by up to four ppt of GDP. The success of tax policy measures will depend in large part on the public’s perception of an improving tax administration and quality of public spending that visibly benefits the people. On tax administration, measures to improve tax compliance and reduce corruption, such as mandating third party information sharing with the BIR and public posting of SALNs of top revenue officials as DOLE has done in its website, are needed to minimize leakages estimated at around four percent of GDP.41 Taken together, there is potential in the next decade to raise revenues by up to eight ppt of GDP. The country’s experience between 1985 and 1997, which saw tax effort grow by 6.3 ppt of GDP on account of strong tax administration and policy reforms42 clearly shows that such a large increase in tax revenues is possible with strong political commitment to reform. This large incremental revenue would enable the government to significantly increase its human and physical investment to improve competitiveness and allow more of its people to benefit from growth.
Strengthening overall competitiveness
Strengthening regulatory capacity. The independence and competence of important regulatory bodies and the justice system need to be ensured, and political and judicial interference in regulatory decisions such as reversal of regulatory decisions need to be limited.43 This can be achieved by clearly defining the role of regulatory bodies including limiting conflict of interests, improving transparency, conducting regulatory assessments, and reducing discretionary powers of the regulators through the establishment of clear and rule‐based procedures and policies.
Enhancing competition. The influence of government in investment decisions could be limited as far as prudently possible, in tandem with enhancing competition that builds on the Philippines’ comparatively liberal investment and trade regimes in order to further differentiate itself from competitors. For example, barriers to entry, including foreign
41 The acronyms stand for Bureau of Internal Revenue (BIR), statement of assets, liabilities, and net worth (SALN), and Department of Labor and Employment (DOLE). 42 This is based on the old GDP prices. Tax effort could have increased further after 1997 if not for the 1997 tax reform which eroded some four ppt of GDP in revenues, mostly due to non‐indexation of excise taxes and the granting of several fiscal incentives. 43 Recent debates on mining policy are cases in point.

28
ownership limits, could be eased in a number of sectors, protection in agriculture lowered, more stringent efforts applied to recover uncollected debt and taxes, and the cost of doing business reduced through simplification of approval and regulatory processes.
Addressing infrastructure concerns. Public investment in infrastructure needs to be governed by coherent sector investment planning and implementation, accompanied by tariff regimes more closely aligned to cost recovery. The framework for private participation in infrastructure can be enhanced by further clarifying regulations for the solicitation and evaluation of PPP proposals and restricting the capacity to bid on projects to qualified firms.
Strengthening the financial sector and access to finance. Credit demand is likely to accelerate if strong growth is sustained. Improving private incentives for prudent banking will thus increase in importance. Strengthening the legal authority to take over failing banks without the acquiescence of existing owners and ensuring that bank supervisors can enforce existing regulations unconstrained by the threat of legal challenges when acting in good faith are important reforms that would complement and reinforce the improvements in the regulatory framework and bring the Philippines closer to regional and international sound practice. In addition, policies to ensure affordable access to finance for micro and small enterprises are needed to spur job creation.
Improving skills. Moving to higher value‐added production would require improvements in the supply and quality of skills. Measures include: i) strengthening the capacity of the Technical Education and Skills Development Authority (TESDA) to plan and oversee delivery of tertiary technical education by private and public sector providers, ii) developing industry specific private‐public partnerships to increase quality and capacity in existing institutions, and iii) ensuring the successful implementation of the K‐12 program which shifts the country’s education system from the current 10 years to 12 years plus kindergarten to bring basic education at par with world standards, enabling high school graduates to qualify for employment even without a college degree.
33. A window of opportunity currently exists to get these critical reforms started. The country is benefiting from strong macroeconomic fundamentals, political stability, and a popular government that is seen by many as committed to improving governance and reducing poverty. Several reforms have successfully started, notably in public financial management. However, the window of opportunity is narrowing given elections in 2013 and 2016 and the historical difficulty of moving forward with reforms when the campaign period kicks in. Now is the time to implement the reforms needed to accelerate growth, create jobs, and reduce poverty.

29
SPECIAL FOCUS 1 Financing the Economic Costs of Disasters
in the Philippines: Challenges and Opportunities44 The Philippines is one of the most disaster‐prone countries in the world. It is regularly hit by earthquakes and typhoons. These natural disasters, in particular typhoons, have grave social and economic consequences for the country. About 1,000 lives are lost every year and the estimated cost to the economy is almost one percent of GDP per year. The fiscal capacity of the general government to mitigate risks and address these costs is limited. The amount of funds available is well below 10 percent of the total direct property damages incurred annually. Recent disasters suggest that the country needs up to five percent of GDP to mitigate risks and rebuild damaged properties. Recognizing this shortcoming, the government recently revamped its disaster and risk management strategy from ex‐post reconstruction to ex‐ante preparedness. Moreover, the Philippine government is preparing an analytic framework and strategy to explore the feasibility of disaster risk financing and transfer options to address the layers of risks faced by the country. In this process, the government could employ a risk layering methodology, commonly adopted in corporate risk management, to improve overall risk management. Overview of the Philippines’ exposure to natural hazards 1. The Philippines is one of the most disaster‐prone countries in the world. Located in the Pacific Ring of Fire, which generates over 90 percent of the world’s earthquakes, and on the path of powerful typhoons, the Philippines accounts for 25 percent of all natural disasters reported annually. The most catastrophic of these hazards include typhoons, monsoon rains, droughts, earthquakes, and volcanic eruptions. The country has experienced an average of 2.5 damaging events every year over the past four hundred years. 2. Frequent natural disasters incur significant economic and human costs in the Philippines, thus slowing down the pace of socio‐economic development. Direct economic losses from all natural hazards are estimated at 0.7 percent of GDP per annum during 1990‐2008.45 As shown in Table 1.1, economic losses cover various sectors – infrastructure, agriculture, and the private sector. These figures, however, grossly underestimate the actual economic damage to the economy, in particular damages to other sectors such as tourism, local governments, and commerce, and indirect damages to lost opportunities and jobs. For example, Tropical Storm Ondoy and Typhoon Pepeng in 2009 alone caused PHP 206 billion (2.7 percent of GDP) in direct damages, or roughly ten times the average.
3. The high cost of natural disasters is largely borne by the public sector, which is already hard pressed to finance its other spending needs. According to the Post Disaster Needs
44 This special focus section is based on World Bank. (2010) “Mitigating the Impact of Disasters: A Risk Finance Strategy Study.” Mimeo. 45 Source: National Disaster Risk Reduction and Management Council (NDRRMC)

30
Assessment (2010) prepared by the government and development partners in the aftermath of Pepeng and Ondoy in 2009, 55 percent of total economic losses is borne by the public sector while 45 percent is borne by the private sector. This ratio is broadly similar to other disaster‐prone countries. Were the government to cover the recovery costs of only large disasters, five percent of GDP would have to be appropriated to the budget annually.
Table 1.1. Economic losses from natural disasters in selected sectors, 1999‐2009
Source: Salceda (2009) for 1999‐2008, World Bank PDNA (2009) for 2009
4. Better management of both national and local disaster risk funds could narrow the financing gap, thereby reducing overall fiscal burden. As shown in Table 1.2, funding available from all government and private sector sources to help finance damages caused by the 2009 typhoons could only cover 1.5 percent of total economic damage and about three percent of total public sector disaster recovery and reconstruction needs. Had the local calamity fund (LCF) been fungible, the total amount available for disaster recovery and reconstruction work could be increased from about PHP 0.2 to 14.3 billion.46 This would have a tremendous impact on improving the effectiveness of government response to natural disasters.
46 Since local government (LG) expenditures account for about 25 percent of national government (NG) expenditure (net of internal revenue allotment [IRA]) and the total NG budget in 2009 was PHP 1.144 trillion, total LG expenditures is estimated at PHP 286 billion, which means that the total maximum allocation for local calamity funds is around PHP 14.3 billion. However, in reality since these resources are not fungible across provinces, the emergency risk funding available in case of a natural disaster is well below this amount. For the purposes of this analysis, the average amount of local calamity fund (LCF) per province is computed by dividing the total amount by 79 (the total number of provinces). The result is assumed to be the average amount available for a province to finance one large catastrophic event.
Infrastructure Agricul ture Private Total (Tota l ) Percent of GDP
1999 1.7 2.4 1.5 5.7 0.2
2000 3.0 6.1 0.3 9.4 0.3
2001 4.3 4.2 0.7 9.3 0.2
2002 0.7 1.5 1.2 3.4 0.1
2003 1.6 2.9 0.7 5.2 0.1
2004 4.4 9.2 0.7 14.2 0.3
2005 0.7 2.3 0.4 3.4 0.1
2006 10.4 11.1 0.2 21.7 0.3
2007 1.3 2.9 0.3 4.5 0.1
2008 8.4 14.9 0.3 23.5 0.3
2009 11.2 39.9 93.6 144.7 1.8
10 year average 3.8 8.4 6.7 19.1 0.4
Total 60.1 134.7 107.3 304.8 0.5
1999‐2009 Percent of GDP 0.1 0.2 0.2 0.5
Economic Losses (PHP bi l l ion)

31
5. Given its frequency and increasing strength, preparedness to typhoon‐related disasters would significantly help lower the government’s post‐disaster fiscal burden. Of natural hazards affecting the Philippines, typhoons and the consequential rain, flooding, and landslides that come with them, accounted for almost 62 percent of total economic damages. Table 1.3 provides a summary of the total impact of natural disasters on the Philippine economy.
Table 1.2. Disaster risk financing capabilities vis‐à‐vis disaster risk financing needs (PHP billion)47
**The first estimate 1/ is from ADB and the second 2/ is
from Benson (2009), ***These estimates are in 2009 pesos.
Assessment of the existing risk financing mechanisms48 6. The Philippines has developed an elaborate system of disaster risk management and financing. The three main institutions are i) the National Disaster Risk Reduction and
47 Sectoral agencies have their respective budgets, which are used for rehabilitation and reconstruction of the assets they manage. However, for purposes of this analysis, their budgets are not included because it is difficult to determine whether the rehabilitation or reconstruction is on account of regular operation and maintenance or on account of disaster response. The budgets of agencies, such as Philippine Atmospheric, Geophysical, and Astronomical Services Administration (PAGASA), Philippine Institute of Volcanology and Seismology (PHIVOLCS), National Mapping and Resource Information Authority (NAMRIA), and related agencies are not included as well. The Philippine Crop Insurance Corporation is not included in the analysis as it is covered by a separate World Bank study. 48 The analyses and conclusions in this section are based on an assessment of existing disaster‐related social safety net schemes and programs, which was carried out through written surveys and personal interviews. Specifically, the assessment was based on interviews with the following organizations: i) GSIS, ii) provincial governments, iii) Insurance Commission, iv) Department of Interior and Local Government (DILG), v) Department of Public Works and Highways (DPWH), vi) Department of Social Welfare and Development (DSWD), and vii) Department of National Defense, Office of Civil Defense (DND‐OCD).
Sources of Disaster Funding Year 2008
NCF 2.00
Contingency Fund 0.80
LCF 0.18
Premium Subsidies to PCIC 0.18
Private Donations 0.01
Total Funds From All 3.20
Average Annual Economic
Loss**17.67
1/
19.672/
Economic Damages from
the Biggest Cat Event
1970‐2009***
206.13

32
Management Fund (NDRRMF)49, ii) the Local Disaster Risk Reduction and Management Fund (LDRRMF)50, and iii) the Government Service Insurance System (GSIS), which is mandated, among others, to provide catastrophe insurance coverage for government‐owned assets. 7. Under the Disaster Risk Reduction and Management (DRRM) Act of 2010, the government has placed greater emphasis on disaster preparedness. Most notably, anchored on the principle of a more pro‐active approach to risk reduction, the DRMM Act places greater emphasis on ex‐ante actions, such as preparedness and mitigation, over ex‐post emergency relief. Thus, the declaration of a state of calamity is no longer required to trigger disbursements from both NDRRMF and LDRRMF. Moreover, both funds can now be utilized for expenditures related to ex‐ante investments, including preparedness and mitigation programs, training and procurement of equipment, construction of evacuation centers and other facilities, and even payments for insurance policies, among others. The NDRRMF can be used for up to two years after the occurrence of a disaster.
Table 1.3. Average annual loss by hazard type in the Philippines, 1990‐2006
Source: Benson (2009)
8. The DRRM Act also streamlined the budget allocation process. The NDRRMF is the main fiscal instrument used by the national government to provide assistance to local government units (LGU) and sectors affected by natural disasters. It is a national budget item that is appropriated annually and administered by the Department of Budget and Management (DBM) and is directly allocated to affected agencies and LGUs.51 A portion of the NDRRMF is automatically allocated to the Quick Response Fund (QRF) for the immediate response and recovery efforts of the various government agencies.
9. The DRRM Act also improved the effectiveness of the LDRRMF. For one, the law removed the five percent ceiling imposed on the fund and even set it as the minimum spending for DRRM requirements of LGUs. The local disaster councils created under the law are mandated to monitor and evaluate the use of the funds based on an agreed DRRM plan.
49 Formerly the National Calamity Fund (NCF) 50 Formerly the Local Calamity Fund (LCF) 51 Disbursements from NDRRMF are endorsed by the newly constituted National Disaster Risk Reduction and Management Council (NDRRMC) to the President who decides on the allocation.
Hazard Type
Total Economic Loss
(PHP bi l l ion)
(2005 Prices )
Share of
Tota l
Percent
of GDP
Typhoons 12.2 61.9 0.21
Drought 2.2 11.4 0.04
Earthquake 2.2 11.4 0.04
Volcanic eruptions 1.9 9.7 0.03
Flooding/flash floods 0.9 4.5 0.02
Others 0.2 1.2 0.00
Tota l 19.7 100.0 0.35

33
Moreover, some changes in the LDRRMF allow LGUs to better manage unspent funding from the LDRRMF such as allowing an LGU to transfer unspent LDRRMF to other LGUs or setting aside the unspent LDRRMF in a trust fund for a period of five years.52 10. To further improve its effectiveness, administrative structures could be streamlined to improve the disbursement process and empower local governments. The DRRM Act has the potential to unleash the capacity of the LDRRMF to pool individual local funds to reach PHP 14.3 billion (as discussed earlier) to reduce the gap between funds available and the economic cost of natural disasters. Incentives to pool funds as against keeping the funds in one province for fear of a localized calamity and the exercise of discretion in fiscal decisions could be improved. By clarifying the mechanisms for pooling these local resources, the government could better provide basic disaster relief services and supplant long‐standing practices of relying on foreign funding for basic infrastructure repairs and post disaster reconstruction. 11. The role of the Government Service and Insurance System (GSIS) could be further strengthened.53 While offering a comprehensive coverage including coverage for natural disasters, the GSIS has persistently provided a very low level of insurance coverage, as insurance premiums are based on the depreciable book value rather than replacement costs.54 As such, local governments across provinces, cities, municipalities, and barangays are reluctant to buy GSIS insurance, calling into question the national government’s reinsurance scheme and its ability to meet on‐the‐ground demands. As a result, most government assets at the national and local government level have remained uninsured. To illustrate, in the aftermath of Typhoon Reming in 2007, Albay Province managed to recover 77 percent of economic losses caused by the calamity but indemnity payments collected by the province from GSIS accounted for only 0.4 percent of the total recovery (or only 0.31 percent of the total economic loss) (Salceda 2009). The main reasons for the underinsurance are, among others, i) insufficient budgets for insurance purposes, particularly at the local level and ii) a directive issued by the Commission on Audit prescribing that all government‐owned assets be insured based on the depreciable book value basis (i.e., original book value minus depreciation), rather than on replacement costs. Therefore, though LGUs are presumed to have unlimited guaranteed access to GSIS insurance, pervasive underinsurance renders their insurance protection very much limited.55 A risk layering approach to financing 12. The assessment above shows that the existing system of disaster risk financing in the Philippines mainly relies on the national budget regardless of the frequency and severity of catastrophic events. As a result, the current system of disaster risk financing has been unable
52 If unutilized after this period, the LDRRMF will revert to the LGUs’ general funds. 53 The GSIS is a government financial institution mandated to provide social security coverage for civil servants and to handle the insurance requirements of the public sector. 54 For instance, according to statistics provided by Albay Province, insurance was not even listed as a source of recovery for homeowners who suffered from Typhoon Reming in 2006. 55 The study could not dispel these concerns as written and oral requests for information about the GSIS’ own risk retention and reinsurance protection have remained unanswered.

34
to effectively cope with even relatively small but frequent events, once the budgetary resources allocated for the task during the year have been depleted.
Figure 1.1. Risk layering approach
Source: Gurenko (2008)
13. To better manage financing needs, the government could employ a risk layering approach to tailor‐fit financing instruments according to risk exposure. Commonly applied in corporate risk management, a risk layering methodology matches the different types of risk financing instruments that best address the risk exposure. In simple terms, risks with high frequency tend to be less severe and can be retained or self‐financed by the insured party. In contrast, risks with low frequency are likely to result in severe damages to the insured and therefore should be transferred to third parties best equipped to handle them. For example, disaster impacts that arise from the small events that occur every year, such as typhoons, could be covered by the national and local budgets, while the impact of a catastrophic earthquake in Metro Manila, which occurs once every 200 years, could easily overwhelm domestic resources. As such, innovative financial instruments could be arranged ex‐ante to provide the necessary economic and financial protection if the event were to happen. Figure 1.1 provides a summary of the conceptual framework behind this type of risk financing. Proposed disaster risk financing strategy and policy reforms 14. The government is currently preparing its strategy with assistance from the Global Facility for Disaster Reduction and Recovery (GFDRR) to explore the feasibility of disaster risk financing and transfer options to address the layers of risks faced in the Philippines. The intention of the framework and strategy is to lay out the courses of actions that aim to offer protection for a broader segment of society, starting from the national level in the short and medium‐term and to the household level in the long‐term. The overall objectives of this strategy is to reduce the financial and economic burden and improve the resiliency of the national government, which has historically assumed the full cost of disasters, rendering it vulnerable to disaster impacts. 15. In the process, the Philippines can build on the existing institutional arrangements for disaster risk financing, rather than creating a completely new system. As a starting point, the government could consider adopting a disaster risk financing framework that clearly differentiates the various types of risks. Costs arising from frequent and moderately hazardous
Contingent loans
Risk retention
Risk financing
Reinsurance
Catastrophe bonds
Donor aid
20 year event or up to 3% of fiscal revenue
30 year event or up to 5% of fiscal revenue
30-100 year event or in excess of 5% of fiscal revenue
100-200 year event or in excess of 5% of fiscal revenue
200+ year event or in excess of 5% of fiscal revenue
Cat insurance pools
Catastrophe bonds
Grants/donor aid
Emergency reconstruction loans
Budgetary funds
Contingent loans
Risk retention
Risk financing
Reinsurance
Catastrophe bonds
Donor aid
20 year event or up to 3% of fiscal revenue
30 year event or up to 5% of fiscal revenue
30-100 year event or in excess of 5% of fiscal revenue
100-200 year event or in excess of 5% of fiscal revenue
200+ year event or in excess of 5% of fiscal revenue
Cat insurance pools
Catastrophe bonds
Grants/donor aid
Emergency reconstruction loansEmergency reconstruction loans
Budgetary funds

35
events can be financed from the budget. Risk transfer to third parties may be opted for rare and catastrophic events that would entail significant additional extra‐budgetary resources. 16. The government can also consider bolstering its currently very limited budgetary resources with additional risk financing capacity that relies on fast‐disbursing external or domestic borrowings, such as a capital contingency facility. With regard to rare catastrophic events, the government could put in place national disaster risk transfer instruments that would enable it to access private sources of financing (e.g., global reinsurance and capital markets) on a short notice. It would be advisable, however, for the government to first put in place a reliable and well functioning disaster risk financing mechanism for frequent but relatively small catastrophic events before moving forward with the plans to deal with less frequent highly catastrophic events. 17. The development of a national disaster risk financing strategy in the Philippines could likewise be complemented by pro‐active measures that reduce the vulnerability of the country to natural disasters. Promoting both structural (e.g., retrofitting) and non‐structural (e.g., early warning systems) measures that reduce the vulnerability to natural disasters are crucial actions that should be given the same emphasis. Clear disaster risk reduction (DRR) targets and outputs should be the basis for additional funds from the national and local governments to encourage preventive and mitigation measures. Promoting awareness and educating stakeholders, both public and private sectors, on the benefits of insurance should help improve the level of protection for various segments of society, while insurance reforms can be designed as a long‐term course of action.
Selected References
ADB. (2008) “National Assessment of the State of Disaster Risk Management in the Philippines.”
Manila. Benson, Charlotte. (2009) “Mainstreaming Risk Reduction into Development: Challenges and
Experience in the Philippines.” IFRC. Gurenko, Eugene. (2008) “Catastrophe Risk Financing: Overview.” GFDRR Training. World Bank. Salceda, Joey. (2009) “Disaster Risk Financing and Insurance: Opportunities for Public‐Private
Cooperation.” Presentation at the Annual Bank Conference for Development Economics. Seoul.
World Bank. (2009) “Financial Solutions for Catastrophe Risk Management.” Washington D.C. World Bank. (2009) “Typhoons Ondoy and Pepeng: Post‐Disaster Needs Assessment.”
Washington, D.C.

36
SPECIAL FOCUS 2 Cycles of Conflict and Displacement in Mindanao
This special focus summarizes the results of a major survey conducted in and around the Autonomous Region in Muslim Mindanao (ARMM) to understand the people’s experience of conflict and displacement in the past decade. The findings are analyzed in a joint World Bank‐World Food Programme (WB‐WFP) report entitled “Violent Conflicts and Displacement in Central Mindanao: Challenges for Recovery and Development.”56 The results highlight the frequency and prevalence of displacement, and the damage done to livelihood, access to services, and social cohesion. The study makes some recommendations on how to improve support to vulnerable households and shape strategies for sustainable peace. Introduction 1. The people of Mindanao have long been hit by cycles of violent conflict and displacement and these have intensified in the last decade. “All Out War” in 2000 and hostilities in 2008 each led to the displacement of nearly a million individuals. Tens of thousands were displaced by military operations in 2003 and in recent months with the escalation of combat in parts of Zamboanga Sibugay and Basilan provinces in October 2011. Currently, several thousands of people in and around the Autonomous Region in Muslim Mindanao (ARMM) remain displaced, particularly in Maguindanao Province. 2. The prevalence and characteristics of mass displacement due to violent conflict are the focus of a new joint study by the World Bank (WB) and the World Food Programme (WFP). Built on the results of a random cluster survey in seven provinces in and around ARMM, the study “Violent Conflicts and Displacement in Central Mindanao: Challenges for Recovery and Development” aims to improve understanding of the development challenges caused by violence and displacement in these areas.57 It provides the most detailed insights on the needs of those areas since the 2005 “Joint Needs Assessments for Reconstruction and Development of Conflict‐affected Communities in Mindanao.” 3. During the last decade in Central Mindanao, the survey revealed that people had been repeatedly forced out from their homes by different types of violent conflict. Survey results show that 41 percent of families in the area reported that they had been displaced at least once between 2000 and 2010. In Maguindanao, as many as 82 percent of households were
56 The report is available at www.eMindanao.org/conflict‐and‐displacement and www.worldbank.org.ph. 57 The survey was conducted in Central Mindanao from November to December 2010. It covered 2,759 adults in 231 barangays across five provinces: Lanao del Sur and Maguindanao in the Autonomous Region in Muslim Mindanao (ARMM), as well as Lanao del Norte, North Cotabato, and Sultan Kudarat, all provinces around ARMM. A smaller urban sample was taken in Cotabato City. Data from Basilan and Tawi‐Tawi (both ARMM provinces) are also analyzed in an annex to the report. The survey sample is representative of the whole population within each of the selected provinces. Primary data collection was conducted by the University of the Southeastern Philippines, Davao City.

37
displaced. At the time of the survey, 21 percent of households in that province reported that they were still displaced, compared to four percent or less elsewhere. Across Central Mindanao, ten percent of households experienced displacement five times or more during the decade prior to the survey and 30 percent had been displaced for a continuous duration of over one year. The average duration of displacement was 15.6 months.
Figure 2.1. Percent of people who experienced displacement between 2000 and 2010
The challenges for recovery and development 4. The study provides a detailed evidence‐base strategy for recovery and development for the conflict‐affected communities. In four broad areas, it explores a range of topics in considerable depth, disaggregated by settlement status,58 province, religious belief, ethnic identity group, and type of livelihood:
i. Socio‐economic issues including food security59 and income poverty, livelihood and access to services, and the types of assistance being provided in communities
ii. Governance and participation including access to information and levels of trust among citizens, between citizens and the State, and towards non‐State organizations such as the Moro Islamic Liberation Front (MILF) and Moro National Liberation Front (MNLF)
58 The three categories are those i) currently displaced (at the time of the survey), ii) previously displaced but who have returned to their homes or have resettled elsewhere, and iii) never been displaced. 59 Food Consumption Scores (FCS) were computed to reflect the diversity, frequency, and nutritional value of the food items consumed by the household during the seven‐day recall period. Each food group was assigned a standardized weight representing the nutritional importance of the food group. The FCS is the sum across food groups of the product of the frequency by the weight.
North Cotabato
26%
Maguindanao82%
Sultan Kudarat
11%
Lanao del Sur47%
Lanao del Norte
48%
CotabatoCity11%

38
iii. Security including perceptions of safety and security, people’s experience of violence and local disputes, as well as the agents who are reported to provide safety from crimes
iv. Perceptions on the peace process including how people see the root cause of the violence in and around ARMM, their proposed means to end it, and view of efforts of different actors to build peace
Socio‐economic issues 5. Displaced people were consistently worse off compared to the rest of the population.60 The adverse impact of displacement does not end when people return to their homes. Returning households were almost as vulnerable as those who were still displaced, experiencing almost the same level of food insecurity, income poverty, and poor access to services.
Figure 2.2. Food consumption by settlement status in Central Mindanao
6. Displacement reduces access to education, perpetuating inter‐generational transmission of poverty. Displaced households at the time of the survey reported having allocated just seven percent of their expenditures to education, and previously displaced households that had just returned home reported having allocated 13 percent for education. This compares poorly to households that were never displaced and households who resettled elsewhere, reporting 25 and 34 percent of their income spent on education, respectively. 7. Vulnerabilities were reported to be particularly severe in Maguindanao. Almost half its adult population was displaced at some point in time between 2000 and 2004, and again in 2008. People in the province reported the most severe poverty, food insecurity, and access to services. Households from the area reported the highest levels of food insecurity and the lowest average monthly expenditures (PHP 3,000 compared to an average of PHP 5,750 across the entire survey area). Expenditures on food and borrowing money for food were also found to be very high.
60 Three quarters of those displaced at the time of the survey were in the poorest two income quintiles and one in three was in the poorest quintile. One in ten had a poor FCS and 45 percent were borderline food insecure.
1% 9% 3% 10% 4%14%
34%
17%
45%
21%
85%
57%
81%
44%
75%
Neverdisplaced
Returnedhome
Resettledelsewhere
Currentlydisplaced
Total
FCS Acceptable
FCS Borderline
FCS Poor

39
8. In much of the survey area, water and sanitation were shown to be major concerns. In Central Mindanao as a whole, about one in five households relied on unprotected sources for their water supply. In Lanao del Sur and Tawi‐Tawi, the gaps in access to safe drinking water and sanitation were even more serious. In the former, 40 percent of families said they used lakes, rivers, or ponds, and 13 percent drew from open wells. In Tawi‐Tawi, 16 percent used lakes or rivers, 14 percent sourced their water from open dug wells, and as many as 38 percent relied on rainwater. Sanitation was also particularly poor in the provinces in ARMM. More households in Tawi‐Tawi and Basilan (62 and 42 percent of households, respectively) used open pits as toilets, compared to an average of six percent in Central Mindanao. 9. The survey data, when disaggregated by religion, indicates that Muslims endured more hardships than Christians. Muslims were more likely to have experienced displacement at 59 percent (compared to 20 percent among Christians) and eight times more likely to be displaced at the time of the survey at eight percent (against one percent for Christians). Almost four times more Muslims used unprotected sources for their water supply and on average, travelled twice as far to get to the nearest elementary school and health facility.61 10. In all areas and for respondents in all categories of displacement/settlement, money and jobs were identified by people as the most pressing problems for their families. Across Central Mindanao, the main concerns were money (74 percent), employment (45 percent), food (39 percent), health (27 percent), and education (20 percent). Priorities identified for government assistance on the mainland were broadly similar, though roads (30 percent) and electricity (13 percent) were prioritized higher than respondents' own priorities. In Tawi‐Tawi, access to water (49 percent) and electricity (39 percent) were identified as priorities for government action more than twice as much as in Central Mindanao. People in Basilan identified water (56 percent), roads (46 percent), and electricity (30 percent) as priority for government action.
Figure 2.3. Percent of households in Central Mindanao who received aid or relief assistance in the one year period prior to the survey
61 Fifty three (53) percent of respondents identified themselves as Muslim and 46 percent Christian. Eighty two (82) percent of Muslims cited religion as the most defining factor of their identity (as opposed to clan, ethnicity, or nationality) compared to 46 percent of Christians.
23%
63% 56% 49%
25%
50% 50%37%
47%27%
45%
Lanao de
l Norte
North Cotabato
Sultan
Kud
arat
Lana
o de
l sur
Maguind
anao
Cotaba
to City
Never displaced
Returned
hom
e
Resettled elsew
here
Curren
tly displaced
Total
40
11. Although half of respondents had received some kind of aid, they said that it was not well targeted. Displaced households were least likely to have received assistance in the year prior to the survey. A higher proportion of food secure households had been assisted than those who were food poor. Overall, development aid was found to increase trust, but this is largely limited to village officials and not those at the municipal, provincial, or national levels. Governance and participation 12. The survey data present a mixed picture on the breadth and depth of public participation in decision‐making. Just over half of respondents in Central Mindanao believed they had the ability to contribute to decisions in their barangays (56 percent), but the sense of participation was lower in Tawi‐Tawi (42 percent) and Basilan (18 percent). Fewer felt able to contribute to decisions in their municipalities than in Central Mindanao (35 percent in Tawi‐Tawi and 13 percent in Basilan compared to 40 percent), or in Mindanao in general (21 percent and 10 percent compared to 31 percent). 13. A significant proportion of people in the survey areas considered themselves poorly informed and distrustful of the news in their respective provinces. In Central Mindanao, one‐third of people reported being uninformed or badly informed about events in their province. The highest shares were reported in Maguindanao (64 percent) and Lanao del Sur (49 percent). Reliance on informal channels of information (i.e., through friends and family) was higher in ARMM provinces (53 percent in Basilan and Lanao del Sur, for example) compared to 10 percent in North Cotabato. In Tawi‐Tawi, 22 percent listened to the radio and 17 percent watched television at least occasionally, compared to an average of 65 and 70 percent, respectively, for Central Mindanao. 14. There were significant geographic variations in the proportion of people reporting trust (or a lack of it) in key institutions. On average 80 percent of people in the survey area trusted their barangay, municipal, and national government officials, the Armed Forces of the Philippines (AFP), and the Philippine National Police (PNP). However, in Lanao del Sur and Maguindanao trust levels were lower (for the AFP, 47 percent and 40 percent, respectively, and for PNP, 51 percent and 52 percent, respectively). Trust towards the police was especially low in Basilan (26 percent compared to an average of 72 percent across the five provinces of Central Mindanao). Security 15. A low sense of security prevailed in most communities. In Central Mindanao, less than half the respondents felt safe going to the nearest market (47 percent) and even less safe when a victim of a crime complains to authorities (37 percent) or to the police (37 percent). Less than a quarter of people (17 percent) felt safe meeting a stranger. 16. Most Central Mindanao respondents (about 70 percent) saw the community itself as the provider of some level of security. Barangay officials were the main authority contacted to

41
resolve most types of disputes. About half of the respondents mentioned the police (53 percent) as the provider of security, followed by government (38 percent), and the military (22 percent). The MILF and MNLF were mentioned by only nine percent and four percent, respectively. Maguindanao was the only province where a significant proportion of people said that they looked to the MILF and MNLF to provide safety from crimes (40 percent and 24 percent respectively). Perceptions on causes of conflict and the peace process 17. The primary cause of conflict in Central Mindanao is seen differently by different groups. In North Cotabato (76 percent) and Maguindanao (70 percent), a large majority, saw the struggle for self‐determination as the main driver. Among Muslims, 59 percent proposed signing a peace agreement as the best means to end the violence. This compares with 36 percent for Christians, who were more inclined to emphasize the need to improve the economic situation (74 percent vs. 56 percent), end impunity (45 percent vs. 40 percent), and resolve land conflicts (35 percent vs. 28 percent).
Figure 2.4 Proposed means to end the violence in Central Mindanao provinces
18. The efforts of different groups to end violence in Mindanao were perceived differently from place to place. Overall, a little under half of respondents in Central Mindanao believed the MILF was working “moderately, greatly, or extremely” hard to end the violence (42 percent average for the three categories together), though the figures were higher in Maguindanao (72 percent) and Lanao del Sur (70 percent). The national government scored an average of 83 percent across the five provinces of Central Mindanao, including 70 and 71 percent, respectively, in Lanao del Sur and Maguindanao. In Basilan and Tawi‐Tawi, perceptions of the peace efforts of central government, AFP, MILF, and MNLF were generally lower than in Central Mindanao.
Nothing can be done
30% 10% 7% 3% 2% 18% 11%
Improveeconomy
47% 84% 76% 41%68% 94% 64%
Sign peaceagreement
25% 36% 71% 36% 93% 47% 48%
End impunity38% 47% 40% 45% 36% 53% 43%
Resolve landdisputes
27% 45% 32% 11% 47% 32% 31%
Remove AFP2% 5% 0% 3% 17% 4% 5%
Dismantle CVOs 0% 0% 0% 0% 1% 2% 0%
Other13% 2% 2% 17% 8% 0% 8%
Lanao delNorte
NorthCotabato
SultanKudarat
Lanaodel sur
Maguin-danao
CotabatoCity Total

42
Conclusion, implications, and recommendations 19. Displacement is a multi‐faceted development issue, not just a matter for crisis response by humanitarian agencies. The data on Maguindanao, in particular, indicates the continuation of multiple dimensions of poverty and insecurity. Across almost every survey indicator – from food security to access to services, income poverty to housing – displaced people and returnee households are shown to remain vulnerable and exposed to further shocks. 20. Across Central Mindanao, improved aid effectiveness will hinge on better targeting. Displaced households were least likely to report having received assistance in the year prior to the survey. The proportion of households who received assistance in the poorest income quintile (40 percent) was likewise slightly lower than those in the richest income quintile (43 percent). 21. Technical field analysis of service delivery and infrastructure gaps remain an essential complement to community prioritization of project investments. Perhaps the most striking example of the gap between real and perceived needs concerns water and sanitation. In Lanao del Sur, 53 percent of people drew their water directly from unprotected water sources like lakes, rivers, or open dug wells, whereas the ongoing community development activity was the construction of a barangay hall—clearly a disconnect. 22. Greater access to information and strengthened mechanisms for accountability will help to drive the transformation of institutions. A continuing trend towards greater trust in state institutions would underpin public perceptions of their legitimacy. This has been highlighted by the 2011 World Development Report of the World Bank as a critical pathway out of conflict towards lasting peace. It is hoped that by providing such a breadth of information on people’s experience of displacement, socio‐economic opportunities, governance and security, the WB‐WFP study will help to make relief, recovery and development efforts more effective.
Selected Reference
World Bank and World Food Programme. (2011) “Violent Conflicts and Displacement in Central Mindanao: Challenges for Recovery and Development.” Washington D.C., December.

43
SPECIAL FOCUS 3 The Philippine Real Estate Market: A Cause for Concern?
The real estate market plays a unique role in economic development and financial stability. Boom‐bust cycles62 are intrinsic in real estate markets and impact the economy directly and indirectly through other sectors such as construction and finance. Real estate is often the largest store of wealth in any economy. In the Philippines, households tend to have greater preference for holding wealth in the form of real estate rather than equities. Given these, a closer look at real estate market developments is a critical element of ensuring macroeconomic stability. The Philippine real estate market today is largely driven by BPOs and remittances and less on investors seeking higher returns. Borrower leverage is low and banks have more prudential measures in place. Overall, systemic risks are fairly low, although the residential segment may face downside risks arising from oversupply, hence, the need for careful monitoring.
Recent trends 1. The office and residential segments are both drivers of sustained growth in the Philippine real estate sector. The Business Process Outsourcing (BPO) industry, which has seen impressive growth in the last decade, has fueled the demand for office space and, to a large extent, residential units. Sustained growth in nominal remittances explains the strong demand in the low‐end to mid‐range residential market. Both the BPO sector and remittances likewise provide fuel for the commercial sector as evidenced by the extension of mall hours and mushrooming of 24‐hour convenience stores and restaurants/coffee shops. An estimated 60 percent of remittances directly and indirectly benefit the real estate sector, which includes mall operations.63 2. The BPO industry, proving resilient to the global slowdown, continues to generate robust demand for office space. The influx of new BPO companies together with the expansion of existing ones have resulted in a much faster take up of office space in the central business districts.64 Out of the total office space stock of 5.7 million square meters (sqm) in Metro Manila in 2011, the BPO industry occupies some two million sqm of office space, equivalent to over 40 percent of total (Colliers International 2012). Achieving full occupancy is much faster now as major BPO firms can easily occupy an entire building, which previously took about one year to fill. 3. As developers respond to higher demand and implement lagged projects in the pipeline, the large supply of new office spaces is seen to push vacancy rates upward and may mute rental growth beginning 2012. Rental rates, which contracted by almost 40 percent
62 This reflects delayed supply responses to demand shocks, slow price adjustments owing to illiquidity, and market imperfections (e.g., difficulty of quick sales during times of illiquidity). 63 Source: CB Richard Ellis 64 Developments outside Metro Manila and surrounding provinces are much limited owing to small economies of scale.

44
during the global financial crisis (Figure 3.1), have recovered, growing by an average of eight percent in 2011 owing to the growth in BPOs. However, beginning 2012 through 2014, an average of 470,000 sqm of new office spaces is lined up vis‐à‐vis an average projected take up of 250,000 to 300,000 sqm, which would result in higher vacancy rates and muted rental growth (Figure 3.2). On account of increased supply, albeit a record‐low rental rate (four percent) in 2011, the vacancy rate in the Makati central business district has already started to rise in Q4 2011 from 3.8 to 4.1 percent (quarter‐on‐quarter).65
Figure 3.1. Rising rental rates of office spaces in Metro Manila
Figure 3.2. Increasing office stock inMetro Manila (YOY change refers to flow, RHS).
Source: Jones Lang LaSalle Leechiu Research Source: Colliers International
4. The demand in the low‐end to mid‐range residential property market has been sustained by remittances, while housing demand by BPO employees also contributes to the expansion of residential properties and even the luxury market in the case of BPO expatriates. Developers have recognized that remittances continue to support mid‐scale subdivisions and housing projects in cities and provinces adjacent to Metro Manila such as Batangas, Laguna, and Cavite Provinces. For instance, the housing market in one area in Cavite Province is largely driven by remittances from seafarers.66 BPO expatriate housing demand has buoyed the luxury condominium leasing market in Metro Manila. At the same time, the new middle class comprising of local BPO employees are buying up units in the mid‐range market. Residential condominium sales also benefit from the low interest rate environment and greater supply of lower cost condominiums. 5. However, massive supply of condominiums in the pipeline is beginning to outpace demand. In 2011, supply in major residential districts in Metro Manila increased by about 53 percent to 6,000 units (Table 3.1). Jones Lang LaSalle Leechiu reports that in Metro Manila, the
65 For example, the recent transfer of a major multinational company from the Makati Central Business District (CBD) to Bonifacio Global City (BGC) in Taguig triggered the increase in vacancy rates. Despite the threat of BGC in attracting BPO and non‐financial institutions, Makati CBD has sustained its demand owing to its premier business location. 66 This, to some extent, owes to seafarer recruitment companies’ active involvement in assisting dependent families by providing them with housing benefits.

45
average new condominium supply for 2011 through 2015 is around 26,000 units, more than five times the average from 1999 to 2010. The market is showing early signs of upcoming headwinds from vast supply. For instance, sensing greater competition, one major developer recently offered a discount of up to 40 percent on selected units, thus narrowing margins.67
6. Despite vast supply and pressure on profit margins, rental rates and property prices in the residential segment are generally stable and vacancy rates steady at around 10 percent for the low and mid‐range market, indicating strong underlying demand. Despite this, the Bangko Sentral ng Pilipinas (BSP) (2012) reports that as of 3Q 2011, residential rental rates are above their 1997 levels but lower in real terms. Residential prices are recovering from the 2008‐2009 trough, albeit at a slower pace.68 Prices have breached their 1997 level but are only 57 percent in real terms. Table 3.1. Residential condominium supply in the pipeline
Figure 3.3. Housing prices are
recovering from the global financial crisis.
Source: Colliers International Source: Colliers International
7. Philippine mall operators are bullish given sustained inflow of remittances and expansion of BPOs. Philippine mall operators have registered between four to nine percent growth in same‐store sales, withstanding the Asian Financial Crisis and the recent global financial crisis (Deutsche Bank 2012). Increased BPO operations have benefitted the retail sector as evidenced by the mushrooming of 24‐hour convenience stores and restaurants/coffee shops near office buildings catering to the large group of night‐shift BPO workers. Some malls are also converting their leasable space to office space and extending their mall hours to accommodate this large pool of consumers. 8. Improved connectivity through infrastructure development has boosted land values outside Metro Manila. For example, since the opening of Skyway’s Alabang exit, lot prices in the area have risen by about 45 percent. Colliers International (2012) forecasts Bonifacio Global City (BGC) land values to continue growing by 12 percent in 2012. Implied land values in the Makati and Ortigas Central Business Districts have been stable at four percent in 2011. BSP
67 This is a departure from previous practices of offering longer payment terms to entice demand rather than price discounts. 68 For example, the average price of luxury three‐bedroom condominiums in Makati CBD grew by four percent in 2011.
2010 2011 2012 2013 Total
Location stock flow flow flow stock
Makati 13,076 1,659 2,483 2,105 19,323
Rockwell 2,382 1,336 ‐ ‐ 3,718
BGC 10,709 1,365 4,099 2,397 18,570
Ortigas 7,481 1,604 672 1,379 11,136
EastWood 5,735 ‐ 558 977 7,270
Total 39,383 5,964 7,812 6,858 60,017

46
(2012) notes that, as of 3Q 2011, current land values are around 65 percent of their 1997 levels in nominal terms and 31 percent in real terms.
Figure 3.4. The Philippines has a low household leverage in housing.
Figure 3.5. Total real estate loans growth is driven by residential loans.
Source: World Bank Source: Bangko Sentral ng Pilipinas (BSP)
Benign outlook at the aggregate expected 9. The Philippine real estate market has changed considerably from its pre‐1997‐98 crisis structure. Demand is now coming from two robust sources—continued expansion of the BPO industry for the office market and some residential segments and remittances for the low‐end to mid‐range residential segments. Both channels of demand have remained resilient and have continued to expand, albeit at a slower pace, despite the current fragile global economic outlook. These markets do not show signs of asset bubbles as indicated, for example, by current price levels. Both office and residential segments recently observed a significant recovery, but prices are still well below their 1997 peak levels in real terms – at 43 and 57 percent, respectively (BSP 2012). This contrasts to the speculative nature in 1997, particularly in the luxury residential segment. 10. The outlook remains strong for the commercial segment. According to Pricewaterhouse Coopers (PwC) and Urban Land Institute’s investor survey (2011), over half of those surveyed recommend “holding” for industrial/distribution, hotel, retail, and office properties throughout 2012, while nearly a third recommend “buying”. Office space demand is expected to be buoyant as the Business Processing Association of the Philippines (BPAP) projects a 20 percent annual increase in employment through 2016 (around 100,000 new worker per annum), translating to an estimated 300,000 sqm in new office space demand per year. In terms of condominiums, a third recommends “buying,” and less than half recommends “holding.”69
69 A “buying” or “holding” recommendation pertains to good prospects for the industry, as opposed to “selling.”
0
10
20
30
40
50
60
0
100
200
300
400
Mar‐09
May‐09
Jul‐09
Sep‐09
Nov‐09
Jan‐10
Mar‐10
May‐10
Jul‐10
Sep‐10
Nov‐10
Jan‐11
Mar‐11
May‐11
Jul‐11
Sep‐11
Percent
PHP billion
Real estate loans
Commercial loans Residential loans
Residential loans growth (rhs) Commercial loans growth (rhs)
Total loans growth (rhs)

47
11. Real estate leverage is low due largely to prudential banking policies enacted after the 1997 crisis as well as the underdeveloped mortgage markets (Figure 3.4). World Development Indicators show that despite the low interest rate environment, the housing loans‐to‐GDP ratio is less than two percent possibly owing to banks’ restrictive lending conditions and strict collateral requirements. Universal and commercial banks’ outstanding real estate loans grew by an annual average of 20 percent between September 2008 and September 2011 to PHP 419 billion but are equivalent to only 15 percent of total outstanding loans and 4.3 percent of GDP.70 As of September 2011, the commercial property sector accounts for two‐thirds of outstanding loans and the residential sector accounts for the balance, levels which are lower than during the global financial crisis (Figure 3.5). Given the limited leverage, the property sector on the aggregate does not pose systemic financial risks at the moment. 12. Despite the generally neutral to positive outlook, the residential segment carries downside risks owing to the following: i) oversupply relative to demand, ii) a potential contraction in remittances owing to continued unrest in the Middle East, reduced deployment to Saudi Arabia, and slower growth in the US and recession in the Euro area, and iii) upward pressures on oil prices, posing risks to private spending growth. 13. Moreover, although leverage remains low, the shift towards non‐bank financing requires careful monitoring of developers’ exposures. Anecdotal evidence suggests that some developers have increasingly used their balance sheets to offer in‐house financing to buyers. A drawback of this program is that, according to anecdotal evidence from real estate brokers, smaller developers may not always conduct sufficient due diligence of the loan applicants and some may not require loan applicants to submit proof of income. In order to mitigate unforeseen risks, developers tend to charge higher interest rates for in‐house financing than market rates, however, these rates are often fixed, unlike bank interest rates, limiting, to some extent, developers’ capacity to adjust to a short‐term adverse financing environment. 14. Nonetheless, the government has the capacity to counteract economic turbulence using macro prudential measures such as reducing the loan‐to‐property value ratio or exposure of banks’ portfolio to the property sector. Currently, BSP’s ceiling for bank loans to the real estate sector is limited to a maximum of 20 percent, much higher than the 10 percent which banks currently hold.71 Moreover, a limit on loan‐to‐value (LTV) ratio can “help prevent the buildup of vulnerabilities on the borrower side” (Crowe et al 2011). In the Philippines, the maximum LTV is 80 percent. Pag‐IBIG (the government home development mutual fund provider) offers a high LTV ratio, as high as 97 percent in some cases, but the amount that can be borrowed is lower. Research shows that a typical mortgage loan carries a LTV ratio of 71 percent on average.
70 Sixteen (16) percent of net of reverse repurchase (RRP) placements with the BSP 71 This ceiling excludes prudential safeguard housing loans to individual households as well as loans to developers for building socialized and low‐cost residential properties under various government housing programs. These loans, nonetheless, are subject to strict underwriting standards and prescribed limits on loan amounts relative to the value of the collateral (Tan 2009).

48
Selected References
Colliers International. (2012) “Philippine Property Market 4Q 2012.” Research & Forecast Report.
Crowe, Christopher, Giovanni Dell'Ariccia, Deniz Igan and Pau Rabanal. (2011) “Policy for
Macro‐financial Stability: Options to Deal with Real Estate Booms.” IMF Staff Discussion Note. SDN/11/02.
Bangko Sentral ng Pilipinas. (2012) Inflation Report Fourth Quarter 2011. Deutsche Bank. 2012 “Residential headwinds: Supply and Demand.” January. Pricewaterhouse Coopers and Urban Institute of Land. (2011) Emerging Trends in Real Estate
2012: Asia Pacific. November. International Monetary Fund. (2012) ”Philippines: 2011 Article IV Consultation.” IMF Country
Report. Washington D.C., March. Espenilla, Nestor. (2006). “The Corporate Bond Market in the Philippines.” BIS paper No. 26 Tan, Winecito. (2009) “Consumer Credit in the Philippines.” BIS Paper No. 46.

49
SPECIAL FOCUS 4 Stepping Up Disbursements by Improving
Absorptive Capacities in Agencies Weak public spending, especially in the first half of 2011, slowed down Philippine economic growth last year. In October 2011, the Aquino government launched the PHP 72 billion Disbursement Acceleration Plan (DAP). The DAP strategy entailed identifying slow‐moving projects, including unspent allocations, and then realigning them to i) agencies that can quickly disburse funds, ii) programs and projects that have poverty reduction impact, and iii) programs and projects that have big multiplier effects. While the strategy helped to boost public spending in the last quarter of 2011, the mere realignment of funds does not guarantee sustained improvement in public spending to address growth and poverty targets. A long‐term strategy should address internal bottlenecks in national government agencies, which include low absorptive capacity of agencies and weak monitoring and evaluation system, among others. 1. Weak government spending pulled down growth in 2011. Public construction contracted by almost 30 percent in 2011 despite efforts to revive infrastructure spending in the fourth quarter (Q4). The decline was most pronounced in Q2 2011 with a 51 percent drop in spending compared to the same period in 2010. Current expenditures (i.e., personnel services, maintenance and other operating expenditures) contracted by eight percent in Q1 2011 but slowly recovered in the next three quarters, growing by five percent for full year 2011.
2. Compared to programmed expenditures, disbursement was lower by nine percent in 2011. Total disbursement at PHP 1.558 trillion was only 91 percent of programmed expenditure for the year and 82 percent of total available appropriations (Figure 4.1). The deterioration in spending performance was most pronounced in infrastructure and other capital expenditures where only 66 percent of the full‐year programmed expenditure was disbursed as of December.
3. The slowdown in disbursements in the first three quarters is partly attributed to measures to improve transparency and accountability in national government agencies (NGAs). These measures include reviewing cost‐efficiency of programs and projects, and assessing the associated procurement process and project execution. For example, a thorough review of the bidding process in infrastructure projects was conducted by the Department of Public Works and Highways to improve cost‐efficiency and transparency of procurement and budget execution. However, the review inadvertently led to the slowdown in public infrastructure spending as the review uncovered significant procedural and governance issues.

50
Figure 4.1. Actual spending against DBCC program and total appropriations72
Source: Development Budget Coordination Committee (DBCC),DBM, and Bureau of the Treasury (BTR)
4. To address the prevailing low level of public spending, the government launched a PHP 72 billion Disbursement Acceleration Plan (DAP) in October 2011. The Department of Budget and Management (DBM) realigned unreleased appropriations to fast‐track disbursements and stimulate the economy. Funding for the DAP was sourced from pooled savings from unused appropriations in 2010 and 2011, windfall revenues from government‐owned and controlled corporations’ (GOCCs) dividends, and realignments within agencies in favor of fast‐disbursing projects. The bulk of the DAP was released to NGAs (53 percent) with the remainder to GOCCs (37 percent) and local government units (10 percent).
72 The Development Budget Coordination Committee (DBCC) recommends the level of annual government expenditures and the ceiling of government spending for economic and social development, national defense, and government debt service to properly allocate expenditures for each development activity. The DBCC programmed expenditures refers to total appropriations as adjusted to the expected level of revenues to be collected, with due consideration to priority policies and programs of the government. Total available appropriations refer to the sum of current appropriations in the General Appropriations Act (GAA), continuing appropriations from the previous years’ GAA, and automatic and supplemental appropriations. Current appropriations from 2008 to 2011 figures are based on the GAA. Continuing appropriations from 2008 to 2011 are actual figures based on the National Expenditure Plan (NEP). The 2011 continuing appropriations are the adjusted figures from 2012 NEP. Automatic and supplemental appropriations from 2008 to 2010 are actual figures based on the NEP while 2011 figures are the adjusted figures from the NEP.
‐
20
40
60
80
100
120
0.0
0.5
1.0
1.5
2.0
2.5
2008 2009 2010 2011
Percent
Government Spending Performance, 2008‐2011
Total available appropriation
Program
Actual
Disbursement rate (Actual/DBCC program)
Disbursement rate (Actual/appropriation)
PHP trillion

51
Table 4.1. Disbursement Acceleration Plan: Sources of financing and spending plan
Source: DBM
5. Government programs, projects, and activities included in the DAP were selected based on program capacity and expected growth and poverty impact. These include i) agencies that can quickly disburse funds, ii) programs/projects that have poverty reduction impact, and iii) programs and projects that have big multiplier effects. The selected programs and projects include i) critical public works and agriculture infrastructure projects, ii) housing, iii) relocation and resettlement projects, iv) additional funding support to local government units, v) rehabilitation of rail systems, vi) projects to support peace efforts, vii) healthcare insurance for indigents, and viii) human resource development training, among others. (See Annex 4.1 for the detailed allocation and outcome of the DAP.) It was apparent, however, that the mere identification of slow‐moving projects, including unspent allocations, and realignment to fast disbursing activities would not result in higher quality spending. Enhancing the impact of public spending on growth and poverty reduction would require addressing execution issues as well. 6. In identifying programs and projects for the DAP, internal bottlenecks to budget execution and disbursement were uncovered and documented. Most bottlenecks were common to all agencies while some were agency‐specific. Table 4.1 enumerates the reasons for the delay in the implementation of some critical programs, projects, and activities in DepEd, DOH, and DPWH.73
73 Department of Education (DepEd), Department of Health (DOH), Department of Public Works and Highways (DPWH)
Unreleased appropriations for personnel services
in 2011, to be pooled as savings and rea l igned
30.00 National government agencies 37.96
Unreleased appropriations for discontinued
or s low‐moving projects in 2011
0.48 Loca l government units 7.25
Rea l ignment of 2011 budgetary i tems within
agencies in favor of fast‐disburs ing projects
7.75 Government owned and control led
corporations
26.90
2010 unprogrammed fund, to be supported
by windfa l l dividends from GOCCs
12.34
Unreleased appropriations for discontinued or s low‐moving
projects in 2010, which are carried‐over as pooled savings in 2011
21.54
Total (PHP billion) 72.11 Total (PHP billion) 72.11
Sources from: Releases to:

52
Table 4.2. Summary of implementation bottlenecks in DepEd, DOH, and DPWH
Source: World Bank Basic Education Public Expenditure Review, Department of Health ‐ Financial Management Policies, Procedures, Practices, and Systems Agency Benchmarking Indicators Study, and WB staff consultations with agencies
7. Delayed release of budget allotments has often been blamed for slow budget execution. However, based on available evidence from some NGAs, the biggest constraint to efficient execution of the budget is low absorptive capacity of line agencies. For example, the World Bank’s forthcoming publication entitled “Basic Education Public Expenditure Review” found that low absorptive capacity of the Department of Education was a key impediment to successful implementation. The reasons behind low absorptive capacity are varied and include: i) frequent and unpredictable changes in agency policy regarding program implementation modality, ii) cumbersome procurement process exacerbated by lack of forward planning, and iii) complexity of inter‐agency coordination, which at times is exacerbated by avoidable internal administrative errors in some cases (see Box 5 for more discussion). For example, hiring new teachers requires authorization from three agencies: DBM, the Civil Service Commission (CSC), and the Professional Regulatory Commission (PRC). Although a similar in‐depth assessment of agency budget execution performance is not available for the other agencies, it is likely that other agencies face similar institutional and procedural bottlenecks. 8. The government has started to address these issues but it will take some time before spending picks up given the reform gestation period. For example, in DPWH in 2011, slow
Department
Agency‐specific Generic
Education 1. Purchase of textbooks 1. Long and ci rcuitous process in the a l location and
procurement of big‐ti cket i tems such as purchase of
textbooks , desks and armchai rs , construction of
class rooms/school bui lding
1. Inadequate technical capaci ty of
internal units to process budget
execution transactions
2. Construction of class rooms 2. Big organizationa l (decentral i zed) s tructure
makes reporting and monitoring di fficult
2. More procedura l requirements to
accompl ish in big‐ticket i tems than that
of smal l ‐i tem budgets (though severa l )
3. Furni ture and fi xtures (desks and
armchai rs )
3. Various and numerous reporting
requirements that agencies have to
submit
4. Creation of new teaching pos itions 4. Weak monitoring and eva luation
framework and sys tem
5. Sani tation and water supply (for new
school bui ldings and class rooms)
5. Practice of implementing "carry‐over"
budget ins tead of the current
appropriation
6. 40 high‐priority divis ions 6. Ad hoc activi ties passed on by
higher/overs ight agencies
Health 1. Kalusugan Pangka lahatan (Universal
Health) Programs
1. Resource transfers to LGUs ‐ no support or non‐
cooperation of LGUs , low capaci ty of LGUs to
produce documentation and reports
7. Inadequate specia l ization and
appreciation of budget analysts in the
DBM s ide on sectoral background and
agency needs
2. Health Faci l i ty Enhancement Program
(HFEP)
2. Pol i tica l pressure on identi fi cation of recipients
to HFEP, financia l ass i tance to indigent patients ,
among others
8. Capaci ty and mindset of l ine
agencies to changes and reforms
Public Works and
Highways
1. Big ti cket projects amounting to PHP
150 mil l ion and above
1. Market readiness or capaci ty of construction
industry to absorb the high number of infra projects
9. Extent of pol icy and sectora l
discuss ions between DBM and l ine
agencies
2. Increase focus on qual i ty of des ign and
speci fi cations vis ‐à ‐vis lowering of costs
3. Cl imate change effect
4. Procurement Issues
5. Project‐speci fic obstacles (right of way, low
support or non‐cooperation from LGUs)
BottlenecksAgency‐indentified
critical projects, programs and activities

53
budget execution was largely a result of deliberate attempts to ensure the quality of spending by focusing on the “right projects, with the right cost, at the right quality, at the right time, and by the right people.” Resources and efforts were focused on operationalizing institutional reforms such as i) reviewing project design and costing, ii) clustering smaller projects, and iii) ensuring discipline in preparing work program prior to fund release. 9. To sustain improvements in agencies’ budget execution capacities, DBM and line agencies would have to coordinate and agree on several efficiency enhancing measures. These include systematically “clearing up” or removing identified bottlenecks in budget execution and arriving at a coherent program to push for disbursements that produce results such as streamlining the releasing, monitoring, and reporting requirements for agreed priority spending.
Selected References
Department of Budget and Management. (2011) General Appropriations Act of 2011. Department of Budget and Management. (2011) National Expenditure Program 2012. World Bank. (2011) “Strengthening Public Finance for More Inclusive Growth.” Public
Expenditure Review. Washington D.C.

54
Box 4.1. Absorptive Capacity Constraints in DepEd Absorptive capacity constraints in the Department of Education (DepEd) is evident in four programs and projects covering the period 2004‐2008: i) School Furniture Program, ii) School Building Program, iii) Procurement of textbooks, and iv) hiring of new teachers. Box Table 4.1 shows the budget execution ratios of the four programs. Stagnant execution ratios are seen in the textbook and school furniture programs.
Box Table 4.1 Table utilization rates of selected DepEd programs:
Appropriations/allotments compared to obligations, 20042008
Source: World Bank. “Philippines: Basic Education Public Expenditure Review.” Unpublished report.
For all programs, 2005 and 2006 appear to be bottleneck years. Except for the hiring of new teachers in 2005, all four programs showed low execution ratios. Through an in‐depth case study approach, the analysis of the operational efficiency of the DepEd budget revealed many deficiencies that have important implications for participation, retention, completion, and learning achievement. The four budget items chosen for the case studies are not fully representative of the DepEd budget as a whole, but they are critical components of the Department’s capital outlay and maintenance and other operating expenses budgets. Efficient execution of each of these components is essential if DepEd is to bring down shortages in textbooks, classrooms, and teachers. The case studies also showed slow and incomplete budget execution by DepEd, quantified the extent of inefficiency in terms of delay and the lapsing of appropriations, and suggested several possible underlying causes of these weaknesses. First, much of the delay has been caused by DepEd’s inability to expedite its own process. Contrary to frequent allegations that slow budget execution is due to DBM’s slowness or refusal to release the budget, the reality is that more often than not, DepEd was unable to sub‐allot the released allotments to continue the budget execution process smoothly. Weak financial management capacities within DepEd were also mentioned as an important source of operational inefficiency. Capacity limitations are valid constraints but the case studies also suggest more systemic causes such as uncertainty or instability in the policy environment and excessive complexity in certain administrative procedures. Policy uncertainty/instability is sometimes caused by DepEd’s need to interact with external stakeholders, such as legislators, whose consent is virtually required for the selection of classroom construction sites, or with the Civil Service Commission, which needs to sign off on the qualification and appointment of new teachers. However, in other cases, DepEd itself has been a source of policy instability and uncertainty. The introduction of new policies (i.e., issuance of new department orders and procurement guidelines on the deployment of new teachers, evaluation of textbooks, and allocation of resources for school building) has created some uncertainties. Instead of improving DepEd’s ability to provide quality education services in a timely manner, these policies have inadvertently contributed to slower program delivery and budget execution. From these findings, two critical questions beg answers if the agency is to improve its impact on development: i) can DepEd quickly learn new ways of operating to improve efficiency and effectiveness and ii) can reforms be introduced more gradually based on DepEd’s realistic level of absorptive capacity? Selective reviews of administrative procedures on budget execution and program delivery are needed to identify procedures that are truly excessive and unnecessary. These procedures may be eliminated and alternatives instituted to achieve faster implementation while maintaining a comparable level of control. Automating certain transactions would also help expedite processing of some procedures by speeding up the handling of paperwork and reduce the scope for human error.
Particulars 2004 2005 2006 2007 2008
% Obligations/Allotments 28 57 30 54 55
% Obligations/Appropriations 59 83 43 112 79
% Obligations/Allotments 0 0 62 74 57
% Obligations/Appropriations 0 0 68 75 50
% Obligations/Allotments 49 45 39 47 51
% Obligations/Appropriations 98 78 49 88 95
% Obligations/Allotments 96 94 93 96 100
% Obligations/Appropriations 112 56 30 39 56
Furniture
School Building Program
Textbooks
New Teaching Positions

55
Annex 4.1: DAP approved amount versus actual spending in end‐2011
Source: DBM
Sector/
Department:Project description
Estimated Cost in
PHP billion
Actual Spending (as of end‐
2011) in PHP billion
Public Works‐
DPWH
DPWH to construct and rehabilitate roads, bridges, flood control, and other projects, many of
which have been damaged in the recent typhoons. These projects already have a completed
program of work, and many are quick‐disbursing projects below PHP 40 million.
5.50 ‐
Agriculture and
Agrarian Reform‐
DA, DAR and NSO
DA to construct and rehabilitate PHP1.62 bill ion worth of irrigation, farm‐to‐market roads,
and other infrastructure. Additional funding requirements to also be released for the
Mindanao Rural Development Project (PHP 919 million) and the Agno River Integrated
Irrigation Project (PHP 411 million). PHP 1.29 bill ion to be released for the Agrarian Reform
Communities Project 2 of the DAR. The DBM, in partnership with the National Statistics Office,
DA and DAR to conduct a National Survey of Farmers and Fisherfolk (PHP 625 million).
4.87 8.97
Support to LGUs‐
DILG
Provision of PHP 6.5 bil lion to LGUs which are almost completely dependent on their Internal
Revenue Allotment (IRA), for the construction of arterial roads to connect to national roads,
rural electrification for barangays and sitios, and other priority projects that have economic
impact, preferably directed to poor sectors and communities. This is being provided in l ight
of the anticipated reduction in IRA in 2012. Also, PHP 750 million to be provided as
development assistance to Quezon Province in l ine with the settlement of National Power
Corp. tax l iabilities.
14.00 9.42
Housing,
relocation and
resettlement‐ NHA,
DILG‐BFP, DILG‐
BJMP
PHP 11.05 bil lion of funds to be released to the National Housing Authority for various
housing projects, including on‐site housing development for families l iving along dangerous
areas and housing for Bureau of Fire Protection and Bureau of Jai l Management and Penology
personnel (PHP 500 mill ion). Government to also release PHP 400 million to the Home
Guarantee Corp. as equity infusion for its credit insurance and mortgage guaranty
operations.
11.45 11.45
Healthcare: NHIP,
DOH, special
hospitals
To support premium subsidies for indigents under the National Health Insurance Program,
PHP 1.496 bil lion to be provided for the payment of obligations of the national government.
The Department of Health to also have an additional PHP 249 mill ion for the hiring of nurses
and midwives to be deployed to rural areas. Furthermore, PHP 357 mill ion to be provided for
the upgrading of the physical plant and medical equipment of the Philippine Heart Center,
PHP 280 million for the renovation and purchase of equipment of the Phil ippine Children’s
Medical Center and PHP 105 million for the pediatric pulmonary program of the Lung Center
of the Philippines.
2.53 2.41
Railway
Rehabilitation‐
DOTC
A total of PHP 1.87 billion to be provided for the rehabil itation of Light Rail Transit (LRT) Lines
1 and 2, including the replacement of worn‐out rails, repair and rehabilitation of trains and
improvement of train station facil ities. For the Metro Rail Transit (MRT), PHP 4.5 bill ion has
also been provided for the purchase of additional train cars.
6.37 6.37
Peace and
Development:
To foster peace, development and reform in the Autonomous Region for Muslim Mindanao,
government to implement a Comprehensive Peace and Development Intervention package,
worth PHP 8.59 bil lion. Meanwhile, the Payapa at Masaganang Pamayanan (PAMANA)
program to be provided with an additional PHP 1.82 bill ion for peace and development
activities with the Cordillera People’s Liberation Army and the Moro national Liberation
Front, support for the Reintegration Program of former rebels of the New People’s Army,
among others.
10.41 0.93
Human resource
development for
Business Process
Outsourcing (BPO)
and other
industries – TESDA
and other industry
groups
The government, through TESDA and other agencies, to partner with industry groups l ike the
Business Process Association of the Phil ippines for human resource development, and to
provide funding for the training of applicants, faculty‐trainers and other activities.
1.10 0.07
Weather
Forecasting‐ DOST‐
PAGASA
To improve the capacity of the Philippine Atmospheric, Geophysical and Astronomical
Services Administration, particularly the enhancement of its Doppler radar network, as well
as to establish a National Meteorological and Climate Center with state‐of‐the‐art
information technology faci lities.
0.70 ‐
Others For DOF, DOJ, DND,DOT,FDCP, COA,PIDS,TIDCORP,CIC,BSP, PHILPOST 15.18 14.19
Total 72.11 53.81

56
Data Appendix
Table 4. Philippines: Selected Economic Indicators, 2008‐13
Source: Government of the Philippines for historical, World Bank for projections 1/ Excludes privatization receipts and includes CB‐BOL restructuring revenues and expenditures (in accordance with GFSM) 2/ Includes gold 3/ Based on World Bank definition. The difference with central bank definition is that it includes the following: i) Gross‐‐Due to Head Office/Branches Abroad of branches and offshore banking units of foreign banks operating in the Philippines, which are treated as quasi‐equity in view of nil and/or token accounts of permanently assigned capital required of these banks, ii) Long‐term loans of non‐banks obtained without BSP approval which cannot be serviced using the foreign exchange resources of the Philippine banking, and iii) Long‐term obligations under capital lease agreements.
2009 2010 2011 2012 2013
Prel. Act.
Growth, inflation, and unemployment
Gross domestic product (% change) 1.1 7.6 3.7 4.2 5.0
Inflation (period average, in %) 3.2 3.8 4.8 3.5 4.0
Savings and investment
Gross national savings 22.1 24.8 23.0 24.2 26.1
Gross domestic investment 16.6 20.5 21.8 22.5 23.6
Public sector
National government balance (GFS basis) 1/ ‐3.9 ‐3.6 ‐2.1 ‐3.0 ‐2.8
National government balance (GOP Definition) ‐3.7 ‐3.5 ‐2.0 ‐2.9 ‐2.7
Total revenue (GOP Definition) 14.0 13.4 14.0 14.0 14.6
Tax revenue 12.2 12.1 12.3 12.8 13.4
Total spending (GOPDefinition) 17.7 16.9 16.0 16.9 17.3
National government debt 54.8 52.4 51.1 49.0 48.0
Balance of payments
Merchandise exports (% change) ‐22.1 34.8 ‐6.9 3.5 7.3
Merchandise imports (% change) ‐24.0 31.5 9.5 5.0 7.0
Remittances (% change) 5.6 8.2 7.2 5.0 5.5
Current account balance 5.6 4.2 1.2 1.7 2.5
FDI (billions of dollars) 1.6 1.2 0.7 1.5 2.5
Portfolio Investment (billions of dollars) ‐0.6 4.0 4.1 4.0 4.0
Gross International reserves2/
(in billions of dollars) 44.2 62.4 75.0 78.0 81.9
(in months of imports) 8.7 9.6 11.1 11.1 11.2
External debt3/ 37.3 36.3 34.8 33.3 32.1
Actual Projection
(in percent of GDP, unless otherwise indicated)

57
Table 5. Philippines: National Government Cash Accounts (GFS Basis), 2008‐12
Source: Department of Finance, Bureau of Treasury, and Department of Budget and Management 1/ This excludes privatization receipts. These are treated as financing items in accordance with the Government Financial Statistics Manual (GFSM). 2/ Data are sourced from the Department of Budget and Management. Allocation to local government (LGUs) units excludes capital transfers to LGUs. They are included in national government capital outlays. 3/ Nominal GDP is based on World Bank staff estimate. Note: “…” means not available.
Jan‐Nov Year Budget WB proj.
Revenue and grant 15.2 14.0 13.4 12.8 14.0 14.2 14.0
Tax revenue 13.6 12.2 12.1 11.4 12.3 13.1 12.8
Net income and profits 6.2 5.2 5.4 5.4 … 5.9 5.6
Excise tax 0.8 0.7 0.7 0.6 … 0.6 0.9
Sales taxes and l icenses 2.3 2.7 2.4 2.1 … 2.7 2.5
Others 0.8 0.6 0.7 0.6 1.6 0.6 0.8
Collection from Customs 3.4 3.1 2.9 2.5 2.5 3.3 3.0
Nontax revenue 1/
1.6 1.7 1.3 1.5 1.6 1.1 1.2
Grant 0.0 0.00 0.0 0.0 0.0 0.0 0.0
Total expenditure
2/16.7 17.9 17.0 13.9 16.1 16.9 17.0
Current expenditures 13.6 14.3 13.8 11.7 13.3 13.4 13.5
Personnel services 4.9 5.2 5.2 4.6 5.1 5.4 5.4
MOOE 1.8 2.1 2.0 1.6 2.1 2.4 2.5
Allotment to LGUs 2.2 2.5 2.4 2.2 2.4 2.0 2.0
Subsidies 0.2 0.2 0.2 0.4 0.5 0.2 0.3
Tax expenditures 0.8 0.6 0.5 0.3 0.3 0.3 0.3
Interest payment 3.7 3.7 3.4 2.7 3.0 3.1 3.0
Capital outlays 2.9 3.4 3.1 2.1 2.6 3.3 3.3
Net lending 0.2 0.2 0.1 0.2 0.2 0.2 0.2
Balance (GFS definition) ‐1.5 ‐3.9 ‐3.6 ‐1.1 ‐2.1 ‐2.7 ‐3.0
Balance (GOP definition) ‐0.9 ‐3.7 ‐3.5 ‐1.0 ‐2.0 ‐2.6 ‐2.9
Primary Balance (GFS) 2.2 ‐0.3 ‐0.2 1.6 0.8 0.4 0.0
Memorandum items
Privatization receipts (PHP bill ions) 31.3 1.4 0.9 0.7 0.9 2.0 2.0
CB‐BOL interest payments (% of GDP) 0.2 0.2 0.1 0.1 0.1 0.1 0.1
Nominal GDP (PHP tri l l ion) 3/
7.7 8.0 9.0 9.7 9.7 11.0 10.6
(in percent of GDP, unless otherwise stated)
2008 2009 2010 2011 2012

58
Philippines Quarterly Update
Previous Editions and Special Focus Sections
December 2011 PQU: Sustaining Growth in Uncertain Times Raising Excise Taxes on Tobacco and Alcohol Products Philippine Exports: Where Do They Stand? September 2011 PQU: Solid Macroeconomic Fundamentals Cushion External Turmoil External Spillovers to Philippine Growth The 2012 Proposed National Government Budget June 2011 PQU: Generating More Inclusive Growth Poverty and Inequality in the Philippines The Services Sector in the Philippines The 2011 National Accounts Revisions (1998‐2010) January 2011 PQU: Robust Growth, Stubborn Poverty Food Prices in the Philippines Fiscal Risks in the Philippines Export of Services: Lessons from the BPO and Tourism Sectors September 2010 PQU: Stepping Up Reforms to Sustain Growth The 2011 National Government Budget: Structural Reforms and Consolidation Employment, Poverty and Distributional Impacts of El Niño in the Philippines The Philippines during the Recent International Financial Shocks Constraints to Growth: the Agribusiness Value Chain in Mindanao June 2010 PQU: The Recovery Continues Despite Global Financial Turbulence Economic Development and Peace: the Case of Mindanao Philippines Migration Patterns during the Global Recession: Resiliency through Diversification and Flexibility The European Sovereign Debt Turmoil and the Philippines Bottlenecks to the Philippines Competitiveness

59
Selected Recent World Bank Publications on the Philippines (For an exhaustive list, please go to: http://goworldbankorg/BRHFJLLQD0.)
No. Document Name Date Document Type
1 Doing business in a more transparent world 2012 ‐ economic profile :
Phil ippines ‐ comparing regulation for domestic firms in 183 economies
1/1/2012 Working Paper
2 Phil ippines quarterly update : sustaining growth in uncertain times 12/1/2011 Working Paper
3 Making everyone count : Gender‐sensitive Monitoring and Evaluation in a
Community‐Driven Development Project ‐ the case of the Phil ippines KALAHI‐
CIDSS
11/1/2011 Working Paper
4 Quarterly economic update : solid macroeconomic fundamentals cushion
external turmoil
9/1/2011 Working Paper
5 Ripe for a big bang ? assessing the political feasibility of legislative reforms in
the Phil ippines' local government code
9/1/2011 Policy Research Working
Paper
6 The Economic Returns of Sanitation Interventions in the Philippines 8/1/2011 UNDP‐Water & Sanitation
Program
7 Phil ippines ‐ Discussion notes : challenges and options for 2010 and beyond 6/9/2011 Other Financial
Accountabil ity Study
8 Phil ippines ‐ Public expenditure review : strengthening public finance for more
inclusive growth
6/1/2011 Public Expenditure
Review
9 Phil ippines ‐ Reproductive health at a glance 6/1/2011 Brief
10 Phil ippines quarterly update : generating more inclusive growth 6/1/2011 Working Paper
11 The politics of power : the political economy of rent‐seeking in electric util ities
in the Philippines
6/1/2011 Policy Research Working
Paper
12 Overview of the Philippines' Conditional Cash Transfer Program : the Pantawid
Pamilyang Pil ipino Program (Pantawid Pamilya)
5/1/2011 Brief
13 Phil ippines ‐ Power distribution in Olongapo city 4/1/2011 Brief
14 Building governance and anti‐corruption in the Philippines' conditional cash
transfer program
3/1/2011 Brief
15 The Search for Durable Solutions : armed conflict and forced displacement in
Mindanao, Phil ippines
3/1/2011 Working Paper
16 The search for durable solutions : armed conflict and forced displacement in
Mindanao, Phil ippines
3/1/2011 Working Paper
17 Doing business in the Phil ippines 2011 : comparing business regulation in 25
cities and 183 economies
1/1/2011 Working Paper
18 Phil ippine health sector review : challenges and future directions 1/1/2011 Working Paper
19 Phil ippines ‐ Fostering more inclusive growth : main report 1/1/2011 Working Paper
20 Phil ippines ‐ Private provision, public purpose : a review of the government's
education service contracting program
1/1/2011 Working Paper
21 Phil ippines ‐ Typhoons Ondoy and Pepeng : post‐disaster needs assessment
(Vol. 1 of 3) : Executive summary
1/1/2011 Other Environmental
Study
22 Phil ippines ‐ Typhoons Ondoy and Pepeng : post‐disaster needs assessment
(Vol. 2 of 3) : Main report
1/1/2011 Other Environmental
Study
23 Phil ippines ‐ Typhoons Ondoy and Pepeng : post‐disaster needs assessment
(Vol. 3 of 3) : Sector reports
1/1/2011 Other Environmental
Study
24 Phil ippines quarterly update : robust growth, stubborn poverty 1/1/2011 Working Paper
25 The Philippines ‐ Sun Power expansion moves solar industry closer to grid
parity
1/1/2011 Brief
26 Trust funds country report FY09 ‐ FY10 Phil ippines 1/1/2011 Annual Report
27 Helping small water util ities become bankable 11/1/2010 Brief
28 It is not too late : preparing for Asia's next big earthquake ‐ with emphasis on
the Phil ippines, Indonesia, and China : policy note
10/20/2010 Working Paper
29 Status of Projects in Execution (SOPE) ‐ FY10 : East Asia and Pacific region ‐
Phil ippines
10/3/2010 Annual Report
30 Skills for the labor market in the Philippines 10/1/2010 Publication

60
COPIES OF THE PHILIPPINES QUARTERLY UPDATE:
Online copies of this publication can be downloaded in www.worldbank.org.ph. Printed copies are also available in the following Knowledge for Development Centers (KDCs):
1. World Bank KDC Ground Floor The Taipan Place, Francisco Ortigas Jr Road (former Emerald), Ortigas Business Center, Pasig City 1605
2. Asian Institute of Management KDC Joseph R McMicking Campus, 123 Paseo de Roxas, Makati City 1226
3. Ateneo de Naga University KDC James O'Brien Library, Ateneo Avenue, Naga City 4400
4. Central Philippine University KDC Ground Floor Henry Luce III Library, Lopez Jaena Street, Jaro, Iloilo City 5000
5. House of Representatives KDC Congressional Planning and Budget Department, 2F RV Mitra Building, Batasang Pambansa Complex, Constitution Hills, 1126 Quezon City
6. Notre Dame University KDC Notre Dame University Library, Notre Dame Avenue, Cotabato City 9600
7. Palawan State University KDC Graduate School ‐ Law Building, Manalo Campus, Valencia St, Puerto Princesa City 5300
8. Saint Paul University Philippines KDC 3rd floor, Learning Resource Center, Mabini St, Tuguegarao City 3500
9. Silliman University KDC Silliman University Library, Dumaguete City 6200
10. University of San Carlos KDC University Library, P Del Rosario Street, Cebu City 6000
11. University of Southeastern Philippines KDC Obrero, Davao City 8000