Philippines - Atlas for the End of the World
6
0 250 500 750 Kilometers PHILIPPINES BIODIVERSITY TARGET 2020 TARGET: 17% protected 2015: 15.2% PROTECTED 9% I-IV 6.1% V-VI .1% NA Philippines Hotspot Neighboring Hotspot Protected Area (IUCN Category I-IV) Protected Area (IUCN Category V-VI) Protected Area (IUCN Category NA) Urban Area Agriculture (0-100% landuse) Roads Railroads 310,103 km 2 Bacolod Baguio Batangas Butuan Cebu Cotabato City Davao General Santos Iligan Iloilo City Lipa City Manila Zamboanga Philippines Taiwan China Vietnam Indonesia Malaysia Brunei
Transcript of Philippines - Atlas for the End of the World

0 250 500 750
Kilometers
PHILIPPINES
BIODIVERSITY TARGET2020 TARGET: 17% protected
2015: 15.2% PROTECTED9% I-IV6.1% V-VI.1% NA
Philippines Hotspot
Neighboring Hotspot
Protected Area (IUCN Category I-IV)
Protected Area (IUCN Category V-VI)
Protected Area (IUCN Category NA)
Urban Area
Agriculture (0-100% landuse)
Roads
Railroads
310,103 km2
Bacolod
Baguio
Batangas
Butuan
Cebu
Cotabato CityDavao
General Santos
Iligan
Iloilo City
Lipa City
Manila
Zamboanga
Philippines
Taiwan
China
Vietnam
Indonesia
Malaysia
Brunei

0 250 500 1,000
Kilometers
Shortfall Assessment to reach Target of 17% protected land in each terrestrial ecoregion
Philippines
2 BIOMES
Tropical & Subtropical Coniferous Forests
Tropical & Subtropical Moist Broadleaf Forests
12 ECOREGIONS
ENDEMIC PLANT SPECIES6,091
ENDEMIC ANIMAL SPECIES591
PHILIPPINES ECOREGIONS
1
2
3
4
5
6
7
8
9
10
1112

0 250 500 1,000
Kilometers
1. Borneo Lowland Rain Forests
2. Greater Negros-Panay Rain Forests
3. Luzon Montane Rain Forests
4. Mindoro Rain Forests
5. Sulu Archipelago Rain Forests 9. Mindanao Montane Rain Forests
10. Mindanao-Eastern Visayas Rain Forests
12. South China Sea Islands
11. Palawan Rain Forests
6. Maldives-Lakshadweep-Chagos-Archipelago Tropical Moist Forests
7. Luzon Tropical Pine Forests
6. Luzon Rain Forests
64 km2 remnant habitat
33,483 km2 remnant habitat
8,987 km2 remnant habitat
610 km2 remnant habitat
1,043 km2 remnant habitat 7,167 km2 remnant habitat
22,140 km2 remnant habitat
2,496 km2 remnant habitat
81 km2 remnant habitat
3,729 km2 remnant habitat
13,708 km2 remnant habitat
+11 km2 protected areas
+3,780 km2 protected areas
+1,528 km2 protected areas
+370 km2 protected areas+300 km2 protected areas
+14,743 km2 protected areas
+1 km2 protected areas
+44 km2 protected areas
+63 km2 protected areas
+9,688 km2 protected areas
To reach Aichi Target of 17%
To reach Aichi Target of 17%
To reach Aichi Target of 17%
To reach Aichi Target of 17%
To reach Aichi Target of 17% To reach Aichi Target of 17%
To reach Aichi Target of 17%
To reach Aichi Target of 17%
Target reached
To reach Aichi Target of 17%
To reach Aichi Target of 17%
To reach Aichi Target of 17%

PhiliPPines | ConfliCts
5
4
110
9
311
2
6
8
12
713
500km2501000
20,142,000 Population2015 urban PoPulation
26,650,0002030 urban PoPulation
81threatened sPeCies
Major CroPsrice, maize, vegetables, coconut
biodiversity threatsdeforestationurban developmentPopulation GrowthindustrializationMining
Conflicts between 2030 projected urban growth areas and threatened species habitats
topography
Water body
remnant vegetation
Protected area
existing urban area
urban Growth Projection
Conflict Zone
Extreme Conflict Zone
threatened species habitat

7. Davao, pHilippineS
8. geneRal SantoS City, pHilippineS
2. baguio City, pHilippineS
PoPulation Projections:
PoPulation Projections:
PoPulation Projections:
2015:
2015:
2015:
1,630,000
616,000
358,000
2,216,000
859,000
497,000
5. Cebu, pHilippineS
6. Cotabato, pHilippineS
1. baColoD, pHilippineS
PoPulation Projections:
PoPulation Projections:
PoPulation Projections:
2015:
2015:
2015:
951,000
351,000
559,000 1,278,000
543,000
753,000
3. batangaS City, pHilippineS
4. butuan, pHilippineS
PoPulation Projections:
PoPulation Projections:
340,000
333,000
2015:
2015:
467,000
447,000
2030:
2030:
2030:
2030:
2030:
2030:
2030:
2030:
topography
Water body
remnant vegetation
Protected area
existing urban area
urban Growth Projection
Conflict Zone
Extreme Conflict Zone
threatened species habitat
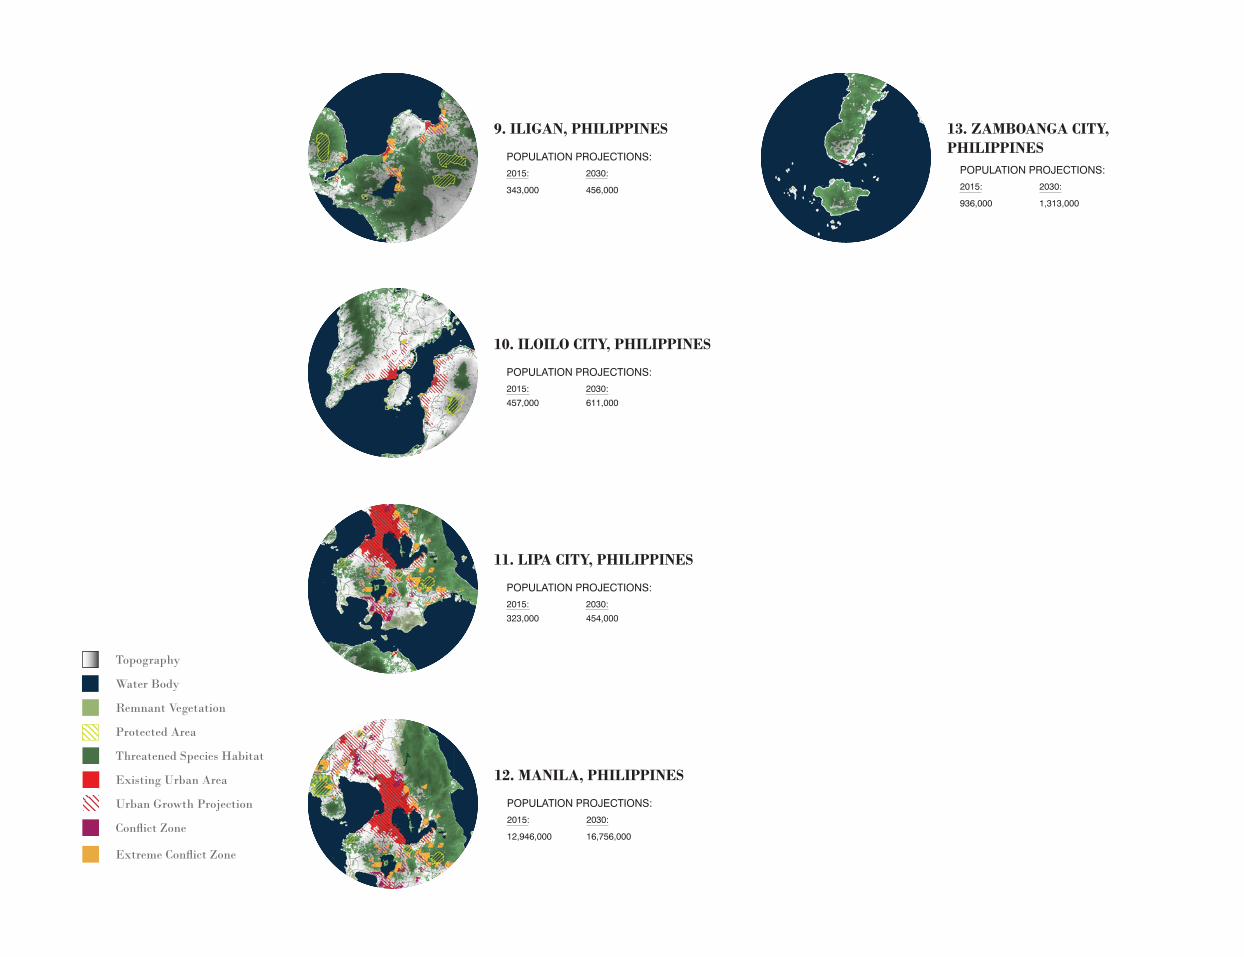
11. lipa City, pHilippineS
PoPulation Projections:
2015:
323,000 454,000
10. iloilo City, pHilippineS
PoPulation Projections:
2015:
457,000 611,000
12. manila, pHilippineS
9. iligan, pHilippineS 13. zamboanga City, pHilippineS
PoPulation Projections:
PoPulation Projections:PoPulation Projections:
12,946,000
343,000936,000
2015:
2015:2015:
16,756,000
456,0001,313,000
2030:
2030:
2030:
2030:2030:
topography
Water body
remnant vegetation
Protected area
existing urban area
urban Growth Projection
Conflict Zone
Extreme Conflict Zone
threatened species habitat