PHILIPPINE STOCK EXCHANGE 28 PHILIPPINE … · The Audit Committee is endorsing to the stockholders...
176
April 25, 2018 PHILIPPINE STOCK EXCHANGE 9th Floor, Philippine Stock Exchange Tower, 28 th Street corner 5 th Avenue, BGC Taguig City Attention: Mr. Jose Valeriano B. Zuño III Head - Disclosure Department PHILIPPINE DEALING AND EXCHANGE CORPORATION 37 th Floor, Tower 1, The Enterprise Center 6766 Ayala Ave. cor Paseo de Roxas, Makati City Attention: Ms. Erika Grace C. Alulod Head, Issuer Compliance and Disclosure Department Subject: Vista Land & Lifescapes, Inc.: Preliminary Information Statement Gentlemen: Please see attached SEC Form 20-IS, Preliminary Information Statement, filed today for the Company’s Annual Stockholders’ Meeting on June 18, 2018. Very truly yours, Brian N. Edang Officer-in-Charge
Transcript of PHILIPPINE STOCK EXCHANGE 28 PHILIPPINE … · The Audit Committee is endorsing to the stockholders...

April 25, 2018 PHILIPPINE STOCK EXCHANGE 9th Floor, Philippine Stock Exchange Tower, 28th Street corner 5th Avenue, BGC Taguig City Attention: Mr. Jose Valeriano B. Zuño III
Head - Disclosure Department
PHILIPPINE DEALING AND EXCHANGE CORPORATION 37th Floor, Tower 1, The Enterprise Center 6766 Ayala Ave. cor Paseo de Roxas, Makati City Attention: Ms. Erika Grace C. Alulod Head, Issuer Compliance and Disclosure Department Subject: Vista Land & Lifescapes, Inc.: Preliminary Information Statement Gentlemen: Please see attached SEC Form 20-IS, Preliminary Information Statement, filed today for the Company’s Annual Stockholders’ Meeting on June 18, 2018. Very truly yours, Brian N. Edang Officer-in-Charge

COVER SHEET
C S 2 0 0 7 0 3 1 4 5 S.E.C. Registration Number
V I S T A L A N D & L I F E S C A P E S , I N C .
(Registrant’s Full Name)
L O W E R G R O U N D F L O O R , L B U I L D I N G B , E V I A B L I F E S T Y L E C E N T E R , V I S T A L C I T Y , D A A N G H A R I , A L M A N Z A C
(Business Address: No. Street/City/Province)
Brian N. Edang 226-3552 ext. 0088
Contact Person Registrant Telephone Number
1 2 3 1 20-IS Preliminary Information Statement
0 6 1 5
Month Day FORM TYPE Month Day Calendar Year Annual Meeting
Secondary License Type, If Applicable
Dept. Requiring this Doc. Amended Articles Number/Section
Total Amount of Borrowings
Total No. of Stockholders Domestic Foreign ----------------------------------------------------------------------------------------------------------
To be accomplished by SEC Personnel concerned
File Number LCU
Document I.D.
Cashier


3
Annex “A” EXPLANATION AND RATIONALE
For each item on the Agenda of Vista Land & Lifescapes, Inc.’s 2018 ASM requiring the approval of the stockholders
1. President’s Report, Management Report and Audited Financial Statements as of and for the year ended December 31, 2017 The audited financial statements (“AFS”) of the Company as of and for the year ended December 31, 2017, audited by SyCip, Gorres, Velayo & Co. and a copy of which is incorporated in the Preliminary Information Statement for this meeting, will be presented for approval by the stockholders. To give context to the AFS and bring to the shareholders’ attention the highlights of said AFS, the President and CEO, Mr. Manuel Paolo A. Villar, will deliver a report to the stockholders on the Company’s performance for the year 2017 and the outlook for 2018. The Board and Management of the Company believes it in keeping with the Company’s thrust to at all times observe best corporate governance practices that the results of operations and financial condition of the Company be presented and explained to the shareholders. Any comments from the shareholders, and their approval or disapproval of these reports, will provide guidance to the Board and Management in their running of the business and affairs of the Company.
2. Ratification of all acts and resolutions of the Board of Directors and Management from the date of the last annual stockholders’ meeting until the date this meeting Ratification by the stockholders will be sought for all the acts and the resolutions of the Board of Directors and all the acts of Management taken or adopted from the date of the last annual stockholders’ meeting until the date of this meeting. A brief summary of these resolutions and actions is set forth in the Preliminary Information Statement for this meeting. Copies of the minutes of the meetings of the Board of Directors are available for inspection by any shareholder at the offices of the Company during business hours.
The Board and Management of the Company believes it is in keeping with the Company’s thrust to at all times observe best corporate governance practices that ratification of their acts and resolutions be requested from the shareholders in this annual meeting. Such ratification will be a confirmation that the shareholders approve the manner that the Board and Management run the business and affairs of the Company.
3. Election of the members of the Board of Directors, including the Independent
Directors, for the year 2018 The Corporate Secretary will present the names of the persons who have been duly nominated for election as directors of the Company in accordance with the By-Laws and Revised Manual on Corporate Governance of the Company and applicable laws and regulations. The voting procedure is set forth in the Preliminary Information Statement for this meeting.

4
4. Appointment of External Auditors
The Audit Committee is endorsing to the stockholders the re-appointment of SyCip Gorres Velayo & Co. as external auditor of the Company for the year 2018.

5
PROXY The undersigned stockholder of VISTA LAND & LIFESCAPES, INC. (the “Company”) hereby appoints __________________________________ or in his absence, the Chairman of the meeting, as attorney-in-fact or proxy, with power of substitution, to represent and vote ______________ shares registered in his/her/its name as proxy of the undersigned stockholder, at the Annual Stockholders’ Meeting of the Company to be held at Colonial Ballroom, Palazzo Verde, Daang Reyna, Vista Alabang, Las Piñas City on 18 June 2018 at 9:00 a.m. and at any of the adjournments thereof for the purpose of acting on the following matters:
1. Approval of the Audited Financial Statements for the year 2017
Yes No Abstain
2. Ratification of all acts and resolutions of the Board of Directors and Management from the date of the last annual stockholders’ meeting until the date of this meeting
Yes No Abstain
3. Election of the members of the Board of Directors, including the Independent Directors, Printed Name of the Stockholder for the year 2018
No. of Votes Manuel B. Villar Manuel Paolo A. Villar Cynthia J. Javarez Camille A. Villar Frances Rosalie T.
Coloma Marilou O. Adea Ruben O. Fruto
4. Re-appointment of SyCip Gorres Velayo &
Co. as external auditor
Yes No Abstain
Printed Name and Signature of the Stockholder
Date
This proxy should be received by the Corporate Secretary on or before 08 June 2018, the deadline for submission of proxies. This proxy when properly executed will be voted in the manner as directed herein by the stockholder(s). If no direction is made, this proxy will be voted for the election of all nominees and for the approval of the matters stated above and for such other matters as may properly come before the meeting in the manner described in the Information Statement. A stockholder giving a proxy has the power to revoke it at any time before the right granted is exercised. A proxy is also considered revoked if the stockholder attends the meeting in person and expressed his intention to vote in person. Notarization of this proxy is not required.

6
SECURITIES AND EXCHANGE COMMISSION
SEC FORM 20-IS
INFORMATION STATEMENT PURSUANT TO SECTION 20 OF THE SECURITIES REGULATION CODE
1. Check the appropriate box:
[x] Preliminary Information Statement [ ] Definitive Information Statement
2. Name of Registrant as specified in its charter: VISTA LAND & LIFESCAPES, INC. 3. Philippines Province, country or other jurisdiction of incorporation or organization 4. SEC Identification Number CS200703145 5. BIR Tax Identification Code 006-652-678-000 6. Lower Ground Floor, Building B, Evia Lifestyle Center, Vista City,
Daanghari, Almanza II, Las Piñas City 1747 Address of principal office Postal Code
7. (632) 874-5758 / (632) 872-6947 / (632) 226-3552 Registrant’s telephone number, including area code 8. Date, time and place of the meeting of security holders June 18, 2018, 9:00 a.m. Colonial Ballroom, Palazzo Verde, Daang Reyna, Vista Alabang, Las Piñas City 9. Approximate date on which the Information Statement is first to be sent or given to security
holders May 18, 2018 10. Securities registered pursuant to Sections 8 and 12 of the Code or Sections 4 and 8 of the
RSA:
Title of Each Class Number of Shares of Common Stock Outstanding and Amount of Debt Outstanding
Common Shares (net of treasury shares as of May 15, 2018) 12,826,926,076 Shares Vista Land Retail Bonds issued in 2014 Up to P5,000,000,000.00 Vista Land Retail Bonds issued in 2017 Up to P5,000,000,000.00 11. Are any or all of registrant's securities listed in a Stock Exchange? Yes x No _______
The Registrant’s common shares are listed on the Philippine Stock Exchange.
WE ARE NOT ASKING YOU FOR A PROXY AND YOU ARE REQUESTED NOT TO SEND US A PROXY

7
PART I
INFORMATION STATEMENT GENERAL INFORMATION Date, time and place of meeting of security holders. Date: June 18, 2018 Time: 9:00 a.m. Place: Colonial Ballroom, Palazzo Verde, Daang Reyna, Vista Alabang, Las Piñas City The corporate mailing address of the principal office of the Company is Lower Ground Floor, Building B, Evia Lifestyle Center, Vista City, Daanghari, Almanza II, Las Piñas City. This Information Statement shall be sent to security holders as soon as practicable after the approval hereof by the Securities and Exchange Commission, but not later than May 25, 2018.
Dissenters' Right of Appraisal There are no corporate matters or action that will entitle a shareholder to exercise a right of appraisal as provided under Section 81, Title X, of the Corporation Code of the Philippines (“Corporation Code”). Any stockholder of the Company shall have the right to dissent and demand payment of the fair value of his shares only in the following instances, as provided by the Corporation Code:
(1) In case any amendment to the articles of incorporation has the effect of changing or restricting the rights of any stockholder or class of shares, or of authorizing preferences in any respect superior to those outstanding shares of any class, or of extending or shortening the term of corporate existence;
(2) In case of sale, lease, exchange, transfer, mortgage, pledge or other disposition of all or substantially all of the corporate property and assets;
(3) In case of merger or consolidation; and (4) In case of investments in another corporation, business or purpose.
The appraisal right, when available, may be exercised by any stockholder who shall have voted against the proposed corporate action, by making a written demand on the corporation within thirty (30) days after the date on which the vote was taken, for payment of the fair value of his shares; Provided, That failure to make the demand within such period shall be deemed a waiver of the appraisal right. A stockholder must have voted against the proposed corporate action in order to avail himself of the appraisal right. If the proposed corporate action is implemented or effected, the corporation shall pay to such stockholder upon surrender of his certificate(s) of stock representing his shares, the fair value thereof as of the day prior to the date on which the vote was taken, excluding any appreciation or depreciation in anticipation of such corporate action. If within a period of sixty (60) days from the date the corporate action was approved by the stockholders, the withdrawing stockholder and the corporation cannot agree on the fair value of the shares, it shall be determined and appraised by three (3) disinterested persons, one of whom shall be named by the stockholder, another by the corporation and the third by the two thus chosen. The findings of the majority of appraisers shall be final, and their award shall be paid by the corporation within thirty (30) days after such award is made: Provided, that no payment shall be made to any dissenting stockholder unless the corporation has unrestricted retained earnings in its books to cover such payment; and Provided, Further, That upon payment by the corporation of the agreed or awarded price, the stockholder shall forthwith transfer his shares to the corporation. Interest of Certain Persons in or Opposition to Matters to be Acted Upon None of the officers or directors or any of their associates has any substantial interest, direct or indirect, in any of the matters to be acted upon in the stockholders’ meeting.

8
No director has informed the Company in writing that he intends to oppose any action to be taken at the meeting. CONTROL AND COMPENSATION INFORMATION
Voting Securities and Principal Holders Thereof
(a) Number of shares outstanding as of March 31, 2018:
Common: 12,826,926,076 Preferred: 3,300,000,000 (b) Record Date: May 2, 2018 Each common and each preferred share of stock of the Company is entitled to one (1) vote. Pursuant to Article II, Section 7 of the Company’s By-Laws, every holder of voting stock may vote during all meetings, including the Annual Stockholders’ Meeting, either in person or by proxy executed in writing by the stockholder or his duly authorized attorney-in-fact. Stockholders entitled to vote are also entitled to cumulative voting in the election of directors. Section 24 of the Corporation Code provides, in part, that: “….in stock corporations, every stockholder entitled to vote shall have the right to vote in person or by proxy the number of shares of stock standing, at the time fixed in the by-laws, in his own name on the stock books of the corporation, or where the by-laws are silent, at the time of the election; and said stockholder may vote such number of shares for as many persons as there are directors to be elected, or he may cumulate said shares and give one candidate as many votes as the number of directors to be elected multiplied by the number of his shares shall equal, or he may distribute them on the same principle among as many candidates as he shall see fit….” Equity Ownership of Foreign and Local Shareholders
Foreign and local security ownership as of March 31, 2018:
Class
Foreign Filipino
Shares
Percent of Class/Total Outstanding
Shares Shares
Percent of Class/Total Outstanding
Shares
Total Outstanding
Shares
Common 2,448,592,923 19.09% 10,378,333,153 80.19% 12,826,926,076 15.18% 64.35%
Preferred 0 0.00% 3,300,000,000 100.00% 3,300,000,000 0.00% 20.46%
Total 2,448,592,923 13,678,333,153 16,126,926,076

9
Security Ownership of Certain Beneficial Owners and Management
Security ownership of certain record and beneficial owners of more than 5.0% of the Company’s voting securities as of March 31, 2018:
Title of Class of Securities
Name/Address of Record Owners and Relationship with Us
Name of
Beneficial Owner /Relationship with Record
Owner Citizenship No. of Shares
Held % of
Ownership1 Common
Fine Properties, Inc Las Pinas Business Center Alabang Zapote Road, Talon, Las Piñas City Shareholder
Fine Properties, Inc./ Record Owner is also beneficial Owner2
Filipino
3,462,047,161
21.467%
Preferred
Fine Properties, Inc Las Pinas Business Center Alabang Zapote Road, Talon, Las Piñas City Shareholder
Fine Properties, Inc./ Record Owner is also beneficial Owner2
Filipino
3,300,000,000
20.463%
Common
PCD Nominee Corporation 37/F Tower 1, The Enterprise Ctr. 6766 Ayala Ave. cor. Paseo de Roxas, Makati City Shareholder
Fine Properties, Inc./ Record Owner is not the beneficial Owner4
Filipino
3,188,590,904
19.772%
Common
PCD Nominee Corporation 37/F Tower 1, The Enterprise Ctr. 6766 Ayala Ave. cor. Paseo de Roxas, Makati City Shareholder
Record Owner is not the beneficial Owner4
Non-Filipino
2,421,743,805
15.017%
Common
PCD Nominee Corporation 37/F Tower 1, The Enterprise Ctr. 6766 Ayala Ave. cor. Paseo de Roxas, Makati City Shareholder
Record Owner is not the beneficial Owner4
Filipino
2,255,758,790
13.988%
Common Althorp Holdings, Inc.
3L Starmall Las Pinas, CV Starr Ave., Pamplona, Las Pinas City Shareholder
Fine Properties, Inc./Record Owner is not the beneficial Owner2
Filipino 1,235,292,469 7.660%
1 Based on the total issued and outstanding capital stocks as of March 31, 2018 of 16,126,926,076 shares (common and preferred). 2 Mr. Manuel B. Villar, Jr. and his spouse are the controlling shareholders of Fine Properties, Inc. The right to vote the shares held by Fine Properties, Inc. has in the past been, and in this annual meeting is expected to be, exercised by either Mr. Villar or Mr. Jerry M. Navarrete. 3 Fine Properties Inc. is the controlling shareholder of Althorp Holdings, Inc. Mr. Manuel B. Villar, Jr. and his spouse are the controlling shareholders of Fine Properties, Inc. The right to vote the shares held by Fine Properties, Inc. has in the past been, and in this annual meeting is expected to be, exercised by either Mr. Villar or Mr. Jerry M. Navarrete. 4 PCD Nominee Corporation is the registered owner of shares beneficially owned by participants in the Philippine Depository & Trust Corporation, a private company organized to implement an automated book entry system of handling securities transactions in the Philippines (PCD). Under the PCD procedures, when an issuer of a PCD-eligible issue will hold a stockholders’ meeting, the PCD shall execute a pro-forma proxy in favor of its participants for the total number of shares in their respective principal securities account as well as for the total number of shares in their client securities account. For the shares held in the principal securities account, the participant concerned is appointed as proxy with full voting rights and powers as registered owner of such shares. For the shares held in the client securities account, the participant concerned is appointed as proxy, with the obligation to constitute a sub-proxy in favor of its clients with full voting and other rights for the number of shares beneficially owned by such clients. Except as indicated above, as of Record Date, the Company is not aware of any investor beneficially owning shares lodged with the PCD which comprise more than five percent (5%) of the Company’s total outstanding capital stock.

10
Security ownership of management as of March 31, 2018:
Title of class Name of beneficial owner
Amount and nature of beneficial ownership Citizenship
Percent of Class1
Common
Manuel B. Villar, Jr. C. Masibay St. BF Resort Village, Talon, Las Piñas City
293,969,986
8,638,138,749
Indirect2
Indirect3
Filipino
Filipino
1.823%
53.563%
Preferred
Manuel B. Villar, Jr. C. Masibay St. BF Resort Village, Talon, Las Piñas City
3,300,000,000
Indirect4
Filipino
20.463%
Common
Manuel Paolo A. Villar C. Masibay St. BF Resort Village, Talon, Las Piñas City
200,000
222,596,324
Direct
Indirect2
Filipino
Filipino
0.001%
1.380%
Common
Cynthia J. Javarez B3A/L2 Vetta di Citta Italia Imus, Cavite
160
Direct
Filipino
0.000%
Common
Camille A. Villar C. Masibay St. BF Resort Village, Talon, Las Piñas City
1,000
Indirect2
Filipino
0.000%
Common
Frances Rosalie T. Coloma 1-10 Granwood Villas, BF Homes, Quezon City
4,815
Direct
Filipino
0.000%
Common
Ruben O. Fruto No. 136 Bunga Ext. Ayala Alabang Village. Muntinlupa City
1,000
Direct
Filipino
0.000%
Common
Common
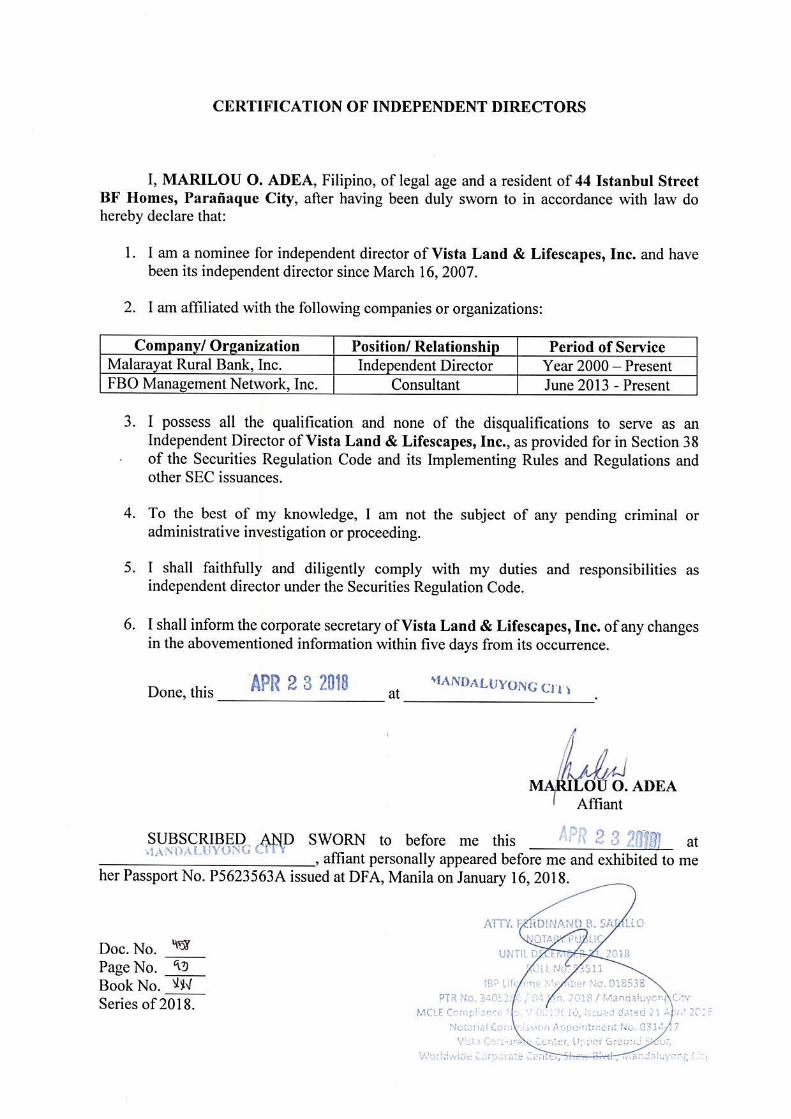
Marilou O. Adea No. 44 Istanbul Street BF Homes, Parañaque City Gemma M. Santos 17 Matungao, Bulacan Bulacan
1
1,000
Direct
Direct
Filipino
Filipino
0.000%
0.000%
Total 12,454,913,035 77.231% 1 Based on the total outstanding, issued and subscribed shares of 16,126,926,076 (common and preferred) as of March 31,
2017 2 Shares lodged under PCD Nominee Corporation (Filipino) 3 Includes 6,650,638,065 shares held thru Fine Properties, Inc., 1,235,292,469 shares held thru Althorp Holdings, Inc. and
752,208,215 shares held thru Manuela Corp. 4 Shares held thru Fine Properties, Inc. Except as indicated in the above table, the above named officers have no indirect beneficial ownership in the Company. Except as aforementioned, no other officers of the Company holds, directly or indirectly, shares in the Company.
Voting Trust Holders of 5.0% or More
As of March 31, 2018, there were no persons holding more than 5.0% of a class of shares under a voting trust or similar agreement.

11
Changes in Control The Company is not aware of any voting trust agreements or any other similar agreements which may result in a change in control of the Company. No change in control of the Company has occurred since the beginning of its last fiscal year. Directors and Executive Officers of the Registrant Term of Office Each director holds office until the annual meeting of stockholders held next after his election and his successor shall have been elected and qualified, except in case of death, resignation, disqualification or removal from office. The term of office of the officers is coterminous with that of directors that elected or appointed them. Background Information The following are the names, ages and citizenship of the incumbent directors/independent directors of the Company as of March 31, 2018: Name Age Position Citizenship Manuel B. Villar, Jr. 68 Chairman of the Board Filipino Manuel Paolo A. Villar 41 Director, President and Chief Executive Officer Filipino Cynthia J. Javarez 54 Director, Chief Financial Officer, Controller Filipino Camille A. Villar 33 Director, Managing Director of Vista Land Commercial
Division Filipino
Frances Rosalie T. Coloma 55 Director Filipino Ruben O. Fruto 79 Independent Director Filipino Marilou Adea 67 Independent Director Filipino The following are the names, ages and citizenship of the Company’s executive officers in addition to its executive and independent directors listed above as of March 31, 2018. Name Age Position Citizenship Gemma M. Santos 55 Corporate Secretary Filipino Ma. Nalen SJ Rosero 47 Chief Legal Counsel, Chief Information Officer and
Compliance Officer Filipino
Benjamarie Therese N. Serrano 54 President of Starmalls, Inc. Filipino Brian N. Edang 39 Head Investor Relations Filipino
The following states the business experience of the incumbent directors and officers of the Company for the last five (5) years: Manuel B. Villar, Jr. Chairman of the Board. Mr. Villar, 68, was Senator of the Philippines from 2001 to June 2013. He served as Senate President from 2006 to 2008. He also served as a Congressman from 1992 to 2001 and as Speaker of the House of Representatives from 1998 to 2000. A Certified Public Accountant, Mr. Villar graduated from the University of the Philippines in 1970 with the degree of Bachelor of Science in Business Administration and in 1973 with the degree of Masters in Business Administration. He founded Camella Homes in the early 1970s and successfully managed said company over the years, to become the largest homebuilder in the Philippines now known as the Vista Land Group. Mr. Villar is also Chairman of the Board of Starmalls, Inc. Manuel Paolo A. Villar, Director and President & Chief Executive Officer. Mr. Villar, 41, graduated from the Wharton School of the University of Pennsylvania, Philadelphia, USA with a Bachelor of Science in Economics and Bachelor of Applied Science in 1999. He was a consultant for McKinsey &Co. in the United States from 1999 to 2001. He joined Crown Asia in 2001 as Head of Corporate Planning. He was elected President and Chief Executive Officer of the Company in July 2011. In addition, at present, he is the CEO and Chairman of St. Agustine Gold and Copper Limited from October 2012, President of Prime Asset Ventures, Inc. from 2013, and Chairman of TVI Resource Development Philippines, Inc. from December 2013.

12
Cynthia J. Javarez, Director, Controller and Chief Financial Officer. Ms. Javarez, 54, graduated from the University of the East with a degree in Bachelor of Science in Business Administration major in Accounting. She is a Certified Public Accountant. She took a Management Development Program at the Asian Institute of Management. She is currently the Controller, Chief Financial Officer and Head of the Tax and Audit group of Vista Land after holding various other positions in the MB Villar Group of Companies since 1985. Camille A. Villar, Managing Director, Vista Land Commercial Division. Ms. Villar, 33, graduated from Ateneo de Manila University with a degree in Bachelor of Science in Management. She took Management in Business Administration, Global Executive MBA Program in IESE Business School, Barcelona, Spain. She joined the Corporate Communications Group of Brittany in 2007 until she assumed the position of Managing Director of Vista Land Commercial. She is also a Director of AllValue Holdings Corp. Frances Rosalie T. Coloma, Director. Ms. Coloma, 55, graduated cum laude from the University of the Philippines with the degree of Bachelor of Science in Business Administration and Accountancy. She is a Certified Public Accountant. She was previously the Finance Manager of Alcatel Philippines, Inc. and Intel Philippines, Inc., Country Controller of Ericsson Telecommunications Philippines, Inc., and Deal Finance Manager of Accenture Delivery Center, Philippines. She was also the Assistant General Manager of Maersk Global Services, Philippines, and is currently the Chief Financial Officer of Golden Haven, Inc Ruben O. Fruto, Independent Director. Mr. Fruto, 79, graduated with the degree of Bachelor of Laws from the Ateneo de Manila University in 1961. He was formerly a partner in the law firm of Feria, Feria, Lugtu & La O’ and the Oben, Fruto & Ventura Law Office. In February 1987, he was the Chief Legal Counsel and Senior Vice President of the Development Bank of the Philippines and Director from 1991 to 1998. He was the Undersecretary of Finance from March 1990 to May 15, 1991. Presently aside from private practice in corporate and civil litigation, he is also Of Counsel of Feria Tantoco Daos Law Office. He is also currently General Counsel of Wallem Philippines Shipping, Inc. and Wallem Maritime Services, Inc.; Vice-Chairman of Toyota Balintawak, Inc.; Director and Vice-President of China Shipping Manila Agency, Inc. and Director and Chairman of Padre Burgos Realty, Inc. Marilou O. Adea, Independent Director. Ms. Adea, 67, is currently a consultant for FBO Management Network, Inc. and is Independent Director for Malarayat Rural Bank. She was until recently the Court Appointed Rehabilitation Receiver of Anna-Lynns, Inc. and Manuela Corporation. Ms. Adea served previously as Project Director for Site Acquisition of Digital Telecommunications Phils. Inc. from 2000 to 2002, Executive Director for FBO Management Network, Inc. from 1989 to 2000 and BF Homes Inc. in Receivership from 1988 to 1994 and Vice President for Finance & Administration for L&H Resources Management Corporation from 1986 to 1988. Ms. Adea worked with the Home Development Mutual Fund from 1978 to 1986. Ms. Adea holds a Degree in Bachelor of Science in Business Administration Major in Marketing Management from the University of the Philippines. Gemma M. Santos, Corporate Secretary. Atty. Santos, 55, graduated cum laude with the degree of Bachelor of Arts, Major in History from the University of the Philippines in 1981, and with the degree of Bachelor of Laws also from the University of the Philippines in 1985. She is a practicing lawyer and Special Counsel in Picazo Buyco Tan Fider & Santos Law Offices. Ma. Nalen SJ Rosero. Chief Legal Counsel, Chief Information Officer and Compliance Officer. Atty. Rosero, 47, graduated salutatorian from the San Beda College of Law in 1997. From 1997 to 2000, she was an Associate in the Litigation Group of Angara Abello Concepcion Relaga & Cruz (ACCRA) Law Offices. She has been the Corporate Secretary of Starmalls. Inc. (formerly Polar Property Holdings Corp.) from 2001 to the present. On September 11, 2013, Atty. Rosero was designated as Compliance Officer and Chief Information Officer of the Company. Benjamarie Therese N. Serrano, President, Starmalls, Inc. Ms. Serrano, 54, graduated from the University of the Philippines with a degree in Economics and from the Asian Institute of Management with a Master’s degree in Business Management. She is also the President and Chief Executive Officer of AllValue Holdings Corp. and its subsidiaries and was President and Chief Executive Officer of Vista Land from 2007 to 2011. She also serves as Business Development Head of the Group.
13
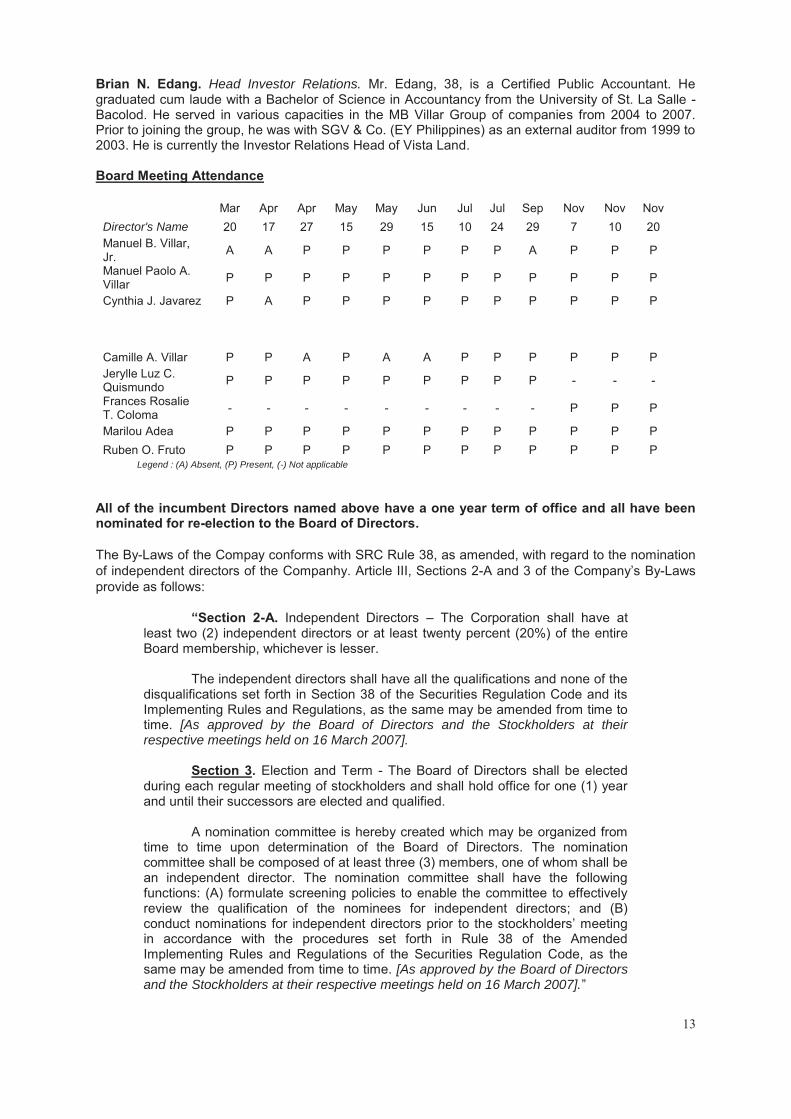
Brian N. Edang. Head Investor Relations. Mr. Edang, 38, is a Certified Public Accountant. He graduated cum laude with a Bachelor of Science in Accountancy from the University of St. La Salle - Bacolod. He served in various capacities in the MB Villar Group of companies from 2004 to 2007. Prior to joining the group, he was with SGV & Co. (EY Philippines) as an external auditor from 1999 to 2003. He is currently the Investor Relations Head of Vista Land. Board Meeting Attendance
Mar Apr Apr May May Jun Jul Jul Sep Nov Nov Nov Director's Name 20 17 27 15 29 15 10 24 29 7 10 20 Manuel B. Villar, Jr. A A P P P P P P A P P P
Manuel Paolo A. Villar P P P P P P P P P P P P
Cynthia J. Javarez P A P P P P P P P P P P Camille A. Villar P P A P A A P P P P P P Jerylle Luz C. Quismundo P P P P P P P P P - - -
Frances Rosalie T. Coloma - - - - - - - - - P P P
Marilou Adea P P P P P P P P P P P P Ruben O. Fruto P P P P P P P P P P P P
Legend : (A) Absent, (P) Present, (-) Not applicable
All of the incumbent Directors named above have a one year term of office and all have been nominated for re-election to the Board of Directors. The By-Laws of the Compay conforms with SRC Rule 38, as amended, with regard to the nomination of independent directors of the Companhy. Article III, Sections 2-A and 3 of the Company’s By-Laws provide as follows:
“Section 2-A. Independent Directors – The Corporation shall have at
least two (2) independent directors or at least twenty percent (20%) of the entire Board membership, whichever is lesser.
The independent directors shall have all the qualifications and none of the
disqualifications set forth in Section 38 of the Securities Regulation Code and its Implementing Rules and Regulations, as the same may be amended from time to time. [As approved by the Board of Directors and the Stockholders at their respective meetings held on 16 March 2007].
Section 3. Election and Term - The Board of Directors shall be elected
during each regular meeting of stockholders and shall hold office for one (1) year and until their successors are elected and qualified.
A nomination committee is hereby created which may be organized from
time to time upon determination of the Board of Directors. The nomination committee shall be composed of at least three (3) members, one of whom shall be an independent director. The nomination committee shall have the following functions: (A) formulate screening policies to enable the committee to effectively review the qualification of the nominees for independent directors; and (B) conduct nominations for independent directors prior to the stockholders’ meeting in accordance with the procedures set forth in Rule 38 of the Amended Implementing Rules and Regulations of the Securities Regulation Code, as the same may be amended from time to time. [As approved by the Board of Directors and the Stockholders at their respective meetings held on 16 March 2007].”
14
On the other hand, SRC Rule 38, as amended, provides in part as follows:
“8. Nomination and Election of Independent Director/s The following rules shall be applicable to all covered companies: A. The Nomination Committee (the "Committee") shall have at least three
(3) members, one of whom is an independent director. It shall promulgate the guidelines or criteria to govern the conduct of the nomination. The same shall be properly disclosed in the Registrant's information or proxy statement or such other reports required to be submitted to the Commission.
B. Nomination of independent director/s shall be conducted by the Committee prior to a stockholders' meeting. All recommendations shall be signed by the nominating stockholders together with the acceptance and conformity by the would-be nominees.
C. The Committee shall pre-screen the qualifications and prepare a final list of all candidates and put in place screening policies and parameters to enable it to effectively review the qualifications of the nominees for independent director/s.
D. After the nomination, the Committee shall prepare a Final List of Candidates which shall contain all the information about all the nominees for independent directors, as required under Part IV (A) and (C) of Annex "C" of SRC Rule 12, which list, shall be made available to the Commission and to all stockholders through the filing and distribution of the Information Statement, in accordance with SRC Rule 20, or in such other reports the Registrant is required to submit to the Commission. The name of the person or group of persons who recommended the nomination of the independent director shall be identified in such report including any relationship with the nominee.
E. Only nominees whose names appear on the Final List of Candidates shall be eligible for election as Independent Director/s. No other nominations shall be entertained after the Final List of Candidates shall have been prepared. No further nominations shall be entertained or allowed on the floor during the actual annual stockholders'/memberships' meeting.”
The Company has complied with the guidelines on the nomination and election of independent directors set forth in Rule 38 of the Amended Implementing Rules and Regulations of the Securities Regulation Code. The nominated independent directors, namely, Mr. Ruben O. Fruto and Ms. Marilou O. Adea were duly nominated by Ms. Marilyn J. Javier, a registered shareholder of the Company who is not a director, officer or substantial shareholder of the Company and who is not related to either of the said nominees. The Nominations Committee of the Company is composed of Mr. Manuel B. Villar, Jr., Chairman, and Jerylle Luz C. Quismundo and Ruben Fruto, members. Directors elected during the annual meeting of stockholders will hold office for one year until their successors are duly elected and qualified. A director who was elected to fill any vacancy holds office only for the unexpired term of his predecessor. No Director has resigned or declined to stand for re-election to the Board of Directors since the date of the last annual stockholders’ meeting due to disagreement with the Company on any matter relating to the Company’s operations, policies or practices. The Company has no other significant employee other than its Executive Officers. Mr. Manuel Paolo A. Villar and Ms. Camille A. Villar, who are both officers of the Company, are siblings and children of Mr. Manuel B. Villar, Jr., the Chairman of the Board. Except for the aforesaid relationship, none of the Company’s Directors or Executive Officers is related to the others by consanguinity or affinity within the fourth civil degree.

15
Except as otherwise disclosed in the Annual Report of the Company (SEC Form 17-A) for the year ended December 31, 2017, the Company has not had any transaction during the last two (2) years in which any Director or Executive Officer or any of their immediate family members had a direct or indirect interest. None of the aforementioned Directors or Executive Officers is or has been involved in any criminal or bankruptcy proceeding, or is or has been subject to any judgment of a competent court barring or otherwise limiting his involvement in any type of business, or has been found to have violated any securities laws during the past five (5) years and up to the latest date. However, the Company has been informed by Atty. Ruben Fruto that he is one of the respondents in investigation proceedings before the Preliminary Investigation and Administrative Adjudication Bureau of the Office of the Ombudsman, designated as OMB Case No. CC-04-0423-I entitled “Special Presidential Task Force 156 versus Antonio P. Belicena, et al.” Atty. Fruto has filed a Manifestation and Motion seeking the dismissal of the subject proceedings as against him, but the same motion has remained unacted upon since the filing thereof on December 28, 2015. Compensation of Directors and Executive Officers Executive Compensation
The compensation for its executive officers for the years 2016 and 2017 (actual) and 2018 (projected) are shown below:
Names Position Year Salary Bonus Others Manuel Paolo A. Villar Cynthia J. Javarez Camille A. Villar Benjamarie Therese N. Serrano Ma. Nalen S.J. Rosero Aggregate executive compensation for above named officers Aggregate executive compensation of all other officers and directors, unnamed
President & CEO Controller/ CFO Managing Director, Vista Land Commercial President, Starmalls, Inc. Chief Legal Counsel/ CIO
Actual 2016 Actual 2017 Projected 2018 Actual 2016 Actual 2017 Projected 2018
P36.0M
P50.0M
P53.1M
P161.4M
P169.4M
P177.9M
P7.6M
P10.0M
P10.5M
P23.0M
P25.3M
P26.6M
P None P None P None P None P None P None
Standard arrangements
Other than payment of reasonable per diem of P=125,000 per non-executive director for every meeting, there are no standard arrangements pursuant to which directors of the Company are compensated, or are to be compensated, directly or indirectly by the Company’s subsidiaries, for any services provided as a director for 2016 and 2017.

16
Other arrangements
There are no other arrangements pursuant to which any director of the Company was compensated, or is to be compensated, directly or indirectly by the Company’s subsidiaries, during 2016 or 2017 for any service provided as a director.
Employment contract between the company and executive officers
There are no special employment contracts between the Company and the named executive officers.
Warrants and options held by the executive officers and directors
There are no outstanding warrants or options held by the Company’s CEO, the named executive officers, and all officers and directors as a group. Significant employee While the Company values the contribution of each of its executive and non-executive employees, the Company believes there is no non-executive employee that the resignation or loss of whom would have a material adverse impact on the business of the Company. Other than standard employment contracts, there are no special arrangements with non-executive employees of the Company. Certain relationships and related transactions
As of December 31, 2017, the Villar Family Companies held 71.37% of the total issued and outstanding common share capital of the Company and 77.23% of the total issued and outstanding common and preferred share capital of the Company.
The Company and its subsidiaries, in their ordinary course of business, engage in transactions with the Villar Family Companies and their respective subsidiaries. The Company’s policy with respect to related-party transactions is to ensure that these transactions are entered into on terms at least comparable to those available from unrelated third parties. Independent Public Accountants The auditing firm of SGV & Co. is being recommended for election as external auditor for the current year.
Representatives of the said firm are expected to be present at the annual stockholders’ meeting and will have the opportunity to make a statement if they desire to do so, and are expected to be available to respond to appropriate questions. In 2017, the Company’s auditors did not perform any substantial non-audit services for the Company. Changes in and Disagreement with Accountants on Accounting and Financial Disclosure Since the incorporation of the Company in 2007, there was no instance where the Company’s public accountants resigned or indicated that they decline to stand for re-election or were dismissed nor was there any instance where the Company had any disagreement with its public accountants on any accounting or financial disclosure issue. The 2017 audit of the Company is in compliance with paragraph (3)(b)(iv) of SRC Rule 68, as amended, which provides that the external auditor should be rotated, or the handling partner changed, every five (5) years or earlier.
For Changes in Accounting Policies, refer to Note 4 - Summary of Significant Accounting Policies under Changes in Accounting Policies and Disclosures discussion on the Consolidated Financial Statements as of and for the years ended December 31, 2017, 2016, and 2017 included in this report.

17
Audit Committee’s Approval Policies and Procedures
In relation to the audit of the Company’s annual financial statements, the Company's Revised Corporate Governance Manual provides that the audit committee shall, among other activities, (i) evaluate significant issues reported by the external auditors in relation to the adequacy, efficiency and effectiveness of policies, controls, processes and activities of the Company; (ii) ensure that other non-audit work provided by the external auditors are not in conflict with their functions as external auditors; and (iii) ensure the compliance of the Company with acceptable auditing and accounting standards and regulations. The Audit Committee of the Company is composed of Ms. Marilou Adea, Chairman, and Mr. Ruben Fruto and Ms. Cynthia Javarez, members. External Audit and Audit-Related Fees The following table sets out the aggregate fees billed for each of the last two years for professional services rendered by SGV & Co.
2016 2017 (In P Thousands) Audit and Audit-Related Fees:
Fees for services that are normally provided by the external auditor in connection with statutory and regulatory filings or engagements
P 19,060
P 27,133 All other fees ̶ ̶ Total P 19,878 P 27,133
SGV & Co. does not have any direct or indirect interest in the Company
Tax Fees Except as provided above, the Company did not pay any tax fees and other fees to its external auditors. OTHER MATTERS Action with Respect to Reports The following reports will be submitted for approval by the stockholders: 1. The President's Report; and 2. Audited Financial Statements for the year 2017. Other Proposed Actions 1. Ratification of all acts and resolutions of the Board of Directors and Management from the date of
the last annual stockholders’ meeting until the date of this meeting as set forth in the minutes of the meetings of the Board of Directors held during the same period and in the disclosures that have been duly filed with the SEC and the PSE. These minutes cover various resolutions of the Board, including declaration of cash dividends, approval of 2016 and 2017 Audited Financial Statements, resignation/election of members of the Board of Directors, refinancing of dollar loan obligations, guaranty of subsidiaries’ bilateral loans and additional issuance of dollar notes, issuance of corporate notes, shelf registration and issuance of Peso retail bonds, opening of bank accounts and appointment of authorized signatories for various transactions in the normal course of business of the Company.
2. Appointment of External Auditors

18
Voting Procedures Manner of voting
In all items for approval, except in the election of directors, each share of stock entitles its registered owner to one vote. For the purpose of electing directors, a stockholder may vote such number of his shares for as many persons as there are directors to be elected or he may cumulate said shares and give one candidate as many votes as the number of directors to be elected multiplied by the number of his shares shall equal, or he may distribute them in the same principle among as many candidates as he shall see fit. Unless required by law, or demanded by a stockholder present or represented at the meeting and entitled to vote thereat, voting need not be by ballot and will be done by show of hands.
Voting requirements
(a) With respect to the election of directors, candidates who received the highest number of votes
shall be declared elected. (b) With respect to the adoption of the Audited Financial Statements for the year ended 31
December 2017, as well as the approval or ratification of the other actions set forth under the heading “Other Proposed Actions” above, the vote of majority of the outstanding capital stock entitled to vote and represented in the meeting is required to approve such matters.
Method of counting votes
The Corporate Secretary will be responsible for counting votes based on the number of shares entitled to vote owned by the stockholders who are present or represented by proxies at the Annual Meeting of the stockholders.
UPON THE WRITTEN REQUEST OF A STOCKHOLDER, THE COMPANY UNDERTAKES TO FURNISH SAID STOCKHOLDER A COPY OF SEC FORM 17-A FREE OF CHARGE, EXCEPT FOR EXHIBITS ATTACHED THERETO WHICH SHALL BE CHARGED AT COST. ANY WRITTEN REQUEST FOR A COPY OF SEC FORM 17-A SHALL BE ADDRESSED AS FOLLOWS:
Vista Land & Lifescapes, Inc. Lower Ground Floor, Building B, Evia
Lifestyle Center, Vista City, Daanghari, Almanza, Las Piñas City, Philippines
Attention: Brian N. Edang
19
PART II
MANAGEMENT REPORT I. FINANCIAL STATEMENTS The Consolidated Financial Statements of the Company as of and for the year ended December 31, 2017 are incorporated herein in the accompanying Index to Financial Statements and Supplementary Schedules. II. INFORMATION ON INDEPENDENT ACCOUNTANT
SGV & Co., independent certified public accountants, audited the Company's consolidated financial statements without qualification as of and for the years ended December 31, 2017, 2016, and 2015, included in this report.
SGV & Co. has acted as the Company's external auditors since 2008 and as Camella Homes, Inc.’s external auditors since 1994. Cyril Jasmin B. Valencia is the current audit partner for the Company and the other subsidiaries The Company has not had any disagreements on accounting and financial disclosures with its current external auditors for the same periods or any subsequent interim period. SGV & Co. has neither shareholdings in the Company nor any right, whether legally enforceable or not, to nominate persons or to subscribe for the securities in the Company. SGV & Co. will not receive any direct or indirect interest in the Company or in any securities thereof (including options, warrants or rights thereto) pursuant to or in connection with the Offer. The foregoing is in accordance with the Code of Ethics for Professional Accountants in the Philippines set by the Board of Accountancy and approved by the Professional Regulation Commission.
In relation to the audit of the Company's annual financial statements, the Company's Revised Corporate Governance Manual provides that the audit committee shall, among other activities (i) evaluate significant issues reported by the external auditors in relation to the adequacy, efficiency and effectiveness of policies, controls, processes and activities of the Company; (ii) ensure that other non-audit work provided by the external auditors are not in conflict with their functions as external auditors; and (iii) ensure the compliance of the Company with acceptable auditing and accounting standards and regulations.
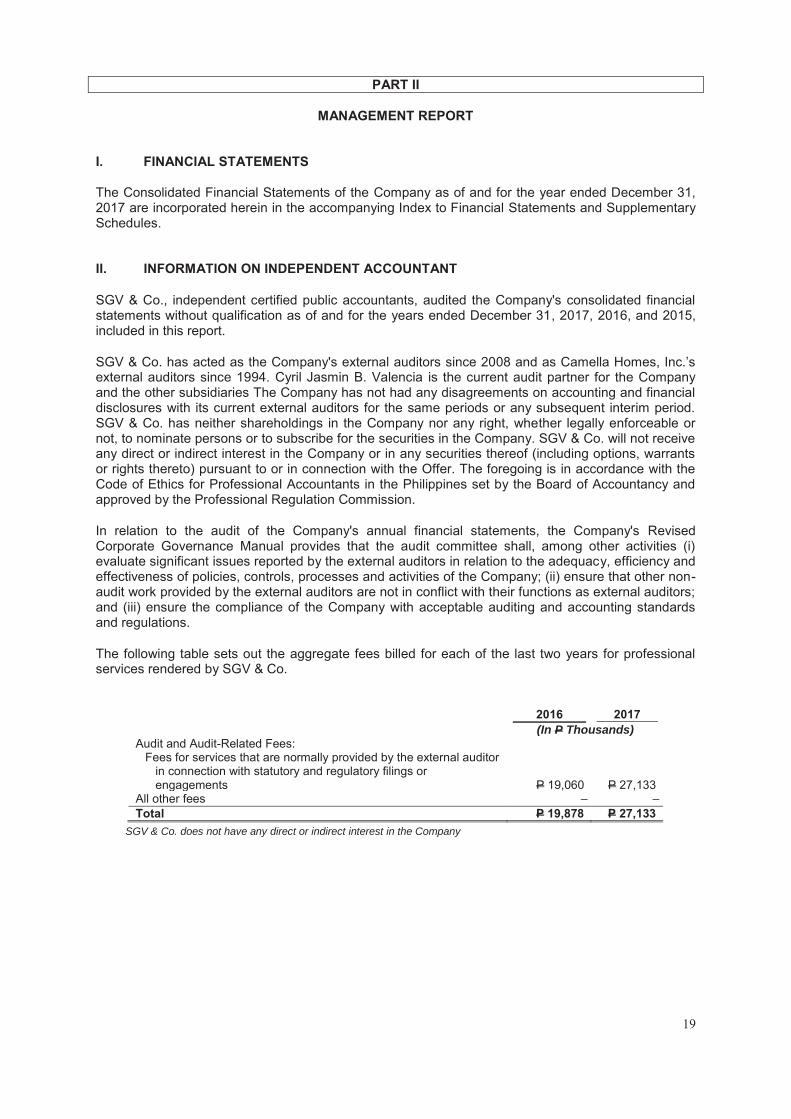
The following table sets out the aggregate fees billed for each of the last two years for professional services rendered by SGV & Co.
2016 2017 (In P Thousands) Audit and Audit-Related Fees:
Fees for services that are normally provided by the external auditor in connection with statutory and regulatory filings or engagements
P 19,060
P 27,133 All other fees ̶ ̶ Total P 19,878 P 27,133
SGV & Co. does not have any direct or indirect interest in the Company

20
III. MANAGEMENT’S DISCUSSION AND ANALYSIS OR PLAN OF OPERATION REVIEW OF YEAR END 2017 VS YEAR END 2016 RESULTS OF OPERATIONS Revenues Real Estate The Company recorded revenue from real estate sales amounting to P=27,594.4 million for the year ended December 31, 2017, an increase of 10% from P=25,025.2 million in same period last year. This was primarily attributable to the increase in the overall completion rate of sold inventories of its business units. The Company uses the Percentage of completion method of revenue recognition where revenue is recognized in reference to the stages of development of the properties.
Real estate revenue from Vista Residences increased by 103% to P=4,262.7 million for the year ended December 31, 2017 from P=2,102.1 million for the year ended December 31, 2016. This increase was principally attributable to the increase in the number of sold condominium units completed or under construction during the year. The Company is currently delivering a number of condominium projects launched from 2-3 years ago. Vista Residences is the business unit of Vista Land that develops and sells vertical projects across the Philippines.
Real estate revenue of Brittany increased by 40% to P=904.0 million for the year ended December 31, 2017 from P=645.4 million in the same period last year. The increase was principally attributable to the increase in the number of completed sold units in the 4th quarter for projects in the Mega Manila area in the high-end housing segment.
Real estate revenue of Crown Asia increased to P=1,178.7 million for the year ended December 31, 2017 from P=985.1 million for the year ended December 31, 2016. The increase was principally attributable to the increase in the number of completed units sold specifically in the 4th quarter for projects in the Mega Manila area in the middle-income housing segment.
Real estate revenue of Camella Homes was flat at P=8,158.3 million for the year ended
December 31, 2017 from P=8,199.8 million for the year ended December 31, 2016. This was principally attributable to the same number of sold homes completed or under construction in the Mega Manila area in the low-cost and affordable housing segment during the year.
Real estate revenue of Communities Philippines was also flat to P=13,090.7 million for the year
ended December 31, 2017 from P=13,092.7 million for the year ended December 31, 2016. This was principally attributable to the same level in the number of sold homes completed or under construction outside the Mega Manila area in the low-cost and affordable housing segment during the year.
Rental income Rental income increased by 29% from P=4,375.3 million for the year ended December 31, 2016 to P=5,625.2 million for the year ended December 31, 2017. The increase was primarily attributable to the additional gross floor area leased out of our investment properties as well as increase in rental rates of our existing malls. Interest income from installment contract receivable and investments Interest income from installment contract receivable and investments increased by 16% from P=1,507.0 million for the year ended December 31, 2016 to P=1,746.2 million for the year ended December 31, 2017. The increase was primarily attributable to the increase in interest income from investments of 39% to P=1,202.6 million for the year ended December 31, 2017 d ue to the recycling of comprehensive income accumulated from AFS investments disposed during the year and the decrease in the interest income from installment contracts receivable of 15% to P=543.5 million for the year ended December 31, 2017 as most of the Group’s buyers are now taking mortgage financing.

21
Miscellaneous Income Miscellaneous income increased by 13% from P=952.5 million for the year ended December 31, 2016 to P=1,076.6 million for the year ended December 31, 2017. The increase was primarily attributable to the 28% increase of the other operating income and parking fees from our malls to P=378.0 million for the year ended December 31, 2017 and the slight increase of 6% to P=698.6 million pertaining to forfeited reservation fees and partial payments from customers whose sales contracts are cancelled before completion of required down payment. Other income (expenses) There was no foreign exchange losses incurred for the year 2017 as the unrealized loss on the Group’s dollar liabilities were offset by the unrealized gain from the Group dollar denominated investments. Costs and Expenses Cost and expenses increased by 7% to P=21,384.5 million for the year ended December 31, 2017 from P=19,915.5 million for the year ended December 31, 2016.
Cost of real estate sales increased by 8% from P=12,321.0 million for the year ended December 31, 2016 to P=13,303.6 million for the year ended December 31, 2017 primarily due to the increase in the overall recorded sales of Vista Land’s business units.
Operating expenses increased by 6% from P=7,594.5 million for the year ended December 31, 2016 to P=8,080.9 million for the year ended December 31, 2017 primarily due to the following:
o an increase in depreciation and amortization from P=1,030.0 million for the year ended December 31, 2016 to P=1,350.2 million in the year ended December 31, 2017 due to the increase in investment properties and additions to property and equipment for the year.
o an increase in commissions from P=1,376.4 million for the year ended December 31, 2016 to P=1,482.5 million for the year ended December 31, 2017 resulting from increase in sales of the Company during the year.
o an occupancy costs from P=715.4 million for the year ended December 31, 2016 to
P=898.3 million for the year ended December 31, 2017 due to increase in the number of malls as well as projects during the year,
Interest and other financing charges Interest and other financing charges increased by 51% from P=2,263.3 million for the year ended December 31, 2016 to P=3,384.2 million for the year ended December 31, 2017. The increase was primarily attributable to the increase in the interest bearing debt of the Company for the year and reduced capitalization for qualifying assets that are already completed during the year. Provision for Income Tax Provision for income tax increased by 40% from P=1,582.2 million for the year ended December 31, 2016 to P=2,210.8 million for the year ended December 31, 2017 primarily due to a higher taxable base for the year. Net Income As a result of the foregoing, the Company’s net income increased by 12% to P=9,062.8 million for the year ended December 31, 2017 from P=8,100.4 million for the year ended December 31, 2016. For the year ended December 31, 2017, there were no seasonal aspects that had a material effect on the financial condition or results of operations of the Company. Neither were there any trends, events or uncertainties that have had or that are reasonably expected to have a material impact on the net

22
sales or revenues or income from continuing operations. The Company is not aware of events that will cause a material change in the relationship between the costs and revenues. There are no significant elements of income or loss that did not arise from the Company’s continuing operations. FINANCIAL CONDITION As of December 31, 2017 vs. December 31, 2016 Total assets as of December 31, 2017 were 199,934.7 million compared to P=174,768.2 million as of December 31, 2016, or a 14% increase. This was due to the following:
Cash and cash equivalents including short term and long-term cash investments, available-for-sale financial assets (excluding equity securities) and held-to-maturity investments increased by 6% from P=37,933.4 million as of December 31, 2016 to P=40,158.8 million as of December 31, 2017 primarily due to the higher internal cash generated and net proceeds from the debt issuance for the year.
Receivables including non-current portion increased by 18% from P37,541.7 million as of
December 31, 2016 to P44,182.5 million as of December 31, 2017due to an increase in the installment contracts receivables from the current year sale and increase in other non-trade receivables.
Receivables from related parties increased by 27% from P3,916.7 million as of December 31, 2016 to P4,987.9 million as of December 31, 2017 due to advances made to the affiliates during the year.
Real estate inventories increased by 15% from P22,954.7 million as of December 31, 2016 to P26,333.9 million as of December 31, 2017 due primarily to the increase in the project launched during the year.
Investment properties increased by 17% from P32,065.5 million as of December 31, 2016 to P37,437.7 million as of December 31, 2017 due primarily to the additions to commercial developments of both the Company and its newly acquired subsidiary Starmalls.
Land and improvements increased by 15% from P30,486.6 million as of December 31, 2016 to P35,029.9as of December 31, 2017 million due primarily to the acquisitions of land made during the year.
Property and equipment increased by 8% from P=822.3 million as of December 31, 2016 to
P=855.8 million as of December 31, 2017 due primarily to the additions of property and equipment for the year.
Investments and advances in project development costs increased by 25% from P=3,232.3 million as of December 31, 2016 to P=4,034.3 million as of December 31, 2017 due primarily to the advances to land owners for joint venture projects during the year.
Pension assets was recorded at P=87.7 million as of December 31, 2017 from a pension liabilities of P=98.1 million as of December 31, 2016 as a result of actuarial adjustment for the company’s retirement program.
Other assets including current portion increased by 13% from P5,064.8 million as of December 31, 2016 to P5,725.4 million as of December 31, 2017 due primarily to the increase in various deposits and input vat.
Total liabilities as of December 31, 2017 were P=115,926.8 million compared to P=98,272.9 million as of December 31, 2016, or a 18% increase. This was due to the following:

23
Accounts and other payables increased by 16% to P=13,274.9 million as of December 31, 2017 from P=11,400.4 million as of December 31, 2016 due to the increase in trade payables and other payables.
Customers’ advances and deposit increased by 35% to P=3,617.9 million as of December 31, 2017 from P=2,671.7 million as of December 31, 2016 due to a higher reservations sales for the year.
Income tax payable decreased by 15% from P=134.0 million as of December 31, 2016 to P=53.2 million as of December 31, 2017 due primarily to the settlements for the year.
Dividend payable increased by 16% million from P=25.0 million as of December 31, 2016 to P=28.9 million as of December 31, 2017 due primarily to the dividend declared during the year..
Notes payable including non-current portion increased by 38% from P=39,525.1 million as of December 31, 2016 to P=54,501.0 million as of December 31, 2017 due primarily to the issuance of dollar notes, peso corporate notes and retail bond for the year.
Deferred tax liabilities – net increased by 48% from P1,628.5 million as of December 31, 2016 to P2,414.2 million as of December 31, 2017 due to the additional deferred liabilities recognized for the year.
Other noncurrent liabilities decreased by 30% from P=2,378.5 million as of December 31, 2016 to P=1,674.1 million as of December 31, 2017 due to the settlements for the period.
Total stockholder’s equity increased by 10% from P=76,495.3 million as of December 31, 2016 to P=84,007.9 million as of December 31, 2017 due to the net income recorded for the year ended December 31, 2017, increase in other comprehensive income and non-controlling interest. Considered as the top five key performance indicators of the Company as shown below:
Notes:
(a) Current Ratio: This ratio is obtained by dividing the Current Assets of the Company by its Current liabilities. This ratio is used as a test of the
Company’s liquidity.
(b) Liability-to-equity ratio: This ratio is obtained by dividing the Company’s Total Liabilities by its Total Equity. The ratio reveals the proportion of
liability and equity a company is using to finance its business. It also measures a company’s borrowing capacity.
(c) Interest expense/Income before interest expense: This ratio is obtained by dividing interest expense for the period by its income before interest
expense. This ratio shows whether a company is earning enough profits before interest to pay its interest cost comfortably
(d) Return on assets: This ratio is obtained by dividing the Company’s net income by its total assets. This measures the Company’s earnings in
relation to all of the resources it had at its disposal.
(e) Return on equity: This ratio is obtained by dividing the Company’s net income by its total equity. This measures the rate of return on the
ownership interest of the Company’s stockholders.
Because there are various calculation methods for the performance indicators above, the Company’s presentation of such may not be comparable to
similarly titled measures used by other companies.
Current ratio as of December 31, 2017 increased from that of December 31, 2016 due primarily to the increase in the current portion of AFS and HTM investments.
Key Performance Indicators 12/31/2017 12/31/2016 Current ratio (a) 4.67:1 3.28:1 Liability-to-equity ratio (b) 1.38:1 1.28:1 Interest expense/Income before
Interest expense (c) 23.1% 18.8%
Return on assets (d) 4.5% 4.6% Return on equity (e) 10.8% 10.6%

24
Liability-to-equity ratio increased due to the increase in the total liabilities brought by the proceeds from accounts and other payables, customer’s advances and deposits as well as notes payable. Interest expense as a percentage of income before interest expense increased in the year ended December 31, 2017 compared to the ratio for the year ended December 31, 2016 due to the higher interest expense for the year. Return on asset remained constant for December 31, 2017 compared to that on December 31, 2016. Return on equity slightly increased due primarily to the higher net income reported for the year ended December 31, 2017.
Material Changes to the Company’s Balance Sheet as of December 31, 2017 compared to December 31, 2016 (increase/decrease of 5% or more)
Cash and cash equivalents including short term and long-term cash investments, available-for-sale financial assets (excluding equity securities) and held-to-maturity investments increased by 6% from P=37,933.4 million as of December 31, 2016 to P=40,158.8 million as of December 31, 2017 primarily due to the higher internal cash generated and net proceeds from the debt issuance for the year.
Receivables including non-current portion increased by 18% from P37,541.7 million as of December 31, 2016 to P44,182.5 million as of December 31, 2017due to an increase in the installment contracts receivables from the current year sale and increase in other non-trade receivables.
Receivables from related parties increased by 27% from P3,916.7 million as of December 31, 2016 to P4,987.9 million as of December 31, 2017 due to advances made to the affiliates during the year.
Real estate inventories increased by 15% from P22,954.7 million as of December 31, 2016 to P26,333.9 million as of December 31, 2017 due primarily to the increase in the project launched during the year.
Investment properties increased by 17% from P32,065.5 million as of December 31, 2016 to P37,437.7 million as of December 31, 2017 due primarily to the additions to commercial developments of both the Company and its newly acquired subsidiary Starmalls.
Land and improvements increased by 15% from P30,486.6 million as of December 31, 2016 to P35,029.9as of December 31, 2017 million due primarily to the acquisitions of land made during the year.
Property and equipment increased by 8% from P=822.3 million as of December 31, 2016 to P=855.8 million as of December 31, 2017 due primarily to the additions of property and equipment for the year.
Investments and advances in project development costs increased by 25% from P=3,232.3 million as of December 31, 2016 to P=4,034.3 million as of December 31, 2017 due primarily to the advances to land owners for joint venture projects during the year.
Pension assets was recorded at P=87.7 million as of December 31, 2017 from a pension liabilities of P=98.1 million as of December 31, 2016 as a result of actuarial adjustment for the company’s retirement program.
Other assets including current portion increased by 13% from P5,064.8 million as of December 31, 2016 to P5,725.4 million as of December 31, 2017 due primarily to the increase in various deposits and input vat.

25
Accounts and other payables increased by 16% to P=13,274.9 million as of December 31, 2017 from P=11,400.4 million as of December 31, 2016 due to the increase in trade payables and other payables.
Customers’ advances and deposit increased by 35% to P=3,617.9 million as of December 31, 2017 from P=2,671.7 million as of December 31, 2016 due to a higher reservations sales for the year.
Income tax payable decreased by 15% from P=134.0 million as of December 31, 2016 to P=53.2 million as of December 31, 2017 due primarily to the settlements for the year.
Dividend payable increased by 16% million from P=25.0 million as of December 31, 2016 to P=28.9 million as of December 31, 2017 due primarily to the dividend declared during the year..
Notes payable including non-current portion increased by 38% from P=39,525.1 million as of December 31, 2016 to P=54,501.0 million as of December 31, 2017 due primarily to the issuance of dollar notes, peso corporate notes and retail bond for the year.
Deferred tax liabilities – net increased by 48% from P1,628.5 million as of December 31, 2016 to P2,414.2 million as of December 31, 2017 due to the additional deferred liabilities recognized for the year.
Other noncurrent liabilities decreased by 30% from P=2,378.5 million as of December 31, 2016 to P=1,674.1 million as of December 31, 2017 due to the settlements for the period.
Total stockholder’s equity increased by 10% from P=76,495.3 million as of December 31, 2016 to P=84,007.9 million as of December 31, 2017 due to the net income recorded for the year ended December 31, 2017, increase in other comprehensive income and non-controlling interest.
Material Changes to the Company’s Statement of Income for the year ended December 31, 2017compared to the year ended December 31, 2016 (increase/decrease of 5% or more)
Real estate sales amounting to P=27,594.4 million for the year ended December 31, 2017, an increase of 10% from P=25,025.2 million in same period last year. This was primarily attributable to the increase in the overall completion rate of sold inventories of its business units. Rental income increased by 29% from P=4,375.3 million for the year ended December 31, 2016 to P=5,625.2 million for the year ended December 31, 2017. The increase was primarily attributable to the additional gross floor area leased out of our investment properties as well as increase in rental rates of our existing malls. Interest income from installment contract receivable and investments increased by 16% from P=1,507.0 million for the year ended December 31, 2016 to P=1,746.2 million for the year ended December 31, 2017. The increase was primarily attributable to the increase in interest income from investments of 39% to P=1,202.6 million for the year ended December 31, 2017 d ue to the recycling of comprehensive income accumulated from AFS investments disposed during the year and the decrease in the interest income from installment contracts receivable of 15% to P=543.5 million for the year ended December 31, 2017 as most of the Group’s buyers are now taking mortgage financing. Miscellaneous income increased by 13% from P=952.5 million for the year ended December 31, 2016 to P=1,076.6 million for the year ended December 31, 2017. The increase was primarily attributable to the 28% increase of the other operating income and parking fees from our malls to P=378.0 million for the year ended December 31, 2017 and the slight increase of 6% to P=698.6 million pertaining to forfeited reservation fees and partial payments from customers whose sales contracts are cancelled before completion of required down payment.

26
There was no foreign exchange losses incurred for the year 2017 as the unrealized loss on the Group’s dollar liabilities were offset by the unrealized gain from the Group dollar denominated investments.
Cost of real estate sales increased by 8% from P=12,321.0 million for the year ended December 31, 2016 to P=13,303.6 million for the year ended December 31, 2017 primarily due to the increase in the overall recorded sales of Vista Land’s business units. Operating expenses increased by 6% from P=7,594.5 million for the year ended December 31, 2016 to P=8,080.9 million for the year ended December 31, 2017 primarily due to the increase in depreciation and amortization resulting from the increase in investment properties and additions to property and equipment for the year, increase in commissions resulting from increase in sales, increase in occupancy cost due to increase in the number of malls as well as projects during the year.
Interest and other financing charges increased by 51% from P=2,263.3 million for the year ended December 31, 2016 to P=3,384.2 million for the year ended December 31, 2017. The increase was primarily attributable to the increase in the interest bearing debt of the Company for the year and reduced capitalization for qualifying assets that are already completed during the year. Provision for income tax increased by 40% from P=1,582.2 million for the year ended December 31, 2016 to P=2,210.8 million for the year ended December 31, 2017 primarily due to a higher taxable base for the year. The Company’s net income increased by 12% to P=9,062.8 million for the year ended December 31, 2017 from P=8,100.4 million for the year ended December 31, 2016. There are no other material changes in the Company’s financial position (changes of 5% or more) and condition that will warrant a more detailed discussion, Further, there are no material events and uncertainties known to management that would impact or change reported financial information and condition of the Company.
REVIEW OF YEAR END 2016 VS YEAR END 2015 RESULTS OF OPERATIONS Revenues Real Estate The Company recorded revenue from real estate sales amounting to P=25,025.2 million for the year ended December 31, 2016 an increase of 2% from P=24,502.2 million in same period last year. This was primarily attributable to the increase in the overall completion rate of sold inventories of its business units particularly of Camella and Communities Philippines. The Company uses the Percentage of completion method of revenue recognition where revenue is recognized in reference to the stages of development of the properties.
Real estate revenue of Camella Homes increased by 20% to P=8,199.8 million for the year ended December 31, 2016 from P=6,807.5 million for the year ended December 31, 2015. This increase was principally attributable to the increase in the number of sold homes completed or under construction in the Mega Manila area in the low-cost and affordable housing segment during the year.
Real estate revenue of Communities Philippines increased by 8% to P=13,092.7 million for the
year ended December 31, 2016 from P=12,134.7 million for the year ended December 31, 2015. This increase was principally attributable to the increase in the number of sold homes completed or under construction outside the Mega Manila area in the low-cost and affordable housing segment during the year.

27
Real estate revenue of Crown Asia decreased to P=985.1 million for the year ended December 31, 2016 from P=1,314.0 million for the year ended December 31, 2015. This decrease was principally attributable to the decline in the number of sold homes completed or under construction in the Mega Manila area in the middle-income housing segment during the year.
Real estate revenue of Brittany decreased by 34% to P=645.4 million for the year ended
December 31, 2016 from P=981.9 million in the same period last year. This decrease was principally attributable to the decrease in the number of sold homes completed or under construction in the Mega Manila area in the high-end housing segment, which was a reflection of the Company’s focus on meeting the increased demand for housing in the low-cost and affordable segment serviced by its other business units.
Real estate revenue from Vista Residences decreased by 36% to P=2,102.1 million for the year ended December 31, 2016 from P=3,264.1 million for the year ended December 31, 2015. This decrease was principally attributable to the decrease in the number of sold condominium units completed or under construction during the year. Vista Residences is the business unit of Vista Land that develops and sells vertical projects across the Philippines.
Rental income Rental income increased by 85% from P=2,367.9 million for the year ended December 31, 2015 to P=4,375.3 million for the year ended December 31, 2016. The increase was primarily attributable the additional gross floor area leased out of our investment properties as well as increase in rental rates of our existing malls. Interest income from installment contract receivable Interest income from installment contract receivable decreased by 10% from P=710.3 million for the year ended December 31, 2015 to P=642.6 million for the year ended December 31, 2016. The decrease was primarily attributable decrease in the interest collected from buyers opting to get in-house financing as more of our buyers are getting bank mortgages to finance their purchase. Miscellaneous Income Miscellaneous income decreased by 25% from P=1,268.6 million for the year ended December 31, 2015 to P=952.5 million for the year ended December 31, 2016. The decrease was primarily attributable the forfeited reservation fees and partial payments from customers whose sales contracts are cancelled before completion of required down payment as well as increase in other operating income and parking fees from our malls. Interest income from investments Interest income from investments increased by 46% from P=593.0 million for the year ended December 31, 2015 to P=864.4 million for the year ended December 31, 2016. The increase was primarily attributable to the increase in the amount invested by the Company to various debt instruments. The Company’s investments increased during the year due to the proceeds from various fund raising activities for the year. Other income (expenses) Other expense of P=7.0 million for the year ended December 31, 2015 increased to P=25.7 million for the year ended December 31, 2016. The increase in the other expense was primarily attributable increase in the foreign exchange losses recorded for the year from our interest payments to our dollar loans. Costs and Expenses Cost and expenses increased by 3% to P=19,915.5 million for the year ended December 31, 2016 from P=19,305.5 million for the year ended December 31, 2015.
Cost of real estate sales increased by 1% from P=12,253.9 million for the year ended December 31, 2015 to P=12,321.0 million for the year ended December 31, 2016 primarily due to the increase in the overall recorded sales of Vista Land’s business units.
28
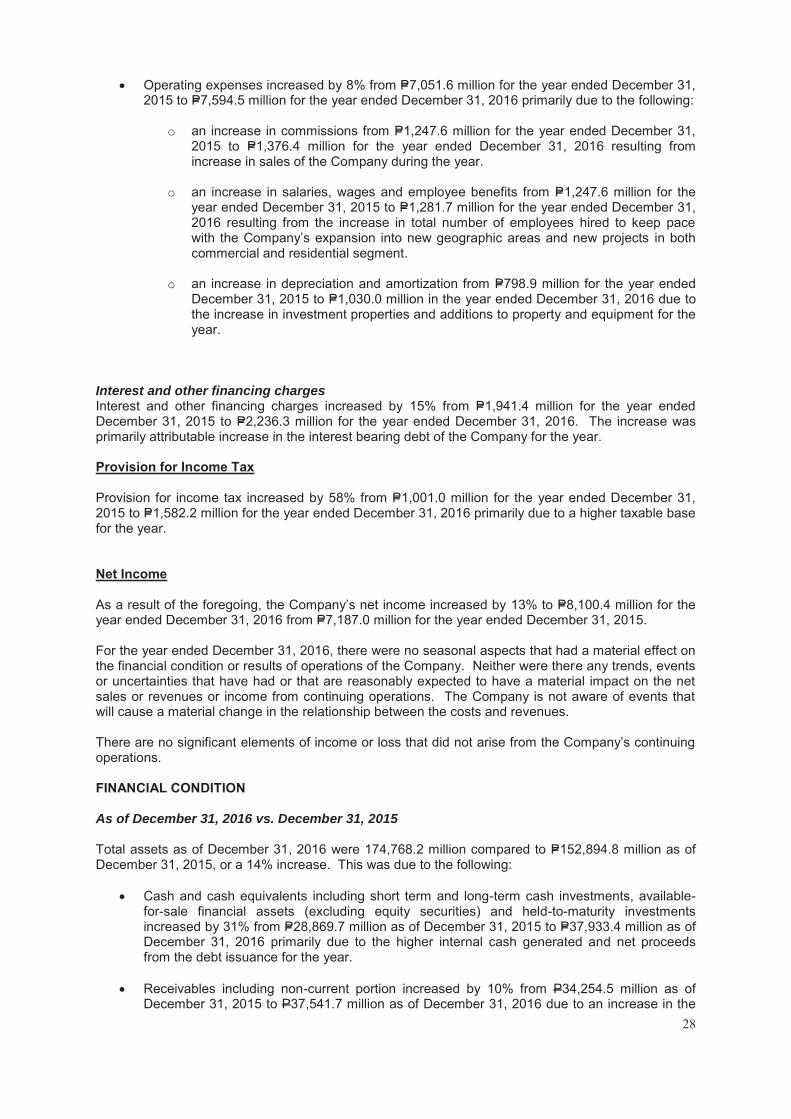
Operating expenses increased by 8% from P=7,051.6 million for the year ended December 31, 2015 to P=7,594.5 million for the year ended December 31, 2016 primarily due to the following:
o an increase in commissions from P=1,247.6 million for the year ended December 31, 2015 to P=1,376.4 million for the year ended December 31, 2016 resulting from increase in sales of the Company during the year.
o an increase in salaries, wages and employee benefits from P=1,247.6 million for the
year ended December 31, 2015 to P=1,281.7 million for the year ended December 31, 2016 resulting from the increase in total number of employees hired to keep pace with the Company’s expansion into new geographic areas and new projects in both commercial and residential segment.
o an increase in depreciation and amortization from P=798.9 million for the year ended
December 31, 2015 to P=1,030.0 million in the year ended December 31, 2016 due to the increase in investment properties and additions to property and equipment for the year.
Interest and other financing charges Interest and other financing charges increased by 15% from P=1,941.4 million for the year ended December 31, 2015 to P=2,236.3 million for the year ended December 31, 2016. The increase was primarily attributable increase in the interest bearing debt of the Company for the year. Provision for Income Tax Provision for income tax increased by 58% from P=1,001.0 million for the year ended December 31, 2015 to P=1,582.2 million for the year ended December 31, 2016 primarily due to a higher taxable base for the year. Net Income As a result of the foregoing, the Company’s net income increased by 13% to P=8,100.4 million for the year ended December 31, 2016 from P=7,187.0 million for the year ended December 31, 2015. For the year ended December 31, 2016, there were no seasonal aspects that had a material effect on the financial condition or results of operations of the Company. Neither were there any trends, events or uncertainties that have had or that are reasonably expected to have a material impact on the net sales or revenues or income from continuing operations. The Company is not aware of events that will cause a material change in the relationship between the costs and revenues. There are no significant elements of income or loss that did not arise from the Company’s continuing operations. FINANCIAL CONDITION As of December 31, 2016 vs. December 31, 2015 Total assets as of December 31, 2016 were 174,768.2 million compared to P=152,894.8 million as of December 31, 2015, or a 14% increase. This was due to the following:
Cash and cash equivalents including short term and long-term cash investments, available-for-sale financial assets (excluding equity securities) and held-to-maturity investments increased by 31% from P=28,869.7 million as of December 31, 2015 to P=37,933.4 million as of December 31, 2016 primarily due to the higher internal cash generated and net proceeds from the debt issuance for the year.
Receivables including non-current portion increased by 10% from P34,254.5 million as of
December 31, 2015 to P37,541.7 million as of December 31, 2016 due to an increase in the

29
installment contracts receivables from the current year sale and increase in other non-trade receivables.
Due from related parties increased by 14% from P3,425.8 million as of December 31, 2015 to P3,916.7 million as of December 31, 2016 due to advances made to the affiliates during the year.
Investment properties increased by 20% from P26,676.3 million as of December 31, 2015 to P32,065.5 million as of December 31, 2016 due primarily to additions to commercial developments of both the Company and its newly acquired subsidiary Starmalls.
Land and improvements increased by 9% from P27,864.7 million as of December 31, 2015 to P30,486.6 as of December 31, 2016 million due primarily to acquisitions of land made during the year.
Investments and advances in project development costs increased by 13% from P=2,854.9
million as of December 31, 2015 to P=3,232.3 million as of December 31, 2016 due primarily to advances land owners for the year.
Other assets including current portion increased by 8% from P4,683.8 million as of December 31, 2015 to P5,064.9 million as of December 31, 2016 due primarily to increase various deposits and input vat.
Total liabilities as of December 31, 2016 were P=98,272.9 million compared to P=82,929.7 million as of December 31, 2015, or a 38% increase. This was due to the following:
Customers’ advances and deposit decreased by 15% to P=2,671.7 million as of December 31, 2016 to P=3,130.5 million as of December 31, 2015 due to slower increase in the reservations sales for the year.
Income tax payable decreased by 15% million from P=158.2 million as of December 31, 2015 to P=134.0 million as of December 31, 2016 due primarily to settlements for the year.
Notes payable including non-current portion increased by 30% from P=30,428.9 million as of December 31, 2015 to P=39,525.1 million as of December 31, 2016 due primarily to the issuance of dollar notes and peso corporate notes for the year.
Bank loans including non-current portion increased by 18% from P=30,539.7 million as of December 31, 2015 to P=36,087.2 million as of December 31, 2016 due to availments made during the period.
Loans payable (representing the sold portion of the Company’s installment contracts receivables with recourse) including non-current portion, increased by 5% from P=3,694.9 million as of December 31, 2015 to P=3,887.3 million as of December 31, 2016 due to sale of receivables for the year.
Pension liabilities decreased by 14% from P114.5 million as of December 31, 2015 to P98.1 million as of December 31, 2016 due to actuarial adjustments for the year.
Deferred tax liabilities – net increased by 31% from P1,247.1 million as of December 31, 2015
to P1,628.5 million as of December 31, 2016 due to adjustments of previously recorded deferred tax liabilities.
Other noncurrent liabilities increased by 13% from P=2,097.4 million as of December 31, 2015 to P=2,378.5 million as of December 31, 2015 due to payment of liabilities for purchase land.
Total stockholder’s equity increased by 9% from P=69,965.1 million as of December 31, 2015 to P=76,495.3 million as of December 31, 2016 due to issuance of common stock, buyback of shares and the net income recorded for the year ended December 31, 2016. Considered as the top five key performance indicators of the Company as shown below:

30
Notes:
(f) Current Ratio: This ratio is obtained by dividing the Current Assets of the Company by its Current liabilities. This ratio is used as a test of the
Company’s liquidity.
(g) Liability-to-equity ratio: This ratio is obtained by dividing the Company’s Total Liabilities by its Total Equity. The ratio reveals the proportion of
liability and equity a company is using to finance its business. It also measures a company’s borrowing capacity.
(h) Interest expense/Income before interest expense: This ratio is obtained by dividing interest expense for the period by its income before interest
expense. This ratio shows whether a company is earning enough profits before interest to pay its interest cost comfortably
(i) Return on assets: This ratio is obtained by dividing the Company’s net income by its total assets. This measures the Company’s earnings in
relation to all of the resources it had at its disposal.
(j) Return on equity: This ratio is obtained by dividing the Company’s net income by its total equity. This measures the rate of return on the
ownership interest of the Company’s stockholders.
Because there are various calculation methods for the performance indicators above, the Company’s presentation of such may not be comparable to
similarly titled measures used by other companies.
Current ratio as of December 31, 2016 decreased from that of December 31, 2015 due primarily to the increase in the current portion of bank loans and loans payable. Liability-to-equity ratio increased due to the increase in the total liabilities brought by the proceeds from banks loans and notes payable. Interest expense as a percentage of income before interest expense decreased in the year ended December 31, 2016 compared to the ratio for the year ended December 31, 2015 due to the lower interest expense for the year. Return on asset remained constant for December 31, 2016 compared to that on December 31, 2015. Return on equity slightly increased due primarily to the higher net income reported for the year ended December 31, 2016.
Material Changes to the Company’s Balance Sheet as of December 31, 2016 compared to December 31, 2015 (increase/decrease of 5% or more)
Cash and cash equivalents including short term and long-term cash investments, available-for-sale financial assets (excluding equity securities) and held-to-maturity investments increased by 31% from P=28,869.7 million as of December 31, 2015 to P=37,933.4 million as of December 31, 2016 primarily due to the higher internal cash generated and net proceeds from the debt issuance for the year.
Receivables including non-current portion increased by 10% from P34,254.5 million as of December 31, 2015 to P37,541.7 million as of December 31, 2016 due to an increase in the installment contracts receivables from the current year sale and increase in other non-trade receivables.
Due from related parties increased by 14% from P3,425.8 million as of December 31, 2015 to P3,916.7 million as of December 31, 2016 due to advances made to the affiliates during the year.
Key Performance Indicators 12/31/2016 12/31/2015 Current ratio (a) 3.28:1 3.42:1 Liability-to-equity ratio (b) 1.28:1 1.19:1 Interest expense/Income before
Interest expense (c) 18.8% 19.2%
Return on assets (d) 4.6% 4.7% Return on equity (e) 10.6% 10.3%

31
Investment properties increased by 20% from P26,676.3 million as of December 31, 2015 to P32,065.5 million as of December 31, 2016 due primarily to additions to commercial developments of both the Company and its newly acquired subsidiary Starmalls.
Land and improvements increased by 9% from P27,864.7 million as of December 31, 2015 to P30,486.6 as of December 31, 2016 million due primarily to acquisitions of land made during the year.
Investments and advances in project development costs increased by 13% from P=2,854.9 million as of December 31, 2015 to P=3,232.3 million as of December 31, 2016 due primarily to advances land owners for the year.
Other assets including current portion increased by 8% from P4,683.8 million as of December 31, 2015 to P5,064.9 million as of December 31, 2016 due primarily to increase various deposits and input vat. Customers’ advances and deposit decreased by 15% to P=2,671.7 million as of December 31, 2016 to P=3,130.5 million as of December 31, 2015 due to slower increase in the reservations sales for the year.
Income tax payable decreased by 15% million from P=158.2 million as of December 31, 2015 to P=134.0 million as of December 31, 2016 due primarily to settlements for the year.
Notes payable including non-current portion increased by 30% from P=30,428.9 million as of December 31, 2015 to P=39,525.1 million as of December 31, 2016 due primarily to the issuance of dollar notes and peso corporate notes for the year.
Bank loans including non-current portion increased by 18% from P=30,539.7 million as of December 31, 2015 to P=36,087.2 million as of December 31, 2016 due to availments made during the period.
Loans payable (representing the sold portion of the Company’s installment contracts receivables with recourse) including non-current portion, increased by 5% from P=3,694.9 million as of December 31, 2015 to P=3,887.3 million as of December 31, 2016 due to sale of receivables for the year.
Pension liabilities decreased by 14% from P114.5 million as of December 31, 2015 to P98.1 million as of December 31, 2016 due to actuarial adjustments for the year.
Deferred tax liabilities – net increased by 31% from P1,247.1 million as of December 31, 2015 to P1,628.5 million as of December 31, 2016 due to adjustments of previously recorded deferred tax liabilities.
Other noncurrent liabilities increased by 13% from P=2,097.4 million as of December 31, 2015 to P=2,378.5 million as of December 31, 2015 due to payment of liabilities for purchase land. Total stockholder’s equity increased by 9% from P=69,965.1 million as of December 31, 2015 to P=76,495.3 million as of December 31, 2016 due to issuance of common stock, buyback of shares and the net income recorded for the year ended December 31, 2016.
Material Changes to the Company’s Statement of income for the year ended December 31, 2016 compared to the year ended December 31, 2015 (increase/decrease of 5% or more)
Revenue from real estate sales amounting to P=25,025.2 million for the year ended December 31, 2016 an increase of 2% from P=24,502.2 million in same period last year primarily attributable to the increase in the overall completion rate of sold inventories of its business units particularly of Camella and Communities Philippines. Rental income increased by 85% from P=2,367.9 million for the year ended December 31, 2015 to P=4,375.3 million for the year ended December 31, 2016 primarily attributable the additional gross

32
floor area leased out of our investment properties as well as increase in rental rates of our existing malls. Interest income from installment contract receivable decreased by 10% from P=710.3 million for the year ended December 31, 2015 to P=642.6 million for the year ended December 31, 2016 primarily attributable decrease in the interest collected from buyers opting to get in-house financing as more of our buyers are getting bank mortgages to finance their purchase. Miscellaneous income decreased by 25% from P=1,268.6 million for the year ended December 31, 2015 to P=952.5 million for the year ended December 31, 2016 primarily attributable the forfeited reservation fees and partial payments from customers whose sales contracts are cancelled before completion of required down payment as well as increase in other operating income and parking fees from our malls. Interest income from investments increased by 46% from P=593.0 million for the year ended December 31, 2015 to P=864.4 million for the year ended December 31, 2016 primarily attributable to the increase in the amount invested by the Company to various debt instruments. The Company’s investments increased during the year due to the proceeds from various fund raising activities for the year.
Operating expenses increased by 8% from P=7,051.6 million for the year ended December 31, 2015 to P=7,594.5 million for the year ended December 31, 2016 primarily due to the increase in commissions resulting from increase in sales for the year, increase in salaries, wages and increase in depreciation and amortization due to the increase in investment properties and additions to property and equipment for the year.
Interest and other financing charges increased by 15% from P=1,941.4 million for the year ended December 31, 2015 to P=2,236.3 million for the year ended December 31, 2016 primarily attributable increase in the interest bearing debt of the Company for the year. Provision for income tax increased by 58% from P=1,001.0 million for the year ended December 31, 2015 to P=1,582.2 million for the year ended December 31, 2016 primarily due to a higher taxable base for the year.
The Company’s net income increased by 13% to P=8,100.4 million for the year ended December 31, 2016 from P=7,187.0 million for the year ended December 31, 2015.
There are no other material changes in the Company’s financial position (changes of 5% or more) and condition that will warrant a more detailed discussion. Further, there are no material events and uncertainties known to management that would impact or change reported financial information and condition on the Company. REVIEW OF YEAR END 2015 VS YEAR END 2014 RESULTS OF OPERATIONS Revenues Real Estate The Company recorded revenue from real estate sales amounting to P=24,502.2 million for the year ended December 31, 2015 an increase of 10% from P=22,320.7 million in same period last year. This was primarily attributable to the increase in the overall completion rate of sold inventories of its business units particularly of Communities Philippines, Vista Residences and Crown Asia. The Company uses the Percentage of completion method of revenue recognition where revenue is recognized in reference to the stages of development of the properties.
Real estate revenue from Vista Residences increased by 57% to P=3,264.1 million for the year ended December 31, 2015 from P=2,073.3 million for the year ended December 31, 2014. This increase was principally attributable to the increase in the number of sold condominium units

33
completed or under construction during the year. Vista Residences is the business unit of Vista Land that develops and sells vertical projects across the Philippines.
Real estate revenue of Camella Homes increased to P=6,807.5 million for the year ended
December 31, 2015 from P=6,257.4 million for the year ended December 31, 2014. This increase was principally attributable to the increase in the number of sold homes completed or under construction in the Mega Manila area in the low-cost and affordable housing segment during the year.
Real estate revenue of Communities Philippines increased by 17% to P=12,134.7 million for
the year ended December 31, 2015 from P=10,373.3 million for the year ended December 31, 2014. This increase was principally attributable to the increase in the number of sold homes completed or under construction outside the Mega Manila area in the low-cost and affordable housing segment during the year.
Real estate revenue of Crown Asia decreased to P=1,314.0 million for the year ended
December 31, 2015 from P=2,327.9 million for the year ended December 31, 2014. This decrease was principally attributable to the decline in the number of sold homes completed or under construction in the Mega Manila area in the middle-income housing segment during the year.
Real estate revenue of Brittany decreased by 18% to P=981.9 million for the year ended
December 31, 2015 from P=1,203.4 million in the same period last year. This decrease was principally attributable to the decrease in the number of sold homes completed or under construction in the Mega Manila area in the high-end housing segment, which was a reflection of the Company’s focus on meeting the increased demand for housing in the low-cost and affordable as well as in the middle-income housing segments serviced by its other business units.
Rental income Rental income increased by 51% from P=1,567.8 million for the year ended December 31, 2014 to P=2,367.9 million for the year ended December 31, 2015. The increase was primarily attributable the additional gross floor area of our investment properties as well as increase in rental rates of our existing malls. Interest income from installment contract receivable Interest income from installment contract receivable decreased by 7% from P=760.6 million for the year ended December 31, 2014 to P=710.3 million for the year ended December 31, 2015. The decrease was primarily attributable decrease in the interest collected from buyers opting to get in-house financing as more of our buyers are getting bank mortgages to finance their purchase. Miscellaneous Income Miscellaneous income increased by 28% from P=990.3 million for the year ended December 31, 2014 to P=1,268.6 million for the year ended December 31, 2015. The increase was primarily attributable the forfeited reservation fees and partial payments from customers whose sales contracts are cancelled before completion of required down payment as well as increase in other operating income and parking fees from our malls. Interest income from investments Interest income from investments increased by 35% from P=439.0 million for the year ended December 31, 2014 to P=593.0 million for the year ended December 31, 2015. The increase was primarily attributable to the increase in the amount invested by the Company to various debt instruments. The Company’s investments increased during the year due to the proceeds from various fund raising activities. Other income (expenses) Other expense of P=29.3 million for the year ended December 31, 2014 decreased by 76% to P=7.0 million for the year ended December 31, 2015. The decrease in the other expense was primarily attributable decrease in the foreign exchange losses recorded for the year.

34
Costs and Expenses Cost and expenses increased by 10% to P=19,305.5 million for the year ended December 31, 2015 from P=17,618.2 million for the year ended December 31, 2014.
Cost of real estate sales increased by 11% from P=11,032.3 million for the year ended December 31, 2014 to P=12,253.9 million for the year ended December 31, 2015 primarily due to the increase in the overall recorded sales of Vista Land’s business units.
Operating expenses increased by 7% from P=6,586.0 million for the year ended December 31,
2014 to P=7,051.6 million for the year ended December 31, 2015 primarily due to the following:
o an increase in commissions from P=1,207.3 million for the year ended December 31, 2014 to P=1,247.6 million for the year ended December 31, 2015 resulting from increase in sales of the Company during the year.
o an increase in salaries, wages and employee benefits from P=973.6 million for the year
ended December 31, 2014 to P=1,247.6 million for the year ended December 31, 2015 resulting from the increase in total number of employees hired to keep pace with the Company’s expansion into new geographic areas and new projects.
o an increase in depreciation and amortization from P=722.1 million for the year ended
December 31, 2014 to P=798.9 million in the year ended December 31, 2015 due to the increase in investment properties and additions to property and equipment for the year.
Interest and other financing charges Interest and other financing charges increased by 38% from P=1,403.0 million for the year ended December 31, 2014 to P=1,941.4 million for the year ended December 31, 2015. The increase was primarily attributable increase in the interest bearing debt of the Company for the year. Provision for Income Tax Provision for income tax increased by 35% from P=741.4 million for the year ended December 31, 2014 to P=1,001.0 million for the year ended December 31, 2015 primarily due to a higher taxable base for the year. Net Income As a result of the foregoing, the Company’s net income increased by 14% to P=7,187.0 million for the year ended December 31, 2015 from P=6,286.4 million for the year ended December 31, 2014. For the year ended December 31, 2015, there were no seasonal aspects that had a material effect on the financial condition or results of operations of the Company. Neither were there any trends, events or uncertainties that have had or that are reasonably expected to have a material impact on the net sales or revenues or income from continuing operations. The Company is not aware of events that will cause a material change in the relationship between the costs and revenues. There are no significant elements of income or loss that did not arise from the Company’s continuing operations. FINANCIAL CONDITION As of December 31, 2015 vs. December 31, 2014 Total assets as of December 31, 2015 were P=152,894.8 million compared to P=124,987.5 million as of December 31, 2014, or a 22% increase. This was due to the following:
Cash and cash equivalents including short term and long-term cash investments, available-for-sale financial assets (excluding equity securities) and held-to-maturity investments increased by 4% from P=27,687.9 million as of December 31, 2014 to P=28,869.7 million as of

35
December 31, 2015 primarily due to the net proceeds from the issuance of dollar notes for the year.
Receivables including non-current portion increased by 22% from P27,985.8 million as of December 31, 2014 to P34,254.5 million as of December 31, 2015 due to an increase in the installment contracts receivables from the current year sale and increase in other non-trade receivables.
Due from related parties decreased by 7% from P3,679.0 million as of December 31, 2014 to P3,425.8 million as of December 31, 2015 due to settlements made by the affiliates during the year.
Real estate inventories increased by 28% from P17,926.0 million as of December 31, 2014 to P22,855.7 million as of December 31, 2015 due to the launching and opening of new projects during the year.
Investment properties increased by 64% from P16,312.0 million as of December 31, 2014 to
P26,676.3 million as of December 31, 2015 due primarily to additions to commercial developments of both the Company and its newly acquired subsidiary Starmalls.
Land and improvements increased by 10% from P25,262.2 million as of December 31, 2014 to P27,864.7 as of December 31, 2015 million due primarily to acquisitions of land made during the year.
Property and equipment increased by 68% from P476.1 million as of December 31, 2014 to
P801.0 million as of December 31, 2015 due to acquisitions made during the year.
Investments and advances in project development costs increased by 80% from P=1,583.8 million as of December 31, 2014 to P=2,854.9 million as of December 31, 2015 due primarily to advances land owners for the year.
Other assets including current portion increased by 36% from P3,432.5 million as of December 31, 2014 to P4,683.8 million as of December 31, 2015 due primarily to increase various deposits, goodwill and input vat.
Total liabilities as of December 31, 2015 were P=82,929.7 million compared to P=60,730.3 million as of December 31, 2014, or a 37% increase. This was due to the following:
Accounts and other payables increased by 48% to P=11,208.2 million as of December 31, 2015 to P=7,558.5 million as of December 31, 2014 due to increase in trade payables and accruals made during the year.
Income tax payable increased by 69% million from P=93.4 million as of December 31, 2014 to P=158.2 million as of December 31, 2015 due primarily to higher tax for the year.
Bank loans including non-current portion increased by 120% from P=13,873.6 million as of December 31, 2014 to P=30,539.7 million as of December 31, 2015 due to availments made during the period.
Loans payable (representing the sold portion of the Company’s installment contracts receivables with recourse) including non-current portion, increased by 37% from P=2,692.8 million as of December 31, 2014 to P=3,694.9 million as of December 31, 2015 due to sale of receivables for the year.
Notes payable including non-current portion increased by 6% from P=28,742.7 million as of December 31, 2014 to P=30,428.9 million as of December 31, 2015 due primarily to the issuance of dollar notes for the year. The company also undertook a liability management exercise to extend the maturity of the Company’s existing dollar notes in addition the Company fully paid its first dollar notes issued in 2010.

36
Deferred tax liabilities – net decreased by 8% from P1,358.4 million as of December 31, 2014 to P1,247.1 million as of December 31, 2015 due to adjustments of previously recorded deferred tax liabilities.
Other noncurrent liabilities decreased by 15% from P=2,460.5 million as of December 31, 2014 to P=2,097.4 million as of December 31, 2015 due to payment of liabilities for purchase land.
Total stockholder’s equity increased by 9% from P=64,257.2 million as of December 31, 2014 to P=69,965.1 million as of December 31, 2015 due to issuance of common stock and the net income recorded for the year ended December 31, 2014. Considered as the top five key performance indicators of the Company as shown below:
Notes:
(a) Current Ratio: This ratio is obtained by dividing the Current Assets of the Company by its Current liabilities. This ratio is used as a test of the
Company’s liquidity.
(b) Liability-to-equity ratio: This ratio is obtained by dividing the Company’s Total Liabilities by its Total Equity. The ratio reveals the proportion of
liability and equity a company is using to finance its business. It also measures a company’s borrowing capacity.
(c) Interest expense/Income before interest expense: This ratio is obtained by dividing interest expense for the period by its income before interest
expense. This ratio shows whether a company is earning enough profits before interest to pay its interest cost comfortably
(d) Return on assets: This ratio is obtained by dividing the Company’s net income by its total assets. This measures the Company’s earnings in
relation to all of the resources it had at its disposal.
(e) Return on equity: This ratio is obtained by dividing the Company’s net income by its total equity. This measures the rate of return on the
ownership interest of the Company’s stockholders.
Because there are various calculation methods for the performance indicators above, the Company’s presentation of such may not be comparable to
similarly titled measures used by other companies.
Current ratio as of December 31, 2015 increased from that of December 31, 2014 due primarily to the increase in the current portion of receivables and real estate inventories. Debt-to-equity ratio increased due to the increase in the total liabilities brought by the issuance of dollar notes. Interest expense as a percentage of income before interest expense increased in the year ended December 31, 2015 compared to the ratio for the year ended December 31, 2014 due to the higher earnings for the year. Return on asset decreased for December 31, 2015 compared to that on December 31, 2014 due primarily to the increase in total assets resulting primarily to the newly acquired subsidiary. Return on equity increased due primarily to the higher net income reported for the year ended December 31, 2015.
Key Performance Indicators 12/31/2015 12/31/2014 Current ratio (a) 3.42:1 2.94:1 Liability-to-equity ratio (b) 1.19:1 0.95:1 Interest expense/Income before Interest expense (c)
19.2% 16.6%
Return on assets (d) 4.7% 5.0% Return on equity (e) 10.3% 9.8%

37
Material Changes to the Company’s Balance Sheet as of December 31, 2015 compared to December 31, 2014 (increase/decrease of 5% or more)
Receivables including non-current portion increased by 22% from P27,985.8 million as of December 31, 2014 to P34,254.5 million as of December 31, 2015 due to an increase in the installment contracts receivables from the current year sale and increase in other non-trade receivables.
Due from related parties decreased by 7% from P3,679.0 million as of December 31, 2014 to P3,425.8 million as of December 31, 2015 due to settlements made by the affiliates during the year.
Real estate inventories increased by 28% from P17,926.0 million as of December 31, 2014 to P22,855.7 million as of December 31, 2015 due to the launching and opening of new projects during the year.
Investment properties increased by 64% from P16,312.0 million as of December 31, 2014 to P26,676.3 million as of December 31, 2015 due primarily to additions to commercial developments of both the Company and its newly acquired subsidiary Starmalls.
Land and improvements increased by 10% from P25,262.2 million as of December 31, 2014 to P27,864.7 as of December 31, 2015 million due primarily to acquisitions of land made during the year.
Property and equipment increased by 68% from P476.1 million as of December 31, 2014 to P801.0 million as of December 31, 2015 due to acquisitions made during the year.
Investments and advances in project development costs increased by 80% from P=1,583.8 million as of December 31, 2014 to P=2,854.9 million as of December 31, 2015 due primarily to advances land owners for the year.
Other assets including current portion increased by 36% from P3,432.5 million as of December 31, 2014 to P4,683.8 million as of December 31, 2015 due primarily to increase various deposits, goodwill and input vat. Accounts and other payables increased by 48% to P=11,208.2 million as of December 31, 2015 to P=7,558.5 million as of December 31, 2014 due to increase in trade payables and accruals made during the year.
Income tax payable increased by 69% million from P=93.4 million as of December 31, 2014 to P=158.2 million as of December 31, 2015 due primarily to higher tax for the year.
Bank loans including non-current portion increased by 120% from P=13,873.6 million as of December 31, 2014 to P=30,539.7 million as of December 31, 2015 due to availments made during the period.
Loans payable (representing the sold portion of the Company’s installment contracts receivables with recourse) including non-current portion, increased by 37% from P=2,692.8 million as of December 31, 2014 to P=3,694.9 million as of December 31, 2015 due to sale of receivables for the year.
Notes payable including non-current portion increased by 6% from P=28,742.7 million as of December 31, 2014 to P=30,428.9 million as of December 31, 2015 due primarily to the issuance of dollar notes for the year. The company also undertook a liability management exercise to extend the maturity of the Company’s existing dollar notes in addition the Company fully paid its first dollar notes issued in 2010.
Deferred tax liabilities – net decreased by 8% from P1,358.4 million as of December 31, 2014 to P1,247.1 million as of December 31, 2015 due to adjustments of previously recorded deferred tax liabilities.

38
Other noncurrent liabilities decreased by 15% from P=2,460.5 million as of December 31, 2014 to P=2,097.4 million as of December 31, 2015 due to payment of liabilities for purchase land. Total stockholder’s equity increased by 9% from P=64,257.2 million as of December 31, 2014 to P=69,965.1 million as of December 31, 2015 due to issuance of common stock and the net income recorded for the year ended December 31, 2014.
Material Changes to the Company’s Statement of income for the year ended December 31, 2015 compared to the year ended December 31, 2014 (increase/decrease of 5% or more)
Revenue from real estate sales amounting to P=24,502.2 million for the year ended December 31, 2015 an increase of 10% from P=22,320.7 million in same period last year. Rental income increased by 47% from P=1,527.0 million for the year ended December 31, 2014 to P=2,246.1 million for the year ended December 31, 2015 primarily due to the additional gross floor area of our investment properties as well as increase in rental rates of our existing malls. Interest income from installment contract receivable decreased by 7% from P=760.6 million for the year ended December 31, 2014 to P=710.3 million for the year ended December 31, 2015 primarily due to the decrease in the interest collected from buyers opting to get in-house financing as more of our buyers are getting bank mortgages to finance their purchase. Miscellaneous income increased by 37% from P=900.0 million for the year ended December 31, 2014 to P=1,231.0 million for the year ended December 31, 2015 primarily due to the forfeited reservation fees and partial payments from customers whose sales contracts are cancelled before completion of required down payment as well as increase in other operating income and parking fees from our malls.
Interest income from investments increased by 35% from P=439.0 million for the year ended December 31, 2014 to P=593.0 million for the year ended December 31, 2015 primarily due to the increase in the amount invested by the Company to various debt instruments. The Company’s investments increased during the year due to the proceeds from various fund raising activities.
Other expense of P=29.3 million for the year ended December 31, 2014 decreased by 76% to P=7.0 million for the year ended December 31, 2015 due primarily to the decrease in the foreign exchange losses recorded for the year.
Cost of real estate sales increased by 11% from P=11,032.3 million for the year ended December 31, 2014 to P=12,253.9 million for the year ended December 31, 2015 primarily due to the increase in the overall recorded sales of Vista Land’s business units.
Operating expenses increased by 7% from P=6,454.9 million for the year ended December 31, 2014 to P=6,892.2 million for the year ended December 31, 2015 primarily due to the increase in commissions resulting from increase in sales for the year, increase in salaries, wages and employees benefits resulting from the increase in total number of employees hired for the year and increase in depreciation and amortization due to the increase in investment properties and additions to property and equipment for the year. Interest and other financing charges increased by 38% from P=1,403.0 million for the year ended December 31, 2014 to P=1,941.4 million for the year ended December 31, 2015 primarily due to the increase in the interest bearing debt of the Company for the year.
Provision for income tax increased by 35% from P=741.4 million for the year ended December 31, 2014 to P=1,001.0 million for the year ended December 31, 2015 primarily due to a higher taxable base for the year. The Company’s net income increased by 14 % to P=7,187.0 million for the year ended December 31, 2015 from P=6,286.4 million for the year ended December 31, 2014. There are no other material changes in the Company’s financial position (changes of 5% or more) and condition that will warrant a more detailed discussion. Further, there are no material events

39
and uncertainties known to management that would impact or change reported financial information and condition on the Company.
IV. NATURE AND SCOPE OF BUSINESS Vista Land & Lifescapes, Inc. (Vista Land) is one of the leading integrated property developers in the Philippines and the largest homebuilder in the country overall. The Company believes that it is one of the few leading integrated property developers in the Philippines that are focused on the mass market. The Company operates its residential property development business and commercial property development business through six distinct business units. Brittany, Crown Asia, Camella Homes, Communities Philippines and Vista Residences are focused on residential property development while Starmalls is involved in commercial property development. Briefly, these business units may be distinguished as follows:
Brittany. Brittany caters to the high-end market segment in Mega Manila, offering luxury houses in master-planned communities, priced at ₱12.0 million and above;
Crown Asia. Crown Asia caters to the upper mid-cost housing segment in Mega Manila, primarily offering houses priced between ₱4.0 million and ₱12.0 million;
Camella Homes. For 40 years, Camella Homes has serviced the low-cost and affordable housingsegment (houses priced below ₱4.0 million) in the Mega Manila area. Camella Homes markets its houses primarily under the “Camella” brand. According to the PSRC “SALIGAN” Study, Camella was acknowledged as the most preferred brand overall in the Philippine housing market, with a brand awareness rate and brand preference rate of 99% and 56%, respectively;
Communities Philippines. Communities Philippines and its subsidiaries offer residential properties outside the Mega Manila area under the “Camella” and “Crown Asia” brands. The Company believes that Communities Philippines and its subsidiaries have the widest coverage of developments in the regions outside Mega Manila of any homebuilder in the Philippines and utilizes Camella Homes’ and Crown Asia’s expertise and designs to offer houses in areas outside of the Mega Manila area that it believes are at par, in terms of quality, with the developments in the Mega Manila area;
Vista Residences, Inc. Vista Residences offers vertical residential projects in the Mega Manila area in the low to upper mid-cost segments. Vertical home projects generally involve longer project development periods as well as some facilities, amenities and other specifications not often found in horizontal homes; and
Starmalls, Inc. Starmalls is a major developer, owner and operator of retail malls that target mass market retail consumers in the Philippines and also develops and operates BPO commercial centers.
The Company has no sale or revenues and net income contributed by foreign sales for 2017, 2016, and 2015. V. MARKET FOR REGISTRANT’S COMMON EQUITY AND RELATED STOCKHOLDERS
MATTERS Market Information The Company’s common shares are listed with the Philippine Stock Exchange. The Company was listed on June 25, 2007.

40
2018 2017 2016 2015 Quarter High Low Close High Low Close High Low Close High Low Close
1st 6.99 5.85 6.50 5.10 4.65 5.08 5.00 3.65 4.66 8.59 6.80 8.59 2nd 6.10 5.08 5.81 5.48 4.55 5.34 8.42 6.30 6.35 3rd 6.40 5.60 6.36 6.45 5.12 5.39 7.30 5.03 5.03 4th 6.40 5.55 5.99 5.39 4.82 4.95 5.83 5.03 5.18
The market capitalization of VLL as of December 31, 2017 based on the closing price of P5.99/share on December 29, 2017, the last trading date for the fourth quarter of 2015, was approximately P76.8 billion. As of April 24, 2018, VLL’s market capitalization stood at P84.8 billion based on the P6.61/share closing price. Common There are approximately 959 holders of common equity security of the Company as of March 31, 2018 (based on the number of accounts registered with the Stock Transfer Agent). The following are the top 20 holders of the common securities of the Company: Name No. of Shares Percentage1
1 FINE PROPERTIES, INC.2 6,650,638,065 51.85% 2 PCD NOMINEE CORPORATION ( FOREIGN ) 2,421,743,805 18.88% 3 PCD NOMINEE CORPORATION (FILIPINO) 1,503,550,575 11.72% 4 ALTHORP HOLDINGS, INC3 1,235,292,469 9.63% 5 MANUELA CORPORATION 4 752,208,215 5.86% 6 MANUEL B. VILLAR, JR. 4 293,969,986 2.29% 7 MANUEL PAOLO A. VILLAR 5 222,796,324 1.74% 8 BESTIMES INVESTMENT LIMITED 26,814,493 0.21% 9 JOHN T. LAO 2,853,000 0.02%
10 SULFICIO TAGUD JR. &/OR ESTER TAGUD 401,000 0.00% 11 TOMAS L. CHUA 400,000 0.00% 12 FEDERAL HOMES, INC. 324,850 0.00% 13 ACRIS CORPORATION 300,000 0.00% 14 CHRISTIAN A. AGUILAR 290,617 0.00% 15 BENJAMARIE THERESE N. SERRANO 200,000 0.00% 16 MARIBETH TOLENTINO 200,000 0.00% 17 CHERYL JOYCE YOUNG 200,000 0.00% 18 LUCIO W. YAN &/OR CLARA Y. YAN 150,000 0.00% 19 FRANCISCO A. UY 120,000 0.00% 20 MAXIMO S. UY &/OR LIM HUE HUA 120,000 0.00%
TOTAL 13,112,573,399 102.23% OTHER STOCKHOLDERS 1,562,977 0.01% TREASURY SHARES – AS OF DECEMBER 31, 2017 (287,210,300) -2.24% TOTAL OUTSTANDING, ISSUED AND SUBSCRIBED 12,826,926,076 100.00% 1 based on the total outstanding, issued and subscribed shares of 12,826,926,076 as of March 31, 2018 2 Includes 3,188,590,904 lodged under PCD Nominee Corp. (Filipino) 3Includes 10,983,363 shares owned by ML&H Corporation which have been merged with Althorp Holdings, Inc. and
1,224,309,106 lodged under PCD Nominee Corp. (Filipino) 4Lodged under PCD Nominee Corp. (Filipino) 5Includes 222,596,324 lodged under PCD Nominee Corp. (Filipino)

41
Preferred
Stockholder’s Name No. of Preferred Shares
Percentage (of Preferred
Shares) 1 FINE PROPERTIES, INC. 3,300,000,000 100.000%
Total outstanding, issued and subscribed 3,300,000,000 100.000% Dividends
P0.1342 per share Regular Cash Dividend Declaration Date: September 29, 2017 Record date: October 16, 2017 Payment date: December 31, 2017
P0.1185 per share Regular Cash Dividend Declaration Date: September 28, 2016 Record date: October 13, 2016 Payment date: October 28, 2016
P0.1357 per share Regular Cash Dividend Declaration Date: September 15, 2015 Record date: September 30, 2015 Payment date: October 15, 2015 P0.11858 per share Regular Cash Dividend Declaration Date: September 15, 2014 Record date: September 30, 2014 Payment date: October 24, 2014 P0.102 per share Regular Cash Dividend Declaration Date: September 11, 2013 Record date: September 26, 2013 Payment date: October 22, 2013
P0.0839 per share Regular Cash Dividend Declaration Date: September 17, 2012 Record date: October 02, 2012 Payment date: October 26, 2012
P0.04 per share Special Cash Dividend Declaration Date: June 15, 2012 Record date: July 02, 2012 Payment date: July 26, 2012
P0.07 per share Regular Cash Dividend Declaration Date: September 13, 2011 Record date: September 28, 2011 Payment date: October 24, 2011 P0.035 per share Special Cash Dividend Declaration Date: May 17, 2011 Record date: June 01, 2011 Payment date: June 28, 2011
42
Dividend Policy The Company's Board is authorized to declare dividends. A cash dividend declaration does not require any further approval from the Company's shareholders. A stock dividend declaration requires the further approval of shareholders representing not less than two-thirds of the Company's outstanding capital stock. Dividends may be declared only from unrestricted retained earnings. In relation to foreign shareholders, dividends payable may not be remitted using foreign exchange sourced from the Philippine banking system unless the investment was first registered with the Banko Sentral ng Pilipinas. The Company is allowed under Philippine laws to declare property and stock dividends, subject to certain requirements. Record Date
Pursuant to existing Philippine SEC rules, cash dividends declared by a company must have a record date not less than 10 nor more than 30 days from the date the cash dividends are declared. With respect to stock dividends, the record date is to be not less than 10 or more than 30 days from the date of shareholder approval, provided however, that the set record date is not to be less than 10 trading days from receipt by the PSE of the notice of declaration of stock dividend. In the event that a stock dividend is declared in connection with an increase in authorized capital stock, the corresponding record date is to be fixed by the Philippine SEC.
Dividends
The Company declares dividends to shareholders of record, which are paid from the Company's unrestricted retained earnings.
The Company intends to maintain an annual cash dividend payment ratio for its Shares of approximately 20% of its consolidated net income from the preceding fiscal year, subject to the requirements of the applicable laws and regulations and the absence of circumstances which may restrict the payment of such dividends. Circumstances which could restrict the payment of cash dividends include, but are not limited to, when the Company undertakes major projects and developments requiring substantial cash expenditures or when it is restricted from paying cash dividends by its loan covenants. The Company's Board, may, at any time, modify such dividend payout ratio depending upon the results of operations and future projects and plans of the Company. Recent Sale of Unregistered Securities On December 28, 2016, the Company entered into a Corporate Notes Facility Agreement with certain financial institutions and China Bank Capital Corporation as Mandated Lead Arranger and Bookrunner, for the issuance by the Company of long-term corporate notes with a principal amount of up to Php8,000.0 million (the “Corporate Notes”). The proceeds from the issuance of the Corporate Notes will be utilized for the purpose of pre-funding the 2017 capital expenditures, refinancing of existing indebtedness and to fund other general corporate expenses. On 29 December 2016, the Company made an initial drawdown in the amount of Php5,150,000,000.00. The interest at 6.19% per annum is payable quarterly in arrears while the principal amount is payable in 2% annual amortizations on each principal repayment date with the balance to be repaid on maturity date. The Corporate Notes are guaranteed by the Company’s subsidiaries. On May 3, 2017, the Company issued additional corporate notes in the amount of Php4,850.0 million due 2026, at a fixed interest of 6.2255% per annum. The proceeds of the Additional Notes will be used to fund VLL’s 2017 capital expenditures and refinance its existing indebtedness, and for other general corporate purposes. Pursuant to the terms and conditions relating to the acquisition by the Company of 88.3% ownership in STR (the “STR Acquisition”), the Company issued a total of 4,575,395,762 common shares to Fine Properties, Inc., Althorp Holdings, Inc., Manuela Corporation, Mr. Manuel B. Villar, Jr. and Mr. Manuel Paolo A. Villar in November 2015 and February 2016, respectively. The issuance of such shares is an exempt transaction under Section 10.1(k) of the SRC. On 23 February 2016, Fine Properties. Inc. sold

43
a total of 2,119,227 listed common shares of VLL to certain minority shareholders of Starmalls which availed of the reinvestment option, as part of the terms and conditions of the tender offer conducted by the Company in relation to the STR Acquisition. The foregoing sale of shares by Fine is exempt from registration requirements pursuant to Section 10.2 of the SRC, as confirmed by the SEC in a letter dated 16 December 2015. Stock Options None VI. COMPLIANCE WITH LEADING PRACTICE ON CORPORATE GOVERNANCE
On May 31, 2017, the Company’s Board has adopted its Revised Manual on Corporate Governance. The Company’s Manual on Corporate Governance describes the terms and conditions by which the Company intends to conduct sound corporate governance practices that are consistent with the relevant laws and regulations of the Republic of the Philippines, and which seek to enhance business transparency and build shareholder value.
Ultimate responsibility and oversight of the Company’s adherence to superior corporate governance practices rests with the Board of Directors. As a policy matter, the Board will hold monthly meetings, at which any number of relevant corporate governance issues may be raised for discussion.
Practical oversight of the Company’s corporate governance standards is exercised through the Board’s three standing committees:
The Audit Committee is charged with internal audit oversight over all of the Company’s business transactions and the effective management of risk.
The Nomination Committee is charged with ensuring that potential candidates for the Board are fully qualified as well as ensuring that the Board maintains adequate independent membership.
The Compensation and Remuneration Committee is charged with ensuring that fair and competitive compensation policies are maintained.
The Company is committed to building a solid reputation for sound corporate governance practices, including a clear understanding by its Directors of the Company’s strategic objectives, structures to ensure that such objectives are realized, systems to ensure the effective management of risks and the systems to ensure the Company’s obligations are identified and discharged in all aspects of its business. Each January, the Company will issue a certification to the Philippines Securities and Exchange Commission and the Philippine Stock Exchange that it has fulfilled its corporate governance obligations.
As of the date of this report, there are no known material deviations from the Company’s Revised Manual of Corporate Governance. The Company is taking further steps to enhance adherence to principles and practices of good corporate governance.


*SGVFS028606*
C O V E R S H E E Tfor
AUDITED FINANCIAL STATEMENTS
SEC Registration Number
C S 2 0 0 7 0 3 1 4 5
C O M P A N Y N A M E
V I S T A L A N D & L I F E S C A P E S , I N C .
A N D S U B S I D I A R I E S
PRINCIPAL OFFICE ( No. / Street / Barangay / City / Town / Province )
L O W E R G R O U N D F L O O R , B U I L D I N G B
, E V I A L I F E S T Y L E C E N T E R , V I S T A
C I T Y , D A A N G H A R I , A L M A N Z A I I ,
L A S P I Ñ A S C I T Y
Form Type Department requiring the report Secondary License Type, If Applicable
A A C F S S E C N A
C O M P A N Y I N F O R M A T I O N
Company’s Email Address Company’s Telephone Number Mobile Number
[email protected] 226 3552 N/A
No. of Stockholders Annual Meeting (Month / Day) Fiscal Year (Month / Day)
960 6/15 12/31
CONTACT PERSON INFORMATION
The designated contact person MUST be an Officer of the Corporation
Name of Contact Person Email Address Telephone Number/s Mobile Number
Cynthia J. Javarez [email protected]
226-3552 loc.0098
0917-857-7447
CONTACT PERSON’s ADDRESS
Lower Ground Floor, Building B, EVIA Lifestyle Center, Vista City,Daanghari, Almanza II, Las Piñas City
NOTE 1 : In case of death, resignation or cessation of office of the officer designated as contact person, such incident shall be reported to the Commission withinthirty (30) calendar days from the occurrence thereof with information and complete contact details of the new contact person designated.
2 : All Boxes must be properly and completely filled-up. Failure to do so shall cause the delay in updating the corporation’s records with the Commissionand/or non-receipt of Notice of Deficiencies. Further, non-receipt of Notice of Deficiencies shall not excuse the corporation from liability for its deficiencies.
*SGVFS028606*
INDEPENDENT AUDITOR’S REPORT
The Stockholders and the Board of DirectorsVista Land & Lifescapes, Inc. and SubsidiariesLower Ground Floor, Building BEVIA Lifestyle Center, Vista CityDaanghari, Almanza II, Las Piñas City
Opinion
We have audited the consolidated financial statements of Vista Land and Lifescapes, Inc. and itssubsidiaries (the Group), which comprise the consolidated statements of financial position as atDecember 31, 2017 and 2016, and the consolidated statements of comprehensive income, consolidatedstatements of changes in equity and consolidated statements of cash flows for each of the three years inthe period ended December 31, 2017, and notes to the consolidated financial statements, including asummary of significant accounting policies.
In our opinion, the accompanying consolidated financial statements present fairly, in all material respects,the consolidated financial position of the Group as at December 31, 2017 and 2016, and its consolidatedfinancial performance and its consolidated cash flows for each of the three years in the period endedDecember 31, 2017 in accordance with Philippine Financial Reporting Standards (PFRSs).
Basis for Opinion
We conducted our audits in accordance with Philippine Standards on Auditing (PSAs). Ourresponsibilities under those standards are further described in the Auditor’s Responsibilities for the Auditof the Consolidated Financial Statements section of our report. We are independent of the Group inaccordance with the Code of Ethics for Professional Accountants in the Philippines (Code of Ethics)together with the ethical requirements that are relevant to our audit of the consolidated financialstatements in the Philippines, and we have fulfilled our other ethical responsibilities in accordance withthese requirements and the Code of Ethics. We believe that the audit evidence we have obtained issufficient and appropriate to provide a basis for our opinion.
Key Audit Matters
Key audit matters are those matters that, in our professional judgment, were of most significance in ouraudit of the consolidated financial statements of the current period. These matters were addressed in thecontext of our audit of the consolidated financial statements as a whole, and in forming our opinionthereon, and we do not provide a separate opinion on these matters. For each matter below, ourdescription of how our audit addressed the matter is provided in that context.
We have fulfilled the responsibilities described in the Auditor’s Responsibilities for the Audit of theConsolidated Financial Statements section of our report, including in relation to these matters.Accordingly, our audit included the performance of procedures designed to respond to our assessment ofthe risks of material misstatement of the consolidated financial statements. The results of our auditprocedures, including the procedures performed to address the matters below, provide the basis for ouraudit opinion on the accompanying consolidated financial statements.
SyCip Gorres Velayo & Co.6760 Ayala Avenue1226 Makati CityPhilippines
Tel: (632) 891 0307Fax: (632) 819 0872ey.com/ph
BOA/PRC Reg. No. 0001, December 14, 2015, valid until December 31, 2018SEC Accreditation No. 0012-FR-4 (Group A), November 10, 2015, valid until November 9, 2018
A member firm of Ernst & Young Global Limited

*SGVFS028606*
- 2 -
Recognition of real estate revenue and costs
The Group applies the percentage of completion (POC) method in determining real estate revenue andcosts. The POC is based on physical completion of the real estate project. The cost of sales is determinedon the basis of the total estimated costs applied with the POC of the project. The Group’s real estaterevenue and costs accounts for 79.20% of total consolidated revenue and 62.21% of the total consolidatedcost of sales for the year ended December 31, 2017. The assessment of the physical stage of completionand the total estimated costs is complex, and requires technical determination by management’sspecialists (project development engineers). In addition, the Company requires a certain percentage ofbuyer’s payments of total selling price (buyer’s equity), to be collected as one of the criteria in order toinitiate revenue recognition. It is the reaching of this level of collection that management has assessedthat it is probable that economic benefits will flow to the Group because of the buyers’ continuingcommitment with the sales agreement. The assessment of the stage of completion and level of buyer’sequity involves significant management judgment. Refer to Notes 2 and 3 to the consolidated statementsfor the disclosures on revenue and cost recognition and discussions of significant estimates.
Audit Response
We obtained an understanding of the Group’s processes for determining the POC, and for determiningand updating of total estimated costs and performed tests of the relevant controls of these processes. Weobtained the certified POC reports prepared by the project development engineers and assessed theircompetence and objectivity by reference to their qualifications, experience and reporting responsibilities.We obtained the supporting details of POC reports showing the completion of the major activities of theproject under construction. For selected projects, we conducted ocular inspections and made relevantinquiries. We performed test computation of the POC calculation of management. We obtained theapproved opening fact sheet indicating work breakdown structure and total project development costs asestimated by the project development engineers. For changes in estimated cost components, wecompared these against the addendum to the opening fact sheet and supporting contractor’s change orderform and performed inquiries with the project development engineers for any revisions. We evaluatedmanagement’s basis of the buyer’s equity by comparing this to the historical analysis of sales collectionsfrom buyers with accumulated payments above the collection threshold. We traced the analysis tosupporting documents.
Valuation of receivable from tenants
Receivable arising from leasing operations are significant to the Group as it represents approximately13.45% of the accounts receivable balance. Furthermore, the valuation of receivable requiredmanagement judgment and subjective assumptions due to the credit risks associated with tradereceivables. The Group records allowance for doubtful receivable as disclosed in Note 33 to theconsolidated financial statements.
A member firm of Ernst & Young Global Limited

*SGVFS028606*
- 3 -
Audit Response
We obtained an understanding of the Group’s specific impairment process over receivable and tested therelevant controls. We obtained an understanding of the Group’s credit policy and the processes foridentifying impairment indicators, including the process for identifying past due receivable. Forindividually significant receivable, we assessed the valuation by considering the terms of the underlyingcontracts and correspondences, the lessee’s payment history including the payments made subsequent toyear end, and the lessee’s current financial condition. With respect to the Group’s collective impairmenttesting for receivable, we tested the groupings of the receivables based on credit risk characteristics andcompared the loss rates applied against the historical data. We also reviewed the Group’s disclosuresregarding receivable and related impairment allowance, the related risks such as credit risk, and the agingof receivable.
Other Information
Management is responsible for the other information. The other information comprises the informationincluded in the SEC Form 20-IS (Definitive Information Statement), SEC Form 17-A and Annual Reportfor the year ended December 31, 2017, but does not include the consolidated financial statements and ourauditor’s report thereon. The SEC Form 20-IS, SEC Form 17-A and Annual Report for the year endedDecember 31, 2017 are expected to be made available to us after the date of this auditor’s report.
Our opinion on the consolidated financial statements does not cover the other information and we will notexpress any form of assurance conclusion thereon.
In connection with our audits of the consolidated financial statements, our responsibility is to read theother information identified above when it becomes available and, in doing so, consider whether the otherinformation is materially inconsistent with the consolidated financial statements or our knowledgeobtained in the audits, or otherwise appears to be materially misstated.
Responsibilities of Management and Those Charged with Governance for the ConsolidatedFinancial Statements
Management is responsible for the preparation and fair presentation of the consolidated financialstatements in accordance with PFRSs, and for such internal control as management determines isnecessary to enable the preparation of consolidated financial statements that are free from materialmisstatement, whether due to fraud or error.
In preparing the consolidated financial statements, management is responsible for assessing the Group’sability to continue as a going concern, disclosing, as applicable, matters related to going concern andusing the going concern basis of accounting unless management either intends to liquidate the Group or tocease operations, or has no realistic alternative but to do so.
Those charged with governance are responsible for overseeing the Group’s financial reporting process.
A member firm of Ernst & Young Global Limited

*SGVFS028606*
- 4 -
Auditor’s Responsibilities for the Audit of the Consolidated Financial Statements
Our objectives are to obtain reasonable assurance about whether the consolidated financial statements as awhole are free from material misstatement, whether due to fraud or error, and to issue an auditor’s reportthat includes our opinion. Reasonable assurance is a high level of assurance, but is not a guarantee that anaudit conducted in accordance with PSAs will always detect a material misstatement when it exists.Misstatements can arise from fraud or error and are considered material if, individually or in theaggregate, they could reasonably be expected to influence the economic decisions of users taken on thebasis of these consolidated financial statements.
As part of an audit in accordance with PSAs, we exercise professional judgment and maintainprofessional skepticism throughout the audit. We also:
Identify and assess the risks of material misstatement of the consolidated financial statements,whether due to fraud or error, design and perform audit procedures responsive to those risks, andobtain audit evidence that is sufficient and appropriate to provide a basis for our opinion. The risk ofnot detecting a material misstatement resulting from fraud is higher than for one resulting from error,as fraud may involve collusion, forgery, intentional omissions, misrepresentations, or the override ofinternal control.
Obtain an understanding of internal control relevant to the audit in order to design audit proceduresthat are appropriate in the circumstances, but not for the purpose of expressing an opinion on theeffectiveness of the Group’s internal control.
Evaluate the appropriateness of accounting policies used and the reasonableness of accountingestimates and related disclosures made by management.
Conclude on the appropriateness of management’s use of the going concern basis of accounting and,based on the audit evidence obtained, whether a material uncertainty exists related to events orconditions that may cast significant doubt on the Group’s ability to continue as a going concern. Ifwe conclude that a material uncertainty exists, we are required to draw attention in our auditor’sreport to the related disclosures in the consolidated financial statements or, if such disclosures areinadequate, to modify our opinion. Our conclusions are based on the audit evidence obtained up tothe date of our auditor’s report. However, future events or conditions may cause the Group to ceaseto continue as a going concern.
Evaluate the overall presentation, structure and content of the consolidated financial statements,including the disclosures, and whether the consolidated financial statements represent the underlyingtransactions and events in a manner that achieves fair presentation.
Obtain sufficient appropriate audit evidence regarding the financial information of the entities orbusiness activities within the Group to express an opinion on the consolidated financial statements.We are responsible for the direction, supervision and performance of the audit. We remain solelyresponsible for our audit opinion.
A member firm of Ernst & Young Global Limited
*SGVFS028606*
- 5 -
We communicate with those charged with governance regarding, among other matters, the planned scopeand timing of the audit and significant audit findings, including any significant deficiencies in internalcontrol that we identify during our audit.
We also provide those charged with governance with a statement that we have complied with relevantethical requirements regarding independence, and to communicate with them all relationships and othermatters that may reasonably be thought to bear on our independence, and where applicable, relatedsafeguards.
From the matters communicated with those charged with governance, we determine those matters thatwere of most significance in the audit of the consolidated financial statements of the current period andare therefore the key audit matters. We describe these matters in our auditor’s report unless law orregulation precludes public disclosure about the matter or when, in extremely rare circumstances, wedetermine that a matter should not be communicated in our report because the adverse consequences ofdoing so would reasonably be expected to outweigh the public interest benefits of such communication.
The engagement partner on the audit resulting in this independent auditor’s report is Cyril Jasmin B.Valencia.
SYCIP GORRES VELAYO & CO.
Cyril Jasmin B. ValenciaPartnerCPA Certificate No. 90787SEC Accreditation No. 1229-AR-1 (Group A), May 12, 2015, valid until May 11, 2018Tax Identification No. 162-410-623BIR Accreditation No. 08-001998-74-2018, February 26, 2018, valid until February 26, 2021PTR No. 6621337, January 9, 2018, Makati City
March 27, 2018
A member firm of Ernst & Young Global Limited

*SGVFS028606*
VISTA LAND & LIFESCAPES, INC. AND SUBSIDIARIESCONSOLIDATED STATEMENTS OF FINANCIAL POSITION
December 312017 2016
ASSETS
Current AssetsCash and cash equivalents (Notes 8, 32 and 33) P=11,494,511,442 P=8,902,537,938Short-term cash investments (Notes 9, 32 and 33) 345,639,559 99,998,562Available-for-sale financial assets (Notes 9, 32 and 33) 6,491,361,776 1,792,527,121Held-to-maturity investments (Notes 9, 32 and 33) 8,133,258,592 1,709,730,739Receivables (Notes 10, 32 and 33) 37,664,761,951 28,329,412,070Receivables from related parties (Notes 30, 32 and 33) 4,987,930,489 3,916,669,458Real estate inventories (Note 11) 26,333,859,417 22,954,662,398Other current assets (Note 12) 4,017,873,284 3,807,341,953
Total Current Assets 99,469,196,510 71,512,880,239
Noncurrent AssetsAvailable-for-sale financial assets (Notes 9, 32 and 33) 121,580,343 6,452,537,732Held-to-maturity investments (Notes 9, 32 and 33) 13,694,030,855 19,141,877,715Receivables - net of current portion (Notes 10, 32 and 33) 6,517,705,884 9,212,259,033Project development costs (Note 16) 4,034,282,866 3,232,311,240Property and equipment (Note 15) 885,818,633 822,250,208Investment properties (Note 14) 37,437,658,962 32,065,532,674Land and improvements (Note 13) 35,029,871,677 30,486,623,405Goodwill (Note 7) 147,272,020 147,272,020Pension assets (Note 28) 87,660,881 –Deferred tax assets - net (Notes 7 and 29) 802,145,997 437,178,971Other noncurrent assets (Note 17) 1,707,506,437 1,257,521,478 Total Noncurrent Assets 100,465,534,555 103,255,364,476
P=199,934,731,065 P=174,768,244,715
LIABILITIES AND EQUITY
Current LiabilitiesAccounts and other payables (Notes 18, 32 and 33) P=13,274,954,736 P=11,400,373,514Customers’ advances and deposits (Note 19) 3,617,888,803 2,671,745,547Income tax payable 53,215,024 133,960,233Dividends payable (Note 23) 28,959,615 24,962,710Current portion of:
Notes payable (Notes 21, 32 and 33) 60,890,732 475,475,872Bank loans (Notes 20, 32 and 33) 3,620,352,953 5,972,290,312Loans payables (Notes 20, 32 and 33) 644,355,649 1,122,548,064
Total Current Liabilities 21,300,617,512 21,801,356,252
(Forward)

*SGVFS028606*
- 2 -
December 312017 2016
Noncurrent LiabilitiesNotes payable - net of current portion
(Notes 21, 32 and 33) P=54,440,151,506 P=39,049,639,700Bank loans - net of current portion
(Notes 20, 32 and 33) 32,179,459,075 30,114,951,980Loans payable - net of current portion
(Notes 20, 32 and 33) 3,116,110,334 2,764,704,543Pension liabilities (Note 28) – 98,133,829Deferred tax liabilities - net (Note 29) 3,216,367,742 2,065,642,208Other noncurrent liabilities (Notes 22 and 33) 1,674,082,315 2,378,510,004
Total Noncurrent Liabilities 94,626,170,972 76,471,582,264Total Liabilities 115,926,788,484 98,272,938,516
Equity (Note 23)Attributable to equity holders of the Parent Company
Common stock 13,114,136,376 13,114,136,376Preferred stock 33,000,000 33,000,000Additional paid-in capital 30,655,429,349 30,655,429,349Treasury shares (Note 4) (6,980,294,580) (6,917,014,956)Retained earnings 44,136,812,797 36,953,581,723Other comprehensive income (Notes 9 and 28) 1,280,960,358 1,111,006,329
82,240,044,300 74,950,138,821Non-controlling interest (Note 31) 1,767,898,281 1,545,167,378
Total Equity 84,007,942,581 76,495,306,199P=199,934,731,065 P=174,768,244,715
See accompanying Notes to Consolidated Financial Statements.
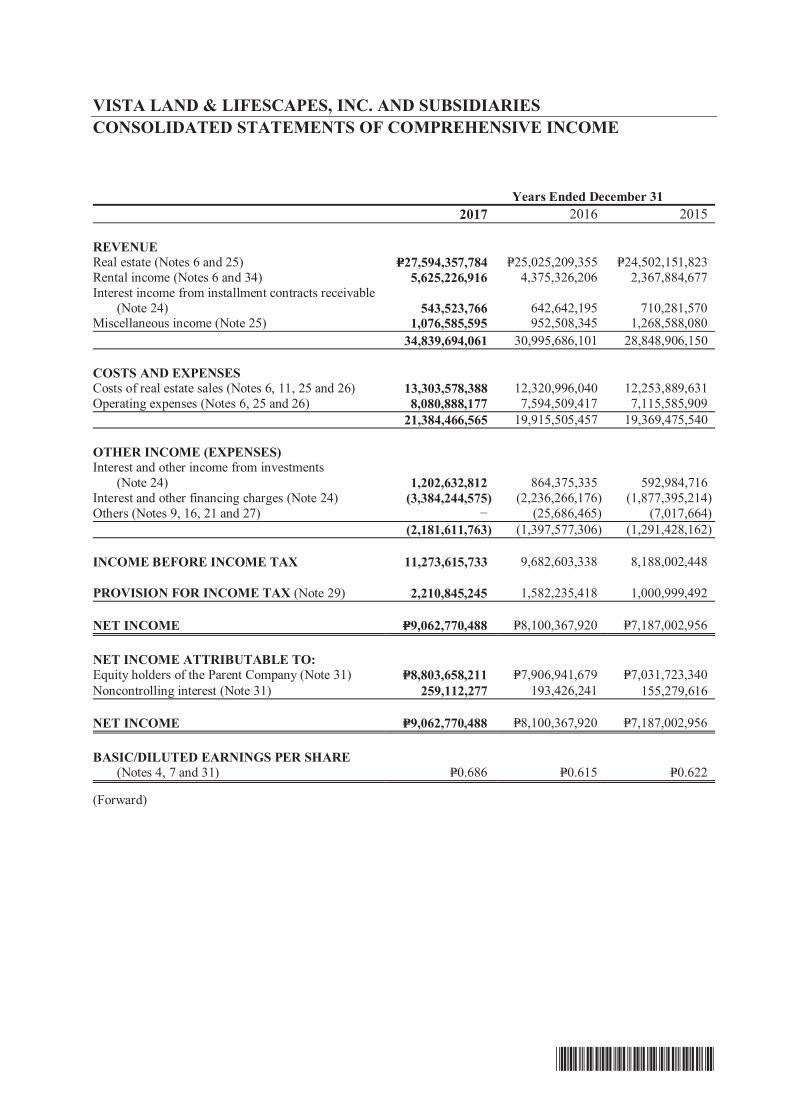
*SGVFS028606*
VISTA LAND & LIFESCAPES, INC. AND SUBSIDIARIESCONSOLIDATED STATEMENTS OF COMPREHENSIVE INCOME
Years Ended December 312017 2016 2015
REVENUEReal estate (Notes 6 and 25) P=27,594,357,784 P=25,025,209,355 P=24,502,151,823Rental income (Notes 6 and 34) 5,625,226,916 4,375,326,206 2,367,884,677Interest income from installment contracts receivable
(Note 24) 543,523,766 642,642,195 710,281,570Miscellaneous income (Note 25) 1,076,585,595 952,508,345 1,268,588,080
34,839,694,061 30,995,686,101 28,848,906,150
COSTS AND EXPENSESCosts of real estate sales (Notes 6, 11, 25 and 26) 13,303,578,388 12,320,996,040 12,253,889,631Operating expenses (Notes 6, 25 and 26) 8,080,888,177 7,594,509,417 7,115,585,909
21,384,466,565 19,915,505,457 19,369,475,540
OTHER INCOME (EXPENSES)Interest and other income from investments (Note 24) 1,202,632,812 864,375,335 592,984,716Interest and other financing charges (Note 24) (3,384,244,575) (2,236,266,176) (1,877,395,214)Others (Notes 9, 16, 21 and 27) (25,686,465) (7,017,664)
(2,181,611,763) (1,397,577,306) (1,291,428,162)
INCOME BEFORE INCOME TAX 11,273,615,733 9,682,603,338 8,188,002,448
PROVISION FOR INCOME TAX (Note 29) 2,210,845,245 1,582,235,418 1,000,999,492
NET INCOME P=9,062,770,488 P=8,100,367,920 P=7,187,002,956
NET INCOME ATTRIBUTABLE TO:Equity holders of the Parent Company (Note 31) P=8,803,658,211 P=7,906,941,679 P=7,031,723,340Noncontrolling interest (Note 31) 259,112,277 193,426,241 155,279,616
NET INCOME P=9,062,770,488 P=8,100,367,920 P=7,187,002,956
BASIC/DILUTED EARNINGS PER SHARE(Notes 4, 7 and 31) P=0.686 P=0.615 P=0.622
(Forward)

*SGVFS028606*
- 2 -
Years Ended December 312017 2016 2015
NET INCOME P=9,062,770,488 P=8,100,367,920 P=7,187,002,956
OTHER COMPREHENSIVE INCOME(LOSS)
Other comprehensive gain (loss) to bereclassified to profit or loss in
subsequent periods:Cumulative translation adjustments (Note 4) (227,817,585) (25,685,005) 40,073,509Changes in fair value of available-for-sale financial assets (Note 9) 250,341,800 479,370,673 572,270,028
Other comprehensive income not to bereclassified to profit or loss in subsequentperiods:
Remeasurement gain on defined benefit obligation - net of tax (Note 28) 147,240,947 30,275,144 232,522,343
169,765,162 483,960,812 844,865,880
TOTAL COMPREHENSIVE INCOME P=9,232,535,650 P=8,584,328,732 P=8,031,868,836
TOTAL COMPREHENSIVE INCOME ATTRIBUTABLE TO:Equity holders of the Parent Company P=8,973,612,240 P=8,395,129,349 P=7,899,526,987Non-controlling interest 258,923,410 189,199,383 132,341,849
P=9,232,535,650 P=8,584,328,732 P=8,031,868,836
See accompanying Notes to Consolidated Financial Statements.

*SGVFS028606*
VIS
TA
LA
ND
& L
IFE
SCA
PES,
IN
C. A
ND
SU
BSI
DIA
RIE
SC
ON
SOL
IDA
TE
D S
TA
TE
ME
NT
S O
F C
HA
NG
ES
IN E
QU
ITY
Oth
er C
ompr
ehen
sive
Inco
me
Cap
ital S
tock
(Not
e 23
)A
dditi
onal
Pai
d-in
Dep
osit
for
futu
reR
etai
ned
Rem
easu
rem
ent
Gai
ns (L
osse
s) o
n R
etir
emen
tC
umul
ativ
eTr
ansl
atio
nO
ther
Com
preh
ensi
veTr
easu
ryN
on-C
ontr
ollin
gC
omm
onSt
ock
Pref
erre
dSt
ock
Cap
ital
(Not
es 7
and
23)
Subs
crip
tion
(Not
e 7)
Ear
ning
s(N
ote
23)
Obl
igat
ion
(Not
e 28
)A
djus
tmen
ts(N
ote
4)In
com
e(N
otes
9 a
nd 2
3)Sh
ares
(Not
es 7
and
23)
Inte
rest
(Not
e 7)
Tota
l
For
the
Yea
r E
nded
Dec
embe
r 31
, 201
7
Bal
ance
s as
at J
anua
ry 1
, 201
7P=1
3,11
4,13
6,37
6P=3
3,00
0,00
0P=3
0,65
5,42
9,34
9P=
P=36,
953,
581,
723
P=288
,176
,785
(P=59
6,80
2)P=8
23,4
26,3
46(P=
6,91
7,01
4,95
6)P=1
,545
,167
,378
P=76,
495,
306,
199
Net
inco
me
8,80
3,65
8,21
125
9,11
2,27
79,
062,
770,
488
Oth
er co
mpr
ehen
sive
inco
me
147,
429,
814
250,
341,
800
(188
,867
)39
7,58
2,74
7C
umul
ativ
e tra
nsla
tion
adju
stm
ents
(227
,817
,585
)(2
27,8
17,5
85)
Tota
l com
preh
ensiv
e in
com
e fo
r the
year
8,80
3,65
8,21
114
7,42
9,81
4(2
27,8
17,5
85)
250,
341,
800
258,
923,
410
9,23
2,53
5,65
0Tr
easu
ry sh
ares
(63,
279,
624)
(63,
279,
624)
Cas
h di
vide
nd d
ecla
red
(1,6
20,4
27,1
37)
(36,
192,
507)
(1,6
56,6
19,6
44)
Bal
ance
s as
at D
ecem
ber
31, 2
017
P=13,
114,
136,
376
P=33,
000,
000
P=30,
655,
429,
349
P=P=4
4,13
6,81
2,79
7P=4
35,6
06,5
99(P=
228,
414,
387)
P=1,0
73,7
68,1
46(P=
6,98
0,29
4,58
0)P=1
,767
,898
,281
P=84,
007,
942,
581
For
the
Yea
r E
nded
Dec
embe
r 31
, 201
6
Bal
ance
s as
at J
anua
ry 1
, 201
6P=1
2,65
4,89
1,75
3P=3
3,00
0,00
0P=2
9,47
0,64
0,86
1P=–
P=30,
483,
778,
682
P=254
,701
,182
P=25,
088,
203
P=462
,740
,871
(P=6,
297,
793,
026)
P=2,8
78,0
40,8
33P=6
9,96
5,08
9,35
9N
et in
com
e–
––
–7,
906,
941,
679
–19
3,42
6,24
18,
100,
367,
920
Oth
er co
mpr
ehen
sive
inco
me
––
––
–34
,502
,002
–47
9,37
0,67
3(4
,226
,858
)50
9,64
5,81
7C
umul
ativ
e tra
nsla
tion
adju
stm
ents
––
––
––
(25,
685,
005)
––
–(2
5,68
5,00
5)To
tal c
ompr
ehen
sive
inco
me
for t
he y
ear
––
––
7,90
6,94
1,67
934
,502
,002
(25,
685,
005)
479,
370,
673
189,
199,
383
8,58
4,32
8,73
2Tr
easu
ry sh
ares
––
––
––
––
(619
,221
,930
)–
(619
,221
,930
)C
ash
divi
dend
dec
lare
d–
––
–(1
,437
,138
,638
)–
––
–(2
1,36
7,43
5)(1
,458
,506
,073
)Is
suan
ce (a
cqui
sitio
n) o
f add
ition
al sh
ares
(Not
es 7
and
23)
459,
244,
623
–1,
184,
788,
488
–(1
,026
,399
)–
(118
,685
,198
)–
(1,5
00,7
05,4
03)
23,6
16,1
11
Bal
ance
s as
at D
ecem
ber
31, 2
016
P=13,
114,
136,
376
P=33,
000,
000
P=30,
655,
429,
349
P=P=3
6,95
3,58
1,72
3P=2
88,1
76,7
85(P=
596,
802)
P=823
,426
,346
(P=6,
917,
014,
956)
P=1,5
45,1
67,3
78P=7
6,49
5,30
6,19
9
For
the
Yea
r E
nded
Dec
embe
r 31
, 201
5
Bal
ance
s as
at J
anua
ry 1
, 201
5 (N
ote
7)P=8
,538
,740
,614
P=33,
000,
000
P=23,
318,
019,
607
P=5,1
53,8
50,6
44P=2
4,59
3,20
3,95
1(P=
758,
928)
(P=14
,985
,306
)(P=
109,
529,
157)
P=P=2
,745
,698
,984
P=64,
257,
240,
409
Net
inco
me
––
––
7,03
1,72
3,34
0–
155,
279,
616
7,18
7,00
2,95
6O
ther
com
preh
ensiv
e in
com
e–
––
––
255,
460,
110
–57
2,27
0,02
8(2
2,93
7,76
7)80
4,79
2,37
1Ex
chan
ge d
iffer
ence
s on
trans
latio
n–
––
––
–40
,073
,509
––
–40
,073
,509
Tota
l com
preh
ensiv
e in
com
e fo
r the
yea
r–
––
–7,
031,
723,
340
255,
460,
110
40,0
73,5
0957
2,27
0,02
8–
132,
341,
849
8,03
1,86
8,83
6Tr
easu
ry sh
ares
aris
ing
from
acq
uisit
ion
(Not
e 7)
––
––
––
––
(6,2
97,7
93,0
26)
–(6
,297
,793
,026
)C
ash
divi
dend
dec
lare
d–
––
–(1
,141
,148
,609
)–
––
––
(1,1
41,1
48,6
09)
Dep
osit
for f
utur
e st
ock
subs
crip
tion
app
lied
to c
apita
l sto
ck, n
et o
fef
fect
from
acq
uisit
ion
(Not
e 7)
4,11
6,15
1,13
9–
6,15
2,62
1,25
4(5
,153
,850
,644
)–
––
––
–5,
114,
921,
749
Bal
ance
s as
at D
ecem
ber
31, 2
015
P=12,
654,
891,
753
P=33,
000,
000
P=29,
470,
640,
861
P=–P=3
0,48
3,77
8,68
2P=2
54,7
01,1
82P=2
5,08
8,20
3P=4
62,7
40,8
71(P=
6,29
7,79
3,02
6)P=2
,878
,040
,833
P=69,
965,
089,
359
See
acco
mpa
nyin
g N
otes
to C
onso
lidat
ed F
inan
cial
Sta
tem
ents
.
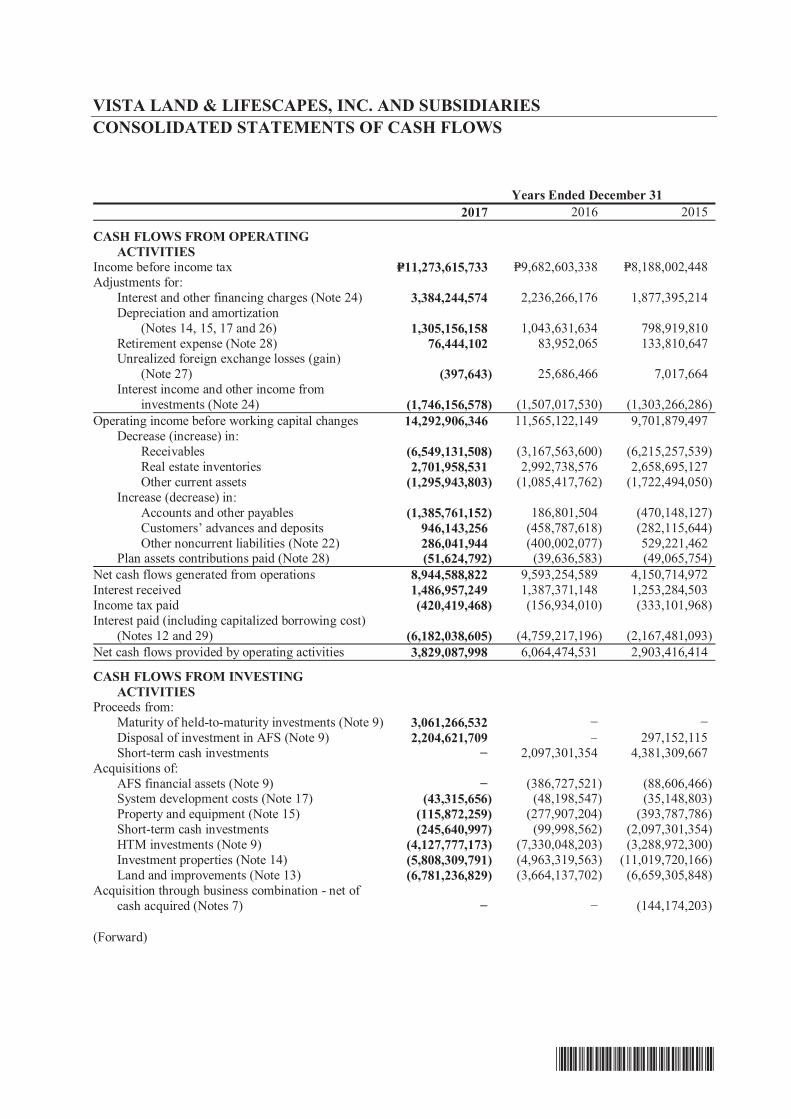
*SGVFS028606*
VISTA LAND & LIFESCAPES, INC. AND SUBSIDIARIESCONSOLIDATED STATEMENTS OF CASH FLOWS
Years Ended December 312017 2016 2015
CASH FLOWS FROM OPERATING ACTIVITIESIncome before income tax P=11,273,615,733 P=9,682,603,338 P=8,188,002,448Adjustments for:
Interest and other financing charges (Note 24) 3,384,244,574 2,236,266,176 1,877,395,214Depreciation and amortization
(Notes 14, 15, 17 and 26) 1,305,156,158 1,043,631,634 798,919,810Retirement expense (Note 28) 76,444,102 83,952,065 133,810,647Unrealized foreign exchange losses (gain)
(Note 27) (397,643) 25,686,466 7,017,664Interest income and other income from
investments (Note 24) (1,746,156,578) (1,507,017,530) (1,303,266,286)Operating income before working capital changes 14,292,906,346 11,565,122,149 9,701,879,497
Decrease (increase) in:Receivables (6,549,131,508) (3,167,563,600) (6,215,257,539)Real estate inventories 2,701,958,531 2,992,738,576 2,658,695,127Other current assets (1,295,943,803) (1,085,417,762) (1,722,494,050)
Increase (decrease) in:Accounts and other payables (1,385,761,152) 186,801,504 (470,148,127)Customers’ advances and deposits 946,143,256 (458,787,618) (282,115,644)Other noncurrent liabilities (Note 22) 286,041,944 (400,002,077) 529,221,462
Plan assets contributions paid (Note 28) (51,624,792) (39,636,583) (49,065,754)Net cash flows generated from operations 8,944,588,822 9,593,254,589 4,150,714,972Interest received 1,486,957,249 1,387,371,148 1,253,284,503Income tax paid (420,419,468) (156,934,010) (333,101,968)Interest paid (including capitalized borrowing cost) (Notes 12 and 29) (6,182,038,605) (4,759,217,196) (2,167,481,093)Net cash flows provided by operating activities 3,829,087,998 6,064,474,531 2,903,416,414
CASH FLOWS FROM INVESTING ACTIVITIESProceeds from:
Maturity of held-to-maturity investments (Note 9) 3,061,266,532Disposal of investment in AFS (Note 9) 2,204,621,709 297,152,115Short-term cash investments 2,097,301,354 4,381,309,667
Acquisitions of:AFS financial assets (Note 9) (386,727,521) (88,606,466)System development costs (Note 17) (43,315,656) (48,198,547) (35,148,803)Property and equipment (Note 15) (115,872,259) (277,907,204) (393,787,786)Short-term cash investments (245,640,997) (99,998,562) (2,097,301,354)HTM investments (Note 9) (4,127,777,173) (7,330,048,203) (3,288,972,300)Investment properties (Note 14) (5,808,309,791) (4,963,319,563) (11,019,720,166)Land and improvements (Note 13) (6,781,236,829) (3,664,137,702) (6,659,305,848)
Acquisition through business combination - net of cash acquired (Notes 7) (144,174,203)
(Forward)

*SGVFS028606*
- 2 -
Years Ended December 312017 2016 2015
Decrease (increase) in:Project development costs (P=801,971,626) (P=377,386,114) (P=1,271,110,823)Receivables from related parties (1,071,261,031) (491,051,066) 364,088,665Other noncurrent assets (445,466,574) (385,875,522) (263,120,034)
Net cash flows used in investing activities (14,174,963,695) (15,927,348,650) (20,218,697,336)
CASH FLOWS FROM FINANCING ACTIVITIESProceeds from:
Notes payable (Note 21) 15,844,753,409 12,478,282,420 13,513,894,356Bank loans (Note 20) 6,618,873,486 6,966,686,959 18,985,501,603Loans payable (Note 20) 2,318,488,025 2,243,998,245 3,003,541,462
Payments of:Shares issuance cost (241,761,447)Notes payable (Note 21) (777,150,342) (724,398,603) (11,827,720,396)Dividends paid (Note 23) (1,652,811,607) (1,453,656,460) (1,234,896,664)Loans payable (Note 20) (2,445,274,649) (2,051,634,740) (2,001,425,911)
Bank loans (Note 20) (6,906,303,750) (4,076,861,331) (2,350,802,182)Acquisition of:
Non-controlling interest (Note 7) (15,152,473)Treasury shares (Note 23) (63,123,014) (619,221,930) (919,504,289)
Net cash flows provided by financing activities 12,937,451,558 12,748,042,087 16,926,826,532
EFFECT OF CHANGE IN EXCHANGE RATES ON CASH AND CASH EQUIVALENTS 397,643 (25,686,466) (7,017,664)
NET INCREASE (DECREASE) IN CASH AND CASH EQUIVALENTS 2,591,973,504 2,859,481,502 (395,472,054)
CASH AND CASH EQUIVALENTS AT BEGINNING OF YEAR 8,902,537,938 6,043,056,436 6,438,528,490
CASH AND CASH EQUIVALENTS AT END OF YEAR (Note 8) P=11,494,511,442 P=8,902,537,938 P=6,043,056,436
See accompanying Notes to Consolidated Financial Statements.

*SGVFS028606*
VISTA LAND & LIFESCAPES, INC. AND SUBSIDIARIESNOTES TO CONSOLIDATED FINANCIAL STATEMENTS
1. Corporate Information
Vista Land & Lifescapes, Inc. (the Parent Company) was incorporated in the Republic of thePhilippines and registered with the Securities and Exchange Commission (SEC) onFebruary 28, 2007 with a corporate life of 50 years. The Parent Company’s registered office addressis at Lower Ground Floor, Building B, EVIA Lifestyle Center, Vista City, Daanghari, Almanza II,Las Piñas City. Formerly, the registered office address is at 3rd Level Starmall Las Piñas, CV StarrAvenue, Philamlife Village, Pamplona, Las Piñas City. The change in address was approved by theBoard of Directors (BOD) and SEC on May 15, 2017 and on December 29, 2017, respectively. As offinancial statements approval date, the Parent Company is in the process of completing the statutoryrequirements for its application for registration information update with the Bureau of InternalRevenue (BIR). The Parent Company is a publicly-listed investment holding company which is51.85% owned by Fine Properties, Inc., (Ultimate Parent Company), 48.15% owned by PCDNominee Corporations and the other entities and individuals.
The Parent Company is the holding company of the Vista Group (the Group). The Group has sixwholly-owned subsidiaries, namely: Brittany Corporation (Brittany), Crown Asia Properties, Inc.(CAPI), Vista Residences, Inc. (VRI), Camella Homes, Inc. (CHI), Communities Philippines, Inc.(CPI) and VLL International Inc. (VII), and an 88.34% owned subsidiary, Starmalls, Inc. which is alisted entity with Philippine SEC. The Group is divided into horizontal, vertical and commercial andothers segments. The horizontal and vertical segments cater to the development and sale ofresidential lots and units and residential high-rise condominium, respectively. The commercialsegment caters to the development, leasing and management of shopping malls and commercialcenters all over the Philippines as well as buildings catering to the business process outsourcing(“BPO”) industry. The other segment caters to the development and management of recreational andvacation facilities such as resorts, hotels, club and spa. It also includes activities from holdingcompanies.
On November 10, 2015, the Parent Company acquired Starmalls, Inc. and its subsidiaries (StarmallsGroup) namely, Masterpiece Asia Properties, Inc. and Manuela Corporation, to cater to vertical andcommercial segment (Note 7).
Starmalls Group is a major developer, owner and operator of 16 retail malls that target mass marketretail consumers in the Philippines. It also develops and operates five BPO commercial centerslocated in Metro Manila. Its commercial assets portfolio have a combined gross floor area of1,060,495 square meters (sq.m.). as at December 31, 2017.
2. Basis of Preparation
The accompanying consolidated financial statements of the Group have been prepared on a historicalcost basis, except for the available-for-sale (AFS) financial assets which have been measured at fairvalue. The consolidated financial statements are presented in Philippine Peso (P=) which is thefunctional and presentation currency of the Parent Company, and all amounts are rounded to thenearest Philippine Peso unless otherwise indicated.

- 2 -
*SGVFS028606*
Statement of ComplianceThe consolidated financial statements of the Group have been prepared in compliance with PhilippineFinancial Reporting Standards (PFRS).
Basis of ConsolidationThe consolidated financial statements comprise the financial statements of the Parent Company andits subsidiaries as of December 31, 2017 and 2016, and for each of the three years in the period endedDecember 31, 2017.
Control is achieved when the Group is exposed, or has rights, to variable returns from its involvementwith the investee and has the ability to affect those returns through its power over the investee.Specifically, the Group controls an investee if and only if the Group has:
Power over the investee (i.e., existing rights that give it the current ability to direct the relevantactivities of the investee)Exposure, or rights, to variable returns from its involvement with the investee, andThe ability to use its power over the investee to affect its returns
Generally, there is a presumption that a majority of voting rights result in control. To support thispresumption and when the Group has less than a majority of the voting or similar rights of aninvestee, the Group considers all relevant facts and circumstances in assessing whether it has powerover an investee, including:
The contractual arrangement with the other vote holders of the investeeRights arising from other contractual arrangementsThe Group’s voting rights and potential voting rights
The Group re-assesses whether or not it controls an investee if facts and circumstances indicate thatthere are changes to one or more of the three elements of control. Consolidation of a subsidiarybegins when the Group obtains control over the subsidiary and ceases when the Group loses controlof the subsidiary. Assets, liabilities, income and expenses of a subsidiary acquired or disposed ofduring the year are included or excluded in the consolidated financial statements from the date theGroup gains control or until the date the Group ceases to control the subsidiary.
Profit or loss and each component of other comprehensive income (OCI) are attributed to the equityholders of the Parent Company and to the noncontrolling interests (NCI), even if this results in theNCI having a deficit balance. The consolidated financial statements are prepared using uniformaccounting policies for like transactions and other similar events. When necessary, adjustments aremade to the financial statements of subsidiaries to bring their accounting policies into line with theGroup’s accounting policies. All intra-group assets and liabilities, equity, income, expenses and cashflows relating to transactions between members of the Group are eliminated in full on consolidation.
A change in the ownership interest of a subsidiary, without a loss of control, is accounted for as anequity transaction. If the Group loses control over a subsidiary, it derecognizes the related assets(including goodwill), liabilities, non-controlling interest and other components of equity, while anyresultant gain or loss is recognized in profit or loss. Any investment retained is recognized at fairvalue.

- 3 -
*SGVFS028606*
The consolidated financial statements include the financial statements of the Parent Company and thefollowing subsidiaries. The voting rights held by the Group in these subsidiaries are in proportion oftheir ownership interest.
Percentage of Ownership2017 2016 2015
Brittany 100.00% 100.00% 100.00%Balmoral Resources Corporation* 36.93
CAPI 100.00 100.00 100.00Balmoral Resources Corporation* 16.93
VRI 100.00 100.00 100.00Vista Leisure Club Corporation 100.00 100.00 100.00Malay Resorts Holdings, Inc. 100.00 100.00 100.00Balmoral Resources Corporation* 37.22
CHIHousehold Development Corporation 100.00 100.00 100.00
Balmoral Resources Corporation* 8.92Mandalay Resources Corp. 100.00 100.00 100.00C&P International Limited 100.00 100.00 100.00Brittany Estates Corporation 100.00 100.00 100.00Camella Sales Specialists, Inc.
Prima Casa Land & Houses, Inc. (PCLHI) 100.00 100.00 100.00CPI 100.00 100.00 100.00
Communities Batangas, Inc. 100.00 100.00 100.00Communities Bulacan, Inc. 100.00 100.00 100.00Communities Cebu, Inc. 100.00 100.00 100.00Communities Cagayan, Inc. 100.00 100.00 100.00Communities Davao, Inc. 100.00 100.00 100.00Communities General Santos, Inc. 100.00 100.00 100.00Communities Isabela, Inc. 100.00 100.00 100.00Communities Leyte, Inc. 100.00 100.00 100.00Communities Naga, Inc. 100.00 100.00 100.00Communities Iloilo, Inc. 100.00 100.00 100.00Communities Negros Occidental, Inc. 100.00 100.00 100.00Communities Pampanga, Inc. 100.00 100.00 100.00Communities Pangasinan, Inc. 100.00 100.00 100.00Communities Tarlac, Inc. 100.00 100.00 100.00Communities Zamboanga, Inc. 100.00 100.00 100.00Communities Ilocos, Inc. 100.00 100.00 100.00Communities Bohol, Inc. 100.00 100.00 100.00Communities Quezon, Inc. 100.00 100.00 100.00Communities Palawan, Inc. 100.00 100.00 100.00Communities Panay, Inc. 100.00 100.00 100.00
VII 100.00 100.00 100.00Starmalls, Inc. 88.34 88.34 79.43
Manuela Corporation 100.00 100.00 100.00Masterpiece Asia Properties, Inc. 98.40 98.40 98.40Mandalay Resources Corp. 100.00 100.00 100.00C&P International Limited 100.00 100.00 100.00
*The Group effectively owns 100% of Balmoral Resources Corporation through Brittany,CAPI, VRI and HDC

- 4 -
*SGVFS028606*
Noncontrolling InterestsNoncontrolling interests represent the portion of profit or loss and net assets not owned, directly orindirectly, by the Group.
Noncontrolling interests are presented separately in the consolidated statement of income,consolidated statement of comprehensive income, and within equity in the consolidated statement offinancial position, separately from parent shareholder’s equity. Any losses applicable to thenoncontrolling interests are allocated against the interests of the noncontrolling interest even if thisresults to the noncontrolling interest having a deficit balance. The acquisition of an additionalownership interest in a subsidiary without a change of control is accounted for as an equitytransaction. Any excess or deficit of consideration paid over the carrying amount of thenoncontrolling interest is recognized in equity of the parent in transactions where the noncontrollinginterest are acquired or sold without loss of control.
As at December 31, 2017 and 2016, percentage of noncontrolling interests pertaining to Starmalls,Inc. and its subsidiaries amounted to 11.66%. The voting rights held by the noncontrolling intrestsare in proportion of their ownership interest.
Starmalls, Inc. was incorporated in the Republic of the Philippines and duly registered with theSecurities and Exchange Commission (SEC) on October 16, 1969, originally to pursue mineralexploration. After obtaining SEC approval on November 10, 2004, it later changed its primarybusiness and is now presently engaged in holding investments in shares of stock and real estatebusiness.
The Parent and the subsidiaries are all domiciled and incorporated in the Philippines and are in thebusiness of real estate development and leasing of commercial spaces and buildings, except for VIIand C&P International Limited. The latter are incorporated in Grand Cayman Island and domiciled inHong Kong and operates as holding companies.
3. Changes in Accounting Policies
The Group applied for the first time certain pronouncements, which are effective for annual periodsbeginning on or after January 1, 2017.
Amendments to PFRS 12, Disclosure of Interests in Other Entities, Clarification of the Scope ofthe Standard (Part of Annual Improvements to PFRSs 2014 - 2016 Cycle)
The amendments clarify that the disclosure requirements in PFRS 12, other than those relating tosummarized financial information, apply to an entity’s interest in a subsidiary, a joint venture oran associate (or a portion of its interest in a joint venture or an associate) that is classified (orincluded in a disposal group that is classified) as held for sale.
Adoption of these amendments did not have any impact on the Group’s consolidated financialstatements because it does not have disposal group.
Amendments to PAS 7, Statement of Cash Flows, Disclosure Initiative
The amendments require entities to provide disclosure of changes in their liabilities arising fromfinancing activities, including both changes arising from cash flows and non-cash changes (suchas foreign exchange gains or losses).

- 5 -
*SGVFS028606*
The Group has provided the required information in Note 35 to the consolidated financialstatements. As allowed under the transition provisions of the standard, the Group did not presentcomparative information for the year ended December 31, 2016 and 2015.
Amendments to PAS 12, Income Taxes, Recognition of Deferred Tax Assets for UnrealizedLosses
The amendments clarify that an entity needs to consider whether tax law restricts the sources oftaxable profits against which it may make deductions upon the reversal of the deductibletemporary difference related to unrealized losses. Furthermore, the amendments provide guidanceon how an entity should determine future taxable profits and explain the circumstances in whichtaxable profit may include the recovery of some assets for more than their carrying amount.
The Group applied the amendments retrospectively. However, their application has no effect onthe Group’s financial position and performance as the Group has no deductible temporarydifferences or assets that are in the scope of the amendments.
Pronouncements issued but not yet effective are listed below. Unless otherwise indicated, the Groupdoes not expect that the future adoption of the said pronouncements will have a significant impact onits consolidated financial statements. The Group intends to adopt the following pronouncementswhen they become effective.
Effective beginning on or after January 1, 2018Amendments to PFRS 2, Share-based Payment, Classification and Measurement of Share-basedPayment Transactions
The amendments to PFRS 2 address three main areas: the effects of vesting conditions on themeasurement of a cash-settled share-based payment transaction; the classification of a share-based payment transaction with net settlement features for withholding tax obligations; and theaccounting where a modification to the terms and conditions of a share-based paymenttransaction changes its classification from cash settled to equity settled.
On adoption, entities are required to apply the amendments without restating prior periods, butretrospective application is permitted if elected for all three amendments and if other criteria aremet. Early application of the amendments is permitted.
The Group does not expect impact from the adoption of this amendment because it does not haveshare-based payment transactions.
PFRS 9, Financial Instruments
PFRS 9 reflects all phases of the financial instruments project and replaces PAS 39, FinancialInstruments: Recognition and Measurement, and all previous versions of PFRS 9. The standardintroduces new requirements for classification and measurement, impairment, and hedgeaccounting. Retrospective application is required but providing comparative information is notcompulsory. For hedge accounting, the requirements are generally applied prospectively, withsome limited exceptions.
The Group plans to adopt the new standard on the mandatory effective date and will not restatecomparative information.

- 6 -
*SGVFS028606*
In 2017, the Group performed its initial impact assessment of PFRS 9 and assessed that it willimpact its methodology and measurement of credit losses as well on the classification andmeasurement of financial assets. There is no impact to the classification and measurement of itsfinancial liabilities.
Amendments to PFRS 4, Insurance Contracts, Applying PFRS 9, Financial Instruments, withPFRS 4
The amendments address concerns arising from implementing PFRS 9, the new financialinstruments standard before implementing the new insurance contracts standard. The amendmentsintroduce two options for entities issuing insurance contracts: a temporary exemption fromapplying PFRS 9 and an overlay approach. The temporary exemption is first applied for reportingperiods beginning on or after January 1, 2018. An entity may elect the overlay approach when itfirst applies PFRS 9 and apply that approach retrospectively to financial assets designated ontransition to PFRS 9. The entity restates comparative information reflecting the overlay approachif, and only if, the entity restates comparative information when applying PFRS 9.
The amendments are not applicable to the Group since none of the entities within the Group haveactivities that are connected with insurance or issue insurance contracts.
PFRS 15, Revenue from Contracts with Customers
PFRS 15 establishes a new five-step model that will apply to revenue arising from contracts withcustomers. Under PFRS 15, revenue is recognized at an amount that reflects the consideration towhich an entity expects to be entitled in exchange for transferring goods or services to acustomer. The principles in PFRS 15 provide a more structured approach to measuring andrecognizing revenue.
The new revenue standard is applicable to all entities and will supersede all current revenuerecognition requirements under PFRSs. Either a full retrospective application or a modifiedretrospective application is required for annual periods beginning on or after January 1, 2018.Early adoption is permitted. The Group plans to adopt the new standard on the required effectivedate using the modified retrospective method.
Based on its initial assessment, the requirements of PFRS 15 on the following may havesignificant impact on the Group’s consolidated financial position, performance and disclosures:
Significant financing component in relation to advance payments received from customers oradvance proportion of work performedDetermination if existing documentation would meet the definition of contracts for real estateagreementsAccounting for costs in obtaining the contract for real estate agreementsMeasurement of progress for real estate
The recognition and measurement requirements in PFRS 15 also apply to gains or losses ondisposal of nonfinancial assets (such as items of property and equipment and intangible assets),when that disposal is not in the ordinary course of business.

- 7 -
*SGVFS028606*
Amendments to PAS 28, Measuring an Associate or Joint Venture at Fair Value (Part of AnnualImprovements to PFRSs 2014 - 2016 Cycle)
The amendments clarify that an entity that is a venture capital organization, or other qualifyingentity, may elect, at initial recognition on an investment-by-investment basis, to measure itsinvestments in associates and joint ventures at fair value through profit or loss. They also clarifythat if an entity that is not itself an investment entity has an interest in an associate or jointventure that is an investment entity, the entity may, when applying the equity method, elect toretain the fair value measurement applied by that investment entity associate or joint venture tothe investment entity associate’s or joint venture’s interests in subsidiaries. This election is madeseparately for each investment entity associate or joint venture, at the later of the date on which(a) the investment entity associate or joint venture is initially recognized; (b) the associate or jointventure becomes an investment entity; and (c) the investment entity associate or joint venture firstbecomes a parent. The amendments should be applied retrospectively, with earlier applicationpermitted.
The amendments should be applied retrospectively, with earlier application permitted. Theamendment is not expected to significantly impact the financial statements since entities withinthe Group are not venture capital organization or alike.
Amendments to PAS 40, Investment Property, Transfers of Investment Property
The amendments clarify when an entity should transfer property, including property underconstruction or development into, or out of investment property. The amendments state that achange in use occurs when the property meets, or ceases to meet, the definition of investmentproperty and there is evidence of the change in use. A mere change in management’s intentionsfor the use of a property does not provide evidence of a change in use. The amendments shouldbe applied prospectively to changes in use that occur on or after the beginning of the annualreporting period in which the entity first applies the amendments. Retrospective application isonly permitted if this is possible without the use of hindsight.
The Group has assessed the impact of the standard and will apply to its future change in use ofproperties to and from investment property given that it is in the mall and commercial centeroperations.
Philippine Interpretation IFRIC-22, Foreign Currency Transactions and Advance Consideration
The interpretation clarifies that, in determining the spot exchange rate to use on initial recognitionof the related asset, expense or income (or part of it) on the derecognition of a non-monetary assetor non-monetary liability relating to advance consideration, the date of the transaction is the dateon which an entity initially recognizes the nonmonetary asset or non-monetary liability arisingfrom the advance consideration. If there are multiple payments or receipts in advance, then theentity must determine a date of the transactions for each payment or receipt of advanceconsideration. Entities may apply the amendments on a fully retrospective basis. Alternatively,an entity may apply the interpretation prospectively to all assets, expenses and income in itsscope that are initially recognized on or after the beginning of the reporting period in which theentity first applies the interpretation or the beginning of a prior reporting period presented ascomparative information in the consolidated financial statements of the reporting period in whichthe entity first applies the interpretation.
The Group does not expect any effect on its consolidated financial statements upon adoption ofthis interpretation.

- 8 -
*SGVFS028606*
Effective beginning on or after January 1, 2019
Amendments to PFRS 9, Prepayment Features with Negative Compensation
The amendments to PFRS 9 allow debt instruments with negative compensation prepaymentfeatures to be measured at amortized cost or fair value through other comprehensive income.An entity shall apply these amendments for annual reporting periods beginning on or afterJanuary 1, 2019. Earlier application is permitted.
The Group will apply this amendment if there are transactions of this nature in the future. Noneof its current transactions will fall under this feature.
PFRS 16, Leases
PFRS 16 sets out the principles for the recognition, measurement, presentation and disclosure ofleases and requires lessees to account for all leases under a single on-balance sheet model similarto the accounting for finance leases under PAS 17, Leases. The standard includes two recognitionexemptions for lessees – leases of ’low-value’ assets (e.g., personal computers) and short-termleases (i.e., leases with a lease term of 12 months or less). At the commencement date of a lease,a lessee will recognize a liability to make lease payments (i.e., the lease liability) and an assetrepresenting the right to use the underlying asset during the lease term (i.e., the right-of-useasset). Lessees will be required to separately recognize the interest expense on the lease liabilityand the depreciation expense on the right-of-use asset.
Lessees will be also required to remeasure the lease liability upon the occurrence of certain events(e.g., a change in the lease term, a change in future lease payments resulting from a change in anindex or rate used to determine those payments). The lessee will generally recognize the amountof the remeasurement of the lease liability as an adjustment to the right-of-use asset.
Lessor accounting under PFRS 16 is substantially unchanged from today’s accounting underPAS 17. Lessors will continue to classify all leases using the same classification principle as inPAS 17 and distinguish between two types of leases: operating and finance leases.
PFRS 16 also requires lessees and lessors to make more extensive disclosures than underPAS 17.
Early application is permitted, but not before an entity applies PFRS 15. A lessee can choose toapply the standard using either a full retrospective or a modified retrospective approach. Thestandard’s transition provisions permit certain reliefs.
The new lease standard will impact its operating lease agreements with its branch offices whichare currently accounted for as operating leases, which will now require to be recorded as right ofuse asset and the related lease liability. There is no significant impact to the Group as a lessor forits investment portfolio. There will be more disclosures as required by the new standard.
Amendments to PAS 28, Long-term Interests in Associates and Joint Ventures
The amendments to PAS 28 clarify that entities should account for long-term interests in anassociate or joint venture to which the equity method is not applied using PFRS 9. An entity shallapply these amendments for annual reporting periods beginning on or after January 1, 2019.Earlier application is permitted.

- 9 -
*SGVFS028606*
The Group does not expect this amendment to have significant impact to the consolidatedfinancial statements because it does not currently have interests in associates and joint ventures.
Philippine Interpretation IFRIC-23, Uncertainty over Income Tax Treatments
The interpretation addresses the accounting for income taxes when tax treatments involveuncertainty that affects the application of PAS 12 and does not apply to taxes or levies outside thescope of PAS 12, nor does it specifically include requirements relating to interest and penaltiesassociated with uncertain tax treatments.
The interpretation specifically addresses the following:o Whether an entity considers uncertain tax treatments separatelyo The assumptions an entity makes about the examination of tax treatments by taxation
authoritieso How an entity determines taxable profit (tax loss), tax bases, unused tax losses, unused tax
credits and tax rateso How an entity considers changes in facts and circumstances
An entity must determine whether to consider each uncertain tax treatment separately or togetherwith one or more other uncertain tax treatments. The approach that better predicts the resolutionof the uncertainty should be followed.
The Group is currently assessing the impact of adopting this interpretation.
Deferred effectivity
Amendments to PFRS 10 and PAS 28, Sale or Contribution of Assets between an Investor and itsAssociate or Joint Venture
The amendments address the conflict between PFRS 10 and PAS 28 in dealing with the loss ofcontrol of a subsidiary that is sold or contributed to an associate or joint venture. Theamendments clarify that a full gain or loss is recognized when a transfer to an associate or jointventure involves a business as defined in PFRS 3, Business Combinations. Any gain or lossresulting from the sale or contribution of assets that does not constitute a business, however, isrecognized only to the extent of unrelated investors’ interests in the associate or joint venture.
On January 13, 2016, the Financial Reporting Standards Council deferred the original effectivedate of January 1, 2016 of the said amendments until the International Accounting StandardsBoard (IASB) completes its broader review of the research project on equity accounting that mayresult in the simplification of accounting for such transactions and of other aspects of accountingfor associates and joint ventures.
4. Summary of Significant Accounting Policies
Current and Noncurrent ClassificationThe Group presents assets and liabilities in consolidated statement of financial position based oncurrent/noncurrent classification.
An asset is current when:Expected to be realized or intended to be sold or consumed in normal operating cycle;Held primarily for the purpose of trading;

- 10 -
*SGVFS028606*
Expected to be realized within 12 months after reporting date; orCash or cash equivalent unless restricted from being exchanged or used to settle a liability for atleast 12 months after reporting date.
All other assets are classified as noncurrent.
A liability is current when:It is expected to be settled in the normal operating cycle;It is held primarily for the purpose of trading;It is due to be settled within 12 months after reporting date; orThere is no unconditional right to defer the settlement of the liability for at least 12 months afterreporting date.
The Group classifies all other liabilities as noncurrent.
Deferred tax assets and liabilities are classified as noncurrent assets and liabilities, respectively.
Cash and Cash EquivalentsCash includes cash on hand and in banks. Cash equivalents are short-term, highly liquid investmentsthat are readily convertible to known amounts of cash with original maturities of three (3) months orless from dates of placement and that are subject to an insignificant risk of changes in value.
Short-term Cash InvestmentsShort-term cash investments consist of money market placements made for varying periods of morethan three (3) months and up to twelve (12) months. These investments earn interest at the respectiveshort-term rates.
Financial InstrumentsDate of recognitionThe Group recognizes a financial asset or a financial liability in the consolidated statement offinancial position when it becomes a party to the contractual provisions of the instrument. Purchasesor sales of financial assets that require delivery of assets within the time frame established byregulation or convention in the marketplace are recognized on the trade date, which is the date whenthe Group commits to purchase or sell the asset.
Initial recognition of financial instrumentsAll financial assets and financial liabilities are initially recognized at fair value. Except for financialassets and liabilities at fair value through profit or loss (FVPL), the initial measurement of financialassets and liabilities include transaction costs. The Group classifies its financial assets in thefollowing categories: financial assets at FVPL, held-to-maturity (HTM) investments, AFS financialassets, and loans and receivables.
The Group classifies its financial liabilities as financial liabilities at FVPL or other financialliabilities.
The classification depends on the purpose for which the investments were acquired and whether theseare quoted in an active market. The financial assets of the Group are of the nature of loans andreceivable, AFS financial assets and HTM financial assets, while its financial liabilities are of thenature of other financial liabilities. Management determines the classification at initial recognitionand re-evaluates such designation, where allowed and appropriate, at every reporting date.

- 11 -
*SGVFS028606*
Financial instruments are classified as liability or equity in accordance with the substance of thecontractual arrangement. Interest, dividends, gains and losses relating to a financial instrument or acomponent that is a financial liability, are reported as expense or income. Distributions to holders offinancial instruments classified as equity are charged directly to equity, net of any related income taxbenefits.
Fair Value MeasurementThe Group measures AFS financial assets and financial assets at FVPL at fair value at each reportingdate. Also, fair values of loans and receivables, other financial liabilities and non-financial assetsmeasured at cost such as investment properties are disclosed in Notes 12 and 36.
Fair value is the price that would be received to sell an asset or paid to transfer a liability in an orderlytransaction between market participants at the measurement date. The fair value measurement isbased on the presumption that the transaction to sell the asset or transfer the liability takes placeeither:
In the principal market for the asset or liability, orIn the absence of a principal market, in the most advantageous market for the asset or liability.
The principal or the most advantageous market must be accessible to by the Group.
The fair value of an asset or a liability is measured using the assumptions that market participantswould use when pricing the asset or liability, assuming that market participants act in their economicbest interest.
A fair value measurement of a non-financial asset takes into account a market participant’s ability togenerate economic benefits by using the asset in its highest and best use or by selling it to anothermarket participant that would use the asset in its highest and best use.
The Group uses valuation techniques that are appropriate in the circumstances and for whichsufficient data are available to measure fair value, maximizing the use of relevant observable inputsand minimizing the use of unobservable inputs.
All assets and liabilities for which fair value is measured or disclosed in the consolidated financialstatements are categorized within the fair value hierarchy based on the lowest level input that issignificant to the fair value measurement as a whole:
Level 1 – Quoted (unadjusted) market prices in active markets for identical assets or liabilitiesLevel 2 – Valuation techniques for which the lowest level input that is significant to the fair valuemeasurement is directly or indirectly observableLevel 3 – Valuation techniques for which the lowest level input that is significant to the fair valuemeasurement is unobservable
For assets and liabilities that are recognized in the consolidated financial statements on a recurringbasis, the Group determines whether transfers have occurred between Levels in the hierarchy by re-assessing categorization (based on the lowest level input that is significant to the fair valuemeasurement as a whole) at the end of each reporting period.
“Day 1” differenceWhere the transaction price in a non-active market is different from the fair value from otherobservable current market transactions in the same instrument or based on a valuation techniquewhose variables include only data from observable market, the Group recognizes the differencebetween the transaction price and fair value (a “Day 1” difference) in profit or loss under “Interestincome” and “Interest and other financing charges” accounts unless it qualifies for recognition as

- 12 -
*SGVFS028606*
some other type of asset or liability. In cases where fair value is determined using data which is notobservable, the difference between the transaction price and model value is only recognized inprofit or loss when the inputs become observable or when the instrument is derecognized. For eachtransaction, the Group determines the appropriate method of recognizing the “Day 1” differenceamount.
Loans and receivablesLoans and receivables are nonderivative financial assets with fixed or determinable payments that arenot quoted in an active market. They are not entered into with the intention of immediate or short-term resale and are not classified as financial assets held-for-trading, designated as AFS or asfinancial assets at FVPL. Receivables are recognized initially at fair value. After initialmeasurement, loans and receivables are subsequently measured at cost or at amortized cost using theeffective interest method, less allowance for impairment losses. Amortized cost is calculated bytaking into account any discount or premium on acquisition and fees that are an integral part of theeffective interest rate (EIR). The amortization, if any, is included in profit or loss. The losses arisingfrom impairment of receivables are recognized in profit or loss. These financial assets are included incurrent assets if maturity is within twelve (12) months from the financial reporting date. Otherwise,these are classified as noncurrent assets.
This accounting policy applies primarily to the Group’s cash and cash equivalents, short-term cashinvestments, receivables (except for advances to private companies, brokers and contractors),receivables from contractors and cash restricted for use included in other noncurrent assets.
HTM investmentsHTM investments are quoted non-derivative financial assets with fixed or determinable payments andfixed maturities for which management has the positive intention and ability to hold to maturity.Where the Group sells or reclassifies other than an insignificant amount of HTM investments, theentire category would be tainted and reclassified at fair value as AFS financial assets. After initialmeasurement, these financial assets are subsequently measured at amortized cost using the effectiveinterest method, less allowance for impairment. Amortized cost is calculated by taking into accountany discount or premium on acquisition and fees that are an integral part of the EIR. Theamortization is included as part of interest and other income from investments in the consolidatedstatement of comprehensive income. Gains and losses are recognized in profit or loss in theconsolidated statement of comprehensive income when the HTM investments are derecognized. Anyimpairment losses are charged to current operations.
As of December 31, 2017 and 2016, the Group has investments in HTM (Note 9).
AFS financial assetsAFS financial assets are nonderivative financial assets that are designated as such or do not qualify tobe classified or designated as financial assets at FVPL, HTM investments or loans and receivables.These are purchased and held indefinitely, and may be sold in response to liquidity requirements orchanges in market conditions.
After initial measurement, AFS financial assets are subsequently measured at fair value withunrealised gains or losses recognized in OCI and credited to the OCI until the investment isderecognized, at which time, the cumulative gain or loss is recognized in other operating income, orthe investment is determined to be impaired, when the cumulative loss is reclassified from the OCI tothe consolidated statement of comprehensive income in interest and other financing charges. Interestearned whilst holding AFS financial assets is reported as interest income using the EIR method.

- 13 -
*SGVFS028606*
When the investment is disposed of, the cumulative gain or loss previously recognized in OCI isrecognized as gain or loss on disposal in profit or loss. Where the Group holds more than oneinvestment in the same security these are deemed to be disposed of on a first-in first-out basis.Interest earned on holding AFS financial assets are reported as interest and other income frominvestments using the EIR. Dividends earned on holding AFS financial assets are recognized in profitor loss as part of miscellaneous income when the right to receive payment has been established. Thelosses arising from impairment of such investments are recognized as provisions for impairmentlosses in profit or loss.
When the fair value of AFS equity financial assets cannot be measured reliably because of lack ofreliable estimates of future cash flows and discount rates necessary to calculate the fair value ofunquoted equity instruments, these investments are carried at cost, less any impairment losses.
As of December 31, 2017 and 2016, AFS financial assets comprise of unquoted and quoted debt andequity securities. The Group’s AFS financial assets in quoted securities pertain to investments in golfclub shares and fixed maturity bonds while unquoted equity securities pertain to investments inpreferred shares issued by utilities companies.
Other financial liabilitiesOther financial liabilities are initially recognized at the fair value of the consideration received lessdirectly attributable transaction costs.
After initial recognition, other financial liabilities are subsequently measured at amortized cost usingthe effective interest method. Amortized cost is calculated by taking into account any discount orpremium on the issue and fees that are an integral part of the EIR. Gains and losses are recognized inprofit or loss when the liabilities are derecognized (redemption is a form of derecognition), as well asthrough the amortization process. Any effects of restatement of foreign currency-denominatedliabilities are recognized in profit or loss.
The financial liabilities measured at cost are accounts and other payables (except for deferred outputVAT) and payable to related parties and other liabilities. The financial liabilities measured atamortized cost are bank loans, loans payable, liabilities for purchased land, long-term notes and notespayable.
Derecognition of Financial Assets and Financial LiabilitiesFinancial assetA financial asset (or, where applicable, a part of a group of financial assets) is derecognized where:(a) the rights to receive cash flows from the assets have expired; (b) the Group retains the right toreceive cash flows from the asset, but has assumed an obligation to pay them in full without materialdelay to a third-party under a “pass-through” arrangement; or (c) the Group has transferred its right toreceive cash flows from the asset and either: (i) has transferred substantially all the risks and rewardsof the asset, or (ii) has neither transferred nor retained the risks and rewards of the asset but hastransferred control of the asset.
Where the Group has transferred its rights to receive cash flows from an asset or has entered into apass-through arrangement, and has neither transferred nor retained substantially all the risks andrewards of the asset nor transferred control of the asset, the asset is recognized to the extent of theGroup’s continuing involvement in the asset. Continuing involvement that takes the form of aguarantee over the transferred asset is measured at the lower of the original carrying amount of theasset and the maximum amount of consideration that the Group could be required to repay.

- 14 -
*SGVFS028606*
Financial liabilityA financial liability is derecognized when the obligation under the liability is discharged or cancelledor has expired. Where an existing financial liability is replaced by another from the same lender onsubstantially different terms, or the terms of an existing liability are substantially modified, such anexchange or modification is treated as a derecognition of the original liability and the recognition of anew liability, and the difference in the respective carrying amounts is recognized in profit or loss.
Impairment of Financial AssetsThe Group assesses at each financial reporting date whether there is objective evidence that afinancial asset or group of financial assets is impaired. A financial asset or a group of financial assetsis deemed to be impaired if, and only if, there is objective evidence of impairment as a result of oneor more events that has occurred after the initial recognition of the asset (an incurred ‘loss event’) andthat loss event (or events) has an impact on the estimated future cash flows of the financial asset orthe group of financial assets that can be reliably estimated. The fact that title of the real estateproperties are transferred only to the buyer upon full payment of the contract price is considered inthe evaluation of impairment. Evidence of impairment may include indications that the borrower or agroup of borrowers is experiencing significant financial difficulty, default or delinquency in interestor principal payments, and where observable data indicate that there is measurable decrease in theestimated future cash flows, such as changes in arrears or economic conditions that correlate withdefaults.
Financial assets carried at amortized costThe Group first assesses whether an objective evidence of impairment exists individually for financialassets that are individually significant. If there is objective evidence that an impairment loss on afinancial asset carried at amortized cost (i.e., loans and receivables or HTM investments) has beenincurred, the amount of the loss is measured as the difference between the assets’ carrying amountand the present value of the estimated future cash flows discounted at the assets original EIR(excluding future credit losses that have not been incurred). If it is determined that no objectiveevidence of impairment exists for an individually assessed financial asset, the asset, together with theother assets that are not individually significant and were thus not individually assessed forimpairment, is included in a group of financial assets with similar credit risk characteristics and thatgroup of financial assets is collectively assessed for impairment.
Assets that are individually assessed for impairment and for which an impairment loss is or continuesto be recognized are not included in a collective assessment of impairment.
For the purpose of a collective evaluation of impairment, financial assets are grouped on the basis ofcredit risk characteristics such as selling price of the lots and residential houses, past-due status andterm.
Future cash flows in a group of financial assets that are collectively evaluated for impairment areestimated on the basis of historical loss experience for assets with credit risk characteristics similar tothose in the group. Historical loss experience is adjusted on the basis of current observable data toreflect the effects of current conditions that did not affect the period on which the historical lossexperience is based and to remove the effects of conditions in the historical period that do not existcurrently. The methodology and assumptions used for estimating future cash flows are reviewedregularly by the Group to reduce any differences between loss estimates and actual loss experience.
The carrying amount of the asset is reduced through the use of an allowance account and the amountof loss is charged to profit or loss. Financial assets carried at amortized costs, together with theassociated allowance accounts, are written off when there is no realistic prospect of future recoveryand all collateral has been realized. If, in a subsequent year, the amount of the estimated impairment

- 15 -
*SGVFS028606*
loss decreases because of an event occurring after the impairment was recognized, the previouslyrecognized impairment loss is reversed. Any subsequent reversal of an impairment loss is recognizedin profit or loss, to the extent that the carrying value of the asset does not exceed its amortized cost atthe reversal date.
AFS financial assets carried at fair valueFor AFS financial assets, the Group assesses at each reporting date whether there is objectiveevidence that an investment or a group of investments is impaired. In the case of equity investmentsclassified as AFS, objective evidence would include a significant or prolonged decline in the fairvalue of the investment below its cost. ‘Significant’ is evaluated against the original cost of theinvestment and ‘prolonged’ against the period in which the fair value has been below its original cost.When there is evidence of impairment, the cumulative loss - measured as the difference between theacquisition cost and the current fair value, less any impairment loss on that investment previouslyrecognized in the consolidated statement of comprehensive income is removed from OCI andrecognized in the statement of profit or loss. Impairment losses on equity investments are notreversed through profit or loss; increases in their fair value after impairment are recognized in OCI.
The determination of what is ‘significant’ or ‘prolonged’ requires judgement. In making thisjudgement, the Group evaluates, among other factors, the duration or extent to which the fair value ofan investment is less than its cost. In the case of debt instruments classified as AFS, the impairmentis assessed based on the same criteria as financial assets carried at amortized cost. However, theamount recorded for impairment is the cumulative loss measured as the difference between theamortized cost and the current fair value, less any impairment loss on that investment previouslyrecognized in the statement of profit or loss.
Future interest income continues to be accrued based on the reduced carrying amount of the asset,using the rate of interest used to discount the future cash flows for the purpose of measuring theimpairment loss. The interest income is recorded as part of finance income. If, in a subsequent year,the fair value of a debt instrument increases and the increase can be objectively related to an eventoccurring after the impairment loss was recognized in the statement of profit or loss, the impairmentloss is reversed through the statement of profit or loss.
AFS financial assets carried at costIf there is an objective evidence that an impairment loss on an unquoted equity instrument that is notcarried at fair value because its fair value cannot be reliably measured, the amount of the loss ismeasured as the difference between the carrying amount and the present value of estimated futurecash flows discounted at the current market rate of return for a similar financial asset.
Offsetting Financial InstrumentsFinancial assets and financial liabilities are offset and the net amount reported in the consolidatedstatement of financial position if, and only if, there is a currently enforceable legal right to offset therecognized amounts and there is an intention to settle on a net basis, or to realize the asset and settlethe liability simultaneously.
Real Estate InventoriesReal estate inventories consist of subdivision land, residential houses and lots and condominium unitsfor sale and development. These are properties acquired or being constructed for sale in the ordinarycourse of business rather than to be held for rental or capital appreciation. These are held asinventory and are measured at the lower of cost and net realizable value (NRV).

- 16 -
*SGVFS028606*
Cost includes:Acquisition cost of subdivision land;Amounts paid to contractors for construction and development of subdivision land, residentialhouses and lots and condominium units; andCapitalized borrowing costs, planning and design costs, cost of site preparation, professional feesfor legal services, property transfer taxes, construction overheads and other related costs.
NRV is the estimated selling price in the ordinary course of the business, based on market prices atthe reporting date, less costs to complete and the estimated costs of sale. The carrying amount ofinventories is reduced through the use of allowance account and the amount of loss is charged toprofit or loss.
The cost of inventory recognized in profit or loss on disposal is determined with reference to thespecific costs incurred on the property sold and an allocation of any non-specific costs. The totalcosts are allocated pro-rata based on the relative size of the property sold.
Creditable Withholding TaxCreditable withholding tax pertains to taxes withheld on income payments and may be applied againstincome tax due. The balance of taxes withheld is recovered in future period.
Value-Added TaxInput tax represents the VAT due or paid on purchases of goods and services subjected to VAT thatthe Group can claim against any future liability to the BIR for output VAT on sale of goods andservices subjected to VAT. The input tax can also be recovered as tax credit under certaincircumstances against future income tax liability of the Group upon approval of the BIR and/orBureau of Customs. Input tax is stated at its estimated net realizable values. A valuation allowance isprovided for any portion of the input tax that cannot be claimed against output tax or recovered as taxcredit against future income tax liability. Input tax is recorded under current assets in the statement offinancial position.
For its VAT-registered activities, when VAT from sales of goods and/or services (output VAT)exceeds VAT passed on from purchases of goods or services (input VAT), the excess is recognized aspayable in the consolidated statement of financial position. When VAT passed on from purchases ofgoods or services (input VAT) exceeds VAT from sales of goods and/or services (output VAT), theexcess is recognized as an asset in the consolidated statement of financial position up to the extent ofthe recoverable amount.
For its non-VAT registered activities, the amount of VAT passed on from its purchases of goods orservice is recognized as part of the cost of goods/asset acquired or as part of the expense item, asapplicable.
Prepaid ExpensesPrepaid expenses are carried at cost less the amortized portion. These typically compriseprepayments for marketing fees, taxes and licenses, rentals and insurance.
Construction Materials and OthersConstruction materials are valued at the lower of cost or NRV. Cost is determined using the movingaverage method. NRV is the replacement cost.

- 17 -
*SGVFS028606*
Deposit for Real Estate Purchases and OthersDeposit for real estate purchases and others consist of advance payments to land owners which willbe applied against the selling price of the real properties that will be acquired. The application isexpected to be within 12 months after the reporting date.
Project Development CostsProject development costs pertain to costs incurred on various on-going projects under a LandDevelopment Agreements (LDAs) entered into by the Group with individuals, private companies andentities under common control.
Investment PropertiesInvestment properties comprise completed property and property under construction orre-development that are held to earn rentals or for capital appreciation or both. Investment properties,except for land, are carried at cost less accumulated depreciation and amortization and anyimpairment in value. Land is carried at cost less any impairment in value.
Expenditures incurred after the investment property has been put in operation, such as repairs andmaintenance costs, are normally charged against income in the period in which the costs are incurred.
Construction-in-progress (CIP) is stated at cost. This includes cost of construction and other directcosts. CIP is not depreciated until such time as the relevant assets are completed and put intooperational use. Construction-in-progress are carried at cost and transferred to the related investmentproperty account when the construction and related activities to prepare the property for its intendeduse are complete, and the property is ready for occupation.
Depreciation and amortization are computed using the straight-line method over the estimated usefullives (EUL) of the assets, regardless of utilization. The EUL and the depreciation and amortizationmethod are reviewed periodically to ensure that the period and method of depreciation andamortization are consistent with the expected pattern of economic benefits from items of investmentproperties.
The EUL of buildings and building improvements is 10 to 40 years.
Investment properties are derecognized when either they have been disposed of or when theinvestment property is permanently withdrawn from use and no future economic benefit is expectedfrom its disposal. Any gain or loss on the retirement or disposal of an investment property isrecognized in profit or loss in the year of retirement or disposal.
Transfers are made to investment property when there is a change in use, evidenced by ending ofowner-occupation, commencement of an operating lease to another party or ending of construction ordevelopment. Transfers are made from investment property when, and only when, there is a changein use, evidenced by commencement of owner-occupation or commencement of development with aview to sale. Transfers between investment property, owner-occupied property and inventories donot change the carrying amount of the property transferred and they do not change the cost of theproperty for measurement or for disclosure purposes.
Land and ImprovementsLand and improvements consist of property for future development and is carried at the lower of costor NRV. Cost includes acquisition cost and other capitalizable costs incurred on the acquisition of theproperty, as well as those costs incurred for development and improvement of the property.

- 18 -
*SGVFS028606*
Property and EquipmentProperty and equipment are carried at cost less accumulated depreciation and any impairment invalue. The initial cost of property and equipment consists of its purchase price, including importduties, taxes and any directly attributable costs of bringing the asset to its working condition andlocation for its intended use.
Depreciation and amortization of property and equipment commences once the property andequipment are available for use and computed using the straight-line basis over the estimated usefullife of property and equipment as follows:
YearsBuilding and building improvements 10 to 40Transportation equipment 2 to 5Office furniture, fixtures and equipment 2 to 5Construction equipment 2 to 5Other fixed assets 1 to 5
Building improvements are amortized on a straight-line basis over the term of the lease or the EUL ofthe asset, whichever is shorter.
The useful lives and depreciation and amortization method are reviewed annually to ensure that theperiod and method of depreciation and amortization are consistent with the expected pattern ofeconomic benefits from items of property and equipment.
When property and equipment are retired or otherwise disposed of, the cost of the relatedaccumulated depreciation and amortization and accumulated provision for impairment losses, if any,are removed from the accounts and any resulting gain or loss is credited to or charged against currentoperations.
Fully depreciated and amortized property and equipment are retained in the accounts until they are nolonger in use. No further depreciation and amortization is charged against current operations.
Systems Development CostsCosts associated with developing or maintaining computer software programs are recognized asexpense as incurred. Costs that are directly associated with identifiable and unique softwarecontrolled by the Group and will generate economic benefits exceeding costs beyond one year, arerecognized as intangible assets to be measured at cost less accumulated amortization and provisionfor impairment losses, if any.
System development costs recognized as assets are amortized using the straight-line method overtheir useful lives, but not exceeding a period of three years. Where an indication of impairmentexists, the carrying amount of computer system development costs is assessed and written downimmediately to its recoverable amount.
Impairment of Nonfinancial AssetsThis accounting policy relates to property and equipment, investment properties, investment in anassociate, investments in project development costs and a joint venture, model house accessories andsystems development costs.
The Group assesses as at reporting date whether there is an indication that nonfinancial assets may beimpaired. If any such indication exists, or when annual impairment testing for an asset is required,the Group makes an estimate of the asset’s recoverable amount. An asset’s recoverable amount is

- 19 -
*SGVFS028606*
calculated as the higher of the asset’s or cash-generating unit’s fair value less costs to sell and itsvalue in use and is determined for an individual asset, unless the asset does not generate cash inflowsthat are largely independent of those assets or groups of assets. Where the carrying amount of anasset exceeds its recoverable amount, the asset is considered impaired and is written down to itsrecoverable amount. In assessing value in use, the estimated future cash flows are discounted to theirpresent value using a pre-tax discount rate that reflects current market assessment of the time value ofmoney and the risks specific to the asset. Impairment losses of continuing operations are recognizedin profit or loss in those expense categories consistent with the function of the impaired asset.
An assessment is made at each financial reporting date as to whether there is an indication thatpreviously recognized impairment losses may no longer exist or may have decreased. If suchindication exists, the recoverable amount is estimated. A previously recognized impairment loss isreversed only if there has been a change in the estimates used to determine the asset’s recoverableamount since the last impairment loss was recognized. If that is the case, the carrying amount of theasset is increased to its recoverable amount. That increased amount cannot exceed the carryingamount that would have been determined, net of depreciation and amortization, had no impairmentloss been recognized for the asset in prior years. Such reversal is recognized in profit or loss unlessthe asset is carried at revalued amount, in which case the reversal is treated as revaluation increase inOCI. After such reversal, the depreciation and amortization charge is adjusted in future periods toallocate the asset’s revised carrying amount, less any residual value, on a systematic basis over itsremaining useful life.
EquityCapital stock is measured at par value for all shares subscribed, issued and outstanding. When theshares are sold at premium, the difference between the proceeds at the par value is credited to“Additional paid-in capital” account. Direct costs incurred related to equity issuance are chargeableto “Additional paid-in capital” account. If additional paid-in capital is not sufficient, the excess ischarged against retained earnings. When the Group issues more than one class of stock, a separateaccount is maintained for each class of stock and the number of shares issued.
Retained earnings represent accumulated earnings of the Group less dividends declared. It includesthe accumulated equity in undistributed earnings of consolidated subsidiaries which are not availablefor dividends until declared by the subsidiaries.
Own equity instruments which are reacquired (treasury shares) are recognized at cost and deductedfrom equity. No gain or loss is recognized in profit or loss on the purchase, sale, issue or cancellationof the Group’s own equity instruments. Any difference between the carrying amount and theconsideration, if reissued, is recognized in additional paid-in capital. Voting rights related to treasuryshares are nullified for the Group and no dividends are allocated to them respectively. When theshares are retired, the capital stock account is reduced by its par value and the excess of cost over parvalue upon retirement is debited to additional paid-in capital to the extent of the specific or averageadditional paid-in capital when the shares were issued and to retained earnings for the remainingbalance.
The retained earnings is restricted to payments of dividends to the extent of the cost of treasuryshares.
Business Combinations and GoodwillBusiness combinations are accounted for using the acquisition method. The cost of an acquisition ismeasured as the aggregate of the consideration transferred, measured at acquisition date fair value andthe amount of any NCI in the acquiree. For each business combination, the acquirer measures theNCI in the acquiree either at fair value or at the proportionate share of the acquiree’s identifiable net

- 20 -
*SGVFS028606*
assets. Acquisition costs incurred are expensed and included in operating expenses. When the Groupacquires a business, it assesses the financial assets and liabilities assumed for appropriateclassification and designation in accordance with the contractual terms, economic circumstances andpertinent conditions as at the acquisition date. This includes the separation of embedded derivativesin host contracts by the acquiree.
If the business combination is achieved in stages, the acquisition date fair value of the acquirer’spreviously held equity interest in the acquiree is remeasured to fair value at the acquisition datethrough consolidated statement of income. Any contingent consideration to be transferred by theacquirer will be recognized at fair value at the acquisition date. Subsequent changes to the fair valueof the contingent consideration, which is deemed to be an asset or liability, will be recognized inaccordance with PAS 39 either in consolidated statement of income or as a change to OCI. If thecontingent consideration is not within the scope of PAS 39, it is measured in accordance with theappropriate PFRS. Contingent consideration that is classified as equity is not measured andsubsequent settlement is accounted for within equity.
Goodwill is initially measured at cost being the excess of the aggregate of the considerationtransferred and the amount recognized for NCI and any previous interest held over the net identifiableassets acquired and liabilities assumed. If the consideration is lower than the fair value of the netassets of the subsidiary acquired, the difference is recognized in consolidated statement of income.
After initial recognition, goodwill is measured at cost less any accumulated impairment losses. Forthe purpose of impairment testing, goodwill acquired in a business combination is, from theacquisition date, allocated to each of the Group’s cash-generating units that are expected to benefitfrom the combination, irrespective of whether other assets or liabilities of the acquiree are assigned tothose units.
Where goodwill forms part of a cash-generating unit and part of the operation within that unit isdisposed of, the goodwill associated with the operation disposed of is included in the carrying amountof the operation when determining the gain or loss on disposal of the operation. Goodwill disposed ofin this circumstance is measured based on the relative values of the operation disposed of and theportion of the cash-generating unit retained.
If the initial accounting for a business combination can be determined only provisionally by the endof the period in which the combination is effected because either the fair values to be assigned to theacquiree’s identifiable assets, liabilities or contingent liabilities or the cost of the combination can bedetermined only provisionally, the acquirer shall account for the combination using those provisionalvalues. The acquirer shall recognize any adjustments to those provisional values as a result ofcompleting the initial accounting within twelve months of the acquisition date as follows: (i) thecarrying amount of the identifiable asset, liability or contingent liability that is recognized or adjustedas a result of completing the initial accounting shall be calculated as if its fair value at the acquisitiondate had been recognized from that date; (ii) goodwill or any gain recognized shall be adjusted by anamount equal to the adjustment to the fair value at the acquisition date of the identifiable asset,liability or contingent liability being recognized or adjusted; and (iii) comparative informationpresented for the periods before the initial accounting for the combination is complete shall bepresented as if the initial accounting has been completed from the acquisition date.
Revenue and Cost RecognitionRevenue is recognized to the extent that it is probable that the economic benefits will flow and theamount of revenue can be reliably measured. The Parent Company assesses its revenue arrangementsagainst specific criteria in order to determine if it is acting as principal or agent. The Parent Company

- 21 -
*SGVFS028606*
has concluded that it is acting as principal in certain revenue arrangements and as agent in certaintransactions.
Real estate revenueFor real estate sales, the Group assesses whether it is probable that the economic benefits will flow tothe Group when the sales prices are collectible. Collectability of the sales price is demonstrated bythe buyer’s commitment to pay, which in turn is supported by substantial initial and continuinginvestments that give the buyer a stake in the property sufficient that the risk of loss through defaultmotivates the buyer to honor its obligation to the seller. Collectability is also assessed by consideringfactors such as the credit standing of the buyer, age and location of the property.
Revenue from sales of completed real estate projects is accounted for using the full accrual method.In accordance with Philippine Interpretations Committee, Q&A 2006-01, the percentage-of-completion (POC) method is used to recognize income from sales of projects where the Group hasmaterial obligations under the sales contract to complete the project after the property is sold, theequitable interest has been transferred to the buyer, construction is beyond preliminary stage(i.e., engineering, design work, construction contracts execution, site clearance and preparation,excavation and the building foundation are finished, and the costs incurred or to be incurred can bemeasured reliably). Under this method, revenue is recognized as the related obligations are fulfilled,measured principally on the basis of the estimated completion of a physical proportion of the contractwork.
Any excess of collections over the recognized receivables are included in the “Customers’ advancesand deposits” account in the liabilities section of the consolidated statement of financial position.
When a sale of real estate does not meet the requirements for revenue recognition, the sale isaccounted for under the deposit method. Under this method, revenue is not recognized, and thereceivable from the buyer is not recorded. The real estate inventories continue to be reported on theconsolidated statement of financial position as “Real estate inventories” and the related liability asdeposits under “Customers’ advances and deposits”.
Cost of real estate sales is recognized consistent with the revenue recognition method applied. Costof subdivision land and condominium units sold before the completion of the development isdetermined on the basis of the acquisition cost of the land plus its full development costs, whichinclude estimated costs for future development works, as determined by the Group’s in-housetechnical staff.
Income from forfeited reservations and collectionsIncome from forfeited reservation and collections is recognized when the deposits from potentialbuyers are deemed nonrefundable due to prescription of the period for entering into a contracted sale.Such income is also recognized, subject to the provisions of Republic Act 6552, Realty InstallmentBuyer Act, upon prescription of the period for the payment of required amortizations from defaultingbuyers.
Rental incomeRental income from investment property is accounted for on a straight-line basis over the lease term.
Interest incomeInterest is recognized using the effective interest method, i.e, the rate, that exactly discounts estimatedfuture cash receipts through the expected life of the financial instrument to the net carrying amount ofthe financial asset.

- 22 -
*SGVFS028606*
Unearned discount is recognized as income over the terms of the financial assets at amortized cost(i.e., loans and receivables or HTM investments) using the effective interest method and is shown asdeduction for the financial assets.
Dividend and miscellaneous incomeDividend and miscellaneous income are recognized when the Group’s right to receive payment isestablished.
Pension CostDefined benefit planThe net defined benefit liability or asset is the aggregate of the present value of the defined benefitobligation at the end of the reporting period reduced by the fair value of plan assets, adjusted for anyeffect of limiting a net defined benefit asset to the asset ceiling. The asset ceiling is the present valueof any economic benefits available in the form of refunds from the plan or reductions in futurecontributions to the plan.
The cost of providing benefits under the defined benefit plans is actuarially determined using theprojected unit credit (PUC) method.
Defined benefit costs comprise the following:
(a) service cost;(b) net interest on the net defined benefit liability or asset; and(c) remeasurements of net defined benefit liability or asset.
Service costs which include current service costs, past service costs and gains or losses on non-routine settlements are recognized as expense in profit or loss. Past service costs are recognizedwhen plan amendment or curtailment occurs.
Net interest on the net defined benefit liability or asset is the change during the period in the netdefined benefit liability or asset that arises from the passage of time which is determined by applyingthe discount rate based on high quality corporate bonds to the net defined benefit liability or asset.Net interest on the net defined benefit liability or asset is recognized as expense or income in profit orloss.
Remeasurements comprising actuarial gains and losses, return on plan assets and any change in theeffect of the asset ceiling (excluding net interest on defined benefit liability) are recognizedimmediately in OCI in the period in which they arise. Remeasurements are not reclassified to profitor loss in subsequent periods.
Plan assets are assets that are held by a long-term employee benefit fund or qualifying insurancepolicies. Plan assets are not available to the creditors of the Group, nor can they be paid directly tothe Group. Fair value of plan assets is based on market price information. When no market price isavailable, the fair value of plan assets is estimated by discounting expected future cash flows using adiscount rate that reflects both the risk associated with the plan assets and the maturity or expecteddisposal date of those assets (or, if they have no maturity, the expected period until the settlement ofthe related obligations).
The Group’s right to be reimbursed of some or all of the expenditure required to settle a definedbenefit obligation is recognized as a separate asset at fair value when and only when reimbursement isvirtually certain.
- 23 -
*SGVFS028606*
Income TaxesCurrent taxCurrent tax assets and liabilities for the current and prior periods are measured at the amount expectedto be recovered from or paid to the taxation authorities. The tax rates and tax laws used to computethe amount are those that are enacted or substantively enacted by the reporting date.
Deferred taxDeferred tax is provided using the liability method on temporary differences, with certain exceptions,at the reporting date between the tax bases of assets and liabilities and their carrying amounts forfinancial reporting purposes.
Deferred tax liabilities are recognized for all taxable temporary differences, with certain exceptions.Deferred tax liabilities shall be recognized for all taxable temporary differences associated withinvestments in subsidiaries, associates and interests in joint ventures when the timing of reversal ofthe temporary differences can be controlled and it is probable that the temporary differences will notreverse in foreseeable future. Otherwise, no deferred tax liability is set up.
Deferred tax assets are recognized for all deductible temporary differences, carryforward benefit ofunused tax credits from excess of minimum corporate income tax (MCIT) over the regular corporateincome tax and unused net operating loss carryover (NOLCO), to the extent that it is probable thattaxable income will be available against which the deductible temporary differences and carryforwardbenefits of unused tax credits from MCIT and NOLCO can be utilized.
Deferred tax assets shall be recognized for deductible temporary differences associated withinvestments in subsidiaries, associates and interests in joint ventures only to the extent that it isprobable that the temporary differences will reverse in the foreseeable future and taxable profit willbe available against which the temporary differences can be utilized.
The carrying amount of deferred tax assets is reviewed at each financial reporting date and reduced tothe extent that it is no longer probable that sufficient taxable income will be available to allow thedeferred tax assets to be utilized. Unrecognized deferred tax assets are reassessed at each financialreporting date and are recognized to the extent that it has become probable that future taxable incomewill allow the deferred tax asset to be recovered.
Deferred tax assets and liabilities are measured at the tax rate that is expected to apply in the periodwhen the asset is realized or the liability is settled, based on tax rates and tax laws that have beenenacted or substantively enacted at the reporting date.
Deferred tax relating to items recognized outside profit or loss is recognized outside profit or loss inthe consolidated statement of comprehensive income. Deferred tax items recognized in correlation tothe underlying transaction either in other comprehensive income or directly in equity.
Deferred tax assets and deferred tax liabilities are offset if a legally enforceable right exists to set offcurrent tax assets against current tax liabilities, and the deferred taxes relate to the same taxable entityand the same taxation authority.
CommissionsThe Group recognizes commission expense upon receipt of down payment from the buyer comprisinga substantial portion of the contract price and the capacity to pay and credit worthiness of buyers havebeen reasonably established for sales under the deferred cash payment arrangement.

- 24 -
*SGVFS028606*
Borrowing CostsBorrowing costs directly attributable to the acquisition or construction of an asset that necessarilytakes a substantial period of time to get ready for its intended use or sale are capitalized as part of thecost of the respective assets (included in “Real estate inventories” and “Investment properties”accounts in the consolidated statement of financial position). All other borrowing costs are expensedin the period in which they occur. Borrowing costs consist of interest and other costs that an entityincurs in connection with the borrowing of funds.
The interest capitalized is calculated using the Group’s weighted average cost of borrowings afteradjusting for borrowings associated with specific developments. Where borrowings are associatedwith specific developments, the amounts capitalized is the gross interest incurred on those borrowingsless any investment income arising on their temporary investment.
Interest is capitalized from the commencement of the development work until the date of practicalcompletion. The capitalization of finance costs is suspended if there are prolonged periods whendevelopment activity is interrupted. Interest is also capitalized on the purchase cost of a site ofproperty acquired specifically for redevelopment but only where activities necessary to prepare theasset for redevelopment are in progress.
Operating ExpensesOperating expenses constitute costs of administering the business. These are recognized as expenseswhen incurred.
LeasesThe determination of whether an arrangement is, or contains a lease is based on the substance of thearrangement at inception date, and requires an assessment of whether the fulfillment of thearrangement is dependent on the use of a specific asset or assets and the arrangement conveys a rightto use the asset. A reassessment is made after inception of the lease only if one of the followingapplies:
(a) there is a change in contractual terms, other than a renewal or extension of the arrangement; arenewal option is exercised or extension granted, unless that term of the renewal or extensionwas initially included in the lease term;
(b) there is a change in the determination of whether fulfillment is dependent on a specified asset; or(c) there is a substantial change to the asset.
Where a reassessment is made, lease accounting shall commence or cease from the date when thechange in circumstances gave rise to the reassessment for any of the scenarios above, and at the dateof renewal or extension period for the second scenario.
Group as a lesseeLeases where the lessor retains substantially all the risks and benefits of ownership of the asset areclassified as operating leases. Operating lease payments are recognized as an expense in profit or lossin the consolidated statement of comprehensive income on a straight-line basis over the lease term.Indirect costs incurred in negotiating an operating lease are added to the carrying value of the leasedasset and recognized over the lease term on the same bases as the lease income. Minimum leasepayments are recognized on a straight-line basis while the variable rent is recognized as an expensebased on the terms of the lease contract.

- 25 -
*SGVFS028606*
Group as a lessorLeases where the lessor does not transfer substantially all the risks and benefits of ownership of theassets are classified as operating leases. Initial direct costs incurred in negotiating operating leasesare added to the carrying amount of the leased asset and recognized over the lease term on the samebasis as the rental income. Contingent rents are recognized as revenue in the period in which they areearned.
Foreign Currency TranslationEach entity in the Group determines its own functional currency and items included in the financialstatements of each entity are measured using that functional currency. Transactions in foreigncurrencies are initially recorded in the functional currency rate ruling at the date of the transaction.Monetary assets and liabilities denominated in foreign currencies are retranslated at the functionalcurrency rate of exchange ruling at the reporting date. Exchange gains or losses arising from foreignexchange transactions are credited to or charged against operations for the period.
The functional currency of C&P International Limited and VII is the US Dollar. As of reporting date,the assets and liabilities of foreign subsidiaries, with functional currencies other than the functionalcurrency of the Parent Company, are translated into the presentation currency of the Group using theclosing foreign exchange rate prevailing at the reporting date, and their respective income andexpenses at the weighted average rates for the year. The exchange differences arising on thetranslation are recognized in OCI under “Cumulative Translation Adjustment”. On disposal of aforeign operation, the component of OCI relating to that particular foreign operation shall berecognized in profit or loss in the consolidated statement of comprehensive income.
Basic and Diluted Earnings Per Share (EPS)Basic EPS is computed by dividing net income attributable to equity holders of the Parent Companyby the weighted average number of common shares issued and outstanding during the year adjustedfor any subsequent stock dividends declared. Diluted EPS is computed by dividing net incomeattributable to the equity holders of the Parent Company by the weighted average number of commonshares issued and outstanding during the year after giving effect to assumed conversion of potentialcommon shares. The calculation of diluted EPS does not assume conversion, exercise, or other issueof potential common shares that would have an antidilutive effect on earnings per share.
As of December 31, 2017, 2016 and 2015, the Group has no potential dilutive common shares(Note 31).
The basic and diluted EPS for the year ended December 31, 2015 has been retroactively adjusted totake into consideration the effect of the pooling of interest method in accounting the acquisition ofStarmalls Group (Notes 7 and 31).
Segment ReportingThe Group’s operating businesses are organized and managed separately according to the nature ofthe products and services provided, with each segment representing a strategic business unit thatoffers different products and serves different markets. Financial information on operating segments ispresented in Note 6 to the consolidated financial statements.
ProvisionsProvisions are recognized when the Group has a present legal or constructive obligation as a result ofpast events, it is more likely than not that an outflow of resources will be required to settle theobligation, and the amount can be reliably estimated. Provisions are not recognized for futureoperating losses.

- 26 -
*SGVFS028606*
Provisions are measured at the present value of the expenditures expected to be required to settle theobligation using a pre-tax rate that reflects the current market assessment of the time value of moneyand the risk specific to the obligation. Where discounting is used, the increase in the provision due tothe passage of time is recognized as interest expense. Where the Group expects some or all of aprovision to be reimbursed, the reimbursement is recognized only when the reimbursement isvirtually certain. The expense relating to any provision is presented in consolidated statement ofcomprehensive income net of any reimbursement.
ContingenciesContingent liabilities are not recognized in the consolidated financial statements. These are disclosedunless the possibility of an outflow of resources embodying economic benefits is remote. Contingentassets are not recognized in the consolidated financial statements but disclosed when an inflow ofeconomic benefits is probable.
Events After the Financial Reporting DatePost year-end events that provide additional information about the Group’s position at the reportingdate (adjusting events) are reflected in the consolidated financial statements. Any post year-endevents that are not adjusting events are disclosed in the consolidated financial statements whenmaterial.
5. Significant Accounting Judgments and Estimates
The preparation of accompanying consolidated financial statements in compliance with PFRSrequires management to make estimates and assumptions that affect the amounts reported in theconsolidated financial statements and accompanying notes. The estimates and assumptions used inthe consolidated financial statements are based upon management’s evaluation of relevant facts andcircumstances as at the date of the consolidated financial statements. Actual results could differ fromsuch estimates.
Judgments and estimates are continually evaluated and are based on historical experience and otherfactors, including expectations of future events that are believed to be reasonable under thecircumstances.
JudgmentsIn the process of applying the Group’s accounting policies, management has made the followingjudgments, apart from those involving estimations, which have the most significant effect on theamounts recognized in the consolidated financial statements:
Revenue and cost recognitionSelecting an appropriate revenue recognition method for a particular real estate sale transactionrequires certain judgments based on, among others:
Buyer’s commitment on the sale which may be ascertained through the significance of thebuyer’s initial investment; andStage of completion of the project.
Collectability of the sales priceFor real estate sales, the buyer’s commitment is evaluated based on collections, credit standing andhistorical collection from buyers. In determining whether the sales prices are collectible, the Groupconsiders that initial and continuing investments by the buyer of about 5% would demonstrate thebuyer’s commitment to pay.

- 27 -
*SGVFS028606*
Classification of financial instrumentsThe Group exercises judgment in classifying a financial instrument, or its component parts, on theinitial recognition as a financial asset, a financial liability or an equity instrument in accordance withthe substance of the contractual arrangement and the definitions of a financial asset, a financialliability or an equity instrument. The substance of the financial instrument, rather than its legal form,governs its classification in the consolidated statements of financial position.
In addition, the Group classifies financial assets by evaluating, among other, whether the asset isquoted or not in an active market. Included in the evaluation on whether a financial asset is quoted inan active market is the determination of whether quoted prices are readily and regularly available, andwhether those prices represent actual and regularly occurring market transactions on an arm’s lengthbasis.
The Group classifies certain quoted nonderivative financial assets with fixed or determinablepayments and fixed maturities as HTM investments. This classification required significantjudgment. In making this judgment, the group evaluates its intention and ability to hold suchinvestments to maturity. If the Group fails to keep these investments to maturity other than in certainspecific circumstances, the Group will be required to reclassify the entire portfolio as AFS financialassets. Consequently, the investment would therefore be measured at fair value and not at amortizedcost.
Distinction between real estate inventories and land and improvementsThe Group determines whether a property will be classified as Real estate inventories or Land andimprovements. In making this judgment, the Group considers whether the property will be sold in thenormal operating cycle (Real estate inventories) or whether it will be retained as part of the Group’sstrategic landbanking activities for development or sale in the medium or long-term (Land andimprovements).
Operating lease commitments - the Group as lesseeThe Group has entered into contract of lease for some of the office space it occupies. The Group hasdetermined that all significant risks and benefits of ownership on these properties will be retained bythe lessor. In determining significant risks and benefits of ownership, the Group considered, amongothers, the significance of the lease term as compared with the EUL of the related asset. The Groupaccordingly accounted for these as operating leases.
Operating lease commitments - the Group as lessorThe Group has entered into commercial property leases on its investment property portfolio. TheGroup has determined that it retains all significant risks and rewards of ownership of these propertiesas the Group considered among others the length of the lease term as compared with the EUL of theassets.
Classification of property as investment property or real estate inventoriesThe Group determines whether a property is classified as investment property or real estate inventoryas follows:
Investment property comprises land and buildings (principally offices, commercial and retailproperty) which are not occupied substantially for use by, or in the operations of, the Group, norfor sale in the ordinary course of business, but are held primarily to earn rental income and capitalappreciation.

- 28 -
*SGVFS028606*
Real estate inventory comprises property that is held for sale in the ordinary course of business.Principally, this is residential and commercial property that the Group develops and intends tosell before or on completion of construction.
Distinction between investment properties and land and improvementsThe Group determines a property as investment property if such is not intended for sale in theordinary course of business, but are held primarily to earn rental income and capital appreciation.Land and improvements comprise property that is retained as part of the Group’s strategiclandbanking activities for development and sale in the medium or long-term.
Business CombinationThe Group determined that Starmalls and its subsidiaries are under common control and accountedthe acquisition of Starmalls Group under the pooling of interest method. No goodwill is recognized(Note 7).
The Group determined that Malay Resorts is not under common control and accounted the acquisitionof Malay Resorts under the acquisition method. The Group determines whether there are separateintangible assets and contingent liabilities and assessed that there are none at acquisition date.Goodwill arising from this business combination amounted to P=147.27 million (Note 7).
Management’s Use of EstimatesThe key assumptions concerning the future and other key sources of estimation uncertainty at thereporting date, that have a significant risk of causing a material adjustment to the carrying amounts ofassets and liabilities within the next financial year are discussed below.
Revenue and cost recognitionThe assessment process for the percentage of completion (POC) and the estimated projectdevelopment costs requires technical determination by management’s specialists (project engineers)and involves significant management judgment. The Group applies the POC method in determiningreal estate revenue and costs. For residential house and lots and condominium units, the POC isbased the physical proportion of work determined based on the bill of quantities applied to theconstruction. The cost of sales is determined based on the estimated project development costsapplied with the respective project’s POC.
The related balances from real estate transactions follow:
2017 2016 2015Real estate sales P=27,594,357,784 P=25,025,209,355 P=24,502,151,823Costs of real estate sales
(Notes 11 and 26) 13,303,578,388 12,320,996,040 12,253,889,631
Determining fair values of financial assets and liabilitiesFair value determinations for financial assets and liabilities are based generally on listed marketprices or broker or dealer quotations. If prices are not readily determinable or if liquidating thepositions is reasonably expected to affect market prices, fair value is based on either internalvaluation models or management’s estimate of amounts that could be realized under current marketcondition, assuming an orderly liquidation over a reasonable period of time. Fair value disclosuresare provided in Note 32.

- 29 -
*SGVFS028606*
Impairment of loans and receivablesThe Group reviews its receivables on a periodic basis to assess impairment of receivables at anindividual and collective level. In assessing for impairment, the Group determines whether there isany objective evidence indicating that there is a measurable decrease in the estimated future cashflows of its loans and receivables. This evidence may include observable data indicating that therehas been an adverse change in the payment status of borrowers, or industry-wide or local economicconditions that correlate with defaults on receivables. These factors include, but are not limited toage of balances, financial status of counterparties, payment behavior and known market factors. TheGroup reviews the age and status of receivables, and identifies individually significant accounts thatare to be provided with allowance.
For the purpose of a collective evaluation of impairment, loans are grouped on the basis of such creditrisk characteristics as type of borrower, collateral type, past-due status and term.
The amount and timing of recorded expenses for any period would differ if the Group made differentjudgments or utilized different estimates. An increase in allowance for impairment would increaserecorded expenses and decrease net income.
Loans and receivables, net of allowance for impairment losses, amounted to P=44,182.47 million andP=37,541.67 million as of December 31, 2017 and 2016, respectively. The allowance for impairmenton loans and receivables amounted to P=397.15 million and P=393.34 million as of December 31, 2017and 2016, respectively (Note 10).
Evaluation of net realizable value of real estate inventories and land and improvementsReal estate inventories and land and improvements are valued at the lower of cost or NRV. Thisrequires the Group to make an estimate of the real estate for sale inventories and land andimprovements’ estimated selling price in the ordinary course of business, cost of completion andcosts necessary to make a sale to determine the NRV. The Group adjusts the cost of its real estateinventories and land and improvements to NRV based on its assessment of the recoverability of theseassets. In determining the recoverability of these assets, management considers whether these assetsare damaged, if their selling prices have declined and management’s plan in discontinuing the realestate projects. Estimated selling price is derived from publicly available market data and historicalexperience, while estimated selling costs are basically commission expense based on historicalexperience. Management would also obtain the services of an independent appraiser to determine thefair value of undeveloped land based on the latest selling prices of the properties of the samecharacteristics of the land and improvements.
Real estate inventories amounted to P=26,333.86 million and P=22,954.66 million as ofDecember 31, 2017 and 2016, respectively (Note 11). Land and improvements amounted toP=35,029.90 million and P=30,486.62 million as of December 31, 2017 and 2016, respectively(Note 13).

- 30 -
*SGVFS028606*
Fair value of financial instrumentsWhere the fair values of financial assets and financial liabilities recorded in the consolidatedstatements of financial position cannot be derived from active markets, they are determined usinginternal valuation techniques using generally accepted market valuation models. The inputs to thesemodels are taken from observable markets where possible, but where this is not feasible estimates areused in establishing fair values. These estimates may include considerations of liquidity, volatility,and correlation. Certain financial assets and liabilities were initially recorded at its fair value byusing the discounted cash flow methodology. See Note 32 to the consolidated financial statementsfor the related balances.
6. Segment Information
For management purposes, the Group’s operating segments are organized and managed separatelyaccording to the nature of the products provided, with each segment representing a strategic businessunit that offers different products and serves different markets. The Group has three reportableoperating segments as follows:
Horizontal ProjectsThis segment pertains to the development and sale of residential lots and units across the Philippines.
Vertical ProjectsThis segment caters on the development and sale of residential high-rise condominium projects acrossthe Philippines.
Commercial and othersThis segment pertains to rental of malls and commercial spaces and activities of holding companies.
Management monitors the operating results of its business units separately for the purpose of makingdecisions about resource allocation and performance assessment. Segment performance is evaluatedbased on segment operating income or loss before income tax and earnings before income tax,depreciation and amortization (EBITDA). Segment operating income or loss before income tax isbased on the same accounting policies as consolidated operating income or loss. No operatingsegments have been aggregated to form the above reportable operating business segments. The chiefoperating decision-maker (CODM) has been identified as the chief executive officer. The CODMreviews the Group’s internal reports in order to assess performance of the Group.
Transfer prices between operating segments are on an arm’s length basis in a manner similar totransactions with third parties.
The amount of segment assets and liabilities are based on the measurement principles that are similarwith those used in measuring the assets and liabilities in the consolidated statements of financialposition which is in accordance with PFRS. The segment assets are presented separately from thereceivables from related parties, AFS financial assets, HTM investments and deferred taxes. Segmentliability are presented separately from the deferred tax liabilities.

- 31 -
*SGVFS028606*
The financial information about the operations of these operating segments is summarized below:
December 31, 2017
Horizontal VerticalCommercial
and OthersIntersegmentAdjustments Consolidated
(Amounts in thousands)Real estate revenue (Note 25) P=22,694,640 P=4,899,718 P= P= P=27,594,358Rental income 189,619 5,511,922 (76,314) 5,625,227Miscellaneous income (Note 25) 745,083 101,196 423,320 (193,014) 1,076,585
23,439,723 5,190,533 5,935,242 (269,328) 34,296,170Costs and operating expenses* 15,011,849 3,539,109 1,660,692 (132,339) 20,079,311Segment income (loss) before income tax 8,427,874 1,651,424 4,274,551 (136,989) 14,216,859Interest income (Note 24) 983,334 26,814 1,227,779 (491,770) 1,746,157EBITDA 9,411,208 1,678,238 5,502,330 (628,759) 15,963,016Interest and other financing charges (Note 24) (3,115,027) (157,875) (111,343) (3,384,245)Depreciation and amortization (Notes 14, 15, 17
and 26) (138,434) (43,169) (1,123,553) (1,305,156)Income before income tax P=6,157,747 P=1,477,194 P=4,267,434 (P=628,759) P=11,273,615Provision for income tax (Note 29) 947,229 386,448 877,168 2,210,845Net income P=5,210,518 P=1,090,746 P=3,390,266 (P=628,759) P=9,062,770Other InformationSegment assets P=98,032,243 P=21,125,737 P=60,004,261 (P=13,457,817) P=165,704,424Receivables from related parties (Notes 30 and 33) (25,710,011) (6,991,721) 37,689,662 4,987,930AFS financial assets (Note 9) 6,612,942 6,612,942HTM investments (Note 9) 21,827,289 21,827,289Deferred tax assets - net (Note 29) 349,669 39,124 413,353 802,146Total Assets P=72,671,901 P=14,173,140 P=126,547,506 (P=13,457,817) P=199,934,731Segment liability P=94,725,639 P=6,422,508 P=12,979,064 (P=1,416,791) P=112,710,420Deferred tax liabilities - net (Note 29) 1,416,792 315,877 1,483,699 3,216,368Total Liability P=97,506,478 P=6,738,385 P=14,462,764 (P=1,416,791) P=115,926,788Capital expenditures** P=24,074,040 P=4,248,360 P=9,072,600 P= P=37,395,000Depreciation and amortization (Notes 14, 15, 17
and 26) 138,434 43,169 1,123,554 1,305,157Provision for impairment losses (Note 26) 3,683 3,683
December 31, 2016
Horizontal VerticalCommercial
and OthersIntersegmentAdjustments Consolidated
(Amounts in thousands)Real estate revenue P=21,218,234 P=3,806,975 P=– P=– P=25,025,209Rental income 4,432,991 (57,665) 4,375,326Miscellaneous income (Note 25) 742,807 147,574 120,868 (58,741) 952,508
21,961,041 3,954,549 4,553,859 (116,406) 30,353,043Costs and operating expenses* 14,556,056 2,947,945 1,481,222 (92,373) 18,892,850Segment income (loss) before income tax 7,404,985 1,006,604 3,072,637 (24,033) 11,460,193Interest income (Note 24) 1,460,035 35,697 3,063,399 (3,077,799) 1,481,332EBITDA 8,865,020 1,042,301 6,136,036 (3,101,832) 12,941,525Interest and other financing charges (Note 24) (2,707,764) (222,901) (298,276) 1,000,000 (2,228,941)Depreciation and amortization (Notes 14, 15, 17
and 26)(222,185) (34,513) (773,282) (1,029,980)
Income before income tax 5,935,071 784,887 5,064,478 (2,101,832) 9,682,604Provision for income tax (Note 29) 932,733 (55,373) 704,875 1,582,235Net income P=5,002,338 P=840,260 P=4,359,603 (P=2,101,832) P=8,100,369Other InformationSegment assets P=58,039,357 P=6,275,771 P=31,912,438 P=45,090,158 P=141,317,724Receivables from related parties (Notes 30 and 33) 8,148,875 (4,565,888) 333,682 3,916,669AFS financial assets (Note 9) 11,968,496 (3,723,431) 8,245,065HTM investments (Note 9) 20,851,608 20,851,608Deferred tax assets - net (Note 29) 437,179 437,179Total Assets P=66,188,232 P=1,709,883 P=65,503,403 P=41,366,727 P=174,768,245Segment liability P=88,733,513 (P=6,231,300) P=13,702,551 P=2,532 P=96,207,296Deferred tax liabilities - net (Note 29) 1,552,865 24,281 843,589 (355,093) 2,065,642Total Liability P=90,286,378 (P=6,207,019) P=14,546,140 (P=352,561) P=98,272,938Capital expenditures** P=20,106,300 P=3,388,000 P=7,429,020 P= P=30,923,320Depreciation and amortization (Notes 14, 15, 17
and 26) 222,185 34,513 773,282 1,029,980Provision for impairment losses (Note 26) 1,974 1,974

- 32 -
*SGVFS028606*
December 31, 2015
Horizontal VerticalCommercial
and OthersIntersegmentAdjustments Consolidated
(Amounts in Thousands)Real estate revenue P=20,156,987 P=4,345,165 P=– P=– P=24,502,152Rental income – 2,410,194 (42,309) 2,367,885Miscellaneous income (Note 25) 334,922 125,862 828,605 (20,801) 1,268,588
20,491,909 4,471,027 3,238,799 (63,110) 28,138,625Costs and operating expenses* 13,071,284 3,370,012 1,992,357 136,903 18,570,556Segment income (loss) before income tax 7,420,625 1,101,015 1,246,442 (200,013) 9,568,069Interest income (Note 24) 683,143 30,355 589,768 – 1,303,266Others (Notes 9, 16, 21 and 27) 194,204 – 5,743,291 (5,944,513) (7,018)EBITDA 8,297,972 1,131,370 7,579,501 (6,144,526) 10,864,317Interest and other financing charges (Note 24) (156,103) (179,005) (3,054,882) 1,512,595 (1,877,395)Depreciation and amortization (Notes 14, 15, 17 and 26) (222,441) (76,619) (499,860) (798,920)Income before income tax 7,919,428 875,746 4,024,759 (4,631,931) 8,188,002Provision for income tax (Note 29) 913,068 30,593 412,431 (355,093) 1,000,999Net income P=7,006,360 P=845,153 P=3,548,315 (4,276,838) P=7,187,003Other InformationSegment assets P=69,338,387 P=14,241,712 P=127,804,018 (P=83,105,640) P=128,278,477Receivables from related parties (Notes 30 and 33) 21,249,133 (4,011,665) (13,813,881) 2,163 3,425,750AFS financial assets (Note 9) (3,803,394) – 7,245,756 3,936,605 7,378,967HTM investments (Note 9) – – 13,521,560 – 13,521,560Deferred tax assets - net (Note 29) – – 290,024 – 290,024Total Assets P=86,784,126 P=10,230,047 P=135,047,477 (P=79,166,872) P=152,894,778Segment liability P=41,839,502 (P=3,370,613) P=43,592,930 (P=669,298) P=81,392,521Deferred tax liabilities - net (Note 29) 1,507,071 321,459 39,314 (330,677) 1,537,167Total Liability P=43,346,573 P=(3,049,154) P=43,632,244 (P=999,975) P=82,929,688Capital expenditures** P=20,654,000 P=4,506,000 P=6,339,583 P=– P=31,499,583Depreciation and amortization (Notes 14, 15, 17 and 26) 222,441 76,619 499,860 – 798,920Provision for impairment losses (Note 26) – – 50,545 – 50,545
Capital expenditure consists of construction costs, land acquisition and land development costs.
The Group has no revenue from transactions with a single external customer amounting to 10% ormore of the Group’s revenue.
7. Business Combinations
Acquisition of Starmalls GroupStarmalls, Inc. was incorporated in the Philippines and duly registered with the SEC onOctober 16, 1969, originally to pursue mineral exploration. After obtaining SEC approval, Starmalls,Inc. later changed its primary business and is now presently engaged in holding investments in sharesof stock and real estate business. Prior to the acquisition of VLLI, Starmalls, Inc. is 30.50% ownedby Fine Properties, Inc. (Fine) and 69.50% owned by PCD Nominee Corporation and other entitiesand individuals. The shares of stock of Starmalls, Inc. are listed at the PSE.
On November 10, 2015, VLLI signed an agreement with the existing shareholders of Starmalls Groupand acquired approximately 88.34% or 7,443.19 million shares of the outstanding capital stock ofStarmalls, Inc. for a total consideration of P=33,537.36 million. Starmalls, Inc. has subsidiariesnamely Manuela Corporation and Masterpiece Asia Properties, Inc. with the following percentages ofownership:
Masterpiece Asia Properties, Inc. (MAPI) 100.00%Manuela Corporation (Manuela) 98.36%

- 33 -
*SGVFS028606*
Upon execution of the agreement, VLLI paid P=2,681.25 million to Fine. As a condition to theacquisition of Starmalls Group, Fine invested the 97.50% of the total consideration from the disposalor P=32,698.93 million representing 4,573.28 million shares of VLLI at P=7.15 per share. The shareswere issued out of VLLI’s increase in its authorized capital stock which was approved by the SEC onNovember 11, 2015.
Starmalls, Inc. and its subsidiaries became subsidiaries of VLLI as at December 31, 2015.
Both VLLI and Starmalls Group are entities under common control of Fine. Accordingly, VLLIaccounted for the acquisition of Starmalls Group under the pooling-of-interest method of accounting.
Under the pooling-of-interest method, VLLI accounted the acquisition as follows:Assets and liabilities reflected as at reporting date is the combined assets and liabilities ofStarmalls Group and Vista Group using their existing historical carrying values prior to theacquisition;Retained earnings reflects the accumulated earnings of Vista Group and the earnings of StarmallsGroup as if the entities had always been combined;Capital stock represents the legal capital of VLLI;The difference between the consideration for the acquisition and the legal capital of Starmalls thatamounted to P=22,859.08 million is accounted for as “equity reserve” which was eventually closedto additional paid-in capital.
The 752.21 million VLLI shares in the amount of P=5,378.29 million issued to Manuela which it heldas of December 31, 2015 have been presented as treasury shares in the consolidated statements offinancial position and consolidated statements of changes in equity as of and for the year endedDecember 31, 2015. Manuela still holds the VLLI shares as of December 31, 2017.
Acquisition of Malay Resorts Holdings, Inc.On December 29, 2015, Vista Leisure Club Corporation acquired 100% ownership of Malay ResortsHoldings, Inc. (Malay Resorts) for a total cash consideration of P=157.00 million. Malay Resortsowns and operates the Boracay Sands Hotel. Accordingly, the Group accounted the businesscombination under the acquisition method.
Below is a summary of the fair values of assets acquired and liabilities assumed as of date ofacquisition:
AssetsCash and cash equivalents P=12,825,797Trade receivables 3,443,198Property and equipment 166,829,102Other assets 2,580,316
185,678,413LiabilitiesAccounts and other payables 31,693,123Payable to related parties 119,841,731Deferred tax liabilities - net 24,415,579
175,950,433Net assets 9,727,980Goodwill 147,272,020Acquisition cost P=157,000,000

- 34 -
*SGVFS028606*
The cost of acquisition is determined as follows:
Cash paid P=157,000,000Fair value of equity interest in Malay Resorts held before business
combinationP=157,000,000
Cash on acquisition follows:
Cash paid P=157,000,000Cash acquired from Malay Resorts 12,825,797Net cash outflow P=144,174,203
From the date of acquisition on December 29, 2015, the Group’s share in the revenue and net loss ofMalay Resorts amounted to nil. If the combination had taken place at the beginning of 2015, theGroup’s share in the revenue and net loss of Malay Resorts would have been P=22.27 million andP=6.39 million, respectively.
8. Cash and Cash Equivalents
This account consists of:
2017 2016Cash on hand P=15,121,766 P=22,563,506Cash in banks 10,642,888,364 5,676,944,237Cash equivalents 836,501,312 3,203,030,195
P=11,494,511,442 P=8,902,537,938
Cash in banks earn interest at the prevailing bank deposit rates. Cash equivalents are short-term,highly liquid investments that are made for varying periods of up to three (3) months depending onthe immediate cash requirements of the Group and earn interest as follows:
2017 2016 2015Philippine Peso 0.10% to 2.75% 0.10% to 5.00% 1.00% to 2.00%US Dollar 0.10% to 2.50% 0.13% to 3.00% 1.38% to 2.00%
Interest earned from cash in banks and cash equivalents for the years ended December 31, 2017, 2016and 2015 amounted to P=51.70 million, P=139.69 million and P=67.89 million, respectively (Note 24).
No cash and cash equivalents are used to secure the obligations of the Group.
Subsequently, on January 5, 2018, cash in bank amounting to P=4,140.00 million were invested inHTM investments and short term cash investments.
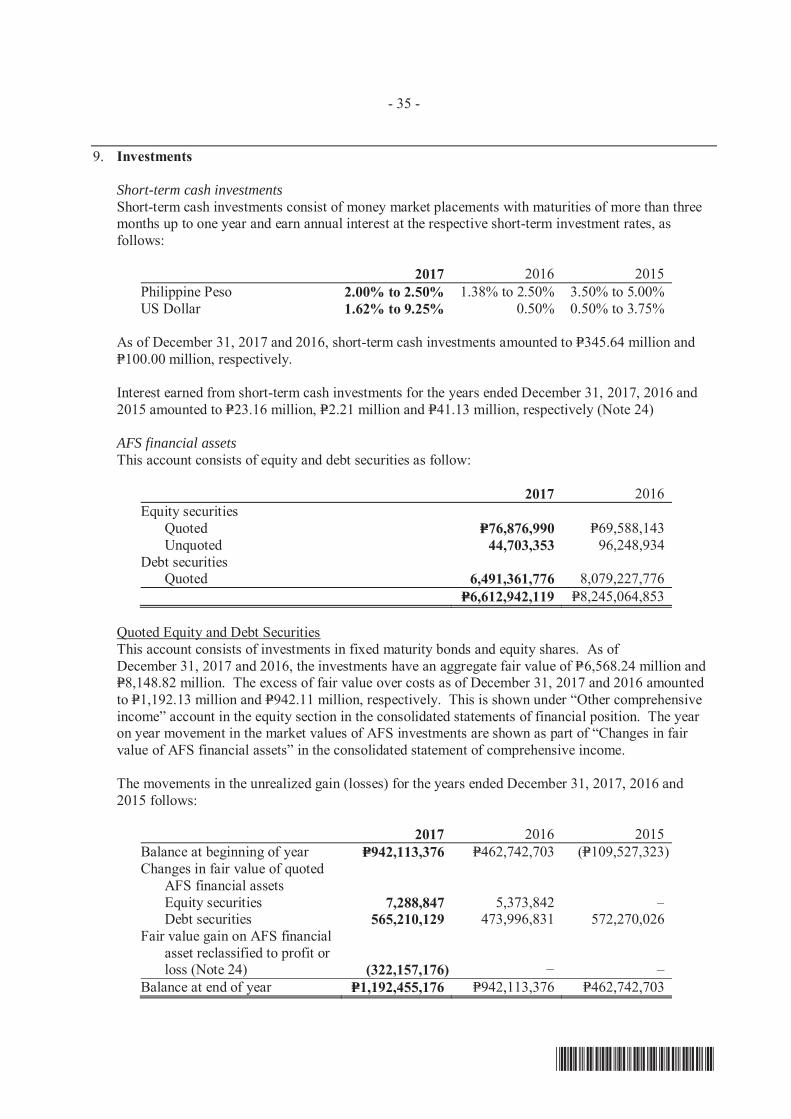
- 35 -
*SGVFS028606*
9. Investments
Short-term cash investmentsShort-term cash investments consist of money market placements with maturities of more than threemonths up to one year and earn annual interest at the respective short-term investment rates, asfollows:
2017 2016 2015Philippine Peso 2.00% to 2.50% 1.38% to 2.50% 3.50% to 5.00%US Dollar 1.62% to 9.25% 0.50% 0.50% to 3.75%
As of December 31, 2017 and 2016, short-term cash investments amounted to P=345.64 million andP=100.00 million, respectively.
Interest earned from short-term cash investments for the years ended December 31, 2017, 2016 and2015 amounted to P=23.16 million, P=2.21 million and P=41.13 million, respectively (Note 24)
AFS financial assetsThis account consists of equity and debt securities as follow:
2017 2016Equity securities
Quoted P=76,876,990 P=69,588,143Unquoted 44,703,353 96,248,934
Debt securitiesQuoted 6,491,361,776 8,079,227,776
P=6,612,942,119 P=8,245,064,853
Quoted Equity and Debt SecuritiesThis account consists of investments in fixed maturity bonds and equity shares. As ofDecember 31, 2017 and 2016, the investments have an aggregate fair value of P=6,568.24 million andP=8,148.82 million. The excess of fair value over costs as of December 31, 2017 and 2016 amountedto P=1,192.13 million and P=942.11 million, respectively. This is shown under “Other comprehensiveincome” account in the equity section in the consolidated statements of financial position. The yearon year movement in the market values of AFS investments are shown as part of “Changes in fairvalue of AFS financial assets” in the consolidated statement of comprehensive income.
The movements in the unrealized gain (losses) for the years ended December 31, 2017, 2016 and2015 follows:
2017 2016 2015Balance at beginning of year P=942,113,376 P=462,742,703 (P=109,527,323)Changes in fair value of quoted
AFS financial assetsEquity securities 7,288,847 5,373,842Debt securities 565,210,129 473,996,831 572,270,026
Fair value gain on AFS financialasset reclassified to profit orloss (Note 24) (322,157,176)
Balance at end of year P=1,192,455,176 P=942,113,376 P=462,742,703

- 36 -
*SGVFS028606*
In 2017, the Group disposed AFS financial assets amounting to US$36.53 million(P=1,830.92 million). The unrealized gain amounting to P=322.16 million previously recognized underother comprehensive income were reclassified to profit or loss upon realization (Note 24).
Details on the quoted debt securities follow:
2017 2016Balance at beginning of year P=8,079,227,776 P=7,207,755,740Acquisition during the year 397,475,205Maturity during the year (1,830,918,953)
6,248,308,823 7,605,230,945Changes in fair value of AFS during the year 243,052,953 473,996,831
P=6,491,361,776 P=8,079,227,776
The investments in fixed maturity bonds will mature in December 2018.
Unquoted Equity SecuritiesThis account pertains to unlisted common shares in a private company and unlisted preferred sharesin a public utility company which the Group will continue to carry as part of the infrastructure that itprovides for its real estate development projects and other operations. These are carried at cost lessimpairment, if any.
The rollforward in this account follows:
2017 2016Balance at beginning of year P=96,248,934 P=96,248,934Disposals during the year (51,545,581)Balance at end of year P=44,703,353 P=96,248,934
HTM investmentsThis account consists of the Group’s investments in various US dollar-denominated debt securitieswith annual interest rates ranging from 3.75% to 4.25%. Interest income from HTM investmentsamounted to P=800.88 million, P=721.02 million and P=482.51 million in 2017, 2016 and 2015,respectively (Note 24).
In 2017 and 2016, no impairment losses were recognized on these investments.
The following presents the breakdown of debt securities classified as HTM investments bycontractual maturity dates as of December 31, 2017 and 2016.
2017 2016Due in one (1) year or less P=8,133,258,592 P=1,709,730,739Due after one (1) year through five (5) years 13,694,030,855 19,141,877,715
P=21,827,289,447 P=20,851,608,454
In 2017 and 2016, the Group acquired additional HTM investments amounting to US$79.30 millionand US$162.93 million, respectively, with EIR ranging from 2.82% to 4.80%.

- 37 -
*SGVFS028606*
HTM investments amounting to $383.50 million and $321.50 million are used to secure the bankloans of the Parent Company amounting to P=17,625.30 million and P=13,551.25 million as ofDecember 31, 2017 and 2016, respectively. The fair values of the investments used as collateralamounted to P=19,135.67 million and P=15,984.98 million as of December 31, 2017 and 2016,respectively (Note 20).
10. Receivables
This account consists of:
2017 2016Installment contracts receivable (Note 20) P=30,943,358,823 P=28,123,412,383Accrued interest receivable 274,834,603 250,598,211Accounts receivable:
Tenants (Note 30) 5,944,584,625 4,268,332,632Buyers 360,536,823 393,680,822Home Development Mutual Fund (HDMF) 231,038,059 34,518,461Others 638,423,712 521,809,631
Advances to:Contractors 4,623,934,231 3,053,343,074Private companies 695,538,326 527,497,584Suppliers 611,979,060 516,783,255Brokers 255,266,011 245,038,144
44,579,494,273 37,935,014,197Less allowance for impairment losses 397,026,438 393,343,094
44,182,467,835 37,541,671,103Less noncurrent portion 6,517,705,884 9,212,259,033
P=37,664,761,951 P=28,329,412,070
Installment Contracts ReceivableInstallment contracts receivable consist of accounts collectible in equal monthly installments withvarious terms up to a maximum of 15 years. These are carried at amortized cost. The correspondingtitles to the subdivision or condominium units sold under this arrangement are transferred to thebuyers only upon full payment of the contract price. The installment contracts receivable areinterest-bearing except for those with installment terms within two years. Annual interest rates oninstallment contracts receivables range from 12.00% to 19.00%. Total interest income recognizedamounted to P=476.09 million, P=609.08 million and P=672.34 million in 2017, 2016 and 2015,respectively (Note 24).
In 2017 and 2016 installment contracts receivables with a total nominal amount of P=1,614.72 millionand P=1,622.28 million, respectively, were recorded at amortized cost amounting to P=1,519.82 millionand P=1,584.10 million, respectively. These are installment contracts receivables that are to becollected in two years which are noninterest-bearing. The fair value upon initial recognition isderived using discounted cash flow model using the discount rates ranging from 3.08% to 4.90% forthose recognized in 2017 and 2.82% to 5.04% for those recognized in 2016.
Interest income recognized from these receivables amounted to P=67.43 million, P=33.56 million, andP=37.94 million in 2017, 2016 and 2015, respectively (Note 24). The unamortized discount amountedto P=70.36 million and P=42.90 million as of December 31, 2017 and 2016, respectively.

- 38 -
*SGVFS028606*
Rollforward in unamortized discount arising from noninterest-bearing receivables is as follows:
2017 2016Balance at beginning of year P=42,896,377 P=38,281,459Additions 94,896,359 38,177,053Accretion (Note 24) (67,428,832) (33,562,135)Balance at end of year P=70,363,904 P=42,896,377
Accounts Receivable:The accounts receivables are non-interest bearing and collectible within one year.
This consists of the following:
Receivable from tenantsReceivables from tenants represent the outstanding receivables arising from the lease of commercialspaces relating to the Group’s mall and BPO operations and are collectible within 30 days frombilling date. These are covered by security deposit of tenants’ equivalent to three-month rental andthree-month advance rental paid by the lessees. This includes both the fixed and contingent portionof lease.
Receivable from buyersReceivables from buyers represent the share of the joint venture partners from the sold real estateinventories that are yet to be collected. The arrangement is covered by a marketing agreement that isseparate and distinct from LDA. These sales do not form part of the Group's revenue and has acorresponding recorded liability. Collections from buyers are remitted to the joint venture partnersnet of any marketing fees agreed by the parties under the LDA.
Receivable from HDMFReceivable from HDMF pertains to amounts retained by HDMF from the proceeds of loans availedby real estate buyers. This amount is released by HDMF upon the release of the related title to theproperty by the Group to HDMF within a six-month to one year period from loan takeout date.
OthersOther receivables consist mainly of nontrade receivables from private entities and various individuals.These are non-interest bearing and are due and demandable.
Advances to private companiesAdvances to private companies pertain to advances made by the Group to third parties to facilitate thetransfer of title to the buyers. These include expected charges for documentary stamp taxes, transferfees, registration fees, city and business tax and notarial expenses. These advances are liquidated bythe private companies once the purpose for which the advances were made had been accomplishedand accordingly will be charged to miscellaneous customer charges.
Advances to brokersAdvances to brokers are commission paid in advance. These are charged to operating expense oncethe milestone of payment or conditions on sales had been reached.
Advances to suppliersAdvances to suppliers are advance payments to suppliers for the purchase of owner suppliedmaterials. These will be applied to billings of deliveries within one year.

- 39 -
*SGVFS028606*
Advances to contractorsAdvances to contractors are advance payments in relation to the Group’s construction activities andare recouped through reduction against progress billings as the construction progresses which areexpected to occur within one year from the date the receivables arose.
Receivables amounting to P=397.03 million and P=393.34 million as of December 31, 2017 and 2016,respectively, are provided with impairment losses as follow:
InstallmentContracts
Receivable
AccountsReceivable
from Tenants
AccountsReceivable
from Buyers
AccountsReceivable
from PrivateCompanies Total
At December 31, 2015 P=120,290,254 P=52,629,873 P=153,863,345 P=65,520,917 P=392,304,389Provision for the year (Note 26) 1,974,771 1,974,771Write-off (936,066) (936,066)At December 31, 2016 120,290,254 52,629,873 155,838,116 64,584,851 393,343,094Provision for the year (Note 26) 2,759,667 923,677 3,683,344At December 31, 2017 P=120,290,254 P=55,389,540 P=156,761,793 P=64,584,851 P=397,026,438
The impairment losses above pertain to individually impaired accounts. No impairment lossesresulted from performing collective impairment test.
In 2017 and 2016, the Group entered into various purchase agreements with financial institutionswhereby the Group sold its installment contracts receivables on a with recourse basis. Thesereceivables are used as collateral to secure the corresponding loans payable obtained. The purchaseagreements provide substitution of contracts which defaults. The Group still retains the soldreceivables in the installment contracts receivables account and records the proceeds from these salesas loans payable (Note 20).
As of December 31, 2017, the carrying value of installment contracts receivables sold and thecorresponding loans payable amounted to P=4,396.53 million and P=3,760.47 million, respectively.
As of December 31, 2016, the carrying value of installment contracts receivables sold and thecorresponding loans payable amounted to P=4,006.52 million and P=3,887.25 million, respectively.
Receivables on a with recourse basis are used as collateral to secure the corresponding loans payablesobtained.
11. Real Estate Inventories
The rollforward of the account follows:
2017 2016Balance at beginning of year P=22,954,662,398 P=22,855,688,651Construction/development costs incurred 10,601,608,044 9,328,257,464Land costs transferred from land and improvements
(Note 13) 4,045,421,145 1,652,120,088Borrowing costs capitalized (Note 24) 2,035,746,218 1,439,592,235Cost of real estate sales (Note 26) (13,303,578,388) (12,320,996,040)
P=26,333,859,417 P=22,954,662,398

- 40 -
*SGVFS028606*
The real estate inventories are carried at cost. No inventories are recorded at amounts lower than costin 2017 and 2016.
This account consists of:
2017 2016Subdivision land for sale and development P=34,690,174,168 P=26,397,818,296Less reserve for land development costs 14,289,953,194 9,441,025,424
20,400,220,974 16,956,792,872Condominium units for sale and development 4,704,409,287 4,928,409,728Residential house units for sale and development 1,229,229,156 1,069,459,798
5,933,638,443 5,997,869,526P=26,333,859,417 P=22,954,662,398
Subdivision land for sale and development represents real estate subdivision projects in which theGroup has been granted License to Sell (LTS) by the Housing and Land Use Regulatory Board of thePhilippines. It also includes raw land inventories that are under development and those that are aboutto undergo development.
Real estate inventories recognized as cost of sales amounted to P=13,303.58 million in 2017,P=12,321.00 million in 2016 and P=12,253.89 million in 2015, and are included as cost of real estatesales in the consolidated statements of comprehensive income (Note 26). Cost of real estate salesincludes acquisition cost of subdivision land, amount paid to contractors, development costs,capitalized borrowing costs and other costs directly attributable to bringing the real estate inventoriesto its intended condition.
Construction and development costs represent approximately 75.00% to 85.00% of the cost of sales.
Borrowing cost capitalized to inventories in 2017, 2016 and 2015 amounted to P=2,035.75 million,P=1,439.59 million and P=1,646.17 million, respectively (Note 24). The capitalization rate used todetermine the borrowing costs eligible for capitalization is 6.15% in 2017, 6.47% in 2016 and 6.67%in 2015.
Except as stated, the inventories are not used to secure the borrowing of the Group (Note 20).
12. Other Current Assets
This account consists of:
2017 2016Input value added tax (VAT) P=1,548,759,336 P=1,515,109,110Prepaid expenses 1,196,323,940 1,237,047,665Creditable withholding taxes 924,833,503 713,937,469Construction materials and others 314,767,438 326,774,056Deposits for real estate purchases and others 33,189,067 14,473,653
P=4,017,873,284 P=3,807,341,953
Input VAT is a tax imposed on purchases of goods, professional and consulting services andconstruction costs. These are available for offset against output VAT in future periods.
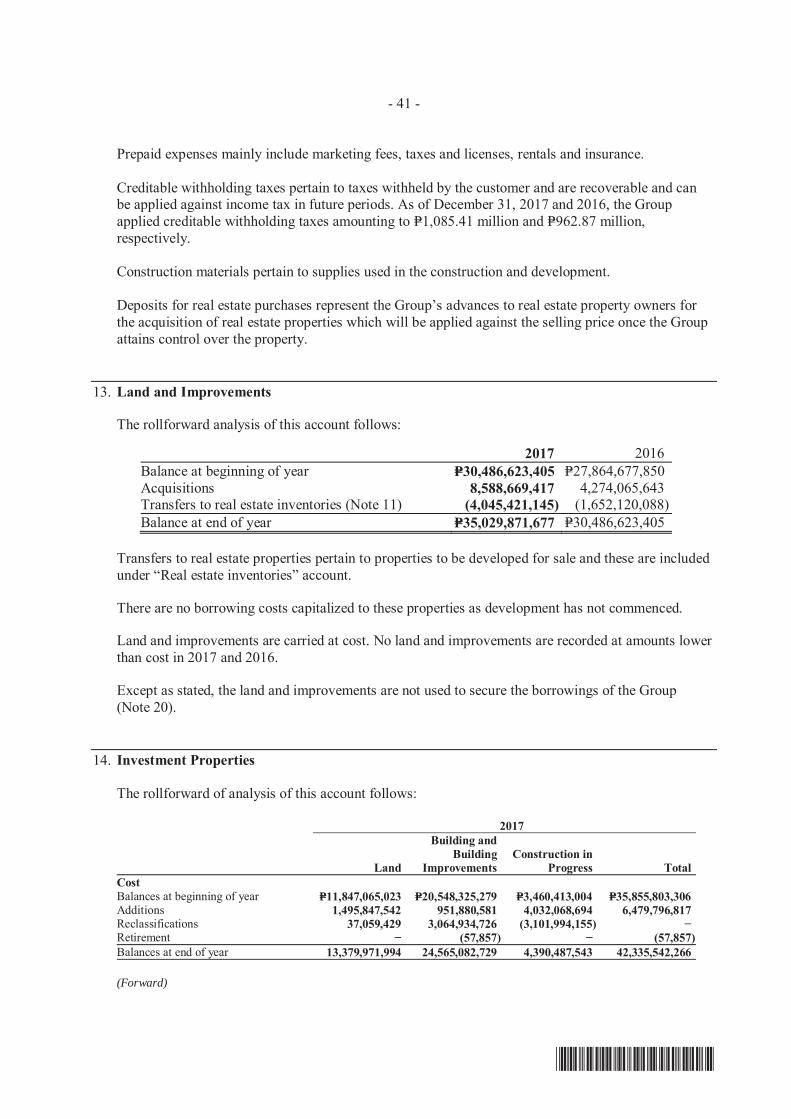
- 41 -
*SGVFS028606*
Prepaid expenses mainly include marketing fees, taxes and licenses, rentals and insurance.
Creditable withholding taxes pertain to taxes withheld by the customer and are recoverable and canbe applied against income tax in future periods. As of December 31, 2017 and 2016, the Groupapplied creditable withholding taxes amounting to P=1,085.41 million and P=962.87 million,respectively.
Construction materials pertain to supplies used in the construction and development.
Deposits for real estate purchases represent the Group’s advances to real estate property owners forthe acquisition of real estate properties which will be applied against the selling price once the Groupattains control over the property.
13. Land and Improvements
The rollforward analysis of this account follows:
2017 2016Balance at beginning of year P=30,486,623,405 P=27,864,677,850Acquisitions 8,588,669,417 4,274,065,643Transfers to real estate inventories (Note 11) (4,045,421,145) (1,652,120,088)Balance at end of year P=35,029,871,677 P=30,486,623,405
Transfers to real estate properties pertain to properties to be developed for sale and these are includedunder “Real estate inventories” account.
There are no borrowing costs capitalized to these properties as development has not commenced.
Land and improvements are carried at cost. No land and improvements are recorded at amounts lowerthan cost in 2017 and 2016.
Except as stated, the land and improvements are not used to secure the borrowings of the Group(Note 20).
14. Investment Properties
The rollforward of analysis of this account follows:
2017
Land
Building andBuilding
ImprovementsConstruction in
Progress TotalCostBalances at beginning of year P=11,847,065,023 P=20,548,325,279 P=3,460,413,004 P=35,855,803,306Additions 1,495,847,542 951,880,581 4,032,068,694 6,479,796,817Reclassifications 37,059,429 3,064,934,726 (3,101,994,155)Retirement (57,857) (57,857)Balances at end of year 13,379,971,994 24,565,082,729 4,390,487,543 42,335,542,266
(Forward)

- 42 -
*SGVFS028606*
Land
Building andBuilding
ImprovementsConstruction in
Progress TotalAccumulated Depreciation
and AmortizationBalances at beginning of year 3,790,270,632 3,790,270,632Depreciation and amortization (Note 26) 1,107,670,529 1,107,670,529Retirement (57,857) (57,857)Balances at end of year 4,897,883,304 4,897,883,304Net Book Value P=13,379,971,994 P=19,667,199,425 P=4,390,487,543 P=37,437,658,962
2016
Land
Building andBuilding
ImprovementsConstruction in
Progress TotalCostBalances at beginning of year P=11,464,130,704 P=10,333,800,925 P=7,927,375,532 P=29,725,307,161Additions 382,934,319 1,460,046,750 4,273,863,508 6,116,844,577Reclassifications 8,740,826,036 (8,740,826,036)Balances at end of year 11,847,065,023 20,534,673,711 3,460,413,004 35,842,151,738Accumulated Depreciation
and AmortizationBalances at beginning of year 3,048,983,925 3,048,983,925Depreciation and amortization (Note 26) 727,635,139 727,635,139Balances at end of year – 3,776,619,064 – 3,776,619,064Net Book Value P=11,847,065,023 P=16,758,054,647 P=3,460,413,004 P=32,065,532,674
The investment properties consist mainly of land and commercial centers that are held to earn rentalincome. These include Vista Malls and Starmalls that are located in key cities and municipalities inthe Philippines and three BPO commercial centers in Metro Manila. The construction in progressrepresents capitalized costs arising from a construction of commercial center that is located in TaguigCity, Las Piñas City, Cavite, Iloilo, Davao, Naga and Cagayan de Oro which is due to be completedin 2018 to 2020. The percentage of completion of various constructions in progress ranges from5.00% to 90.00% in 2017 and from 4.00% to 90.00% in 2016.
The reclassification of P=3,101.99 million in 2017 from construction in progress to building andimprovements represents completed BPO commercial center in Taguig and retail malls in Molino,Kawit, Las Piñas and Talisay Cebu, with gross floor area of 164,486 sq.m.
Rental income earned from investment properties amounted to P=5,625.23 million, P=4,375.33 millionand P=2,367.88 million in 2017, 2016 and 2015, respectively (Note 25). Repairs and maintenancecosts recognized under “Operating expenses” arising from investment properties amounted toP=149.46 million, P=107.12 million and P=279.59 million for the years ended December 31, 2017, 2016and 2015, respectively (Note 26). Cost of property operations amounted to P=1,420.42 million,P=1,874.25 million and P=996.96 million for the years ended December 31, 2017, 2016 and 2015. Forthe terms and conditions on the lease, refer to Note 34.
Except as stated, the investment properties are not used to secure the borrowings of the Group(Note 20).
The Group has no restrictions on the realizability of its investment properties and no contractualobligations to either purchase or construct or develop investment properties or for repairs,maintenance and enhancements.

- 43 -
*SGVFS028606*
The fair value of the land amounted to P=32,917.84 million and P=28,344.29 million as ofDecember 31, 2017 and 2016, respectively. This is based on the most recent selling price of similarproperty. The parcels of land are located in cities and municipalities like Mandaluyong, Las Piñas,Taguig, Naga, Imus, San Jose del Monte, Sta. Rosa, Alabang and Kawit.
As of December 31, 2017 and 2016, the aggregate fair values of investment properties amounted toP=63,489.77 million and P=51,801.83 million, respectively. The most recent fair value was determinedon September 30, 2017 by Santos Knight Frank Inc. (formerly CB Richard Ellis Phils., Inc.) which isan SEC accredited asset valuer.
The valuation techniques adopted for the measurement of fair values are the market approach for theland and cost approach for the buildings and land improvements.
The market price per square meter of the land ranged from P=1,926 to P=139,987, while building andimprovements ranged from P=16,787 to P=203,800. The fair value measurement using unobservabledata in active market is Level 3 of the fair value hierarchy. The estimated useful life of the investmentproperties other than land is 40 years.
Borrowing cost capitalized to investment properties in 2017, 2016 and 2015 amounted toP=846.20 million, P=1,167.18 million and P=468.63 million, respectively (Note 24). The capitalizationrate used to determine the borrowing costs eligible for capitalization is 6.15% in 2017, 6.47% in 2016and 6.67% in 2015.
15. Property and Equipment
The rollforward analyses of this account follow:
2017
Land
Building andBuilding
ImprovementsTransportation
Equipment
OfficeFurniture,
Fixtures andEquipment
ConstructionEquipment
Other FixedAssets Total
CostBalances at beginning of year P=83,333,600 P=573,959,560 P=554,066,534 P=615,859,385 P=330,953,472 P=185,540,984 P=2,343,713,535Additions 3,501,731 149,835,966 23,864,419 38,250,238 6,804,429 222,256,783Balances at end of year 83,333,600 577,461,291 703,902,500 639,723,804 369,203,710 192,345,413 2,565,970,318Accumulated Depreciation
and AmortizationBalances at beginning of year P= P=339,283,586 P=426,696,953 P=541,397,280 P=105,995,347 P=108,090,161 P=1,521,463,327Depreciation and amortization
(Note 26) 11,622,113 64,238,310 42,108,142 18,571,784 22,148,009 158,688,358Balances at end of year 350,905,699 490,935,263 583,505,422 124,567,131 130,238,170 1,680,151,685Net Book Value 83,333,600 226,555,592 212,967,237 56,218,382 244,636,579 62,107,243 885,818,633
2016
Land
Building andBuilding
ImprovementsTransportation
Equipment
OfficeFurniture,
Fixtures andEquipment
ConstructionEquipment
Other FixedAssets Total
CostBalances at beginning of year P=83,333,600 P=446,793,455 P=546,741,889 P=587,206,720 P=246,744,788 P=154,985,876 P=2,065,806,328Additions 127,166,105 7,324,645 28,652,665 84,208,684 30,555,108 277,907,207Balances at end of year 83,333,600 573,959,560 554,066,534 615,859,385 330,953,472 185,540,984 2,343,713,535Accumulated Depreciation
and AmortizationBalances at beginning of year 229,338,282 385,358,664 463,724,899 83,104,688 103,304,883 1,264,831,416Depreciation and amortization
(Note 26) 109,945,304 41,338,289 77,672,381 22,890,659 4,785,278 256,631,911Balances at end of year 339,283,586 426,696,953 541,397,280 105,995,347 108,090,161 1,521,463,327Net Book Value P=83,333,600 P=234,675,974 P=127,369,581 P=74,462,105 P=224,958,125 P=77,450,823 P=822,250,208

- 44 -
*SGVFS028606*
Depreciation and amortization expense charged to operations amounted to P=158.69 million,P=256.63 million and P=798.92 million for the years ended December 31, 2017, 2016 and 2015,respectively (Note 26).
As of December 31, 2017 and 2016, fully depreciated assets that are still actively in use amounted toP=331.29 million and P=220.91 million, respectively.
The Group’s transportation equipment with a carrying value of P=212.97 million and P=66.74 million asof December 31, 2017 and 2016, respectively, were pledged as collateral under chattel mortgage tosecure the car loans of the Group with various financial institutions (Note 20).
Except as stated, the property and equipment are not used to secure the borrowings of the Group(Note 20).
16. Project Development Costs
Project development costs pertain to cash advances to Bria Homes, Inc., a real estate developer ofaffordable house and lot, contracted by the Group for the construction of socialized housing units asrequired by the Housing and Land Use Regulatory Board (HLURB) (Note 30). These advances forproject development costs are included in the total estimated cost of project development whicheventually forms part of the cost of sales.
The following are the subsidiaries with outstanding LDAs accounted for as project developmentcosts:
Entity Project 2017 2016PCLHI Horizontal P=1,143,046,937 P=1,103,277,582Brittany Horizontal 830,384,147 829,260,419CPI Horizontal 731,731,397 272,361,240CAPI Horizontal 598,534,852 596,617,680HDC Horizontal 556,424,966 317,424,319VRI Vertical 174,160,567 113,370,000
P=4,034,282,866 P=3,232,311,240
17. Other Noncurrent Assets
This account consists of:
2017 2016Cash restricted for use P=934,178,185 P=500,630,394Deposits 583,774,070 517,312,842Model house accessories at cost 168,438,707 208,658,041Systems development costs 18,177,238 22,695,623Other assets 2,938,237 8,224,578
P=1,707,506,437 P=1,257,521,478
Cash restricted for use are deposits restricted solely for payment of the principal amortization andinterest of certain bank loans. These deposits bear prevailing interest rates and will be retained asdeposits until the bank loans are fully paid. Deposit balance should be equivalent to two quarters of

- 45 -
*SGVFS028606*
debt amortization. Interest income from cash restricted for use amounted to P=6.20 million,P=4.73 million and P=1.45 million in 2017, 2016 and 2015, respectively (Note 24).
Noncurrent portion of deposits include deposits for real estate purchases and deposits to utilitycompanies which will either be applied or recouped against future billings or refunded uponcompletion of the real estate projects. These deposits are necessary for the continuing constructionand development of real estate projects of the Group.
Model house accessories pertain to the furniture and fixture and other interior decorations used anddisplayed in the model house inventory.
The rollforward analysis of system development costs follow:
2017 2016Balance at beginning of year P=22,695,623 P=20,210,092Additions 34,278,886 48,198,547Amortization (Note 26) (38,797,271) (45,713,016)Balance at end of year P=18,177,238 P=22,695,623
Amortization of system development costs amounted to P=38.80 million, P=45.71 million andP=33.27 million for the years ended December 31, 2017, 2016 and 2015, respectively. These areincluded in the “Depreciation and amortization” account under “Operating expenses” in theconsolidated statements of comprehensive income (Note 26).
18. Accounts and Other Payables
This account consists of:
2017 2016Current portion of liabilities for purchased land
(Note 22) P=4,526,299,339 P=1,728,397,118Accounts payable
Contractors 2,378,231,392 3,157,581,768Suppliers 1,481,099,089 978,485,959Buyers 416,607,741 160,069,831Incidental costs 237,708,812 793,241,102
Accrued expenses 923,148,155 1,525,065,470Current portion of deferred output tax (Note 22) 849,966,969 695,644,782Commissions payable 836,870,044 809,619,299Current portion of retention payable (Note 22) 652,518,032 1,020,918,247Other payables 972,505,163 531,349,938
P=13,274,954,736 P=11,400,373,514
Current portion of liabilities for purchased landLiabilities for purchased land are payables to various real estate property sellers. Under the terms ofthe agreements executed by the Group covering the purchase of certain real estate properties, the titlesof the subject properties shall be transferred to the Group only upon full payment of the real estatepayables. Liabilities for purchased land that are payable beyond one year from year end date arereported as noncurrent liabilities (Note 22).

- 46 -
*SGVFS028606*
Accounts payable - contractorsAccounts payable - contractors pertain to contractors’ billings for construction services related to thedevelopment of various projects of the Group. These are expected to be settled within a year afterthe financial reporting date.
Accounts payable - suppliersAccounts payable - suppliers represent construction materials, marketing collaterals, office suppliesand property and equipment ordered and delivered but not yet due. These are expected to be settledwithin a year from recognition date.
Accounts payable - buyersAccounts payable - buyers pertain to refunds arising from the cancellation of contract to sellagreement which is determined based on the required refund under the Maceda Law.
Accounts payable - incidental costsAccounts payable - incidental costs pertain to liabilities incurred in relation to land acquisitions. Thisincludes payable for titling costs, clearing, security and such other additional costs incurred.
Accrued expensesAccrued expenses consist mainly of accruals for project cost estimate, interest on bonds and bankloans, light and power, marketing costs, professional fees, postal and communication, supplies,repairs and maintenance, transportation and travel, security and insurance. These are noninterest-bearing. Details of accrued expenses as follow:
2017 2016Accrued expenses
Interest P=386,940,966 P=542,170,916Rental 247,941,900 272,446,524Marketing 230,017,952 509,570,000Subdivision Maintenance 18,689,068 60,903,932Security 11,998,348 29,923,303Professional fees 8,644,842 15,058,803Power, Light and Power 3,682,479 7,688,537Repairs and maintenance 3,076,537 17,705,38913th Month/Bonus 2,952,991 21,815,241Management Fees 1,895,262 3,316,709Real Property Tax 12,018,880Others 7,307,810 32,447,236
P=923,148,155 P=1,525,065,470
Current portion of deferred output taxDeferred output tax pertains to the VAT charged to the buyers on installment upon contracting of realestate sale but were not yet collected as of reporting date. Further, upon collection of the installmentreceivables, the equivalent output tax from collected installment receivables are included in thecurrent VAT payable of the month when collection is made. Deferred output VAT pertaining toinstallment receivables that are beyond one year after report date are presented as noncurrentliabilities (Note 22).
Commissions payableCommissions payable pertain to fees due to brokers for services rendered which are expected to besettled within one year.

- 47 -
*SGVFS028606*
Current portion of retention payableRetention payable pertains to 10.00% retention from the contractors’ progress billings which will bereleased after the completion of contractors’ project. The 10.00% retention serves as a holdoutamount withheld from the contractor to cover for back charges that may arise from quality issues inaffected projects. Retention payables that are payable beyond one year from year end date arepresented as noncurrent liability (Note 22).
Other payablesOther payables include dues from remittance to Social Security System, Philippine Health InsuranceCorporation, Home Development Mutual Fund, withholding taxes, payables to JV partners andvarious payables. These are noninterest-bearing and are normally settled within one year.
19. Customers’ Advances and Deposits
This account consists of customers’ reservation fees, down payments and excess of collections overthe recognized revenue for a specific customer’s account.
The Group requires buyers of real estate units to pay a minimum percentage of the total selling pricebefore the two parties enter into a sale transaction. Payments from buyers which have not reached theminimum required percentage are presented as customers’ advances and deposits. When the level ofrequired payment is reached by the buyer, a sale is recognized and these deposits and down paymentsare applied against the related installment contracts receivable.
The excess of collections over the recognized revenue is applied against the receivables in thesucceeding years.
20. Bank Loans and Loans Payable
Bank LoansBank loans pertain to the borrowings of the Group from various local financial institutions. Thesebank loans are obtained to finance capital expenditures and for general corporate purposes.
The rollforward analysis of this account follows:
2017 2016Balance at the beginning of the year P=36,087,242,892 P=30,539,740,751Availment 6,618,873,487 17,477,193,581Payment (6,906,304,351) (11,929,692,040)Balance at end of the year 35,799,812,028 36,087,242,292Less: current portion 3,620,352,953 5,972,290,312
P=32,179,459,075 P=30,114,951,980

- 48
-
*SGVFS028606*
Det
ails
of t
he b
ank
loan
s as o
f Dec
embe
r 31,
201
7 an
d 20
16 fo
llow
:
Loa
n T
ype
Dat
e of
Ava
ilmen
t20
1720
16
Mat
urity
Inte
rest
Rat
e Pa
ymen
t Ter
ms
Cov
enan
ts/C
olla
tera
ls
VLLI
Ban
k lo
anA
pril
2013
P=P=1
91,6
46,1
18A
pril
2017
7.27
%
Inte
rest
and
prin
cipa
l pay
able
quar
terly
Cur
rent
ratio
of a
t lea
st1:
1.75
; Deb
t to
Equi
tym
axim
um o
f 1:1
.00
and
DSC
R 1
:1.0
0;un
secu
red
Ban
k lo
anJu
ne 2
013
666,
666,
667
2,00
0,00
0,00
0Ju
ne 2
018
5.75
% to
5.90
%In
tere
st a
nd p
rinci
pal p
ayab
lequ
arte
rlyC
urre
nt ra
tio at
leas
t1:
1.75
and
DSC
R n
otle
ss th
an 1
:1.0
0;un
secu
red
Ban
k lo
anA
ugus
t 201
7;O
rigin
ally
avai
led
inSe
ptem
ber 2
014
with
inte
rest
of 4
.25%
p.a
.
1,50
0,00
0,00
01,
500,
000,
000
July
201
8; re
new
edup
on m
atur
ity su
bjec
tto
chan
ge in
inte
rest
rate
4.00
%
Inte
rest
paya
ble
quar
terly
,pr
inci
pal p
ayab
le u
pon
mat
urity
Cur
rent
ratio
at le
ast
1:1.
75 a
nd D
SCR
not
less
than
1:1
.00;
with
colla
tera
l
Ban
k lo
anSe
ptem
ber 2
016
2,58
7,83
4,48
22,
991,
582,
391
Sept
embe
r 202
35.
00%
Inte
rest
and
prin
cipa
l pay
able
quar
terly
Cur
rent
ratio
of a
t lea
st1:
1.00
; Deb
t to
Equi
tym
axim
um o
f 2.5
0:1.
00an
d D
SCR
1:1
.00;
unse
cure
dB
ank
loan
Oct
ober
201
64,
600,
000,
000
5,00
0,00
0,00
0O
ctob
er 2
023
5.00
%
Inte
rest
and
prin
cipa
l pay
able
quar
terly
Cur
rent
ratio
of a
t lea
st1:
1.00
; Deb
t to
Equi
tym
axim
um o
f 2.5
0:1.
00an
d D
SCR
1:1
.00;
unse
cure
dB
ank
loan
Ava
iled
and
rene
wed
in v
ario
us d
ates
in20
17
2,50
0,00
0,00
0
Var
ious
mat
uriti
es in
2018
, ren
ewed
upo
nm
atur
ity su
bjec
t to
chan
ge in
inte
rest
rate
3.88
% to
4.00
%In
tere
st pa
yabl
e m
onth
ly,
prin
cipa
l pay
able
upo
n m
atur
ityW
ith co
llate
ral
Ban
k lo
anA
vaile
d an
d re
new
edin
var
ious
dat
esin
2017
13,6
25,2
99,0
0012
,051
,251
,000
V
ario
us m
atur
ities
in20
17 a
nd 2
018,
rene
wed
upo
nm
atur
ity su
bjec
t to
chan
ge in
inte
rest
rate
3.75
% to
4.00
%In
tere
st pa
yabl
e m
onth
ly,
prin
cipa
l pay
able
upo
n m
atur
ityW
ith co
llate
ral

- 49
-
*SGVFS028606*
Loa
n T
ype
Dat
e of
Ava
ilmen
t20
1720
16
Mat
urity
Inte
rest
Rat
e Pa
ymen
t Ter
ms
Cov
enan
ts/C
olla
tera
ls
P=25,
479,
800,
149
P=23,
734,
479,
509
MAP
IB
ank
loan
May
201
252
,500
,000
May
201
75.
70%
Inte
rest
and
prin
cipa
l pay
able
mon
thly
With
colla
tera
l
Ban
k lo
anA
vaile
d in
var
ious
date
s in
2013
and
2014
1,32
1,88
4,70
91,
801,
153,
679
Aug
ust 2
020
5.70
% to
6.12
%In
tere
st a
nd p
rinci
pal p
ayab
lequ
arte
rlyW
ith co
llate
ral
Ban
k lo
anD
ecem
ber 2
014
182,
342,
446
273,
105,
263
Dec
embe
r 201
96.
25%
In
tere
st an
d pr
inci
pal p
ayab
lem
onth
lyW
ith co
llate
ral
Ban
k lo
anA
vaile
d in
var
ious
date
s in
2015
1,93
2,57
8,18
32,
273,
621,
392
Mar
ch 2
022
5.46
% to
6.25
%In
tere
st a
nd p
rinci
pal p
ayab
lem
onth
lyW
ith co
llate
ral
Ban
k lo
anJu
ly 2
017
500,
000,
000
June
202
76.
23%
In
tere
st an
d pr
inci
pal p
ayab
lem
onth
lyW
ith co
llate
ral
3,93
6,80
5,33
84,
400,
380,
334
MC
Ban
k lo
anA
vaile
d in
var
ious
date
s in
2012
and
2013
122,
126,
194
257,
559,
138
Var
ious
mat
uriti
es in
2017
to 2
020
7.00
% to
7.25
%In
tere
st a
nd p
rinci
pal p
ayab
lem
onth
lyW
ith co
llate
ral
Ban
k lo
anA
vaile
d in
var
ious
date
s in
2014
151,
764,
706
231,
764,
706
Var
ious
mat
uriti
es in
2019
5.75
%
Inte
rest
and
prin
cipa
l pay
able
quar
terly
With
colla
tera
l
Ban
k lo
anJu
ly 2
015
3,31
8,97
1,62
73,
756,
118,
462
July
202
25.
75%
In
tere
st an
d pr
inci
pal p
ayab
lequ
arte
rlyW
ith co
llate
ral
3,59
2,86
2,52
74,
245,
442,
306
Britt
any
Ban
k lo
anN
ovem
ber 2
010
166,
145
518,
816
Dec
embe
r 201
810
.50%
In
tere
st an
d pr
inci
pal p
ayab
lem
onth
lyCh
atte
l mor
tgag
e
CAPI
Ban
k lo
anA
pril
2014
176,
535,
983
294,
183,
042
Apr
il 20
195.
50%
In
tere
st an
d pr
inci
pal p
ayab
lequ
arte
rlyU
nsec
ured
Ban
k lo
anD
ecem
ber 2
011
891,
446
230,
391
Dec
embe
r 201
910
.50%
In
tere
st an
d pr
inci
pal p
ayab
lem
onth
lyCh
atte
l mor
tgag
e
177,
427,
429
294,
413,
433
CHI
Ban
k lo
anFe
brua
ry 2
010
5,06
7,42
24,
677,
822
Dec
embe
r 201
910
.50%
In
tere
st an
d pr
inci
pal p
ayab
lem
onth
lyCh
atte
l mor
tgag
e

- 50
-
*SGVFS028606*
Loa
n T
ype
Dat
e of
Ava
ilmen
t20
1720
16
Mat
urity
Inte
rest
Rat
e Pa
ymen
t Ter
ms
Cov
enan
ts/C
olla
tera
ls
CPI
Ban
k lo
anM
arch
201
5P=1
,056
,820
,480
P=1,5
25,1
55,3
42M
arch
202
05.
50%
In
tere
st an
d pr
inci
pal p
ayab
lequ
arte
rlyU
nsec
ured
Ban
k lo
anFe
brua
ry 2
010
19,1
14,6
557,
905,
415
Aug
ust 2
019
10.7
5%
Inte
rest
and
prin
cipa
l pay
able
mon
thly
Chat
tel m
ortg
age
1,07
5,93
5,13
51,
533,
060,
757
VRI
Ban
k lo
anA
pril
2014
529,
411,
765
882,
352,
941
Apr
il 20
195.
50%
In
tere
st an
d pr
inci
pal p
ayab
lequ
arte
rlyU
nsec
ured
Ban
k lo
anD
ecem
ber 2
016
990,
000,
000
990,
000,
000
Dec
embe
r 202
46.
70%
In
tere
st pa
yabl
e qu
arte
rly,
prin
cipa
l pay
able
upo
n m
atur
ityU
nsec
ured
Ban
k lo
anM
ay 2
010
1,17
6,77
944
1,11
6A
ugus
t 202
010
.50%
In
tere
st an
d pr
inci
pal p
ayab
lem
onth
lyCh
atte
l mor
tgag
e
1,52
0,58
8,54
41,
872,
794,
057
PCLH
IB
ank
loan
Febr
uary
201
311
,159
,339
1,47
5,85
8D
ecem
ber 2
020
vario
us
Inte
rest
and
prin
cipa
l pay
able
mon
thly
Chat
tel m
ortg
age
35,7
99,8
12,0
2836
,087
,242
,892
Less
cur
rent
por
tion
3,62
0,35
2,95
35,
972,
290,
312
Ban
k lo
ans,
net o
f cur
rent
por
tion
P=32,
179,
459,
075
P=30,
114,
952,
580

- 51 -
*SGVFS028606*
VLLIIn April 2013, the Parent Company entered into an unsecured bilateral loan agreements with localbanks. A portion of the corporate notes was terminated and bank loans with principal amount ofP=1,700.00 million were issued during the year which bears annual fixed interest rate of 7.27%. Thesebilateral loans are divided into three (3) banks with principal balances of P=800.00 million(unsecured), P=600.00 million (unsecured) and P=300.00 million (unsecured), respectively. Thebilateral loan with the principal balance of P=800.00 million required the Group to maintain currentratio of 1:1.75, debt to equity ratio of 1:1.00 and debt-service coverage ratio (DSCR) of1:1.00. These restrictions and requirements were complied with by the Parent Company as atDecember 31, 2016. As at December 31, 2016, the outstanding balance of the loans amounted toP=191.65 million. The loans matured April 17, 2017 and were fully paid.
In June 2013, the Parent Company obtained unsecured P=1,000.00 million and unsecuredP=5,000.00 million peso-denominated bank loans from local banks which bear annual fixed interestrate of 5.90% and 5.75%, respectively. The loans will mature in June 2018. The principal balance ofthe loans are paid in twelve (12) and twenty (20) equal quarterly installments, respectively. Theunsecured P=5,000.00 million peso-denominated bank loan requires the Parent Company to maintaincurrent ratio of 1:1.75 and debt-service coverage ratio (DSCR) of 1:1.00. These restrictions andrequirements were complied with by the Parent Company as at December 31, 2017 and 2016. As atDecember 31, 2017 and 2016, outstanding balance amounted to P=666.67 million and P=2,000.00million, respectively.
On September 11, 2014, the Parent Company obtained a peso-denominated bank loan from a localbank amounting to P=1,500.00 million with fixed interest of 4.25% per annum. The bank loan isrenewed annually upon maturity. The note matured on July 24, 2017 and was renewedAugust 23, 2017. The loan is secured by the HTM investments of VII amounting to US$31.60million. As at December 31, 2017 and 2016, outstanding balance of the loans amounted toP=1,500.00 million.
On September 23, 2016, the Parent Company obtained a 7-year unsecured peso-denominated loanfrom a local bank amounting to P=3,500.00 million which bears annual fixed interest rate of 5.00%payable quarterly. The principal balance of the loan will be paid in twenty eight (28) equal quarterlyinstallments commencing on the first interest payment date. The loan requires the Parent Companyto maintain a current ratio of at least 1.00:1.00, a maximum debt-to-equity ratio of 2.50:1.00 and aDSCR of at least 1.00:100. These were complied with by the Parent Company as atDecember 31, 2017 and 2016. As at December 31, 2017 and 2016, outstanding balance of the loansamounted to P=2,587.83 million and P=2,991.58 million, respectively.
On October 5, 2016, the Parent Company obtained a 7-year unsecured peso-denominated loan from alocal bank amounting to P=5,000.00 million which bears annual fixed interest rate of 5.00% payablequarterly. The principal balance of the loan will be paid in twenty five (25) equal quarterlyinstallments commencing on the fourth interest payment date. The loan requires Parent Company tomaintain a current ratio of at least 1.00:1.00, a maximum debt-to-equity ratio of 2.50:1.00 and aDSCR of at least 1.00:100. These were complied with by the Parent Company as atDecember 31, 2017 and 2016. As at December 31, 2017 and 2016, outstanding balance of the loansamounted to P=4,600.00 million and P=5,000.00 million, respectively.
In 2017, the Parent Company obtained new peso-denominated bank loans from local banks totalingP=2,500.00 million with interests ranging from 3.875% to 4.00% per annum payable monthly. Theloans will mature in 2018. The loans are secured by a hold-out on the identifiable HTM investmentsof VII totaling US$51.80 million. As at December 31, 2017, outstanding balance of the loansamounted to P=2,500.00 million.

- 52 -
*SGVFS028606*
The Parent Company has various peso-denominated bank loans from different local banks with fixedinterest-rates ranging from 3.75% to 4.00% per annum. These bank loans are renewable uponmaturity subject to change in interest rates and/or hold-out amount of the HTM investments of VII.These loans are secured by hold-out of the HTM investments of VII amounting to US$300.10 million.The loans require the Group to maintain a current ratio of at least 1.00:1.00, a maximum debt-to-equity ratio of 2.50:1.00 and a DSCR of at least 1.00:100. These were complied with by the ParentCompany as at December 31, 2017 and 2016. As at December 31, 2017 and 2016, outstandingbalance of the loans amounted to P=13,625.30 million and P=12,051.25 million, respectively.
MAPIIn May 2012, MAPI obtained a secured loan from a local bank amounting to P=420.00 million tofinance the construction of Starmall San Jose del Monte. The loan provides for the Group to observecertain covenants including, among others, incurrence of additional debt; grant of security interest;payment of dividends; mergers, acquisitions and disposals; and certain other covenants. As ofDecember 31, 2016, the outstanding balance of loan amounted to P=52.50 million and was fully paidin May 2017.
In 2013, MAPI entered into a secured term loan agreements with a local bank for a total credit line ofP=2,700.00 million. As of December 31, 2017, a total of P=2,300.00 million has been drawn from thissecured facility to finance the construction of various ongoing projects of MAPI. The loans havematurities beginning December 2015 to August 2020 and bear annual interest rates ranging from5.75% to 6.12%. The loan requires MAPI to maintain a current ratio of not lower than 1.25:1:00 anddebt-equity ratio of not higher than 3.00:1.00. These were complied with by MAPI as atDecember 31, 2017 and 2016. As of December 31, 2017 and 2016, outstanding balance of the loansamounted to P=1,321.88 million and P=1,801.15 million, respectively.
MAPI is also required to maintain a reserve fund for its future loan and interest repayments. Inaccordance with the agreement, MAPI maintains a reserve fund amounting to P=808.02 million andP=374.48 million as of December 31, 2017 and 2016, respectively, which is presented under “Othernoncurrent assets” account in the consolidated statements of financial position (Note 17).
In December 2014, MAPI entered into a secured term loan agreement with a local bank amounting toP=1,000.00 million primarily to finance various ongoing mall constructions. The loans have maturitiesbeginning December 2016 to June 2017 and bears annual interest of 4.50%. These were fully paid in2016.
In connection with the loan, MAPI agreed to execute a negative pledge over certain real propertieswith carrying amount of P=5,344.00 million as of December 31, 2015. MAPI cannot allow any otherindebtedness to be secured by the covered real properties nor permit any other creditor to receive anypriority or preference over the covered real properties, without written consent from the local bank.
In December 2014, MAPI entered into a secured term loan agreement with a local bank amounting toP=366.00 million also primarily to finance various ongoing mall constructions. The loan hasmaturities beginning December 2014 to December 2019 and bears annual interest of 6.25%. As ofDecember 31, 2017, outstanding balance of the loans amounted to P=182.34 million andP=273.11 million, respectively.
In 2015, MAPI entered into a secured term loan agreements with a local bank amounting toP=2,273.62 million primarily to finance various ongoing mall constructions. The loans have maturitiesof seven years from the date of drawdown and bear an annual fixed interest rate of 5.46%. As ofDecember 31, 2017 and 2016, outstanding balance of the loans amounted to P=1,932.58 million andP=2,273.62 million, respectively.

- 53 -
*SGVFS028606*
In July 2017, MAPI obtained a 10-year unsecured peso denominated loan from a local bankamounting to P=500.00 million which bears annual fixed interest rate of 6.23%. The principal balanceof the loan will be paid in thirty two (32) equal quarterly installments commencing on the ninthinterest payment date. The loan requires MAPI to maintain a current ratio of at least 1.00:1.00, amaximum debt-to-equity ratio of 2.50:1.00 and a DSCR of at least 1.00:100. These were compliedwith by MAPI as at December 31, 2017. The outstanding balance as at December 31, 2017 amountedto P=500.00 million.
MCIn 2012 and 2013, MC obtained various term loans from local banks to finance the upgrade of the airconditioning systems of Starmall EDSA - Shaw and Starmall Alabang. The loans have maturitiesfrom October 2014 to February 2020 and bear an annual fixed interest rates ranging from 7.00% to7.25%. As of December 31, 2017 and 2016, outstanding balance of the loans amounted toP=122.13 million and P=257.56 million, respectively.
In 2014, MC obtained various unsecured loans from a local bank to finance the upgrade of the airconditioning systems of Starmall Las Piñas - Main and Starmall Las Piñas - Annex and theacquisition of generator set upgrades for all the malls of MC. The loans have maturities of five yearsfrom the date of drawdown and bear fixed annual interest rate of 5.75%. As of December 31, 2017and 2016, outstanding balance of loans amounted to P=151.76 million and P=231.76 million,respectively.
In July 2015, MC obtained a loan from a local bank worth P=4,000.00 million which was used solelyfor capital expenditure and general corporate purposes and has a maturity of seven years from thedate of drawdown and bears an annual fixed interest rate of 5.75%. Real estate contracts of MC aswell as investment properties in Starmall Alabang are used as a mortgage for this loan. As ofDecember 31, 2017 and 2016, outstanding balance of loans amounted to P=3,318.97 million andP=3,756.12 million, respectively.
MC is also required to maintain a reserve fund for its future principal and interest loan repayments.In accordance with the loan agreement with the bank, MC is required to maintain a reserve fund forits future principal and interest loan repayments amounting to P=126.15 million. The reserve fund ispresented under “Other noncurrent assets” account in the consolidated statements of financial position(Note 17).
In January 2016, MC obtained a loan from a local bank amounting to P=1,000.00 million for workingcapital requirement. The loan bears an annual interest rate of 4.50%. The loan was paid in full onDecember 31, 2016.
Residential SubsidiariesThe Group’s residential subsidiaries have various peso-denominated bank loans from different bankswith fixed interest-rates ranging from 5.50% to 10.75% per annum. These bank loans are renewedannually upon maturity. As at December 31, 2017 and 2016, outstanding balance of the loansamounted to P=2,790.34 million and P=3,706.94 million, respectively. Of the total bank loans,P=37.58 million and P=15.58 million were secured by chattel mortgages on the Group’s transportationequipment as at December 31, 2017 and 2016, respectively (Note 15).
Bank loan covenantsIn addition to financial covenants, unless otherwise stated, the bank loans of the Group provide forcertain restrictions and requirements with respect to, among others, payment of dividends, incurrenceof additional liabilities, investment and guaranties, mergers or consolidations or other materialchanges in their ownership, corporate set-up or management, acquisition of treasury stock, disposition

- 54 -
*SGVFS028606*
and mortgage of assets. These restrictions and requirements were complied with by the Group as atDecember 31, 2017 and 2016.
Loans PayableAs stated in Note 10 to the consolidated financial statements, loans payable pertain to the remainingbalance of “Installment contracts receivable” of subsidiaries that were sold on a with recourse basis.These loans bear annual fixed interest rates ranging from 7.00% to 12.00% in 2017 and 2016, payableon equal monthly installments over a maximum period of 3 to 15 years. The installment contractsreceivables serve as the collateral for the loans payable. These will mature on various dates up toDecember 2027.
Movement of loans payable follows:
2017 2016Balance at beginning of year P=3,887,252,607 P=3,694,889,102Availments 2,318,488,025 2,243,998,245Payments (2,445,274,649) (2,051,634,740)
3,760,465,983 3,887,252,607Less current portion 644,355,649 1,122,548,064
P=3,116,110,334 P=2,764,704,543
Interest expense on bank loans and notes payable amounted to P=1,632.59 million, P=898.38 millionand P=1,652.21 million in 2017, 2016 and 2015, respectively (Note 24). As of December 31, 2017 and2016, the balance of unamortized issue cost on bank loans amounted to P=306.49 million andP=35.84 million, respectively.

- 55
-
*SGVFS028606*
Det
ails
of t
he lo
ans p
ayab
le a
s of D
ecem
ber 3
1, 2
017
and
2016
follo
w:
Entit
yD
ate
of A
vailm
ent
2017
2016
Mat
urity
Inte
rest
Rat
e Pa
ymen
t Ter
ms
Cov
enan
ts/
Col
late
rals
CHI
Loan
s pay
able
vario
usP=2
85,5
26,7
07P=4
58,1
55,6
51M
arch
202
9va
rious
Inte
rest
and
prin
cipa
l pay
able
mon
thly
W
ith re
cour
seBr
ittan
yLo
ans p
ayab
leva
rious
93,0
98,7
8420
1,87
3,98
2A
pril
2028
vario
usIn
tere
st an
d pr
inci
pal p
ayab
le m
onth
ly
With
reco
urse
VRI
Loan
s pay
able
vario
us2,
170,
644,
649
1,74
8,51
3,61
2D
ecem
ber 2
029
vario
usIn
tere
st an
d pr
inci
pal p
ayab
le m
onth
ly
With
reco
urse
CAPI
Loan
s pay
able
vario
us33
,459
,339
85,3
97,1
83M
arch
202
8va
rious
Inte
rest
and
prin
cipa
l pay
able
mon
thly
W
ith re
cour
seCP
ILo
ans p
ayab
leva
rious
606,
399,
802
840,
609,
407
Oct
ober
202
8va
rious
Inte
rest
and
prin
cipa
l pay
able
mon
thly
W
ith re
cour
sePC
LHI
Loan
s pay
able
vario
us57
1,33
6,70
255
2,70
2,77
2Ju
ne 2
030
vario
usIn
tere
st an
d pr
inci
pal p
ayab
le m
onth
ly
With
reco
urse
3,76
0,46
5,98
33,
887,
252,
607
Less
cur
rent
por
tion
644,
355,
649
1,12
2,54
8,06
4Lo
ans p
ayab
le, n
et o
f cur
rent
por
tion
P=3,1
16,1
10,3
34P=2
,764
,704
,543

- 56 -
*SGVFS028606*
21. Notes Payable
This account consists of:
2017 2016Dollar denominated bonds P=34,881,714,167 P=29,068,413,335Retail bonds 9,892,318,736 4,934,226,365Corporate note facility 9,727,009,335 5,514,622,937Homebuilder bonds 7,852,935
54,501,042,238 39,525,115,572Less current portion 60,890,732 475,475,872
P=54,440,151,506 P=39,049,639,700
Dollar Denominated Bonds
US$350.00 million Notes (Due November 2024)On November 28, 2017, VII (the Issuer) issued US$350.00 million (P=17,724.00 million) notes(“Notes”) with a term of seven years from initial draw down date. The interest rate is 5.75% perannum payable semi-annually in arrears on May 28 and November 28 of each year beginning onNovember 28, 2017. Said notes were used to fund tender offer for existing Notes dueOctober 4, 2018 and April 29, 2019. Some of the proceeds was used to refinance existing debtand for general corporate purposes. There are no properties owned by the Group that were pledgedas collateral to this note. As of December 31, 2017, outstanding balance of note amounted toUS$339.73 million (P=16,962.64 million).
Redemption at the option of the issuerAt any time, the Issuer may on any one or more occasions redeem all or a part of the Notes on anybusiness day or after November 28, 2021 and up to but excluding the Maturity date, the Issuer may onone or more occasions redeem all or part of the Notes, at the redemption price (expressed inpercentages of principal amount on the date of redemption), plus accrued and unpaid interest, if any,to (but not including) the date of redemption, if redeemed during the 12-month period commencingon November 28 of the years set forth below:
Period Price2021 102.8750%2022 101.4375%2023 and thereafter 100.0000%
CovenantsThe Notes provide for the Group to comply with certain covenants including, among others,incurrence of additional debt; grant of security interest; payment of dividends; mergers, acquisitionsand disposals; and certain other covenants. The incurrence test for additional debt requires the Groupto have a proforma (Fixed Charge Coverage Ratio) FCCR of not less than 2.25x. These werecomplied with by the Group as at December 31, 2017.
US$425.00 million Notes (Due June 2022)On June 18, 2015, VII (the Issuer) issued US$300.00 million (P=13,541.40 million) notes (“Notes”)with a term of seven years from initial draw down date. The interest rate is 7.375% per annumpayable semi-annually in arrears on June 18 and December 17 of each year beginning onDecember 17, 2015. Said notes were used to refinance notes issued notes issued October 2013 due2018 and April 2014 due 2019. As of December 31, 2017 and 2016, outstanding balance of note

- 57 -
*SGVFS028606*
amounted to US$234.34 million (P=11,700.74 million) and US$237.47 million (P=11,806.87 million),respectively. There are no properties owned by the Group that were pledged as collateral to this note.
On February 2, 2016, an additional unsecured note, with the same terms and conditions with theabove notes, were issued by the Group amounting to USD$125.00 million (P=5,996.25). The noteswere issued at 102% representing a yield to maturity of 6.979%. As of December 31, 2017 and 2016,outstanding balance of note amounted to US$124.54 million (P=6,218.33 million) and US$122.12million (P=6,071.90 million), respectively. There are no properties owned by the Group that werepledged as collateral to this note.
Redemption at the option of the issuerAt any time, the Issuer may on any one or more occasions redeem all or a part of the Notes, by givingnotice, at a redemption price equal to 100% of the principal amount of the Notes redeemed, plus theApplicable Premium as of, and accrued and unpaid interest, if any, to, the date of redemption, subjectto the rights of the person in whose name the Note is registered on the relevant record date to receiveinterest due on the relevant interest payment date.
CovenantsThe Notes provide for the Group to comply with certain covenants including, among others,incurrence of additional debt; grant of security interest; payment of dividends; mergers, acquisitionsand disposals; and certain other covenants. The incurrence test for additional debt requires the Groupto have a proforma FCCR of not less than 2.5x. These were complied with by the Group as atDecember 31, 2017 and 2016.
On September 29, 2016, VII repurchased US$54.54 million out of the US$425.00 million notesoutstanding balance prior to the repurchase date.
On January 10, 2018, the Issuer announce a solicitation of consent to holders of the Notes to approveproposed amendments to certain terms and conditions of the Notes with the intention of aligningthose terms and conditions of the Notes issued in November 28, 2017. Amendment include amongothers the proforma FCCR to be not less than 2.25x from the previous requirement of not less than2.5x. In a meeting of Noteholders on February 1, 2018, Noteholders holding 90.12% of the aggregateamount of principal amount of the Notes outstanding voted in favor and approved the amendments ofthe terms of the Notes.
US$350.00 million Notes (Due April 2019)On April 29, 2014, VII (the Issuer) issued unsecured US$225.00 million (P=10,021.50 million) notes(“Notes”) due April 29, 2019 to refinance its debt and for general corporate purposes. The interestrate of 7.45% per annum is payable semi-annually in arrears on April 29 and October 29 of each yearcommencing on October 29, 2014.
On September 11, 2014, an additional unsecured note, with the same terms and conditions with theabove notes, were issued by the Issuer amounting to US$125.00 million. The notes were issued at102% representing a yield to maturity of 6.935%.
As of December 31, 2017 and 2016, outstanding balance of the notes amounted to nil andUS$174.92 million (P=8,697.25 million).
The Notes are unconditionally and irrevocably guaranteed by the Parent Company and itssubsidiaries. Other pertinent provisions of the Notes follow:

- 58 -
*SGVFS028606*
Redemption at the option of the issuerAt any time the Group may redeem all or part of the Notes, at a redemption price equal to 100% ofthe principal amount of the notes redeemed, plus the applicable premium as of, and accrued andunpaid interest, if any, to the date of the redemption, subject to the rights of note holders on therelevant record date to receive interest due on the relevant interest payment date.
Redemption upon a change in controlUnless the Notes are previously redeemed, repurchased and cancelled, the issuer will, no later than 30days following a change of control make an offer to purchase all outstanding Notes at a purchaseprice equal to 101% of their principal amount together with accrued and unpaid interest, ifany. Change of control includes the sale of all or substantially all the properties or assets of the issueror its restricted subsidiaries.
CovenantsThe Notes provide for the Group to comply with certain covenants including, among others,incurrence of additional debt; grant of security interest; payment of dividends; mergers, acquisitionsand disposals; and certain other covenants. The incurrence test for additional debt requires the Groupto have a proforma FCCR of not less than 2.5x. These were complied with by the Group as atDecember 31, 2017 and 2016.
On November 10, 2017, the Issuer launched a tender offer to purchase any and all of the Notes due2019 as part of its liability management. On November 21, 2017 the end of tender offer period, theGroup has accepted valid tender offers representing 41.92% of the total outstanding Notes or anaggregate of $75.78 million in nominal amount. The settlement was made on November 29, 2017 at107.241% purchase price. The outstanding balance after the tender offer amounted to$105.01 million.
On November 21, 2017, the issuer elected the Make Whole Redemption option to redeem and pay theremaining outstanding balance of the Notes after the Tender Offer period.
On December 21, 2017, the issuer redeemed and paid $105.01 million remaining balance of the Notesat 106.869% redemption price. The notes were fully paid as of December 31, 2017.
The exercise of make whole redemption for Notes due in April 2019 resulted to payment of premiumof P=364.00 million and interest of P=57.02 million which are recorded in interest and other financingcharges of the consolidated statements of comprehensive income.
US$100.00 million Notes (Due October 2018)On October 4, 2013, VII (the Issuer) issued unsecured US$100.00 million bonds with a term of fiveyears from the issue date. The interest rate is 6.75% per annum payable semi-annually in arrears onApril 4 and October 4 of each year commencing on April 4, 2014. As of December 31, 2017 and2016, outstanding balance of the bond amounted to nil and US$50.13 million (P=2,492.38 million).
The Notes are unconditionally and irrevocably guaranteed by the Group. Other pertinent provisionsof the Notes follow:
Redemption at the option of the issuer – equity clawbackAt any time prior to September 30, 2013, the Group may redeem up to 35% of the aggregate principalamount of the US Notes originally issued at a redemption price equal to 106.75% of the principalamount, plus accrued and unpaid interest, if any, to the date of redemption with the net cash proceedsof an equity offering; provided that: (i) at least 65% of the aggregate principal amount of US Notesoriginally issued remains outstanding immediately after the occurrence of such redemption and

- 59 -
*SGVFS028606*
(ii) the redemption occurs within 60 days of the date of the closing of such equity offering. TheNotes contains an equity clawback option.
Redemption at the option of the issuer – early redemptionAt any time the Group may redeem all or part of the Notes, at a redemption price equal to 100% ofthe principal amount of the notes redeemed, plus the applicable premium as of, and accrued andunpaid interest, if any, to the date of the redemption, subject to the rights of note holders on therelevant record date to receive interest due on the relevant interest payment date.
CovenantsThe Notes provide for the Group to comply with certain covenants including, among others,incurrence of additional debt; grant of security interest; payment of dividends; mergers, acquisitionsand disposals; and certain other covenants. The incurrence test for additional debt requires the Groupto have a proforma FCCR of not less than 2.5x. These were complied with by the Group as atDecember 31, 2017 and 2016.
On September 29, 2016, VII repurchased US$10.70 million out of the remaining US$62.51 millionnotes outstanding prior to the repurchase date.
On November 10, 2017, the Issuer launched a tender offer to purchase any and all of the Notes due2018 as part of its liability management. On November 21, 2017, the end of tender offer period, theGroup has accepted valid tender offers representing 8.78% of the total outstanding Notes or anaggregate of $4.55 million in nominal amount. The settlement was made on November 29, 2017 at103.863% purchase price. The outstanding balance after the tender offer amounted to $47.26 million.
On November 21, 2017, the Issuer elected the Make Whole Redemption option to redeem and pay theremaining outstanding balance of the Notes after the Tender Offer period.
On December 21, 2017, the issuer redeemed and paid $47.26 million remaining balance of the Notesat 103.522% redemption price. The notes were fully paid as of December 31, 2017.
The exercise of make whole redemption for Notes due in October 2018 resulted to payment ofpremium of P=84.00 million and interest of P=34.44 million which are recorded in interest and otherfinancing charges of the consolidated statements of comprehensive income.
Peso Retail Bonds
2017 Fixed-rate Peso Retail BondsOn August 8, 2017, the Group issued unsecured fixed-rate Peso Retail Bonds with an aggregateprincipal amount of P=5,000.00 million. The proceeds of the issuance was used to partially financecertain commercial development projects of the Group and for general corporate purposes. There areno securities pledged as collateral for these bonds. The issue costs amounted to P=64.87 million.
The offer is comprised of 7-year fixed rate bonds due on August 8, 2024 and 10-year fixed rate bondsdue on August 9, 2027 with interest rates of 5.75% and 6.23% per annum, respectively. This is theinitial tranche offered out of the shelf registration of fixed rate bonds in the aggregate principalamount of up to P=20,000.00 million to be offered within a period of three (3) years. Interest on theRetail Bonds is payable quarterly in arrears starting on November 8, 2017 for the first interestpayment date and on February 8, May 8, August 8 and November 8 each year for each subsequentpayment date.
As of December 31, 2017, outstanding balance of the bonds amounted to P=4,937.67 million.

- 60 -
*SGVFS028606*
Redemption at the option of the issuerThe Issuer may redeem in whole, the outstanding Retail Bonds on the following relevant dates. Theamount payable to the bondholders upon the exercise of the early redemption option by the Issuershall be calculated, based on the principal amount of Retail Bonds being redeemed, as the sum of: (i)accrued interest computed from the last interest payment date up to the relevant early redemptionoption date; and (ii) the product of the principal amount of the Retail Bonds being redeemed and theearly redemption price in accordance with the following schedule:
a) Seven Year Bonds:i. Five (5) years and six (6) months from issue date at early redemption price of 101.00%ii. Six (6) years from issue date at early redemption price of 100.50%
b) Ten Year Bonds:i. Seven (7) years from issue date at early redemption price of 102.00%ii. Eight (8) years from issue date at early redemption price of 101.00%iii. Nine (9) years from issue date at early redemption price of 100.50%
CovenantsThe Retail Bonds provide for the Group to comply with covenants including, among others,incurrence or guarantee of additional indebtedness; prepayment or redemption of subordinate debtand equity; making certain investments and capital expenditures; consolidation or merger with otherentities; and certain other covenants. The Retail Bonds requires the Group to maintain a current ratioof at least 1.00:1.00, a maximum debt-to-equity ratio of 2.50:1.00 and a DSCR of at least1.00:100. These were complied with by the Group as at December 31, 2017.
2014 Fixed-rate Peso Retail BondsOn May 9, 2014, the Parent Company issued unsecured fixed-rate Peso Retail Bonds with anaggregate principal amount of P=5,000.00 million. The proceeds of the issuance was used to partiallyfinance certain commercial development projects of CPI and its subsidiaries. The issue costsamounted to P=114.15 million.
The offer is comprised of 5-year fixed rate bonds due on November 9, 2019 and 7-year fixed ratebonds due on May 9, 2021 with interest rate of 5.65% and 5.94% per annum, respectively. Intereston the Retail Bonds is payable quarterly in arrears starting on August 9, 2014 for the first interestpayment date and on February 9, May 9, August 9 and November 9 each year for each subsequentinterest payment date.
The Retail Bonds shall be repaid at maturity at par plus any outstanding interest, unless the ParentCompany exercises its early redemption option.
As of December 31, 2017 and 2016, outstanding balance of the bonds amounted to P=4,954.65 millionand P=4,934.23 million, respectively.
Redemption at the option of the issuerThe Group may redeem in whole, the outstanding Retail Bonds on the following relevant dates. Theamount payable to the bondholders upon the exercise of the early redemption option by the Groupshall be calculated, based on the principal amount of Retail Bonds being redeemed, as the sum of:(i) accrued interest computed from the last interest payment date up to the relevant early redemptionoption date; and (ii) the product of the principal amount of the Retail Bonds being redeemed and theearly redemption price in accordance with the following schedule:
a) Five Year Bonds:i. Three (3) years and six (6) months from issue date at early redemption price of 101.00%

- 61 -
*SGVFS028606*
ii. Four (4) years from issue date at early redemption price of 100.50%b) Seven Year Bonds:
i. Five (5) years and six (6) months from issue date at early redemption price of 101.00%ii. Six (6) years from issue date at early redemption price of 100.50%
CovenantsThe Retail Bonds provide for the Group to comply with certain covenants including, among others,incurrence or guarantee of additional indebtedness; prepayment or redemption of subordinate debtand equity; making certain investments and capital expenditures; consolidation or merger with otherentities; and certain other covenants. The Retail Bonds require the Group to maintain a current ratioof at least 1.00:1.00, a maximum debt-to-equity ratio of 1.50:1.00 and a DSCR of at least1.00:100. These were complied with by the Group as of December 31, 2017 and 2016.
Corporate Note FacilityOn December 28, 2016, the Parent Company (the Issuer) entered into a Corporate Notes FacilityAgreement with China Bank Capital Corporation for the issuance of a long term corporate notes witha principal amount of up to P=8,000.0 million. On April 21, 2017, a consent solicitation was made foramendments to include among others, increasing the corporate notes principal amount to up toP=10,000.00 million and the appointment of RCBC Capital Corporation as Co-Lead Arranger togetherwith the China Bank Capital Corporation in respect to the second draw down. Such amendmentswere consented by Note Holders representing at least fifty one percent (51%) of the outstandingcorporate notes. On April 27, 2017, the Group made such amendments to the Corporate Note Facilitydated December 28, 2016. The first drawdown was at P=5,150.00 million in 2016. On May 3, 2017,the Issuer made its second drawdown at P=4,850.00 million.
The proceeds for the first and second drawdown will be utilized for the 2017 capital expenditures,refinancing of existing indebtedness and to fund other general corporate expenses. The interests atthe first drawdown at 6.1879% per annum and 6.2255% per annum for the second drawdown arepayable quarterly in arrears while the principal amounts are payable in 2.00% annual amortizationson each principal repayment date with 82.00% to be repaid on maturity date. In case of default on thenotes, interest and any amount payable due to the lender, the borrower will pay a default interest. Theissue cost amounted to P=38.72 million.
The corporate notes provide early redemption at the option of the Issuer as follows:
Early Redemption Date
EarlyRedemption
Amount7th anniversary from issue date and interest payment thereafter 102.00%8th anniversary from issue date and interest payment thereafter 101.00%9th anniversary from issue date and interest payment thereafter 100.50%
As part of the issuance of the corporate notes, the subsidiaries of the Parent Company that acted asguarantors, irrevocably and unconditionally, are: Brittany Corporation, Camella Homes, Inc., CrownAsia Properties, Inc. Communities Philippines, Inc. Starmalls, Inc. and Vista Residences, Inc.
CovenantsThe Corporate Notes Facility requires the Parent Company to maintain the pari passu ranking with alland future unsecured and unsubordinated indebtedness except for obligations mandatorily preferredor in respect of which a statutory preference is established by law. The Parent Company is alsorequired to maintain at all times the following financial ratios: Current ratio at 1.00, debt to equity at
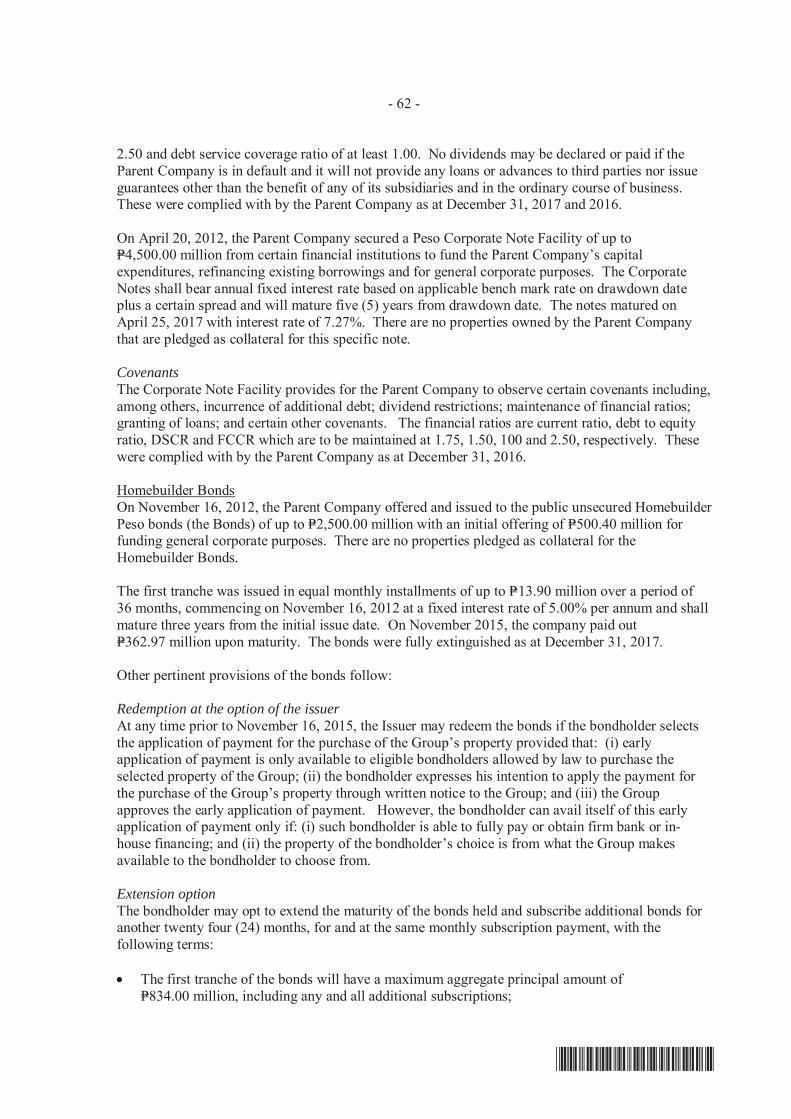
- 62 -
*SGVFS028606*
2.50 and debt service coverage ratio of at least 1.00. No dividends may be declared or paid if theParent Company is in default and it will not provide any loans or advances to third parties nor issueguarantees other than the benefit of any of its subsidiaries and in the ordinary course of business.These were complied with by the Parent Company as at December 31, 2017 and 2016.
On April 20, 2012, the Parent Company secured a Peso Corporate Note Facility of up toP=4,500.00 million from certain financial institutions to fund the Parent Company’s capitalexpenditures, refinancing existing borrowings and for general corporate purposes. The CorporateNotes shall bear annual fixed interest rate based on applicable bench mark rate on drawdown dateplus a certain spread and will mature five (5) years from drawdown date. The notes matured onApril 25, 2017 with interest rate of 7.27%. There are no properties owned by the Parent Companythat are pledged as collateral for this specific note.
CovenantsThe Corporate Note Facility provides for the Parent Company to observe certain covenants including,among others, incurrence of additional debt; dividend restrictions; maintenance of financial ratios;granting of loans; and certain other covenants. The financial ratios are current ratio, debt to equityratio, DSCR and FCCR which are to be maintained at 1.75, 1.50, 100 and 2.50, respectively. Thesewere complied with by the Parent Company as at December 31, 2016.
Homebuilder BondsOn November 16, 2012, the Parent Company offered and issued to the public unsecured HomebuilderPeso bonds (the Bonds) of up to P=2,500.00 million with an initial offering of P=500.40 million forfunding general corporate purposes. There are no properties pledged as collateral for theHomebuilder Bonds.
The first tranche was issued in equal monthly installments of up to P=13.90 million over a period of36 months, commencing on November 16, 2012 at a fixed interest rate of 5.00% per annum and shallmature three years from the initial issue date. On November 2015, the company paid outP=362.97 million upon maturity. The bonds were fully extinguished as at December 31, 2017.
Other pertinent provisions of the bonds follow:
Redemption at the option of the issuerAt any time prior to November 16, 2015, the Issuer may redeem the bonds if the bondholder selectsthe application of payment for the purchase of the Group’s property provided that: (i) earlyapplication of payment is only available to eligible bondholders allowed by law to purchase theselected property of the Group; (ii) the bondholder expresses his intention to apply the payment forthe purchase of the Group’s property through written notice to the Group; and (iii) the Groupapproves the early application of payment. However, the bondholder can avail itself of this earlyapplication of payment only if: (i) such bondholder is able to fully pay or obtain firm bank or in-house financing; and (ii) the property of the bondholder’s choice is from what the Group makesavailable to the bondholder to choose from.
Extension optionThe bondholder may opt to extend the maturity of the bonds held and subscribe additional bonds foranother twenty four (24) months, for and at the same monthly subscription payment, with thefollowing terms:
The first tranche of the bonds will have a maximum aggregate principal amount ofP=834.00 million, including any and all additional subscriptions;

- 63 -
*SGVFS028606*
All subscriptions held by bondholders who exercised the extension option shall mature on thefifth (5th) anniversary of the initial issue date;Upon exercise of the extension option at least six (6) months prior to the initial maturity date, allsubscriptions held shall bear interest on principal amount at a fixed rate of 6.75% per annum,applied prospectively from the initial maturity date to the extended maturity date; andInterest will not be compounded and shall be payable on the relevant maturity date or on the earlyredemption date, as may be applicable, less the amount of any applicable withholding taxes.
Interest expense on notes payable amounted to P=4,005.77 million, P=3,866.16 million and P=2,302.00million in 2017, 2016 and 2015, respectively (Note 24). As of December 31, 2017 and 2016, thebalance of unamortized bond premium amounted to P=59.20 million and P=48.64 million, respectively.
22. Other Noncurrent Liabilities
This account consists of:
2017 2016Liabilities for purchased land - net of current portion
(Note 18) P=818,805,840 P=1,809,275,473Retentions payable - net of current portion (Note 18) 718,286,908 457,264,712Deferred output tax - net of current portion
(Note 18) 136,989,567 111,969,819P=1,674,082,315 P=2,378,510,004
23. Equity
Capital StockThe details of the Parent Company’s capital stock follow:
2017 2016 2015CommonAuthorized shares 17,900,000,000 17,900,000,000 17,900,000,000Par value per share P=1.00 P=1.00 P=1.00Issued shares 13,114,136,376 13,114,136,376 12,654,891,753Outstanding shares 12,074,717,861 12,087,242,961 11,754,816,438Treasury shares (P=6,980,294,580) (P=6,917,014,956) (P=6,297,793,026)Value of shares issued P=13,114,136,376 P=13,114,136,376 P=12,654,891,753
PreferredAuthorized shares 10,000,000,000 10,000,000,000 10,000,000,000Par value per share P=0.01 P=0.01 P=0.01Issued and outstanding shares 3,300,000,000 3,300,000,000 3,300,000,000Value of shares issued 33,000,000 P=33,000,000 P=33,000,000

- 64 -
*SGVFS028606*
Common sharesIn February 2016, the Parent Company issued 459.24 million new common shares out of the unissuedportion of its authorized capital stock at issue price of P=7.15 per share or P=3,283.60 million, out ofwhich additional paid-in capital amounted to P=2,824.36 million. Costs related to issuance of sharesamounted to P=123.72 million and is presented as reduction to additional paid-in capital in theconsolidated statements of changes in equity.
In November 2015, the SEC approved the increase in the authorized capital stock of the ParentCompany from P=12,000.00 million divided into: (i) 11,900,000,000 common shares with par value ofP=1.00 per share, or an aggregate par value of P=11,900.00 million; and (ii) 10,000,000,000 preferredshares with par value of P=0.01 per share, or an aggregate par value of P=100.00 million, to P=18,000.00million divided into: (i) 17,900,000,000 common shares with par value of P=1.00 per share, or anaggregate par value of P=17,900.00 million and (ii) 10,000,000,000 preferred shares with par value ofP=0.01 per share, or an aggregate par value of P=100.00 million.
In 2015, the Parent Company issued 4,116,151,139 common shares out of the increase in the authorizedcapital stock. The issuance of the common shares that amounted to P=29,187.77 million, out of whichadditional paid-in capital amounted to P=25,071.57 million. The issuance of the common sharespertains to the Company’s acquisition of Starmalls Group (Note 7). The common shares issued at P=1.00par value per share totaled P=13,114.14 million, P=13,114.14 million and P=12,654.89 million for theyears ended December 31, 2017, 2016 and 2015, respectively.
The movement in the Parent Company’s common stock and amounts involved follows:
2017 2016 2015Shares Amount Shares Amount Shares Amount
At January 1 13,114,136,376 P=13,114,136,376 12,654,891,753 P=12,654,891,753 8,538,740,614 P=8,538,740,614Issuances 459,244,623 459,244,623 4,116,151,139 4,116,151,139At December 31 13,114,136,376 P=13,114,136,376 13,114,136,376 P=13,114,136,376 12,654,891,753 P=12,654,891,753
Preferred sharesOn March 21, 2013, the Parent Company issued in favor of Fine Properties, 3,300.00 million newpreferred shares out of the unissued portion of its authorized capital stock at par or an aggregate issueprice of P=33.00 million. The subscription price was fully paid on the same date. The preferred sharesare voting, non-cumulative, non-participating, non-convertible and non-redeemable. The BOD maydetermine the dividend rate which shall in no case be more than 10% per annum.
Registration Track RecordOn July 26, 2007, the Parent Company launched its follow-on offer where a total of 8,538,740,614common shares were offered at an offering price of P=6.85 per share. The registration statement wasapproved on June 25, 2007.
Below is the summary of the Parent Company’s track record of registration of securities with the SECas of December 31, 2017:
Number of SharesRegistered
Number of holders of securities as of year end
December 31, 2015 12,654,891,753 979Add/(Deduct) Movement 459,244,623 (8)December 31, 2016 13,114,136,376 971Add/(Deduct) Movement (11)December 31, 2017 13,114,136,376 960

- 65 -
*SGVFS028606*
Treasury SharesTreasury shares totaling 287,210,300 in 2017 and 274,685,200 in 2016 of the Parent Companyamounting to P=1,602.00 million and P=1,538.73 million, respectively, represents the shares of stockheld by the Parent Company, while treasury shares (752,208,215) amounting to P=5,378.29 millionrepresents Parent Company stocks held by Manuela. These treasury shares are recorded at cost.
On March 17, 2015, the BOD of the Parent Company approved the buyback of its common shares upto the extent of the total purchase price of P=1,500.00 million subject to the prevailing market price atthe time of the buyback over a 24-month period but subject to periodic review by the management.
On November 16, 2016, the BOD of the Parent Company approved the buyback of its common sharesup to the extent of the total purchase price of P=1,500.00 million subject to the prevailing market priceat the time of the buyback over a 24-month period but subject to periodic review by the management.
For the years ended December 31, 2017 and 2016, the Parent Company bought back from the marketa total of 12,525,100 shares or P=63.28 million in value and 126,818,100 or P=619.22 million in value,respectively.
The movement in the Parent Company’s treasury shares follows:
2017 2016 2015Shares Amount Shares Amount Shares Amount
At January 1 1,026,893,415 P=6,917,014,956 900,075,315 P=6,297,793,026 P=Additions 12,525,100 63,279,624 126,818,100 619,221,930 900,075,315 6,297,793,026At December 31 1,039,418,515 P=6,980,294,580 1,026,893,415 P=6,917,014,956 900,075,315 P=6,297,793,026
Retained EarningsIn accordance with Securities Regulation Code Rule No. 68, As Amended (2011), Annex 68-C, theParent Company’s retained earnings available for dividend declaration as of December 31, 2017, afterreconciling items, amounted to P=2,072.95 million, which is below the paid-up capital of P=43,802.57million. The paid up capital includes capital stock and additional paid-in capital of the ParentCompany.
Retained earnings include the accumulated equity in undistributed earnings of consolidatedsubsidiaries of P=40,448.07 million, P=31,356.20 million and P=25,684.72 million in 2017, 2016 and2015, respectively. These are not available for dividends until declared by the subsidiaries.
Also, the retained earnings is restricted to payments of dividends to the extent of cost of treasuryshares in the amount of P=1,602.00 million, P=1,538.73 million and P=919.50 as at and for the yearsended December 31, 2017, 2016 and 2015, respectively.
On September 29, 2017, the BOD approved the declaration of a regular cash dividend amounting toP=1,620.43 million or P=0.1342 per share, in favor of all stockholders of record as of October 16, 2017,with payment date on October 30, 2017.
On September 28, 2016, the BOD approved the declaration of a regular cash dividend amounting toP=1,437.14 million or P=0.1185 per share, in favor of all stockholders of record as ofSeptember 28, 2016, with payment date on October 28, 2016.
On September 15, 2015, the BOD approved the declaration of a regular cash dividend amounting toP=1,141.15 million or P=0.1357 per share, in favor of all stockholders of record as ofSeptember 15, 2015, payable on September 30, 2015.

- 66 -
*SGVFS028606*
Non-controlling interestIn 2016, the Vista Group acquired additional 750,265,955 shares of Starmalls, Inc. for a totalconsideration of P=3,383.70 million. The transaction was accounted for as an equity transaction sincethere was no change in control. The movements within equity are accounted as follows:
Fair value of consideration paid P=3,383,699,457Book value of shares 1,500,705,403Difference charged to equity 1,882,994,054Attributable to OCI 119,711,596Equity reserves recognized in additional paid in capital P=1,763,282,458
Capital ManagementThe primary objective of the Group’s capital management policy is to ensure that debt and equitycapital are mobilized efficiently to support business objectives and maximize shareholder value. TheGroup establishes the appropriate capital structure for each business line that properly reflects itspremier credit rating and allows it the financial flexibility, while providing it sufficient cushion toabsorb cyclical industry risks.
The Group considers debt as a stable source of funding. The Group lengthened the maturity profile ofits debt portfolio and makes it a point to spread out its debt maturities by not having a significantpercentage of its total debt maturing in a single year.
The Group manages its capital structure and makes adjustments to it, in the light of changes ineconomic conditions. It monitors capital using leverage ratios on both a gross debt and net debt basis.As of December 31, 2017, 2016 and 2015, the Group had the following ratios:
2017 2016 2015Current ratio 467% 302% 342%Debt-to-equity ratio 107% 99% 87%Net debt-to-equity ratio 60% 49% 46%Asset-to-equity ratio 238% 230% 219%
As of December 31, 2017, 2016 and 2015, the Group had complied with all externally imposedcapital requirements (Notes 20 and 21). No changes were made in the objectives, policies orprocesses for managing capital during the years ended December 31, 2017, 2016 and 2015.
The Group considers as capital the equity attributable to equity holders of the Parent Company.
The following table shows the component of the Group’s equity which it manages as capital as ofDecember 31, 2017, 2016 and 2015:
2017 2016 2015Total paid-up capital P=43,802,565,725 P=43,802,565,725 P=42,158,532,614Retained earnings 44,136,812,797 36,953,581,723 30,483,778,682Treasury shares (6,980,294,580) (6,917,014,956) (6,297,793,026)Other comprehensive income 1,333,327,591 1,111,006,329 742,530,256
P=82,292,411,533 P=74,950,138,821 P=67,087,048,526

- 67 -
*SGVFS028606*
Financial Risk AssessmentThe Group’s financial condition and operating results would not be materially affected by the currentchanges in liquidity, credit, interest, currency and market conditions.
Credit risks continue to be managed through defined credit policies and continuing monitoring ofexposure to credit risks. The Group’s base of counterparties remains diverse. As such, it is notexposed to large concentration of credit risk.
Exposure to changes in interest rates is reduced by regular availment of short-term loans as it relatesto its sold installment contracts receivables in order to cushion the impact of potential increase in loaninterest rates.
Exposure to foreign currency holdings are as follows:
2017 2016Cash and cash equivalents US$93,191,602 US$6,195,197AFS financial assets 130,009,248 162,494,525HTM investments 437,157,810 419,380,701Notes payable (695,856,089) (584,642,263)
Liquidity risk is addressed with long-term funding already locked in, while funds are placed on ashort-term placement.
24. Interest and Other Income from Investments and Interest and Other Financing Charges
Interest and other income from investments consists of:
2017 2016 2015Installment contracts receivable
(Note 10) P=476,094,934 P=609,080,060 P=672,339,166Accretion of unamortized discount
(Note 10) 67,428,832 33,562,135 37,942,404543,523,766 642,642,195 710,281,570
Cash and cash equivalents, short- term investments and cash restricted for use (Notes 8, 9 and 17) 79,593,675 143,350,393 110,473,069Gain on disposal of investment in
AFS (Note 9) 322,157,176HTM investments (Note 9) 800,881,961 721,024,942 482,511,647
1,202,632,812 864,375,335 592,984,716P=1,746,156,578 P=1,507,017,530 P=1,303,266,286
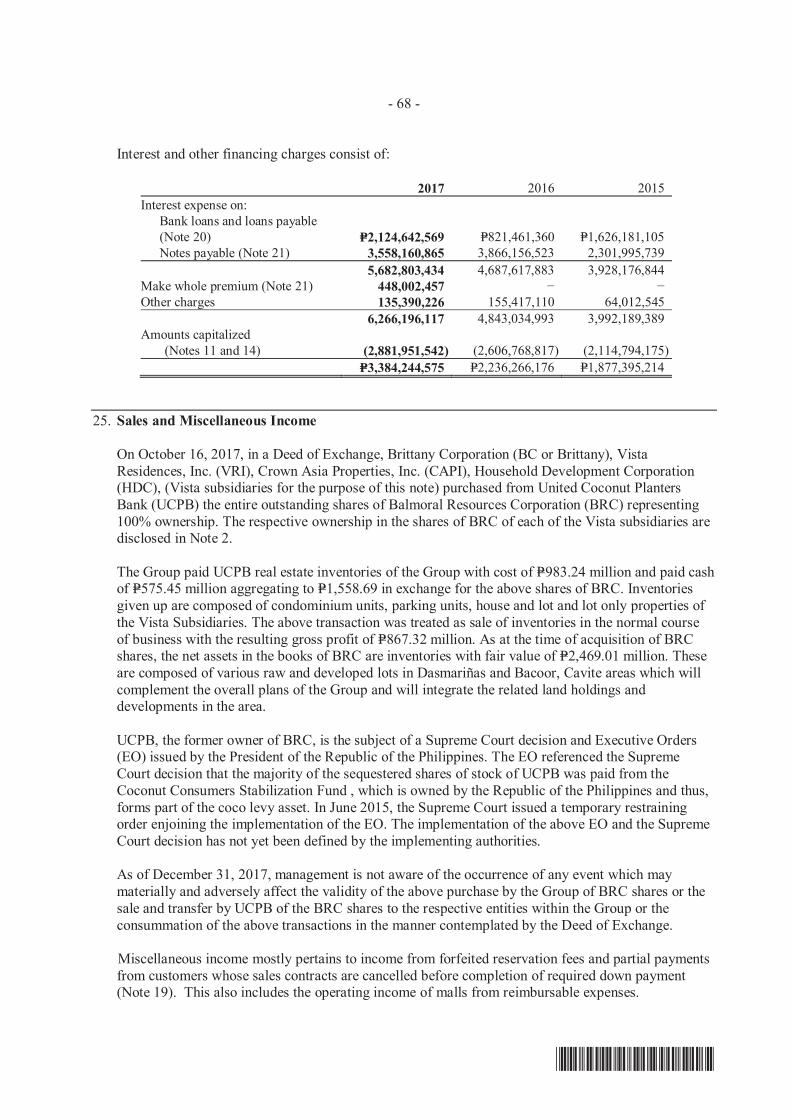
- 68 -
*SGVFS028606*
Interest and other financing charges consist of:
2017 2016 2015Interest expense on:
Bank loans and loans payable(Note 20) P=2,124,642,569 P=821,461,360 P=1,626,181,105Notes payable (Note 21) 3,558,160,865 3,866,156,523 2,301,995,739
5,682,803,434 4,687,617,883 3,928,176,844Make whole premium (Note 21) 448,002,457Other charges 135,390,226 155,417,110 64,012,545
6,266,196,117 4,843,034,993 3,992,189,389Amounts capitalized (Notes 11 and 14) (2,881,951,542) (2,606,768,817) (2,114,794,175)
P=3,384,244,575 P=2,236,266,176 P=1,877,395,214
25. Sales and Miscellaneous Income
On October 16, 2017, in a Deed of Exchange, Brittany Corporation (BC or Brittany), VistaResidences, Inc. (VRI), Crown Asia Properties, Inc. (CAPI), Household Development Corporation(HDC), (Vista subsidiaries for the purpose of this note) purchased from United Coconut PlantersBank (UCPB) the entire outstanding shares of Balmoral Resources Corporation (BRC) representing100% ownership. The respective ownership in the shares of BRC of each of the Vista subsidiaries aredisclosed in Note 2.
The Group paid UCPB real estate inventories of the Group with cost of P=983.24 million and paid cashof P=575.45 million aggregating to P=1,558.69 in exchange for the above shares of BRC. Inventoriesgiven up are composed of condominium units, parking units, house and lot and lot only properties ofthe Vista Subsidiaries. The above transaction was treated as sale of inventories in the normal courseof business with the resulting gross profit of P=867.32 million. As at the time of acquisition of BRCshares, the net assets in the books of BRC are inventories with fair value of P=2,469.01 million. Theseare composed of various raw and developed lots in Dasmariñas and Bacoor, Cavite areas which willcomplement the overall plans of the Group and will integrate the related land holdings anddevelopments in the area.
UCPB, the former owner of BRC, is the subject of a Supreme Court decision and Executive Orders(EO) issued by the President of the Republic of the Philippines. The EO referenced the SupremeCourt decision that the majority of the sequestered shares of stock of UCPB was paid from theCoconut Consumers Stabilization Fund , which is owned by the Republic of the Philippines and thus,forms part of the coco levy asset. In June 2015, the Supreme Court issued a temporary restrainingorder enjoining the implementation of the EO. The implementation of the above EO and the SupremeCourt decision has not yet been defined by the implementing authorities.
As of December 31, 2017, management is not aware of the occurrence of any event which maymaterially and adversely affect the validity of the above purchase by the Group of BRC shares or thesale and transfer by UCPB of the BRC shares to the respective entities within the Group or theconsummation of the above transactions in the manner contemplated by the Deed of Exchange.
Miscellaneous income mostly pertains to income from forfeited reservation fees and partial paymentsfrom customers whose sales contracts are cancelled before completion of required down payment(Note 19). This also includes the operating income of malls from reimbursable expenses.

- 69 -
*SGVFS028606*
To conform with the 2017 and 2016 presentation, the Group reclassified the excess of reimbursablelight and water expenses amounting to P=159.34 million in 2015 from occupancy cost tomiscellaneous income (Note 26). Management believes that the reclassification will give moreunderstanding to the reader of the financial statements given the nature of accounts.
26. Costs and Expenses
Cost of real estate salesCost includes acquisition cost of subdivision land, construction and development cost and capitalizedborrowing costs. Cost of real estate sales recognized for the years ended December 31, 2017, 2016and 2015 amounted to P=13,303.58 million, P=12,321.00 million and P=12,253.89 million, respectively(Note 11).
Operating expensesThis account consists of:
2017 2016 2015Commissions P=1,482,466,386 P=1,376,399,761 P=1,247,561,867Salaries, wages and employees
benefits (Note 28) 1,163,127,363 1,281,718,370 1,311,630,558Depreciation and amortization (Notes 14, 15 and 17) 1,305,156,158 1,029,980,066 798,919,810Advertising and promotions 900,933,561 1,129,111,882 1,317,186,308Repairs and maintenance (Note 14) 899,791,273 836,619,978 756,898,068Occupancy costs (Notes 25 and 34) 898,250,603 715,360,838 591,121,951Taxes and licenses 489,237,432 461,211,182 282,585,300Professional fees 460,787,673 300,101,628 305,200,669Transportation and travel 105,271,689 73,495,820 114,250,464Representation and entertainment 88,696,519 86,656,689 125,947,227Office expenses 43,205,134 39,597,211 56,259,898Provision for impairment losses on receivables (Note 10) 3,683,344 1,974,771 50,544,672Miscellaneous 240,281,042 262,281,221 157,479,117
P=8,080,888,177 P=7,594,509,417 P=7,115,585,909
Operating expenses represent the cost of administering the business of the Group. These arerecognized when the related services and costs have been incurred.
Occupancy costOccupancy cost consists of rent, light and power and other utility expenses.
The Group entered into various lease agreements for administrative purposes which are renewed onan annual basis with advanced deposits. Also, the Group is a lessee under various operating leasescovering parcels of land for completed and ongoing construction of commercial establishments.These leases have terms ranging from 20 to 25 years with rental escalation clauses and renewaloptions.

- 70 -
*SGVFS028606*
Rent expenses included under “Occupancy costs” amounted to P=214.12 million, P=136.74 million andP=142.71 million in 2017, 2016 and 2015, respectively (Note 34).
Miscellaneous expensesMiscellaneous expenses include dues and subscriptions, donations and other expenditures.
27. Other Expenses
This account consists of foreign exchange losses amounting to nil, P=25.69 million andP=7.02 million in 2017, 2016 and 2015, respectively.
28. Retirement Plan
The Group has noncontributory defined benefit pension plan covering substantially all of its regularemployees. The benefits are based on current salaries and years of service and related compensationon the last year of employment. The retirement is the only long-term employee benefit.
The principal actuarial assumptions used to determine the pension benefits with respect to thediscount rate, salary increases and return on plan assets were based on historical and projected normalrates.
The components of pension expense follow:
2017 2016 2015Current service cost (Note 26) P=67,902,138 P=83,952,065 P=133,810,647Interest cost 8,591,964 7,324,790 14,091,148Total pension expense P=76,494,102 P=91,276,855 P=147,901,795
Funded status and amounts recognized in the consolidated statements of financial position for thepension plan follow:
2017 2016 2015Plan assets P=506,700,526 P=434,496,381 P=377,164,819Defined benefit obligation (419,039,645) (532,630,210) (491,637,680)Pension Assets (Liability)
recognized in the consolidatedstatements of financialposition P=87,660,881 (P=98,133,829) (P=114,472,861)
Changes in the combined present value of the combined defined benefit obligation are as follows:
2017 2016 2015Balance at beginning of year P=532,630,210 P=491,637,680 P=632,840,548Transfer in (13,215,360) –Current service cost 67,902,138 83,952,065 133,810,647Interest cost 33,287,822 22,847,291 28,683,671Actuarial gain (214,780,525) (52,591,466) (303,697,186)Balance at end of year P=419,039,645 P=532,630,210 P=491,637,680

- 71 -
*SGVFS028606*
Changes in the fair value of the combined plan assets are as follows:
2017 2016 2015Balance at beginning of year P=434,496,381 P=377,164,819 P=320,844,860Interest income included in net
interest cost 24,745,858 15,522,501 14,592,524Actual return excluding amount
included in net interest cost (4,166,505) 2,172,478 (7,338,319)Contributions 51,624,792 39,636,583 49,065,754Balance at end of year P=506,700,526 P=434,496,381 P=377,164,819
The movements in the combined net pension (assets) liabilities follow:
2017 2016 2015Balance at beginning of year P=98,133,829 P=114,472,861 P=311,995,688Pension expense 76,444,102 91,276,855 147,901,795Transfer in (13,215,359) –Total amount recognized in OCI (210,614,020) (54,763,945) (296,358,868)Contributions (51,624,792) (39,636,583) (49,065,754)Balance at end of year (P=87,660,881) P=98,133,829 P=114,472,861
The assumptions used to determine the pension benefits for the Group are as follows:
2017 2016 2015Discount rates 5.80% 5.51% 5.65%Salary increase rate 7.75% 7.75% 7.75%
The turn-over rate used to compute the retirement liability is ranging from 10.00% at age 18 to 0.00%at age 60 in 2017 and ranging from 6% at age 18 to 0% at age 60 in 2016.
The distribution of the plan assets at year-end follows:
2017 2016 2015AssetsCash and cash equivalents P=47,525,181 P=213,444,809 P=122,890,077Investments in private companies 434,951,416 198,399,874 202,148,585Investments in government
securities 20,731,584 21,091,661 50,287,541Receivables 4,127,012 2,112,871 2,159,162
507,335,193 435,049,215 377,485,365LiabilityTrust fee payables 634,667 552,834 320,546Net plan assets P=506,700,526 P=434,496,381 P=377,164,819
The carrying amounts disclosed above reasonably approximate fair value at year-end. The overallexpected rate of return on assets is determined based on the market prices prevailing on that date,applicable to the period over which the obligation is to be settled.
The net unrealized gains on investments in government securities amounted to P=0.35 million,P=1.82 million and P=2.16 million as of December 31, 2017, 2016 and 2015, respectively.

- 72 -
*SGVFS028606*
The Group expects to contribute P=53.96 million to its retirement fund in 2018.
The composition of the fair value of the Fund includes:
Cash - include savings and time deposit with various banks and special deposit account.
Investments in private companies - include investments in long-term debt notes and corporatebonds.
Investments in government securities - include investment in Philippine RTBs.
Receivables - includes interest and dividends receivable generated from investments included inthe plan.
Trust fee payable - pertain mainly to charges of trust or in the management of the plan.
The Group retirement benefit fund is in the form of a trust being maintained by a trustee bank.The fund includes investment in the form of fixed-rate peso retail bonds of the Parent Companydue 2019, 2021 and 2027 with interest rates of 5.65%, 5.94% and 6.23%, respectively. As ofDecember 31, 2017 and 2016, the fair value of investment amounts to P=331.05 million andP=200.08 million, respectively. Interest income earned from the investments in bonds amounted toP=3.84 million and P=1.34 million in 2017 and 2016, respectively.
The allocation of the fair value of plan assets follows:
2017 2016Deposits 9.29% 48.39%Corporate bonds 84.98 44.98Government bonds 4.93 6.15
The funds are administered by a trustee bank under the supervision of the Board of Directors of theplan. The Board of Directors is responsible for investment of the assets. It defines the investmentstrategy as often as necessary, at least annually, especially in the case of significant marketdevelopments or changes to the structure of the plan participants. When defining the investmentstrategy, it takes account of the plans’ objectives, benefit obligations and risk capacity.
Shown below is the maturity analysis of the undiscounted benefit payments:
Plan Year 2017 2016Less than 1 year P=970,250 P=1,735,582More than 1 year to 5 years 19,150,032 1,455,132More than 5 years to 10 years 83,271,320 32,154,398More than 10 years to 15 years 345,093,667 140,638,679More than 15 years to 20 years 1,042,839,430 695,321,84220 years and beyond 4,919,929,008 4,438,759,747
P=6,411,253,707 P=5,310,065,380
The average duration of the expected benefit payments at the end of the reporting period is 29.71years.

- 73 -
*SGVFS028606*
Sensitivity analysis on the actuarial assumptionsEach sensitivity analysis on the significant actuarial assumptions was prepared by remeasuring theDefined Benefit Obligation (DBO) at the reporting date after adjusting one of the current assumptionsaccording to the applicable sensitivity increment or decrement (based on changes in the relevantassumption that were reasonably possible at the valuation date) while all other assumptions remainedunchanged. The sensitivities were expressed as the corresponding change in the DBO.
It should be noted that the changes assumed to be reasonably possible at the valuation date are opento subjectivity, and do not consider more complex scenarios in which changes other than thoseassumed may be deemed to be more reasonable.
Impact on Defined Benefit ObligationRates 2017 2016
Discount rate +1% 307,615,096 400,265,382-1% (431,392,602) (594,665,850)
Salary increase +1% 432,358,754 594,133,677-1% (306,432,651) (400,026,682)
Each year, an Asset-Liability Matching Study (ALM) is performed with the result being analyzed interms of risk-and-return profiles. Union Bank’s (UB) current strategic investment strategy consists of9.36% of cash, 4.09% of investments in government securities, 85.73% of investment in privatecompanies and 0.81% receivables. For the Group other than UB, the principal technique of theGroup’s ALM is to ensure the expected return on assets to be sufficient to support the desired level offunding arising from the defined benefit plans.
29. Income Tax
Provision for income tax consists of:
2017 2016 2015Current:
RCIT/MCIT P=1,443,448,108 P=1,218,757,113 P=887,669,604Final 7,583,382 7,914,896 9,356,228
Deferred 759,813,755 355,563,409 103,973,660P=2,210,845,245 P=1,582,235,418 P=1,000,999,492
Creditable withholding tax offset against income tax payable are disclosed in Note 12.
The components of the Group’s deferred taxes are as follows:
Net deferred tax assets:
2017 2016 2015Deferred tax assets on: Excess of tax basis over book basis of deferred gross profit on real estate sales P=761,709,815 P=397,686,311 P=258,901,652
Accrual of retirement costs 29,534,710 21,649,338 20,365,354NOLCO 2,911,709 9,613,462
(Forward)

- 74 -
*SGVFS028606*
2017 2016 2015Unrealized foreign exchange
losses P=21,589,604 P=20,826,711 P=Deferred tax component of OCI 17,832,879 10,427,970 6,639,768Unamortized discount
on receivables 9,152,109 4,075,483 5,857,946Allowance for probable losses 6,614,982 6,614,982Unamortized discount on loan 676,012Allowance for impairment
losses on land and improvements 2,519,137
Carry forward benefit of MCIT 72,742847,110,111 464,192,504 303,970,061
Deferred tax liabilities on:Accrual of retirement costs P=26,587,741 P= P=Deferred tax component of OCI 26,386,386 15,825,541 12,758,126Excess of book basis over tax basis of deferred gross profit on real estate sales 2,358,131 2,358,131 1,187,878Capitalized interest and other expenses (10,368,144) 8,829,861
44,964,114 27,013,533 13,946,004P=802,145,997 P=437,178,971 P=290,024,057
Net deferred tax liabilities:2017 2016 2015
Deferred tax assets on:Accrual of retirement costs P=109,169,751 P=70,267,721 P=100,089,396Allowance for probable losses 103,522,011 105,145,815 82,443,193Straight line lease adjustment 89,443,348 83,357,101 77,494,142Allowance for impairment losses
on land and improvements 56,259,059 56,259,059 49,796,496NOLCO 50,582,310 50,582,310 60,247,102Carryforward benefit of MCIT 14,914,385 14,914,385 19,470,784Unrealized foreign exchange
losses 11,518,188Unamortized discount
on receivables 4,809,550 7,487,835 17,074,606Excess of book basis over tax basis of deferred gross profit on real estate sales 559,451 1,990,319Deferred tax component of OCI 1,105,277Others 19,682,261
440,218,602 388,573,677 429,393,576Deferred tax liabilities on:
Excess of book basis over tax basis of deferred gross profit on real estate sales P=1,166,220,101 P=1,320,017,722 P=1,188,315,051Capitalized interest and other
expenses 1,157,735,547 410,868,230 364,574,878Straight line lease adjustment 1,145,999,197 615,532,454 286,239,613Deferred tax component of OCI 61,407,113 38,618,296 66,832,511Retirement Expense 29,935,113 9,630,024
(Forward)

- 75 -
*SGVFS028606*
2017 2016 2015Fair Value Adjustments from
business combination P=23,619,214 P=23,619,214 P=24,415,579Unamortized bond transaction
cost 22,604,672 13,809,483 35,165,647Discount on rawlands payable 21,373,197 21,373,197 1,017,419Unrealized foreign exchange gain 8,377,135 747,265Others 19,315,055
3,656,586,344 2,454,215,885 1,966,560,698(P=3,216,367,742) (P=2,065,642,208) (P=1,537,167,122)
As of December 31, 2017, 2016 and 2015, the Group has deductible temporary differences, NOLCOand MCIT that are available for offset against future taxable income for which no deferred tax assetshave been recognized as follows:
2017 2016 2015NOLCO P=5,440,943,955 P=4,503,058,091 P=158,263,294Accrual of retirement cost 345,014 30,476,159 5,868,838MCIT 14,067,939 6,545,367 2,543,371Post-employment benefit
obligation 1,497,145 630,361Allowance on probable losses 26,742,003Unrealized foreign exchange loss 11,925,344
P=5,455,356,908 P=4,580,244,109 P=167,305,864
The related unrecognized deferred tax assets on these deductible temporary differences amounted toP=1,646.45 million, P=1,378.65 million and P=51.97 million as of December 31, 2017, 2016 and 2015,respectively.
Deferred tax assets are recognized only to the extent that taxable income will be available againstwhich the deferred tax assets can be used. The subsidiaries will recognize a previously unrecognizeddeferred tax asset to the extent that it has become probable that future taxable income will allow thedeferred tax asset to be recovered.
As of December 31, 2017, the details of the unused tax credits from the excess of the MCIT overRCIT and NOLCO, which are available for offset against future income tax payable and taxableincome, respectively, over a period of three (3) years from the year of inception, follow:
NOLCO
Inception Year Amount Used/Expired Balance Expiry Year2014 P=1,578,172,076 (P=1,578,172,076) P= 20172015 1,562,731,542 1,562,731,542 20182016 1,589,720,373 1,589,720,373 20192017 2,457,099,740 2,457,099,740 2020
P=7,187,723,731 (P=1,578,172,076) P=5,609,551,655

- 76 -
*SGVFS028606*
MCIT
Inception Year Amount Used/Expired Balance Expiry Year2014 P=5,283,434 (P=5,283,434) P= 20172015 20,696,410 20,696,410 20182016 6,570,554 6,570,554 20192017 1,715,360 1,715,360 2020
P=34,265,758 (P=5,283,434) P=28,982,324
The reconciliation of the provision for income tax computed at the statutory income tax rate to theprovision for income tax shown in profit or loss follows:
2017 2016 2015Provision for income tax computed at the statutory income tax rate 30.00% 30.00% 30.00%Additions to (reductions in) income tax resulting from:
Nondeductible interest and other expenses 3.28 5.65 5.06
Change in unrecognized deferred tax assets 3.15 17.65 (12.20)
Tax-exempt income (9.13) (29.42) (11.31)Expired MCIT and NOLCO (4.25) (3.95) (0.04)Interest income already subjected
to final tax (0.14) (0.04) (0.22)Equity in net loss of an associate –Others (3.30) (3.56) 0.61
Provision for income tax 19.61% 16.33% 11.90%
Board of Investments (BOI) IncentivesThe BOI issued in favor of certain subsidiaries in the Group a Certificate of Registration as Developerof Mass Housing Projects for its 43 projects in 2017, 11 projects in 2016 and 5 projects in 2015, inaccordance with the Omnibus Investment Code of 1987. Pursuant thereto, the projects have beengranted an Income Tax Holiday for a period of either three years for new projects, or four years forexpansion projects, commencing from the date of issuance of the Certificate of Registration.
The Group availed of tax incentive in the form of ITH on its income under registered activitiesamounting to P=625.68 million, P=453.27 million and P=744.87 million in 2017, 2016 and 2015,respectively.
30. Related Party Transactions
Parties are considered to be related if one party has the ability, directly or indirectly, to control the otherparty in making financial and operating decisions or the parties are subject to common control orcommon significant influence. Entities under common control are those entities outside the Group butare related parties of Fine Properties, Inc. Related parties may be individuals or corporate entities.
The Group in their regular conduct of business has entered into transactions with related partiesprincipally consisting of trade transactions from mall leasing, advances, reimbursement of expensesand purchase and sale of real estate properties.

- 77 -
*SGVFS028606*
The consolidated statements of financial position include the following amounts resulting from theforegoing transactions which represent amounts receivable (payable) to related parties as ofDecember 31, 2017 and 2016:
December 31, 2017
Relationship Nature of TransactionAmount/Volume
OutstandingBalance Terms Conditions
Receivable from tenants (Note 10)
Entities under Common Control a) Rental of mall spaces P=208,896,936 P=1,471,135,449 Non-interest bearingUnsecured,
No impairmentAdvances in project development cost(Note 16)
Entities under Common Controlb) Purchase of housing
credits P=775,367,103 P=2,233,118,324 Non-interest bearingUnsecured,
No impairmentReceivable from related parties
Ultimate Parent c) Advances P=700,392,700 P=3,580,432,843 Non-interest bearingUnsecured,
No impairment
Entities under Common Control c) Advances 584,383,046 1,407,497,646 Non-interest bearingUnsecured,
No impairmentP=1,284,775,746 P=4,987,930,489
Dividends DeclaredStockholders c) Dividends P=840,191,470
December 31, 2016
Relationship Nature of TransactionAmount/Volume
OutstandingBalance Terms Conditions
Receivable from tenants (Note 10)
Entities under Common Control a) Rental of mall spaces P=197,323,912 P=480,888,126 Non-interest bearingUnsecured,
No impairmentAdvances in project development cost(Note 16)
Entities under Common Controlb) Purchase of housing
credits P=393,087,247 P=1,457,751,221 Non-interest bearingUnsecured,
No impairmentReceivable from related parties
Ultimate Parent c) Advances P=245,474,309 P=2,880,040,145 Non-interest bearingUnsecured,
No impairment
Entities under Common Control c) Advances 222,424,579 1,036,629,313 Non-interest bearingUnsecured,
No impairmentP=467,898,888 P=3,916,669,458
Dividends DeclaredStockholders c) Dividends P=745,156,384
a) The Group has operating lease agreements with All Value Group which is comprised of AllHomeCorp., AllDay Retail Concepts, Inc. and Family Shoppers Unlimited. Inc., for the leases ofcommercial spaces. All Value Group is engaged in retail businesses covering supermarkets, retailof apparel, construction materials and home/building appliances and furnishings. The leaseagreements are renewable annually and contains escalation clauses. Rental income from AllValue Group amounted to P=1,250.14 million and P=1,008.79 million as of December 31, 2017 and2016, respectively. These are non-interest bearing, unsecured and are not impaired.
On October 30, 2017, Manuela Corporation (MC) and MAPI entered into a memorandum ofagreement with AllHome Corp. wherein MC and MAPI will offset its receivables from AllHomeCorp. relating to mall rental and other charges, against billings of AllHome Corp to MC andMAPI for the supply of construction materials and home/building appliances and furnishings.Amount offset with receivables amounted to P=5.00 million in 2017.
b) On December 23, 2016, the Group entered into a Memorandum of Agreement with Bria Homes,Inc., a developer of socialized housing projects located in various areas in the Philippines toassign portions of the socialized housing project in compliance with the requirements of RepublicAct No. 7279 (Urban Development and Housing Act of 1992).
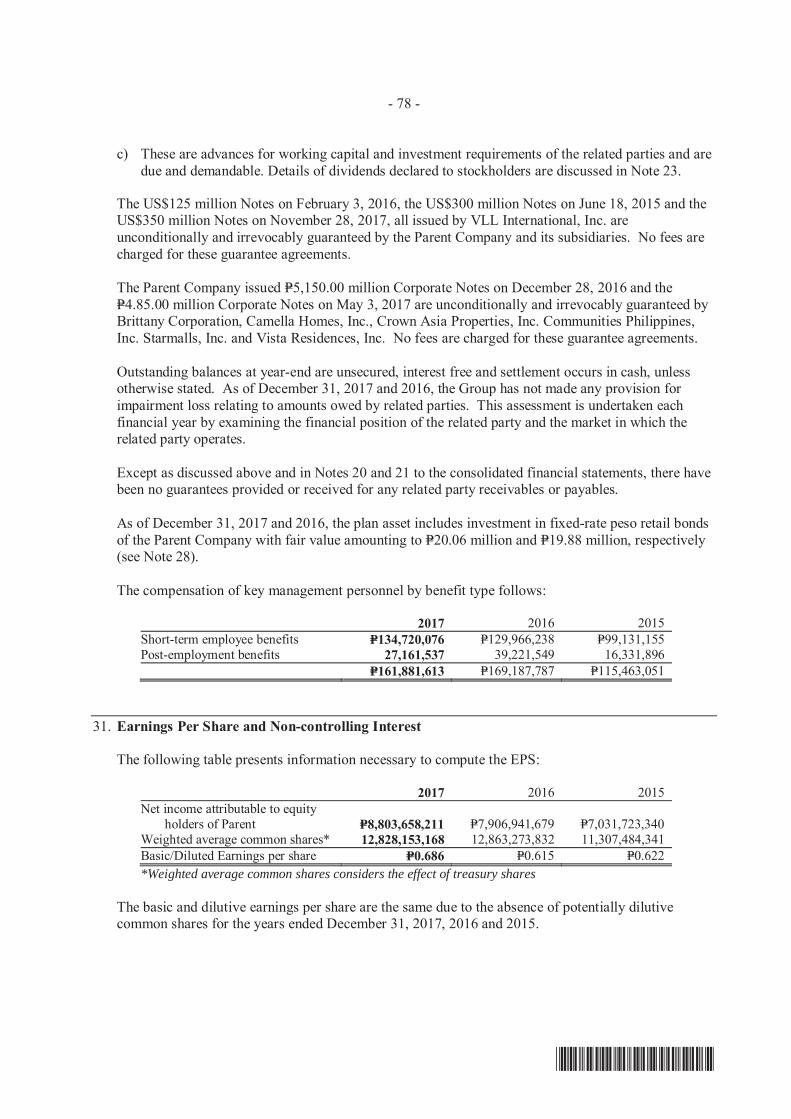
- 78 -
*SGVFS028606*
c) These are advances for working capital and investment requirements of the related parties and aredue and demandable. Details of dividends declared to stockholders are discussed in Note 23.
The US$125 million Notes on February 3, 2016, the US$300 million Notes on June 18, 2015 and theUS$350 million Notes on November 28, 2017, all issued by VLL International, Inc. areunconditionally and irrevocably guaranteed by the Parent Company and its subsidiaries. No fees arecharged for these guarantee agreements.
The Parent Company issued P=5,150.00 million Corporate Notes on December 28, 2016 and theP=4.85.00 million Corporate Notes on May 3, 2017 are unconditionally and irrevocably guaranteed byBrittany Corporation, Camella Homes, Inc., Crown Asia Properties, Inc. Communities Philippines,Inc. Starmalls, Inc. and Vista Residences, Inc. No fees are charged for these guarantee agreements.
Outstanding balances at year-end are unsecured, interest free and settlement occurs in cash, unlessotherwise stated. As of December 31, 2017 and 2016, the Group has not made any provision forimpairment loss relating to amounts owed by related parties. This assessment is undertaken eachfinancial year by examining the financial position of the related party and the market in which therelated party operates.
Except as discussed above and in Notes 20 and 21 to the consolidated financial statements, there havebeen no guarantees provided or received for any related party receivables or payables.
As of December 31, 2017 and 2016, the plan asset includes investment in fixed-rate peso retail bondsof the Parent Company with fair value amounting to P=20.06 million and P=19.88 million, respectively(see Note 28).
The compensation of key management personnel by benefit type follows:
2017 2016 2015Short-term employee benefits P=134,720,076 P=129,966,238 P=99,131,155Post-employment benefits 27,161,537 39,221,549 16,331,896
P=161,881,613 P=169,187,787 P=115,463,051
31. Earnings Per Share and Non-controlling Interest
The following table presents information necessary to compute the EPS:
2017 2016 2015Net income attributable to equity
holders of Parent P=8,803,658,211 P=7,906,941,679 P=7,031,723,340Weighted average common shares* 12,828,153,168 12,863,273,832 11,307,484,341Basic/Diluted Earnings per share P=0.686 P=0.615 P=0.622*Weighted average common shares considers the effect of treasury shares
The basic and dilutive earnings per share are the same due to the absence of potentially dilutivecommon shares for the years ended December 31, 2017, 2016 and 2015.

- 79 -
*SGVFS028606*
As of December 31, 2017, 2016 and 2015, the accumulated balances of and net income attributable tonon-controlling interests follows:
2017 2016 2015Accumulated balances:
Starmalls Group P=1,550,677,573 P=1,348,688,755 P=2,692,595,308Manuela 217,598,442 196,478,623 185,445,525
Share in dividendStarmalls Group 36,192,507 21,367,435
Net income attributable to:Starmalls Group 237,835,848 179,100,462 81,340,194Manuela 21,276,429 14,325,779 73,939,422
Other comprehensive incomeattributable to:Starmalls Group 345,477 (934,178) 1,349,193Manuela (156,610) (3,292,680) (24,286,960)
32. Fair Value Determination
The Group uses the following hierarchy for determining and disclosing the fair value of financialinstruments by valuation technique:
Level 1: Quoted (unadjusted) prices in active markets for identical assets or liabilities;Level 2: Valuation techniques involving inputs other than quoted prices included in
Level 1 that are observable for the asset or liability, either directly or indirectly; and
Level 3: Other valuation techniques involving inputs for the asset or liability that are notbased on observable market data (unobservable inputs).
The following methods and assumptions were used to estimate the fair value of each class of financialinstrument for which it is practicable to estimate such value:
Cash and cash equivalents short-term cash investments, accrued interest receivable, receivables fromtenants, buyers and others, receivables from related parties and accounts and other payables exceptfor deferred output VAT and other statutory payables: Due to the short-term nature of the accounts,the fair value approximate the carrying amounts in the consolidated statements of financial position.
Installment contracts receivables: Estimated fair value of long-term portion of installment contractsreceivables is based on the discounted value of future cash flows using the prevailing interest rates forsimilar types of receivables as of the reporting date using the remaining terms of maturity. Thediscount rate used ranged from 3.08% to 4.90% in 2017 and 2.82% to 5.04% in 2016.
AFS financial assets: Fair values of debt and equity securities are based on quoted market prices. ForAFS investment in unquoted equity securities, these are carried and presented at cost since fair valueis not reasonably determinable due to the unpredictable nature of future cash flows and without anyother suitable methods of arriving at a reliable fair value.
HTM investments: The fair value of HTM investments that are actively traded in organized financialmarkets is determined by reference to quoted market bid prices, at the close of business on thereporting date.

- 80 -
*SGVFS028606*
Bank loans, loans payable, notes payable and retention payable:Estimated fair values are based on the discounted value of future cash flows using the applicable ratesfor similar types of loans. Interest rates used in discounting cash flows ranged from 3.88% to 5.75%in 2017 and 3.58% to 7.27% in 2016 using the remaining terms to maturity.
The following table provides the fair value measurement and the hierarchy of the Group’s financialassets and liabilities recognized as of December 31, 2017 and 2016:
December 31, 2017Fair Value
Carrying values Total
Quoted prices inactive markets
for identicalassets
(Level 1)
Significant offerobservable
inputs(Level 2)
Significantunobservable
inputs(Level 3)
AssetsFinancial assets measured at fair value:
AFS financial assets P=6,568,238,766 P=6,568,238,766 P=6,568,238,766 P= P=Financial assets for which fair values are
disclosed: Installment contract receivables 30,943,358,823 31,013,722,726 31,013,722,726 HTM investments 21,827,289,447 21,874,926,636 21,874,926,636LiabilitiesFinancial liabilities for which fair values
are disclosed Bank loans 35,799,812,028 26,305,509,403 26,305,509,403 Notes payable 54,501,042,238 38,247,956,919 38,247,956,919
Loans payable 3,760,465,983 2,916,312,620 2,916,312,620
December 31, 2016Fair Value
Carrying values Total
Quoted prices inactive markets
for identicalassets
(Level 1)
Significant offerobservable
inputs(Level 2)
Significantunobservable
inputs(Level 3)
AssetsFinancial assets measured at fair value:
AFS financial assets P=8,148,815,919 P=8,148,815,919 P=8,148,815,919 P=– P=Financial assets for which fair values are
disclosed: Installment contract receivables 28,123,412,383 – – 28,123,412,383 HTM investments 20,851,608,454 26,916,602,632 26,916,602,632 –LiabilitiesFinancial liabilities for which fair values
are disclosed Bank loans 36,087,242,292 28,600,559,439 – – 28,600,559,439 Notes payable 39,525,115,572 30,309,713,338 – – 30,309,713,338
Loans payable 3,887,252,607 3,265,162,468 – – 3,265,162,468
In 2017 and 2016, there were no transfers between Levels of fair value measurements.
Significant increases (decreases) in discount rate would result in significantly higher (lower) fairvalue of the installment contracts receivables, notes payable, loans payable, bank loans retentionpayable and liabilities for purchased land.

- 81 -
*SGVFS028606*
Description of significant unobservable inputs to valuation
Account Valuation Technique Significant Unobservable InputsInstallment contracts receivables Discounted cash flow analysis Discount rateBank loans Discounted cash flow analysis Discount rateNotes payable Discounted cash flow analysis Discount rateLoans payable Discounted cash flow analysis Discount rate
33. Financial Asset and Liabilities
Financial Risk Management Objectives and PoliciesFinancial riskThe Group’s principal financial liabilities comprise of bank loans, loans payable, notes payable,accounts and other payables (except for deferred output VAT and other statutory payables) andliabilities for purchased land. The main purpose of the Group’s financial liabilities is to raisefinancing for the Group’s operations. The Group has various financial assets such as installmentcontracts receivables, cash and cash equivalents and short-term, long-term cash investments, HTMinvestments and AFS financial assets which arise directly from its operations. The main risks arisingfrom the use of financial instruments are interest rate risk, foreign currency risk, credit risk andliquidity risk.
The BOD reviews and approves with policies for managing each of these risks. The Group monitorsmarket price risk arising from all financial instruments and regularly report financial managementactivities and the results of these activities to the BOD.
The Group’s risk management policies are summarized below. The exposure to risk and how theyarise, as well as the Group’s objectives, policies and processes for managing the risk and the methodsused to measure the risk did not change from prior years.
Cash flow interest rate riskThe Group’s exposure to market risk for changes in interest rates, relates primarily to its financialassets and liabilities that are interest-bearing.
The Group’s policy is to manage its interest cost by entering into fixed rate debts. The Group alsoregularly enters into short-term loans as it relates to its sold installment contracts receivables in orderto cushion the impact of potential increase in loan interest rates.
The table below shows the financial assets and liabilities that are interest-bearing:
December 31, 2017Effective
Interest Rate AmountFinancial assetsFixed rateCash and cash equivalents (excluding cash on hand) 0.10% to 2.75% P=11,479,389,676Short-term cash investments 2.00% to 9.25% 345,639,559HTM investments 2.82% to 4.80% 21,827,289,447Installment contracts receivable 4.32% to 4.90% 30,851,702,032
P=64,504,020,714

- 82 -
*SGVFS028606*
December 31, 2017Effective
Interest Rate AmountFinancial liabilitiesFixed rateNotes payable 5.00% to 7.45% P=54,501,042,238Bank loans 3.75% to 10.50% 35,799,812,028Loans payable 7.00% to12.00% 3,760,465,983
P=94,061,320,249
December 31, 2016Effective
Interest Rate AmountFinancial assetsFixed rateCash and cash equivalents (excluding cash on hand) 0.10% to 0.50% P=8,879,974,432Short-term cash investments 1.37% to 2.50% 99,998,562HTM investments 1.33% to 3.12% 20,851,608,454Installment contracts receivable 1.57% to 3.79% 29,157,514,308
P=58,989,095,756
Financial liabilitiesFixed rateNotes payable 5.00% to 7.45% P=39,525,115,572Bank loans 3.88% to 10.75% 36,087,242,292Loans payable 7.00% to12.00% 3,887,252,607
P=79,499,610,471
As of December 31, 2017 and 2016, the Group’s income and operating cash flows are substantiallyindependent of changes in market interest rates.
Foreign exchange riskThe Group’s foreign exchange risk results primarily from movements of the Philippine Peso againstthe United States Dollar (USD). Approximately 37.11% and 36.56% of the debt of the Group as ofDecember 31, 2017 and 2016, respectively, are denominated in USD. The Group’s foreign currency-denominated debt comprises of the notes payable in 2017 and 2016.
Below are the carrying values and the amounts in US$ of these foreign currency denominatedfinancial assets and liabilities:
December 31, 2017Peso US$
AssetsCash and cash equivalents P=4,653,056,688 $93,191,602AFS financial assets 6,491,361,776 130,009,248HTM investments 21,827,287,456 437,157,770
32,971,705,920 660,358,620LiabilityNotes payable (34,907,625,160) (699,131,287)Net foreign currency position (P=1,935,919,263) ($38,772,667)

- 83 -
*SGVFS028606*
December 31, 2016Peso US$
AssetsCash and cash equivalents P=308,025,195 $6,195,197AFS financial assets 8,079,227,776 162,494,525HTM investments 20,851,608,454 419,380,701
29,238,861,425 588,070,423LiabilityNotes payable (29,068,413,316) (584,642,263)Net foreign currency position P=170,448,116 $3,428,160
In translating the foreign currency- denominated monetary assets and liabilities in peso amounts, thePhilippine Peso - US dollar exchange rates as at December 31, 2017 and 2016 used were P=49.93 toUS$1.00 and P=49.72 to US$1.00.
The following table demonstrates the sensitivity to a reasonably possible change in the US dollarexchange rate until its next annual reporting date, with all other variables held constant, of theGroup’s 2017 and 2016 profit before tax (due to changes in the fair value of monetary assets andliabilities) as of December 31, 2017 and 2016:
December 31, 2017Increase/Decrease
in US Dollar rate
Effect onincome
before taxCash and cash equivalents +2.14% P=1,729,428
-2.14% (1,729,428)HTM investments +2.14%
-2.14%AFS financial assets +2.14%
-2.14%Notes payable +2.14%
-2.14%
December 31, 2016Increase/Decrease
in US Dollar rate
Effect onincome
before taxCash and cash equivalents +1.44% P=314,776
-1.44% (314,776)HTM investments +1.44%
-1.44%AFS financial assets +1.44%
-1.44%Notes payable +1.44%
-1.44%
The assumed movement in basis points for foreign exchange sensitivity analysis is based on themanagement’s forecast of the currently observable market environment, showing no materialmovements as in prior years.
There are no items affecting equity except for those having impact on profit or loss.

- 84 -
*SGVFS028606*
Credit riskThe Group transacts only with recognized and creditworthy third parties. The Group’s receivablesare monitored on an ongoing basis resulting to manageable exposure to bad debts. Real estate buyersare subject to standard credit check procedures, which are calibrated based on the payment schemeoffered. The Group’s respective credit management units conduct a comprehensive creditinvestigation and evaluation of each buyer to establish creditworthiness.
Receivable balances are being monitored on a regular basis to ensure timely execution of necessaryintervention efforts. In addition, the credit risk for installment contracts receivables is mitigated asthe Group has the right to cancel the sales contract without need for any court action and takepossession of the subject house in case of refusal by the buyer to pay on time the due installmentcontracts receivable. This risk is further mitigated because the corresponding title to the real estateproperties sold under this arrangement is transferred to the buyers only upon full payment of thecontract price.
With respect to credit risk arising from the other financial assets of the Group, which are comprisedof cash and cash equivalents, short-term cash investments, AFS financial assets and HTMinvestments, the Group’s exposure to credit risk arises from default of the counterparty, with amaximum exposure equal to the carrying amount of these instruments.
The table below shows the comparative summary of maximum credit risk exposure on financialassets as of December 31, 2017 and 2016:
2017Maximum
Credit ExposureFair Value of
CollateralNet Exposure to
Credit RiskFinancial
EffectLoans and Receivables
Cash and cash equivalents (excluding cash on hand) P=11,479,389,676 P=– P=11,479,389,676 P=–
Short-term cash investments 345,639,559 – 345,639,559 –Receivables
Installment contracts receivables 30,823,068,569 38,564,627,540 30,823,068,569 Others 13,636,258,268 – 13,636,258,268 –
56,284,356,072 38,564,627,540 25,461,287,504 30,823,068,569HTM investments 21,827,289,447 21,827,289,447AFS Financial Assets
Investments in quoted debtsecurities 6,491,361,776 – 6,491,361,776 –
Investment in quoted equitysecurities 76,876,990 76,876,990
Investments in unquoted equity securities 44,703,353 – 44,703,353 –
P=84,724,587,638 P=38,564,627,540 P=53,901,519,070 P=30,823,068,569

- 85 -
*SGVFS028606*
2016Maximum
Credit ExposureFair Value of
CollateralNet Exposure to
Credit RiskFinancial
EffectLoans and ReceivablesCash and cash equivalents (excluding cash on hand) P=8,879,974,432 P=– P=8,879,974,432 P=–Short-term cash investments 99,998,562 – 99,998,562 –Receivables Installment contracts receivables 28,123,412,383 36,892,198,739 – 28,123,412,383 Others 9,811,601,814 – 9,811,601,814 –
46,914,987,191 36,892,198,739 18,791,574,808 28,123,412,383HTM investments 20,851,608,454 – 20,851,608,454 –AFS Financial Assets Investments in quoted debt
securities 8,079,227,776 – 8,079,227,776 – Investment in quoted equity
securities 69,588,143 69,588,143 Investments in unquoted equity
securities 96,248,934 – 96,248,934 –P=75,915,411,564 P=36,892,198,739 P=47,791,999,181 P=28,123,412,383

- 86
-
*SGVFS028606*
Giv
en th
e G
roup
’s d
iver
se b
ase
of c
ount
erpa
rties
, it i
s no
t exp
osed
to la
rge
conc
entra
tions
of c
redi
t ris
k. A
s of
Dec
embe
r 31,
201
7 an
d 20
16, t
he a
ging
ana
lyse
s of
pas
tdu
e bu
t not
impa
ired
rece
ivab
les,
pre
sent
ed p
er c
lass
are
as
follo
ws:
Dec
embe
r 31
, 201
7
Nei
ther
Pas
tT
otal
of P
ast
Impa
ired
Due
Nor
Past
Due
But
Not
Impa
ire d
Due
But
Not
Fina
ncia
lIm
pair
ed<3
0 da
ys30
-60
days
60-9
0 da
ys>9
0 da
ysIm
pair
edA
sset
sT
otal
Insta
llmen
t con
tract
rece
ivab
les
P=25,
794,
583,
682
P=512
,119
,679
P=492
,637
,459
P=1,6
25,7
03,0
67P=2
,398
,024
,682
P=5,3
05,5
06,2
71P=1
20,2
90,2
54P=3
0,94
3,35
8,82
3O
ther
rece
ivab
les
7,83
9,09
3,15
061
6,82
4,81
819
6,40
4,03
231
5,65
7,68
54,
391,
419,
581
5,24
3,28
4,73
227
6,73
6,18
413
,636
,135
,450
Tota
lP=3
3,63
3,67
6,83
2P=1
,128
,944
,497
P=689
,041
,491
P=1,9
41,3
60,7
52P=6
,789
,444
,263
P=10,
548,
791,
003
P=397
,026
,438
P=44,
579,
494,
273
Dec
embe
r 31,
201
6
Nei
ther
Pas
tTo
tal o
f Pas
tIm
paire
dD
ue N
orPa
st D
ue B
ut N
ot Im
paire
dD
ue B
ut N
otFi
nanc
ial
Impa
ired
<30
days
30-6
0 da
ys60
-90
days
>90
days
Impa
ired
Ass
ets
Tota
lIn
stallm
ent c
ontra
ct re
ceiv
able
sP=2
5,30
9,20
7,74
5P=3
15,8
34,0
95P=4
16,4
39,2
92P=2
45,4
23,7
07P=1
,716
,217
,290
P=2,6
93,9
14,3
84P=1
20,2
90,2
54P=2
8,12
3,41
2,38
3O
ther
rece
ivab
les
6,25
9,36
6,61
285
7,88
1,68
183
,737
,811
48,8
87,0
782,
288,
675,
792
3,27
9,18
2,36
227
3,05
2,84
09,
811,
601,
814
Tota
lP=3
1,56
8,57
4,35
7P=1
,173
,715
,776
P=500
,177
,103
P=294
,310
,785
P=4,0
04,8
93,0
82P=5
,973
,096
,746
P=393
,343
,094
P=37,
935,
014,
197
Thos
e ac
coun
ts th
at a
re c
onsi
dere
d ne
ither
pas
t due
nor
impa
ired
are
rece
ivab
les
with
out a
ny d
efau
lt in
pay
men
ts an
d th
ose
acco
unts
whe
rein
the
man
agem
ent h
asas
sess
ed th
at re
cove
rabi
lity
is hi
gh.

- 87
-
*SGVFS028606*
The
tabl
es b
elow
show
the
cred
it qu
ality
of t
he G
roup
’s fi
nanc
ial a
sset
s as o
f Dec
embe
r 31,
201
7 an
d 20
16, g
ross
of a
llow
ance
for i
mpa
irmen
t los
ses:
Dec
embe
r 31
, 201
7N
eith
er p
ast d
ue n
or im
pair
edPa
st d
ue b
utH
igh
grad
eM
ediu
m g
rade
Low
gra
deT
otal
not i
mpa
ired
Impa
ired
Tot
alLo
ans a
nd R
ecei
vabl
es
Cash
and
cas
h eq
uiva
lent
s (ex
clud
ing
cash
on
hand
)P=1
1,47
9,38
9,67
7P=–
P=–P=1
1,47
9,38
9,67
7P=–
P=–P=1
1,47
9,38
9,67
7
Shor
t-ter
m c
ash
inve
stmen
ts34
5,63
9,55
9–
–34
5,63
9,55
9–
345,
639,
559
R
ecei
vabl
es
In
stallm
ent c
ontra
cts r
ecei
vabl
e22
,782
,729
,690
2,67
6,74
7,29
025
,459
,476
,980
5,36
3,59
1,58
912
0,29
0,25
430
,943
,358
,823
Oth
ers
5,58
7,17
3,75
12,
464,
355,
932
8,05
1,52
9,68
35,
307,
869,
583
276,
736,
184
13,6
36,1
35,4
50
Long
-term
cas
h in
vestm
ents
––
–To
tal l
oans
and
rece
ivab
les
40,1
94,9
32,6
775,
141,
103,
222
45,1
23,5
99,3
6610
,671
,461
,172
397,
026,
438
56,4
04,5
23,5
09H
TM
inve
stm
ents
21,8
27,2
89,4
47–
–21
,827
,289
,447
––
21,8
27,2
89,4
47A
FS F
inan
cial
Ass
ets
Inve
stmen
ts in
quo
ted
debt
sec
uriti
es6,
491,
361,
776
––
6,49
1,36
1,77
6–
–6,
491,
361,
776
Inve
stm
ents
in q
uote
d eq
uity
sec
uriti
es76
,876
,990
76,8
76,9
9076
,876
,990
Inve
stm
ents
in u
nquo
ted
equi
ty s
hare
s44
,703
,353
––
44,7
03,3
53–
–44
,703
,353
P=68,
635,
164,
243
P=5,1
41,1
03,2
22P=
P=73,
563,
830,
932
P=10,
671,
461,
172
P=397
,026
,438
P=84,
844,
755,
075
Dec
embe
r 31,
201
6N
eith
er p
ast d
ue n
or im
paire
dPa
st d
ue b
utH
igh
grad
eM
ediu
m g
rade
Low
gra
deTo
tal
not i
mpa
ired
Impa
ired
Tota
lLo
ans a
nd R
ecei
vabl
es
Cash
and
cas
h eq
uiva
lent
s (ex
clud
ing
cash
on
hand
)P=8
,879
,974
,432
P=–P=–
P=8,8
79,9
74,4
32P=–
P=–P=8
,879
,974
,432
Sh
ort-t
erm
cas
h in
vestm
ents
99,9
98,5
62–
–99
,998
,562
––
99,9
98,5
62
Rec
eiva
bles
Insta
llmen
t con
tract
s rec
eiva
ble
25,0
04,0
80,8
6125
8,33
0,50
346
,796
,381
25,3
09,2
07,7
452,
693,
914,
384
120,
290,
254
28,1
23,4
12,3
83
O
ther
s6,
259,
366,
612
––
6,25
9,36
6,61
23,
279,
182,
362
273,
052,
840
9,81
1,60
1,81
4
Long
-term
cas
h in
vestm
ents
––
––
––
–To
tal l
oans
and
rece
ivab
les
40,2
43,4
20,4
6725
8,33
0,50
346
,796
,381
40,5
48,5
47,3
515,
973,
096,
746
393,
343,
094
46,9
14,9
87,1
91H
TM in
vestm
ents
20,8
51,6
08,4
54–
–20
,851
,608
,454
––
20,8
51,6
08,4
54A
FS F
inan
cial
Ass
ets
–In
vestm
ents
in q
uote
d de
bt s
ecur
ities
8,07
9,22
7,77
6–
–8,
079,
227,
776
––
8,07
9,22
7,77
6In
vest
men
ts in
unq
uote
d eq
uity
sha
res
96,2
48,9
34–
–96
,248
,934
––
96,2
48,9
34P=6
9,27
0,50
5,63
0P=2
58,3
30,5
03P=4
6,79
6,38
1P=6
9,57
5,63
2,51
4P=5
,973
,096
,746
P=393
,343
,094
P=75,
942,
072,
354

- 88 -
*SGVFS028606*
High grade cash and cash equivalents and short-term and long-term cash investments are moneymarket placements and working cash fund placed, invested or deposited in local banks belonging tothe top ten banks in the Philippines in terms of resources and profitability.
The Group’s high-grade receivables pertain to receivables from related parties and third partieswhich, based on experience, are highly collectible or collectible on demand, and of which exposure tobad debt is not significant. Installment contract receivables under bank-financing and pag-ibigfinancing awaiting for bank and pag-ibig remittance but has been processed are assessed to be highgrade since the accounts have undergone credit evaluation performed by two parties, the Group andthe respective bank, thus credit evaluation underwent a more stringent criteria resulting to higherprobability of having good quality receivables.
Medium grade accounts are active accounts with minimal to regular instances of payment default, dueto ordinary/common collection issues. These accounts are typically not impaired as thecounterparties generally respond to credit actions and update their payments accordingly.
Low grade accounts are accounts which have probability of impairment based on historical trend.
Based on the Group’s experience, its loans and receivables are highly collectible or collectible ondemand. The receivables are collateralized by the corresponding real estate properties. In few casesof buyer defaults, the Group can repossess the collateralized properties and held it for sale in theordinary course of business at the prevailing market price. The total of repossessed propertiesincluded in the “Real estate inventories” account in the consolidated statement of financial positionamounted to P=263.87 million, P=190.40 million and P=758.01 million as of December 31, 2017, 2016and 2015, respectively. The Group performs certain repair activities on the said repossessed assets inorder to put their condition at a marketable state. Costs incurred in bringing the repossessed assets toits marketable state are included in their carrying amounts unless these exceed the recoverable values.
The Group did not accrue any interest income on impaired financial assets.
The Group’s investments in unquoted equity securities presented as AFS are incidental to its housingprojects and are considered by the Group to be of high quality.
Liquidity RiskThe Group monitors its cash flow position, debt maturity profile and overall liquidity position inassessing its exposure to liquidity risk. The Group maintains a level of cash deemed sufficient tofinance its cash requirements. Operating expenses and working capital requirements are sufficientlyfunded through cash collections. The Group’s loan maturity profile is regularly reviewed to ensureavailability of funding through adequate credit facilities with banks and other financial institutions.
The extent and nature of exposures to liquidity risk and how they arise as well as the Group’sobjectives, policies and processes for managing the risk and the methods used to measure the risk arethe same for 2017 and 2016.

- 89 -
*SGVFS028606*
Maturity Profile of Financial Assets and LiabilitiesThe tables below summarize the maturity profile of the Group’s financial assets and liabilities as ofDecember 31, 2017 and 2016 based on undiscounted contractual payments, including interestreceivable and payable.
December 31, 2017
On Demand1 to
3 Months3 to
12 Months1 to
5 Years TotalFinancial AssetsLoans and receivablesCash and cash equivalents P=10,658,010,130 P=836,501,312 P=– P=– P=11,494,511,442Short-term cash investments – – 345,639,559 – 345,639,559Receivables from related parties – – 4,987,930,489 – 4,987,930,489Receivables
Installment contracts receivables 10,127,467,539 2,642,268,482 8,393,149,975 10,057,494,211 31,220,380,207Others 7,919,965,041 704,702,205 2,723,007,794 2,011,439,026 13,359,114,066
HTM investments 8,133,258,592 13,694,030,855 21,827,289,447AFS Financial Assets
Investments in quoted debtsecurities 6,491,361,775 6,491,361,775
Investments in unquotedequity shares 44,703,353 44,703,353
Total undiscounted financial assets P=28,750,146,063 P=4,183,471,999 P=31,074,348,184 P=25,762,964,092 P=89,770,930,338
Financial LiabilitiesFinancial liabilities at amortized costBank loans P=4,073,750 P=904,069,801 P=2,712,209,402 P=32,179,459,075 P=35,799,812,028Loans payable 100,847,102 112,439,017 743,016,886 2,804,162,979 3,760,465,984Liabilities for purchased land 674,640,471 1,964,807,957 1,886,850,911 818,805,840 5,345,105,179Accounts payable and other payables 5,697,366,316 455,015,960 1,230,899,946 1,312,628,208 8,695,910,430Notes payable 60,890,732 54,440,151,506 54,501,042,238Total undiscounted financial liabilities P=6,476,927,639 P=3,436,332,735 P=6,633,867,877 P=91,555,207,608 P=108,102,335,859
December 31, 2016
On Demand1 to
3 Months3 to
12 Months1 to
5 Years TotalFinancial AssetsLoans and receivablesCash and cash equivalents P=5,699,507,743 P=3,203,030,195 P=– P=– P=8,902,537,938Short-term cash investments – – 96,944,262 – 96,944,262Receivables from related parties – – 3,916,669,458 – 3,916,669,458Receivables
Installment contracts receivables 9,865,911,150 3,137,785,500 6,893,212,488 8,226,503,245 28,123,412,383Others 6,012,800,077 990,381,496 2,808,420,241 9,811,601,814
Long-term cash investment – – – – –HTM investments – – 1,709,730,739 19,141,877,715 20,851,608,454AFS Financial Assets
Investments in quoted detsecurities 254,929,521 1,537,597,600 6,286,700,655 8,079,227,776
Investments in unquotedequity shares 96,248,934 – – – 96,248,934
Total undiscounted financial assets P=21,674,467,904 P=7,586,126,712 P=16,962,574,788 P=33,655,081,615 P=79,878,251,019
Financial LiabilitiesFinancial liabilities at amortized costBank loans P=4,760,773 P=23,246,444 P=5,936,148,446 P=30,498,369,589 P=36,462,525,252Loans payable 3,537,672 286,147,688 832,862,703 2,764,704,543 3,887,252,606Liabilities for purchased land 475,421,547 352,118,432 1,018,500,974 1,809,275,473 3,655,316,426Accounts payable and other payables 5,593,805,022 1,421,696,692 1,018,500,975 2,139,376,095 10,173,378,784Notes payable 208,061,469 259,561,469 5,047,000,000 5,514,622,938Total undiscounted financial liabilities P=6,077,525,014 P=2,291,270,725 P=9,065,574,567 P=42,258,725,700 P=59,693,096,006

- 90 -
*SGVFS028606*
34. Lease Commitments
The Group as LesseeThe Group has entered into non-cancellable operating lease agreements for its several branch officeswith terms of one to 25 years. The lease agreements include escalation clauses that allow areasonable increase in rates. The leases are payable on a monthly basis and are renewable undercertain terms and conditions.
Future minimum rentals payable under non-cancellable operating leases as of December 31, 2017 and2016 follow:
2017 2016Within one year P=199,541,551 P=235,916,879After 1 year but not more than five years 929,679,349 882,978,925More than five years 1,679,928,540
P=2,809,149,440 P=1,118,895,804
Rent expense included in the consolidated statements of comprehensive income for the years endedDecember 31, 2017, 2016 and 2015 amounted to P=214.12 million, P=136.74 million andP=142.71 million, respectively (Note 26).
The Group as LessorThe Group has entered into non-cancellable property leases on its investment property portfolio,consisting of retail mall spaces and BPO commercial centers which generally provide for either (a)fixed monthly rent, or (b) minimum rent or a certain percentage of gross revenue, whichever ishigher. All leases include a clause to enable upward revision of the rental charge on an annual basisbased on prevailing market conditions.
Future minimum rentals receivable under non-cancellable operating leases as of December 31, 2017and 2016 follow:
2017 2016Within one year P=3,348,432,254 P=2,265,562,198After one year but not more than five years 12,282,694,490 8,846,993,112More than five years 6,298,639,191 7,002,260,095
P=21,929,765,935 P=18,114,815,405
Rental income included in the consolidated statements of comprehensive income for the years endedDecember 31, 2017, 2016 and 2015 amounted to P=5,625.23 million, P=4,375.33 million andP=2,367.88 million, respectively (Note 24).
Contingent rent included in rental income for the years ended December 31, 2017, 2016 and 2015amounted to P=663.81 million, P=454.91 million and P=257.59 million, respectively.

- 91 -
*SGVFS028606*
35. Notes to Consolidated Statements of Cash Flows
Details of the movement in cash flows from financing activities follow:
Non-cash Change
December 31,2016 Cash Flows Acquisition
Foreignexchange
movementFair value
changesDecember 31,
2017Loans payable P=3,887,252,607 (P=126,786,624) P= P= P= P=3,760,465,983Bank loans 36,087,242,292 (287,430,264) 35,799,812,028Notes payable 39,525,115,572 14,673,096,492 302,830,174 54,501,042,238Total liabilities from
financing activities P=79,499,610,471 P=14,258,879,604 P= P=302,830,174 P= P=94,061,320,249
The Group’s noncash investing and financing activities pertain to the following:
a) Transfers from land and improvements to real estate inventories amounting to P=4,045.42 million,P=1,652.12 million and P=4,056.79 million in 2017, 2016 and 2015, respectively.
b) Transfers from property and equipment to investment property amounting to P=62.72 million in2015. There are no transfers in 2016 and 2017.
c) Purchase of land that are payable from one to three years amounting to P=1,807.43 million,P=609.93 million and P=2,606.29 million in 2017, 2016 and 2015, respectively.
d) In 2016, pension liability amounting to P=13.22 million was transferred to a related party.
Under the receivable discounting arrangements, the Group applies collections from installmentcontracts receivables against loans payable. The group considers the turnover of the receipts andpayments under this type of arrangement as quicker and relatively shorter. Where the Groupconsiders a quick turnaround, the receipts and payments are reported on a net basis. The effects on thecash flows arising from financing activities presented on a net basis follow:
2017 2016 2015Proceeds from loans payable P=2,318,488,026 P=2,243,997,645 P=3,003,541,462Collection of installment contract receivables (1,817,597,657) (1,839,906,656) (1,970,343,823)Proceeds from loans payable -net P=500,890,369 P=404,090,989 P=1,033,197,639
2017 2016 2015Payments of loans payable (P=1,817,597,657) (P=1,839,906,656) (P=1,970,343,823)Collection of installment contract receivables 1,817,597,657 1,839,906,656 1,970,343,823Payments of loans payable - net P= P= P=
The Group made certain reclassifications to the consolidated statements of cash flows for 2016 and2015 to align with 2017 classification. Movements in receivable from related parties were transferredto investing activities from operating activities while movement in noncurrent liabilities were movedto operating and investing activities from financing activities. Below is the summary of movements:
Increase (Decrease)2016 2015
Net cash flows provided by (used) in:Operating activities P=91,048,989 P=165,132,797Investing activities (491,051,066) 364,088,666Financing activities 400,002,074 (529,221,462)

- 92 -
*SGVFS028606*
36. Commitments and Contingencies
The Group has entered into several contracts with contractors for the development of its real estateproperties. As of December 31, 2017 and 2016, these contracts have an estimated aggregate cost ofP=13,077.46 million and P=8,728.40 million, respectively. These contracts are due to be completed onvarious dates up to December 2020.
The progress billings are settled within one year from date of billings. These are unsecuredobligations and carried at cost.
The Group has various contingent liabilities from legal cases arising from the ordinary course ofbusiness which are either pending decision by the courts or are currently being contested by theGroup, the outcome of which are not presently determinable.
In the opinion of the management and its legal counsel, the eventual liability under these lawsuits orclaims, if any, will not have a material or adverse effect in the Group’s financial position and resultsof operations.
37. Approval of the Financial Statements
The consolidated financial statements of the Group as of December 31, 2017 and 2016 and for eachof the three years in the period ended December 31, 2017 were authorized for issue by the BOD onMarch 27, 2018.

*SGVFS028606*
INDEPENDENT AUDITOR’S REPORTON THE SUPPLEMENTARY SCHEDULES
The Stockholders and the Board of DirectorsVista Land & Lifescapes, Inc. and SubsidiariesLower Ground Floor, Building BEVIA Lifestyle Center, Vista CityDaanghari, Almanza II, Las Piñas City
We have audited in accordance with Philippine Standards on Auditing the accompanying consolidatedfinancial statements of Vista Land & Lifescapes, Inc. and its subsidiaries (the Group) as atDecember 31, 2017 and 2016 and for the three years in the period ended December 31, 2017, and haveissued our report thereon dated March 27, 2018. Our audits were made for the purpose of forming anopinion on the basic consolidated financial statements taken as a whole. The schedules listed in the Indexto the Financial Statements and Supplementary Schedules are the responsibility of the management ofVista Land and Lifescapes, Inc. These schedules are presented for purposes of complying with SecuritiesRegulation Code Rule No. 68, As Amended (2011) and are not part of the consolidated financialstatements. The schedules have been subjected to the auditing procedures applied in the audit of the basicconsolidated financial statements. In our opinion, the information are fairly stated in all material respectsin relation to the consolidated financial statements taken as a whole.
SYCIP GORRES VELAYO & CO.
Cyril Jasmin B. ValenciaPartnerCPA Certificate No. 90787SEC Accreditation No. 1229-AR-1 (Group A), May 12, 2015, valid until May 11, 2018Tax Identification No. 162-410-623BIR Accreditation No. 08-001998-74-2018, February 26, 2018, valid until February 25, 2021PTR No. 6621337, January 9, 2018, Makati City
March 27, 2018
SyCip Gorres Velayo & Co.6760 Ayala Avenue1226 Makati CityPhilippines
Tel: (632) 891 0307Fax: (632) 819 0872ey.com/ph
BOA/PRC Reg. No. 0001, December 14, 2015, valid until December 31, 2018SEC Accreditation No. 0012-FR-4 (Group A), November 10, 2015, valid until November 9, 2018
A member firm of Ernst & Young Global Limited

VISTA LAND & LIFESCAPES, INC. AND SUBSIDIARIESINDEX TO CONSOLIDATED COMPANY FINANCIAL STATEMENTS AND
SUPPLEMENTARY SCHEDULES
CONSOLIDATED COMPANY FINANCIAL STATEMENTS
Consolidated Statements of Financial Position as of December 31, 2017 and 2016
Consolidated Statements of Comprehensive Income for the Years Ended December 31, 2017 and 2016
Consolidated Statements of Changes in Equity for the Years Ended December 31, 2017 and 2016
Consolidated Statements of Cash flows for the Years Ended December 31, 2017 and 2016
SUPPLEMENTARY SCHEDULES
Report of Independent Auditors on Supplementary Schedules
I. Supplementary schedules required by Annex 68-E
A. Financial Assets (Current Marketable Equity and Debt Securities and Other Short-Term CashInvestments)
B. Amounts Receivable from Directors, Officers, Employees,Related Parties and Principal Stockholders (Other than Related Parties)
C. Amounts Receivable from Related Parties which areEliminated during the Consolidation of Financial Statements
D. Intangible Assets
E. Long-term Debt
F. Indebtedness to Related Parties
G. Guarantees of Securities of Other Issuers
H. Capital Stock
II. Schedule of all of the effective standards and interpretations (Part 1, 4J)
III. Reconciliation of Retained Earnings Available for Dividend Declaration(Part 1, 4C; Annex 68-C)
IV. Map of the relationships of the companies within the group (Part 1, 4H)
V. Schedule of Financial Ratios

VIS
TA
LA
ND
& L
IFE
SCA
PES,
INC
. AN
D S
UB
SID
IAR
IES
SCH
ED
UL
E A
: FIN
AN
CIA
L A
SSE
TS
DE
CE
MB
ER
31,
201
7
Nam
e of
issu
ing
entit
y an
das
soci
atio
n of
eac
h iss
ue
Num
ber
of sh
ares
or
prin
cipa
l am
ount
of
bond
s an
d no
tes
Am
ount
sho
wn
in th
eba
lanc
e sh
eet
Val
ue b
ased
on
mar
ket
quot
atio
n at
end
of
repo
rtin
g pe
riod
Inco
me
rece
ived
and
acc
rued
Cas
h an
d ca
sh e
quiv
alen
ts a
nd S
hort-
te
rm c
ash
inve
stm
ents
N/A
P=11,
840,
151,
001
P=11,
840,
151,
001
P=79,
593,
675
Inst
allm
ent c
ontra
cts r
ecei
vabl
esN
/A30
,943
,358
,823
31,0
13,7
22,7
2654
3,52
3,76
6In
vest
men
ts in
Ava
ilabl
e-fo
r-sa
le
finan
cial
ass
ets
Var
ious
6,61
2,94
2,11
96,
612,
942,
119
Inve
stm
ents
in H
eld
to M
atur
ityV
ario
us21
,827
,289
,447
21,8
74,9
26,6
3680
0,88
1,96
1T
otal
Fin
anci
al A
sset
sP=7
1,22
3,74
1,39
1P=7
1,34
1,74
2,48
3P=1
,423
,999
,402

VIS
TA
LA
ND
& L
IFE
SCA
PES,
INC
. AN
D S
UB
SID
IAR
IES
SCH
ED
UL
E B
: AM
OU
NT
S R
EC
EIV
AB
LE
FR
OM
DIR
EC
TO
RS,
OFF
ICE
RS,
EM
PLO
YE
ES,
RE
LA
TE
D P
AR
TIE
S A
ND
PR
INC
IPA
LST
OC
KH
OL
DE
R (O
TH
ER
TH
AN
RE
LA
TE
D P
AR
TIE
S)D
EC
EM
BE
R 3
1, 2
017
Nam
e an
dD
esig
natio
n of
deb
tor
Bal
ance
at
begi
nnin
g of
peri
odA
dditi
ons
Am
ount
s col
lect
edA
mou
nts
wri
tten
off
Cur
rent
Non
curr
ent
Bal
ance
at e
ndof
per
iod
Empl
oyee
s
P=52
,813
,650
P=44,
266,
190
(P=1
3,60
2,25
8)P=
P=83,
477,
582
P=
P=8
3,47
7,58
2O
ffic
ers
10
9,45
915
4,78
6
(1
09,4
59)
15
4,78
6
154,
786
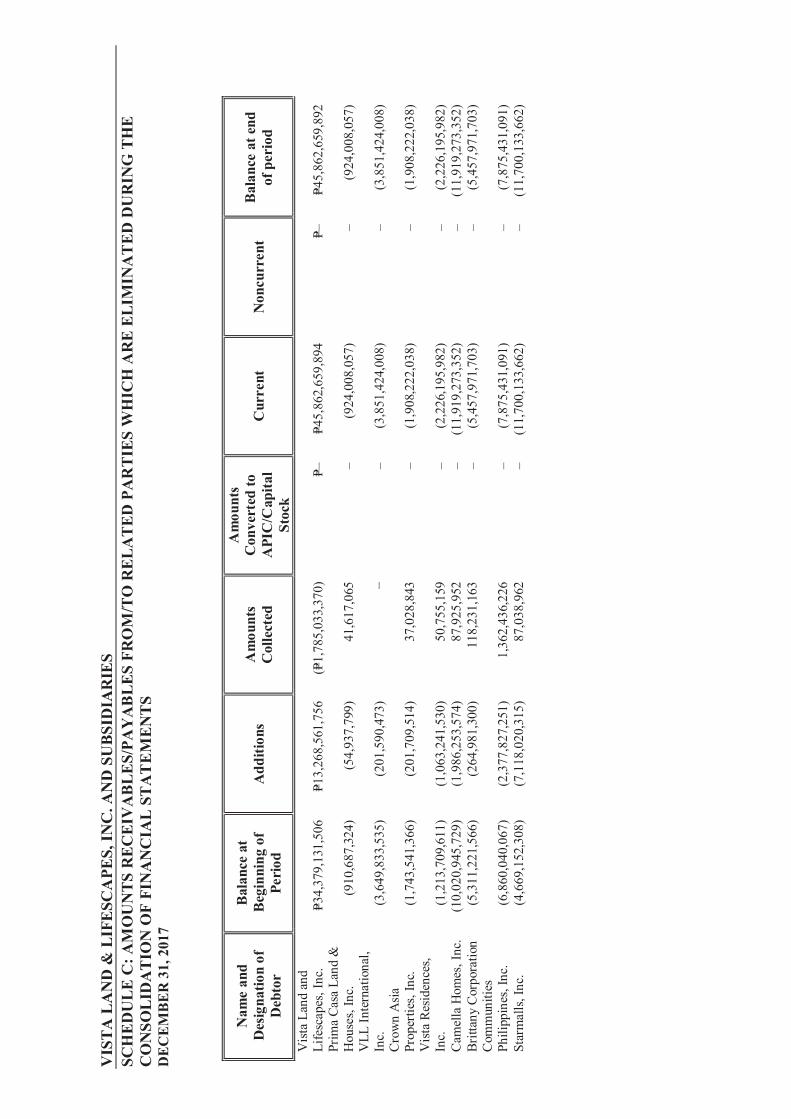
VIS
TA
LA
ND
& L
IFE
SCA
PES,
INC
. AN
D S
UB
SID
IAR
IES
SCH
ED
UL
E C
: AM
OU
NT
S R
EC
EIV
AB
LE
S/PA
YA
BL
ES
FRO
M/T
O R
EL
AT
ED
PA
RT
IES
WH
ICH
AR
E E
LIM
INA
TE
D D
UR
ING
TH
EC
ON
SOL
IDA
TIO
N O
F FI
NA
NC
IAL
ST
AT
EM
EN
TS
DE
CE
MB
ER
31,
201
7
Nam
e an
dD
esig
natio
n of
Deb
tor
Bal
ance
at
Beg
inni
ng o
fPe
riod
Add
ition
sA
mou
nts
Col
lect
ed
Am
ount
sC
onve
rted
toA
PIC
/Cap
ital
Stoc
k
Cur
rent
Non
curr
ent
Bal
ance
at e
ndof
per
iod
Vis
ta L
and
and
Life
scap
es, I
nc.
P=34,
379,
131,
506
P=13,
268,
561,
756
(P=1,
785,
033,
370)
P=–
P=4
5,86
2,65
9,89
4P=–
P=45,
862,
659,
892
Prim
a Ca
sa L
and
&H
ouse
s, In
c.(9
10,6
87,3
24)
(54,
937,
799)
41,6
17,0
65–
(924
,008
,057
)–
(924
,008
,057
)V
LL In
tern
atio
nal,
Inc.
(3,6
49,8
33,5
35)
(201
,590
,473
)–
(3,8
51,4
24,0
08)
–(3
,851
,424
,008
)C
row
n A
siaPr
oper
ties,
Inc.
(1,7
43,5
41,3
66)
(201
,709
,514
)37
,028
,843
– (1
,908
,222
,038
)–
(1,9
08,2
22,0
38)
Vis
ta R
esid
ence
s,In
c.(1
,213
,709
,611
)(1
,063
,241
,530
)50
,755
,159
– (2
,226
,195
,982
)–
(2,2
26,1
95,9
82)
Cam
ella
Hom
es, I
nc.
(10,
020,
945,
729)
(1,9
86,2
53,5
74)
87,9
25,9
52–
(11,
919,
273,
352)
–(1
1,91
9,27
3,35
2)Br
ittan
y C
orpo
ratio
n(5
,311
,221
,566
)(2
64,9
81,3
00)
118,
231,
163
–(5
,457
,971
,703
)–
(5,4
57,9
71,7
03)
Com
mun
ities
Phili
ppin
es, I
nc.
(6,8
60,0
40,0
67)
(2,3
77,8
27,2
51)
1,36
2,43
6,22
6–
(7,8
75,4
31,0
91)
–(7
,875
,431
,091
)St
arm
alls
, Inc
.(4
,669
,152
,308
)(7
,118
,020
,315
)87
,038
,962
–
(11,
700,
133,
662)
–(1
1,70
0,13
3,66
2)

VIS
TA
LA
ND
& L
IFE
SCA
PES,
INC
. AN
D S
UB
SID
IAR
IES
SCH
ED
UL
E D
: IN
TA
NG
IBL
E A
SSE
TS
DE
CE
MB
ER
31,
201
7
Des
crip
tion
Beg
inni
ng b
alan
ceA
dditi
ons
Am
ount
of
Am
ortiz
atio
nC
urre
ntN
ot C
urre
ntE
ndin
g ba
lanc
e
Syste
ms d
evel
opm
ent
co
stP=2
2,69
5,62
3P=3
4,27
8,88
6(P=
38,7
97,2
71)
P=P=1
8,17
7,23
8P=1
8,17
7,23
8
See
Not
e 17
of t
he C
onso
lidat
ed F
inan
cial
Sta
tem
ents
.
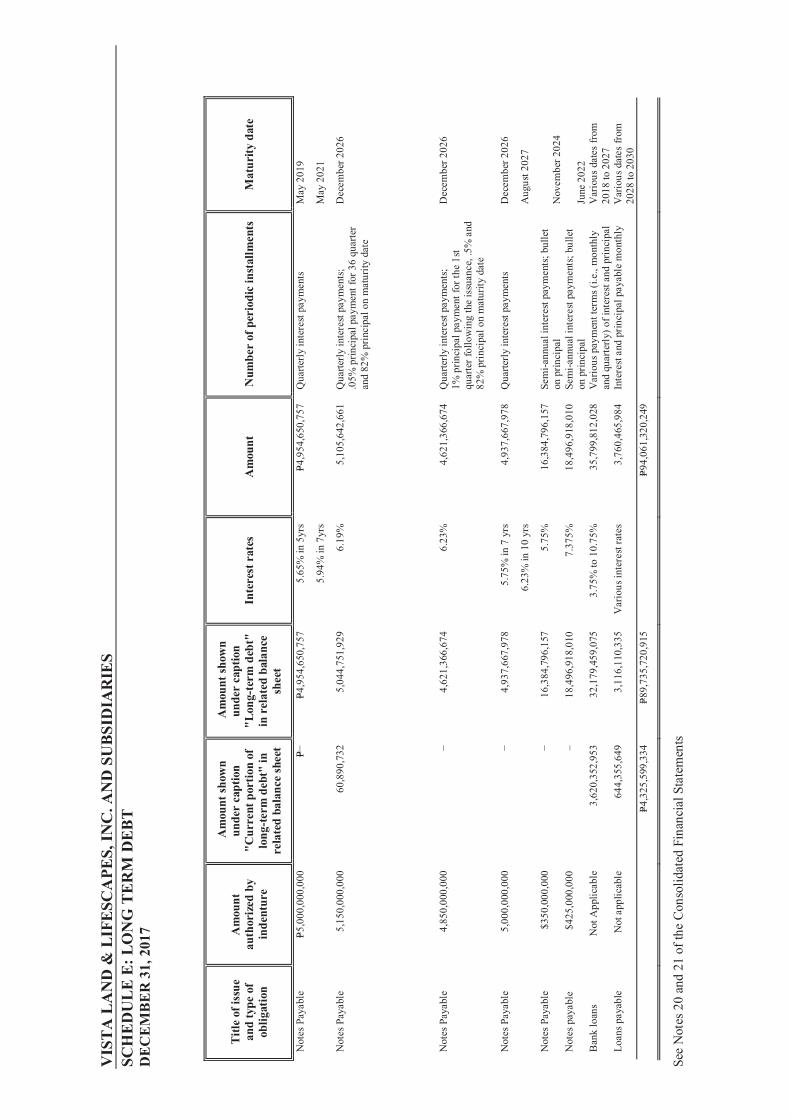
VIS
TA
LA
ND
& L
IFE
SCA
PES,
INC
. AN
D S
UB
SID
IAR
IES
SCH
ED
UL
E E
: LO
NG
TE
RM
DE
BT
DE
CE
MB
ER
31,
201
7
Title
of i
ssue
and
type
of
oblig
atio
n
Am
ount
auth
oriz
ed b
yin
dent
ure
Am
ount
show
nun
der
capt
ion
"Cur
rent
por
tion
oflo
ng-te
rm d
ebt"
inre
late
d ba
lanc
e sh
eet
Am
ount
show
nun
der
capt
ion
"Lon
g-te
rm d
ebt"
in r
elat
ed b
alan
cesh
eet
Inte
rest
rat
esA
mou
ntN
umbe
r of
per
iodi
c in
stal
lmen
tsM
atur
ity d
ate
Not
es P
ayab
leP=5
,000
,000
,000
P=P=4
,954
,650
,757
5.65
% in
5yr
sP=4
,954
,650
,757
Q
uarte
rly in
tere
st pa
ymen
tsM
ay 2
019
5.94
% in
7yr
sM
ay 2
021
Not
es P
ayab
le5,
150,
000,
000
60,8
90,7
325,
044,
751,
929
6.19
%5,
105,
642,
661
Qua
rterly
inte
rest
paym
ents
;.0
5% p
rinci
pal p
aym
ent f
or 3
6 qu
arte
ran
d 82
% p
rinci
pal o
n m
atur
ity d
ate
Dec
embe
r 202
6
Not
es P
ayab
le4,
850,
000,
000
4,62
1,36
6,67
46.
23%
4,62
1,36
6,67
4 Q
uarte
rly in
tere
st pa
ymen
ts;
1% p
rinci
pal p
aym
ent f
or th
e 1s
tqu
arte
r fol
low
ing
the
issu
ance
, .5%
and
82%
prin
cipa
l on
mat
urity
dat
e
Dec
embe
r 202
6
Not
es P
ayab
le5,
000,
000,
000
4,93
7,66
7,97
85.
75%
in 7
yrs
4,93
7,66
7,97
8 Q
uarte
rly in
tere
st pa
ymen
tsD
ecem
ber 2
026
6.23
% in
10
yrs
Aug
ust 2
027
Not
es P
ayab
le$3
50,0
00,0
0016
,384
,796
,157
5.75
%16
,384
,796
,157
Se
mi-a
nnua
l int
eres
t pay
men
ts; b
ulle
ton
prin
cipa
lN
ovem
ber 2
024
Not
es p
ayab
le $
425,
000,
000
–18
,496
,918
,010
7.37
5% 1
8,49
6,91
8,01
0Se
mi-a
nnua
l int
eres
t pay
men
ts; b
ulle
ton
prin
cipa
lJu
ne 2
022
Ban
k lo
ans
Not
App
licab
le3,
620,
352,
953
32,1
79,4
59,0
753.
75%
to 1
0.75
%35
,799
,812
,028
V
ario
us p
aym
ent t
erm
s (i.e
., m
onth
lyan
d qu
arte
rly) o
f int
eres
t and
prin
cipa
lV
ario
us d
ates
from
2018
to 2
027
Loan
s pay
able
Not
app
licab
le64
4,35
5,64
93,
116,
110,
335
Var
ious
inte
rest
rate
s3,
760,
465,
984
Inte
rest
and
prin
cipa
l pay
able
mon
thly
V
ario
us d
ates
from
2028
to 2
030
P=4,3
25,5
99,3
34P=8
9,73
5,72
0,91
5P=9
4,06
1,32
0,24
9
See
Not
es 2
0 an
d 21
of t
he C
onso
lidat
ed F
inan
cial
Sta
tem
ents

VIS
TA
LA
ND
& L
IFE
SCA
PES,
INC
. AN
D S
UB
SID
IAR
IES
SCH
ED
UL
E F
: IN
DE
BT
ED
NE
SS T
O R
EL
AT
ED
PA
RT
IES
DE
CE
MB
ER
31,
201
7
Nam
e of
rel
ated
par
tyB
alan
ce a
t beg
inni
ng o
f per
iod
Bal
ance
at e
nd o
f per
iod
NO
T A
PPL
ICA
BL
E

VIS
TA
LA
ND
& L
IFE
SCA
PES,
INC
. AN
D S
UB
SID
IAR
IES
SCH
ED
UL
E G
: GU
AR
AN
TE
ES
OF
SEC
UR
ITIE
S O
F O
TH
ER
ISSU
ER
SD
EC
EM
BE
R 3
1, 2
017
Nam
e of
issu
ing
entit
y of
secu
ritie
s gua
rant
eed
by th
eco
mpa
ny fo
r w
hich
this
stat
emen
ts is
file
d
Titl
e of
issu
e of
eac
h cl
ass
of se
curi
ties g
uara
ntee
dT
otal
am
ount
gua
rant
eed
and
outs
tand
ing
Am
ount
of o
wne
d by
per
son
for
whi
ch st
atem
ent i
s file
dN
atur
e of
gua
rant
ee
NO
T A
PPL
ICA
BL
E

VIS
TA
LA
ND
& L
IFE
SCA
PES,
INC
. AN
D S
UB
SID
IAR
IES
SCH
ED
UL
E H
: CA
PIT
AL
ST
OC
KD
EC
EM
BE
R 3
1, 2
017
Titl
e of
issu
eN
umbe
r of
shar
esau
thor
ized
Num
ber
of sh
ares
issue
d an
d ou
tsta
ndin
gat
sho
wn
unde
r re
late
dba
lanc
e sh
eet c
aptio
n
Num
ber
of sh
ares
rese
rved
for
optio
ns,
war
rant
s, co
nver
sion
and
othe
r ri
ghts
Num
ber
of sh
ares
hel
d by
Rel
ated
par
ties
Dir
ecto
rs,
offic
ers a
ndem
ploy
ees
Oth
ers
Com
mon
Sto
ck, P
1 pa
r val
ue17
,900
,000
,000
12,0
74,7
17,8
61–
8,63
8,13
8,74
951
6,77
3,33
62,
919,
805,
776
Pref
erre
d St
ock,
P0.
01 p
ar
valu
e10
,000
,000
,000
3,30
0,00
0,00
0–
3,30
0,00
0,00
0–
–
See
Not
e 23
of t
he C
onso
lidat
ed F
inan
cial
Sta
tem
ents

VISTA LAND AND LIFESCAPES, INC. AND SUBSIDIARIESSCHEDULE OF ALL THE EFFECTIVE STANDARDS AND INTERPRETATIONS[which consist of PFRSs, Philippine Accounting Standards (PASs) and Philippine Interpretations] effective asof December 31, 2017:
Below is the list of all effective PFRS, Philippine Accounting Standards (PAS) and Philippine Interpretations ofInternational Financial Reporting Interpretations Committee (IFRIC) as of December 31, 2017:
PHILIPPINE FINANCIAL REPORTING STANDARDS AND INTERPRETATIONSEffective as of December 31, 2017
Adopted Not Adopted Not Applicable
Framework for the Preparation and Presentation of Financial StatementsConceptual Framework Phase A: Objectives and qualitative characteristics
PFRSs Practice Statement Management Commentary
Philippine Financial Reporting Standards
PFRS 1(Revised)
First-time Adoption of Philippine Financial Reporting Standards
Amendments to PFRS 1 and PAS 27: Cost of an Investment in a Subsidiary,Jointly Controlled Entity or Associate
Amendments to PFRS 1: Additional Exemptions for First-time Adopters
Amendment to PFRS 1: Limited Exemption from Comparative PFRS 7Disclosures for First-time Adopters
Amendments to PFRS 1: Severe Hyperinflation and Removal of Fixed Datefor First-time Adopters
Amendments to PFRS 1: Government Loans
PFRS 2 Share-based Payment
Amendments to PFRS 2: Vesting Conditions and Cancellations
Amendments to PFRS 2: Group Cash-settled Share-based PaymentTransactions
PFRS 3(Revised) Business Combinations
PFRS 4 Insurance Contracts
Amendments to PAS 39 and PFRS 4: Financial Guarantee Contracts
PFRS 5 Non-current Assets Held for Sale and Discontinued Operations
Amendment to PFRS 5, Changes in Methods of Disposal
PFRS 6 Exploration for and Evaluation of Mineral Resources
PFRS 7 Financial Instruments: Disclosures
Amendments to PAS 39 and PFRS 7: Reclassification of Financial Assets
Amendments to PAS 39 and PFRS 7: Reclassification of Financial Assets -Effective Date and Transition
Amendments to PFRS 7: Improving Disclosures about FinancialInstruments
Amendments to PFRS 7: Disclosures - Transfers of Financial Assets
Amendments to PFRS 7: Disclosures - Offsetting Financial Assets andFinancial Liabilities
Amendments to PFRS 7: Mandatory Effective Date of PFRS 9 andTransition Disclosures
Amendment to PFRS 7, Servicing Contracts
Amendment to PFRS 7, Applicability of the Amendments to PFRS 7 toCondensed Interim Financial Statements
PFRS 8 Operating Segments

- 2 -
PHILIPPINE FINANCIAL REPORTING STANDARDS AND INTERPRETATIONSEffective as of December 31, 2017
Adopted Not Adopted Not Applicable
PFRS 9 Financial Instruments*
Amendments to PFRS 9: Mandatory Effective Date of PFRS 9 andTransition Disclosures*
PFRS 10 Consolidated Financial Statements
Amendments to PFRS 10, PFRS 12 and PAS 28, Investment Entities:Applying the Consolidation Exception
PFRS 11 Joint Arrangements
Amendments to PFRS 11, Accounting for Acquisitions of Interests in JointOperations
PFRS 12 Disclosure of Interests in Other Entities
Amendments to PFRS 10, PFRS 12 and PAS 28, Investment Entities:Applying the Consolidation Exception
PFRS 13 Fair Value Measurement
PFRS 14 Regulatory Deferral Accounts
Philippine Accounting Standards
PAS 1 (Revised) Presentation of Financial Statements
Amendment to PAS 1: Capital Disclosures
Amendments to PAS 32 and PAS 1: Puttable Financial Instruments andObligations Arising on Liquidation
Amendments to PAS 1: Presentation of Items of Other ComprehensiveIncome
Amendments to PAS 1, Disclosure Initiative
PAS 2 Inventories
PAS 7 Statement of Cash Flows
PAS 8 Accounting Policies, Changes in Accounting Estimates and Errors
PAS 10 Events after the Reporting Period
PAS 11 Construction Contracts
PAS 12 Income Taxes
Amendment to PAS 12 - Deferred Tax: Recovery of Underlying Assets
PAS 16 Property, Plant and Equipment
Amendments to PAS 16 and PAS 38, Clarification of Acceptable Methodsof Depreciation and Amortization
Amendments to PAS 16 and PAS 41, Agriculture: Bearer Plants
PAS 17 Leases
PAS 18 Revenue
PAS 19 Employee Benefits
Amendments to PAS 19: Actuarial Gains and Losses, Group Plans andDisclosures
Amendments to PAS 19: Discount Rate: Regional Market Issue
PAS 19(Amended)
Employee Benefits

- 3 -
PHILIPPINE FINANCIAL REPORTING STANDARDS AND INTERPRETATIONSEffective as of December 31, 2017
Adopted Not Adopted Not Applicable
PAS 20 Accounting for Government Grants and Disclosure of GovernmentAssistance
PAS 21 The Effects of Changes in Foreign Exchange Rates
Amendment: Net Investment in a Foreign Operation
PAS 23(Revised)
Borrowing Costs
PAS 24(Revised)
Related Party Disclosures
PAS 26 Accounting and Reporting by Retirement Benefit Plans
PAS 27 Consolidated and Separate Financial Statements
PAS 27(Amended)
Separate Financial Statements
Amendments to PAS 27, Equity Method in Separate Financial Statements
PAS 28 Investments in Associates
Amendments to PFRS 10, PFRS 12 and PAS 28, Investment Entities:Applying the Consolidation Exception
PAS 28(Amended)
Investments in Associates and Joint Ventures*
PAS 29 Financial Reporting in Hyperinflationary Economies
PAS 31 Interests in Joint Ventures
PAS 32 Financial Instruments: Disclosure and Presentation
Amendments to PAS 32 and PAS 1: Puttable Financial Instruments andObligations Arising on Liquidation
Amendment to PAS 32: Classification of Rights Issues
Amendments to PAS 32: Offsetting Financial Assets and FinancialLiabilities*
PAS 33 Earnings per Share
PAS 34 Interim Financial Reporting
Amendment to PAS 34, Disclosure of Information ‘Elsewhere in the InterimFinancial Report’
PAS 36 Impairment of Assets
PAS 37 Provisions, Contingent Liabilities and Contingent Assets
PAS 38 Intangible Assets
Amendments to PAS 16 and PAS 38, Clarification of Acceptable Methodsof Depreciation and Amortization
PAS 39 Financial Instruments: Recognition and Measurement
Amendments to PAS 39: Transition and Initial Recognition of FinancialAssets and Financial Liabilities
Amendments to PAS 39: Cash Flow Hedge Accounting of ForecastIntragroup Transactions
Amendments to PAS 39: The Fair Value Option
Amendments to PAS 39 and PFRS 4: Financial Guarantee Contracts
Amendments to PAS 39 and PFRS 7: Reclassification of Financial Assets
Amendments to PAS 39 and PFRS 7: Reclassification of Financial Assets -Effective Date and Transition
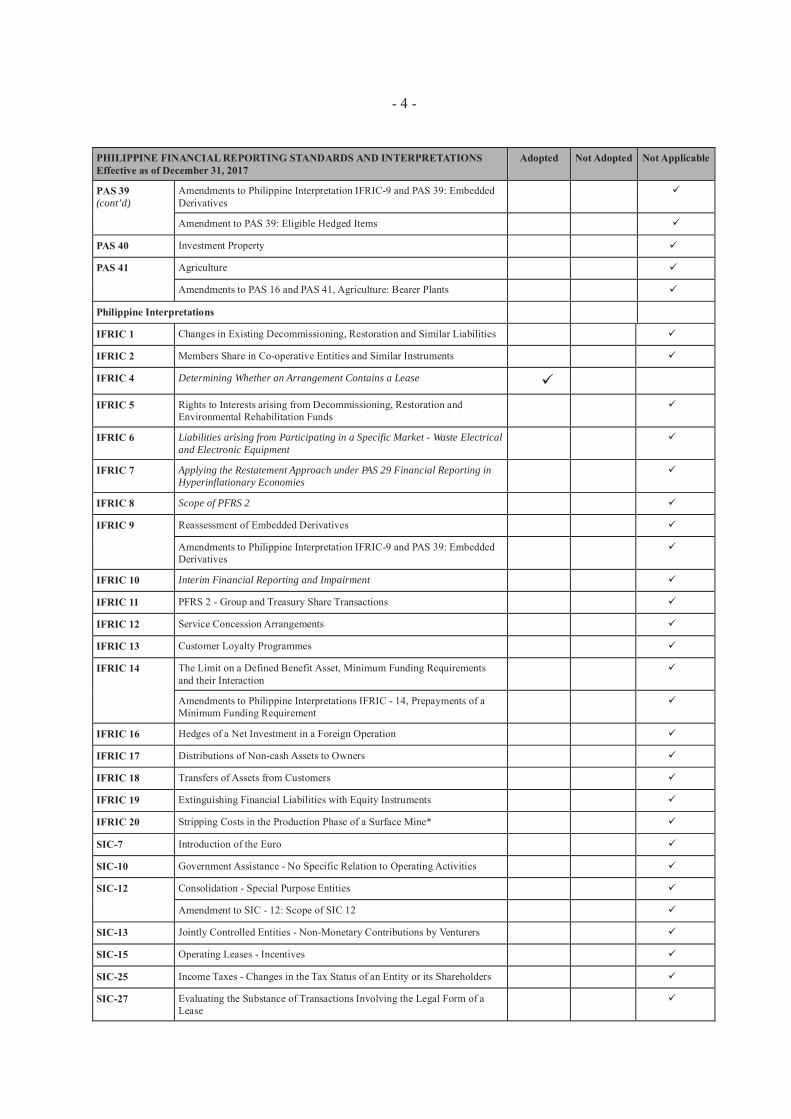
- 4 -
PHILIPPINE FINANCIAL REPORTING STANDARDS AND INTERPRETATIONSEffective as of December 31, 2017
Adopted Not Adopted Not Applicable
PAS 39(cont’d)
Amendments to Philippine Interpretation IFRIC-9 and PAS 39: EmbeddedDerivatives
Amendment to PAS 39: Eligible Hedged Items
PAS 40 Investment Property
PAS 41 Agriculture
Amendments to PAS 16 and PAS 41, Agriculture: Bearer Plants
Philippine Interpretations
IFRIC 1 Changes in Existing Decommissioning, Restoration and Similar Liabilities
IFRIC 2 Members Share in Co-operative Entities and Similar Instruments
IFRIC 4 Determining Whether an Arrangement Contains a Lease
IFRIC 5 Rights to Interests arising from Decommissioning, Restoration andEnvironmental Rehabilitation Funds
IFRIC 6 Liabilities arising from Participating in a Specific Market - Waste Electricaland Electronic Equipment
IFRIC 7 Applying the Restatement Approach under PAS 29 Financial Reporting inHyperinflationary Economies
IFRIC 8 Scope of PFRS 2
IFRIC 9 Reassessment of Embedded Derivatives
Amendments to Philippine Interpretation IFRIC-9 and PAS 39: EmbeddedDerivatives
IFRIC 10 Interim Financial Reporting and Impairment
IFRIC 11 PFRS 2 - Group and Treasury Share Transactions
IFRIC 12 Service Concession Arrangements
IFRIC 13 Customer Loyalty Programmes
IFRIC 14 The Limit on a Defined Benefit Asset, Minimum Funding Requirementsand their Interaction
Amendments to Philippine Interpretations IFRIC - 14, Prepayments of aMinimum Funding Requirement
IFRIC 16 Hedges of a Net Investment in a Foreign Operation
IFRIC 17 Distributions of Non-cash Assets to Owners
IFRIC 18 Transfers of Assets from Customers
IFRIC 19 Extinguishing Financial Liabilities with Equity Instruments
IFRIC 20 Stripping Costs in the Production Phase of a Surface Mine*
SIC-7 Introduction of the Euro
SIC-10 Government Assistance - No Specific Relation to Operating Activities
SIC-12 Consolidation - Special Purpose Entities
Amendment to SIC - 12: Scope of SIC 12
SIC-13 Jointly Controlled Entities - Non-Monetary Contributions by Venturers
SIC-15 Operating Leases - Incentives
SIC-25 Income Taxes - Changes in the Tax Status of an Entity or its Shareholders
SIC-27 Evaluating the Substance of Transactions Involving the Legal Form of aLease

- 5 -
PHILIPPINE FINANCIAL REPORTING STANDARDS AND INTERPRETATIONSEffective as of December 31, 2017
Adopted Not Adopted Not Applicable
SIC-29 Service Concession Arrangements: Disclosures
SIC-31 Revenue - Barter Transactions Involving Advertising Services
SIC-32 Intangible Assets - Web Site Costs
Standards tagged as “Not applicable” have been adopted by the Group but have no significant covered transactionsfor the year ended December 31, 2017.
Standards tagged as “Not adopted” are standards issued but not yet effective as of December 31, 2017. The Groupwill adopt the Standards and Interpretations when these become effective.
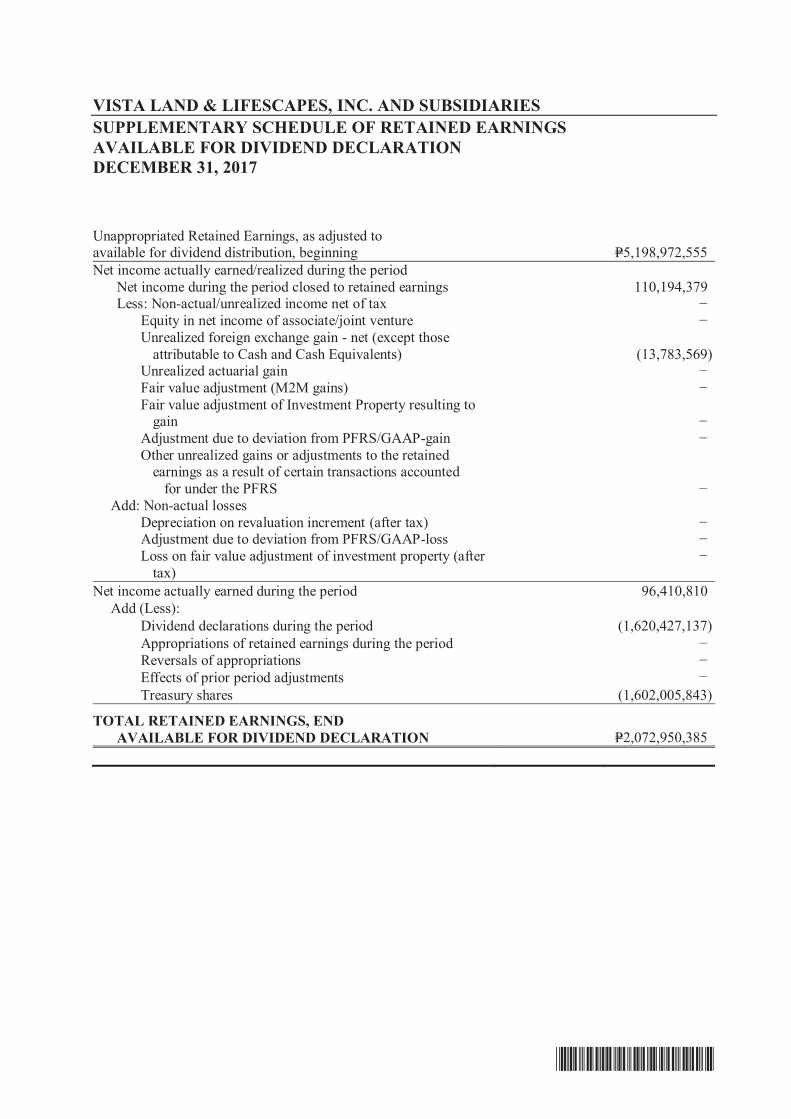
*SGVFS028606*
VISTA LAND & LIFESCAPES, INC. AND SUBSIDIARIESSUPPLEMENTARY SCHEDULE OF RETAINED EARNINGSAVAILABLE FOR DIVIDEND DECLARATIONDECEMBER 31, 2017
Unappropriated Retained Earnings, as adjusted toavailable for dividend distribution, beginning P=5,198,972,555Net income actually earned/realized during the period
Net income during the period closed to retained earnings 110,194,379Less: Non-actual/unrealized income net of tax
Equity in net income of associate/joint ventureUnrealized foreign exchange gain - net (except those
attributable to Cash and Cash Equivalents) (13,783,569)Unrealized actuarial gainFair value adjustment (M2M gains)Fair value adjustment of Investment Property resulting to
gainAdjustment due to deviation from PFRS/GAAP-gainOther unrealized gains or adjustments to the retained
earnings as a result of certain transactions accounted for under the PFRS
Add: Non-actual lossesDepreciation on revaluation increment (after tax)Adjustment due to deviation from PFRS/GAAP-lossLoss on fair value adjustment of investment property (after
tax)Net income actually earned during the period 96,410,810
Add (Less):Dividend declarations during the period (1,620,427,137)Appropriations of retained earnings during the periodReversals of appropriationsEffects of prior period adjustmentsTreasury shares (1,602,005,843)
TOTAL RETAINED EARNINGS, ENDAVAILABLE FOR DIVIDEND DECLARATION P=2,072,950,385

VISTA LAND & LIFESCAPES, INC. AND SUBSIDIARIESGROUP STRUCTUREBelow is the map showing the relationship between and among the Group and its Ultimate Parent Company, and itssubsidiaries as of December 31, 2017.
Fine Properties, Inc.
Vista Land & Lifescapes,Inc.
BrittanyCorporation
Prima Casa Land& Houses, Inc. *
BalmoralResources
Corporation **
Crown AsiaProperties, Inc.
Prima Casa Land& Houses, Inc. *
BalmoralResources
Corporation **
Vista Residences,Inc.
Vista LeisureClub Corp.
Malay ResortsHoldings, Inc.
Prima Casa Land& Houses, Inc. *
BalmoralResources
Corporation **
Camella Homes,Inc.
Prima Casa Land &Houses, Inc. *
MandalayResources Corp.
C&P InternationalLimited
HouseholdDevelopment Corp.
Camella SalesSpecialist
CommunitiesPhilippines, Inc.
CommunitiesBatangas, Inc.
CommunitiesBulacan, Inc.
CommunitiesCagayan, Inc.
Communities Cebu,Inc.
Communities Davao,Inc.
Communities GeneralSantos, Inc.
Communities Iloilo,Inc.
Communities Isabela,Inc.
Communities Leyte,Inc.
Communities Naga,Inc.
Communities NegrosOccidental, Inc.
CommunitiesPampanga, Inc.
CommunitiesPangasinan, Inc.
Communities Tarlac,Inc.
CommunitiesZamboanga, Inc.
Communities ilocos,Inc.
Communities Bohol,Inc.
Communities Quezon,Inc.
CommunitiesPalawan, Inc.
Communities Panay,Inc.
Prima Casa Land &Houses, Inc. *
VLL International,Inc.
Starmalls, Inc.
ManuelaCorporation
Masterpiece AsiaProperties, Inc.
51.94%
100%
40% 100%
100%
100%
5%
5%
10% 100%
100%
100%
100%
100%
100%
100%
100%
100%
100%
100%
100%
100%
100%
100%
100%
100%
100%
100%
100%
40%
BrittanyEstates Corp.
100%
*Vista Land’s combined ownership in Prima Casa Land & Houses, Inc. is 100%.**Vista Land’s combined ownership in Balmoral Resources Corporation. is 100%.
100%
100%
100%
98.37%
100% 100% 100% 100% 100% 88.34%
8.92%
100%
36.93% 16.93%
37.22%
BalmoralResources
Corporation **

*Not early adopted.
VISTA LAND & LIFESCAPES, INC. AND SUBSIDIARIESSCHEDULE OF FINANCIAL RATIOSDECEMBER 31, 2017
Below are the financial ratios that are relevant to the Group for the years ended December 31, 2017, 2016and 2015.
2017 2016 2015
Current ratio Current assets 4.67 3.28 3.42Current liabilities
Long-term debt-to-equity ratio Long-term debt¹ 1.07 0.94 0.87Equity
Debt ratio Interest bearing debt² 0.45 0.43 0.40Total assets
Debt to equity ratio Interest bearing debt² 1.07 0.99 0.87Total equity
Net debt to equity ratio Net debt³ 0.60 0.49 0.46Total equity
Asset to equity ratio Total assets 2.38 2.28 2.19Total equity
Interest service coverage ratio EBITDA 2.74 2.68 2.70Total interest paid
Asset to liability ratio Total Assets 1.72 1.78 1.84Total Liabilities
¹ Pertains to long term portion of the Bank loans, Loans payable and Notes payable² Includes Bank loans, and Notes payable³ Interest bearing debt less Cash and cash equivalents, Short-term and Long-Term cash investments, AFS (quoted debt securities)and HTM

HOMEBUILDER BONDSSchedule and Use of ProceedsAs of December 31, 2017

Schedule and Use of ProceedsAs of December 31, 2017

Schedule and Use of ProceedsAs of December 31, 2017