Philippine-Japan Economic Linkages: A Case Study of … – Japan Economic Linkages: A Case Study of...
84
For comments, suggestions or further inquiries please contact: Philippine Institute for Development Studies Surian sa mga Pag-aaral Pangkaunlaran ng Pilipinas The PIDS Discussion Paper Series constitutes studies that are preliminary and subject to further revisions. They are be- ing circulated in a limited number of cop- ies only for purposes of soliciting com- ments and suggestions for further refine- ments. The studies under the Series are unedited and unreviewed. The views and opinions expressed are those of the author(s) and do not neces- sarily reflect those of the Institute. Not for quotation without permission from the author(s) and the Institute. August 2004 The Research Information Staff, Philippine Institute for Development Studies 3rd Floor, NEDA sa Makati Building, 106 Amorsolo Street, Legaspi Village, Makati City, Philippines Tel Nos: 8924059 and 8935705; Fax No: 8939589; E-mail: [email protected] Or visit our website at http://www.pids.gov.ph DISCUSSION PAPER SERIES NO. 2004-33 Victorina Zosa Philippine-Japan Economic Linkages: A Case Study of Cebu
Transcript of Philippine-Japan Economic Linkages: A Case Study of … – Japan Economic Linkages: A Case Study of...

For comments, suggestions or further inquiries please contact:
Philippine Institute for Development StudiesSurian sa mga Pag-aaral Pangkaunlaran ng Pilipinas
The PIDS Discussion Paper Seriesconstitutes studies that are preliminary andsubject to further revisions. They are be-ing circulated in a limited number of cop-ies only for purposes of soliciting com-ments and suggestions for further refine-ments. The studies under the Series areunedited and unreviewed.
The views and opinions expressedare those of the author(s) and do not neces-sarily reflect those of the Institute.
Not for quotation without permissionfrom the author(s) and the Institute.
August 2004
The Research Information Staff, Philippine Institute for Development Studies3rd Floor, NEDA sa Makati Building, 106 Amorsolo Street, Legaspi Village, Makati City, PhilippinesTel Nos: 8924059 and 8935705; Fax No: 8939589; E-mail: [email protected]
Or visit our website at http://www.pids.gov.ph
DISCUSSION PAPER SERIES NO. 2004-33
Victorina Zosa
Philippine-Japan Economic Linkages:A Case Study of Cebu

List of Projects under the Japan-Philippines Economic Partnership Research Project
Title of the Project Proponent
Impact analysis on the whole economy 1. Situationer on Japan-Philippines Economic Relations Erlinda Medalla 2. Philippine-Japan Bilateral Agreements: Analysis of Possible
Effects on Unemployment, Distribution and Poverty in the Philippines Using CGE-Microsimulation Approach
Caesar Cororaton
Impact analysis on specific sectors/ concerns 3. An Analysis of Industry and Sector- Specific Impacts of a
Japan-Philippines Economic Partnership AIM Policy Center
(Royce Escolar) 4. Prospects and Problems of Expanding Trade with Japan: A
Survey of Philippine Exporters Rosalina Palanca-Tan
5. Towards a Strategy for Manufactured Exports to Japan Peter Lee U and Ferdinand Maquito 6. Small and Medium Enterprise Development Experience and
Policy in Japan and the Philippines: Lessons and Policy Implications
Cielito F. Habito
7. Developing the Japanese Market for Philippine Tourism and Retirement Services: Prospects and Impediments
Winston Conrad Padojinog and Cherry Lyn Rodolfo
8. Prospects of Services Trade Liberalization in Japan-RP Bilateral Agreement
Gloria Pasadilla
9. Movement of Natural Persons Between the Philippines and Japan: Issues and Prospects
Tereso S. Tullao Jr.
10. Toward a Philippines-Japan Economic Partnership in Agriculture
Amelia Bello and Zenaida Sumalde
11. Philippine-Japan Economic Linkage: A Case Study of Cebu Victorina Zosa Special Studies 12. A Comparative Study of the Bilateral FTA Arrangements:
Applications to the Philippines John Lawrence Avila
13. Philippines-Japan Economic Partnership: Where is the Philippines in Japan's Plan?
Lydia N. Yu-Jose
14. Understanding Japan’s Motives for Pursuing an Economic Partnership Agreement with the Philippines
Ronald Rodriguez
15. Exploring Potentials of a Japan-Philippine Economic Partnership in Human Resource Development
Jose V. Camacho Jr., Jhoanna Alcalde, Nino Manalo, Rodger Valientes
16. The Dynamics of Philippines-Japan Economic Cooperation: The Case of Japan’s Official Development Assistance (ODA) in the Philippines
Jose V. Camacho Jr. Agham C. Cuevas
17. Preferential Rules of Origin for the Japan-Philippine Economic Partnership: Issues and Prospects
George Manzano
18. Philippine - Japan Free Trade Agreement: Analyzing the Potential Impact using a Computable General Equilibrium Model
Taeko Yasutake

Philippine – Japan Economic Linkages: A Case Study of Cebu
Victorina Zosa University of San Carlos
Paper prepared for the Japan- Philippines Economic Partnership Research Project
February 2004

Section Title Page
1.0 Introduction 1
1.1 Objectives of the Study 1
1.2 Organization of the Study 2
2.0 Data and Approach 2
3.0 Regional Situationer 3
3.1 Natural Advantage 4
3.2 Population 4
3.3 Economic Characteristics 4
3.4 Development Constraints 5
4.0 Cebu-Japan Economic Relationship 7
4.1 Foreign Trade 7
4.2 Foreign Direct Investments 10
4.3 Tourism 18
4.4 Movement of Natural Persons 20
4.5 Information Technology 24
4.6 Sociocultural and Political Factors 27
5.0 Economic Competitiveness of Cebu 31
5.1 Perceptions of Local Businessmen 33
5.2 Ranking of Japanese Businessmen 33
6.0 Elements of the Cooperation Framework Between Cebu and Japan 35
6.1 Estimates of Japanese Economic Presence in Cebu: An Exercise 35
6.2 Possible Gains and Losses in a Bilateral Arrangement 37
7.0 Summary and Conclusion 43
Philippine - Japan Economic Linkages: A Case Study of Cebu
TABLE OF CONTENTS

Table No. Title
1 Share of Central Visayas to the Philippine Merchandise Exports : 2002 FOB Value in US 1,000 Dollars 8
2 Top Ten Exports and Imports, Philippines and Cebu: 2000 9
3 Distribution of Japanese Firms in PEZA, by Selected Characteristics: 2003 12
4 Central Visayas and Cebu Ecozone (EZ) Foreign Trade Indicators: 1991 - 2002 (in US $ Million) 13
5 Share of Cebu Economic Zones in Regional Employment and Investments: 1990 - 2002 14
6 Share of Cebu Economic Zones in PEZA Employment, Exports and Investments: 1994-2002 15
7 Nationality of Cebu Economic Zone (CEZ) Locators, by Product: 2003 16
8 Distribution of Japanese Firms in Cebu Economic Zones, by Equity Participation: 2003 17
9 Financial Performance of Top 7000 Corporations in Cebu Economic Zones: 2002 18
10 Foreign Tourist Arrivals in the Philippines and Cebu: 1982 - 2002 19
11 Selected Information on Overseas Contract Workers, October 2001 21
12 Distribution of OCWs in Japan by Occupation: 2001 22
13 Distribution of Association for Overseas Technical Scholarship (AOTS): 1959 - 2001 23
14 Number of Recipients of Japanese Scholarships and Trainings: 2003 23
15 List of Japanese IT-Related Firms in CEZ: 2003 25
16 Enrolment and No. of Graduates of Cebu Higher Education Institutions, by Field of Discipline 26
17 Central Visayas Development Projects: 2003 27
18 List of Japanese Funded Government Projects in Central Visayas: 2003 29
19 Ranking of Location Factors, by Metro Cebu Businessman: 2003 Philippine Cities Competitiveness Ranking Project 32
20 Competitiveness of Cebu, In terms of Top 5 Ranking in Investment-Related Costs JETRO Survey of 26 Asian Cities, 2002 34
21 Measure of Japanese Economic Presence in Cebu, 2002 36
22 Measure of Economic Openness of Cebu: 1990 - 2002 40
23 Central Visayas Income and Expenditures and Gini Coefficient, by Province: 2000 41
24 Percent of Cebu Barangays with Selected Facilities and Services: 1990 & 2000 42
25 Percent of Population 20 Years & Older, by Higher Educational Attainment in Cebu Province : 1990 & 2000 43
Philippine - Japan Economic Linkages: A Case Study of Cebu
LIST OF TABLES

Philippine – Japan Economic Linkages: A Case Study of Cebu
Dr. Victorina Zosa
University of San Carlos
ABSTRACT
The impact of the Japan-Philippine Economic Agreement (JPEPA) can be enriched by providing a regional dimension in its macro-analysis. Cebu-Japan cooperation largely hinges on Cebu’s economic competitiveness which manifests itself through its quality human resources, its dynamic export sector and tourism industry, its proximity to international entry and exit points, its infrastructures, its cost of doing business, its quality of life and the responsiveness of LGU to business needs. On the other hand, Cebu, as a destination of Japanese investments, is hampered by the relatively high wages of both unskilled and skilled labor, an unstable wage rate environment and moderately high costs of telecommunication, water, gas, and container transport. With this, the exercise on cost-benefit analysis yielded positive gains for Cebu’s economy. The foreign exchange loss, driven by the balance of trade deficit between Cebu and Japan, and the foregone corporate income taxes were offset by the Japanese direct investments, salaries and mandatory contributions of Cebu Economic Zones (CEZ) employees, income for Japanese tourists, remittances of OCWs in Japan, estimated cost-of-living expenses of Japanese nationals residing in Cebu and the Japanese ODA to Cebu.
Keywords: economic linkages, economic competitiveness, investments, human resource, bilateral agreement
EXECUTIVE SUMMARY
The impact of the Japan-Philippine Economic Agreement (JPEPA) can be enriched by providing a regional dimension in its macro-analysis. Cebu is a good case study for this regional analysis for the following reasons. First, Cebu is basically an export-led economy. Second, Japanese direct investments (JDIs) have become increasingly important over the years. Third, Japanese tourists account for a substantial portion of foreign tourist arrivals in Cebu. Fourth, Cebu is the recipient of a substantial amount of Japanese Official Development Assistance (ODA). Fifth, there are several Cebu-based associations of Filipino professional-grantees who studied and trained in Japan. In addition, there is a Japanese Association of Cebu, Inc., with a membership of over 1,000 Japanese nationals. And sixth, there is the Cebu Investment Promotion Center (CIPC), active in attracting JDIs into Cebu.
Information on the economic competitiveness of Cebu is derived from the 2003 survey of 202 local businessmen and the 2002 JETRO Survey of Investment-Related Costs in 26 Asian cities. Cebu-Japan cooperation largely hinges on Cebu’s economic competitiveness which manifests itself through its quality human resources, its dynamic export sector and tourism industry, its proximity to international entry and exit points, its infrastructures, its cost of doing business, its quality of life and the responsiveness of LGU to business needs. When rated among 26 Asian cities, Cebu is the most competitive in terms of monthly wage of mid-level managers and supervisors and the second most competitive in terms of monthly housing rent for foreigners. On the other hand, Cebu, as a destination of Japanese investments, is hampered by the relatively high wages of both unskilled and skilled labor, an unstable wage rate environment and moderately high costs of telecommunication, water, gas, and container transport
Cebu’s basic formula for attracting Japanese direct investments (JDIs), referred to above, has remained virtually unchanged over the years. External trade has captured a significant and ever-growing share in the GRDP over the years. The share of CEZ exports to Gross Regional Domestic Product has substantially increased from 6.37% in 1990 to 32.06% in 2002. In addition, the estimated receipts from foreign tourists are substantially more than GRDP.
The growth of export industries in Cebu has likewise increased the demand for higher education In 2003, Cebu’s higher education institutions (HEIs) enrolled a total of 131,664 students and produced 22,920 graduates, which is the annual addition to the local workforce. The quality of Cebu’s labor force is enhanced through the firm’s investment in training and skills development, quality circles, the workers’ desire for self-improvement, availability of IT programs in the city, and industrial peace. In addition, Japanese scholarships and training programs are available to the graduates and workers of Cebu, thereby facilitating technology transfer. A substantial number of the Cebuano workforce has been exposed to the Japanese work ethic. In turn, Japanese engineers based in Cebu have interacted with local labor. Within this work environment, it may be possible, in the future, for Cebu-based Japanese firms to host production processes requiring high-precision technology and highly-educated workforce.

An unintended consequence of a trained human resource is labor mobility. Thus, it is common for workers to seek employment in other firms within the zone, and specifically, for workers in Japanese firms to job-hunt in American or European firms. On the other hand, there are also cases when Japanese engineers, with expired work contracts, would seek employment in other Japanese firms within the economic zone.
CEZ is an example of the agglomeration of Japanese firms. Large Japanese firms would sub-contract their input or service requirements to other Japanese firms, usually of the SME category. It is not unusual for Japanese firms to buy, even their office supplies, from a Japanese company. In the literature, Krugman (1991) argues that firms agglomerate due to increasing returns. The geographic concentration of similar activities results in technical externalities, such as the development of specialized suppliers, workers investing in industry specific skills, and knowledge spilling between firms. These technical externalities reduce the firms’ cost, improve their product quality or both.
Crucial in the development of the economic zones is the role of Japanese ODA. By providing funds for the support infrastructure in industrial development, such as the renovation of the Mactan International Airport and Cebu International Port, the construction of the Mactan-Cebu Bridge and the upgrading of the Leyte Geothermal Project to supply the needed electricity, the Japanese government has made Cebu an attractive location for Japanese investors, workers and tourists.
The exercise on cost-benefit analysis yielded positive gains for Cebu’s economy. The foreign exchange loss, driven by the balance of trade deficit between Cebu and Japan, and the foregone corporate income taxes were offset by the JDIs, salaries and mandatory contributions of CEZ employees, income for Japanese tourists, remittances of OCWs in Japan, estimated cost-of-lving expenses of Japanese nationals residing in Cebu and the Japanese ODA to Cebu.
In terms of human development, Cebu’s export-led growth was able to reduce poverty incidence by approximately 8% from 1988 to 2000. There was also a more stable income distribution for Cebu, especially in its key cities. Lapulapu City, the site of the Mactan Export Processing Zone, has the lowest Gini ratio. While more income opportunities became available in Metro Cebu, the other provinces in Central Visayas suffered from a relatively high income inequity, especially Bohol and Negros Oriental. There is a need for Cebu’s economic growth to spillover to ts neighboring provinces. The eco-tourism potential of Bohol, Siquijor and Negros Oriental has attracted a lot of foreign and domestic tourists. However, there is a need to complement tourism development with industrial development, as in the case of Cebu.

1.0. Introduction The impact of the Japan-Philippine Economic Partnership Agreement (JPEPA) can be enriched by providing a regional dimension in its macro-analysis. It answers the question How is a particular region benefited by JPEPA? Cebu is a good case study for this regional analysis for the following reasons. First, Cebu is basically an export-led economy. It is home to 7 Cebu Economic Zones (CEZ), which provide local employment and generates foreign exchange earnings. In 2003, Japan is the major export destination of CEZ products. Second, Japanese direct investments (JDIs) have become increasingly important over the years. Majority of CEZ locators are Japanese. Third, Japanese tourists account for a substantial portion of foreign tourist arrivals in Cebu, from 52% in 1984 to 30% in 2002. Fourth, Cebu is the recipient of a substantial amount of Japanese Official Development Assistance (ODA). Fifth, there are several associations of Filipino professional-grantees who studied and trained in Japan. There is also a Japanese Association Cebu, Inc. with a membership of over 1,000 Japanese nationals. And sixth, there is the Cebu Investment Promotion Center (CIPC), active in attracting JDIs into Cebu. 1.1. Objectives of the Study The study provides a regional dimension to the JPEPA by looking at the existing economic arrangement between Cebu and Japan, together with its accompanying benefits and constraints. The Cebu experience could provide insights into a meaningful cooperation framework between Japan and the Philippines. The specific objectives of the study are: 1. To describe the existing structure of Cebu-Japan economic arrangements, in terms of:
a. Trade in goods and services b. Foreign direct investments c. Tourism d. Movement of natural persons, including Filipino overseas contract workers (OCWs),
teachers, professionals and workers sent to Japan for study and training grants e. Information technology f. Other socio-cultural and political factors including Japanese ODA
2. To discuss the economic competitiveness of Cebu from the perspective of local and Japanese businessmen
3. To quantify the benefits and costs of Japanese economic presence in Cebu 4. To identify possible gains and losses which arises from the bilateral trading arrangement 5. To propose a cooperation framework which would promote stronger economic linkages
between Cebu and Japan, based on the Philippines reform objectives of: a. Global competitiveness b. Sustainable growth c. Revenue increase d. Resource allocation efficiency e. Poverty alleviation

2
1.2. Organization of the Study Section 2 enumerates the Data Sources and the Analytical Approach used in the study. Section 3 presents the regional situationer of Central Visayas, including its natural advantage, its population, its economic characteristics, and its development constraints. Section 4 describes the existing structure of Cebu-Japan economic arrangements. Section 5 asks why local and Japanese businessmen prefer to locate in Cebu. Section 6 sketches the elements of a cooperation framework between Cebu and Japan. In providing the summary and conclusion, Section 7 uses the Cebu experience in defining a cooperation framework which would promote stronger economic linkages between the two countries. 2.0. Data and Approach
To cast the regional situationer, secondary data were obtained from the 2002 Labor Force Survey (LFS), 2000 Census of Population, various Philippine Statistical Yearbooks and 1998 Annual Survey of Establishments (ASE). The location quotient (LQ) uses the 2002 LFS sectoral employment. LQ compares the local (regional) economy to a reference (national) economy, with the end view of identifying specializations in the local economy. Characteristics of establishments are computed using the 1998 ASE. These measures of the competitiveness of the region’s industries include output (value added and revenues), employment, firm size (number of firms, employment/firm, revenues/firm), factor intensity (ratio of capital expenditures to compensation and capital/labor ratio) and labor productivity (output/labor). To describe the economic relationships between Cebu and Japan, secondary data were obtained from the Department of Trade and Industry Region VII (DTI RO7), 2000 Foreign Trade Statistics in the Philippines, Philippine Economic Zone Authority (PEZA) Website, Top 5000 2002 and Top 7000 Corporations 2002, Department of Tourism Region VII (DOT RO7), Cebu Investment and Promotion Center (CIPC) Website, 2001 Survey on Overseas Foreign Workers (OFWs), the Association for Overseas Technical Scholarship (AOTS) Website, AOTS Cebu Chapter, the Philippine Association of Japan Ministry of Education Scholars (PHILAJAMES) Website, the Development Academy of the Philippines (DAP) listing of Asian Productivity Organization (APO) trainees, and the National Economic Development Authority Regional VII (NEDA RO7) for the listing of Japanese Official Development Assistance (ODA). To discuss the decision-to-locate factors of local and Japanese businessmen, the results of two surveys were used. For the local businessmen, the 2003 survey of the Philippine Cities Competitiveness Ranking Project (PCCRP) covering 30 cities in the Philippines provided the analysis of broad and specific location factors. A total of 202 businessmen from the cities of Cebu, Lapulapu and Mandaue were asked to rate the attractiveness of their respective cities, in terms of several indicators. The PCCRP, wherein the University of San Carlos is an academic partner, is funded by the Asian Institute of Management. In November 2002, the Japanese External Trade Organization (JETRO) conducted a Survey of Investment-Related Costs in 26 Cities of 16 Asian Countries. Manila and Cebu are included in this survey. JETRO overseas offices collected the survey information, with assistance from the local Japanese Chambers of Commerce and selected Japanese manufacturing companies.
3
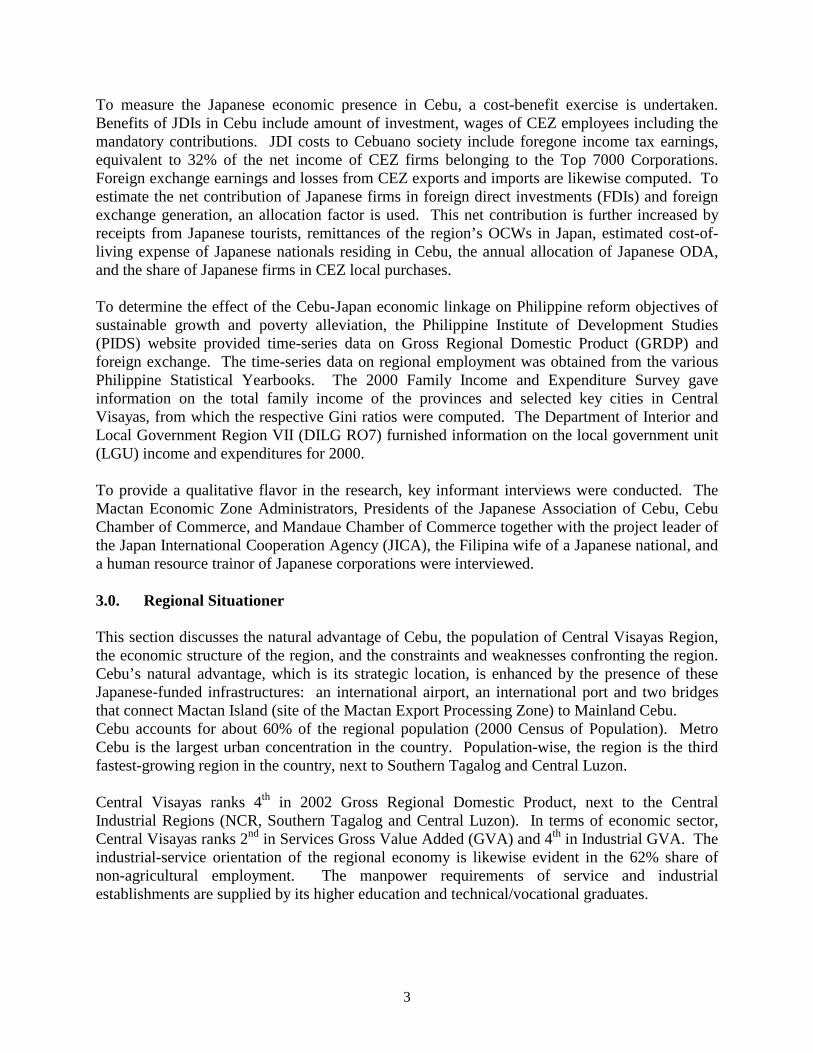
To measure the Japanese economic presence in Cebu, a cost-benefit exercise is undertaken. Benefits of JDIs in Cebu include amount of investment, wages of CEZ employees including the mandatory contributions. JDI costs to Cebuano society include foregone income tax earnings, equivalent to 32% of the net income of CEZ firms belonging to the Top 7000 Corporations. Foreign exchange earnings and losses from CEZ exports and imports are likewise computed. To estimate the net contribution of Japanese firms in foreign direct investments (FDIs) and foreign exchange generation, an allocation factor is used. This net contribution is further increased by receipts from Japanese tourists, remittances of the region’s OCWs in Japan, estimated cost-of-living expense of Japanese nationals residing in Cebu, the annual allocation of Japanese ODA, and the share of Japanese firms in CEZ local purchases. To determine the effect of the Cebu-Japan economic linkage on Philippine reform objectives of sustainable growth and poverty alleviation, the Philippine Institute of Development Studies (PIDS) website provided time-series data on Gross Regional Domestic Product (GRDP) and foreign exchange. The time-series data on regional employment was obtained from the various Philippine Statistical Yearbooks. The 2000 Family Income and Expenditure Survey gave information on the total family income of the provinces and selected key cities in Central Visayas, from which the respective Gini ratios were computed. The Department of Interior and Local Government Region VII (DILG RO7) furnished information on the local government unit (LGU) income and expenditures for 2000. To provide a qualitative flavor in the research, key informant interviews were conducted. The Mactan Economic Zone Administrators, Presidents of the Japanese Association of Cebu, Cebu Chamber of Commerce, and Mandaue Chamber of Commerce together with the project leader of the Japan International Cooperation Agency (JICA), the Filipina wife of a Japanese national, and a human resource trainor of Japanese corporations were interviewed. 3.0. Regional Situationer This section discusses the natural advantage of Cebu, the population of Central Visayas Region, the economic structure of the region, and the constraints and weaknesses confronting the region. Cebu’s natural advantage, which is its strategic location, is enhanced by the presence of these Japanese-funded infrastructures: an international airport, an international port and two bridges that connect Mactan Island (site of the Mactan Export Processing Zone) to Mainland Cebu. Cebu accounts for about 60% of the regional population (2000 Census of Population). Metro Cebu is the largest urban concentration in the country. Population-wise, the region is the third fastest-growing region in the country, next to Southern Tagalog and Central Luzon. Central Visayas ranks 4th in 2002 Gross Regional Domestic Product, next to the Central Industrial Regions (NCR, Southern Tagalog and Central Luzon). In terms of economic sector, Central Visayas ranks 2nd in Services Gross Value Added (GVA) and 4th in Industrial GVA. The industrial-service orientation of the regional economy is likewise evident in the 62% share of non-agricultural employment. The manpower requirements of service and industrial establishments are supplied by its higher education and technical/vocational graduates.

4
The main constraints confronting the region are the looming power shortage in Cebu, the salt water intrusion into Cebu’s water table, and inability of the fruits of development to trickle down to the other provinces in the region. 3.1. Natural Advantage Cebu is strategically located at the center of the Philippine archipelago, making it readily accessible as both air and sea routes. As the Tourism Gateway for Central and Southern Philippines, Cebu hosts the Mactan Cebu International Airport which has regular direct international flights to Singapore, Kota Kinabalu (Malaysia), Hongkong, Narita (Japan) and Seoul (South Korea), and chartered/extra flights to Incheon (Korea), Taipei and Kaoshiong (Korea), Kansai and Nagoya (Japan). It has reliable airfreight to and from Cebu, as evidenced by the presence of international freight forwarders (DHL, FedEx, UPS and TNT). Cebu is base to over 80% of the inter-island shipping capacity in the Philippines, with one (1) international port and 44 domestic ports. There are 44 local shipping lines and 13 international carriers and/or shipping lines in Cebu. The Cebu International Port handles foreign/domestic cargo and passengers. Its 8-kilometer shipping berth is the largest outside Manila. The Japanese government funded the upgrading of the Mactan Cebu International Airport, the Cebu International Port and the two bridges connecting Mactan Island to mainland Cebu. 3.2. Population
For 2000, the census population of Cebu province is 3,356,137, or 59% of the population of Central Visayas (5,701,064). Central Visayas is composed of the four (4) island provinces of Cebu, Bohol, Negros Oriental and Siquijor. On the other hand, Metro Cebu consists of the four cities of Cebu, Mandaue, Lapulapu and Talisay and the six municipalities of Cordova, Consolacion, Liloan, Compostela, Minglanilla and Naga. As of 2000, it has a population of 1,661,899, or 50% of Cebu’s population, making it the second largest urban center in the Philippines, next to the National Capital Region (NCR).
The regional intercensal population growth rate (1995-2000) of 2.79% is the third highest in the Philippines, trailing behind Southern Tagalog and Central Luzon (Annex Table 1). The 1995-2000 intercensal population growth rates of Cebu Province and Metro Cebu are 2.88% and 3.49%, respectively. It is interesting to note that ecozones such as Lapulapu City and Balamban had intercensal population growth rates of 4.52% and 3.64%, respectively. The land area of Central Visayas is 14,951.5 sq.km., making it the 11th smallest region in the country, in terms of land area. In terms of population density, Central Visayas ranks third at 381 persons/sq. km., next to NCR and Central Luzon.
3.3. Economic Characteristics
Next to the Central Industrial Region (CIR), consisting of NCR, Southern Tagalog and Central Luzon, Central Visayas contributed the fourth largest share in Gross Regional Domestic Product (GRDP) in 2002 –Annex Table 1. More broadly, it ranked second in Service Gross Value Added (GVA) and fourth in Industry GVA as of 2002.

5
Using the more detailed 1998 Annual Survey of Establishments (Annex Table 2), Central Visayas ranked first in some economic characteristics for Hotels & Restaurants (ratio of capital expenditures to compensation and capital/labor ratio), Health Services (Ratio of Capital Expenditures to Compensation and capital/labor ratio), and Real Estate & Business Activities (Average Firm Size - employment).
Meanwhile, Central Visayas ranked second in some measures of economic performance for Electricity, Gas & Water (average firm size – employment), Private Education (average firm size – employment, average firm size – revenues and labor productivity), Construction (average firm size – employment and capital expenditures), Transport, Storage & Communication (average firm size – revenues, labor productivity, employment, total revenues and value added), and Wholesale & Retail Trade (capital expenditures).
Central Visayas ranked third in Manufacturing (average firm size – employment and employment), Financial Intermediation (labor productivity, value added and total revenues), Fishing (number of firms), and Community and Personal Services (number of firms).
The location quotient is used to determine the degree of specialization of economic activities in Central Visayas. A location quotient > 1 indicates that Central Visayas specializes in that activity, while a location quotient <1 shows that Central Visayas has a lower share in that economic activity relative to the national average. Annex Table 3 shows that Central Visayas has a larger employment concentration in the following economic activities: agriculture and forestry, fishing, manufacturing, utilities, construction, wholesale & retail trade, and community & personal services.
Central Visayas, particularly Cebu Province, has a large presence of major bank branches, including international banks. There are likewise available modern land lines with IDD, fiber optic data lines and Internet providers. The Philippine Long Distance Telephone Co. (PLDT) is expected to put up its third cable landing station in Cebu. This submarine cable landing stations will allow faster transfer of high-scale voice and data via fiber optic networks and interconnections in the country. PLDT will likewise set up an Innovation Laboratory in Cebu to showcase its various products and services for its corporate clients.
Summing up, the industrial-service orientation of the Central Visayas economy is also evident from the high proportion of non-agricultural employment (62%) and from its larger share in regional commodity flow (air and sea transport). The manpower requirements of service and industry firms are partly supplied by the graduates of its higher education institutions (HEIs) and non-formal education (NFE) graduates. Central Visayas is the third largest source of higher education graduates (from SY 1993 to 1999) and the fourth largest supplier of technical or vocational graduates for 1996.
3.4 Development Constraints As of July 2003, Cebu’s installed capacity is 447.7 megawatt (MW), of which only 326 MW (73%) is considered dependable capacity. During peak hours, the demand reaches 375 MW, pointing to a 49 MW deficit. To remedy the supply-deficit gap, two projects will be implemented, viz., (a) the $68.5 million Leyte-Cebu Interconnection Uprating which will supply Cebu with an additional 200 MW of geothermal power from Tongonan (Leyte) in 2005, and (b) the $40 million Cebu-Mactan Interconnection Project which will benefit mainly the Mactan

6
Export Processing Zone. The Leyte-Cebu Interconnection Project, contracted to the Japanese consortium of J-Power Systems and Kanematsu and financed mainly by the Japan Bank for International Cooperation – International Finance Office (JBIC-IFO), will install a second circuit submarine cable from Leyte to Cebu, spanning 32.5 kilometers. Early in 2003, Kanematsu Corp. was awarded the 20 MW Palinpinon Geothermal Complex in Negros Oriental, which will build a power plant and transmission lines and will develop a steam field. From 1995-2000, the estimated water generation was 269,874 thousand cubic meters in Cebu Province, while the estimated water consumption was 168,476 thousand cubic meters (DTI Cebu Website). This implies that there is still an adequate supply of potable water, sourced from the Metro Cebu Water District (MCWD), individually owned wells and independent water districts. However, the Water Resources Center of the University of San Carlos (USC-WRC) reports that the present capacity of Cebu’s coastal aquifer is 150,000 cubic meters daily, while the actual pumping is double or 300,000 cubic meters per day. As a result of this practice, seawater intrusion has been observed since 1975, causing the “saline edge” to move three kilometers inland. If unmitigated, it is estimated that 50% of the coastal aquifer will be permanently lost in 2025. The performance of Central Visayas in agriculture is dismal, as it ranked 11th in agricultural GVA and 10th in agricultural productivity in 2002. Moreover, the region’s basic education indicators are not spectacular. Although its elementary cohort survival rate and NEAT average are slightly higher than the national average (2000), the functional literacy rate of its population (1994), the NSAT average and secondary cohort survival rates (2000) are lower than the national average. This could perhaps indicate the inadequate provision of basic education resources in the region, partly as a result of rapid population growth (2.79%) – the third highest in the country, next to NCR and Southern Tagalog.
Two consequent features of rapid urbanization and industrialization are: (a) the high incidence of poverty and (b) the high income inequality in the region. Although its per capita poverty threshold in 2000 is the third lowest in the country at P11,061, its poverty incidence is 43.7%, much higher than the national poverty incidence of 39.4%. The per capita poverty threshold is the annual per capita income required or the amount to be spent to satisfy the nutritional requirements of 2,000 calories and other basic needs. The Gini concentration of Central Visayas is 0.4696, a relatively higher coefficient compared to that of the 0.4507 national average. A Gini concentration close to 0 would mean a more equitable income distribution, while a value close to 1 would mean a very inequitable income distribution. Only two other regions (Eastern Visayas and Northern Mindanao) exhibited a higher Gini concentration than Central Visayas.
Thus Central Visayas, despite its strong economic performance, failed to distribute income growth equitably among its provinces. Perhaps, this could be due to the inability of investments in social capital (education and basic services) to keep pace with business investments and its high population growth. A 2.79% regional population growth rate means that its population is expected to double in 25 years.

7
4.0. Cebu-Japan Economic Relationship This section looks into the trade pattern with Japan, Japanese investment flow, human resource flows (Japanese tourist arrivals in Cebu, Cebuano overseas contract workers in Japan and the pool of Cebuano professionals and workers who studies and trained in Japan), the extent of Japanese participation in Information Technology (IT), and the role of other socio-political factors such as the Official Development Assistance (ODA) in regional development. 4.1. Foreign Trade 4.1.1 Philippine Trade Relations with Japan Japan is the second largest trading partner of the Philippines. From January to November 2003, 16% of Philippine merchandise exports went to Japan (Annex Table 4). In terms of the major products, Japan was a major market for our fresh foods (54%), mineral products (43%), machineries/transport equipment (31%), non-metallic products (30%), furniture & wood products (28%), construction materials (26%), other industrial manufactures (25%), and marine products (22%). Japan is likewise a major source of our imports, with 20% of Philippine imports originating from Japan (January to November 2003). Japan is a major supplier of machineries and transport equipment (40%), electronics (31%), metal manufactures (23%), other industrial manufactures (21%), and non-metallic minerals (20%). Annex Table 5 presents the trading pattern with Japan. Philippine exports to Japan in 2003 are dominated by electronics (62%), followed by machineries/transport equipment (10%). Likewise, electronics comprised 45% of Japanese imports in 2003, followed by other industrial manufactures (24%) and machineries/transport equipment (16%). Annex Table 6 provides information on the net trade balance with Japan in 2003. The export/import (X/M) ratio is used to determine whether the trade balance is favorable or not. A value of X/M > 1 indicates a trade surplus, while a value of X/M < 1 depicts a trade deficit. Among the commodities with a trade surplus are: fresh foods, garments & footwear, marine products, seaweeds/carageenan/cut flowers, furniture & wood products, housewares, giftwares, processed foods, forest products, petroleum products and electronics. Meanwhile, the Philippines suffered a trade deficit in the following products: textiles, non-metallic minerals, machineries & transport equipment, metal manufactures, construction materials, chemicals and other industrial manufactures. Palanca-Tan (2003) observes that the Japanese direct investments (JDIs) in the Philippines are trade-creating, generating both imports and exports for the host country. Japanese firms located in the Philippines import machinery and production inputs from Japan. Meanwhile, these Japanese firms export their finished product, not towards the Japanese market, but towards a third country (such as the United States). Thus, the result is an increasing trend towards trade deficit between Japan and the Philippines.

8
4.1.2. Central Visayas Foreign Trade Performance Table 1 gives the 2002 export values of Central Visayas and the Philippines. While Central Visayas exports only account for 9% of total Philippine exports in 2002, preliminary data reveal that Central Visayas is a major source of the following exports: GTH (gifts, toys and housewares – 67%), furniture & wood products (60%), marine products (30%), and seaweeds & carageenan (26%).
Table 1. Share of Central Visayas to the Philippine Merchandise Exports : 2002 FOB Value in US 1,000 Dollars
Central Visayas 1 Total Philippine Exports 2 Major Product Value Percent Value Percent
Central Visayas Share
ALL PRODUCTS 3,108,127 100% 35,208,159 100% 8.83%
Consumer Manufactures 632,758 20.36% 3,662,105 10.40% 17.28% Garments & Footwear 84,260 2.71% 2,353,385 6.68% 3.58% Housewares 6,853 0.22% 189,755 0.54% 3.61% Furniture & Wood Products 241,558 7.77% 402,554 1.14% 60.01% Giftware & Accessories 282,412 9.09% 418,981 1.19% 67.40% Other Consumer Products 17,674 0.57% 297,430 0.84% 5.94% Food & Food Preparations 143,332 4.61% 1,396,362 3.97% 10.26% Processed Foods 20,050 0.65% 588,214 1.67% 3.41% Fresh Foods 986 0.03% 396,017 1.12% 0.25% Marine Products 122,296 3.93% 412,131 1.17% 29.67% Resource-Based Products 56,283 1.81% 1,719,896 4.88% 3.27% Coconut Products 2,790 0.09% 357,113 1.01% 0.78% Mineral Products 8,203 0.26% 279,506 0.79% 2.93% Forest Products, Tobacco, Marble 3,184 0.10% 69,031 0.20% 4.61% Seaweeds, Carageenan, Cutflowers 19,917 0.64% 75,194 0.21% 26.49% Textile Yarns, Twine, Cordages 21,911 0.70% 220,080 0.63% 9.96% Non-metallic Mineral 22,486 0.06% Petroleum Products 379,102 1.08% Other Resource-Based Products 277 0.01% 317,383 0.90% 0.09% Industrial Manufactures 1,479,109 47.59% 26,713,309 75.87% 5.54% Electronics 1,424,472 45.83% 24,321,896 69.08% 5.86% Machineries/Transport Equpt 42,094 1.35% 1,511,372 4.29% 2.79% Metal Manufactures 3 51,501 0.15% Construction Materials 1,504 0.05% 122,855 0.35% 1.22% Chemicals 11,039 0.36% 322,068 0.91% 3.43% Other Industrial Manufactures 3 383,617 1.09% Special Transactions 310,435 9.99% 1,716,487 4.88% 18.09% 1 www.dtiro7.net.ph 2 http://tradelinephil.dti.gov.ph 3 Available data inconsistent with national figures

9
From January to September 2003, Central Visayas exports increased by 17% from US $ 2,099.34 million in same-period 2002 to US $ 2,453.703 million. For the first time, Japan was the top export market for Central Visayas exports. The top five exporters include Pentax Cebu Phils Corp., Cebu Mitsumi Inc., Lexmark International (Phil) Inc. and Muramoto Audio Visual Philippines. For the same period, the top ten export products in descending order are: electronics, furniture, electrical equipment, other industrial goods, garments/wearables, marine products, steel/metal products, traditional products, GTH (gifts, toys and housewares) and processed foods.
Table 2 determines the volume of foreign trade in Cebu (exports and imports) vis-à-vis that of the Philippines, using 2000 Foreign Trade Statistics of the Philippines. The data reveal that, except for electronics, the ranking for the top ten exports and imports for Cebu and the Philippines are not congruent. For instance, included in Cebu’s top ten exports but excluded from the Philippines top ten exports are: other industrial goods, electrical equipment, marine products, and mineral products. And included in Cebu’s top ten imports, but excluded from the Philippines top ten imports are: forest products, resource-based products, mineral products, chemicals, consumer manufactures and wood products, NES.
Table 2. Top Ten Exports and Imports, Philippines and Cebu: 2000 Philippines Cebu
Rank Exports Value (US$M) Percent Rank Exports Value (US$M) Percent
1 Electronics 22,880.14 60.09% 1 Electronics 946.24 33.65% 2 Garments 2,562.62 6.73% 2 Other Industrial Goods 360.22 12.81% 3 Woodcraft & Furniture 592.84 1.56% 3 Electrical Equipment 234.24 8.33% 4 Ignition Wiring Sets 576.28 1.51% 4 Furniture 219.62 7.81% 5 Coconut Oil 463.94 1.22% 5 Garments 157.47 5.60% 6 Petroleum Products 436.35 1.15% 6 Steel/Metal Products 100.95 3.59% 7 Metal Components 431.52 1.13% 7 Marine Products 71.71 2.55% 8 Other Manufactured Products 369.56 0.97% 8 Gifts, Toys & Housewares 46.4 1.65% 9 Bananas (Fresh) 291.65 0.77% 9 Vehicles, Machinery 34.59 1.23%
10 Cathodes (Refined Copper) 233.79 0.61% 10 Mineral Products 28.12 1.00% Total of Top Ten 28,838.69 75.74% Total of Top Ten 2,199.56 78.22%
Philippines Cebu
Rank Imports Value (US$M) Percent Rank Imports Value (US$M) Percent
1 Electronics 6,804.61 21.68% 1 Machinery/Transport Eqpt 388.85 30.81% 2 Mineral Fuels & Lubricants 3,876.61 12.35% 2 Electronics 100.43 7.96% 3 Telecommunication Equipment 2,931.35 9.34% 3 Industrial Manufactures 95.14 7.54% 4 Industrial Machinery 1,909.98 6.09% 4 Forest Products 91.14 7.22% 5 Office and EDP Machines 1,536.19 4.89% 5 Resource-based Products 63.19 5.01% 6 Electrical Machinery 1,444.19 4.60% 6 Metal Manufactures 56.53 4.48% 7 Transport Equipment 1,149.73 3.66% 7 Mineral Products 54.84 4.35% 8 Textiles 1,114.20 3.55% 8 Chemicals 51.5 4.08% 9 Iron and Steel 886.07 2.82% 9 Consumer Manufactures 23.11 1.83%
10 Plastics 694.77 2.21% 10 Wood Products, NES 14.81 1.17% Total of Top Ten 22,347.70 71.19% Total of Top Ten 939.54 74.45% Sources: 2000 Foreign Trade Statistics of the Philippines (NSO) and DTI Region VII

10
4.2. Foreign Direct Investments Foreign direct investments (FDI) play an important role in capital and employment generation. Annex Table 7 details the approved investments and actual FDI, by promotion agency for 2002 and the Three Quarters of 2003. The promotion agencies are: Board of Investments (BOI), Philippine Economic Zone Authority (PEZA), Subic Bay Metropolitan Authority (SBMA) and Clark Development Corporation (CDC). In 2002, the total approved investments were P 99,183.7 million with a projected employment of 110,429. However, the 2002 FDI was P 46,048.7 million, with PEZA accounting for 50% of total FDI. The realized FDI (ratio of FDI to approved investments) for PEZA is 59%, indicating that out of the total PEZA-approved investments of P38,741.1, only P 22,796.1 million was translated into actual investments. Annex Table 8 decomposes FDIs by country and industry. In 2002, Japan is the largest foreign investor in the country, accounting for 37% of total FDI. Manufacturing is the recipient of 52% of total FDI in 2002, followed by mining (25%), and services (11%). 4.2.1. PEZA Locators The Philippine Economic Zone Authority (PEZA), a government corporation attached to the Department of Trade and Industry (DTI), was established by the Special Economic Zone Act of 1995. It is mandated to accelerate employment generation in the countryside and to spur export growth by encouraging investments in the economic zones. Incentives are granted to ecozone developers/operators, and ecozone and IT locators. For ecozone developers, the investment incentive package consists of: (a) income tax holiday (ITH), (b) government support for accessing financing, including Official Development Assistance (ODA), (c) provision of vital off-site infrastructure facilities, (d) option to pay 5% Gross Income Tax in lieu of all national and local taxes, (e) permanent resident status for foreign investors and immediate family members, (f) employment of foreign nationals, and (g) promotion assistance to prospective local and foreign locators. For ecozone locators, the investment package includes: (a) ITH or exemption from corporate income tax for four years, extendable to a maximum of eight years, (b) after the ITH period, the option to pay a special 5% tax on gross income, in lieu of all national and local taxes, (c) exemption from duties and taxes on imported capital equipment, spare parts, supplies, raw materials, (d) domestic sales allowance equivalent to 30% of total sales, (e) exemption from wharfage dues and export taxes, imposts and fees, (f) permanent resident status for foreign investors and immediate family members, (g) employment of foreign nationals, and (h) simplified import and export procedure.
Annex Table 9 lists the number of PEZA operating firms as of September 2003. Out of the total 940 firms, 436 firms (46%) are public economic zones, 444 (47%) are private economic zones, and 60 (6%) are IT Parks. The public economic zones are: Baguio City Economic Zone, Bataan Economic Zone, Cavite Economic Zone and Mactan Economic Zone. The table likewise describes the types of economic zones, such as industrial estate (IE), export processing zone (EPZ), free trade zone (FTZ), tourist/recreational center, agro-industrial economic zone and information technology (IT) park.

11
Annex Tables 10 and 11 portray the economic characteristics of PEZA firms. For instance, over the period 1995-2002, 41% of the PEZA locators are Japanese; while the main product produced is electronics (58%), followed by electrical machinery (13%). The average annual growth rate of investments (1994 – 2002) is 3.6%, while average annual PEZA employment is 583,643. Manufactured exports of PEZA firms likewise grew at an average of 30.71% (1994 – 2000). To generate one job, an investment of P163,036 is required. To generate a dollar of exports, P8 worth of investment is needed. And one worker in the zone can generate $24.50 worth of exports. Annex Table 12 delineates the distribution of PEZA firms, by industry group and region. For instance, 91% of PEZA firms are engaged in manufacturing. Majority (66%) of the PEZA firms are located in CALABARZON (Southern Tagalog). The second most preferred location of PEZA firms is Cebu, with 160 establishments, or 18% of total PEZA firms.
Table 3 summarizes the extent of Japanese participation in PEZA in 2003. There are a total of 907 PEZA firms, of which 417 (46%) are owned by Japanese companies. The regional breakdown shows that 597 (66%) are located in Southern Tagalog, while 160 (18%) are sited in Central Visayas. Out of the 160 Cebu EZ firms, 96 (60%) are controlled by Japanese corporations, indicating the preference of Japanese investors for Cebu as a location site. As to the type of industrial activity, Japanese firms seem to prefer the following industries: motor vehicles & other transport equipment (82%), computer equipment (73%), machinery & equipment (67%), medical, precision & optical instruments including watches (65%), metal products (59%), chemical & other products (57%), electrical machinery (45%), recycling (41%), semiconductor & electronics (38%), other manufactures (28%), computer & related business activities (26%) and garments (17%). With regards to the equity participation, 78% of Japanese investors opted for full ownership (99% to 100%). Some 14% of the Japanese investors had a majority share (51% to 99%), while only 8% had a minority interest (50% and below).
Japanese direct investments (JDIs) in the Philippines centered on economic activities, which required cheap unskilled or semiskilled (assembly-type) labor. This is in contrast with JDIs in Singapore, South Korea or Taiwan, which required more technically demanding production processes. While the R&D intensive activities are still mainly carried out in Japan. Tecson (2003) pointed out that this practice of distributing different value-adding activities to different countries is a response to the efficiency considerations in order to take advantage of differences in relative factor endowments.

12
Table 3. Distribution of Japanese Firms in PEZA, by Selected Characteristics: 2003 Total Japanese Selected Characteristics
Number Percent Number Percent Region 907 100% 417 46% Southern Tagalog 597 65.8% 294 49% Central Visayas/Cebu 160 17.6% 96 60% NCR 68 7.5% 12 18% Central Luzon 66 7.3% 12 18% CAR/Benguet 13 1.4% 1 8% Eastern Visayas/Leyte 1 0.1% 1 100% North Mindanao/Misamis Oriental 1 0.1% 1 100% Central Mindanao/South Cotabato 1 0.1% 1 100% Industry 907 100.0% 417 46% Motor Vehicles & Other Transport Equipment 72 7.9% 59 82% Office, Accounting & Computing Equipment 66 7.3% 48 73% Machinery & Equipment 55 6.1% 37 67% Medical, Precision & Optical Instruments, Watches 34 3.7% 22 65% Basic Metals & Metal Products 85 9.4% 50 59% Chemical, Rubber, Plastic & Non-Metalic Products 79 8.7% 45 57% Electrical Machinery 58 6.4% 26 45% Furnitures, Recycling & Other Manfuactures 54 6.0% 22 41% Semi-conductor and Electronics 123 13.6% 47 38% Food, Tobacco, Leather, Wood, Paper, Printed & Petroleum Products 53 5.8% 15 28%
Computer & Related Business Activities 76 8.4% 20 26% Textiles & Wearing Apparel 152 16.8% 26 17% Owners' Share 907 100.0% 417 100.0% 50% and Below 84 9.3% 34 8.2% 51% - 99% 138 15.2% 58 13.9% 99.01% - 99.99% 256 28.2% 131 31.4% 100% 421 46.4% 194 46.5% No information 8 0.9% Filipino Owners Share 907 100.0% 417 100.0% 0% 372 41.0% 212 50.8% 50% and Below 369 40.7% 185 44.4% 51% - 99% 74 8.2% 18 4.3% 99.01% - 99.99% 4 0.4% 2 0.5% 100% 88 9.7% Source: PEZA Website, DTI Region VII, Annex Table 12

13
4.2.2. Contribution of Cebu Ecozones to the Regional Economy There are seven (7) Cebu economic zones (CEZ), the earliest of which is the Mactan Export Processing Zone established in 1979. Table 4 highlights the 59% contribution of Cebu Ecozone firms to total regional exports over the period 1991 – 2002. In 1991, the ecozone firms accounted for 34% of regional exports, peaking at 68% in 2000. Ecozone firms are relatively import-intensive, claiming 66% of the total imports passing through Cebu ports and airports over the period 1991 – 2002. In 1991, ecozone firms accounted for 42% of regional imports, rising steadily and reaching 79% of total imports in 2002. The imported products, obtained from Manila ports, are not included in this data.
Table 4. Central Visayas and Cebu Ecozone (EZ) Foreign Trade Indicators: 1991 – 2002 (in US $ Million)
Central Visayas Cebu Economic Zone Cebu EZ Share Year
Exports ($M)
Imports ($M)
Trade Balance
Exports ($M)
Imports ($M)
Trade Balance Exports Imports
1991 749.00 424.00 325.00 251.00 179.00 72.00 33.51% 42.22% 1992 806.00 440.00 366.00 306.00 213.00 93.00 37.97% 48.41% 1993 1,006.00 545.00 461.00 466.00 287.00 179.00 46.32% 52.66% 1994 1,291.00 1,248.00 43.00 663.00 415.00 248.00 51.36% 33.25% 1995 1,454.00 1,203.00 251.00 896.00 781.00 115.00 61.62% 64.92% 1996 1,694.00 1,013.00 681.00 1,103.00 604.00 499.00 65.11% 59.62% 1997 1,941.00 872.00 1069.00 1,102.00 627.00 475.00 56.77% 71.90% 1998 2,200.00 909.00 1291.00 1,349.00 634.00 715.00 61.32% 69.75% 1999 2,407.57 986.10 1421.47 1,626.37 697.78 928.59 67.55% 70.76% 2000 2,812.00 1,265.96 1546.04 1,919.00 992.00 927.00 68.24% 78.36% 2001 2,988.00 1,694.00 1294.00 1,755.72 1,333.11 422.61 58.76% 78.70% 2002 3,108.13 1,522.44 1585.69 1,775.77 1,208.33 567.44 57.13% 79.37% Total 22,456.70 12,122.50 10,334.20 13,212.86 7,971.22 5,241.64 58.84% 65.76%
Average 1,871.39 1,010.21 861.18 1,101.07 664.27 436.80 Source: DTI Region VII Website
14
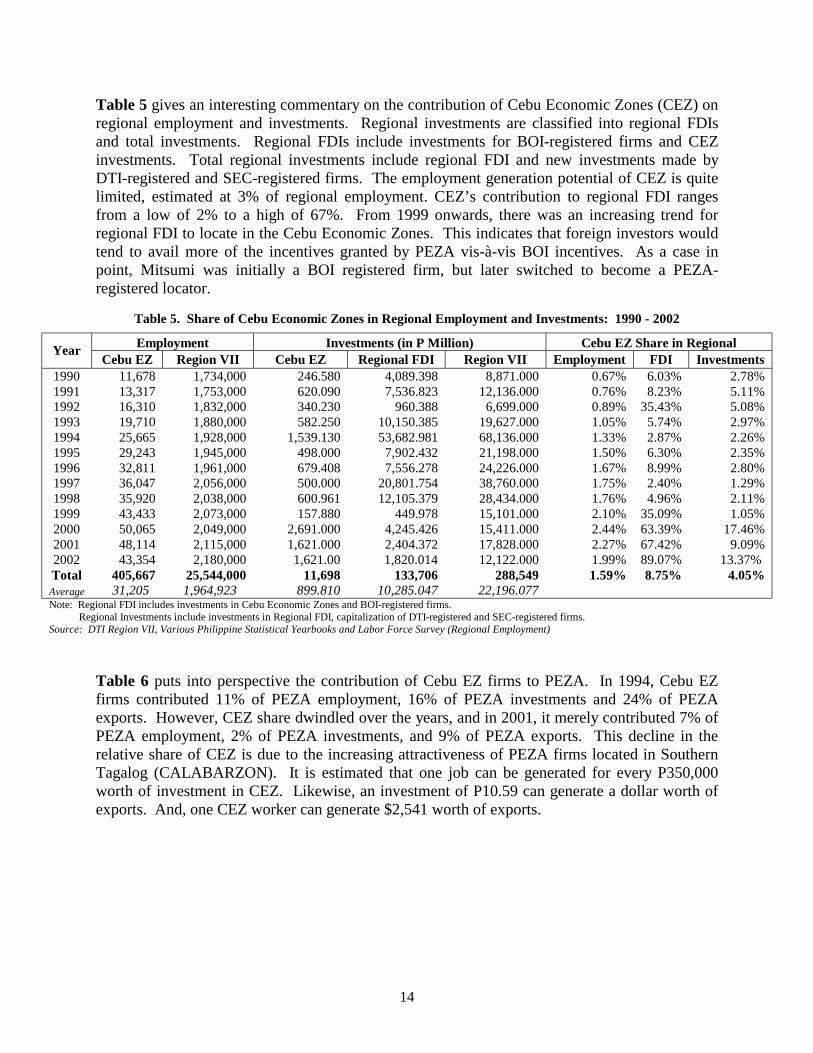
Table 5 gives an interesting commentary on the contribution of Cebu Economic Zones (CEZ) on regional employment and investments. Regional investments are classified into regional FDIs and total investments. Regional FDIs include investments for BOI-registered firms and CEZ investments. Total regional investments include regional FDI and new investments made by DTI-registered and SEC-registered firms. The employment generation potential of CEZ is quite limited, estimated at 3% of regional employment. CEZ’s contribution to regional FDI ranges from a low of 2% to a high of 67%. From 1999 onwards, there was an increasing trend for regional FDI to locate in the Cebu Economic Zones. This indicates that foreign investors would tend to avail more of the incentives granted by PEZA vis-à-vis BOI incentives. As a case in point, Mitsumi was initially a BOI registered firm, but later switched to become a PEZA-registered locator.
Table 5. Share of Cebu Economic Zones in Regional Employment and Investments: 1990 - 2002 Employment Investments (in P Million) Cebu EZ Share in Regional Year
Cebu EZ Region VII Cebu EZ Regional FDI Region VII Employment FDI Investments 1990 11,678 1,734,000 246.580 4,089.398 8,871.000 0.67% 6.03% 2.78% 1991 13,317 1,753,000 620.090 7,536.823 12,136.000 0.76% 8.23% 5.11% 1992 16,310 1,832,000 340.230 960.388 6,699.000 0.89% 35.43% 5.08% 1993 19,710 1,880,000 582.250 10,150.385 19,627.000 1.05% 5.74% 2.97% 1994 25,665 1,928,000 1,539.130 53,682.981 68,136.000 1.33% 2.87% 2.26% 1995 29,243 1,945,000 498.000 7,902.432 21,198.000 1.50% 6.30% 2.35% 1996 32,811 1,961,000 679.408 7,556.278 24,226.000 1.67% 8.99% 2.80% 1997 36,047 2,056,000 500.000 20,801.754 38,760.000 1.75% 2.40% 1.29% 1998 35,920 2,038,000 600.961 12,105.379 28,434.000 1.76% 4.96% 2.11% 1999 43,433 2,073,000 157.880 449.978 15,101.000 2.10% 35.09% 1.05% 2000 50,065 2,049,000 2,691.000 4,245.426 15,411.000 2.44% 63.39% 17.46% 2001 48,114 2,115,000 1,621.000 2,404.372 17,828.000 2.27% 67.42% 9.09% 2002 43,354 2,180,000 1,621.00 1,820.014 12,122.000 1.99% 89.07% 13.37% Total 405,667 25,544,000 11,698 133,706 288,549 1.59% 8.75% 4.05% Average 31,205 1,964,923 899.810 10,285.047 22,196.077 Note: Regional FDI includes investments in Cebu Economic Zones and BOI-registered firms. Regional Investments include investments in Regional FDI, capitalization of DTI-registered and SEC-registered firms. Source: DTI Region VII, Various Philippine Statistical Yearbooks and Labor Force Survey (Regional Employment)
Table 6 puts into perspective the contribution of Cebu EZ firms to PEZA. In 1994, Cebu EZ firms contributed 11% of PEZA employment, 16% of PEZA investments and 24% of PEZA exports. However, CEZ share dwindled over the years, and in 2001, it merely contributed 7% of PEZA employment, 2% of PEZA investments, and 9% of PEZA exports. This decline in the relative share of CEZ is due to the increasing attractiveness of PEZA firms located in Southern Tagalog (CALABARZON). It is estimated that one job can be generated for every P350,000 worth of investment in CEZ. Likewise, an investment of P10.59 can generate a dollar worth of exports. And, one CEZ worker can generate $2,541 worth of exports.

15
Table 6. Share of Cebu Economic Zones in PEZA Employment, Exports and Investments: 1994-2002 Employment Investments (in P Million) Exports (in US Million) Cebu EZ Share in PEZA
Year Cebu EZ PEZA Cebu EZ PEZA Cebu EZ PEZA Employment Investments Exports
1990 11,678 246.580 185.63 1991 13,317 620.090 251.17 1992 16,310 340.230 305.87 1993 19,710 582.250 465.51 1994 25,665 229,650 1,539.130 9,600 663.48 2739 11.18% 16.03% 24.22% 1995 29,243 304,557 498.000 52,500 898.95 4284 9.60% 0.95% 20.98% 1996 32,811 380,625 679.408 65,300 1,103.00 6500 8.62% 1.04% 16.97% 1997 36,047 562,085 500.000 159,700 1,102.32 10626 6.41% 0.31% 10.37% 1998 35,920 609,044 600.961 96,900 1,349.01 13270 5.90% 0.62% 10.17% 1999 43,433 617,690 157.880 155,700 1,626.37 15807 7.03% 0.10% 10.29% 2000 50,065 696,035 2,691.000 156,700 1,919.00 20025 7.19% 1.72% 9.58% 2001 48,114 708,657 1,621.000 80,800 1,755.72 19498 6.79% 2.01% 9.00% 2002 43,354 820,960 1,621.000 38,700 1,775.77 22723 5.28% 4.19% 7.81% Total 405,667 4,929,303 11,698 815,900 13,402 115,472 8.23% 1.43% 11.61%
Average 31,205 547,700 839.711 90,656 1,030.91 12,830 5.70% 0.93% 8.03% Investments/Employment Ratio P 349,816 P 163,036 Investments /Export Ratio P/$ 10.59 P/$ 7.96 Export/Employment Ratio $ 2,541 $ 22,343 Source: PEZA Website and DTI Region VII
4.2.3. Japanese Role in Cebu Ecozones
Some 96 Japanese firms are distributed in seven Cebu Economic Zones located in Mactan Island (Mactan Export Processing Zone I and II and Cebu Light Industry Science Park I), Cebu City (Asia Town Technology Park), Danao City (Mitsumi Realty Inc. Special Economic Zone), Naga (New Cebu Township) and Balamban (West Cebu Industrial Park). Annex Table 13 lists the Japanese firms in CEZ, including its product and equity participation. Table 7 breaks down the nationality of CEZ locators as well as its major products. Out of 160 CEZ firms, 96 (60%) are owned by Japanese shareholders. Japanese firms produce carageenan extract, bags & Braille copying. They also manufacture garment products, plastic & non-metal products, computer peripherals, machinery & equipment, electronics, dental & medical products, optical products, watches, car parts manufacturing, shipbuilding, furniture, recycled clothing, jewelry & fashion accessories and computer & business services. Table 8 focuses on the equity participation of the 96 Japanese firms. Some 52% are wholly owned by the Japanese, and another 35% have Japanese equity participation of 99% - 99.99%. Only 2% of the Japanese firms have equity participation below 50%.

16
Table 7. Nationality of Cebu Economic Zone (CEZ) Locators, by Product: 2003 Code Product Firms Japanese Filipino European American Asian Others Food, Bags, Wood & Printing Products 7 3 2 2 15132 Carageenan Extract 2 1 1 19121 Bags Manufacturing 3 1 2 20121 Wood Products 1 1 22221 Braile Copying 1 1 Garments 27 9 6 4 8 17200 Textile Products 3 2 1 18000 Garments 24 7 5 4 8 Chemical, Plastic & Non-Metals 15 9 2 1 2 1 24113 Liquid Gas Manufacturing 3 2 1 24253 Laminated Core Mfg. 1 1 25204 Plastic Manufacturing 8 6 2 26109 Non-metal Products 3 2 1 Metals and Metal Products 15 12 1 1 1 27210 Metals 7 5 1 1 28920 Metal Products 8 7 1 Business Machines 4 3 1 30001 Computer Peripherals 4 3 1 Machinery & Equipment 7 7 29130 Machinery & Equipment 7 7 Electronics & Electrical Machinery 15 9 1 2 3 0 0 31000 Electrical Machinery 5 3 1 1 32000 Electronics 10 6 1 1 2 Precision Instruments & Watches 22 17 2 2 1 33111 Dental & Medical Products 3 3 33201 Optical Products 14 12 1 1 33301 Watches 5 2 1 1 1 Motor Vehicles 34300 Car Parts Manufacturing 9 7 1 1 35111 Shipbuilding 4 3 1 35201 Other Transport Equipment 4 2 1 1 Furnitures, Recyling, Jewelry & Other Manufactures 20 10 3 4 1 2
36010 Furnitures 8 5 1 2 37201 Recylced Clothing 2 1 1 39110 Jewelry, Fashion Accessories & Handicrafts 10 4 3 3 Computer & Business Services 11 5 3 2 1 55292 In-flight Catering 1 1 72300 Computer Services 9 4 3 2 74220 Business Services 1 1 160 96 18 17 10 16 3 100% 60% 11% 11% 6% 10% 2% Source of Basic Data: PEZA Website

17
Table 8. Distribution of Japanese Firms in Cebu Economic Zones, by Equity Participation: 2003 Japanese Filipino
Code Product Total Below
50% 50%-98% 99% 100% Below
50% 50%-98%
99% - 100%
Food, Bags, Wood & Printing Products 3 1 1 1 1 1 15132 Carageenan Extract 1 1 1 19121 Bags Manufacturing 1 1 20121 Wood Products 22221 Braile Copying 1 1 1
Garments 9 2 2 5 4 17200 Textile Products 2 1 1 2 18000 Garments 7 1 1 5 2
Chemical, Plastic & Non-Metals 9 4 5 4 24113 Liquid Gas Manufacturing 24253 Laminated Core Mfg. 1 1 25204 Plastic Manufacturing 6 3 3 3 26109 Non-metal Products 2 1 1 1
Metals and Metal Products 12 3 4 5 7 27210 Metals 5 2 3 2 28920 Metal Products 7 3 2 2 5
Business Machines 3 1 2 1 30001 Computer Peripherals 3 1 2 1
Machinery & Equipment 7 3 4 3 29130 Machinery & Equipment 7 3 4 3
Electronics & Electrical Machinery 9 1 3 5 4 31000 Electrical Machinery 3 1 2 3 32000 Electronics 6 1 5 1
Precision Instruments & Watches 17 1 10 6 11 33111 Dental & Medical Products 3 1 2 3 33201 Optical Products 12 7 5 7 33301 Watches 2 1 1 1
Motor Vehicles 12 1 2 2 7 4 1 34300 Car Parts Manufacturing 7 2 5 2 35111 Shipbuilding 3 1 2 2 1 35201 Other Transport Equipment 2 2
Furnitures, Recyling, Jewelry & Other Manufactures 10 1 2 7 3
36010 Furnitures 5 1 4 1 37201 Recylced Clothing 1 1 39110 Jewelry, Fashion Accessories & Handicrafts 4 2 2 2
Computer & Business Services 5 2 3 3 55292 In-flight Catering 72300 Computer Services 4 2 2 2 74220 Business Services 1 1 1
96 2 10 34 50 45 2 0 100% 2% 10% 35% 52% 47% 2% 0% Source of Basic Data: PEZA Website

18
Due to the difficulty in obtaining financial data for CEZ firms, the information published by the Top 7000 Corporations: 2002-2003 was used. Table 9 indicates the importance of Japanese business presence in Cebu. CEZ firms belonging to the top 7000 corporations generated a total of P71.242 billion in total revenues in 2002, while earning a profit of P7.182 billion in 2002. These CEZ firms owned P47.228 billion worth of assets, incurred liabilities totaling P18.342 billion and had a net worth of P28.886 billion.
Some 59% of CEZ firms in the Top 7000 corporations are Japanese-owned. These Japanese firms contribute 57% of gross sales, account for 48% of profits generated in the CEZ, comprise 57% of the total assets of CEZ locators, incur 69% of the total liabilities of CEZ locators, and contribute 50% of owner’s equity.
Table 9. Financial Performance of Top 7000 Corporations in Cebu Economic Zones: 2002 Cebu EZ Japanese Share of Financial Indicators Locators Locators Japanese Firms
No. of Firms in CEZ 160 96 60.00% No. of CEZ Firms in Top 7000 Corporations 81 48 59.26% Gross Sales of Top 7000 Corporations (P1,000) 71,242,483 40,892,410 57.40% Profits of Top 7000 Corporations (P1,000) 7,181,671 3,417,263 47.58% Assets (P1,000) 47,228,408 27,030,367 57.23% Liabilities (P1,000) 18,342,098 12,698,710 69.23% Stockholders' Equity (P1,000) 28,886,307 14,331,655 49.61% Source: Top 7000 Corporations in the Philippines: 2002-2003
Annex Table 14 details the financial performance of the Japanese firms belonging to the Top 7000 Corporations, by industry group. The top five revenue earners are firms producing metal products, followed by semi-conductors, electronic valves and tubes, supporting activities to water transport, and electronic products. There are several industry groups dominated by Japanese firms. These are the manufacture of electronic valves, supporting activities to water transport, electronics, electronic data processing (EDP) equipment, insulated wires and cables, builder’s carpentry and joinery, non-ferrous smelting and refining, repair of personal & household goods, plastic products, electrical transformers, refined petroleum products, jewelry, fabricated metal products, metal containers, wood furniture, wholesaling, buttons, fabricated wire products, medical equipment, other computer related activities and glass fibers.
It has been widely observed that Japanese firms tend to sub-contract their production processes to other Japanese firms. Thus, there is a tendency for the agglomeration of Japanese firms. This practice is consistent with their Just-in-Time Delivery in the procurement of their raw materials. The above data seem to validate this practice. In the manufacture of electronic or computer products, other Japanese firms supply the needed raw materials such as electronic valves, insulated wires and cables, plastic products, electrical transformers, fabricated metal products, fabricated wire products, and the like.
4.3. Tourism
Cebu is a tourism gateway in the Philippines. In the 1980s, Cebu was marketed as an island in the Pacific. Tourists are drawn by its mix of metropolitan and rural ambience. The presence of hotels, convention centers, cosmopolitan restaurants, and shopping complexes make Cebu an

19
ideal combination for business meetings cum tourism activities. A number of beach resorts, ranging from a five-star to inexpensive category, dot the island. Cebu offers a feast to nature lovers, from the Olango Bird Sanctuary (where migratory birds from Siberia stop over enroute to Australia) to a diversity of flowering plants (most of 8,120 species of which 5,832 are unique to the Philippines). Its cool highlands, golf resorts, scuba diving sites, and a wonderful view of the night lights at the Busay Tops are welcome sites to any tourist. As the country’s oldest city, Cebu is rich in cultural heritage as shown in its old churches, museums, forts and monuments. More recently, Cebu has become a jump-off point for eco-tourism in the Visayas and Mindanao. Its accessibility to both sea and air transport makes it easy for both the domestic and foreign tourists to spend a day or two in Cebu island, and vacation away in the islands of Bohol, Negros Oriental, Siquijor, Camiguin and Surigao.
Table 10 documents tourist arrivals for both the Philippines and Cebu from 1982 to 2002. While the share of Japanese tourists to Philippine tourist arrivals ranges from 6% to 21%, the preference of Japanese tourists for Cebu is shown by these figures. Over the 21-year period, Japanese tourists account for 30% (2002) to 52% (1984) of foreign tourist arrivals. The attractiveness of Cebu to the Japanese tourists may be due to the insular character of Cebu. In fact, a number of hotels and beach resorts were built with the Japanese tourist market as their target. Also, there were direct flights from Cebu to Japan. Japanese tourists generally opt to forego Manila and proceed directly to Cebu.
Table 10. Foreign Tourist Arrivals in the Philippines and Cebu: 1982 - 2002 Philippines Cebu Year
Total Japan Percent Total Japan Percent 1982 890,807 157,399 17.67% 63,067 21,237 33.67% 1983 860,550 177,166 20.59% 69,034 30,433 44.08% 1984 816,721 156,944 19.22% 96,689 50,079 51.79% 1985 773,074 153,511 19.86% 92,043 47,004 51.07% 1986 781,517 134,261 17.18% 88,958 34,410 38.68% 1987 794,700 126,127 15.87% 99,379 31,061 31.26% 1988 1,043,114 181,741 17.42% 110,185 37,518 34.05% 1989 1,189,719 215,634 18.12% 130,194 47,868 36.77% 1990 1,024,520 201,982 19.71% 111,475 44,886 40.27% 1991 951,365 197,540 20.76% 109,830 43,348 39.47% 1992 1,152,952 221,578 19.22% 131,859 47,779 36.23% 1993 1,372,097 243,412 17.74% 164,138 52,921 32.24% 1994 1,573,821 93,673 5.95% 188,903 65,359 34.60% 1995 1,760,163 107,151 6.09% 227,329 88,918 39.11% 1996 2,049,367 350,242 17.09% 248,311 99,588 40.11% 1997 2,222,523 376,714 16.95% 277,614 106,122 38.23% 1998 2,149,357 361,631 16.83% 242,894 83,448 34.36% 1999 2,170,514 387,513 17.85% 289,098 118,361 40.94% 2000 1,992,169 390,517 19.60% 296,187 127,751 43.13% 2001 1,796,893 343,840 19.14% 273,876 106,769 38.98% 2002 1,932,677 374,441 19.37% 286,783 87,168 30.40% Total 29,298,620 4,953,017 16.91% 3,597,846 1,372,028 38.13%
Source: National Statistics Office, 2001 & Department of Tourism Region 7, 2002

20
Initially, Japanese tourists joined tour groups organized by their companies. There were three periods in which Japanese tourist arrivals peaked. First was in 1984, when Japanese tourist arrivals registered 50,079. After this period, there was an 8-year decline, with tourist arrivals registering below 1984 level. From 1992 onwards, tourist arrivals were on the upswing (except for the single year 1988), reaching its peak in 2000 with 127,751 tourist arrivals. From thereon, Japanese tourist arrivals were again on the downtrend. A Japanese national commented that this could perhaps be reflective of the waning of promotional activities. While in the past, he observed a proliferation of tourism brochures in Japan, more recently, there was a dearth of information regarding Cebu as a tourist destination.
4.4. Movement of Natural Persons
Movement of natural persons refers to the activities of the Overseas Filipino Workers (OFWs) as well as Filipinos trained using Japanese resources. The 2001 Survey on OFWs, a rider survey to the October Labor Force Survey, estimated the number of OFWs who are working or had worked abroad during the last six months preceding the survey period. It provides information on the socioeconomic characteristics of OFWs and the amount of remittances.
Table 11 sketches the profile of the overseas contract worker (OCW) as of 2001. For Central Visayas, over two-thirds (67%) of the OCWs are males and over half (51%) belong to age group 25 to 35 years. About a fourth (24%) of the OCWs worked in Saudi Arabia, while 15% worked in Japan. Over half (53%) are trade & promotion operators. OCWs working in Japan contribute 15% of total remittances in Central Visayas. In 2001, there are about 94,000 Filipinos working in Japan, with 7,000 coming from Central Visayas. The Cebuano OCWs contributed P252.515 million in remittances in 2001.

21
Table 11. Selected Information on Overseas Contract Workers, October 2001 Central Visayas Philippines Variables No. Percent No. Percent
Central Visayas Share
Number of OCWs (1,000) 46 100.00% 1,029 100% 4.47% Male 31 67.39% 528 51.31% 5.87% Female 15 32.61% 501 48.69% 2.99%
Age Distribution 45 100% 1,030 100% 4.37% 15 - 24 5 11.11% 127 12.33% 3.94% 25 - 34 23 51.11% 417 40.49% 5.52% 35 – 44 14 31.11% 284 27.57% 4.93% 45 & Over 3 6.67% 202 19.61% 1.49%
Place of Work 46 100% 1,029 100% 4.47% Saudi Arabia 11 23.91% 266 25.85% 4.14% Hongkong 2 4.35% 123 11.95% 1.63% Japan 7 15.22% 94 9.14% 7.45% Taiwan 4 8.70% 87 8.45% 4.60% Singapore 2 4.35% 58 5.64% 3.45% Others 20 43.48% 401 38.97% 4.99%
Occupation 45 100% 1,030 100% 4.37% Managers / Professionals 2 4.44% 118 11.46% 1.69% Technicians, Associate Professionals & Clerks 5 11.11% 103 10.00% 4.85%
Service Workers 5 11.11% 116 11.26% 4.31% Trade & Promotion Operators 24 53.33% 336 32.62% 7.14% Laborers & Unskilled Workers 9 20.00% 346 33.59% 2.60% Others (Special Occupations & Farmers) 0.00% 11 1.07% 0.00%
Remittance of OCWs (in P1 ,000) 1,683,680 100.00% 38,514,872 100.00% 4.37% Saudi Arabia 557,796 33.13% 9,477,131 24.61% 5.89% Hongkong 55,922 3.32% 3,305,933 8.58% 1.69% Japan 252,515 15.00% 3,704,804 9.62% 6.82% Taiwan 70,570 4.19% 2,454,522 6.37% 2.88% Singapore 79,091 4.70% 1,842,209 4.78% 4.29% Others 667,786 39.66% 17,730,273 46.03% 3.77%
Source: 2001 Survey on Overseas Filipino
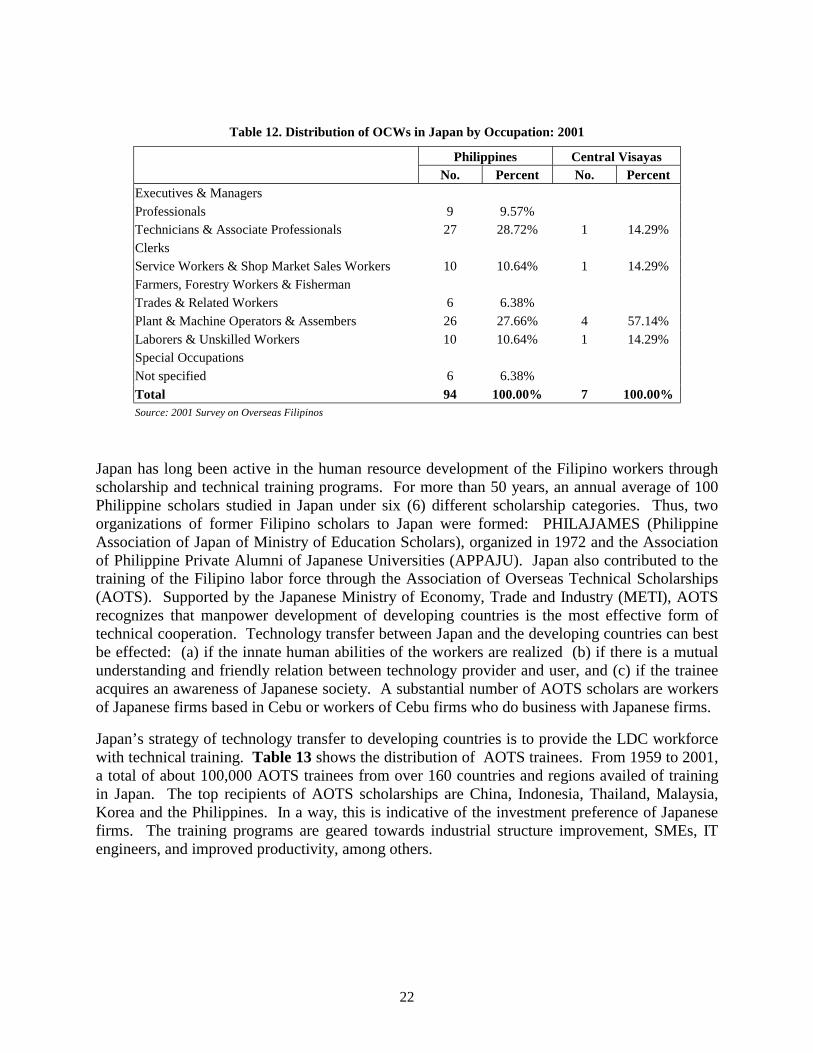
Table 12 concentrates on the Filipino OCWs in Japan. Nationwide, 29% of Filipino OCWs in Japan are hired as technicians and associate professionals, while another 28% work as plant and machine operators & assemblers. Some 11% are service workers and shop workers. In Central Visayas, approximately, 4,000 Filipino OCWs or 57% found jobs as plant and machine operators & assemblers. Perhaps, their experiences in Japanese firms based in the Philippines have boosted their chances for Japanese overseas employment.
22
Table 12. Distribution of OCWs in Japan by Occupation: 2001 Philippines Central Visayas
No. Percent No. Percent Executives & Managers Professionals 9 9.57% Technicians & Associate Professionals 27 28.72% 1 14.29% Clerks Service Workers & Shop Market Sales Workers 10 10.64% 1 14.29% Farmers, Forestry Workers & Fisherman Trades & Related Workers 6 6.38% Plant & Machine Operators & Assembers 26 27.66% 4 57.14% Laborers & Unskilled Workers 10 10.64% 1 14.29% Special Occupations Not specified 6 6.38% Total 94 100.00% 7 100.00% Source: 2001 Survey on Overseas Filipinos
Japan has long been active in the human resource development of the Filipino workers through scholarship and technical training programs. For more than 50 years, an annual average of 100 Philippine scholars studied in Japan under six (6) different scholarship categories. Thus, two organizations of former Filipino scholars to Japan were formed: PHILAJAMES (Philippine Association of Japan of Ministry of Education Scholars), organized in 1972 and the Association of Philippine Private Alumni of Japanese Universities (APPAJU). Japan also contributed to the training of the Filipino labor force through the Association of Overseas Technical Scholarships (AOTS). Supported by the Japanese Ministry of Economy, Trade and Industry (METI), AOTS recognizes that manpower development of developing countries is the most effective form of technical cooperation. Technology transfer between Japan and the developing countries can best be effected: (a) if the innate human abilities of the workers are realized (b) if there is a mutual understanding and friendly relation between technology provider and user, and (c) if the trainee acquires an awareness of Japanese society. A substantial number of AOTS scholars are workers of Japanese firms based in Cebu or workers of Cebu firms who do business with Japanese firms.
Japan’s strategy of technology transfer to developing countries is to provide the LDC workforce with technical training. Table 13 shows the distribution of AOTS trainees. From 1959 to 2001, a total of about 100,000 AOTS trainees from over 160 countries and regions availed of training in Japan. The top recipients of AOTS scholarships are China, Indonesia, Thailand, Malaysia, Korea and the Philippines. In a way, this is indicative of the investment preference of Japanese firms. The training programs are geared towards industrial structure improvement, SMEs, IT engineers, and improved productivity, among others.

23
Table 13. Distribution of Association for Overseas Technical Scholarship (AOTS): 1959 - 2001 Region/Country Number (1959 – 2001) Percent
Asia 74,871 81.12% China 17,944 19.44% Indonesia 10,824 11.73% Thailand 10,369 11.23% Malaysia 6,990 7.57% Korea 6,639 7.19% Philippines 4,939 5.35% India 4,820 5.22% Singapore 2,657 2.88% Vietnam 2,029 2.20% Pakistan 1,711 1.85% Sri Lanka 1,686 1.83% Taiwan 1,126 1.22% Others 3,137 3.40% Middle East 2,981 3.23% Africa 3,957 4.29% Latin America 7,722 8.37% Oceania 520 0.56% Europe 2,249 2.44% Total 92,300 100.00% Source: AOTS Website
It is interesting to note that the Cebu workforce is a recipient of training opportunities in Japan. Table 14 breaks down the human resource development extended by the Japanese government to Filipino professionals. Out of 4,939 AOTS scholars, 391 (8%) are from Cebu. Specifically, 248 (63%) of the Cebuano participants are employed by Cebu Ecozone firms. The Japanese Ministry of Education likewise grants scholarships for PhD and Master’s programs. Out of the reported 207 PHILAJAMES grantees, 18 (9%) hail from Cebu, of which a third (33%) work for Cebu Ecozone firms. The Asian Productivity Organization (APO), administered in the Philippines by the Development Academy of the Philippines, likewise gave training opportunities to Filipino professionals. From 1993 – 2003, a total of 1,230 professionals attended seminars. Of these, 70 (6%) are hired by Cebuano firms.
Table 14. Number of Recipients of Japanese Scholarships and Trainings: 2003
Organization Philippines Cebu Cebu EZ Firms Cebu Share Share of Cebu
EZ Firms
Association for Overseas Technical Scholarship, 1959 - 2000 4939 391 248 7.92% 63.43%
Philippine Association of Japanese Ministry of Education (PHILAJAMES)
207 18 6 8.70% 33.33%
AsiaN Productivity Organization, 1993 - 2003 1230 70 n.d. 5.69%
Total 6376 479 254 7.51% 53.03% Sources: Cebu AOTS, Phil. Association of Japanese Ministry of Education, Development Academy of the Philippines

24
Annex Table 15 specifies the Cebu-based companies which benefited from the AOTS training of their workers. Foremost of them are NEC Technologies Philippines, Inc, NEC Telecom Software Philippines, Inc., Cebu Jewelpico Corp., Tsuneishi Shipbuilding Inc., Tamiya Phils. Inc., Tsukiden Software Philippines Inc., Tsuneishi Heavy Industries Cebu Inc., Epson Precision Inc., Honda Philippines Inc., Coral Bay Nickel Corp and the like. The University of San Carlos , Taiyo Yuden Philippines, Asahi Optical, University of the Philippines Cebu College, Cebu City General Hospital, Cebu Mitsumi Inc., and Pit-os National High School are among the beneficiaries of Japan Ministry of Education scholarships. Likewise, the Asian Productivity Organization (APO) seminars have benefited government officials, industry representatives and academicians in Cebu.
4.5. Information Technology
Cebu has long-desired to be the IT hub of the Philippines, and eventually, in South East Asia. However, Cebu’s planners and businessmen have not formally come up with a definition of IT. A glance at the Japanese IT firms in Cebu (Table 15) shows that the IT industry may include the manufacture of electronic products, computer products, software programming and computer aided design applications . More recently, there was an increase in the demand for e-services to locate in Cebu, specifically call centers. Presently, there are twelve firms expressing their desire to locate in Cebu, with three call centers already operational: Sykes, WesternWats and People Support.

25
Table 15. List of Japanese IT-Related Firms in CEZ: 2003 Firm Products and Services Equity Mactan Economic Zone 1 Cebu Daichi Corp. Molding dies & industrial plastic parts for use of electronic & automotive industries 100.00% 2 Cebu Microelectronics Corp. Assembly of super precision electric discharging mechatronics (EDM) tools, etc. 99.92% 3 Cebu Shensei Corp. Laminated cores for magnetic tape heads 100.00% 4 Daitoh Precisions, Inc. Plastic parts for electronic assemblies like floppy disk drives & audio heads 99.00% 5 Exas Phils. Inc. Pressed steel part of floppy disk drives of personal computers 100.00% 6 Goji Industry Corp. Manufacture of CD ROM mechanism and magnetic audio head 100.00% 7 Halsangz Plating Cebu Corp. Electroplating of electronic parts 99.95% 8 Ingram Systems Phils. Corp. Development of software programs/applications 99.99% 9 Intec Cebu Inc. Manufacture of printed circuit board (PCB) for CD and CD--ROM players 100.00%
10 KKS A&I International Inc. Architectural and interior computer assisted design 99.99% 11 Mactan Parts Technology Inc. Manufacture of plastic frame and tray for CDRW 100.00% 12 Mactan Showa Electric Wire Inc. Production of stud wires for semiconductors 100.00% 13 Muramoto Audio-Visual Phils. Inc. Floppy disk drives for computers, CD-ROM 100.00% 14 NEC Technologies Phils Inc. Transmission and telecommunication equipment and system 99.99% 15 Phil. Makoto Corp. Magnetic eraser heads for industrial semiconductor 99.92% 16 Taiyo Yuden (Phils) Inc. Electronic components 99.96% 17 Tokiwa Optical Phils. Corp. Sensory elements for handheld bar code laser scanner, laser pointer & desktop
scanner 99.00% 18 Tokyo Steel Phils. Corp Stainless steel shafts and screws for computer and audio video equipment 100.00% Mactan Economic Zone II 19 Koshin Phil. Corp. Optical filters and fiber-optic devices for electronic, medical, optical, other
applications 99.93% 20 Makoto Metal Technology Alloy diecast for component parts of optical devices 100.00% 21 Matluster Corporation High precision glass for optical and electronic applications 99.99% Mitsumi Realty Inc 22 Cebu Mitsumi Inc. Electronic Products: magnetic tape head, floppy disk drive, CD-ROM 100.00% Asia Town Information Technology Park 23 NEC Telecom Software Phils. Software for telecommunication equipment and system engineering 100.00% 24 Tsuneishi Technical Services (Phils) Inc. Computer aided ship design (CASD), computer aided engineering design (CAED)
and Electronic Data Archival (EDA) 100.00%
Source: PEZA Website
Why was Cebu able to service the manpower requirements of the IT industry? Table 16 provides an insight that the Cebuano workforce is gearing up towards the increased supply of IT professionals. Of the total higher education enrolment of 131,664 in SY 2003-2004, 22,651 (17%) are enrolled in Information Technology (IT) courses, next only to business and accountancy. In March 2003, there were a total of 22,920 higher education graduates. Of these, 3,045 (13%) pursued an IT degree.

26
Table 16. Enrolment and No. of Graduates of Cebu Higher Education Institutions, by Field of Discipline Enrolment SY 2003 - 2004 Graduates SY 2002 - 2003 Field of Discipline
No. Percent No. Percent Business Administration 25,861 19.64% 5,449 23.77% Information Technology 1 22,651 17.20% 3,045 13.29% Medical & Allied Fields 22,067 16.76% 2,358 10.29% Education & Teacher Training 17,864 13.57% 4,354 19.00% Engineering 14,254 10.83% 2,409 10.51% Marine (Naval) Engineering / Transportation 7,688 5.84% 775 3.38% Trade, Craft & Industry 5,385 4.09% 1,426 6.22% Criminology 4,383 3.33% 732 3.19% Social & Behavioral Sciences 3,264 2.48% 690 3.01% Laws & Jurisprudence 1,921 1.46% 279 1.22% Humanities 1,898 1.44% 381 1.66% Architecture & Town Planning 1,456 1.11% 206 0.90% Natural Sciences 1,147 0.87% 308 1.34% Agriculture 718 0.55% 332 1.45% Fine & Applied Arts 564 0.43% 70 0.31% Tourism 401 0.30% 48 0.21% Mathematics 142 0.11% 58 0.25% Total 131,664 100.00% 22,920 100.00% No. of HEIs 73 1 Includes Computer Engineering, Computer Science and Information Technology Courses
Source: CHED Region 7 Form BC
Cebu ventured into the world of IT on March 29, 1994 when the Department of Science and Technology and the University of San Carlos provided internet services. Today, Cebu hosts the only PEZA-registered IT park outside Luzon, the five-hectare Asia Town Cyberpark. There are 7 multimedia companies, 41 programming firms with P125 million declared capitalization, employing an estimated of 12,000 persons. There are 422 registered internet cafes, with an average of 10 computers per café and 250,000 internet café users per week. There are 41 higher education institutions (HEIs) producing IT graduates. Likewise, there are internationally accredited Software Learning Centers in Cebu such as the CISCO Networking Academy, Microsoft Certified Training Centers, and the Oracle Programming Academy. Broadband services through Digital Subscriber Lines (DSL) are provided by PLDT and Globe, while Wireless Application Protocol (WAP) services are available through the dual-band GSM facilities provided by Globe and Smart. More importantly, the Cebu Educational Foundation for Information Technology (CEDF-IT) was established in 2001 to improve the quality of Cebu’s IT workforce. The founding members included leading IT firms (NEC Telecom Software, Lexmark), universities and colleges offering IT courses, business associations (Cebu Chamber of Commerce, Tritech, etc.), and representative government agencies (NEDA, DOST, DTI, CHED, TESDA, etc.). Since then, certification programs were offered to upgrade the skills of IT teachers.

27
4.6. Sociocultural and Political Factors
4.6.1. Japanese ODA.
The Official Development Assistance (ODA) consists of grant aid, technical cooperation, subscription and contribution to the U.N. agencies and international financial institutions and government loans. ODA is intended to promote the economic development and welfare of developing countries. Japan is the top donor country to the Philippines for the past 23 years, contributing a cumulative total of US$9.144 billion. This makes the Philippines the third largest recipient of Japanese Official Development Assistance (ODA), next to Indonesia and China. Cebu has likewise been the recipient of Japanese ODA over the years. For instance, Japan International Cooperation Agency (JICA) funded the Long-Term Development Plan of Cebu Province in the 1990s. The Japanese government has funded Cebu’s major infrastructures such as the rehabilitation of the international airport and seaport, the two bridges connecting Mactan to Cebu mainland, and recently, a reclamation project. Table 17 enumerates the sources of government funded projects as of 2003. As of 2003, there are a total of 87 development projects, amounting to P 36.509 billion. Of these, P20.450 billion (56%) was funded by the Japanese government, while another P1.014 billion (3%) enjoyed Japanese funding with local counterpart. Disaggregated by province, P8.831 billion (42%) went to Cebu. In terms of sector, P13.899 billion (65%) were infrastructure projects.
Table 17. Central Visayas Development Projects: 2003 By Local/Foreign Source
Source No. of Projects Amount (in Php M) % Share Local 59 8,380.08 22.95% Local/ Japan 3 1,014.34 2.78% Japan 12 20,449.80 56.01% Foreign 13 6,665.07 18.26% TOTAL 87 36,509.29 100.00%
By Sector, Province Sector/Province Japan Local/Japan Total % Share
Sector Infrastructure 13,335.91 563.03 13,898.94 64.75% Economic 7,113.74 231.31 7,345.05 34.22% Social Services 0.15 0.15 0.00% Development Administration 220.00 220.00 1.02% TOTAL 20,449.80 1,014.34 21,464.14 100.00% Province Cebu 8,831.10 220.00 9,051.10 42.17% Bohol 4,473.36 4,473.36 20.84% Negros Oriental 145.18 563.03 708.22 3.30% Siquijor - 0.00% Regionwide 7,000.15 231.31 7,231.46 33.69% TOTAL 20,449.80 1,014.34 21,464.14 100.00% Source: National Economic Development Authority 7

28
Table 18 lists the Japanese-funded government projects in Central Visayas. A substantial amount (P7 billion) was invested in the region-wide Agrarian Reform Infrastructure Support Project. The second biggest Japanese-funded project is the Metro Cebu Development Project III, known as the Cebu South Coastal Road Project. Other projects in Cebu include the Cebu North Coastal Road Project, the Cebu South Road Improvement Project, and the Cebu Socio-Economic Empowerment Development (SEED) Project. Cebu-based projects account for 36% of total Japanese projects.
4.6.2. Other Socio-Cultural and Political Factors
Japanese manufacturing firms generally outsource their jobs to other Japanese firms. In the case of semi-conductor firms, only the packaging is outsourced to Filipino firms. Japanese firms send their Filipino workers, such as the engineers, supervisors and operators to Japan for training. According to the key informants, Japanese investors prefer Cebu because of its favorable peace and order condition, industrial peace, a trainable workforce, the workers’ fluency in English, less bureaucratic procedures in doing business, more LGU support to foreign investors, tourist attraction in Cebu. Some economic zones have their own power provider, East Asia Utilities Corporation.
Japanese firms are transparent in their financial transaction and comply with environmental rules and regulations. Mitsumi, for instance, has a multipartite monitoring team composed of DENR, PEZA and LGUs which monitors the extent of pollution brought about by their economic activity of washing the chips and discharging waste water.
One of the main beneficiaries of foreign locators is the small and medium enterprises (SMEs) in Cebu. The foreign locators facilitate technology transfer in SMEs. An important contribution of Japanese presence in Cebu is the exposure to the Japanese work ethic. The Japanese worker requires less supervision, and they can solve the operational problems without referring them to their supervisors. However, once an SME is tapped by a Japanese firm as its sub-contractor, the SME can no longer directly export to Japan.
A Filipina started a local car assembly using surplus Japanese parts. While working in Japan, she married a Japanese who owned coffee shops, restaurants and real estate. In Japan, she saw the potential of surplus car parts piled in the junkyard. With the assistance of her brother, an engineer based in Guam, she set up her local business. Her husband assists her in the acquisition of surplus car parts and distributes these to Cebu, Myanmar and Kenya. The bureaucracy is the main obstacle for doing business in the Philippines. Its wishy-washy implementation of rules and regulations make it difficult for businessmen to predict the business environment. A few years back, the government encouraged the assembly of local motor vehicles using surplus car parts. Just recently, this incentive was repealed.
The Japanese Association of Cebu has about 1,000 members. About 65% of them are Japanese technicians working in the Cebu Economic Zones. Some 20% are independent businessmen, while 15% of them are retired Japanese who live on their pension. The Japanese technician usually stay in Cebu for about 3 to 4 years, after which they are assigned to another country. There is an estimated 200 Japanese retirees in Cebu, spending P40,000 per month for their daily needs. To assist non-English speaking Japanese tourists, there is a need for a Japanese-speaking personnel at the Bureau of Immigration. While the CEZ administrators take care of the VISA

Name of Project Location Fund Source Duration Amount Yearly Application
Cebu Projects Arterial Road Links Development Project VI (Cebu North Coastal Road Project) Cebu JBIC L/A PH-P227, 25th
Yen Loan Package 2003 - 2006 970,930,000 323,643,333
Arterial Road Links Development Project IV (B. Naga - Toledo Road Project) Cebu JBIC Loan No. PH-P204 2003 - 2006 555,000,000 185,000,000
MCDP III - Cebu South Coastal Road Project Southeastern part of Cebu CityJBIC PH-P175/C-004, 21st Yen Loan Package; JBIC PH-P158 (20th YCP)
February 11, 2002 - February 10, 2004 4,053,146,463 2,026,573,232
Arterial Road Links Development Project IV (Cebu South Road Improvement Project) Cebu Province JBIC PH-P188
Package I: February 10, 2003 - January 29, 2005: Package II; January 8, 2003 - October 28,
2004
785,150,000 392,575,000
South Reclamation Infrastructure (Stage 1-1) Project South Reclamation Area, Cebu City JBIC Loan Agreement PH-
P157 February 2003 - July 2004 339,385,740 339,385,740
Cebu Socio-Economic Empowerment Development (Cebu SEED) Project
20 municipalities in the northern part of Cebu province including the islands of Camotes and Bantayan
JICA with counterpart from the province of Cebu and the beneficiary LGUs
March 1999 to February 2004 220,000,000 44,000,000
Subtotal 6,923,612,204 3,311,177,305 Percent 35.81% 48.20%
Central Visayas Projects
Agrarian Reform Infrastructure Support Project (ARISP II)
ARC in Estaca, Pilar, Bohol; ARC in Anopog-Camugao, Pinamungahan, Cebu; and Bayawan, Negros Oriental
Japan Bank for International Cooperation (JBIC)
June 2002 - December 2003 7,000,000,000 3,500,000,000
Forestry Sector Project (FSP) JBIC Loan II Regionwide JBIC 1996 - 2000 (extended) 231,310,000 57,827,500.00
Expansion of National Tuberculosis Control Project Regionwide Japan International Cooperation
Agency (JICA) 1998 - 2003 149,560 29,912
Arterial Road Links Development Project IV (A. Bohol Circumferential Road Improvement Project)
Bohol JBIC 2003 - on going 1,975,620,000
Sixth Road Improvement Project, Contract Package NG-A Negros Oriental Province JBIC, Asian Development Bank
(ADB)August 28, 2001 - February 13,
2004 563,034,462
Rural Road Network Development Project Negros Oriental JBIC Loan No. PH-P162January 4, 2001 - December 2002
(Extended)145,184,965
Bohol Irrigation Project - Phase II Bohol Province JBIC PH-P202, 23rd Yen Loan Package 2003 - on going 2,384,000,000
Bohol Integrated Agriculture Promotion Project Capayas Irrigation Project, Lumanog, Ubay, Bohol JICA Grant November 1996 -
November 2003 113,740,000
Subtotal 12,413,038,987 3,557,857,412 Percent 64.19% 51.80%
Total 19,336,651,191 6,869,034,717 Percent 100% 100%Source: Regional Project Monitoring Committee: Sectoral Reports 1st Quarter 2003: NEDA Region 7
Table 18. List of Japanese Funded Government Projects in Central Visayas: 2003

30
requirements of Japanese nationals employed at CEZ, there is a need to provide Japanese immigrants with VISA assistance. At present, the Japanese Association of Cebu is holding Saturday classes for children of Japanese nationals. These classes are funded by the Japanese government.
Both governments should encourage the exchange of students between Cebu and Japan to explore the different cultures. A feedback mechanism should be set up in Cebu so that the Filipino professionals and workers who benefited from study and training grants in Japan can effect a technology transfer in their respective work environments. It has also been observed that Japanese companies were able to reduce the delivery time of their work output from 180 days to 45 days. These lessons in work productivity could benefit the local labor force. Over the past years, it has been a practice in CEZ to showcase the best practices in labor productivity. Perhaps, the different business, employees, academic, government and non-governmental organizations can benefit from the success stories. It was observed that the Japanese contribution to the local economy was under-rated. More importantly, in order to forge a meaningful economic relationship between Cebu and Japan, there must be an understanding of the richness of their respective cultures.

31
5.0. Economic Competitiveness of Cebu
Why is Metro Cebu attractive to investors? To answer this, two surveys are presented. The first survey was administered to 202 Cebuano businessmen under the auspices of the Philippine City Competitiveness Ranking Project 2003. The second is the 2002 JETRO Survey on the Investment-Related Costs of Selected 26 Asian Cities, administered to the local Japanese Chamber of Commerce and selected Japanese businessmen.
5.1. Perceptions of Local Businessmen
Table 19 ranks seven (7) broad location factors, including its 49 selected indicators. The broad location factors, ranked in order of importance, are: quality of human resources 1st, dynamism of local economy 2nd, linkages and accessibility 3rd, infrastructure 4th, cost of doing business 5th, quality of life 6th, and responsiveness of local government unit (LGU) to business 7th.
The human resources, required by business and industry, are readily supplied by Cebu’s educational institutions. Cebu is the educational center in Southern Philippines. The ensuing discussion highlights the respective ranks of selected economic indicators. The educational institutions in Cebu are perceived to play an important role in training the skilled manpower 7th. The role of schools is evident through the on-the-job training (OJT) provided to their students 8th, the upgrading of their school curricula to address the issue of relevance 14th, and the numerous training programs jointly organized by both the schools and industry 21st. Aside from schools, the quality of Cebu’s labor force is likewise an asset. The worker’s productivity is enhanced through the firm’s investment in training and skills development 1st, quality circles 3rd , fair labor practice 9th, eagerness of the local workers to develop skills 11th, job satisfaction 12th, additional benefits 15th, availability of IT programs in the city 17th, and the existence of a healthy relationship between labor and management 26th. However, firms are not perceived as effective in managing their human resources 48th .
The businessmen acknowledge the dynamism of tourism in spurring regional growth 6th. Other factors attributed to a dynamic local economy are: access to business financing 19th, conducive regulatory environment 24th, and the perception of a more favorable business climate within the next six months 28th.
The accessibility of Metro Cebu is measured in terms of proximity to international entry and exit points 4th, reasonable time from raw material source to the factory 16th, benefits of collaborating with other firms in the industry 23rd, availability of business support services 27th, proximity to sources of raw materials and other productive inputs 32nd, and good services provided by national agencies 34th. The strategic role of Cebu’s international airport and port is highlighted in this set of location factors. Likewise, the role of agglomeration economies is imputed in this measure of accessibility and linkages.
Infrastructure received diverse ratings from high to low. Belonging to the plus factors are: adequate cellular phone signals 2nd, adequate ISPs 5th and ease of connection to telephone lines from other service providers 10th. Businessmen are starting to become wary of the reliability of both electric power 18th and water services 22nd. While, businessmen have expressed concern over the congested traffic during peak hours 49th, the garbage problem 44th, and road and traffic management 37th.

32
Table 19. Ranking of Location Factors by Metro Cebu Businessman: 2003 Rank Broad Category Rank Indicators
1 Investing in training and skills development is important. 3 Workers' suggestions about ways to improve business operations are encouraged. 7 Availability of skilled labor needed by the company. 8 Allows on-the-job trainees from schools. 9 Poor labor practices such as discrimination and harassment are discouraged.
11 Workers from the local pool are eager to develop skills. 12 Job satisfaction of my workers and productivity is existent. 14 Curricula and academic programs in local HEIs equip graduate with basic skills needed by local industries 15 Good performance by workers can be attained through additional benefits. 17 Availability of IT programs in the city 21 Existence of training programs jointly organized by schools and industry partners. 26 Relations between management and labor are constructive.
1 Quality of Human Resources
48 Effective management of my firm's human resources is a key priority. 6 Tourism as an industry is a very vibrant sector
19 Access to financing for private businesses is available. 24 The city's regulatory environment is conducive to business.
2 Dynamism of Local Economy
28 In the next six months, revenues of local businesses are expected increase considerably. 32 Proximity to location of raw materials and other productive inputs 16 Reasonable time in transporting raw materials from domestic sources in the city 4 Proximity to international entry and exit points (airports, seaports & other transshipment points)
27 Available business support services, such as advice on product or process development, marketing, and business strategy making.
23 The benefits of collaborating with other firms in the industry is existent.
3 Linkages and Accessibility
34 The level of services provided by national agencies (e.g. DENR, BFAR, BFAD) is good. 37 Management of road network and traffic 49 During peak hours, roads are clear. 18 Reliable electric power 22 Reliable water services 10 Ease of connection to telephone lines from other service providers 2 Adequate cellular phone signals 5 Adequate ISPs
4 Infrastructure
44 Adequate facilities for managing garbage 20 Profitability of doing business in this is city is high. 5 Cost of Doing Business 45 Non-existence of informal fees 40 Clean roads and public open spaces 46 Clean open bodies of water 41 Clean air quality in the city 13 Adequate rest and recreational facilities (cinemas, bookstores, malls, etc.)
6 Quality of Life
25 Security environment is conducive for business. 36 Simple and efficient process in securing business permit. 39 Local government units are dynamically involved in developing human resources. 47 Local government programs are effective in assisting displaced workers. 43 Honesty and transparency of LGUs in its dealings 30 The city's administration of justice is fair. 29 Policies and regulations in the city is reflective to business needs. 42 LGU holds regular forums to elicit opinions of its constituents 38 Very effective Clean and Green Program 31 Reasonable business taxes imposed by LGU. 33 Well-implemented master development plan.
7 Responsivenss of LGU to Business
35 Reasonable and flexible land-use regulations such as zoning
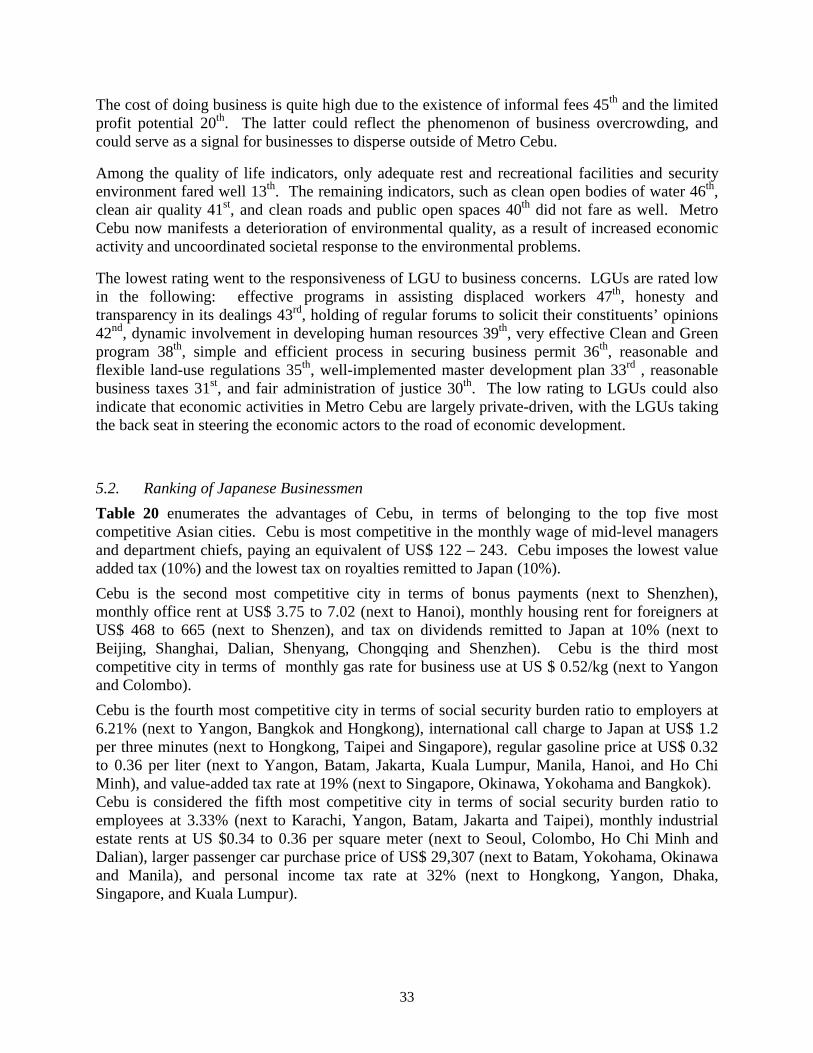
33
The cost of doing business is quite high due to the existence of informal fees 45th and the limited profit potential 20th. The latter could reflect the phenomenon of business overcrowding, and could serve as a signal for businesses to disperse outside of Metro Cebu.
Among the quality of life indicators, only adequate rest and recreational facilities and security environment fared well 13th. The remaining indicators, such as clean open bodies of water 46th, clean air quality 41st, and clean roads and public open spaces 40th did not fare as well. Metro Cebu now manifests a deterioration of environmental quality, as a result of increased economic activity and uncoordinated societal response to the environmental problems.
The lowest rating went to the responsiveness of LGU to business concerns. LGUs are rated low in the following: effective programs in assisting displaced workers 47th, honesty and transparency in its dealings 43rd, holding of regular forums to solicit their constituents’ opinions 42nd, dynamic involvement in developing human resources 39th, very effective Clean and Green program 38th, simple and efficient process in securing business permit 36th, reasonable and flexible land-use regulations 35th, well-implemented master development plan 33rd , reasonable business taxes 31st, and fair administration of justice 30th. The low rating to LGUs could also indicate that economic activities in Metro Cebu are largely private-driven, with the LGUs taking the back seat in steering the economic actors to the road of economic development.
5.2. Ranking of Japanese Businessmen Table 20 enumerates the advantages of Cebu, in terms of belonging to the top five most competitive Asian cities. Cebu is most competitive in the monthly wage of mid-level managers and department chiefs, paying an equivalent of US$ 122 – 243. Cebu imposes the lowest value added tax (10%) and the lowest tax on royalties remitted to Japan (10%). Cebu is the second most competitive city in terms of bonus payments (next to Shenzhen), monthly office rent at US$ 3.75 to 7.02 (next to Hanoi), monthly housing rent for foreigners at US$ 468 to 665 (next to Shenzen), and tax on dividends remitted to Japan at 10% (next to Beijing, Shanghai, Dalian, Shenyang, Chongqing and Shenzhen). Cebu is the third most competitive city in terms of monthly gas rate for business use at US $ 0.52/kg (next to Yangon and Colombo). Cebu is the fourth most competitive city in terms of social security burden ratio to employers at 6.21% (next to Yangon, Bangkok and Hongkong), international call charge to Japan at US$ 1.2 per three minutes (next to Hongkong, Taipei and Singapore), regular gasoline price at US$ 0.32 to 0.36 per liter (next to Yangon, Batam, Jakarta, Kuala Lumpur, Manila, Hanoi, and Ho Chi Minh), and value-added tax rate at 19% (next to Singapore, Okinawa, Yokohama and Bangkok). Cebu is considered the fifth most competitive city in terms of social security burden ratio to employees at 3.33% (next to Karachi, Yangon, Batam, Jakarta and Taipei), monthly industrial estate rents at US $0.34 to 0.36 per square meter (next to Seoul, Colombo, Ho Chi Minh and Dalian), larger passenger car purchase price of US$ 29,307 (next to Batam, Yokohama, Okinawa and Manila), and personal income tax rate at 32% (next to Hongkong, Yangon, Dhaka, Singapore, and Kuala Lumpur).

Investment Costs Rank Value Higher Ranked Cities (Country)WAGES
Mid-level managers (monthly; section and department chief level) 1 US$ 122 - 243Bonus payments (fixed bonus+ variable bonus months) 2 Basic wage x 1 month Shenzhen (China)
Social Security burden Ratio (A. Employer) 4 6.21% (SSS: 5.21%, EC: 1%) Yangon (Myanmar), Bangkok (Thailand) and Hong Kong (China)
Social Security burden Ration (B. Employee) 5 3.33% (SSS) Karachi (Pakistan), Yangon (Myanmar), Batam (Indonesia), Jakarta (Indonesia) and Taipei (Taiwan)
LAND COSTS and OFFICE SPACEOffice rent (monthly) (per sq.m) 2 US$ 3.75 - 7.02 Hanoi (Vietnam)Housing rent for foreigners (monthly) 2 US$ 468 - 655 Shenzhen (China)
Industrial estate rents (monthly) (per sq.m) 5 US$ 0.34 - 0.36 Seoul (Korea), Colombo (Sri Lanka), Ho Chin Minh City (Vietnam) and Dalian (China)
TELECOMMUNICATION COSTS
International call charge (for 3 min. to Japan) 4 US$ 1.2 Hong Kong (China), Taipei (Taiwan), and Singapore (Singapore)
Value-added tax (standard tax rate) 1 10%Tax on royalties remitted to Japan (highest tax rate) 1 10%
Tax on dividends remitted to Japan (highest tax rate) 2 10% Beijing (China), Shanghai (China), Dalian (China), Shenyang (China), Chongqing (China) and Shenzhen (China)
Gas rate for business use (monthly basic charge) 3 US$ 0.52/kg Yangon (Myanmar) and Colombo (Sri Lanka)
Regular gasoline price (1 liter) 4 US$ 0.32 - 0.36Yangon (Myanmar), Batam (Indonesia), Jakarta (Indonesia), Kuala Lumpur (Malaysia), Manila (Philippines), Hanoi (Vietnam), and Ho Chin Minh City (Vietnam)
Value-added tax rate (highest tax rate) 4 10% Singapore (Singapore), Okinawa (Japan), Yokohama (Japan), and Bangkok (Thailand)
Large passenger car purchase price (sedan over 2500cc) 5 US$ 29,307 Batam (Indonesia), Yokohama (Japan), Okinawa (Japan) and Manila (Philippines)
Personal income tax rate (highest tax rate) 5 32% Hong Kong (China), Yangon (Myanmar), Dhaka (Bangladesh), Singapore (Singapore), and Kuala Lumpur (Malaysia)
Table 20. Competitiveness of Cebu, In terms of Top 5 Ranking in Investment-Related Costs JETRO Survey of 26 Asian Cities, 2002
PUBLIC UTILITIES COST
Source: http://www/jetro.go.ip

35
Annex Table 16 details the competitiveness of Cebu in other investment-related costs. For instance, Cebu ranks 14th in legal minimum wage, ranks 10th in nominal wage increase rate, 9th in monthly salary of engineers, and 7th in monthly salary of worker. Dhaka has the lowest monthly wage for workers and engineers. Bangkok has the lowest nominal wage rate increase from 1999 to 2001. And Colombo has the lowest legal minimum wage.
Cebu is relatively not competitive with respect to telecommunication, water rate, gas rate and container transport. With respect to monthly basic telephone charges, Cebu and Manila are the least competitive cities. Cebu is also not so competitive in terms of monthly basic mobile phone charges 19th, broadband internet connection fee 16th, and internet connection fee 12th. Beijing reports the lowest internet connection fee, while Seoul charges the lowest broadband internet connection fee. Ho Chi Minh and Hanoi enjoys the lowest monthly basic telephone fee, while Colombo charges the minimum monthly basic mobile phone fee.
Cebu ranks 14th in business water rates and 16th in business gas rate. Cebu is 20th in container transport. New Delhi charges the lowest water rate for business use, while Hongkong charges the lowest gas rate for business use. Mumbai (India) charges the lowest fee for container transport.
The Philippines, and Cebu, as a destination of Japanese investments is hampered by many factors. Foremost is the relatively high wages of both unskilled and skilled labor. Dhaka has the lowest wage rates. Bangkok has guaranteed a stable wage rate environment, by minimizing wage rate increases from 1999 to 2001. Despite the liberalization of the telecommunication, utilities and the shipping industries in the country, our rates are still globally uncompetitive. The time is now opportune to the look into the efficiency of these industries. 6.0. Elements of the Cooperation Framework Between Cebu and Japan This section looks into the benefits and constraints spurred by the economic relationship between Cebu and Japan. Based on the analysis, a cooperation framework which could address the Philippines’ reform objectives is suggested.
6.1. Estimates of Japanese Economic Presence in Cebu: An Exercise
Japanese economic presence in Cebu is felt in the following areas: (a) foreign direct investments, (b) foreign trade, (c) movement of natural, (d) Japanese Official Development Assistance, and (e) estimated local purchases of Cebu Economic Zones. Table 21 presents the economic estimates of Japanese economic presence in Cebu.
Foreign direct investments (FDIs), undertaken by CEZ firms is reported at P1.621 billion in 2002. In addition, these CEZ firms generate local employment. Using a 1996 estimate, it was noted that 88.54% of the CEZ workforce were factory workers; some 10.88% were managers and staff, while 0.58% were foreign nationals. Estimates of salary contribution, withheld income taxes and mandatory employment contribution comprise societal benefit from employment generation. Mandatory employment contribution for both employees and employers include: (a) Social Security Systems (SSS) contribution for the social security benefits of the employees, (b) National Health Insurance Program (PhilHealth) contribution for the medical insurance/benefit

36
Table 21. Measure of Japanese Economic Presence in Cebu, 2002 Estimated Benefits Estimated Costs Net Benefit/Cost Activity (in Pesos) (in Pesos) (in Pesos)
Foreign Direct Investments, 2002 Amount of Investments, 2002 1,621,000,000 Employment Generation: 43,354 workers Salaries to factory workers (88.54%) @ P8,000/mo 3,992,105,686 Salaries to Filipino managers & staff (10.88% @ P40,000/mo) 2,452,795,904 Withholding Taxes on Wages: Factory Workers 372,339,091 Withholding Taxes on Wages: Filipino managers 234,900,883 SSS Contribution: Factory Workers 350,998,215 SSS Contribution: Filipino managers & staff 80,376,235 PHILHEALTH: Factory Workers 92,125,516 PHILHEALTH: Managers & staff 14,150,746 Home Development Mutual Fund: P200/month per worker 104,049,600 Income Taxes Foregone: 32% of Total Income of Top 7000 Corp. 2,298,134,720 Sub-total 9,314,841,877 2,298,134,720 7,016,707,157 ` Foreign Trade, 2002 Exports @ P51.60 for US $1: US $ 1775.77 Million 91,629,732,000 Imports @ P 51.60 for US $1: US $ 1208.33 Million 62,349,828,000 Import Adjustments, RP-Japan Export/Import Ratio (0.732157) 62,800,578,681 Sub-total 91,629,732,000 125,150,406,681 (33,520,674,681) Total Foreign Direct Investments and Foreign Trade, 2002 100,944,573,877 127,448,541,401 (26,503,967,524) Share of Japanese Firms (96 out of 160 locators or 60%) A 60,566,744,326 76,469,124,841 (15,902,380,515) Movement of Natural Persons Japanese tourists: 87,168 x US $1,058.75/tourist @ P51.60 for US $1 4,762,118,592 Remittances of Filipino OCWs in Japan 224,660,000 AOTS Trainings Japanese Scholarships Japanese Nationals in Cebu, 1200 persons @ P40,000/month 576,000,000 Sub-total B 5,562,778,592 - 5,562,778,592 Japanese Official Development Assistance - Cebu Projects 3,311,177,305 Regional Projects: 40% of municipalities x P6,869,034,717 2,758,604,342 Sub-total C 6,069,781,647 6,069,781,647 Estimated Local Purchases of Cebu Economic Zone Firms, 2002 8,205,128,205 Share of Japanese Firms (96 out of 160 locators) D 4,923,076,923 4,923,076,923 Measure of Japanese Presence in Cebu (A + B + C + D) 77,122,381,488 76,469,124,841 653,256,648

37
of the employees, and (c) Home Development and Mutual Fund (HDMF) contribution for the housing needs of the employees. The total benefits from FDI are estimated at P9.315 billion in 2002.
However, CEZ locators are generally exempt from corporate income tax, the maximum of which is 32%. Data from Top 7000 Corporations in the Philippines located in CEZ report a total net profit of P7.182 billion in 2002. Assuming an income tax rate of 32%, the income taxes foregone is estimated at P2.298 billion.
The net benefit of CEZ FDIs is estimated at P7.017 billion in 2002. The estimated benefits total P9.315 billion, of which P1.621 billion is attributed to total FDIs. Some P7.694 billion represents the salaries and mandatory contributions or the employment generation potential of CEZ firms. On the other hand, the opportunity cost of foregone income taxes is estimated at P2.298 billion.
Another perceived benefit of FDIs is foreign exchange earnings. In 2002, CEZ exports are valued at P91.630 billion, while CEZ imports are reported at P62.350 billion. At first glance, it seems that CEZ enjoys a balance of trade surplus equivalent to P29.280 billion. But these reported data merely refer to the exports and imports which are processed in Cebu ports. A substantial portion of imported raw materials still pass through the Manila ports. Thus, an import adjustment factor is incorporated, representing the average RP-Japan export-import ratio in 2002. It seems that CEZ firms, having a high import content, is estimated to have lost some P33.521 billion in foreign exchange earnings.
To arrive at an estimate of the contribution of Japanese firms, the 60% allocation factor is used. It is noted that 96 out of 160 locators in CEZ are Japanese firms. Thus, in terms of FDI and foreign trade, the net contribution loss of Japanese firms is estimated at – P17.944 billion, mainly due to the foreign exchange loss.
Nonetheless, the net contribution loss is partly offset by the following: (a) contribution of Japanese tourists which generate tourist income of P4.762 billion, (b) remittances of Central Visayas OCWs working in Japan amounting to P224.660 million, (c) estimated cost-of-living expenses of Japanese nationals residing in Cebu running at P576 million, (d) estimated Cebu allocation of Japanese Official Development Assistance (ODA) amounting to P6.070 billion, and (e) share of Japanese firms in CEZ local purchases estimated at P4.923 billion. On the whole, Japanese economic presence is still favorable to the Cebuano economy, with an estimated net contribution of P653 million in 2002.
6.2. Possible Gains and Losses in a Bilateral Arrangement
Bilateral relationship between Cebu and Japan has long been in place. Since 1959, the 391 Cebuano workers benefited from AOTS, 18 Cebuano scholars enjoyed Japanese Ministry of Education study grants, and 70 Filipino trainees attended Asian Productivity Organization (APO) seminars. As a result, the local universities have a pool of Japanese-trained PhDs in Biology, Marine Sciences, Robotics and Engineering. AOTS scholars have returned to their workplaces, while some of them moved on to other companies, bringing with them the technical skills they acquired from their Japanese experience. Moreover, APO scholars have attempted to improve
38
the productivity of their respective workplaces, with some of them spearheading local productivity workshops.
The strategy of bringing in Japanese nationals first as tourists and then as potential investors could account for the relatively higher share of Japanese firms in the Cebu Economic Zones. In the 1980s when the Japanese economy was booming, some Japanese investors partnered with local businessmen to set up golf courses. This venture was subsequently abandoned when Japan went into recession from 1990s onwards. Nevertheless, there are still a lot of local hotel resorts, which cater largely to Japanese tourists. As noted in Section 3.3, Central Visayas ranked first in some economic characteristics for Hotels & Restaurants in the 1998 Annual Survey of Establishments. The tourist amenities savored by the Japanese tourists are also enjoyed by the locals. During the tourist lean season, hotel resort operators open their facilities to the locals at a at a discounted rate.
But not all Japanese tourists set up manufacturing firms in CEZ. Some of them bring with them their illegal activities, as reported by one Japanese national.
Japan’s interest in Cebu is not limited to tourism, foreign investments and technology transfer. Even the Japanese government contributed to the development of Cebu by providing both the Long-Term Cebu Development Plan and the infrastructures needed to transform Cebu into a region with low agricultural productivity to an export region with industrial-service orientation. Table 22 attempts to measure the economic openness of Cebu. The share of CEZ exports to Gross Regional Domestic Product has substantially increased from 6.37% in 1990 to 32.06% in 2002. This validates the export orientation of Central Visayas. In addition, the estimated receipts from foreign tourists are substantially more than the GRDP. As an open economy, Cebu’s growth hinges on the external developments of its trading partners. Its economy is likewise cushioned against the uncertainties generated by national politics.
What is the development implication of Cebu’s export-led growth? In 1988, Central Visayas was the fourth poorest region, with a poverty incidence of 46.7% of total families and 52.1% of regional population. In 2000, Central Visayas slid down to the ninth poorest region, reporting a slight alleviation of its poverty situation. The proportion of poor families dropped by 7.9% from 46.7% in 1988 to 38.8% in 2000. Likewise, there was an 8.4% reduction of poverty incidence of the regional population from 52.1% in 1988 to 43.7% in 2000. Offhand, it seems that the CEZ was able to alleviate the poverty situation in Central Visayas.
Table 23 shows the provincial distribution of family and municipal/city income and expenditures in Central Visayas. Cebu is home to 59% of total families in Central Visayas. Cebu contributes 65% of total family income and claims 66% of total family expenditures. Although Cebu accounts for 40% of total cities and municipalities in the region, Cebu generates 65% of total local government unit (LGU) income and expenditures.
Central Visayas has the third highest Gini ratio in 2000, next to Eastern Visayas and Northern Mindanao. However, among the four provinces in Central Visayas, Cebu has the lowest Gini ratio. More interesting is that among the three urbanized cities in Cebu, Lapulapu, the site of three economic zones, has the lowest Gini ratio. This indicates that the export economy of Cebu has contributed to a more equitable income distribution within the province. Japanese nationals have also commented on the favorable peace and order conditions in Cebu as an important
39
location factor. It is worth noting that a favorable peace and order condition is associated with an equitable income distribution.
Table 24 affords a glimpse of the 1990-2000 changes in the physical infrastructures, commercial establishments and service facilities, especially on Metro Cebu barangays. The period saw an increase in the number of barangay halls, public plazas, public markets and streets within Metro Cebu. There was also an increase in the number of barangays with stores, lodging facilities, shops, banks and recreational facilities. More Metro Cebu barangays reported an increase in the following services: telephone, health, high school, electricity, newspaper circulation, elementary schools, communal systems and telegraph.
Table 25 details the change in the educational attainment of Cebu’s population belonging to age group 20 years and older from 1990 to 2000. It is observed that the working population of Metro Cebu has become more literate. Specifically, there was an increase in the proportion of the working population who attended high school (+5%), completed post-secondary (+3%), and attended college (+0.8). On the other hand, there was a decrease in the proportion of the working population who did not attend school (-2.4%), or merely attended elementary school (-9.2%). The quality of the labor force, in terms of number of years of schooling, has slightly improved in Metro Cebu over the years.

YearGRDP
(P1,000) at Current Prices
Average Exchange Rate (P/$)
CEZ Exports
(US$1,000)
Peso Equivalent of CEZ Exports
(P1,000)
Share of CEZ
Exports to GRDP (A)
Foreign Tourist Arrivals
Average Daily
Expenditure (US $)
Average Length of
Stay
Estimated Receipts from
Foreign Tourists
Share of Tourism to GRDP (B)
Economic Openness of
Cebu (A + B)
1990 70,766,356 24.3 185,630 4,510,809.00 6.37% 111,475 144.94 10.31 4,047,908,405 5720% 5726.47%1991 82,821,213 27.5 251,170 6,907,175.00 8.34% 109,830 144.94 10.31 4,513,366,486 5450% 5457.87%1992 88,830,818 25.5 305,870 7,799,685.00 8.78% 131,859 144.94 10.31 5,024,546,624 5656% 5665.09%1993 94,892,469 27.1 465,510 12,615,321.00 13.29% 164,138 144.94 10.31 6,646,994,975 7005% 7018.06%1994 108,492,900 26.4 663,480 17,515,872.00 16.14% 188,903 144.94 10.31 7,452,289,270 6869% 6885.06%1995 121,438,468 25.7 898,950 23,103,015.00 19.02% 227,329 155.92 9.22 8,398,867,154 6916% 6935.17%1996 140,543,545 26.2 1,103,000 28,898,600.00 20.56% 248,311 156.28 9.18 9,333,474,257 6641% 6661.54%1997 158,892,511 29.5 1,102,320 32,518,440.00 20.47% 277,614 148.24 8.93 10,841,272,104 6823% 6843.49%1998 176,998,511 40.9 1,349,010 55,174,509.00 31.17% 242,894 130.82 8.44 10,968,738,590 6197% 6228.25%1999 200,794,772 39.3 1,626,370 63,916,341.00 31.83% 289,098 134.87 8.50 13,024,825,717 6487% 6518.47%2000 236,042,793 44.2 1,919,000 84,819,800.00 35.93% 296,187 120.37 8.30 13,079,303,429 5541% 5577.00%2001 260,533,534 51.0 1,755,720 89,541,720.00 34.37% 273,876 105.17 9.16 13,455,861,242 5165% 5199.10%2002 285,817,257 51.6 1,775,770 91,629,732.00 32.06% 286,783 115.58 9.16 15,667,385,465 5482% 5513.67%
Sources: PIDS Website (GRDP, Average Exchange Rate), DTI ROVII (CEZ Exports), DOT ROVII (Foreign Tourist Arrivals 2002 Philippine Statistical Yearbook (Average Daily Expenditures and Average Length of Stay of Foreign Tourists)
Table 22. Measure of Economic Openness of Cebu: 1990 - 2002

Cebu City Lapulapu Mandaue
All Families 1,104,989 415,507 151,406 40,507 45,058 210,182 224,933 17,397 Percent 100.00% 37.60% 13.70% 3.67% 4.08% 19.02% 20.36% 1.57% Percent of Cebu 59.05%
Total Family Income (P1,000) 109,980,924 34,788,250 23,211,578 6,841,716 7,170,536 16,245,161 20,347,245 1,376,436 Percent 100.00% 31.63% 21.11% 6.22% 6.52% 14.77% 18.50% 1.25% Percent of Cebu 65.48% Average Family Income (P) 99,531 83,725 153,307 168,902 159,140 77,291 90,459 79,119
Total Family Expenditures (P1,000) 92,425,706 29,602,038 19,576,968 5,748,955 6,375,625 14,062,687 16,078,422 981,011 Percent 100.00% 32.03% 21.18% 6.22% 6.90% 15.22% 17.40% 1.06% Percent of Cebu 66.33% Average Family Expenditures (P) 83,644 71,243 129,301 141,925 141,498 66,907 71,481 56,390
All Municipalities 132 50 1 1 1 48 25 6 Percent 100.00% 37.88% 0.76% 0.76% 0.76% 36.36% 18.94% 4.55% Percent of Cebu 40.15%
Total Municipal Income (P1,000) 7,432,617 1,780,532 2,299,400 393,050 389,812 1,133,566 1,345,416 90,841 Percent 100.00% 23.96% 30.94% 5.29% 5.24% 15.25% 18.10% 1.22% Percent of Cebu 65.43% Ave. Municipal Income (P) 15,140,173 35,610,636 2,299,400 393,050 389,812 24,118,417 53,816,629 15,140,173
Total Municipal Expenditures (P1,000) 6,880,655 1,576,861 2,268,953 339,367 347,110 1,068,893 1,195,168 84,314 Percent 100.00% 22.92% 32.98% 4.93% 5.04% 15.53% 17.37% 1.23% Percent of Cebu 65.87% Ave. Municipal Expenditures (P) 14,052,256 31,537,224 2,268,953 339,367 347,110 22,268,596 47,806,714 14,052,256
Gini Coefficient 0.502850 0.465396 0.445494 0.431513 0.465416 0.548261 0.476963 0.469351Sources: Local Productivity & Performance Measurement System, Department of Interior & Local Government RO VII 2000 Family Income & Expenditures Survey (National Statistics Office)
Table 23. Central Visayas Income and Expenditures and Gini Coefficient, by Province: 2000
Income and Expenditures Central Visayas Cebu Highly Urbanized Cities Bohol Negros Oriental Siquijor

1990 2000 % Change 1990 2000 % Change 1990 2000 % Change Physical Infrastructures Street Pattern 32.2 42.7 10.5 61.5 63.5 2.0 23.7 36.7 13.0Highway Access 63.1 83.4 20.3 90.4 91.1 0.7 55.2 81.1 25.9Public Plaza 31.6 33.3 1.7 20.0 27.3 7.3 35.0 35.0 0.0Barangay Hall 60.1 92.9 32.8 80.4 93.0 12.6 54.3 92.9 38.6Church 83.8 86.8 3.0 85.9 85.2 -0.7 83.2 87.2 4.0Public Market 24.0 25.4 1.4 27.0 33.2 6.2 23.1 23.1 0.0
Commercial EstablishmentsStore, any kind 66.5 80.9 14.4 71.1 89.3 18.2 65.1 78.4 13.3Repair shop, any kind 21.1 34.1 13.0 41.9 56.1 14.2 15.1 27.7 12.6Lodging Facility 8.3 15.1 6.8 19.3 35.1 15.8 5.2 9.3 4.1Recreational Facility 10.1 13.4 3.3 18.9 28.8 9.9 7.5 8.9 1.4Financing Institution 6.2 10.4 4.2 14.1 28.0 13.9 3.9 5.3 1.4
Elementary School(s) 77.5 83.0 5.5 76.7 80.8 4.1 77.8 83.6 5.8High School 17.5 27.5 10.0 26.3 42.4 16.1 14.9 23.2 8.3Health Services 51.5 79.7 28.2 70.4 90.8 20.4 46.0 76.5 30.5Post Office 15.2 18.7 3.5 31.5 21.8 -9.7 10.5 17.8 7.3Telephone Service 13.2 32.3 19.1 39.3 60.9 21.6 57.0 23.9 -33.1Telegraph Service 8.2 8.6 0.4 12.2 15.1 2.9 7.1 6.8 -0.3Newspaper 9.2 22.5 13.3 29.6 37.6 8.0 3.3 18.1 14.8Communal Water System 36.4 54.9 18.5 53.7 56.8 3.1 31.3 54.3 23.0Electricity 62.1 76.9 14.8 81.9 92.6 10.7 56.3 72.3 16.0
Service/Communication Facilities
Source: Zosa & Zosa. Cebu A Demographic & Socio-economic Profile based on the 2000 Census
Table 24. Percent of Cebu Barangays with Selected Facilities and Services: 1990 & 2000
Facility / Services Cebu Province Metro Cebu Outside Metro Cebu

43
Table 25. Percent of Populatiopn 20 Years & Older, by Highest Educational Attainment in Cebu Province : 1990 & 2000 Educational Attainment Cebu Province, Metro Cebu
and Selected Cities, by Census Year
All Persons 20 and Older
No Grade Completed Pre-School Elementary
School * High School * Post Secondary *
College or More *
Cebu Province 1990 1,319,644 6.9 0.1 49.4 21.1 2.9 19.0 2000 1,762,265 2.8 0.1 40.3 27.0 4.9 21.3 Percent Change 33.54% -4.1 0.0 -9.1 5.9 2.0 2.3 Metro Cebu 1990 654,185 4.0 0.0 37.7 25.9 3.7 28.1 2000 919,695 1.6 0.1 28.5 30.9 6.7 28.9 Percent Change 40.60% -2.4 0.1 -9.2 5.0 3.0 0.8 Outside Metro Cebu 1990 665,459 9.8 0.2 60.9 16.4 2.1 10.1 2000 842,570 4.1 0.1 53.2 22.7 2.9 13.0 Percent Change 26.60% -5.7 -0.1 -7.7 6.3 0.8 2.9 * Including graduates, currently enrolled, and drop-outs Percent do not add to 100.0 because Not Stated cases are omitted.
Source: Zosa & Zosa. Cebu A Demographic & Socio-economic Profile based on the 2000 Census
7.0. Summary and Conclusion
The Cebu-Japan cooperation is boosted by the economic competitiveness of Cebu. Cebu’s competitiveness manifests itself through its quality human resources, its dynamic export sector and tourism industry, its proximity to international entry and exit points and its infrastructures, its cost of doing business, its quality of life and the responsiveness of LGU to business needs. When rated among 26 Asian cities, Cebu is the most competitive with regards to the monthly wage of mid-level managers and supervisors and the second most competitive city in terms of monthly housing rent for foreigners. On the other hand, Cebu, as a destination of Japanese investments, is hampered by the relatively high wages of both unskilled and skilled labor, an unstable wage rate environment and moderately high costs of telecommunication, water, gas, and container transport.
Cebu’s basic formula for attracting Japanese direct investments (JDIs), referred to above, has remained virtually unchanged over the years. External trade has captured a significant and ever-growing share in the GRDP over the years. The share of CEZ exports to Gross Regional Domestic Product has substantially increased from 6.37% in 1990 to 32.06% in 2002. In addition, the estimated receipts from foreign tourists are substantially more than GRDP.
The growth of export industries in Cebu has likewise increased the demand for higher education In 2003, Cebu’s HEIs enrolled a total of 131,664 students and produced 22,920 graduates, which is the annual addition to the local workforce. The quality of Cebu’s labor force is enhanced through the firm’s investment in training and skills development, quality circles, the worker’s desire for self-improvement, availability of IT programs in the city, and industrial peace. In addition, Japanese scholarships and training programs are available to the graduates and workers

44
of Cebu to facilitate technology transfer. A substantial number of the Cebuano workforce has been exposed to the Japanese work ethic. In turn, Japanese engineers based in Cebu have interacted with local labor.
An unintended consequence of a trained human resource is labor mobility. Thus, it is common for workers to seek employment in other firms within the zone, or for Filipino workers in Japanese firms to job-hunt in American or European firms. On the other hand, there are also cases when Japanese engineers, with expired work contracts, would seek employment in other Japanese firms within the economic zone.
CEZ is an example of the agglomeration of Japanese firms. Large Japanese firms would sub-contract their input or service requirements to other Japanese firms, usually of the SME category. It is not unusual for Japanese firms to buy, even their office supplies, from a Japanese company. In the literature, Krugman (1991) argues that firms agglomerate due to increasing returns. The geographic concentration of similar activities results in technical externalities, such as the development of specialized suppliers, workers investing in industry specific skills, and knowledge spilling between firms. These technical externalities reduce the firms’ cost, improve their product quality or both.
Crucial in the development of the economic zones is the role of Japanese ODA. By providing funds for the support infrastructure in industrial development, such as the renovation of the Mactan International Airport and Cebu International Port, the construction of the Mactan-Cebu Bridge and the upgrading of the Leyte Geothermal Project to supply the needed electricity, the Japanese government has made Cebu an attractive location for Japanese investors, workers and tourists.
In terms of human development, Cebu’s export-led growth was able to reduce poverty incidence by approximately 8% from 1988 to 2000. There was also a more stable income distribution for Cebu, especially in its key cities. Lapulapu City, the site of the Mactan Export Processing Zone, has the lowest Gini ratio. While more income opportunities became available in Metro Cebu, the other provinces in Central Visayas suffered from a relatively high income inequity, especially Bohol and Negros Oriental. There is a need for Cebu’s economic growth to spillover its neighboring provinces. The eco-tourism potential of Bohol, Siquijor and Negros Oriental has attracted a lot of foreign and domestic tourists. However, there is a need to complement tourism development with industrial development, as in the case of Cebu.

Annex Table Title
1 Regional Situationer, Central Visayas: 2000 - 2002
2 Competitiveness of Central Visayas, In Terms of Top 5 Ranking in Selected Economic Characteristics 1997/1998 Annual Survey of Establishments
3 Comparative Location Quotient, Central Visayas: 1998 and 2002
4 Share of Japan to Total Philippine Merchandise Exports and Imports: 2003 and 2002 FOB Value in US 1,000 Dollars
5 Exports and Imports to Japan: 2003 and 2002 FOB Value in US 1,000 Dollars
6 Net Trade Balance with Japan: 2003 and 2002 FOB Value in US 1,000 Dollars
7 Approved Investments and Foreign Direct Investments, by Promotion Agency 2002 and January to September 2003
8 Foreign Direct Investments, by Country and Industry 2002 and January - September 2003
9 Distibution of PEZA Firms, by Zone: September 2003
10 PEZA Locator Investments, by Nationality and Products: 1995 - 2002 (in percent)
11 Selected Economic Variables of PEZA Firms, 1994 - 2003
12 Distribution of PEZA Firms, by Region and Industry: 2003
13 List of Japanese Firms in Cebu Economic Zones: 2002
14 Selected Financial Institution of Top 7000 Corporation in Cebu Economic Zones: 2002
15 Distribution of AOTS, PHILAJAMES and APO: 2003
16 Investments Costs in 26 Asia Cities JETRO November 2002 Survey
LIST OF ANNEX TABLES
Philippine - Japan Economic Linkages: A Case Study of Cebu

Number % Share RankPopulation, 2000 76,498,735 5,701,064 7.45% 5 IV, NCR, III, VIPop. Growth Rate 1995-2000 (in %) 2.35% 2.79% 3 IV, IIILand Area (sq. km.) 300,000 14,951.50 4.98% 11 NCR, ARMM, I, X, XIIPopulation Density (persons/sq km) 255 381 3 NCR, IIIMetro Cebu to Total City Population 23,039,451 1,661,899 7.21% 2 NCR (10,319,507--45%) 2002 GRDP at constant 1985 prices (in thousand pesos) 1,046,083,473 74,429,639 7.12% 4 NCR, IV, III
2002 GVA Agriculture at constant 1985 prices (in thousand pesos) 206,198,004 9,649,801 4.68% 11 IV, III, XI, VI, IX, I, II,
X, XII, V2002 GVA Industry at constant 1985 prices (in thousand pesos) 361,167,417 24,376,692 6.75% 4 NCR, IV, III
2002 GVA Services at constant 1985 prices (in thousand pesos) 478,718,052 40,868,860 8.54% 2 NCR
Total Employment, July 2002 (in 1,000) 30,104 2,180 7.24% 5 IV, NCR, III, VIAgricultural Employment, July 2002 (in 1,000) 11,114 825 7.42% 4 IV, VI, VIndustrial Employment, July 2002 (in 1,000) 4,694 444 9.46% 4 IV, NCR, IIIService Employment, July 2002 (in 1,000) 14,266 910 6.38% 5 NCR, IV, III, VIOverall Value Added/Labor (2002) 34,749 34,356 0.99 5 NCR, CAR, XI, IV
Agricultural Value Added/Labor (2002) 18,503 11,697 0.63 10 XI, III, IV, IX, VI, I, II, XII, X
Industrial Value Added/Labor (2002) 76,942 54,902 0.71 11 CAR, NCR, XI, X, XII, VI, IV, CARAGA, III, VII
Service Value Added/Labor (2002) 33,557 44,911 1.34 5 NCR, IV, III, VI, VIICommodity Flow, by Water (in P1,000), 2000 256,121,473 29,825,133 11.64% 2 NCRCommodity Flow, by Air (in P1,000), 2000 2,962,598,798 208,373,008 7.03% 4 NCR, XI, IXHigher Education Enrolment, SY 2000-01 2,430,392 215,139 8.85% 4 NCR, IV, VICumulative Higher Education Graduates, SY1993 to SY1999 2,286,705 185,843 8.13% 3 NCR, VI
Non-Formal Education Graduates, 1996 113,697 12,217 10.75% 4 VIII, I, VIFunctional Literacy of Population 10-64 Years Old, 1994 (in %) 83.80% 80.90% 7 NCR, IV, III, II, I, X, V
NEAT Average Grade, 2000 51.73 53.28 7 VIII, XIII, X, XI, I, XNSAT Average Grade, 2000 53.39 52.2 11 VI, V, XII, ARMMElementary Cohort Survival Rate, 2000 67.21% 68.40% 6 I, NCR, III, IV, IISecondary Cohort Survival Rate, 2000 73.05% 74.41% 7 I, IV, II, CAR, III, NCRIncidence of Poor Families, 2000 (in %) 33.70% 38.80% 9 NCR, III, IV, II, CAR, IIncidence of Poor Population, 2000 (in %) 39.40% 43.70% 9 NCR, IV, III, II, I, CARPer Capita Poverty Threshold, 2000 (in P) 13,823 11,061 13 VIII, XIIGini Concentration, 2000 0.4507 0.4696 3 VIII, X
Annex Table 1
Source: 2002 Philippine Statistical Yearbook, July 2002 Labor Force Survey
Regional Situationer, Central Visayas: 2000 - 2002
Variable Philippines Central Visayas Better Ranked Regions

Page 1 of Annex Table 2
No. % Share Rank
Ratio of Capital Expenditures to Compensation 0.427 1.385 324% 1
K/L Ratio 27.695 77.472 280% 1Labor Productivity 137.066 149.129 109% 2 NCRAverage Firm Size (Employment) 25.718 26.015 101% 2 NCRAverage Firm Size (Revenues) 8,542.11 8,008.61 94% 2 NCRCapital Expenditures (P1,000) 4,762,149 818,257 17% 2 NCRValue Added (P1,000) 23,568,643 1,575,105 7% 2 NCRTotal Revenue (P1,000) 57,112,557 3,251,494 6% 2 NCRNo. of Firms 6,686 406 6% 4 NCR, IV & IIIEmployment 171,951 10,562 6% 4 NCR, IV & III
Ratio of Capital Expenditures to Compensation 0.350 0.789 225% 1
K/L Ratio 26.681 57.589 216% 1Average Firm Size (Employment) 54.526 85.291 156% 2 VICapital Expenditures (P1,000) 1,718,136 270,150 16% 2 NCRAverage Firm Size (Revenues) 14,985.85 24,170.80 161% 3 VI & NCRLabor Productivity 130.540 118.048 90% 3 NCR & VIIITotal Revenue (P1,000) 17,698,288 1,329,394 8% 3 NCR & IVEmployment 64,395 4,691 7% 3 NCR & IVValue Added (P1,000) 8,406,120 553,763 7% 3 NCR & IVNo. of Firms 1,181 55 5% 5 NCR, IV, III & XI
Average Firm Size (Employment) 67.109 81.583 122% 1Employment 279,510 16,806 6% 2 NCRNo. of Firms 4,165 206 5% 2 NCRValue Added (P1,000) 62,157,403 2,945,096 5% 2 NCRAverage Firm Size (Revenues) 25,603.62 22,204.89 87% 3 NCR & XILabor Productivity 222.380 175.241 79% 3 NCR & IVTotal Revenue (P1,000) 106,639,081 4,574,207 4% 3 NCR & XICapital Expenditures (P1,000) 8,229,143 169,250 2% 3 NCR & IIICapital Productivity 7.553 17.401 230% 5 Caraga, CAR, VIII & IV
Average Firm Size (Employment) 114.894 137.580 120% 2 NCRNo. of Firms 603 50 8% 3 IV & IIIAverage Firm Size (Revenues) 436,864.10 379,309.08 87% 4 NCR, VIII & IVEmployment 69,281 6,879 10% 4 NCR, IV & IIITotal Revenue (P1,000) 263,429,052 18,965,454 7% 5 NCR, IV, VIII & III
Hotels & Restaurants: 1997 ASE
Other Services (Health): 1998 ASE
Real Estates & Business Activities: 1998 ASE
Electricity, Gas & Water: 1998 ASE
Annex Table 2Competitiveness of Central Visayas, In Terms of Top 5 Ranking in Selected Economic Characteristics
1997/1998 Annual Survey of Establishments
Sector Philippines Central Visayas Higher Ranked Regions
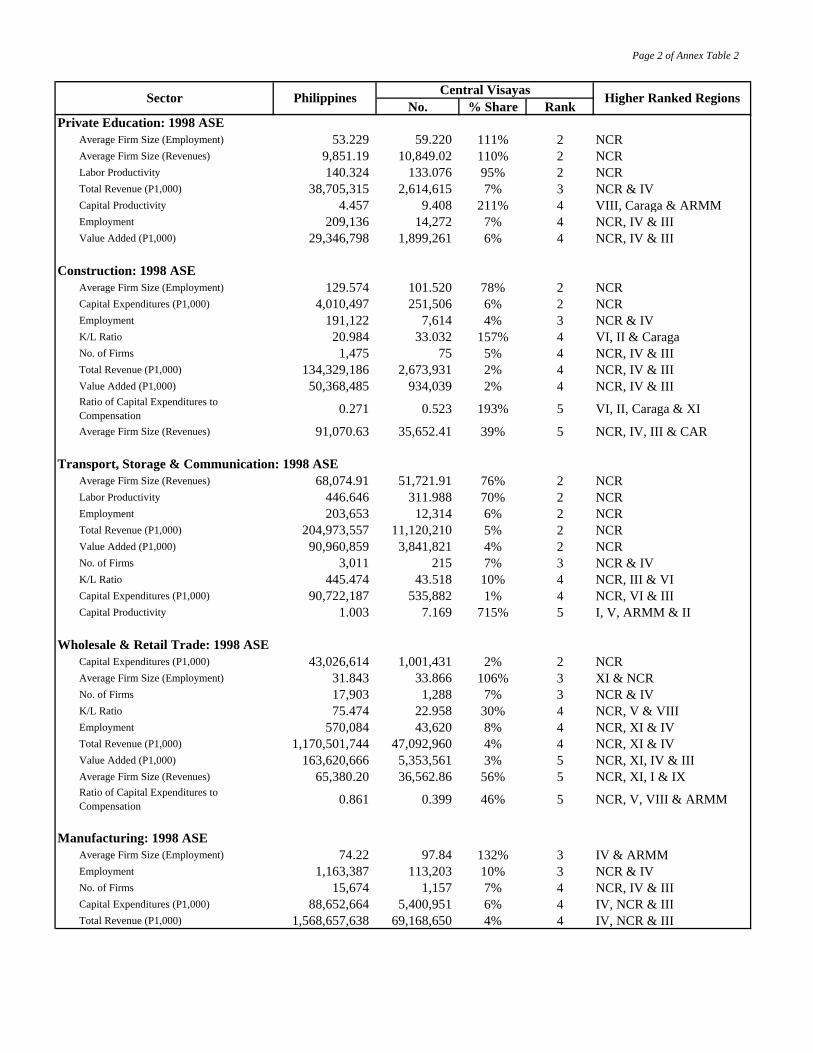
Page 2 of Annex Table 2
No. % Share Rank Sector Philippines Central Visayas Higher Ranked Regions
Average Firm Size (Employment) 53.229 59.220 111% 2 NCRAverage Firm Size (Revenues) 9,851.19 10,849.02 110% 2 NCRLabor Productivity 140.324 133.076 95% 2 NCRTotal Revenue (P1,000) 38,705,315 2,614,615 7% 3 NCR & IVCapital Productivity 4.457 9.408 211% 4 VIII, Caraga & ARMMEmployment 209,136 14,272 7% 4 NCR, IV & IIIValue Added (P1,000) 29,346,798 1,899,261 6% 4 NCR, IV & III
Average Firm Size (Employment) 129.574 101.520 78% 2 NCRCapital Expenditures (P1,000) 4,010,497 251,506 6% 2 NCREmployment 191,122 7,614 4% 3 NCR & IVK/L Ratio 20.984 33.032 157% 4 VI, II & CaragaNo. of Firms 1,475 75 5% 4 NCR, IV & IIITotal Revenue (P1,000) 134,329,186 2,673,931 2% 4 NCR, IV & IIIValue Added (P1,000) 50,368,485 934,039 2% 4 NCR, IV & IIIRatio of Capital Expenditures to Compensation 0.271 0.523 193% 5 VI, II, Caraga & XI
Average Firm Size (Revenues) 91,070.63 35,652.41 39% 5 NCR, IV, III & CAR
Average Firm Size (Revenues) 68,074.91 51,721.91 76% 2 NCRLabor Productivity 446.646 311.988 70% 2 NCREmployment 203,653 12,314 6% 2 NCRTotal Revenue (P1,000) 204,973,557 11,120,210 5% 2 NCRValue Added (P1,000) 90,960,859 3,841,821 4% 2 NCRNo. of Firms 3,011 215 7% 3 NCR & IVK/L Ratio 445.474 43.518 10% 4 NCR, III & VICapital Expenditures (P1,000) 90,722,187 535,882 1% 4 NCR, VI & IIICapital Productivity 1.003 7.169 715% 5 I, V, ARMM & II
Capital Expenditures (P1,000) 43,026,614 1,001,431 2% 2 NCRAverage Firm Size (Employment) 31.843 33.866 106% 3 XI & NCRNo. of Firms 17,903 1,288 7% 3 NCR & IVK/L Ratio 75.474 22.958 30% 4 NCR, V & VIIIEmployment 570,084 43,620 8% 4 NCR, XI & IVTotal Revenue (P1,000) 1,170,501,744 47,092,960 4% 4 NCR, XI & IVValue Added (P1,000) 163,620,666 5,353,561 3% 5 NCR, XI, IV & IIIAverage Firm Size (Revenues) 65,380.20 36,562.86 56% 5 NCR, XI, I & IXRatio of Capital Expenditures to Compensation 0.861 0.399 46% 5 NCR, V, VIII & ARMM
Average Firm Size (Employment) 74.22 97.84 132% 3 IV & ARMMEmployment 1,163,387 113,203 10% 3 NCR & IVNo. of Firms 15,674 1,157 7% 4 NCR, IV & IIICapital Expenditures (P1,000) 88,652,664 5,400,951 6% 4 IV, NCR & IIITotal Revenue (P1,000) 1,568,657,638 69,168,650 4% 4 IV, NCR & III
Manufacturing: 1998 ASE
Private Education: 1998 ASE
Construction: 1998 ASE
Transport, Storage & Communication: 1998 ASE
Wholesale & Retail Trade: 1998 ASE

Page 3 of Annex Table 2
No. % Share Rank Sector Philippines Central Visayas Higher Ranked Regions
Value Added (P1,000) 569,069,870 24,165,392 4% 5 NCR, IV, III & CAR
Labor Productivity 2,017.797 1,016.913 50% 3 NCR & XValue Added (P1,000) 499,027,464 6,709,595 1% 3 NCR & IVTotal Revenue (P1,000) 634,379,862 7,880,550 1% 3 NCR & IVK/L Ratio 123.939 37.684 30% 4 NCR, Caraga & IVAverage Firm Size (Revenues) 110,442.18 24,397.99 22% 4 NCR, X & IINo. of Firms 5,744 323 6% 4 NCR, IV & IIICapital Expenditures (P1,000) 30,651,848 248,640 1% 4 NCR, IV & XIRatio of Capital Expenditures to Compensation 0.521 0.207 40% 5 NCR, Caraga, IV & XI
Employment 247,313 6,598 3% 5 NCR, IV, III & XI
No. of Firms 506 79 16% 3 IV & VIAverage Firm Size ( Employment) 51.103 36.405 71% 4 NCR, XI & IXEmployment 25,858 2,876 11% 5 NCR, XI, IV & VITotal Revenue (P1,000) 5,754,038 261,894 5% 5 NCR, XI, VI & IVCapital Expenditures (P1,000) 221,402 7,203 3% 5 NCR, XI, VI & IV
No. of Firms 2,065 163 8% 3 NCR & IVLabor Productivity 419.215 219.876 52% 4 NCR, V & IIIAverage Firm Size (Revenues) 21,103.93 9,031.45 43% 4 NCR, III & VK/L Ratio 56.223 20.218 36% 4 IV, NCR & VIEmployment 67,966 4,123 6% 4 NCR, IV & IIITotal Revenue (P1,000) 43,579,620 1,472,126 3% 4 NCR, IV & IIIValue Added (P1,000) 28,492,347 906,550 3% 4 NCR, IV & IIICapital Expenditures (P1,000) 3,821,264 83,357 2% 4 IV, NCR & VIAverage Firm Size (Employment) 32.913 25.294 77% 5 NCR, III, IV & IXRatio of Capital Expenditures to Compensation 0.543 0.291 54% 5 IV, NCR, VI & X
Ratio of Capital Expenditures to Compensation 2.956 3.183 108% 4 VI, NCR & Caraga
Labor Productivity 335.890 267.281 80% 4 I, VI & CaragaCapital Productivity 1.049 1.130 108% 5 III, IV, X & IK/L Ratio 320.085 236.606 74% 5 NCR, VI, XI & CaragaCapital Expenditures (P1,000) 6,611,365 156,870 2% 5 VI, I, Caraga & NCR
Average Firm Size (Employment) 103.839 107.804 104% 4 XI, IX & CaragaEmployment 124,191 12,074 10% 4 XI, VI & IIINo. of Firms 1,196 112 9% 5 VI, IV, XI & IIIValue Added (P1,000) 10,398,243 582,743 6% 5 XI, III, IV & VITotal Revenue (P1,000) 29,797,965 1,184,484 4% 5 XI, IV, III & VI
Mining & Quarrying: 1998 ASE
Agriculture: 1997 ASE
Source: 1997/1998 Annual Survey of Establishments
Financial Intermendiation: 1998 ASE
Fishing: 1998 ASE
Community & Personal Services: 1995 ASE

1998 1 2002 2
Agriculture and Forestry 1.6641 1.2930 1.0062Fishing 0.6691 1.4792 1.1661Mining and Quarrying 0.7585 0.4269 0.8204Manufacturing 1.2610 1.2941 1.3962Electricity, Gas and Water 2.6095 1.3205 1.2786Construction 0.5507 0.5298 1.1760Wholesale and Retail Trade; Repair of Motor Vehicles, Motorcycles and Personal and Household Goods
0.9716 1.0176 0.9201
Hotels and Restaurants 1.9845 0.8169 0.4512Transport, Storage and Communications 1.2542 0.8041 0.8893Financial Intermediation 0.3992 0.3548 0.6716Real Estate, Renting and Business Activities 1.4070 0.7996 0.7365Private Education 1.9217 0.9076 0.9389Health & Social Work 1.9561 0.9688 0.8883Other Community, Social and Personal Services 0.9448 0.8068 1.2540Sources: 1 Annual Survey of Establishments (ASE), 1997 & 1998 2 Labor Force Survey, July 2002
Comparative Location Quotient, Central Visayas: 1998 and 2002Annex Table 3
Sectors1998 Value
Added1Employment

Japan Total Exports Share Japan Total Exports Share Japan Total Imports Share Japan Total Imports ShareALL PRODUCTS 5,224,377 32,441,278 16.10% 5,295,454 35,208,159 15.04% 6,979,132 34,380,315 20.30% 7,232,676 35,426,508 20.42%
Consumer Manufactures 252,751 3,222,123 7.84% 268,146 3,662,105 7.32% 85,842 1,392,761 6.16% 95,784 1,370,864 6.99%
Garments & Footwear 64,927 2,025,239 3.21% 77,911 2,353,385 3.31% 854 81,703 1.04% 943 87,803 1.07%
Housewares 24,570 163,795 15.00% 26,577 189,755 14.01% 2,697 56,470 4.78% 5,535 61,553 8.99%
Furniture & Wood Products 97,997 355,112 27.60% 92,566 402,554 22.99% 4,794 46,475 10.32% 11,310 51,004 22.18%
Giftware & Accessories 32,538 357,578 9.10% 39,166 418,981 9.35% 4,763 71,483 6.66% 3,911 77,933 5.02%
Other Consumer Products 32,719 320,400 10.21% 31,927 297,430 10.73% 72,735 1,136,631 6.40% 74,086 1,092,571 6.78%
Food & Food Preparations 339,823 1,442,539 23.56% 381,152 1,396,362 27.30% 8,075 1,968,694 0.41% 7,817 2,283,273 0.34%
Processed Foods 36,963 648,720 5.70% 36,292 588,214 6.17% 6,027 1,256,338 0.48% 3,481 1,376,214 0.25%
Fresh Foods 215,605 397,277 54.27% 223,169 396,017 56.35% 47 666,528 0.01% 121 850,455 0.01%
Marine Products 87,254 396,542 22.00% 121,692 412,131 29.53% 2,001 45,827 4.37% 4,215 56,604 7.45%
Resource-Based Products 282,860 1,979,855 14.29% 259,895 1,719,896 15.11% 147,749 5,752,148 2.57% 175,548 5,777,150 3.04%
Coconut Products 27,159 444,396 6.11% 21,732 357,113 6.09% 3,624 0.00% 6,890 0.00%
Mineral Products 127,929 295,004 43.37% 141,329 279,506 50.56% 11,586 382,071 3.03% 12,744 374,055 3.41%
Forest Products, Tobacco, Marble 7,419 79,728 9.31% 14,644 69,031 21.21% 4,971 382,566 1.30% 5,385 386,705 1.39%
Seaweeds, Carageenan, Cutflowers 1,694 75,484 2.24% 2,085 75,194 2.77% 57 8,543 0.67% 35 6,264 0.56%
Textile Yarns, Twine, Cordages 27,486 216,017 12.72% 26,726 220,080 12.14% 73,539 944,574 7.79% 89,283 1,113,795 8.02%
Non-metallic Mineral 6,719 22,233 30.22% 6,583 22,486 29.28% 13,417 66,586 20.15% 31,178 99,378 31.37%
Petroleum Products 69,618 462,082 15.07% 32,237 379,102 8.50% 8,216 3,366,355 0.24% 1,700 3,159,307 0.05%
Other Resource-Based Products 14,836.6 384,912 3.85% 14,559 317,383 4.59% 35,963 597,827 6.02% 35,224 630,756 5.58%
Industrial Manufactures 3,964,426 24,111,023 16.44% 4,047,984 26,713,309 15.15% 6,660,205 24,442,593 27.25% 6,808,153 24,915,205 27.33%
Electronics 3,261,420 21,491,974 15.18% 3,392,718 24,321,896 13.95% 3,158,487 10,156,216 31.10% 3,237,947 9,950,422 32.54%
Machineries/Transport Equpt 514,191 1,673,611 30.72% 478,696 1,511,372 31.67% 1,127,168 2,843,918 39.63% 1,184,264 2,883,451 41.07%
Metal Manufactures 12,472 64,804 19.25% 8,194 51,501 15.91% 241,551 1,042,012 23.18% 262,473 1,000,583 26.23%
Construction Materials 34,104 132,308 25.78% 31,836 122,855 25.91% 91,873 505,647 18.17% 93,760 517,146 18.13%
Chemicals 33,789 307,034 11.00% 35,817 322,068 11.12% 361,404 2,054,073 17.59% 352,734 1,977,058 17.84%
Other Industrial Manufactures 108,450 441,292 24.58% 100,724 383,617 26.26% 1,679,721 7,840,727 21.42% 1,676,976 8,586,545 19.53%
Special Transactions 384,518 1,685,737 22.81% 338,276 1,716,487 19.71% 77,261 824,120 9.37% 145,374 1,080,016 13.46%
Source: http://tradelinephil.dti.gov.ph
Annex Table 4Share of Japan to Total Philippine Merchandise Exports and Imports: 2003 and 2002
FOB Value in US 1,000 Dollars
Major Product GroupingPhilippine Exports Philippine Imports
Jan - Nov 2003 Jan - Dec 2002 Jan - Nov 2003 Jan - Dec 2002

Value Percent Value Percent Value Percent Value Percent ALL PRODUCTS 5,224,377 100% 6,979,132 100% 5,295,454 100% 7,232,676 100%
Consumer Manufactures 252,751 4.84% 85,842 1.23% 268,146 5.06% 95,784 1.32% Garments & Footwear 64,927 1.24% 854 0.01% 77,911 1.47% 943 0.01% Housewares 24,570 0.47% 2,697 0.04% 26,577 0.50% 5,535 0.08% Furniture & Wood Products 97,997 1.88% 4,794 0.07% 92,566 1.75% 11,310 0.16% Giftware & Accessories 32,538 0.62% 4,763 0.07% 39,166 0.74% 3,911 0.05% Other Consumer Products 32,719 0.63% 72,735 1.04% 31,927 0.60% 74,086 1.02%Food & Food Preparations 339,823 6.50% 8,075 0.12% 381,152 7.20% 7,817 0.11% Processed Foods 36,963 0.71% 6,027 0.09% 36,292 0.69% 3,481 0.05% Fresh Foods 215,605 4.13% 47 0.00% 223,169 4.21% 121 0.00% Marine Products 87,254 1.67% 2,001 0.03% 121,692 2.30% 4,215 0.06%Resource-Based Products 282,860 5.41% 147,749 2.12% 259,895 4.91% 175,548 2.43% Coconut Products 27,159 0.52% 0.00% 21,732 0.41% 0.00% Mineral Products 127,929 2.45% 11,586 0.17% 141,329 2.67% 12,744 0.18% Forest Products, Tobacco, Marble 7,419 0.14% 4,971 0.07% 14,644 0.28% 5,385 0.07% Seaweeds, Carageenan, Cutflowers 1,694 0.03% 57 0.00% 2,085 0.04% 35 0.00% Textile Yarns, Twine, Cordages 27,486 0.53% 73,539 1.05% 26,726 0.50% 89,283 1.23% Non-metallic Mineral 6,719 0.13% 13,417 0.19% 6,583 0.12% 31,178 0.43% Petroleum Products 69,618 1.33% 8,216 0.12% 32,237 0.61% 1,700 0.02% Other Resource-Based Products 14,836.6 0.28% 35,963 0.52% 14,559 0.27% 35,224 0.49%Industrial Manufactures 3,964,426 75.88% 6,660,205 95.43% 4,047,984 76.44% 6,808,153 94.13% Electronics 3,261,420 62.43% 3,158,487 45.26% 3,392,718 64.07% 3,237,947 44.77% Machineries/Transport Equpt 514,191 9.84% 1,127,168 16.15% 478,696 9.04% 1,184,264 16.37% Metal Manufactures 12,472 0.24% 241,551 3.46% 8,194 0.15% 262,473 3.63% Construction Materials 34,104 0.65% 91,873 1.32% 31,836 0.60% 93,760 1.30% Chemicals 33,789 0.65% 361,404 5.18% 35,817 0.68% 352,734 4.88% Other Industrial Manufactures 108,450 2.08% 1,679,721 24.07% 100,724 1.90% 1,676,976 23.19%Special Transactions 384,518 7.36% 77,261 1.11% 338,276 6.39% 145,374 2.01%
Source: http://tradelinephil.dti.gov.ph
Annex Table 5Exports and Imports to Japan: 2003 and 2002
FOB Value in US 1,000 Dollars
Major Product GroupingJan - Nov 2003 Jan - Dec 2002
Exports Imports Exports Imports
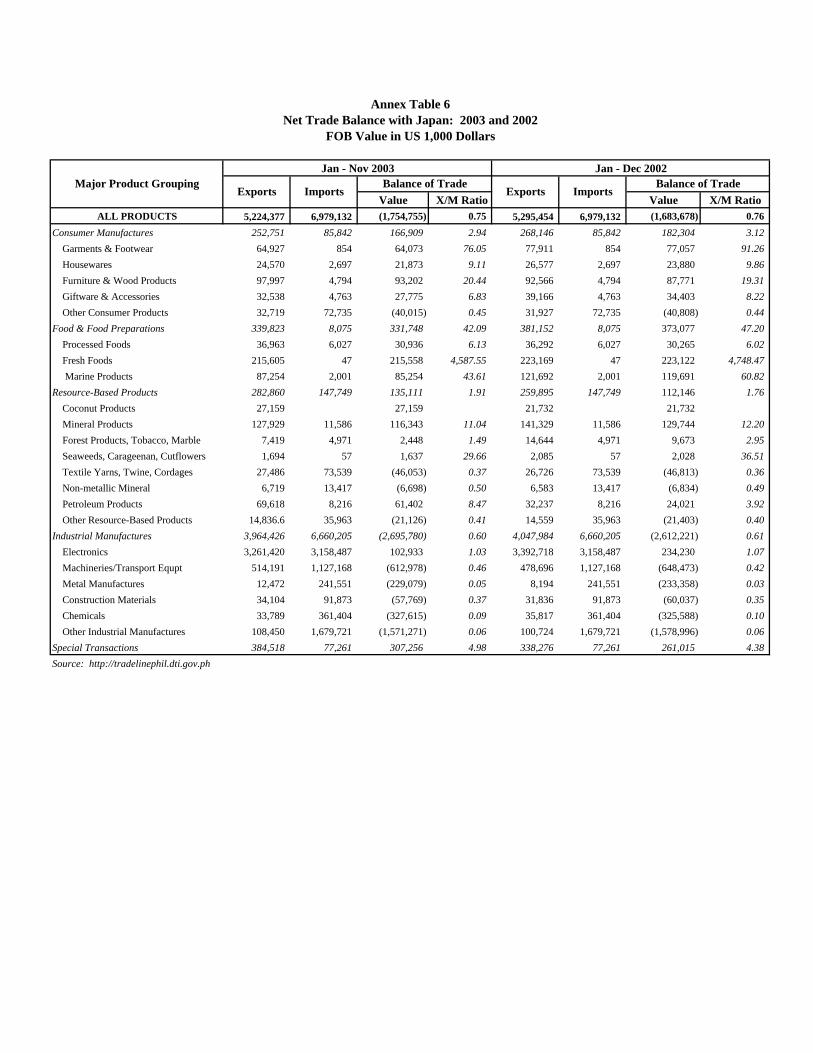
Value X/M Ratio Value X/M Ratio ALL PRODUCTS 5,224,377 6,979,132 (1,754,755) 0.75 5,295,454 6,979,132 (1,683,678) 0.76
Consumer Manufactures 252,751 85,842 166,909 2.94 268,146 85,842 182,304 3.12 Garments & Footwear 64,927 854 64,073 76.05 77,911 854 77,057 91.26 Housewares 24,570 2,697 21,873 9.11 26,577 2,697 23,880 9.86 Furniture & Wood Products 97,997 4,794 93,202 20.44 92,566 4,794 87,771 19.31 Giftware & Accessories 32,538 4,763 27,775 6.83 39,166 4,763 34,403 8.22 Other Consumer Products 32,719 72,735 (40,015) 0.45 31,927 72,735 (40,808) 0.44 Food & Food Preparations 339,823 8,075 331,748 42.09 381,152 8,075 373,077 47.20 Processed Foods 36,963 6,027 30,936 6.13 36,292 6,027 30,265 6.02 Fresh Foods 215,605 47 215,558 4,587.55 223,169 47 223,122 4,748.47 Marine Products 87,254 2,001 85,254 43.61 121,692 2,001 119,691 60.82 Resource-Based Products 282,860 147,749 135,111 1.91 259,895 147,749 112,146 1.76 Coconut Products 27,159 27,159 21,732 21,732 Mineral Products 127,929 11,586 116,343 11.04 141,329 11,586 129,744 12.20 Forest Products, Tobacco, Marble 7,419 4,971 2,448 1.49 14,644 4,971 9,673 2.95 Seaweeds, Carageenan, Cutflowers 1,694 57 1,637 29.66 2,085 57 2,028 36.51 Textile Yarns, Twine, Cordages 27,486 73,539 (46,053) 0.37 26,726 73,539 (46,813) 0.36 Non-metallic Mineral 6,719 13,417 (6,698) 0.50 6,583 13,417 (6,834) 0.49 Petroleum Products 69,618 8,216 61,402 8.47 32,237 8,216 24,021 3.92 Other Resource-Based Products 14,836.6 35,963 (21,126) 0.41 14,559 35,963 (21,403) 0.40 Industrial Manufactures 3,964,426 6,660,205 (2,695,780) 0.60 4,047,984 6,660,205 (2,612,221) 0.61 Electronics 3,261,420 3,158,487 102,933 1.03 3,392,718 3,158,487 234,230 1.07 Machineries/Transport Equpt 514,191 1,127,168 (612,978) 0.46 478,696 1,127,168 (648,473) 0.42 Metal Manufactures 12,472 241,551 (229,079) 0.05 8,194 241,551 (233,358) 0.03 Construction Materials 34,104 91,873 (57,769) 0.37 31,836 91,873 (60,037) 0.35 Chemicals 33,789 361,404 (327,615) 0.09 35,817 361,404 (325,588) 0.10 Other Industrial Manufactures 108,450 1,679,721 (1,571,271) 0.06 100,724 1,679,721 (1,578,996) 0.06 Special Transactions 384,518 77,261 307,256 4.98 338,276 77,261 261,015 4.38 Source: http://tradelinephil.dti.gov.ph
Balance of Trade
Annex Table 6Net Trade Balance with Japan: 2003 and 2002
FOB Value in US 1,000 Dollars
Major Product GroupingJan - Nov 2003 Jan - Dec 2002
Exports Imports Balance of Trade
Exports Imports

Type of Investment, by Year Total BOI PEZA SBMA CDC
2002
Approved Investments (AI) Value (P Million) 99,183.7 28,352.1 38,741.1 4,542.2 27,548.2 Percent 100.00% 28.6% 39.1% 4.6% 27.8% Projected Employment 110,429 30,130 36,536 2,868 40,895 Investment/Employment Ratio (P 1,000 / Worker) 898.167 940.992 1,060.35 1,583.75 673.63
Foreign Direct Investments (FDI) Value (P Million) 46,048.7 8,815.1 22,796.1 746.7 13,690.7 Percent 100.0% 19.1% 49.5% 1.6% 29.7%
Ratio of FDI to AI (in percent) 46.43% 31.09% 58.84% 16.44% 49.70%
Jan to Sept 2003
Approved Investments (AI) Value (P Million) 38,228.6 19,150.8 16,012.4 1,350.7 1,714.6 Percent 100.0% 50.1% 41.9% 3.5% 4.5% Projected Employment 53,938 18,356 30,149 2,206 3,227 Investment/Employment Ratio (P 1,000 / Worker) 708.751 1,043.299 531.109 612.285 531.329
Foreign Direct Investments (FDI) Value (P Million) 19924.4 5433.7 13780.7 336.4 373.7 Percent 100.0% 27.3% 69.2% 1.7% 1.9%
Difference (AI- FDI), in P Million
Ratio of FDI to AI (in percent) 52.12% 28.37% 86.06% 24.91% 21.80%
Source: BOI Website (National Statistical Coordination Board)
Approved Investments refer to the project cost or committed investments.
Approved Investments and Foreign Direct Investments, by Promotion Agency2002 and January to September 2003
BOI - Board of Investments, PEZA - Philippine Economic Authority, SBMA - Subic Bay Metropolitan Authority, CDC - Clark Development Corporation
Annex Table 7

Rank Value (P Million) Percent Rank Value (P Million) Percent
Top 10 Countries
Japan 1 17,053.80 37.03% 1 6,373.4 31.99%Taiwan 2 12,197.80 26.49% 7 540.1 2.71%USA 3 3,627.00 7.88% 2 5,494.3 27.58%Germany 4 2,554.90 5.55% 8 421.2 2.11%Switzerland 5 1,764.00 3.83%Korea 6 1,344.50 2.92% 6 524.4 2.63%Singapore 7 1,168.20 2.54% 9 279.7 1.40%PROC 8 892.80 1.94% 10 219.4 1.10%France 9 725.10 1.57%UK 10 617.90 1.34% 3 2,256.7 11.33%Netherlands 4 1,611.8 8.09%Australia 5 985.6 4.95%Sub-total 41,946.00 91.09% 18,706.6 93.89%Others 4,102.80 8.91% 1,217.8 6.11%
Total 46,048.70 100.00% 19,924.40 100.00%
Industry
Manufacturing 1 23,690.80 51.45% 1 11,707.2 58.76%Mining 2 11,589.40 25.17% 4 855.7 4.29%Services 3 5,113.80 11.11% 2 4,296.0 21.56%Transportation 4 2,054.20 4.46% 8 58.7 0.29%Communication 5 1,054.40 2.29% 7 97.3 0.49%Electricity 6 996.50 2.16% - Trade 7 675.50 1.47% 5 722.5 3.63%Finance & Real Estate 8 564.30 1.23% 10 10.6 0.05%Construction 9 125.40 0.27% - Agriculture 10 97.80 0.21% 9 24.3 0.12%Storage 71.70 0.16% 6 324.9 1.63%Water 15.00 0.03% - Gas 0.00 3 1,827.2 9.17%Total 46,048.70 100.00% 19,924.4 100.00%
Source: http://tradelinephil.dti.gov.ph
Annex Table 8Foreign Direct Investments, by Country and Industry
2002 and January - September 2003
Country/ Industry 2002 Jan - Sept 2003

Economic Zone Operating Firms Percent Types of Economic Zones
Public Economic Zones 436 46.38%Baguio City Economic Zone 12 1.28%Bataan Economic Zone 52 5.53%Cavite Economic Zone 268 28.51%Mactan Economic Zone 104 11.06%Private Economic Zones 444 47.23%Amkor Anam Economic Zone 1 0.11%Angeles Industrial Park 6 0.64%Calamba Premiere Industrial Park 11 1.17%Carmeltray Industrial Park I 22 2.34%Carmeltray Industrial Park II 31 3.30%Cebu Light Industry & Science Park 2 0.21%Cocochem Industrial Park 3 0.32%Daichi Industrial Park 4 0.43%EMI-Jolou Realty, Inc 1 0.11%First Cavite Industrial Park 65 6.91%First Philippine Industrial Park 14 1.49%Gateway Business Park 16 1.70%Greenfield Automotive Park 3 0.32%
Jasaan Misamis Oriental Special Economic Zone 1 0.11%
Laguna International Industrial Park 25 2.66%Laguna Technopark, Inc. 69 7.34%Leyte Industrial Development Estate 1 0.11%Light Industry & Science Park I 35 3.72%Light Industry & Science Park II 23 2.45%Lima Technology Center 11 1.17%Luisita Industrial Park 4 0.43%Macroasia Ecozone 1 0.11%Mactan Economic Zone II 43 4.57%Mitsumi Realty Inc., SEZ 1 0.11%New Cebu Township 2 0.21%People's Technology Complex 15 1.60%Plastic Processing Center 2 0.21%Sarangani Economic Development Zone 1 0.11%Subic Shipyard Special Economic Zone 2 0.21%Tabangao Special Economic Zone 1 0.11%TECO-Special Economic Zone (SEZ) 1 0.11%Toyota Sta. Rosa Industrial Complex 3 0.32%Victoria Wave 15 1.60%West Cebu Industrial Park 5 0.53%Yakazi Torres Mfg. Inc Realty SEZ 4 0.43%IT Park & Buildings 60 6.38%Asia Town Information Technology (IT) Park 2 0.21%E-Squire IT Park 10 1.06%Eastwood City Cyberpark 16 1.70%Eugenio Lopez Jr. Communication Center 1 0.11%GT Tower 1 0.11%Northgate Cyberzone 6 0.64%Pacific IT Center 5 0.53%PBCom Tower 3 0.32%Philamlife IT Building 1 0.11% Investments, Commercial, Banking & Financial CentersRCBC Plaza 10 1.06%Summit One Office Tower 4 0.43%Total 940 100.00%Source: PEZA Website
Agro-Industrial Economic Zone - refers to a large and suitable tract of land subdivided and developed in accordance with a comprehensive plan, with provisions for basic infrastructures which are export-oriented. Accordingly, the industry mix of an agro-industrial ecozone should be influenced mainly by the agricultural and natural resources abundant in their surrounding areas.
Information Technology (IT) Park - refers to an area developed or which has the potential to be developed into a complex capable of providing the necessary infrastructure support facilities and amenities to the IT industry in order to promote the development and export of IT software products and other IT related services.
Free Trade Zone - refers to an isolated political area adjacent to a port of entry (such as a seaport) and /or airport where imported goods may be unloaded for immediate transhipment or stored, repacked, sorted, mixed or otherwise manipulated. However, movement of these imported goods from the free-trade area to a non-free trade area in the country shall be subject to customs and internal revenue rules and regulations.
Tourist/Recreational Center - refers to an area within the ECOZONE where tourist accommodation facilities such as hotels, apartelles, tourist inns, pension houses, resorts, sports and/or recreational facilities are provided to render tourism services for both local and foreign tourists, travellers and investors in accordance with the guidelines issued by the PEZA.
Annex Table 9Distibution of PEZA Firms, by Zone: September 2003
Industrial Estate (IE) - refers to tract of land subdivided and
developed according to a comprehensive plan under a unified
continuous management and with provisions for basic infrastructure
and utilities, with or without pre-built standard factory buildings and
community facilities for the use of a community of industries.
Ezport Processing Zone (EPZ) - refers to a specialized industrial
estate located physically and/or administratively outside the customs
territory and predominantly oriented to export production. Enterprises
located in EPZs are allowed to import capital equipment and raw
materials free from duties, taxes and other import restrictions.

Nationality Percent Product Percent Japanese 41% Electronic Parts & Products 58.00%Filipino 17% Electrical Machinery 12.80%American 13% Transport/Car Parts 7.50%Dutch 8% Chemical & Chemical Products 3.60%British 6% Rubber & Plastic Products 2.40%Singaporean 5% Medical & Precision Instruments 2.30%Korean 4% Garments & Textiles 1.50%German 2% IT Services 1.00%Taiwanese 1% Other Manufactures 10.90%Malaysian 1%Others 2%
Total 100% Total 100%
Annex Table 10PEZA Locator Investments, by Nationality and Products: 1995 - 2002
(in percent)
Source: Philippine Economic Zone Authority (PEZA) Website

Value (P Billion)
Change (P Billion)
Growth Rate (in Percent) Number Change Growth Rate
(in Percent)Value ($
Billion)Growth Rate (in Percent)
Investment / Employment
(in Pesos)
Investment / Exports (P/$)
Exports / Employment (in
Dollars)
1994 9.6 229,650 2.7390 41,803 3.50 11,927 1995 52.5 42.9 446.88% 304,557 74,907 32.62% 4.2840 56.41% 172,382 12.25 14,066 1996 65.3 12.8 24.38% 380,625 76,068 24.98% 6.5000 51.73% 171,560 10.05 17,077 1997 159.7 94.4 144.56% 562,085 181,460 47.67% 10.6290 63.52% 284,121 15.02 18,910 1998 96.9 -62.8 -39.32% 609,044 46,959 8.35% 13.2700 24.85% 159,102 7.30 21,788 1999 155.7 58.8 60.68% 617,690 8,646 1.42% 15.8070 19.12% 252,068 9.85 25,591 2000 156.7 1.0 0.64% 696,035 78,345 12.68% 20.0250 26.68% 225,132 7.83 28,770 2001 80.8 -75.9 -48.44% 708,657 12,622 1.81% 19.4980 -2.63% 114,018 4.14 27,514 2002 38.7 -42.1 -52.10% 820,960 112,303 15.85% 22.7230 16.54% 47,140 1.70 27,679 2003 907,129.00 86,169 10.50% 27.3130 20.20% 30,109
Total 815.9 142.7880Average 90.7 3.6 583,643 75,275 17.32% 14.2788 30.71% 163,036 7.96 22,343
Year
Annex Table 11Selected Economic Variables of PEZA Firms, 1994 - 2003
Source: PEZA Website
RatioManufactured Exports EmploymentInvestments

Page 1 of Annex Table 12
No. % No. % No. % No. % No. % No. % No. % No. % No. %Mining and Quarrying 1 0.11% 1 0.17%
Non-Metallic Mining and Quarrying 1 0.11% 1 0.17%Manufacturing 828 91.29% 17 25.00% 11 84.62% 65 98.48% 583 97.65% 149 93.13% 1 100% 1 100% 1 100%
Food Products and Beverages 9 0.99% 1 1.47% 1 1.52% 4 0.67% 2 1.25% 1 100%Tobacco Products 1 0.11% 1 1.52%Textiles 59 6.50% 2 15.38% 14 21.21% 40 6.70% 3 1.88%Wearing Apparel 95 10.47% 2 2.94% 17 25.76% 51 8.54% 25 15.63%Tanning and Dressing of Leather; Luggage, Handbags and Footwear 11 1.21% 1 7.69% 5 7.58% 2 0.34% 3 1.88%
Wood, Wood Products and Cork, Except Furniture 8 0.88% 3 4.41% 1 7.69% 1 1.52% 2 0.34% 1 0.63%
Paper and Paper Products 19 2.09% 1 1.47% 1 7.69% 1 1.52% 14 2.35% 2 1.25%Publishing, Printing and Reproduction of Recorded Media 9 0.99% 1 1.47% 7 1.17% 1 0.63%
Coke, Refined Petroleum and other Fuel Products 1 0.11% 1 0.17%
Chemicals and Chemical Products 24 2.65% 1 7.69% 6 9.09% 13 2.18% 3 1.88% 1 100%Rubber and Plastic Products 60 6.62% 2 15.38% 4 6.06% 44 7.37% 10 6.25%Other Non-Metallic Mineral Products 12 1.32% 1 1.47% 1 1.52% 5 0.84% 5 3.13%Basic Metals 36 3.97% 2 2.94% 1 1.52% 24 4.02% 8 5.00% 1 100%Fabricated Metal Products, Except Machinery and Equipment 47 5.18% 1 1.47% 1 1.52% 38 6.37% 7 4.38%
Machinery and Equipment, N.E.C. 56 6.17% 51 8.54% 5 3.13%Office, Accounting and Computing Machinery 61 6.73% 1 1.52% 55 9.21% 5 3.13%
Electrical Machinery and Apparatus, N.E.C. 56 6.17% 1 1.47% 2 15.38% 3 4.55% 45 7.54% 5 3.13%
Radio, Television and Communication Equipment and Apparatus 119 13.12% 1 1.47% 1 7.69% 2 3.03% 105 17.59% 10 6.25%
Medical, Precision and Optical Instruments, Watches and Clocks 34 3.75% 1 1.52% 14 2.35% 19 11.88%
Motor Vehicles, Trailers and Semi-Trailers 61 6.73% 2 3.03% 51 8.54% 8 5.00%
Other Transport Equipment 9 0.99% 1 1.47% 1 1.52% 7 4.38%
Eastern Visayas
Northern Mindanao
Central Mindanao
Annex Table 12Distribution of PEZA Firms, by Region and Industry: 2003
PSIC All PEZA FirmsRegion
NCR CAR Central Luzon
Southern Tagalog &
Central Visayas

Page 2 of Annex Table 12
No. % No. % No. % No. % No. % No. % No. % No. % No. %
Eastern Visayas
Northern Mindanao
Central MindanaoPSIC All PEZA Firms
Region
NCR CAR Central Luzon
Southern Tagalog &
Central Visayas
Manufacture and Repair of Furniture 9 0.99% 2 0.34% 7 4.38%Recycling 7 0.77% 1 1.47% 4 0.67% 2 1.25%Manufacture, N.E.C. 25 2.76% 1 1.47% 2 3.03% 11 1.84% 11 6.88%
Construction 1 0.11% 1 1.47%Wholesale and Retail Trade; Repair of Motor Vehicles, Personal and Household Goods
2 0.22% 1 1.52% 1 0.17%
Sale, Maintenance and Repair of Motor Vehicles 2 0.22% 1 1.52% 1 0.17%
Hotels and Restaurants 1 0.11% 1 0.63%Transport, Storage and Communications 16 1.76% 16 23.53%
Postal and Telecommunications Services 16 1.76% 16 23.53%
Real Estate, Renting and Business Activities 56 6.17% 33 48.53% 2 15.38% 11 1.84% 10 6.25%
Computer and Related Activities 43 4.74% 29 42.65% 2 15.38% 4 0.67% 8 5.00%Research and Development 2 0.22% 1 0.17% 1 0.63%Miscellaneous Business Activities 11 1.21% 4 5.88% 6 1.01% 1 0.63%
Other Community, Social and Personal Service Activities 2 0.22% 1 1.47% 1 0.17%
Recreational, Cultural and Sporting Activities 1 0.11% 1 1.47%
Other Service Activities 1 0.11% 1 0.17%Total 907 100.00% 68 7.50% 13 1.43% 66 7.28% 597 65.82% 160 17.64% 1 0.11% 1 0.11% 1 0.11%Source: PEZA Website, 2003

Page 1 of Annex Table 13
Company Product/Activity Equity Participation
Mactan Economic Zone 1 Aso Seiyaku Phils., Inc. Health-care products spec. first-aid adhesive bandages 99.99%
2 Auto Liv Izumi Phils., Inc.
Autoparts, steering wheels, plastic parts & leather wrapping for steering wheels ; to include the manufacture of cellular phone, its components and parts; Manufacture of wooden steering wheels
100%
3 Cebu Dai-ichi, Corp. Molding dies & industrial plastic parts for use of electronic & automotive industries 100%
4 Cebu Daiki Corporation
Ladies' and men's ready-to-wear garments such as suits, jackets, skirts, pants, sportswear, polos and blouses as well as accessories such as shoulder paddings, collars, interlinings cloths, buttons, zippers, laces and tapes
99.99%
5 Cebu Iwakami Corp.
Manufacture of various precision injection-molded rubber/resin parts and components of optical machineries, electrical appliances and contrivances, automobile parts, food processing and sports industries, among others. ; sub-assembly of camera parts
99.97%
6 Cebu Jewelpico Corporation Clasps for necklaces 100%
7 Cebu Logitem Inc. Manufacture, produce, assemble and process corrugated cartons, boards, boxes, cardboard boxes, styrofoam containers
99%
8 Cebu Microelectronics, Corp.
Visual inspection and screening test of capacitors and assembly of super precision Electric Discharging Mechatronics (EDM) tools, microwave amplifiers, microwave chip devices, pick-up needles for chip devices, electronic circuit boards, laser connector optical devices primarily used for microwave communications system and made-to-order electronic parts
99.92%
9 Cebu Nagata Corporation Manufacture of communication components parts and assembly of communication parts; die casting of aluminum ingot alloy
100%
10 Cebu Nisico Corp. Super high optical elements of lenses 99.99%11 Cebu Shensei Corporation Laminated cores for magnetic tape head 100%
12 Cebuano Materials Inc. Pallets made of wood and pallets made of plastic or metal and other products of similar nature and character 100%
13 Cebuano Mfg. Gloves Corp. Industrial & disposable gloves 100%
14 Cozo Filters Phils. Corp. Manufacture and processing of finished optical glass filters with or without mount and other optical components 100%
15 Daitoh Precisions, Inc. Various types of small, plastic parts for various electronic assemblies like floppy disk drives and audio heads 99%
16 Drecome, Inc. Plating of various metal products 60%
Annex Table 13List of Japanese Firms in Cebu Economic Zones: 2002

Page 2 of Annex Table 13
Company Product/Activity Equity Participation
17 Exas Phils., Inc.
Pressed steel parts of floppy disk drives of personal computers, chemistry assays, enzymeimmuno assays, hormone assays, infectious diseases assays, immunoflourescent assays and over the counter assays. Manufacture of die set
100%
18 Far East Wire Harness Corporation Wire harness and paging systems, body massage and shower with suction type cleaner and letter opener 99.70%
19 Fas Cebu Corporation Car covers, seat covers, working clothes/gowns, floor carpets/mats and other automotive and car accessories 91%
20 Goji Industry Corporation Manufacture of flash units, flash components, CD-ROM mechanism, and other photographic and optical equipment .Manufacture of magnetic audio head
100%
21 Halsangz Plating Cebu Corp.
Electroplating or painting of electronic parts, building decorations, fashion accessories, jewelries, interior decorations and light engineering with zinc, gold, nickel, aluminum and chromium
99.95%
22 Imcon World Corp.
Patrol lights for machineries and equipment and red beam controllers for body health or massage devices ; manufacture of contact assembly for machine power switches; plating or surface treatment of metal and non-metal products
90%
23 Ingram Systems Phils. Corp. Designing, development, creation and production of software programs / applications 99.99%
24 Intec Cebu Inc. Manufacture/assembly of mechanical system & printed circuit board (PCB) for cassette tape recorder, CD and CD-ROM players
100%
25 International Jewelry Mfg., Inc. Manufacture of jewelries and jewelry parts 99.73%26 KH Cebu Corp. RTW ladies dresses 88%27 KKS A & I International, Inc. Architectural and interior computer assisted design 99.99%
28 KT Sakurai Corp.(formerly Philippine Sakurai Plastic Corp.)
Industrial plastic component parts of prismatic binoculars ; increase in capacity of production of plastic component parts for prismatic binoculars ; manufacture of industrial molding dies
100.00%
29 Kanepackage Phils., Inc. Manufacture of shock-absorbing packaging system 100%
30 Karikawa Cebu Corp. Ready-to-wear ladies dresses such as suits, jackets, skirts, pants, blouses, one-piece dresses and camisole 100%
31 Kubo Optical Phils. Corp. Primitive binoculars 99%32 Lookwell Philippines, Inc. Shell buttons and other fashion accessories 100%
33 M Plating Corp. Engage in Plating/surface treatment up metal & non-metal products 98%
34 Mactan Parts Technology, Inc.
Stamping metal parts of cassette deck mechanism and other audio- visual parts ; precision plastic molding for the manufacture of plastic (Poly Oxy Metylene) frame and tray for compact disc re-writable (CDRW)
100%
35 Mactan Steel Center Inc. (formerly JS Steel Cebu Corp.) Metal sheets coils into sheared and slitted metal sheets 100%
36 Mactan Showa Electric Wire Inc. Production of stud wires for semiconductors 100%
37 Mobilia Products Corp. Exclusively designed interior furniture such as tables, chairs, sofas 100%

Page 3 of Annex Table 13
Company Product/Activity Equity Participation
38 Muramoto Audio-Visual Phils.,Inc.
Car stereos, video tape loading mechanism & floppy disk drives for computers and to increase the production capacity of floppy disc drives (FDD) mechanism for computers, compact disk-read-only memory (CD-ROM) mechanism with changer for computers
100%
39 NEC Technologies Phils. Inc. Transmission and telecommunication equipment & system specifically types of coil & transformers, panels and data communication equipment
99.99%
40 Nihon Fuji Multi-Products Corp. Plastic laundry hangers 45%
41 Pentax Cebu Phils. Corp. (formerly Asahi Optical (Phils.) Corp.)
Various camera models, plastic camera components, optical devices, camera production; assembly of cartridge 100%
42 Philippine Lino Corporation Motorcycle engine knockpins 100%43 Philippine Kenko Corp. Lenses and piano 100%
44 Philippine Makoto Corp.
Aluminum (diecasting) body and other mechanical component parts of prismatic binoculars and magnetic eraser heads ; manufacture of filter rings & step rings for cameras ; Production of microscope for industrial, semiconductor, Bio and Medical use. ; Manufacture of automotive parts
99.92%
45 Philippine Tonan Corp.
Kitchen apparatus and equipment, office furnitures and fixtures, warehouse/factory fixtures and household fixtures made of metal sheets, other plastic and metal based products such as laundry and clothers hanger, terminal connector and airconditioning parts, dehumifying box (Toyo living Auto Dry); galvanized iron
100%
46 Phil-Japan Metals and Refined Products Co., Inc.
Recovery of precious metals such as silver as main product; By products: palladium, platinum & gold 99.96%
47 Precision Springs Cebu Inc. Various metal springs 99.99% Japanese;
48 Shemberg Food Ingredients Corp. Blended carageenan seaweed extract 2%
49 Souhatsu Cebu Mfg.,Inc.
Various metal rods & springs, processing of pipes, control cables, wire works and wire harness processing in addition to processing/ shaping of various iron rods and parts for car airconditioners
99.94%
50 St. Jane International Inc. Manufacture of cosmetics bags, ladies' tote bags, basket, craft box, accessories fabric covered box, bed and bath items, kitchen set, linen and home decorations
100%
51 Sun-Pleats Cebu Corp. Ready-to-wear ladies dresses such as suits, jackets, skirts, pants, blouses, one-piece dresses and camisole 100%
52 Swallow Glove Cebu Corporation(formerly Cebu Swallow Eishin Corp.) Industrial gloves 100%

Page 4 of Annex Table 13
Company Product/Activity Equity Participation
53 Taiyo Yuden (Phils.), Inc.
Electronic components, such as inductors and compound filters, processing of semi-axial ceramic capacitors & axial lead conductors, electromagnetic interference suppression filters ; assembly and sale of electronic machinery and equipment used for electronic parts assembly, i.e. multi-layer pressing machines ; taping of multi-layer ceramic chip capacitors which are used in cordless telephones, CD-ROM and Digital Video Disc (DVD); ferrite chip (FC) bead inductor
99.96%
54 TOA Kiko Cebu Corp. Electronic lighting fixtures 99.92%
55 Tokiwa Optical Phils. Corp.
Various component parts for optical and photographic products such as plastic optical lenses, objective lens cylinder, eyepiece lens cylinder and focusing lever ; manufacture of sensory elements for handheld bar code laser scanner, laser beam pointer and desktop scanner
99%
56 Tokyo Dress Cebu Corporation Ladies' dresses such as suits, jackets, shirts, pants, and blouses 100%
57 Tokyo Steel Phils. Corp. Manufacture of stainless steel shafts and screws for computer and audio and video equipment 100%
58 Toritsu Ind. Cebu Inc. Manufacture, produce, assemble and process plastic magnets, super engineering plastic parts for computers, optical instruments, medical instruments.
99.00%
59 Toyo Flex Cebu Corp. Manufacture/processing of wire rope or steel cable attachments 100%
60 Trigger Co., Phils. Carbide-typed circular saws, tungsten carbide tipped circular saws 100%
61 Yamashin Cebu Filter Mfg. Corp. Hydraulic filters; manufacture of process filters, filter case assembly and metal worked parts 100%
Mactan Economic Zone II
62 Blaze Manufacturing Inc. (formerly Yamaso Philippines Corp.)
Manufacture of blocks made of mortar wth ducts inserted in it 100%
63 Cebu Mold Tech., Inc. Manufacture of mold/ die and parts 99.99%
64 Cebu Sarah, Inc. Manufacture of network-control-unit and transformer coils for transmission equipment 100%
65 Cebu Toa Kakou Corp. Manufacture of flexible, plastic polymer tubings 99.98%66 Cebu Toyo Corporation Element lenses and assembled lenses 100%
67 Chase Dental Corp. (formerly Cebu Yamaichi Corporation)
Paraffin wax, impression materials, resin teeth & acrylic resin materials for making dentures 100%
68 Hideka Manufacturing Corp. Importation of used clothing for recycling partly in wiping rags and partly for shredding into wood, polyester and cotton fibers
100%
69 Ina Micro Opto Corporation Manufacture of high powered microscopes 100%70 KGS Phils. Corporation Braille cells 99.93%71 KY Polymer Corp. Manufacture of artificial marble 99.97%
72 Kinken Cebu Corp. Engage in plating or surface treatment of metal or non-metal products 99.99%

Page 5 of Annex Table 13
Company Product/Activity Equity Participation
73 Koshin Philippines Corp.
Manufacture and coatings processing of various thin-film optical filters and modular fiber-optic devices for electronic, medical, optical photographic, communications and general industrial applications
100.00%
74 Makoto Metal Technology, Inc.
Manufacture of aluminum and zinc alloy diecasting products for component parts of microscope, binocular, automotive, lighting fixture, optical devices and other similar goods
100%
75 Matluster Corporation Manufacture of wrist watch cover glass and high precision glass element for optical and electronic applications 99.99%
76 Merasenko Corporation
Manufacture of medical disposable devices such as blood tubing circuit for dialysis, surgical knife sharpener, F-type aseathiung circuit, infusion line, and tracheotomy tube in semi-finished form
100%
77 NKC Conveyors Philippines Corp. Manufacture of rubber seals and sash rollers and other bearing-related products 100%
78 NKC Manufacturing Philippines Corp. Manufacture of rubber seals and sash rollers and other bearing-related products 100%
79 Olympus Optical Products Phils., Inc
Manufacture and assembly of precision medical equipment and apparatus and its component parts, and the design and development of software for the manufacture of, usage/operation of after sales support of precision equipment and apparatus
100.00%
80 Philippine Iino Corp. Manufacture of motorcycle parts 100%
81 Sarah Digital Network, Inc. Manufacture, assembly of PC boards for computers and testing equipment 99.98%
82 T&H Furnishing Industries Inc. Ship furnitures and fixtures 100%
83 Tamiya Phils. Manufacture of precise plastic vehicle models such as plastic, stationary, four-wheel vehicle, solar poweered and helicopter models among others
99.99%
84 Ube Electronics (Phils.) Inc. Microwave delectric ceramic filters and duplexes 99.99%85 Yamashin Cebu Filter Mfg. Hydraulic filter elements 100%
86 NEC Telecom Software Philippines, Inc Operation and management software for telecommunication equipment and transmission systems and system engineering 100%
87 Tsuneishi Technical Services (Philippines), Inc.
Engage in ship design, Computer Aided Ship Design (CASD), Computer Aided Engineering Design (CAED) and Electronic Data Archival (EDA)
100%
Cebu Light Industry and Science Park 88 Enomoto Molds and dies 100%
Mitzumi Reality Inc.
89 Cebu Mitsumi Inc.
Manufacture of variouselectronic products such as : Magnetic tape head (MTH), floppy disk drive (FDD), connector (CON), flexible printed circuit (FPC), CD-ROM Drive (CD-ROM), etc.
100%
Asian Town Information Technology Park

Page 6 of Annex Table 13
Company Product/Activity Equity Participation
New Cebu Township90 KSS Philippines, Inc. Manufacture of SMD Quartz crystals 100%
West Cebu Industrial Park 91 Asian Craft (Cebu), Inc Fabrication of metal products. 100%
92 Cebu Asiatic Shipping & Port Services, Inc.
To provide transhipment of THIS's raw materials from ports to its facilities at WCIP-SEZ, shot-blasting operations of the steel plates, tubes and pipes for new vessels, paining and other finishing activities of the new vessels.
40%
93 K & A Metal Industries, Inc.Fabrication/manufacture of hull blocks, steel beams for export and shot-blasting of steel plates for companies inside WCIP
60%
94 T&H Furnishings Inc. Wooden furnitures for ships 100%95 Tsuneishi Heavy Industries (Cebu) Inc Ship building of bulk carriers and ship repair 80%
96 Tsunetetsu (Cebu), Inc.
To engage in outfitting works for the engine room of the ships built or repaired by the THI, machining of steel, shaped steel, pipe and iron materials and subsequently, undertake outfitting of different kinds of plants.
70%
Source: PEZA Website

Page 1 of Annex Table 14
CEZ Firms Japanese Percent CEZ Firms Japanese Percent CEZ Firms Japanese Percent CEZ Firms Japanese Percent CEZ Firms Japanese Percent
28999 Manufacture of miscellaneous fabricated metal products, n.e.c. 16,479,644 1,326,262 8.05% 8 6 75.00% 2309249 166,435 7.21% 6,951,674 1,241,098 17.85% 4,483,432 196,798 4.39%
32200Manufacture of semi-conductor devices and other electronic components
12,748,367 6,352,534 49.83% 6 2 33.33% 1862592 886,721 47.61% 11,692,881 5,345,101 45.71% 9,186,423 4,287,191 46.67%
32100 Manufacture of electronic valves and tubes 11,732,688 11,732,688 100.00% 1 1 100.00% 31,168 31,168 100.00% 2,076,587 2,076,587 100.00% 483,393 483,393 100.00%
63200 Supporting and auxiliary activities to water transport 5,953,471 5,953,471 100.00% 1 1 100.00% 746,845 746,845 100.00% 5,750,367 5,750,367 100.00% 1,796,863 1,796,863 100.00%
32400Manufacture of television and radio receivers, sound or video recording or reproducing apparatus, and associated goods
3,463,064 3,463,064 100.00% 1 1 100.00% 204,135 204,135 100.00% 1,532,884 1,532,884 100.00% 1,027,965 1,027,965 100.00%
33309 Manufacture of other watch and clock parts, n.e.c. 2,646,596 1,473,577 55.68% 3 1 33.33% 178865 155,439 86.90% 1,786,716 1,204,606 67.42% 432,970 182,448 42.14%
30002Manufacture of electronic data processing equipment and accessories
1,985,999 1,985,999 100.00% 1 1 100.00% 867,611 867,611 100.00% 3,713,980 3,713,980 100.00% 3,049,969 3,049,969 100.00%
31300 Manufacture of insulated wire and cables 1,735,593 0 0.00% 1 0 0.00% 386,098 0 0.00% 1,462,180 0 0.00% 1,178,576 0 0.00%
29199 Manufacture of other general purpose machinery, n.e.c. 1,423,790 1,423,790 100.00% 2 2 100.00% -63590 -63,590 100.00% 1,156,956 1,156,956 100.00% 90,560 90,560 100.00%
20130 Manufacture of builders' carpentry and joinery; millworking 1,372,561 0 0.00% 1 0 0.00% 43,338 0 0.00% 614,459 0 0.00% 316,368 0 0.00%
21020 Manufacture of containers and boxes of paper and paperboard 1,250,802 1,250,802 100.00% 2 2 100.00% 65394 65,394 100.00% 509,215 509,215 100.00% 138,442 138,442 100.00%
18990 Manufacture of other wearing apparel, n.e.c. 889,558 104,858 11.79% 4 1 25.00% 17038 978 5.74% 307,721 68,815 22.36% 93,864 23,069 24.58%
33202 Manufacture of photographic equipment and accessories 767,515 767,515 100.00% 3 3 100.00% 9127 9,127 100.00% 540,568 540,568 100.00% 345,671 345,671 100.00%
27220 Non-ferrous smelting and refining, except precious metals 728,361 728,361 100.00% 1 1 100.00% 86,494 86,494 100.00% 278,536 278,536 100.00% 200,908 200,908 100.00%
52609 Repair of personal and household goods, n.e.c. 706,591 0 0.00% 1 0 0.00% 60,752 0 0.00% 3,042,839 0 0.00% 2,925,148 0 0.00%
33201 Manufacture of optical instruments and lenses 567,598 567,598 100.00% 3 3 100.00% 22,992 22,992 100.00% 361,289 361,289 100.00% 143,184 143,184 100.00%
25209 Manufacture of plastic products, n.e.c. 548,075 548,075 100.00% 1 1 100.00% 24,436 24,436 100.00% 681,604 681,604 100.00% 621,041 621,041 100.00%
25205 Manufacture of other plastic industrial supplies 534,176 534,176 100.00% 2 2 100.00% 71,281 71,281 100.00% 478,310 478,310 100.00% 383,535 383,535 100.00%
74219Architectural, engineering and other technical activities related to Architectural and Engineering
521,158 0 0.00% 1 0 0.00% 93,753 0 0.00% 107,075 0 0.00% 86,840 0 0.00%
27110 Operation of blast furnaces and steel making furnaces 503,173 0 0.00% 1 0 0.00% -17,433 0 0.00% 375,642 0 0.00% -181,537 0 0.00%
31102 Manufacture of electrical transformers 446,435 446,435 100.00% 1 1 100.00% -672 -672 100.00% 590,427 590,427 100.00% 517,369 517,369 100.00%
23200 Manufacture of refined petroleum products 393,621 393,621 100.00% 1 1 100.00% 29,165 29,165 100.00% 276,231 276,231 100.00% 123,886 123,886 100.00%
18120 Women's and girl's and babies' garment manufacturing 299,373 104,875 35.03% 2 1 50.00% -7161 -17,490 244.24% 256,423 38,606 15.06% 23,055 -11,571 -50.19%
6910 Gathering of laver and other edible seaweeds 286,405 0 0.00% 1 0 0.00% 24,188 0 0.00% 287,932 0 0.00% 200,612 0 0.00%
39100 Manufacture of jewelry and related articles 258,043 258,043 100.00% 1 1 100.00% 5,190 5,190 100.00% 82,253 82,253 100.00% 35,452 35,452 100.00%
39190 Manufacture of jewelry and related articles, n.e.c. 233,214 233,214 100.00% 2 2 100.00% 9802 9,802 100.00% 14,140 14,140 100.00% 11,652 11,652 100.00%
Annex Table 14Selected Financial Institution of Top 7000 Corporation in Cebu Economic Zones: 2002
Industry Code Product
Gross Revenues (in P'000) No. of Firms Profit (in P'000) Assets Equity

Page 2 of Annex Table 14
CEZ Firms Japanese Percent CEZ Firms Japanese Percent CEZ Firms Japanese Percent CEZ Firms Japanese Percent CEZ Firms Japanese Percent
Industry Code Product
Gross Revenues (in P'000) No. of Firms Profit (in P'000) Assets Equity
63191 Freight terminal facilities for trucking companies 200,481 0 0.00% 1 0 0.00% 4,192 0 0.00% 108,362 0 0.00% 25,472 0 0.00%
28990 Manufacture of other fabricated metal products, n.e.c. 197,299 197,299 100.00% 2 2 100.00% 32551 32,551 100.00% 168,564 168,564 100.00% 73,061 73,061 100.00%
34300Manufacture of parts and accessories for motor vehicles and their engines
165,195 165,195 100.00% 2 2 100.00% -797 -797 100.00% 144,224 144,224 100.00% 130,440 130,440 100.00%
28120 Manufacture of tanks, reservoirs and containers of metal 158,379 158,379 100.00% 1 1 100.00% 6,449 6,449 100.00% 101,244 101,244 100.00% 67,208 67,208 100.00%
32300Manufacture of television and radio transmitters and apparatus for line telephony and line telegraphy
156,568 59,017 37.69% 2 1 50.00% 7,195 6,360 88.39% 88,444 15,753 17.81% 10,623 13,026 122.62%
73120Research and experimental development in engineering and technology
149,004 0 0.00% 1 0 0.00% 3,765 0 0.00% 157,787 0 0.00% 117,431 0 0.00%
18900 Manufacture of wearing apparel, n.e.c. 133,392 0 0.00% 1 0 0.00% 367 0 0.00% 42,925 0 0.00% 3,174 0 0.00%
85129 Private medical, dental and other health services, n.e.c. 130,556 0 0.00% 1 0 0.00% 303 0 0.00% 209,833 0 0.00% 138,921 0 0.00%
25206 Manufacture of primary plastic products 123,416 0.00% 1 0 0.00% -4,525 0 0.00% 131,422 0 0.00% 36,157 0 0.00%
52334 Radio and television, including parts and accessories, retailing 122,517 0 0.00% 1 0 0.00% -1,647 0 0.00% 129,561 0 0.00% 13,465 0 0.00%
36010 Manufacture and repair of wood furniture 113,723 113,723 100.00% 1 1 100.00% 501 501 100.00% 106,338 106,338 100.00% 54,551 54,551 100.00%
51909 Other wholesaling, n.e.c. 97,936 97,936 100.00% 1 1 100.00% 8,401 8,401 100.00% 66,592 66,592 100.00% 56,187 56,187 100.00%62200 Non-scheduled air transport 93,916 0 0.00% 1 0 0.00% -6,519 0 0.00% 37,381 0 0.00% -1,301 0 0.00%
39991 Manufacture of buttons, except of plastic 93,659 93,659 100.00% 1 1 100.00% 2,353 2,353 100.00% 161,902 161,902 100.00% 17,180 17,180 100.00%
15142 Canning/packing and preserving of vegetables and vegetable juices 90,274 0 0.00% 1 0 0.00% -3,165 0 0.00% 44,911 0 0.00% -15,109 0 0.00%
28996 Manufacture of fabricated wire products 89,096 89,096 100.00% 1 1 100.00% 11896 11,896 100.00% 114,191 114,191 100.00% 105,204 105,204 100.00%
51504Professional and scientific and measuring and controlling equipment, wholesaling
85,085 85,085 100.00% 1 1 100.00% -3,217 -3,217 100.00% 42,100 42,100 100.00% 30,145 30,145 100.00%
18100 Ready-made garments manufacturing 84,277 0 0.00% 1 0 0.00% 9,907 0 0.00% 27,359 0 0.00% 11,295 0 0.00%
20121 Manufacture of veneer sheets and plywoods 81,562 0 0.00% 1 0 0.00% 8,504 0 0.00% 82,049 0 0.00% 52,118 0 0.00%
72900 Other computer related activities 78,546 78,546 100.00% 1 1 100.00% 14,345 14,345 100.00% 34,320 34,320 100.00% 31,945 31,945 100.00%
24241Manufacture of drugs and medicines including biological products such as bacterial and virus vaccines, sera and plasma
66,119 66,119 100.00% 1 1 100.00% 25,443 25,443 100.00% 96,665 96,665 100.00% 94,619 94,619 100.00%
24252Manufacture of cleaning preparations, except soap and detergents
63,145 0 0.00% 1 0 0.00% -10,036 0 0.00% 22,893 0 0.00% 7,074 0 0.00%
18200 Custom tailoring and dressmaking 62,243 0 0.00% 1 0 0.00% -8,941 0 0.00% 19,779 0 0.00% 1,316 0 0.00%
55292 Catering and take-out activities (carried on sep. units) 50,989 0 0.00% 1 0 0.00% 10,621 0 0.00% 60,324 0 0.00% 45,599 0 0.00%
39390 Manufacture of sporting and athletic goods, n.e.c. 39,837 0 0.00% 1 0 0.00% 1,551 0 0.00% 63,447 0 0.00% 53,627 0 0.00%
26103 Manufacture of glass fibers and yarn of glass fibers 39,398 39,398 100.00% 1 1 100.00% 11,517 11,517 100.00% 36,901 36,901 100.00% 10,264 10,264 100.00%
TOTAL 71,242,483 40,892,410 57.40% 81 48 59.26% 7,181,671 3,417,263 47.58% 47,228,407 27,030,367 57.23% 28,886,307 14,331,655 49.61%Source: Top 700 Corporations 2002 - 2003

Page 1 of Annex Table 15
No. of TraineesAssociation for Overseas Technical Scholarship, 1959 - 2000
1 Nec Technologies Philippines, Inc. 1592 Nec Telecom Software Philippines, Inc. 523 Asian Arts, Inc. 104 Cebu Jewelpico Corporation 105 Apti-Philippines, Incorporated 96 Philippine Iron Construction And Marine Works Inc. 97 Tsuneishi Shipbuilding Cebu Inc. 98 Tamiya Philippines, Inc. 89 Kmp Engineering, Inc. 7
10 Center For Industrial Technology And Enterprise 611 Philippine Forklift Center, Inc. 612 Cebu Chamber Of Commerce And Industry, Inc 313 Tino's Sales Service Center 314 Tsukiden Software Philippines Inc. 315 Tsuneishi Heavy Industries Cebu Inc. 316 Vicente Sotto Mem. Medical Center 317 Department Of Trade And Industry 218 Electro Alloys Corp. 219 Epson Precision (Philippines), Inc. 220 Honda Philippines, Inc. 221 International Elevator & Equipment, Inc. 222 Monark Equipment Corporation 223 National Power Corp.(Retired) 224 Pacmac, Incorporated 225 Pks Shipping Co., Inc. 226 Sandoval Shipyards Inc. 227 Treasure Island Industrial Corp. 228 University of San Carlos 229 Abowar Corporation 130 Advanced Packaging Technology Group Fairchild Semiconductor 131 Alamag Processing Corporation 132 Almont Hotels, Inc 133 Atlas Consolidated Mining & Dev't Corp. 134 Balili Marine Yacht Club Resort Inc. 135 C & M Metalcraft 136 Carlos Antonio Disenos Inc. 137 Cebu Institute of Medicine 138 Cebu Legacy Marketing Corporation 139 Cebu Shipyard & Eng'g Worls Inc. 140 Cebu Southern Motors Inc. 141 Cebu Velez General Hospital 142 Center For Quality And Productivity 143 Cite Technical Institute Inc. 144 Coral Bay Nickel Corporation 145 Crafters Of Cebu, Inc. 146 Dalisay Sweets 147 Department Of Environment And Natural Resources 148 Digital Network Communications & Computer Inc. 149 Dotanah Engineering 150 Emilia &Sons Inc. 1
Distribution of AOTS, PHILAJAMES and APO : 2003
Company/Project Title
Annex Table 15

Page 2 of Annex Table 15
No. of TraineesCompany/Project Title51 Empress Auto Supply 152 Fashion Accessories Manufactures & Exporters 153 Fermell Fishing Corporation 154 Fine Interiors Trading Corp. 155 Foundation For Resouce Linkage & Development, Inc. 156 Gencoal Corporation 157 Greenhills Products, Inc. 158 Hammercon Incorporated 159 Hinatuan Mining Corporation 160 Iwg-Philippines Inc. 161 Jh Trading House Co., Ltd. 162 Jojo's Food Products 163 Kankuyo Philippines Corporation 164 Kawashima Textile Mfg. Phils., Inc. 165 La Tondena Distillers, Inc. 166 Linea Fina, Inc. 167 Lucky Tableware Factory, Inc. 168 Maiscor (Phils) Inc. 169 Mandaue Compressed Gases Corporation 170 Metropolitan Bank & Trust Company 171 Mhi Plant Construction Co., Ltd. 172 Mobilia Products Inc. 173 Nesic Philippines Inc. 174 Nkc Manufacturing Philippines Corporation 175 Norkis Trading Co., Inc. 176 Philippine Polyamide Industrial Corp. 177 Precision Machinist Corporation 178 Primary Structures Corporation 179 Quest International Phils. Corp. 180 Saikoh Motor Sales(Cebu) Inc. 181 San Miguel Corp. 182 Sea Commercial Co., Inc. 183 Sunpride Foods, Incorporated 184 Ting Guan Trading Corp. 185 Touchcom Philippines, Inc. 186 Ube Electronics (Phils) Inc. 187 Universal Cement Co., Inc. 188 Universal Rubina Co., 189 Utility Enterprises Corp. 190 Visayan Automotive Corp./ Mitsubishi Motors Corp. 191 Visayas Association Of Quality Circles 192 Yamashin Cebu Filter Manufacturing Corp. 193 Not Elsewhere Classified 3
Subtotal 391
Philippine Association of the Japanese Ministry of Education1 De La Salle University. 2401 Taft Ave, Manila, 1004 72 SEAFDEC Aquaculture Department 73 University of San Carlos 74 University of the Philippines Diliman 65 Benguet State University, Institute of Physical Education and Sports 56 University of Baguio, College of Dentistry 57 University of the Philippines 48 Ateneo de Davao University, College of Arts and Sciences, Faculty Member 3

Page 3 of Annex Table 15
No. of TraineesCompany/Project Title9 Department of Education Culture and Sports 3
10 Taiyo Yuden Philippines, MEPZA 3
11 University of the Philippines Cebu College, Natural Sciences and Mathematics Division 3
12 University of the Philippines Mindanao College of Science and Mathematics, Faculty Member 3
13 Asahi Optical Philippines, MEPZA 214 Department of Agriculture 2
15 Don Mariano Marcos Memorial State University, Northern Luzon Aquatic and Marine R&D Zonal Center 2
16 DOST-CAR, BSU Campus 217 Embassy of Japan 218 Holy Angel University, College of Engineering 219 Infratech Systems Consultants, Inc / Quali-Infra Construction 220 Institute of Biological Sciences, CAS 2
21 Isabela State University, College of Forestry and Management, Dept. of Environmental Science and Management 2
22 Mapua Institute of Technology 223 Mariano Marcos State University, College of Arts & Sciences, Batac 224 National Institute of Molecular Biology and Biotechnology 225 United Airlines 226 University of the Philippines Visayas, Ilo-ilo City 227 Angel Personal Messaging Off. 128 Aquaculture Department, Southeast Asian Fisheries Development Center 129 Asian Development Bank 130 Asian Hospital & Medical Center 131 Asia-Pacific Telocommunity 132 ASPAC, Department of Foreign Affairs 133 Ateneo de Manila University 134 Baguio City National High School 135 Bataan Polytechnic State College 136 BIOTECH 137 Botolan Reforestation Inc 138 Bureau of Plant Industry 139 Businessman 140 Capstone, Inc. 141 Cebu City General Hospital 142 Cebu Mitsumi Inc. 143 CEM, Department of Agribusiness Mgt. 144 Chuo Kaihatsu Corp. 145 Dairy Training & Research Institute 146 Dakudao & Sons, Inc., Architect 147 Del Monte Fresh Produce (Phils) Inc., Director for Research 148 DENR, Mines and Geosciences Bureau 149 Dental Clinic 1
50 Department of Trade and Industry, Bureau of Trade and Regulation on Consumer Protection 1
51 DEP-ED-RO-CAR 152 DMMMSU 153 Doctor of Philosophy 154 DOLE, Senior Scientist, Stanfilco, A Division of Dole Phil Inc. 155 Earthquake Disaster Mitigation Research Center 156 Exfam GB for Mindanao Programme 157 EZQ Computer Telephony Phils. 1

Page 4 of Annex Table 15
No. of TraineesCompany/Project Title58 Farming Systems and Soil Resources Institute 159 FDPSavills 160 Fisheries Resources Management Project Phil. 161 Foreign Service Institute, Department of Foreign Affairs 162 Forest Products Research and Development Institute 163 Fujitsu Philippines, Inc. 164 Government Service Insurance System (GSIS) 165 GREYFOUR Law Offices 166 Hitachi Cable Phils. 167 Honda Cars Phils., Inc. 168 i2 Technologies Japan Ltd 169 Institute of Food Science and Technology 170 International Rice Research Institute 171 Itochu Corp 172 KSS Philippines, Inc. 173 La Tondeña Distillers, Inc. 174 Lakan Dula High School 175 Lamb of God, School Director 176 Mapandan Central School 177 Masa Ecological Development Inc. 178 Mindanao State University, Dept. of Mathematics and Physics 179 Ministry Of Education, Brunei Darussalam 180 Mitsumi Philippines, Inc. 181 Moscow Electro-technical Institute of Communications, 182 Mountain Province State Polytechnic College 183 National Agriculture Research Center for Kyushu Okinawa Region 184 National Economic and Development Authority 185 National Power Corporation, Visayas Regional Center, Jones 186 National Research Council of the Philippines 187 Network of Aquaculture Centres in Asia-Pacific (NACA), 188 Office of the Ombudsman-Mindanao, Lawyer 189 Office of the Press Secretary 190 Osato Laboratory 191 Pangasinan State University 192 Philajames - Mindanao Chapter 193 Philippine Carabao Center 194 Philippine Long Distance Telephone Company 195 Philippine Military Academy 196 Philippine Trade Training Center 197 Philippines TRC, Inc. 198 PICHE 199 Pit-os National High School, Pit-os 1
100 PricewaterhouseCoopers Financial Advisors, Inc. 1101 RCBC-Securities & Stock Market Research 1102 Research Institute for Solvothermal Technology 1103 San Miguel Corporation 1104 School of Urban & Regional Planning 1105 Scinvent, Inc. 1106 Ship and Ocean Foundation 1107 Smartflex Systems Philippines 1108 South Western University, College of Dentistry 1109 Southeast Asian Fisheries Development Center 1110 Southpoint Aquatic Resources, Inc. 1111 Taikisha Philippines, Inc. 1

Page 5 of Annex Table 15
No. of TraineesCompany/Project Title112 The Hebrew University of Jerusalem, Faculty of Dental Medicine 1113 The Medical City; 1114 Union Cement Corp. 1115 University of Bohol, Science High School, University of Baguio 1116 University of Mindanao, Faculty Member 1117 University of Santo Tomas 1118 University of the Philippines Los Baños 1119 University of the Philippines, Center for International Studies 1120 University of Miami School of Medicine 1121 Vibrametrics, Inc.; 1122 Virgen Milagrosa Educational Institute, College of Dentistry 1123 Woodfields Consultants, Inc. 1124 Not Elsewhere Classified 26
Subtotal 207
Asian Productivity Organization, 1993 - 2003 1 International Productivity Conference 142 Labour-Management Consultation Mechanism from the Philippines to Japan 63 Venture 2001: Asian Forum on Venture Business 54 Venture 2000: Asian Forum on Venture Business 5
5 Symposium on Adaptation of SMEs in a Transitional Age-Coping with Challenges and Changes 2
6 International Forum on SMEs: Accelerating Growth and Enhancing Competitiveness in the Knowledge Economy 2
7 Workshop on Productivity in Service Sector: Hotel Sector 28 Seminar on Development of Women 29 Symposium on the Application of Information Technology in Small Industries 2
10 Advanced Workshop on Green Productivity for Productivity Facilitators 211 Advanced Workshop on Green Productivity for Professionals 112 Effective Problem Solving for Production Managers 113 Forum on B2B Cooperation on E2 Commerce 114 Forum on B2B Cooperation on E2Commerce 115 Information Technology for Problem Solving 116 International Conference on Productivity in the E-Age 117 Productivity Improvement in Foundry Industry 1
18 Seminar on Comparative Study on Planning Process of Community Development Component of People's Participation 1
19 Seminar on Electronic Commerce 120 Seminar on Human Resources Management for Globalizing SMEs 121 Seminar on Productivity for Enhancing Competitiveness in E-Age. 122 Seminar on Total Productivity Management 1
23 Study Meeting on Application of Information Technology in Community/Rural Development 1
24 Study Meeting on Regional Industrialization and Development 125 Study Meeting on the Use and Regulation of Genetically Modified Organisms 1
26 Symposium on Concept and Management of Six Sigma for Productivity Improvement 1
27 Symposium on Productivity Measurement: Service Sector 128 Symposium on Reengineering for Higher Productivity 129 Symposium on Supply Chain Management: A New Management Tool 130 Symposium on Technical Information Mechanism for Small Industries 1
31 Top Management Forum: Knowledge Management: A Key to Corporate Competitiveness 1
32 Trainer's Training on 5s for Supporting Industry 1

Page 6 of Annex Table 15
No. of TraineesCompany/Project Title33 Training Course on Small Industries Development of Export Promotion 134 Venture 2002: Asian Forum on Venture Business 135 Workshop on Green Productivity for the Food Processing Industry 1
36 Workshop on Green Productivity with a Special Focus on Occupational Health and Safety 1
37 Workshop on Green Productivity with a Special Focus on Occupational Health and Safety 1
38 Workshop on Tools and Techniques for Productivity Improvement 1Subtotal 70
TOTAL 668Sources: Cebu AOTS, Phil. Association of Japanese Ministry of Education, Development Academy of the Philippines

Page 1 of Annex Table 16
Costs Rank of Cebu Rank 1 Rank 26 or lastWorkers (monthly, general industry) 7 Dhaka (Bangladesh) Yokohama (Japan)Engineers (monthly, mid-level engineers) 9 Dhaka (Bangladesh) Yokohama (Japan)Mid-level managers (monthly; section and department chief level) 1 Cebu (Philippines) Yokohama (Japan)
Legal minimum wage 14 Colombo (Sri Lanka) Yokohama (Japan)Bonus payments (fixed bonus_ variable bonus months) 2 Shenzhen (Chinal) Seoul (Korea)
Social Security burden Ration (A. Employer) 4 Yangon (Myanmar) Shanghai (China)Social Security burden Ration (B. Employee) 5 Karachi (Pakistan) Singapore (Singapore)Nominal wage increase rate (1999-2000-2001) (%) 10 Bangkok (Thailand) Seoul (Korea)
Industrial estate (land) purchase rate (per sq.m) 7 Colombo (Sri Lanka) Yokohama (Japan)
Industrial estate rents (monthly) (per sq.m) 5 Seoul (Korea) Yangon (Myanmar)Office rent (monthly) (per sq.m) 2 Hanoi (Vietnam) Singapore (Singapore)Housing rent for foreigners (monthly) 2 Shenzhen (Chinal) Yokohama (Japan)Telephone installation fee 8 Singapore (Singapore) Yangon (Myanmar)
Telephone Charge (monthly basic charge) 20 Ho Chin Minh City & Hanoi (Vietnam)
Cebu & Manila (Philippines)
Telephone Charge (call charge per min.) nil
Singapore, Beijing, Seoul, Jakarta, Batam, Ho Chin
Minh City, Hanoi, Taipei, Kuala Lumpur, Colombo,
Dhaka, & New Delhi
Yangon (Myanmar)
International call charge (for 3 min. to Japan) 4 Hongkong (China) Yangon (Myanmar)Mobile phone subscription fee nil Dalian (China) Yangon (Myanmar)Mobile phone charge (monthly basic charge) 19 Colombo (Sri Lanka) Hong Kong (China)Mobine phone charge (call charge per min.) 8 Mumbai (India) Taipei (Taiwan)Internet connection fee (telephone lin) (A. initial contract fee, B. monthly basic charge, C. connection fee per hour)
12 Beijing (China) Yangon (Myanmar)
Internt connection fee (broadband) 16 Seoul (Korea) New Delhi (India)Electricity rate for business use (monthly basic charge) Batam (Indonesia) Okinawa (Japan)
Electricity rate for business use (charge per kWh) 7 Shanghai (China) Hong Kong (China)
Electricity rate for general use (monthly basic charge) Manila (Philippines) Karachi (Pakistan)
Electricity rate for general use (charge per kWh) 7 Taipei (Taiwan) Okinawa (Japan)
Water rate for business use (monthly basic charge) 8 Karachi (Pakistan) Jakarta (Indonesia)
Water rate for business use (charge per cu.m) 12 Batam (Indonesia) Okinawa (Japan)Water rate for business for general use (monthly basic charge) 10 Colombo (Sri Lanka) Taipei (Taiwan)
Water rate for business for general use (charge per cu.m) 14 New Delhi (India) Okinawa (Japan)
Investment Costs in 26 Asian Cities JETRO November 2002 Survey
Annex Table 16

Page 2 of Annex Table 16
Costs Rank of Cebu Rank 1 Rank 26 or last
Gas rate for business use (monthly basic charge) 3 Yangon (Myanmar) Kuala Lumpur (Malaysia)
Gas rate for business use (charge per cu.m) Hongkong (China) Karachi (Pakistan)
Gas rate for general use (monthly basic charge) 8 Yangon (Myanmar) Hong Kong (China)
Gas rate for general use (charge per cu.m) Dhaka (Bangladesh) Hong Kong (China)Container transport (40 - foot container) (plant-nearest port) (Yokohama Port) 13 Batam (Indonesia) New Delhi (India)
Container transport (40 - foot container) (plant-nearest port) (Los Angeles Port) 20 Mumbai (India) Chongqing (China)
Passenger car purchase price (1500 cc sedan) 8 Seoul (Korea) Singapore (Singapore)Large passenger car purchase price (sedan over 2500cc) 5 Batam (Indonesia) Karachi (Pakistan)
Regular gasoline price (1 liter) 4 Yangon (Myanmar) Hong Kong (China)Corporate income tax rate (effective tax rate) 7 Hong Kong (China) Karachi (Pakistan)
Personal income tax rate (highest tax rate) 5 Hong Kong (China) & Yangon (Myanmar)
Hanoi & Ho Chin Minh (Vietnam)
Value-added tax rate (highest tax rate) 4 Singapore (Singapore)
Beijing, Shanghai, Dalian,
Shenyang,Chongqing, Shenzhen
Value-added tax (standard tax rate) 1
Jakarta, Batam, Seoul, Singapore, Hanoi, Ho chin
Minh, Manila, Cebu, Beijing, Shanghai, Dalian, Shenyang,
Chongqing, Shenzhen, Dhaka & Karachi
Colombo (Sri Lanka)
Tax on dividends remitted to Japan (highest tax rate) 2
Beijing, Shanghai, Dalian, Shenyang, Chongqing,
ShenzhenKuala Lumpur (Malaysia)
Tax on royalties remitted to Japan (highest tax rate) 1
Jakarta, Batam, Seoul, Singapore, Hanoi, Ho Chin
Minh, Kuala Lumpur, Manila, Cebu, Beijing,
Shanghai, Dalian, Shenyang, Chongqing, Shenzhen,
Dhaka & Colombo
Taipei, Mumbai, & New Delhi