Philippine IT-BPO Road Map 2016: Driving to Global Leaderships3.amazonaws.com/zanran_storage/ ·...
25
Philippine IT-BPO Road Map 2016: Driving to Global Leadership Funded by the Commission on Information and Communications Technology (CICT)/Office of the President IT-BPO = information technology and business process outsourcing Commissioned by the Business Processing Association of the Philippines (BPAP and partner associations)
Transcript of Philippine IT-BPO Road Map 2016: Driving to Global Leaderships3.amazonaws.com/zanran_storage/ ·...
Philippine IT-BPO Road Map 2016: Driving to Global Leadership
Funded by the Commission on Information and Communications Technology (CICT)/Office of the President
ITBPO = information technology and business process outsourcing
Commissioned by the Business Processing Association of the Philippines (BPAP and partner associations)
Proprietary & Confidential. Copyright © 2010 BPAP, Everest Global, and Outsource2Philippines.2
Contents
Road Map 2016 study overview
Philippine ITBPO industry: current state and competitive positioning
Global market trends in ITBPO and target for Road Map 2016
Initiatives to achieve Road Map 2016
Call to action and publicprivate partnership
Proprietary & Confidential. Copyright © 2010 BPAP, Everest Global, and Outsource2Philippines.3
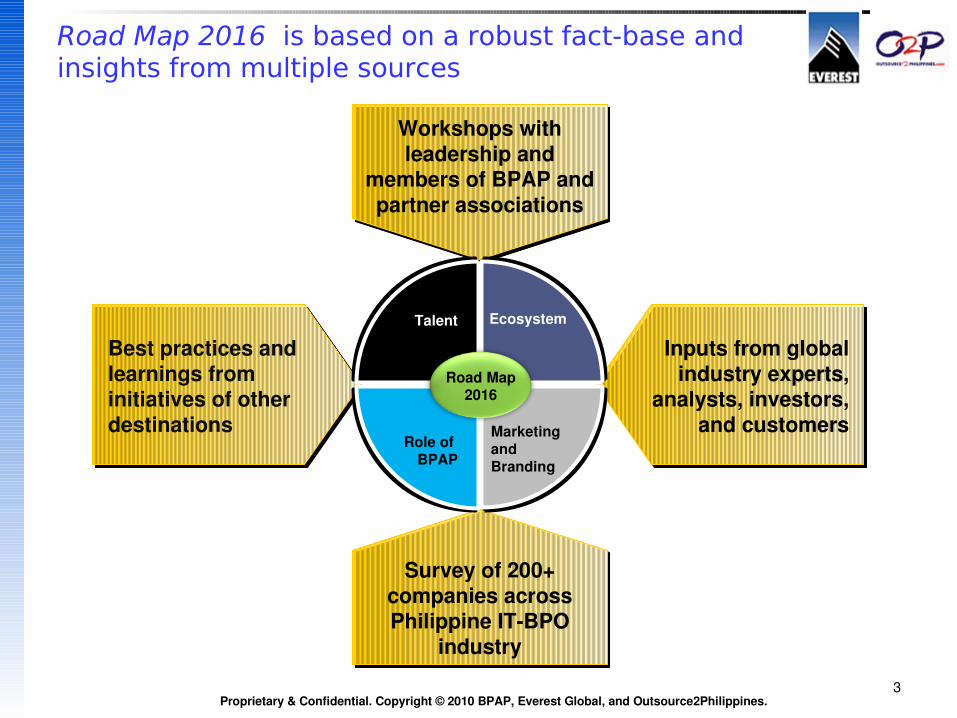
Road Map 2016 is based on a robust fact-base and insights from multiple sources
Workshops with leadership and
members of BPAP and partner associations
Survey of 200+ companies across Philippine ITBPO
industry
Best practices and learnings from initiatives of other destinations
Inputs from global industry experts,
analysts, investors, and customers
Role of BPAP
Ecosystem
Marketing and Branding
Talent
Road Map2016
Proprietary & Confidential. Copyright © 2010 BPAP, Everest Global, and Outsource2Philippines.4
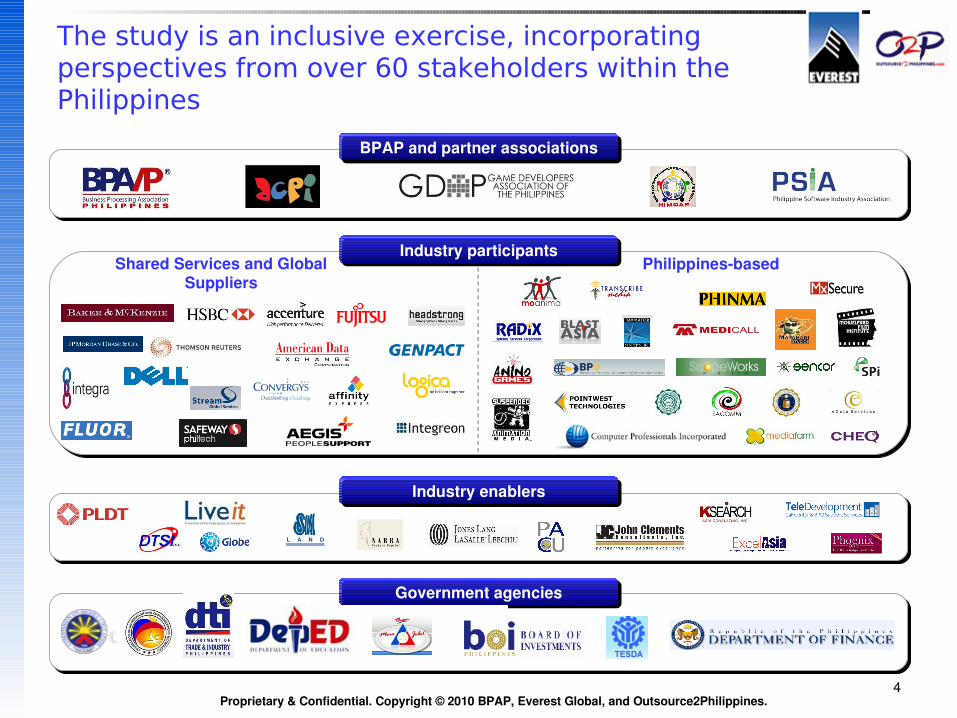
The study is an inclusive exercise, incorporating perspectives from over 60 stakeholders within the Philippines
BPAP and partner associations
Industry participantsShared Services and Global
SuppliersPhilippinesbased
Industry enablers
Government agencies
Proprietary & Confidential. Copyright © 2010 BPAP, Everest Global, and Outsource2Philippines.5
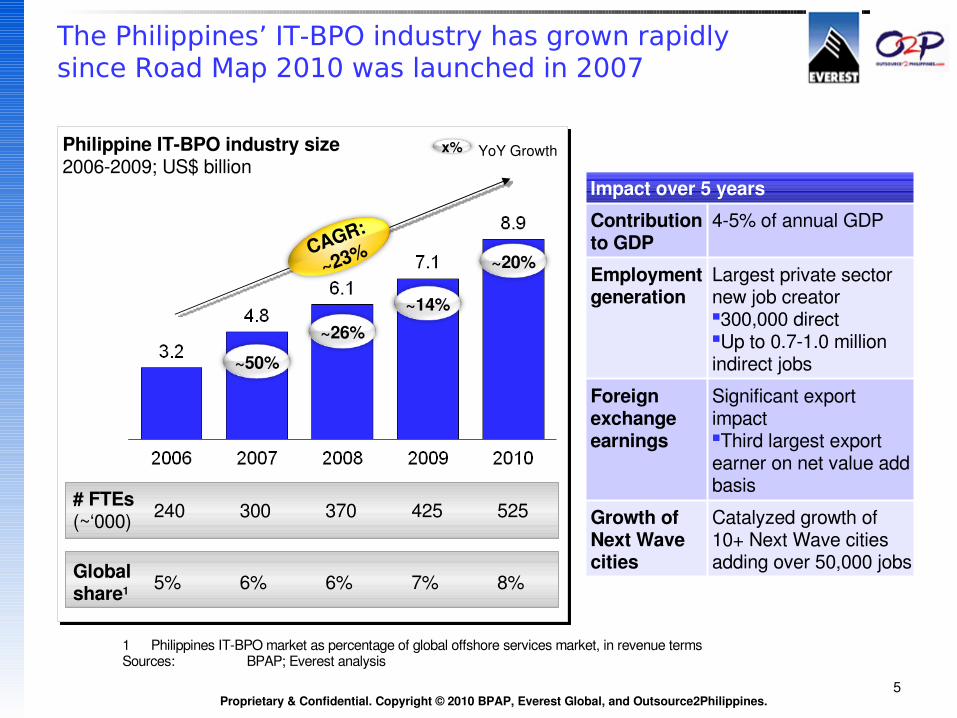
The Philippines’ IT-BPO industry has grown rapidly since Road Map 2010 was launched in 2007
Philippine ITBPO industry size20062009; US$ billion
x% YoY Growth
1 Philippines ITBPO market as percentage of global offshore services market, in revenue termsSources: BPAP; Everest analysis
# FTEs(~‘000) 240 300 370 425 525
Global share1 5% 6% 6% 7% 8%
Impact over 5 years
Contribution to GDP
45% of annual GDP
Employment generation
Largest private sector new job creator300,000 directUp to 0.71.0 million indirect jobs
Foreign exchange earnings
Significant export impact Third largest export earner on net value add basis
Growth of Next Wave cities
Catalyzed growth of 10+ Next Wave cities adding over 50,000 jobs
~50%
~26%~14%
~20%CAGR:
~23%
Proprietary & Confidential. Copyright © 2010 BPAP, Everest Global, and Outsource2Philippines.6
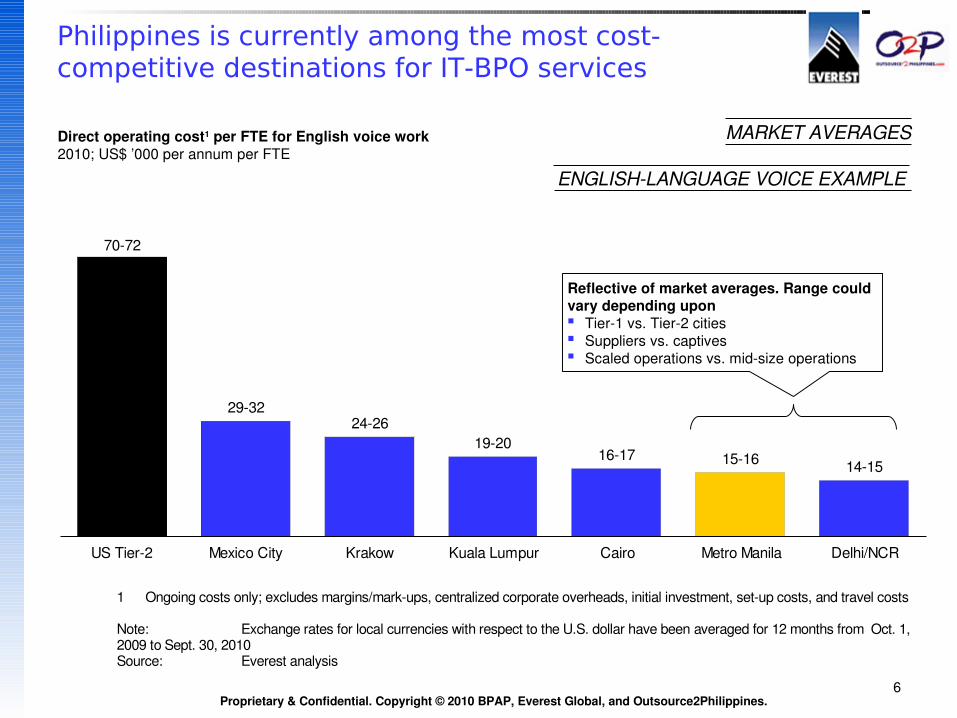
1 Ongoing costs only; excludes margins/markups, centralized corporate overheads, initial investment, setup costs, and travel costs
Note: Exchange rates for local currencies with respect to the U.S. dollar have been averaged for 12 months from Oct. 1, 2009 to Sept. 30, 2010Source: Everest analysis
Philippines is currently among the most cost-competitive destinations for IT-BPO services
29322426
19201617 1516 1415
7072
US Tier2 Mexico City Krakow Kuala Lumpur Cairo Metro Manila Delhi/NCR
Reflective of market averages. Range could vary depending upon Tier1 vs. Tier2 cities Suppliers vs. captives Scaled operations vs. midsize operations
Direct operating cost1 per FTE for English voice work2010; US$ ’000 per annum per FTE
MARKET AVERAGES
ENGLISHLANGUAGE VOICE EXAMPLE
Proprietary & Confidential. Copyright © 2010 BPAP, Everest Global, and Outsource2Philippines.7
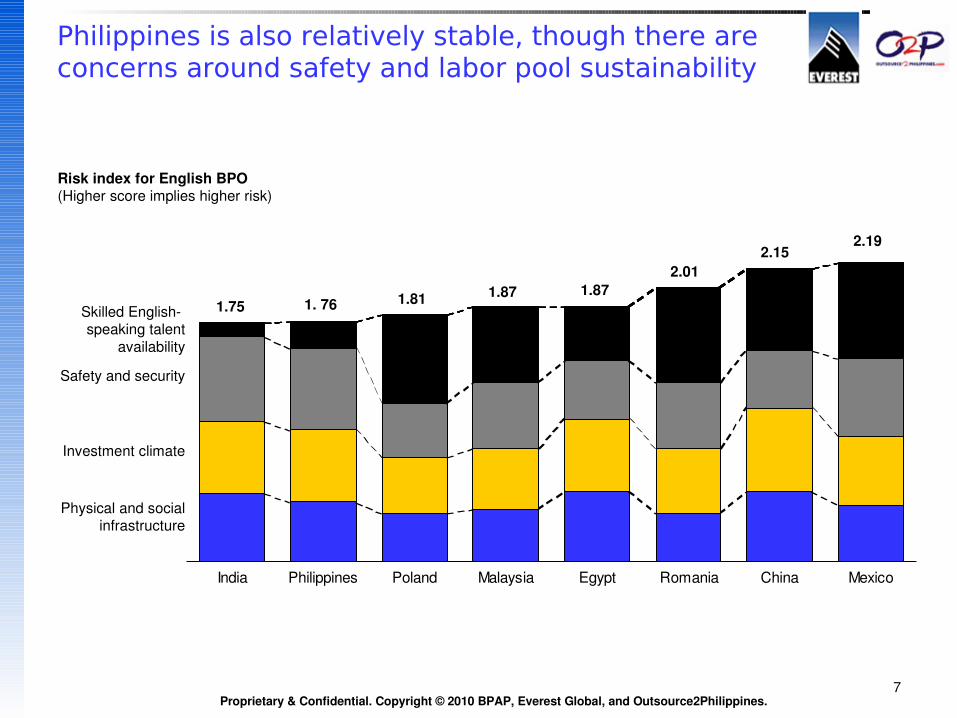
India Philippines Poland Malaysia Egypt Romania China Mexico
Philippines is also relatively stable, though there are concerns around safety and labor pool sustainability
Skilled English speaking talent
availability
Safety and security
Investment climate
Risk index for English BPO(Higher score implies higher risk)
Physical and social infrastructure
1.751.871.811. 76
1.872.01
2.152.19
Proprietary & Confidential. Copyright © 2010 BPAP, Everest Global, and Outsource2Philippines.8
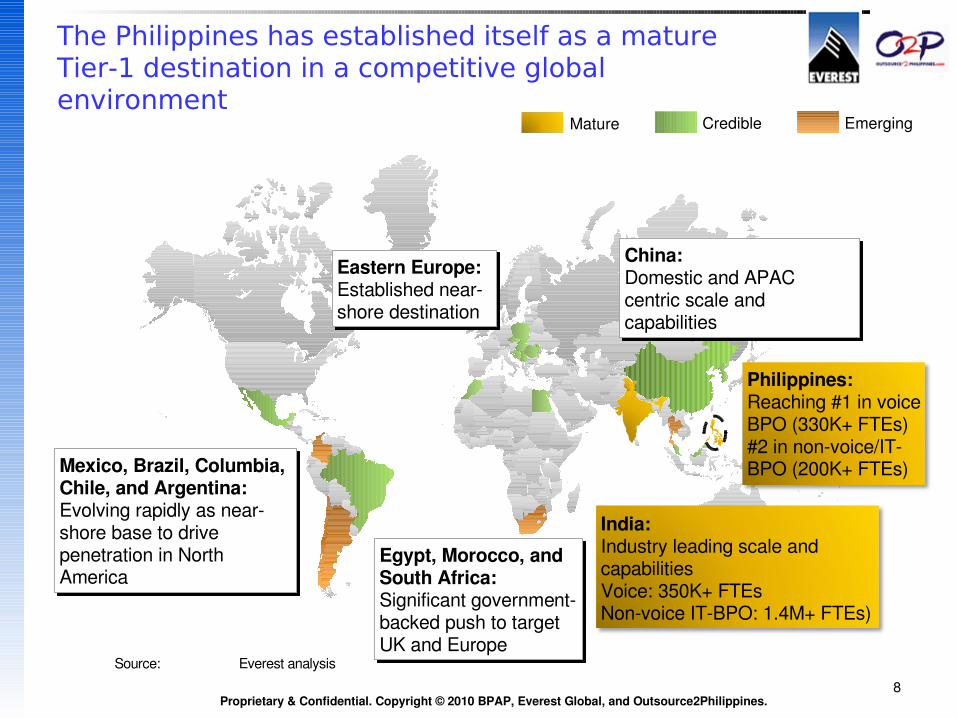
The Philippines has established itself as a mature Tier-1 destination in a competitive global environment
Mature Credible Emerging
Eastern Europe: Established nearshore destination
China:Domestic and APAC centric scale and capabilities
Mexico, Brazil, Columbia, Chile, and Argentina: Evolving rapidly as nearshore base to drive penetration in North America
Philippines: Reaching #1 in voice BPO (330K+ FTEs)#2 in nonvoice/ITBPO (200K+ FTEs)
India: Industry leading scale and capabilities Voice: 350K+ FTEsNonvoice ITBPO: 1.4M+ FTEs)
Egypt, Morocco, and South Africa: Significant governmentbacked push to target UK and Europe
Source: Everest analysis
Proprietary & Confidential. Copyright © 2010 BPAP, Everest Global, and Outsource2Philippines.9
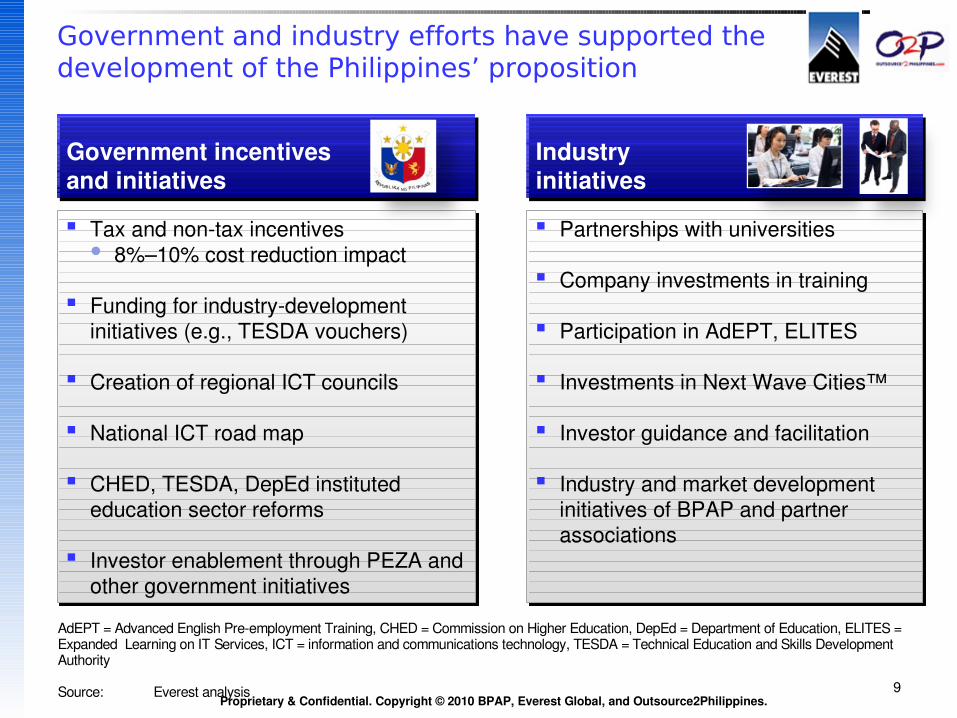
Government and industry efforts have supported the development of the Philippines’ proposition
Government incentives and initiatives
Industry initiatives
Partnerships with universities
Company investments in training
Participation in AdEPT, ELITES
Investments in Next Wave Cities™
Investor guidance and facilitation
Industry and market development initiatives of BPAP and partner associations
Tax and nontax incentives 8%–10% cost reduction impact
Funding for industrydevelopment initiatives (e.g., TESDA vouchers)
Creation of regional ICT councils
National ICT road map
CHED, TESDA, DepEd instituted education sector reforms
Investor enablement through PEZA and other government initiatives
AdEPT = Advanced English Preemployment Training, CHED = Commission on Higher Education, DepEd = Department of Education, ELITES = Expanded Learning on IT Services, ICT = information and communications technology, TESDA = Technical Education and Skills Development Authority
Source: Everest analysis
Proprietary & Confidential. Copyright © 2010 BPAP, Everest Global, and Outsource2Philippines.10
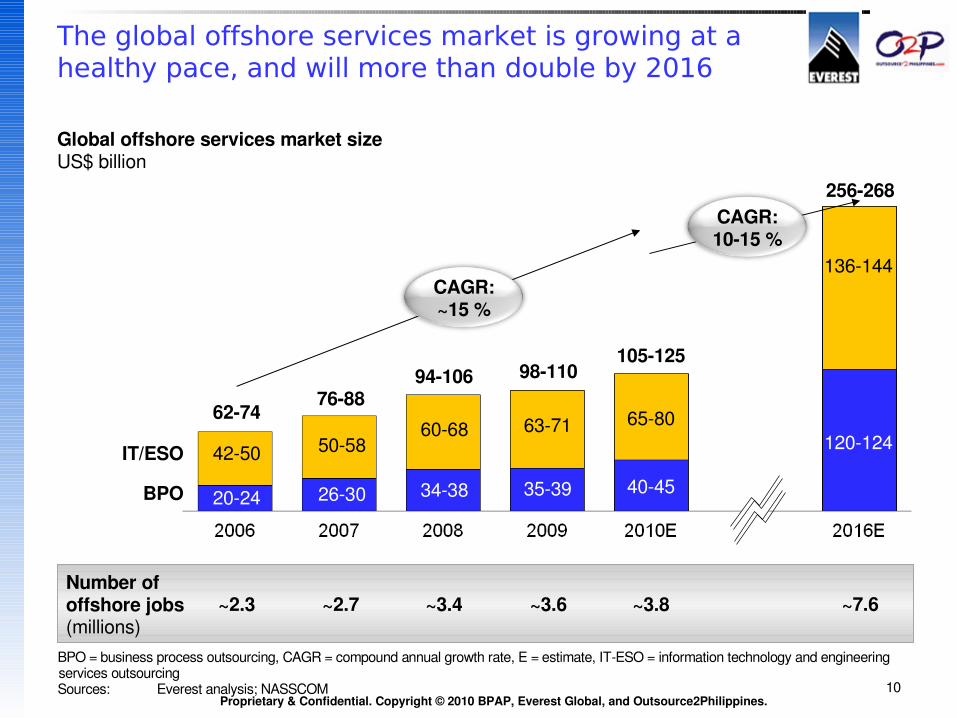
The global offshore services market is growing at a healthy pace, and will more than double by 2016
BPO = business process outsourcing, CAGR = compound annual growth rate, E = estimate, ITESO = information technology and engineering services outsourcingSources: Everest analysis; NASSCOM
Global offshore services market sizeUS$ billion
~2.3 ~2.7 ~3.4 ~3.6 ~7.6Number ofoffshore jobs(millions)
~3.8
62747688
94106 98110
256268
IT/ESO
BPO 2024
4250
2630
5058
3438
6068
3539
6371120124
136144
105125
4045
6580
CAGR:~15 %
CAGR:1015 %
Proprietary & Confidential. Copyright © 2010 BPAP, Everest Global, and Outsource2Philippines.11
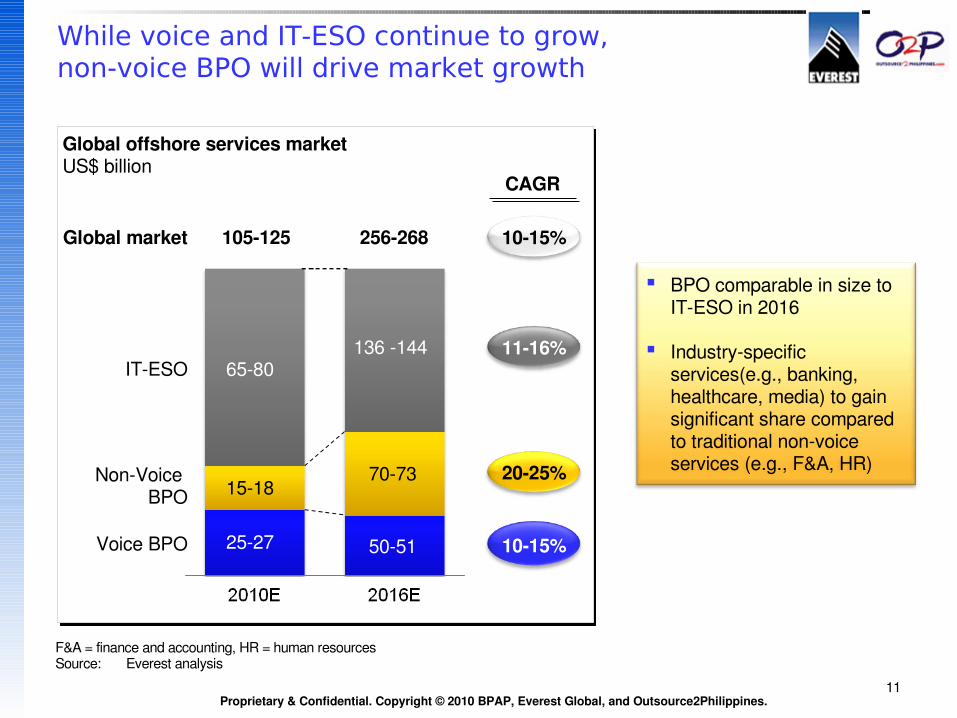
While voice and IT-ESO continue to grow, non-voice BPO will drive market growth
Global offshore services marketUS$ billion
1015%
2025%
1116%
2527 5051
105125
6580
7073
1015%256268
136 144 ITESO
1518
Voice BPO
NonVoice BPO
Global market
CAGR
BPO comparable in size to ITESO in 2016
Industryspecific services(e.g., banking, healthcare, media) to gain significant share compared to traditional nonvoice services (e.g., F&A, HR)
F&A = finance and accounting, HR = human resourcesSource: Everest analysis
Proprietary & Confidential. Copyright © 2010 BPAP, Everest Global, and Outsource2Philippines.12
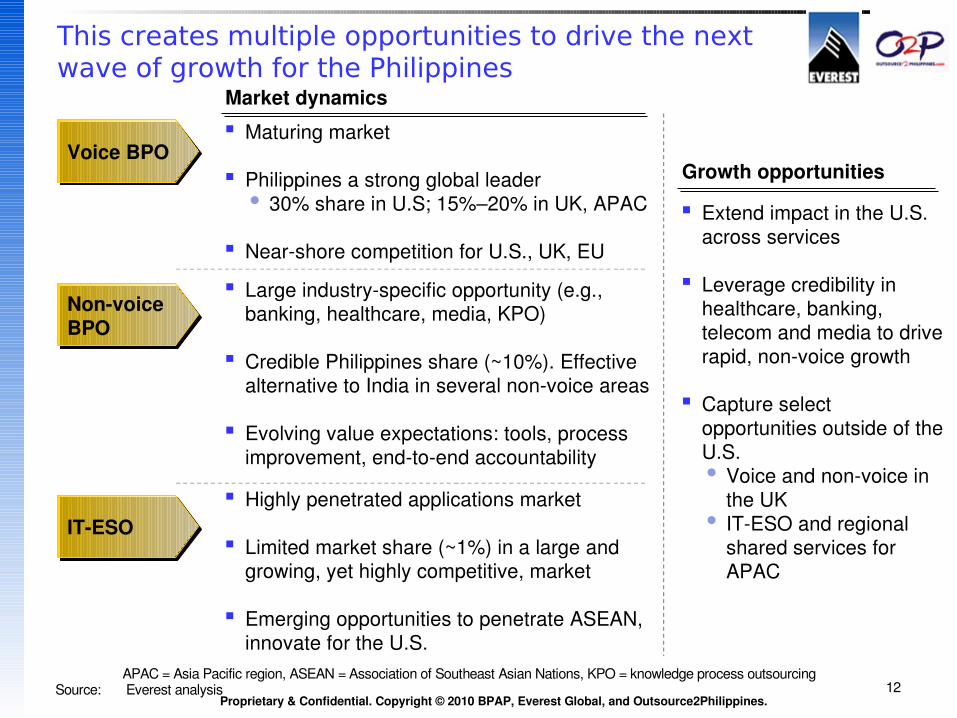
This creates multiple opportunities to drive the next wave of growth for the Philippines
Voice BPO
Nonvoice BPO
ITESO
Market dynamics Maturing market
Philippines a strong global leader 30% share in U.S; 15%–20% in UK, APAC
Nearshore competition for U.S., UK, EU
Large industryspecific opportunity (e.g., banking, healthcare, media, KPO)
Credible Philippines share (~10%). Effective alternative to India in several nonvoice areas
Evolving value expectations: tools, process improvement, endtoend accountability
Highly penetrated applications market
Limited market share (~1%) in a large and growing, yet highly competitive, market
Emerging opportunities to penetrate ASEAN, innovate for the U.S.
Growth opportunities
Extend impact in the U.S. across services
Leverage credibility in healthcare, banking, telecom and media to drive rapid, nonvoice growth
Capture select opportunities outside of the U.S. Voice and nonvoice in
the UK ITESO and regional
shared services for APAC
APAC = Asia Pacific region, ASEAN = Association of Southeast Asian Nations, KPO = knowledge process outsourcingSource: Everest analysis
Proprietary & Confidential. Copyright © 2010 BPAP, Everest Global, and Outsource2Philippines.13
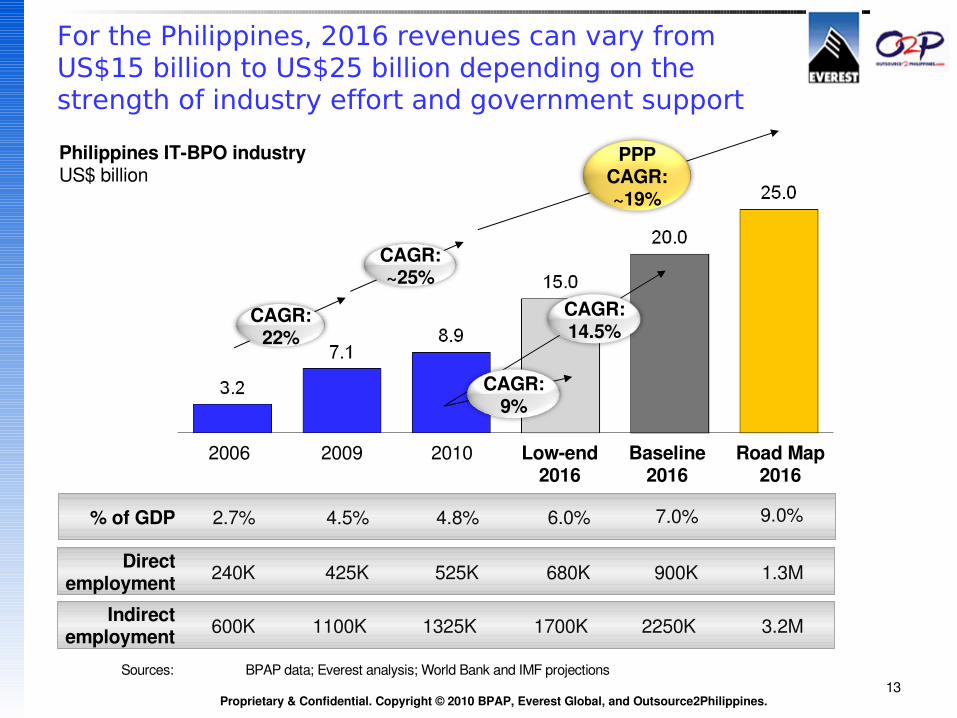
For the Philippines, 2016 revenues can vary from US$15 billion to US$25 billion depending on the strength of industry effort and government support
Philippines ITBPO industryUS$ billion
Sources: BPAP data; Everest analysis; World Bank and IMF projections
1325K 2250KIndirect employment 600K 1100K 3.2M
% of GDP 2.7% 4.8% 7.0%4.5% 9.0%
1700K
6.0%
2006 20102009 Road Map 2016
Baseline 2016
CAGR: 22%
CAGR: ~25%
CAGR: 14.5%
PPPCAGR: ~19%
Lowend 2016
CAGR: 9%
525K 900KDirect employment 240K 425K 1.3M680K
Proprietary & Confidential. Copyright © 2010 BPAP, Everest Global, and Outsource2Philippines.14
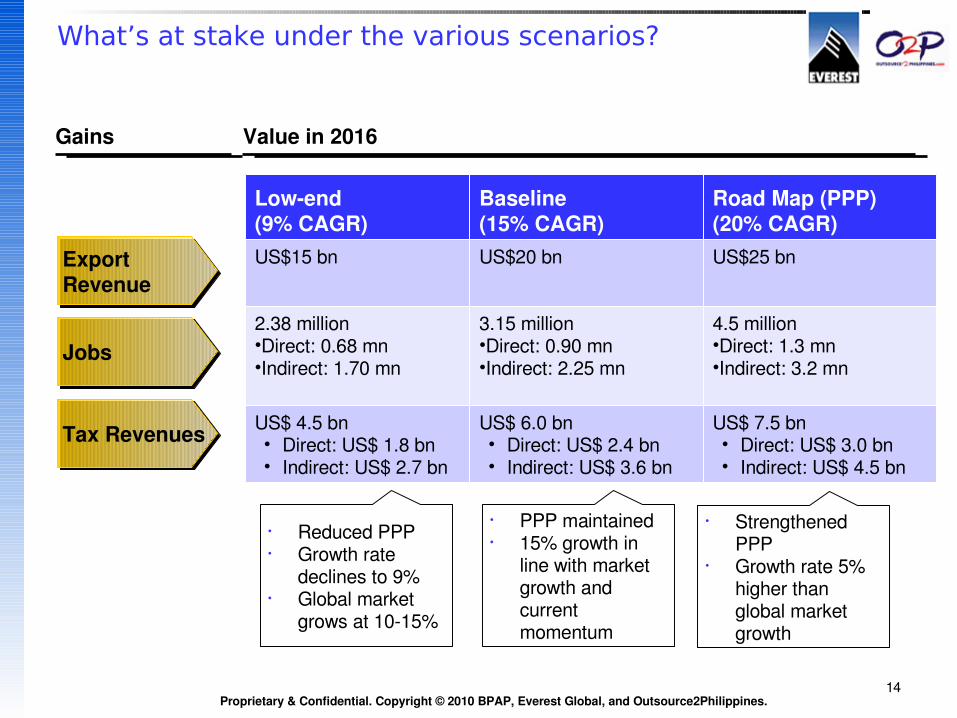
What’s at stake under the various scenarios?
Jobs
Export Revenue
Tax Revenues
Lowend(9% CAGR)
Baseline(15% CAGR)
Road Map (PPP)(20% CAGR)
US$15 bn US$20 bn US$25 bn
2.38 million•Direct: 0.68 mn•Indirect: 1.70 mn
3.15 million•Direct: 0.90 mn•Indirect: 2.25 mn
4.5 million•Direct: 1.3 mn•Indirect: 3.2 mn
US$ 4.5 bn • Direct: US$ 1.8 bn• Indirect: US$ 2.7 bn
US$ 6.0 bn• Direct: US$ 2.4 bn• Indirect: US$ 3.6 bn
US$ 7.5 bn• Direct: US$ 3.0 bn • Indirect: US$ 4.5 bn
Gains Value in 2016
• Reduced PPP• Growth rate
declines to 9%• Global market
grows at 1015%
• PPP maintained • 15% growth in
line with market growth and current momentum
• Strengthened PPP
• Growth rate 5% higher than global market growth
Proprietary & Confidential. Copyright © 2010 BPAP, Everest Global, and Outsource2Philippines.15
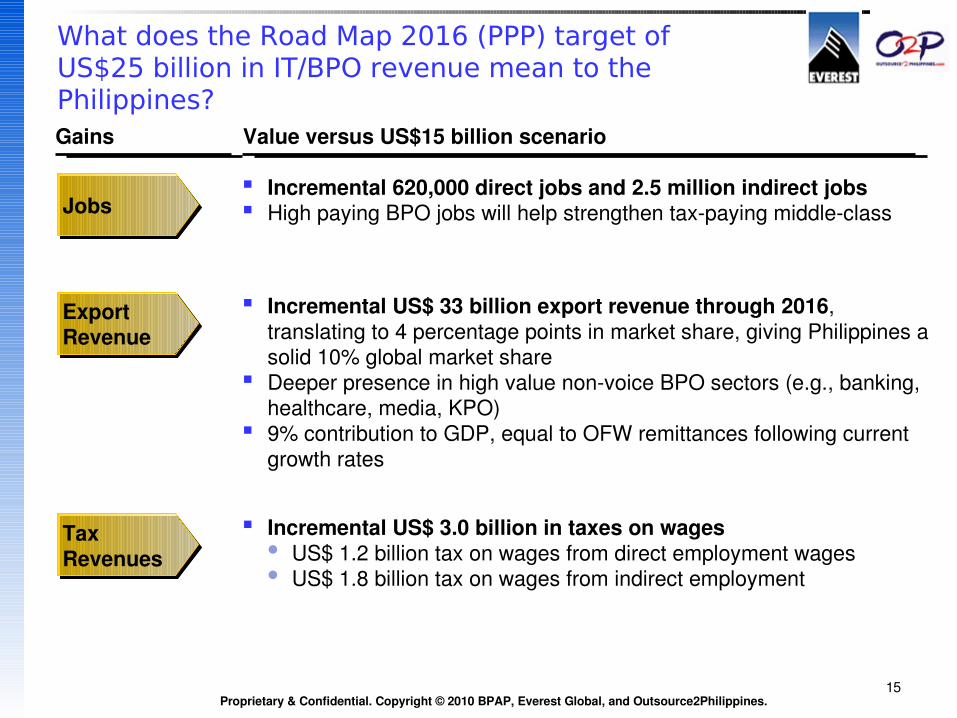
What does the Road Map 2016 (PPP) target of US$25 billion in IT/BPO revenue mean to the Philippines?
Jobs
Export Revenue
Tax Revenues
Gains Value versus US$15 billion scenario
Incremental 620,000 direct jobs and 2.5 million indirect jobs High paying BPO jobs will help strengthen taxpaying middleclass
Incremental US$ 33 billion export revenue through 2016, translating to 4 percentage points in market share, giving Philippines a solid 10% global market share
Deeper presence in high value nonvoice BPO sectors (e.g., banking, healthcare, media, KPO)
9% contribution to GDP, equal to OFW remittances following current growth rates
Incremental US$ 3.0 billion in taxes on wages US$ 1.2 billion tax on wages from direct employment wages US$ 1.8 billion tax on wages from indirect employment
Proprietary & Confidential. Copyright © 2010 BPAP, Everest Global, and Outsource2Philippines.16
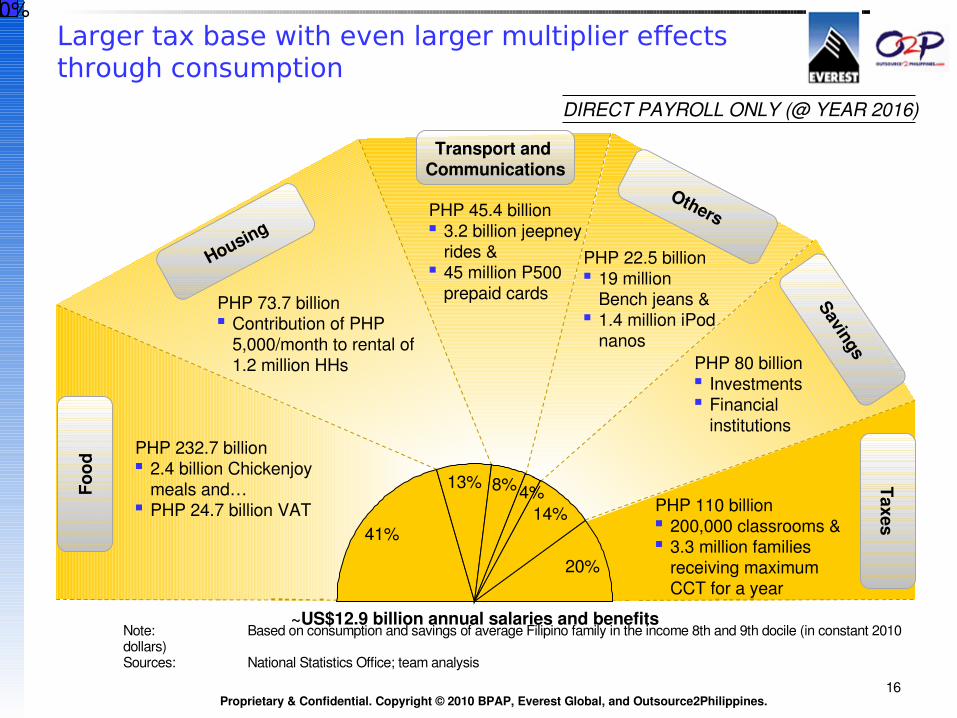
10%Larger tax base with even larger multiplier effects through consumption
Food
Housing
Transport and Communications
Others
Savings
Taxes
PHP 22.5 billion 19 million
Bench jeans & 1.4 million iPod
nanosPHP 80 billion Investments Financial
institutions
PHP 73.7 billion Contribution of PHP
5,000/month to rental of 1.2 million HHs
PHP 232.7 billion 2.4 billion Chickenjoy
meals and… PHP 24.7 billion VAT PHP 110 billion
200,000 classrooms & 3.3 million families
receiving maximum CCT for a year
PHP 45.4 billion 3.2 billion jeepney
rides & 45 million P500
prepaid cards
Note: Based on consumption and savings of average Filipino family in the income 8th and 9th docile (in constant 2010 dollars) Sources: National Statistics Office; team analysis
~US$12.9 billion annual salaries and benefits
DIRECT PAYROLL ONLY (@ YEAR 2016)
41%
13% 8%4%14%
20%
Proprietary & Confidential. Copyright © 2010 BPAP, Everest Global, and Outsource2Philippines.17
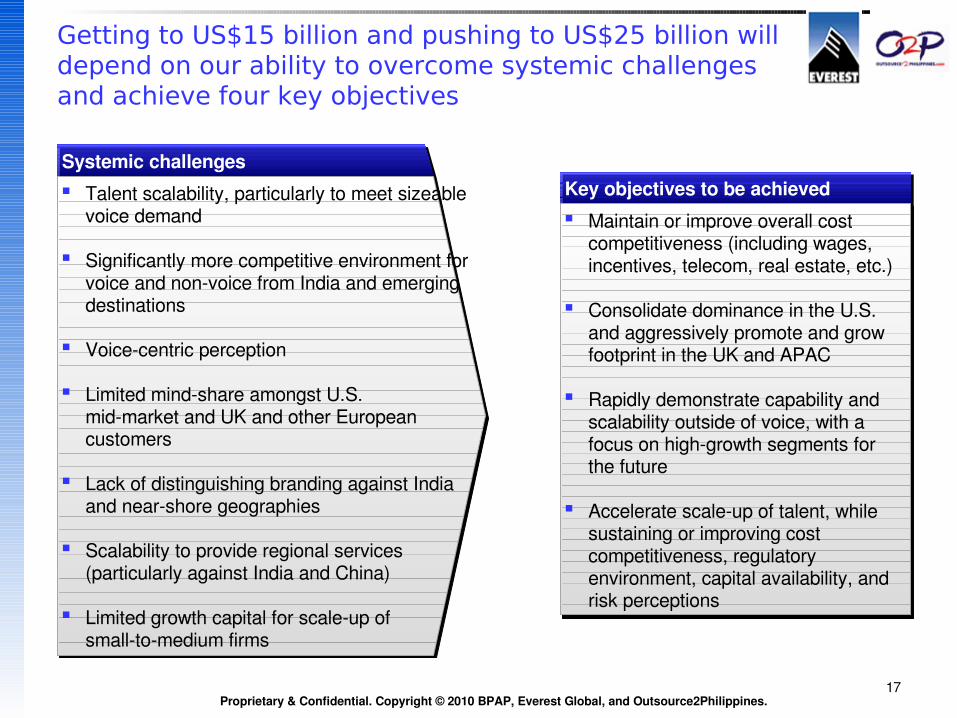
Getting to US$15 billion and pushing to US$25 billion will depend on our ability to overcome systemic challenges and achieve four key objectives
Systemic challengesKey objectives to be achieved Talent scalability, particularly to meet sizeable
voice demand
Significantly more competitive environment for voice and nonvoice from India and emerging destinations
Voicecentric perception
Limited mindshare amongst U.S.midmarket and UK and other European customers
Lack of distinguishing branding against India and nearshore geographies
Scalability to provide regional services (particularly against India and China)
Limited growth capital for scaleup of smalltomedium firms
Maintain or improve overall cost competitiveness (including wages, incentives, telecom, real estate, etc.)
Consolidate dominance in the U.S. and aggressively promote and grow footprint in the UK and APAC
Rapidly demonstrate capability and scalability outside of voice, with a focus on highgrowth segments for the future
Accelerate scaleup of talent, while sustaining or improving cost competitiveness, regulatory environment, capital availability, and risk perceptions
Proprietary & Confidential. Copyright © 2010 BPAP, Everest Global, and Outsource2Philippines.18
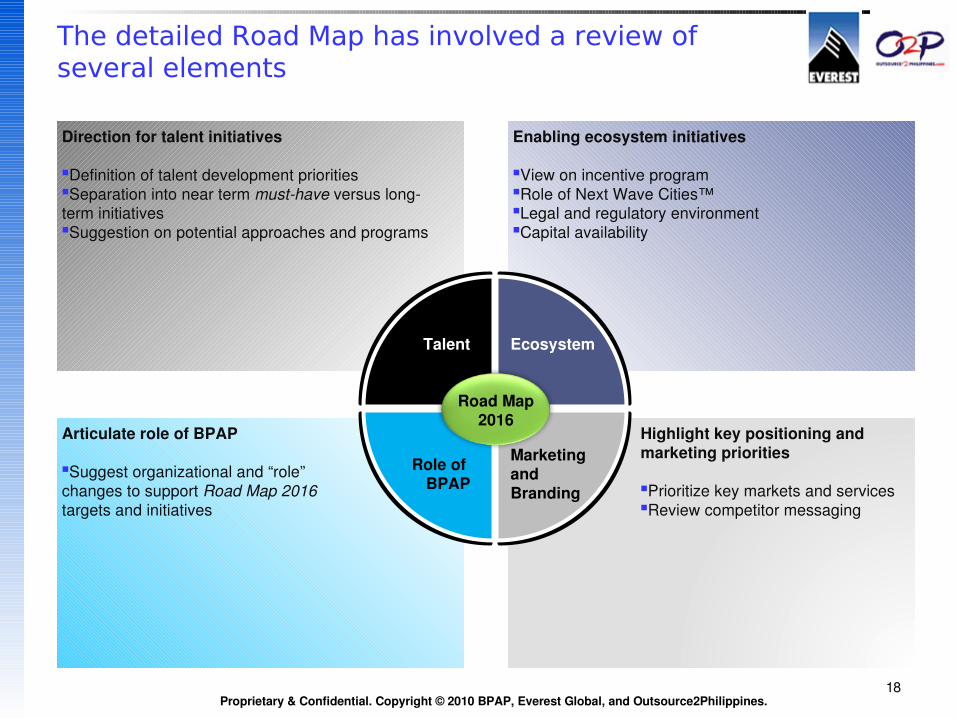
The detailed Road Map has involved a review of several elements
Direction for talent initiatives
Definition of talent development prioritiesSeparation into near term musthave versus long term initiativesSuggestion on potential approaches and programs
Articulate role of BPAP
Suggest organizational and “role” changes to support Road Map 2016 targets and initiatives
Enabling ecosystem initiatives
View on incentive programRole of Next Wave Cities™Legal and regulatory environmentCapital availability
Road Map2016
Highlight key positioning and marketing priorities
Prioritize key markets and servicesReview competitor messaging
Role of BPAP
Ecosystem
Marketing and Branding
Talent
Proprietary & Confidential. Copyright © 2010 BPAP, Everest Global, and Outsource2Philippines.19
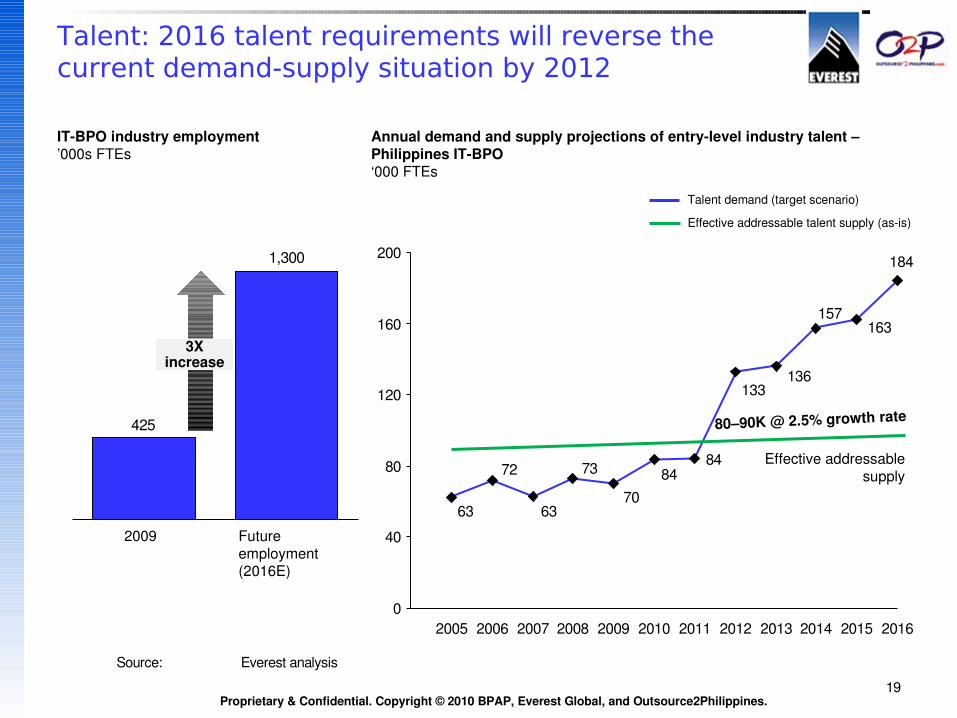
Talent: 2016 talent requirements will reverse the current demand-supply situation by 2012
84
184
163
63
72
63
73
7084
133136
157
0
40
80
120
160
200
2005 2006 2007 2008 2009 2010 2011 2012 2013 2014 2015 2016
80–90K @ 2.5% growth rate
Effective addressable supply
425
1,300
2009 Future employment (2016E)
3Xincrease
ITBPO industry employment’000s FTEs
Annual demand and supply projections of entrylevel industry talent – Philippines ITBPO ‘000 FTEs
Talent demand (target scenario)
Effective addressable talent supply (asis)
Source: Everest analysis
Proprietary & Confidential. Copyright © 2010 BPAP, Everest Global, and Outsource2Philippines.20
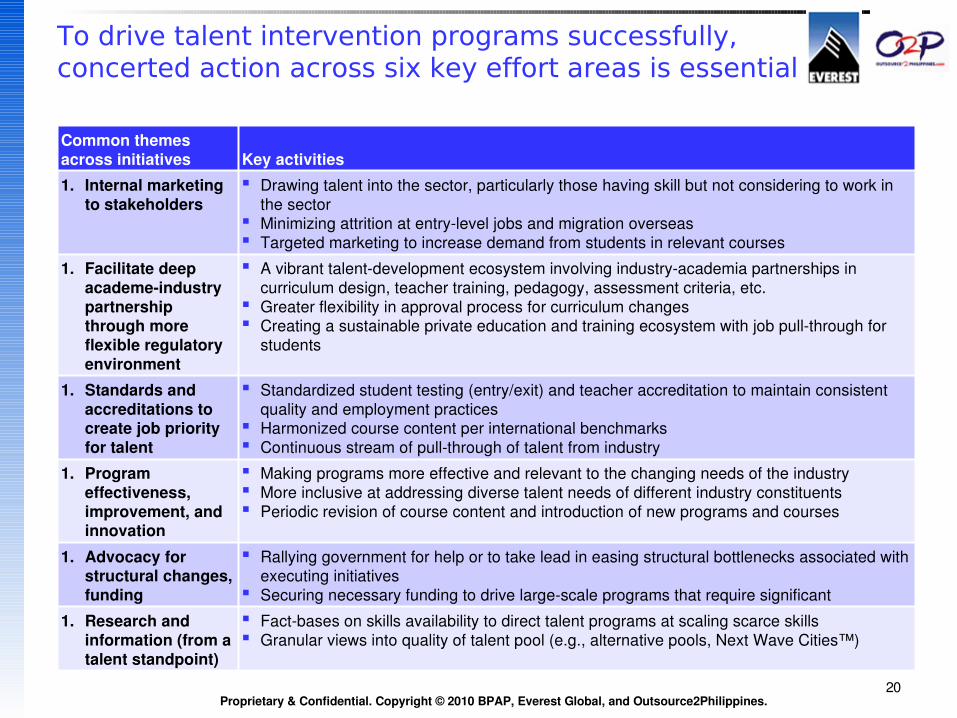
To drive talent intervention programs successfully, concerted action across six key effort areas is essential
Common themes across initiatives Key activities
1. Internal marketing to stakeholders
Drawing talent into the sector, particularly those having skill but not considering to work in the sector
Minimizing attrition at entrylevel jobs and migration overseas Targeted marketing to increase demand from students in relevant courses
1. Facilitate deep academeindustry partnership through more flexible regulatory environment
A vibrant talentdevelopment ecosystem involving industryacademia partnerships in curriculum design, teacher training, pedagogy, assessment criteria, etc.
Greater flexibility in approval process for curriculum changes Creating a sustainable private education and training ecosystem with job pullthrough for
students
1. Standards and accreditations to create job priority for talent
Standardized student testing (entry/exit) and teacher accreditation to maintain consistent quality and employment practices
Harmonized course content per international benchmarks Continuous stream of pullthrough of talent from industry
1. Program effectiveness, improvement, and innovation
Making programs more effective and relevant to the changing needs of the industry More inclusive at addressing diverse talent needs of different industry constituents Periodic revision of course content and introduction of new programs and courses
1. Advocacy for structural changes, funding
Rallying government for help or to take lead in easing structural bottlenecks associated with executing initiatives
Securing necessary funding to drive largescale programs that require significant investment 1. Research and
information (from a talent standpoint)
Factbases on skills availability to direct talent programs at scaling scarce skills Granular views into quality of talent pool (e.g., alternative pools, Next Wave Cities™)
Proprietary & Confidential. Copyright © 2010 BPAP, Everest Global, and Outsource2Philippines.21
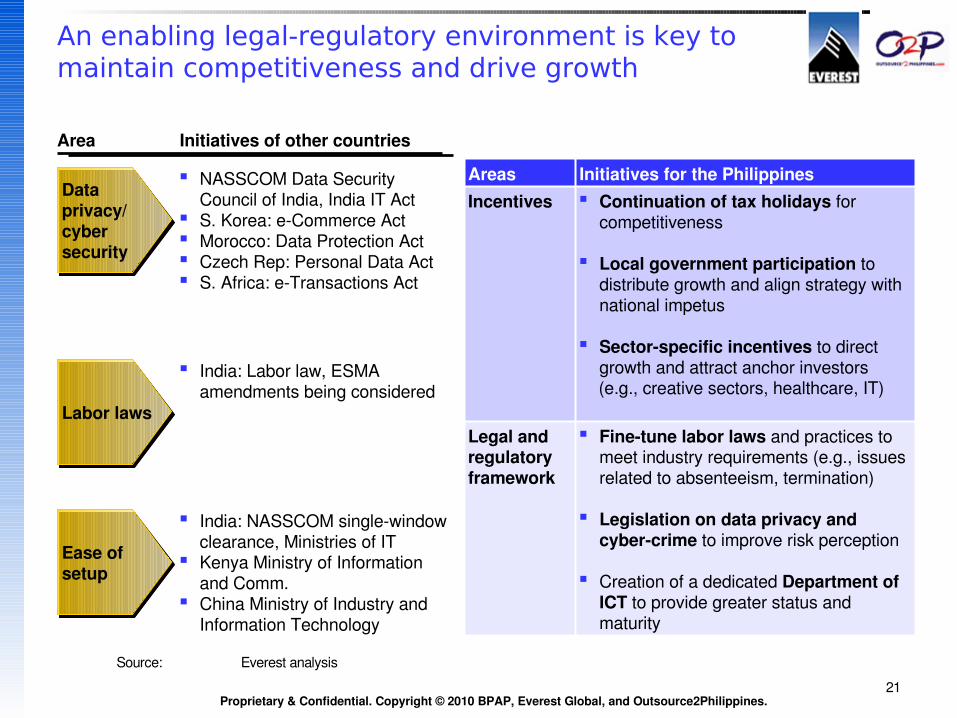
An enabling legal-regulatory environment is key to maintain competitiveness and drive growth
Initiatives of other countries
Data privacy/ cyber security
NASSCOM Data Security Council of India, India IT Act
S. Korea: eCommerce Act Morocco: Data Protection Act Czech Rep: Personal Data Act S. Africa: eTransactions Act
India: Labor law, ESMA amendments being considered
India: NASSCOM singlewindow clearance, Ministries of IT
Kenya Ministry of Information and Comm.
China Ministry of Industry and Information Technology
Labor laws
Ease of setup
Area
Source: Everest analysis
Areas Initiatives for the PhilippinesIncentives Continuation of tax holidays for
competitiveness
Local government participation to distribute growth and align strategy with national impetus
Sectorspecific incentives to direct growth and attract anchor investors
(e.g., creative sectors, healthcare, IT)
Legal and regulatory framework
Finetune labor laws and practices to meet industry requirements (e.g., issues related to absenteeism, termination)
Legislation on data privacy and cybercrime to improve risk perception
Creation of a dedicated Department of ICT to provide greater status and maturity
Proprietary & Confidential. Copyright © 2010 BPAP, Everest Global, and Outsource2Philippines.22
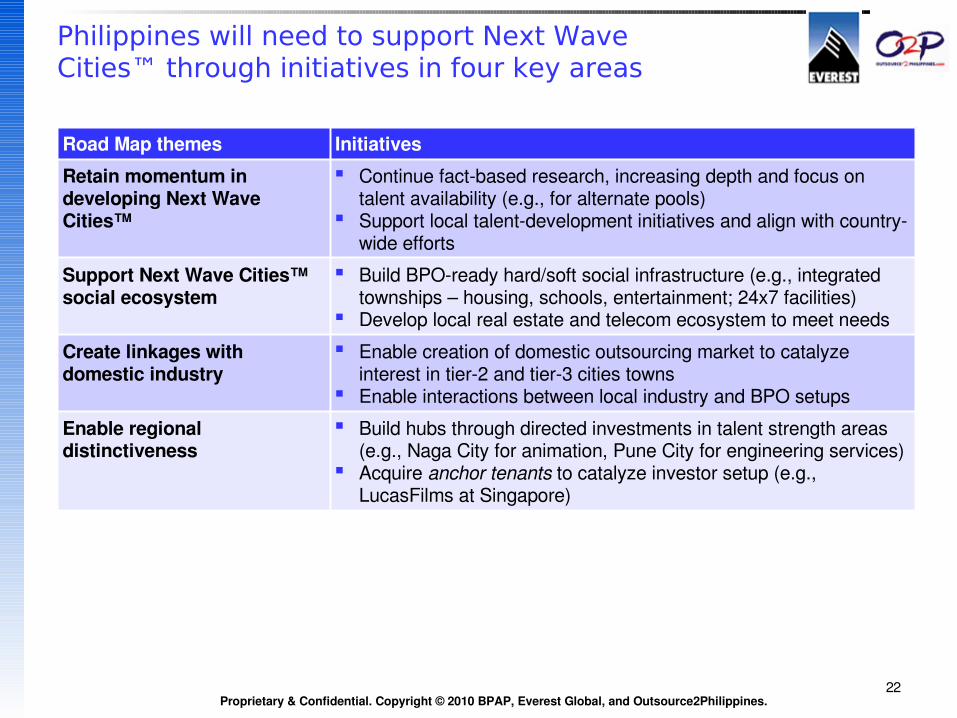
Philippines will need to support Next WaveCities™ through initiatives in four key areas
Road Map themes Initiatives
Retain momentum in developing Next Wave Cities™
Continue factbased research, increasing depth and focus on talent availability (e.g., for alternate pools)
Support local talentdevelopment initiatives and align with countrywide efforts
Support Next Wave Cities™ social ecosystem
Build BPOready hard/soft social infrastructure (e.g., integrated townships – housing, schools, entertainment; 24x7 facilities)
Develop local real estate and telecom ecosystem to meet needs
Create linkages with domestic industry
Enable creation of domestic outsourcing market to catalyze interest in tier2 and tier3 cities towns
Enable interactions between local industry and BPO setups
Enable regional distinctiveness
Build hubs through directed investments in talent strength areas (e.g., Naga City for animation, Pune City for engineering services)
Acquire anchor tenants to catalyze investor setup (e.g., LucasFilms at Singapore)
Proprietary & Confidential. Copyright © 2010 BPAP, Everest Global, and Outsource2Philippines.23
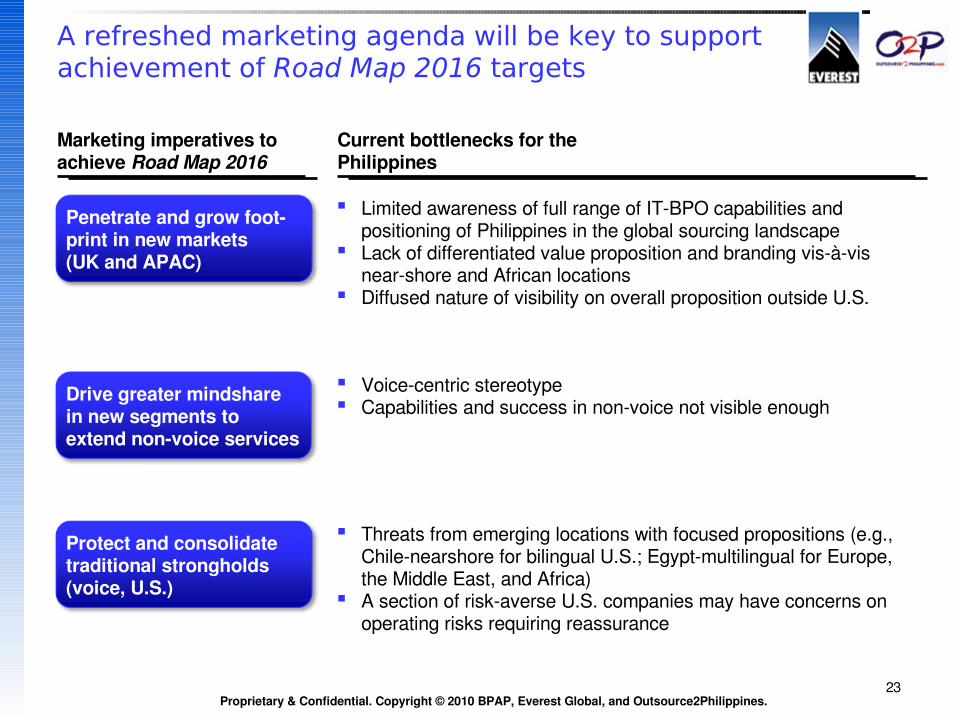
A refreshed marketing agenda will be key to support achievement of Road Map 2016 targets
Marketing imperatives to achieve Road Map 2016
Current bottlenecks for the Philippines
Penetrate and grow footprint in new markets (UK and APAC)
Limited awareness of full range of ITBPO capabilities and positioning of Philippines in the global sourcing landscape
Lack of differentiated value proposition and branding visàvis nearshore and African locations
Diffused nature of visibility on overall proposition outside U.S.
Voicecentric stereotype Capabilities and success in nonvoice not visible enough
Drive greater mindshare in new segments to extend nonvoice services
Protect and consolidate traditional strongholds (voice, U.S.)
Threats from emerging locations with focused propositions (e.g., Chilenearshore for bilingual U.S.; Egyptmultilingual for Europe, the Middle East, and Africa)
A section of riskaverse U.S. companies may have concerns on operating risks requiring reassurance
Proprietary & Confidential. Copyright © 2010 BPAP, Everest Global, and Outsource2Philippines.24
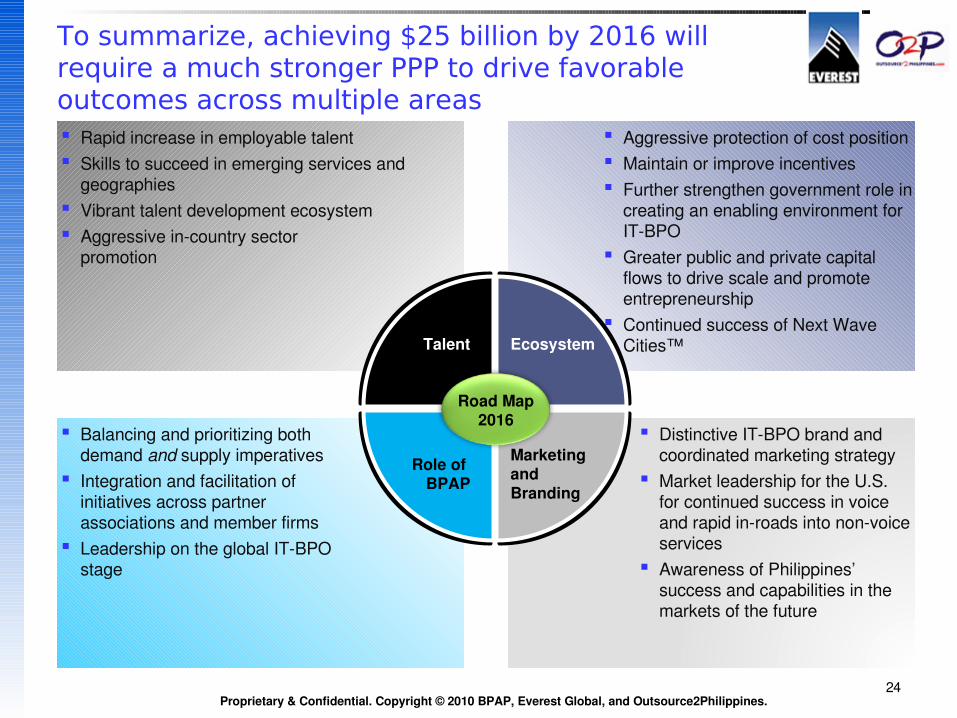
To summarize, achieving $25 billion by 2016 will require a much stronger PPP to drive favorable outcomes across multiple areas Rapid increase in employable talent Skills to succeed in emerging services and
geographies Vibrant talent development ecosystem Aggressive incountry sector
promotion
Balancing and prioritizing both demand and supply imperatives
Integration and facilitation of initiatives across partner associations and member firms
Leadership on the global ITBPO stage
Aggressive protection of cost position Maintain or improve incentives Further strengthen government role in
creating an enabling environment for ITBPO
Greater public and private capital flows to drive scale and promote entrepreneurship
Continued success of Next Wave Cities™
Road Map2016
Distinctive ITBPO brand and coordinated marketing strategy
Market leadership for the U.S. for continued success in voice and rapid inroads into nonvoice services
Awareness of Philippines’ success and capabilities in the markets of the future
Role of BPAP
Ecosystem
Marketing and Branding
Talent
Proprietary & Confidential. Copyright © 2010 BPAP, Everest Global, and Outsource2Philippines.25
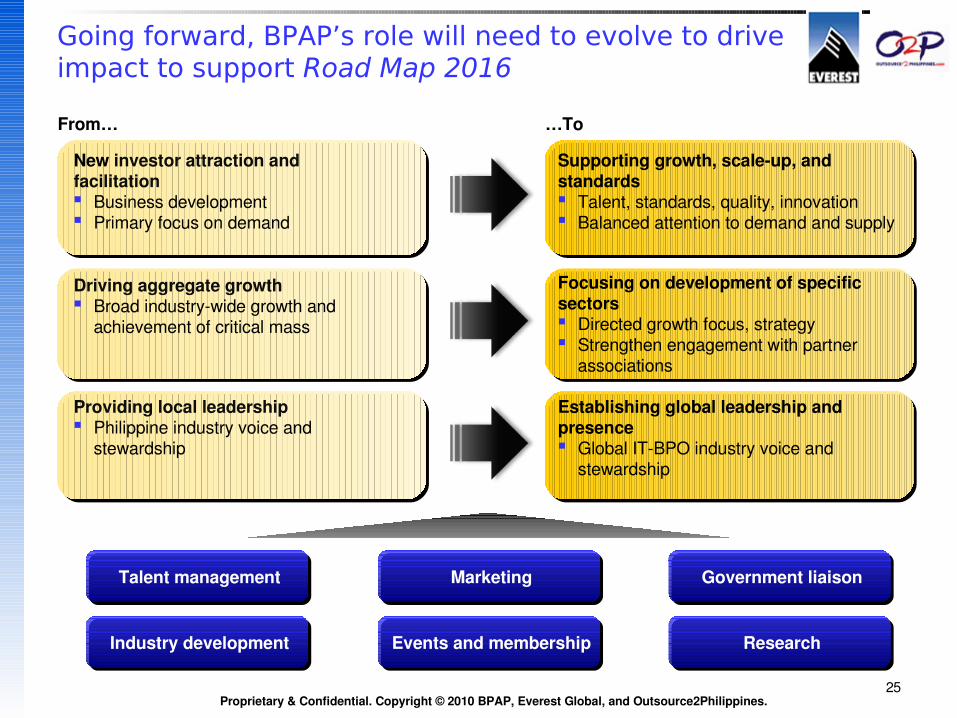
Going forward, BPAP’s role will need to evolve to drive impact to support Road Map 2016
ResearchEvents and membershipIndustry development
Marketing Government liaisonTalent management
From… …To
New investor attraction and facilitation Business development Primary focus on demand
Supporting growth, scaleup, and standards Talent, standards, quality, innovation Balanced attention to demand and supply
Driving aggregate growth Broad industrywide growth and
achievement of critical mass
Focusing on development of specific sectors Directed growth focus, strategy Strengthen engagement with partner
associations
Providing local leadership Philippine industry voice and
stewardship
Establishing global leadership and presence Global ITBPO industry voice and
stewardship