Philippine Forest Ecosystems and Climate Change: …8168/n11._philippine_.pdf · Philippine Forest...
15
Annals of Tropical Research 25(2): 37-51 (2003) Philippine Forest Ecosystems and Climate Change: Carbon stocks, Rate of Sequestration and the Kyoto Protocol Rodel D. Lasco and Florencia B. Pulhin Environmental Forestry Programme, College of Forestry and Natural Resources, University of the Philippines at Los Baños, Laguna, Philippines ABSTRACT Tropical forests have a valuable role in relation to climate change, being a source and sink of carbon. This paper reviews the state of knowledge on carbon stocks and rate of sequestration of various forest ecosystems in the Philippines. Carbon density ranges widely from less than 5 t/ha to more than 200 t/ha in the following order: old growth forests > secondary forest > mossy forest > mangrove forest > pine forest > tree plantation > agroforestry farm > brushlands > grasslands. Carbon sequestration ranges from less than 1 t/ha/yr in natural forests to more than 15 t/ha/yr in some tree plantations. Land-use change and forestry make an important contribution in the national emissions and sinks. It is estimated that Philippine forest lands are a net sink of greenhouse gasses (GHG) absorbing 107 Mt CO 2 equivalent in 1998, about equal to the total Philippine GHG emissions. The clean development mechanism (CDM) presents a clear opportunity for Philippine forestry, if the threats are properly addressed. Keywords: tropical forests; carbon budget; carbon sequestration; Kyoto Protocol. INTRODUCTION Climate change is one of the primary concerns of humanity today. The most recent IPCC assessment report concludes that there is strong evidence that human activities have affected the world’s climate (IPCC, 2001). The rise in global temperatures has been attributed to emission of greenhouse gasses, notably CO 2 (Schimell et al., 1996). Forest ecosystems can be sources and sinks of carbon (Watson et al., 2000). Deforestation and burning of forests releases CO 2 to the atmosphere. Indeed, land-use change and forestry (LUCF) is responsible for about 25% of all greenhouse emissions. However, forest ecosystems could also help reduce greenhouse gas concentrations by absorbing carbon from the atmosphere through the process of photosynthesis. Of all the world’s forests, tropical forests have the greatest potential to sequester carbon primarily through
-
Upload
doankhuong -
Category
Documents
-
view
223 -
download
0
Transcript of Philippine Forest Ecosystems and Climate Change: …8168/n11._philippine_.pdf · Philippine Forest...

Annals of Tropical Research 25(2): 37-51 (2003)
Philippine Forest Ecosystems and Climate Change: Carbon stocks, Rate of Sequestration and the
Kyoto Protocol
Rodel D. Lasco and Florencia B. Pulhin
Environmental Forestry Programme, College of Forestry and Natural Resources, University of the Philippines at Los Baños, Laguna, Philippines
ABSTRACT
Tropical forests have a valuable role in relation to climate change, being a source and sink of carbon. This paper reviews the state of knowledge on carbon stocks and rate of sequestration of various forest ecosystems in the Philippines. Carbon density ranges widely from less than 5 t/ha to more than 200 t/ha in the following order: old growth forests > secondary forest > mossy forest > mangrove forest > pine forest > tree plantation > agroforestry farm > brushlands > grasslands. Carbon sequestration ranges from less than 1 t/ha/yr in natural forests to more than 15 t/ha/yr in some tree plantations. Land-use change and forestry make an important contribution in the national emissions and sinks. It is estimated that Philippine forest lands are a net sink of greenhouse gasses (GHG) absorbing 107 Mt CO2 equivalent in 1998, about equal to the total Philippine GHG emissions. The clean development mechanism (CDM) presents a clear opportunity for Philippine forestry, if the threats are properly addressed. Keywords: tropical forests; carbon budget; carbon sequestration; Kyoto Protocol. INTRODUCTION
Climate change is one of the primary concerns of humanity today. The most recent IPCC assessment report concludes that there is strong evidence that human activities have affected the world’s climate (IPCC, 2001). The rise in global temperatures has been attributed to emission of greenhouse gasses, notably CO2 (Schimell et al., 1996). Forest ecosystems can be sources and sinks of carbon (Watson et al., 2000). Deforestation and burning of forests releases CO2 to the atmosphere. Indeed, land-use change and forestry (LUCF) is responsible for about 25% of all greenhouse emissions. However, forest ecosystems could also help reduce greenhouse gas concentrations by absorbing carbon from the atmosphere through the process of photosynthesis. Of all the world’s forests, tropical forests have the greatest potential to sequester carbon primarily through

LASCO and PULHIN 38
reforestation, agroforestry and conservation of existing forests (Brown et al., 1996).
Philippine forest ecosystems have likewise been a source and sink of carbon. From the 1500s to the modern era, it is estimated that deforestation has contributed 3.7 Gt C to the atmosphere (Lasco, 1998). Of this amount, 70% (2.6 Gt) was released this century alone. However, present land-use cover also absorbs carbon through regenerating forests and planted trees. The vast areas of degraded land in the Philippines in fact offer great potential for carbon sequestration through rehabilitation activities such as reforestation and agroforestry.
In the last few years, there has been a great increase in research activities on the role of Philippine forest ecosystems in climate change. In this paper, the current state of knowledge of the carbon budgets of Philippine forest ecosystems is reviewed, with special focus on carbon stocks and rate of sequestration. Future research directions that will further enhance understanding of the role of Philippine forests in climate change are then examined. CARBON STOCKS AND SEQUESTRATION OF FOREST ECOSYSTEMS IN THE PHILIPPINES
Research on the carbon stocks and rate of sequestration of Philippine forests is relatively new, having begun only about four years ago. Initial estimates of carbon stocks and sequestration were mainly based on secondary information and expert judgment. Recently, there has been a progressive accumulation of new information based on field studies, the findings of which are synthesized here. Carbon Stocks of Philippine Forest Ecosystems
The Philippines has a total of about 16 M ha of ‘forest lands’. These do not necessarily contain forests; rather, they are lands that are under the control of the state and which are ideally under forest cover. In reality, actual land cover ranges from natural primary forests to degraded grassland areas (Table 1). A number of recent research studies have attempted to quantify the carbon stocks of each of these land cover types.
The remaining natural forest areas (5.4 M ha) consist mainly of primary dipterocarp forests, secondary forests, mossy forests, pine forests and mangrove forests. Secondary forests (2.7 M ha) are the main source of logs and timber because they are the only natural forests where logging is allowed. The other forest types have been protected since 1992 under the National Integrated Protected Area System (NIPAS). However, most of these areas are protected only on paper and remain open access.
Primary dipterocarp forests cover 0.8 M ha. They are the richest terrestrial biodiversity resource of the country. Limited data are available on the carbon stocks of these forests, primarily because most of them are located in highly inaccessible areas. In addition, it is sometimes difficult to distinguish between

Philippine forest ecosystems and climate change 39
primary and secondary forests since historical records are not always available. The IPCC default values for closed-canopy forests in the Philippines is equivalent to 165-260 tC/ha based on 50% carbon content (Houghton et al., 1997). There are limited data available on carbon stocks of pine, mossy and mangrove forests (Table 2). As expected, they have generally lower carbon stocks than dipterocarp forests (90-184 tC/ha). Table 1. Area of forest cover in the Philippines (1000ha); total area = 15.9 M ha
Forest type Area (1000 ha) Old growth 805 Mossy 1040 Pine 228 Submarginal 475 Mangrove 112 Secondary forest 2731 Brushlands 2232 Tree Plantation 600 Grasslands 1800 Agroforestry 5859
Table 2. Above-ground biomass and carbon density of forest land cover in the Philippines
Land Cover
Age (yrs)
Carbon content
(%)
Biomass (t/ha)
Carbon (t/ha)
Location
Source of data
A. Protection Forests 1. Old growth
50.0
370-520
165-260
IPCC default (Houghton et al., 1997)
2. Mossy 45.0 408.5 183.8 Makiling Lasco et al., 2000 3. Pine 48.8 184.6 90.1 Baguio Lasco et al., 2000 4. Submarginal 0.0 5. Mangrove 44.0 401.8 176.8 Quezon Lasco et al., 2000 B. Secondary Forest 45.4 672.8 305.5 Makiling Lasco et al., 2000 45.0 262.0 117.9 Mindanao Kawahara et al., 1981 44.0 547.0 240.7 Makiling Lasco et al., 2001a 44.7 446.0 199.4 Leyte Lasco et al., 1999 Mean 44.6 465.9 207.9 C. Brushlands 45.4 63.8 29.0 Leyte Lasco et al., 1999

LASCO and PULHIN 40
D. Tree Plantation Mahogany 44.0 41.6 590.40 245.6 Makiling Racelis, 2000 Tree legumes 43.1 530.70 228.7 Makiling Lasco et al., 2000 Dipterocarps 66 45.4 541.4 245.8 Makiling Racelis, 2000 A. auriculiformis 16.0 46.6 164.83 76.8 N. Ecija Lasco et al., 2000 Teak 45.7 74.82 34.2 N. Ecija Lasco et al., 2000 Mahogany 45.0 17.00 7.7 Leyte Lasco et al., 1999 Gmelina 45.0 124.00 55.8 Leyte Lasco et al., 1999 A. mangium 45.0 195.80 88.1 Leyte Lasco et al., 1999 Gmelina 7.0 45.0 120.70 54.3 Mindanao Kawahara et al., 1981 Gmelina 9.0 45.0 85.70 38.6 Mindanao Kawahara et al., 1981 Gmelina 9.0 45.0 87.40 39.3 Mindanao Kawahara et al., 1981 P. falcataria 4.0 45.0 69.50 31.3 Mindanao Kawahara et al., 1981 P. falcataria 5.0 45.0 75.60 34.0 Mindanao Kawahara et al., 1981 P. falcataria 7.0 45.0 96.40 43.4 Mindanao Kawahara et al., 1981 P. falcataria 7.0 45.0 8.10 3.6 Mindanao Kawahara et al., 1981 P. falcataria 9.0 45.0 108.20 48.7 Mindanao Kawahara et al., 1981 P. falcataria 9.0 45.0 28.70 12.9 Mindanao Kawahara et al., 1981 Mahogany 16.0 45.0 261.00 117.5 Mindanao Kawahara et al., 1981 A. auriculiformis* 6 45.0 7.39 3.3 N. Ecija Lasco, 2001 A. auriculiformis 2* 6 45.0 9.97 4.5 N. Ecija Sakurai et al., 1994 A. auriculiformis 3* 9 45.0 42.51 19.1 N. Ecija A. auriculiformis 4* 9 45.0 32 14.4 N. Ecija A. auriculiformis 5* 9 45.0 46.11 20.7 N. Ecija A. auriculiformis 6* 9 45.0 39.73 17.9 N. Ecija Tectona grandis 1* 13 45.0 8.7 3.9 N. Ecija T. grandis 2* 13 45.0 22.3 10.0 N. Ecija Gmelina arborea 1* 6 45.0 17.22 7.7 N. Ecija G. arborea 2* 6 45.0 7.71 3.5 N. Ecija Pinus kesiya* 13 45.0 107.83 48.5 N. Ecija P. kesiya + broadleaf spp.*
13
45.0
83.24 37.5
N. Ecija
Acacia mangium* 4.0 45.0 56.9 25.6 Leyte Buante 1997; Lasco 2001 Gmelina arborea* 4.0 45.0 70.2 31.6 Leyte Buante 1997; Lasco 2001 A. auriculiformis* 4.0 45.0 63.5 28.6 Leyte Buante 1997; Lasco 2001 Acacia neriifolia* 4.0 45.0 87.13 39.2 Iloilo Lasco 2001 A. holosericea* 4.0 45.0 34.4 15.5 Iloilo Lachica-Lustica 1997 A. crassicarpa* 4.0 45.0 155.79 70.1 Iloilo A. aulacocarpa* 4.0 45.0 56.36 25.4 Iloilo

Philippine forest ecosystems and climate change 41
Leucaena diversifolia*
4.0
45.0
0.66 0.3
Iloilo
Casuarina cuminghiana*
4.0
45.0
3.21 1.4
Iloilo
C. equisitifolia* 4.0 45.0 15.55 7.0 Iloilo Eucalyptus citrodora*
4.0
45.0
52.41 23.6
Iloilo
E. cloeziana* 4.0 45.0 48.27 21.7 Iloilo E. pellita* 4.0 45.0 33.99 15.3 Iloilo E. tereticornis* 4.0 45.0 49.87 22.4 Iloilo Mahogany 80.0 45.0 564.92 254.2 Makiling Lasco 2001 Mahogany 80.0 45.0 634.99 285.7 Makiling Sakurai et al., 1994 Dipterocarps 80.0 45.0 536.12 241.3 Makiling Dipterocarps 80.0 45.0 279.14 125.6 Makiling Mean 132.3 59.0 E. Grasslands I. cylindrica 44.5 20.1 8.9 Leyte Lasco et al. 1999 S. spontaneum 41.3 36.9 15.2 Leyte Lasco et al., 1999 Mean 42.9 28.5 12.1 F. Agroforestry Fallow system* 45.0 32.0 14.4 Cebu Lasco and Suson, 1989 Coconut+coffee 44.0 99.2 43.6 Makiling Zamora, 1999 Narra+cacao 44.0 191.6 84.3 Makiling Zamora, 1999 Alley cropping 45.0 3.8 1.7 Makiling Lasco et al., 2001c Gmelina+cacao 44.0 257.7 113.4 Makiling Lasco et al., 2001c Home garden 45.0 32.7 14.7 Isabela Castro, 2000 Mean 102.8 45.4 Source: FMB, 1998 except tree plantations, grasslands and agroforestry which are estimates from various literature sources. Note: Changes in soil carbon are not included.
Carbon content assumed to be 45% for all data from Kawahara et al. 1981. * Carbon content assumed to be 45%.
Secondary forests are the most dynamic and economically important forest
types in the Philippines (Lasco et al., 2001b). Aside from being the main source of wood, they are also under severe pressure from loggers and shifting cultivators. Relatively reliable information is now available for secondary forests, with carbon stocks ranging from 118 to 306 tC/ha.
To rehabilitate denuded grassland areas, the government is promoting the establishment of tree plantations by private entities, as well as permanent reforestation activities. Usually fast growing tree species such as Gmelina

LASCO and PULHIN 42
arborea, Acacia mangium, and Pterocarpus indicus are planted. The exact area of rehabilitated uplands is not known, but has been estimated at 600,000 ha (Lasco and Pulhin, 2000). Harvesting is allowed in tree plantations by private individuals and groups but not in government reforestation projects. Numerous data are now available on the carbon density of tree plantations, the mean estimate being 59 tC/ha.
Agroforestry is widely promoted to help stabilize upland farms in sloping areas. There is a great variety of agroforestry systems ranging from alley cropping to multistory systems. Consequently, there is also a wide range of carbon stocks found in these systems (1.7-113 tC/ha) with some agroforestry farms such as alley cropping having little biomass carbon.
Brushlands are those forest areas that have been severely degraded so that there is less than 10% cover. Little information is available on carbon stocks in these areas. Finally, grasslands cover a substantial area of the country as a result of severe degradation from farming and grazing. They have a much lower biomass carbon stocks (estimated at 29 tC/ha).
As an overall estimate, the carbon content of biomass in the Philippines ranges from 41% to 49% with an average close to 45%. This is a little lower than the IPCC default value of 50% (Houghton et al., 1997). Rate of Carbon Sequestration
The rate of carbon sequestration of the various land uses varies from 0.9 tC/ha/yr for natural forests to 17.5 tC/ha/yr for fast growing tree plantations (Table 3). While some information has been gathered in recent years, there are still limited data on carbon sequestration compared to carbon stocks. This is because carbon stocks can be easily calculated using allometric equations (mainly from Brown, 1997), but in contrast, biomass change and carbon sequestration requires long-term monitoring. Estimation may be easier in tree plantations than native forests because the year of establishment is usually known. Table 3. MAI of above-ground biomass and carbon in the Philippines
Age Biomass Carbon Location Source of data (yrs) MAI MAI Land Cover (t/ha) (t/ha) A. Protection Forests nd nd nd B. Secondary Forest nd 2.1 0.9 Leyte Lasco et al., 1999 nd 4.9 1.19 Mindanao Kawahara et al., 1981 Mean 3.5 1.1 C. Brushlands 9.5 4.3 Leyte Lasco et al., 1999

Philippine forest ecosystems and climate change 43
D. Tree Plantation Mahogany 44 14.24 6.4 Makiling Racelis, 2000 Dipterocarps 66 7.369001 3.3 Makiling Racelis, 2000 A. auriculiformis 16 9.08 4.1 N. Ecija Lasco et al., 2000 Mahogany 8.39 3.3 Leyte Lasco et al., 1999 Gmelina 18.84 8.2 Leyte Lasco et al., 1999 Gmelina 7 11.3 5.51 Mindanao Kawahara et al., 1981 Gmelina 9 10.5 4.37 Mindanao Kawahara et al., 1981 Gmelina 9 9.6 6.04 Mindanao Kawahara et al., 1981 P. falcataria 4 20.2 7.82 Mindanao Kawahara et al., 1981 P. falcataria 5 11.2 6.8 Mindanao Kawahara et al., 1981 P. falcataria 7 8.4 6.2 Mindanao Kawahara et al., 1981 P. falcataria 7 2.2 0.52 Mindanao Kawahara et al., 1981 P. falcataria 9 5.3 5.41 Mindanao Kawahara et al., 1981 P. falcataria 9 3.7 1.44 Mindanao Kawahara et al., 1981 Mahogany 16 19.6 7.33 Mindanao Kawahara et al., 1981 A. auriculiformis* 6 1.231766 0.6 N. Ecija Lasco, 2001 A. auriculiformis 2* 6 1.661289 0.7 N. Ecija Sakurai et al., 1994 A. auriculiformis 3* 9 4.723807 2.1 N. Ecija A. auriculiformis 4* 9 3.555892 1.6 N. Ecija A. auriculiformis 5* 9 5.123389 2.3 N. Ecija A. auriculiformis 6* 9 4.414571 2.0 N. Ecija Tectona grandis 1* 13 0.669576 0.3 N. Ecija T. grandis 2* 13 1.71554 0.8 N. Ecija Gmelina arborea 1* 6 2.869172 1.3 N. Ecija G. arborea 2* 6 1.285075 0.6 N. Ecija Pinus kesiya* 13 8.29455 3.7 N. Ecija P. kesiya + broadleaf spp*. 13 6.403308 2.9 N. Ecija Acacia mangium* 4 14.225 6.4 Leyte Buante, 1997Lasco 2001 Gmelina arborea* 4 17.55 7.9 Leyte Buante, 1997Lasco 2001 A. auriculiformis* 4 15.875 7.1 Leyte Buante, 1997Lasco 2001 Acacia neriifolia* 4 21.78127 9.8 Iloilo Lasco, 2001 A. holosericea* 4 8.599975 3.9 Iloilo Lachica-Lustica, 1997 A. crassicarpa* 4 38.94815 17.5 Iloilo A. aulacocarpa* 4 14.09045 6.3 Iloilo Leucaena diversifolia* 4 0.164304 0.1 Iloilo Casuarina cuminghiana* 4 0.802636 0.4 Iloilo C. equisitifolia* 4 3.886252 1.7 Iloilo

LASCO and PULHIN 44
Eucalyptus citrodora* 4 13.10143 5.9 Iloilo E. cloeziana* 4 12.06799 5.4 Iloilo E. pellita* 4 8.498015 3.8 Iloilo E. tereticornis* 4 12.46637 5.6 Iloilo Mahogany 80 7.061438 3.2 Makiling Lasco 2001 Mahogany 80 7.937386 3.6 Makiling Sakurai et al., 1994 Dipterocarps 80 6.701469 3.0 Makiling Dipterocarps 80 3.489233 1.6 Makiling Mean 9.1 4.2 E. Grasslands nd nd nd F. Agroforestry Fallow system** nd 10.6 5.3 Cebu Lasco and Suson, 1989 Source: FMB, 1998 except tree plantations, grasslands and agroforestry which are estimates from various literature sources. Note: Changes in soil carbon are not included.
Carbon content assumed to be 45% for all data from Kawahara et al., 1981. * Carbon content assumed to be 45%. ** Carbon content assumed to be 50%.
Reliance on allometric equations derived from literature from other countries
also has limitations. Biomass estimates from allometric equations seem to be higher than that from destructive sampling (Lasco et al., 2000). This is of course assuming destructive sampling is more accurate than the use of equations. Thus, one of the most urgent research needs in the future is to develop allometric equations specific to Philippine forest types. CONTRIBUTION OF LUCF TO NATIONAL GHG EMISSIONS AND SINKS
The role of forests varies depending on the situation of the specific country. To determine the contribution of landuse change and forestry (LUCF), the IPCC has developed guidelines for the national inventory of GHG emitted and absorbed by forest land (Houghton et al., 1997). This is designed to help standardize the methods of all Parties to the UNFCCC in the conduct of their GHG inventories. Key components of the guidelines are: changes in forest and other woody biomass stocks; forests and grassland conversion; and abandonment of managed lands. The activity data most commonly needed in all worksheets are those pertaining to area of forest and other land uses, growth and conversion rates, biomass stocks, carbon fraction and content, and harvests or extraction rates.
Compilation of the GHG inventory in the Philippines started as early as November 1991 (Francisco, 1997). Since then, the estimates have been
Philippine forest ecosystems and climate change 45
progressively updated in response to new methodologies as prescribed by the IPCC and the availability of new data. The most recent inventory is that for 1994 as contained in the 1999 Philippines Initial National Communication.
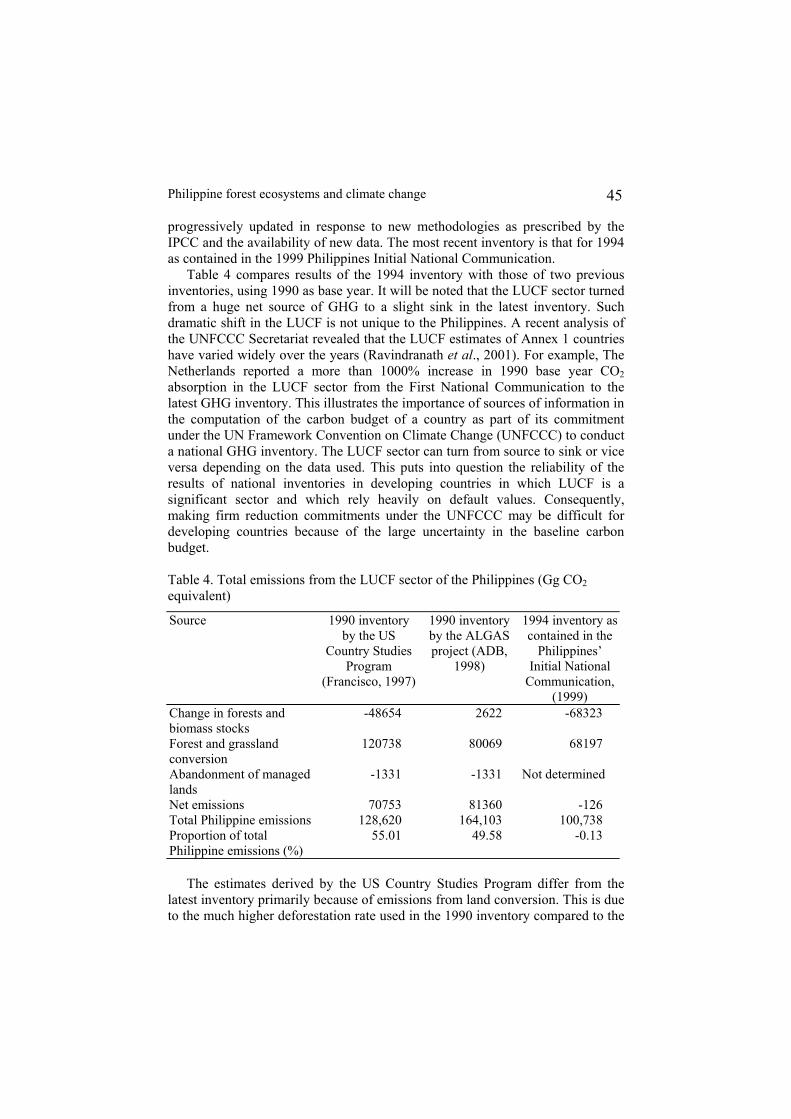
Table 4 compares results of the 1994 inventory with those of two previous inventories, using 1990 as base year. It will be noted that the LUCF sector turned from a huge net source of GHG to a slight sink in the latest inventory. Such dramatic shift in the LUCF is not unique to the Philippines. A recent analysis of the UNFCCC Secretariat revealed that the LUCF estimates of Annex 1 countries have varied widely over the years (Ravindranath et al., 2001). For example, The Netherlands reported a more than 1000% increase in 1990 base year CO2 absorption in the LUCF sector from the First National Communication to the latest GHG inventory. This illustrates the importance of sources of information in the computation of the carbon budget of a country as part of its commitment under the UN Framework Convention on Climate Change (UNFCCC) to conduct a national GHG inventory. The LUCF sector can turn from source to sink or vice versa depending on the data used. This puts into question the reliability of the results of national inventories in developing countries in which LUCF is a significant sector and which rely heavily on default values. Consequently, making firm reduction commitments under the UNFCCC may be difficult for developing countries because of the large uncertainty in the baseline carbon budget. Table 4. Total emissions from the LUCF sector of the Philippines (Gg CO2 equivalent)
Source 1990 inventory by the US
Country Studies Program
(Francisco, 1997)
1990 inventory by the ALGAS project (ADB,
1998)
1994 inventory as contained in the
Philippines’ Initial National
Communication, (1999)
Change in forests and biomass stocks
-48654 2622 -68323
Forest and grassland conversion
120738 80069 68197
Abandonment of managed lands
-1331 -1331 Not determined
Net emissions 70753 81360 -126 Total Philippine emissions 128,620 164,103 100,738 Proportion of total Philippine emissions (%)
55.01 49.58 -0.13
The estimates derived by the US Country Studies Program differ from the
latest inventory primarily because of emissions from land conversion. This is due to the much higher deforestation rate used in the 1990 inventory compared to the

LASCO and PULHIN 46
1994 inventory. The ALGAS estimate is unique in that change in biomass stocks is a net source rather than a net sink.
On the basis of the new data in Tables 2 and 3, it is possible to recalculate the GHG uptake and emissions using the 1996 IPCC Revised Guidelines, the same method used in earlier inventories. A comparison of the results reveals that the LUCF sector is a significant net sink (-107 Mt CO2 equivalent) in this calculation, which is based on 1997-98 land cover data. As indicated in Table 5, it is a much higher net sink compared to the 1994 inventory (-0.126 Mt CO2 equivalent). This finding is also consistent with, although a little lower than, the previous calculation of Lasco and Pulhin (2001) of 142 Mt CO2 equivalent. This shows that with availability of more data, it becomes possible to refine estimates of the contribution of LUCF to national GHG emission.
Total LUCF sector sequestration is almost equal to the total net GHG emission of the Philippines from all sources (101 Mt in 1994). This reveals the importance of Philippine forests in climate change mitigation, because they absorb practically all the fossil fuel emissions of the country. Table 5. Comparison of GHG emissions and sinks from the LUCF sector in the Philippines between the 1994 and 1997-1998 inventories and this study
Source CO2 equivalent (M ton), from 1994
Inventory (Philippine NC, 1999)
1997-98 Inventory
(Lasco and Pulhin, 2001)
1997-98 inventorya
Biomass growth -111 -222 -218 Harvests 42 31 27 On site and off site burning
36 23 43
Decay 33 23 40 Net Absorption -0.126 -142 -107 Note: a These values were calculated by the authors for this study. PHILIPPINE FORESTS AND THE KYOTO PROTOCOL
In 1997, during the Third Conference of Parties (COP) the Kyoto Protocol was drafted which is the first international agreement that places legally binding limits (when it is ratified) on GHG emissions from developed countries (UNFCCC, 1997). The Protocol also provides for flexible mechanisms to meet carbon reduction obligations. The most relevant to developing countries is the Clean Development Mechanism (CDM) contained in Article 12. Essentially, the CDM allows Annex 1 (developed) countries to meet their carbon reduction quota via activities in developing countries (non-Annex 1 countries). Two forestry activities are allowed under the first commitment period: reforestation and afforestation. The CDM provides a way for developing countries to be more
Philippine forest ecosystems and climate change 47
actively involved in the mitigation of GHG in the atmosphere, short of actual reduction commitments. But perhaps more importantly in the short term, developing countries stand to benefit from the CDM through investment inflow and technology transfer that will support their respective sustainable development agenda (Frumhoff et al., 1998).
The Philippines, with its wide areas of lands needing reforestation and afforestation, stands to benefit in the CDM, should it decide to participate. There are somewhere from 2 to 9 M ha of denuded and degraded upland areas that need immediate rehabilitation (Lasco and Pulhin, 2000). These areas are former tropical forests but are now mainly grasslands, brushlands and cultivated farms. At the present rate or reforestation (less than 100,000 ha/yr), it will take more than 100 years to fully rehabilitate these areas. In addition, up to 19 M people are living in the uplands, half of whom rely on some form of shifting cultivation. This situation has spawned numerous ecological and socio-economic problems: soil erosion, siltation of water bodies, flooding, extreme poverty and unrest. However, there are key issues that must be resolved if the Philippines is to realize the benefits while minimizing the negative impacts of CDM. These issues are summarized below, based on Lasco et al. (2001d). Negative environmental impacts
There are concerns that including LUCF in climate change mitigation could lead to adverse impacts to the overall environment. A commonly cited example is the possibility of converting natural tropical forests to fast-growing tree plantations to maximize carbon credits. Such a scenario however is based on a fallacy that tree plantations will give a higher carbon credit. Studies in the Philippines show that a mature tropical forest contains more carbon than a tree plantation (Table 2). In fact, simply protecting an existing natural forest is more cost-effective than establishing an artificial plantation. Nevertheless, it is essential that appropriate social and environmental criteria be used to evaluate proposed carbon credit projects to ensure that the overall environment is not harmed in the process of their implementation. The Philippines has a well-established environmental impact assessment (EIA) system which could be easily adopted for climate change projects. Property rights to forest land
Once new financing schemes are available, competition on who will control forest lands may intensify. In the Philippines, many upland areas are being claimed by indigenous peoples. Such claims may be ignored in favor of establishment of climate change forests. Thus, there should be adequate provisions in the guidelines that the rights of local users should be respected. In many developing countries this is easier said than done. However, through adequate public consultation and participation in the planning and implementation of projects these issues could be adequately addressed. The EIA system is the main mechanism for facilitating this in the Philippines. Existing

LASCO and PULHIN 48
policies and procedures embodied in the Indigenous People’s Rights Act (IPRA) should also be able to ensure that the rights of the IPs are fully safeguarded. Establishing a baseline or reference
A prerequisite to a credible offset project under the CDM is accurately estimating the situation without the project or the ‘business-as-usual’ scenario which will serve as the basis for claiming credit of any project or activity. In a developing country such as the Philippines, the perennial lack of data in specific sites could hamper baseline case determination. In this situation, regional analysis which is an accepted tool for establishing a benchmark for an area using available data from another but similar area can be used. Another option is to disallow projects where the baseline is not clear and concentrate on those projects where baselines could be easily measured and verified. Additionality of carbon sequestration
Carbon offset projects must be able to demonstrate value adding (either by preventing C emission or by C sequestration) over and above what would be expected under the baseline scenario. If the baseline case can be accurately measured, it would normally follow that the additional benefits could also be easily shown. Leakage in benefits
Forestry projects are suspected by some to be prone to ‘leakage’, that is, C mitigation benefits could be negated by indirect effects occurring outside project boundaries. For example, a project that protects a particular tract of forest land could lead to increased cutting in adjacent lands to compensate for the loss of harvest in the protected area. In the Philippines, potential for leakage will vary from project to project. For example, the potential leakage will be least in grassland rehabilitation by reforestation because the baseline C storage is almost zero as a result of constant burning. Permanence of reductions
Under energy projects, switching from a coal-fired power plant to a geothermal plant will mean that the carbon in the unused coal deposit will be permanently conserved. In contrast, it is contended that in forestry projects, the carbon conserved or sequestered could more easily be released, say by burning or harvesting. There are several ways by which this issue can be addressed. At the field level, forest protection measures should be integrated in project design and implementation. In the context of the Kyoto Protocol, the use of temporary CER (Certified Emission Reduction) credits have been proposed. Measurement accuracy
Compared to energy projects, it has also been questioned whether benefits from forestry projects could be accurately determined. The Second Assessment

Philippine forest ecosystems and climate change 49
Report of the IPCC (Brown et al., 1996) stated that there is a high level of confidence on measurements of net C conserved or sequestered under site-level conditions. CONCLUDING COMMENTS
Tropical forest lands in the Philippines have a wide range of carbon stocks. The highest stocks can be found in primary and secondary dipterocarp forests (more than 250 tC/ha) while the lowest are in grassland areas (< 50 tC/ha). The MAI of carbon also varies widely with the highest increment found in tree plantations of fast growing species (close to 17.5 tC/ha/yr) and the lowest in natural forests (0.9 tC/ha/yr). The national GHG inventory calculation based on the IPCC methodology shows that forest lands are a net sink of carbon (-107 Mt). This is almost equivalent to the total Philippine GHG emissions from all sources.
The Kyoto Protocol presents an opportunity for forestry and land-use projects that could mitigate climate change. However, several key issues have to be addressed before the carbon mitigation and sustainable development potential of these projects can be attained. These include, among others, potential negative environmental impacts, baseline and additionality, leakage and permanence. REFERENCES ADB. 1998. Asia Least-Cost Greenhouse Gas Abatement Strategy: Philippines.
Asian Development Bank, Manila, Philippines. BROWN, S. 1997. Estimating Biomass and Biomass Change of Tropical Forest: A
Primer. Forestry paper 134. FAO, Rome. BROWN, S., SATHAYE, J., Cannel, M. and P. KAUPPI. 1996. Management of
forests for mitigation of greenhouse gas emissions, Chapter 24. In: Climate Change 1995: Impacts, Adaptations, and Mitigation of Climate Change: Scientific-Technical Analyses (R.T. Watson, M.C. Zinyowera, and R.H. Moss, eds.). Contribution of Working Group II to the Second Assessment Report of the Intergovernmental Panel on Climate Change, Cambridge University Press. pp. 775-797.
BUANTE, C.R. 1997. Biomass production of Acacia mangium Willd., Gmelina arborea Roxb., and Acacia auriculiformis A. Cunn. Ex Benth. as fuelwood species in Leyte. In: Developments in Agroforestry Research. Book Series No. 160/1997. Philippine Council for Agriculture, Forestry and Natural Resources Research and Development, Los Baños, Laguna, Philippines. pp 224- 246.
CASTRO. 2000. Carbon Storage Potential of an Agroforestry Farm in Bayombong, Nueva Viscaya, Philippines. Unpublished MSc thesis. University of the Philippines at Los Baños. College, Laguna, Philippines.
FRANCISCO, R. 1997. Greenhouse Gas Sources and Sinks from Philipine Agriculture, Land Use and Forestry. Paper presented at the Synthesis Workshop on Greenhouse Gasses, Aerosols, and Land Use and Cover Change in Southeast Asia. 15-19 November 1997. Taipeh, Taiwan.

LASCO and PULHIN 50
FRUMHOFF, P.C., GOETZE, D.C. and J.J. HARDNER. 1998. Linking Solutions to Climate Change and Biodiversity Loss Through the Kyoto Protocol’s Clean Development Mechanism. Union of Concerned Scientists, Cambridge, MA. 14pp.
HOUGHTON, J.T., MEIRA FILHO, L.G., LIM, B., TREANTON, K., MAMATY, I., BONDUKI, Y., GRIGGS, D.J. and B.A. CALLANDER, eds. 1997. Greenhouse Gas Inventory Workbook. Intergovernmental Panel on Climate Change (IPCC), Organization for Economic Co-operation and Development (OECD) and the International Energy Agency (IEA), Paris, France. pp. 5.1-5.54.
IPCC. 2001. Climate Change 2001: Impacts, Adaptation and Vulnerability. Summary for Policy Makers and Technical Summary of the Working Group II Report. World Meteorological Organization (WMO), Geneva, Switzerland and UN Environmental Programme (UNEP), Nairobi, Kenya. 89pp.
KAWAHARA, T., KANAZAWA, Y. and S. SAKURAI. 1981. Biomass and net production of man-made forests in the Philippines. Journal of Japan Forestry Society. 63(9): 320-327.
LACHICA-LUSTICA, A. 1997. Trial planting of introduced reforestation species in Dumarao, Capiz. In: Developments in Agroforestry Research. Book Series No. 160/1997. Philippine Council for Agriculture, Forestry and Natural Resources Research and Development, Los Banos, Laguna, Philippines. pp. 270-281.
LASCO, R.D. 1998. Management of tropical forests in the Philippines: Implications to global warming. World Resource Review. 10(3): 410-418.
LASCO, R.D. 2001. Carbon Budgets of Forest Ecosystems in Southeast Asia Following Disturbance and Restoration. Review paper prepared for the GCTE-APN project, Land Use Change and the Terrestrial Carbon Cycle in Asia. February 2001. Los Baños, Laguna, Philippines.
LASCO, R.D., CRUZ, R.V.O. and F.B. PULHIN. 2001d. The Kyoto Protocol: Opportunities and threats to Philippine forestry. Journal of Environmental Science and Management. 3: 53-63.
LASCO, R.D., GUILLERMO, I.Q., CRUZ, R.V.O., BANTAYAN, N.C. and F.B. PULHIN. 2001a. In press. Carbon stocks assessment of a tropical secondary forest in Mt. Makiling, Philippines. Journal of Tropical Forest Science.
LASCO, R.D., LALES, J.S., GUILLERMO, I.Q., and T. ARNOUEVO. 1999. CO2 Absorption Study of the Leyte Geothermal Forest Reserve. Final Report of a study conducted for the Philippine National Oil Company. UPLB Foundation Inc. Los Baños, Laguna, Philippines.
LASCO, R.D. and F.B. PULHIN. 2000. Forest land-use change in the Philippines and climate change mitigation. Mitigation and Adaptation to Global Change Journal. 5: 81-97.
LASCO, R.D. and F.B. PULHIN. 2001. LUCF in the Philippines: CC impacts and mitigation potential. In: Disturbing Climate (J.T. Villarin, ed.). Manila Observatory, Quezon City, Philippines.
LASCO, R.D., PULHIN, F.B., VISCO, R.G., RACELIS, D.A., GUILLERMO, I.Q., and R.F. SALES. 2000. Carbon Stocks Assessment of Philippine Forest
Philippine forest ecosystems and climate change 51
Ecosystems. Paper presented at the Science-Policy Workshop on Terrestrial Carbon Assessment for Possible Carbon Trading. 28-20 February 2000. Bogor, Indonesia.
LASCO, R.D., SALES, R.F., ESTRELLA, R., SAPLACO, S.R., CASTILLO, A.S.A., CRUZ, R.V.O., and F.B. PULHIN. 2001c. Carbon stocks assessment of two agroforestry systems in the Makiling forest reserve, Philippines. Philippine Agricultural Scientist. 84(4): 401-407.
LASCO, R.D. and P.D. SUSON. 1999. A Leucaena Leucocephala - based indigenous fallow system in central Philippines: the Naalad system. International Tree Crops Journal. 10(2): 161-174.
LASCO, R.D., VISCO, R.G. and J.M. PULHIN. 2001b. Formation and transformation of secondary forests in the Philippines. Journal of Tropical Forest Science. 13: 652-670.
PHILIPPINES’ INITIAL NATIONAL COMMUNICATION. 1999. The Philippines’ Initial National Communication on Climate Change. Manila, Philippines. 91pp.
RACELIS. 2000. Carbon Stock Assessment of Large-leaf Mahogany (Sweitenia macrophylla King) and Dipterocarp Plantations in the Mt. Makiling Forest Reserve. Unpublished MSc thesis. University of the Philippines at Los Baños. College, Laguna, Philippines.
RAVINDRANATH, LASCO, R.D. and SUDHA. 2001. Assessment of GHG inventories from LUCF sector of Annex 1 countries. Mitigation and Adaptation Strategies for Global Change. 6: 25-46.
SAKURAI, S., RAGIL, R.S.B. and L.U. DE LA CRUZ. 1994. Tree growth and productivity in degraded forest land. In: Rehabilitation of Degraded Lands in the Tropics. JIRCAS International Symposium Series No. 1, Japan International Research Center for Agricultural Sciences (JIRCAS), Tsukuba, Japan. pp. 64- 71.
SCHIMMEL, D., ENTING, I.G., HEIMANN, M., WIGLEY, T.M.L., RAYNEUD, D., ALVES, D. and U. SEIGENTHLER. 1996. CO2 and the carbon cycle. In: Climate Change 1994: Radiative Forcing of Climate Change and an Evaluation of the IPCC IS92 Emision Scenarios (J.T. Houghton, L.G. Meira Filho, J. Bruce, H. Lee, B.A. Callander, E. Haites, N. Harris, and K. Maskell, eds.). Published for the IPCC, Cambridge University Press. pp. 35-71.
UNFCCC. 1997. The Kyoto Protocol. UNFCCC, Geneva, Switzerland. WATSON, R.T., NOBLE, I.R., BOLIN, B., RAVINDRANATH, N.H., VERADO,
D.J. and D.J. DOKKEN, eds. 2000. Land Use, Land-use Change, and Forestry. Published for the Intergovermental Panel for Climate Change, Cambridge University Press.
ZAMORA, D. 1999. Carbon Dioxide (CO2) Storage Potential of Multistorey Agroforestry Systems in Mt. Makiling. Unpublished MSc Thesis. University of the Philippines Los Baños College, Laguna, Philippines.