Refrigerator Repair Mission Viejo - Appliance Repair Mission Viejo (949) 558-2157

Philipp Rode, Christian Keim, Guido Robazza, Pablo Viejo, James Schofield
Cities and energy: urban morphology and residential heat-energy demand Article (Accepted version) (Refereed)
Original citation: Rode, Philipp, Keim, Christian, Robazza, Guido, Viejo, Pablo and Schofield, James (2014) Cities and energy: urban morphology and residential heat-energy demand. Environment and Planning B: Planning and Design, 41 (1). pp. 138-162. ISSN 0265-8135 DOI: 10.1068/b39065 © 2013 Pion and its Licensors This version available at: http://eprints.lse.ac.uk/60778/ Available in LSE Research Online: February 2016 LSE has developed LSE Research Online so that users may access research output of the School. Copyright © and Moral Rights for the papers on this site are retained by the individual authors and/or other copyright owners. Users may download and/or print one copy of any article(s) in LSE Research Online to facilitate their private study or for non-commercial research. You may not engage in further distribution of the material or use it for any profit-making activities or any commercial gain. You may freely distribute the URL (http://eprints.lse.ac.uk) of the LSE Research Online website. This document is the author’s final accepted version of the journal article. There may be differences between this version and the published version. You are advised to consult the publisher’s version if you wish to cite from it.
brought to you by COREView metadata, citation and similar papers at core.ac.uk
provided by LSE Research Online

Cities and Energy: Urban Morphology and Residential Heat Energy Demand 23 January 2013
Philipp Rode LSE Cities, London School of Economics and Political Science, Houghton Street, London WC2A 2AE, United Kingdom; e-mail: [email protected] Christian Keim EDF R&D Center, Asia Pacific Direction-China Division, Henderson Center, Tower 2, 12th floor, 18 Janguomennei Avenue, 100005 Beijing, China; e-mail: [email protected] Guido Robazza LSE Cities, London School of Economics and Political Science, Houghton Street, London WC2A 2AE, United Kingdom; e-mail: [email protected] Pablo Viejo European Institute for Energy Research, Karlsruhe Institute of Technology, Emmy-Noether-Strasse 11, 76131 Karlsruhe, Germany; e-mail: [email protected] James Schofield LSE Cities, London School of Economics and Political Science, Houghton Street, London WC2A 2AE, United Kingdom; e-mail: [email protected]
Acknowledgments This study was conducted as an integral part of the Urban Age research programme at LSE Cities at the London School of Economics and Political Science and the buildings and energy research at the European Institute for Energy Research (EIFER) at Karlsruhe Institute of Technology. In particular, we would like to thank Ricky Burdett, Nurten Avci, Snezhina Dimitrova, Syed Monjur Murshed, Jean-Marie Bahu, Marina Montero Carrero, Karl Baker, Kay Kitazawa, Miranda Iossifidis, Claire Mookerjee, Daniel Budish and Yash Ovardhan, Kirstin Flemming. We are further grateful for the scientific guidance we received from Brian Ford, Irene Gallou, Joana Goncalves, David Kingstone, Andreas Koch, Nikolaus Kohler, Shao Li, Bruno Moser, Philip Steadman, Chris Trott and Rick Wheal.

1
Cities and Energy: Urban Morphology and
Residential Heat Energy Demand
Abstract. This paper aims to better understand the theoretical heat-energy demand of
different types of urban form at a scale of 500 by 500 metres. The empirical basis of this
study includes samples of dominant residential building typologies identified for Paris,
London, Berlin and Istanbul. In addition, archetypal idealised samples were created for each
type through an analysis of their built form parameters and removal of unwanted ‘invasive’
morphologies. The digital elevation models of these real and idealised samples were run
through a simulation that modelled solar gains and building surface energy losses to estimate
heat-energy demand. In addition to investigating the effect of macro scale morphological
parameters, micro scale design parameters, such as U-values and glazing ratios, as well as
climatic effects were analysed. The theoretical results of this study suggest that urban
morphology induced heat energy efficiency is significant and can lead to a difference in heat
energy demand up to a factor of 6. Compact and tall building types were found to have the
greatest heat energy efficiency at the neighbourhood scale while detached housing was found
to have the lowest.
Key words: Urban form, building energy consumption; digital elevation models; urban
morphology; heat energy
1 Introduction
Buildings concentrate a large proportion of global energy demand. In the developed world,
approximately 40 per cent of energy end-use takes place in buildings, while in the developing
world the figure is still significant at 20 per cent (Pérez-Lombard et al., 2008). In 2004, this
resulted in global emissions of 8.6 GtCO2e (Levine et al., 2007) or approximately 33 per cent

2
of all energy related greenhouse gas emissions and 17.6 per cent of all anthropogenic
greenhouse gas emissions (Rogner et al., 2007). Within some cities, the dominance of
buildings in relation to energy demand is even more pronounced. In the case of London, the
energy used in buildings amounts to almost 70 per cent of the city’s total energy demand
(UN-Habitat, 2008), with a similar share of carbon emissions (Mayor of London, 2010). In
Berlin, building energy use is slightly lower at about 56 per cent, but still far exceeds
transport and industry related energy demand (UN-Habitat, 2008). So evidently, the building
sector is the most significant contributor to carbon emissions in the global north, but at the
same time has also been highlighted as a sector with great opportunities for significant
improvement.
This paper focuses on theoretical heat energy efficiencies created by the spatial configuration
of cities. Of all energy used in buildings, energy for space heating produces the greatest
demand. In Europe, approximately 70 per cent of energy use in residential buildings is
heating related (WBCSD, 2009) while a recent more detailed study for New York City
identified a range between 55 to 65 per cent of total energy consumption in residential
buildings as space heating related (Howard et al., 2012). In principle, three areas of
intervention have the capacity to play an important role in reducing heat-energy demand.
These include behavioural adjustments, technological advancement and design
considerations. For the overall energy consumption in non-domestic buildings, Baker and
Steemers (2000) suggest that these three factors together might explain an energy demand
variation of a factor of 10 (2, 2 and 2.5 respectively). To fully explain the up to 20-fold
difference observed for energy demand of buildings, Ratti et al (2005a) question whether
urban geometry might be the missing factor 2. This study addresses this question by focusing
exclusively on theoretical heat-energy demand (excluding space cooling and air conditioning)
related to design issues at their most fundamental level: building design and urban form.

3
Our research takes the established discourse on heat-energy demand and building typologies
to a larger scale, so allowing for an exploration of trade-offs and scaling effects at the
neighbourhood level that have to date been neglected by the existing literature. The following
underlying research hypothesis served as the basis for our investigation:
The basic configuration of residential buildings in cities (urban morphology) at the
neighbourhood scale significantly impacts on heat-energy demand with more compact urban
morphologies displaying far greater heat-energy efficiency than suburban and modern
building configurations such as residential towers and slab housing.
To investigate this hypothesis, the archetypal morphologies of four major European cities are
analysed and categorised to create generic idealised morphology types. These morphology
types are then modelled in order to compare their thermal performance as a result of passive
solar heat gains and overall heat losses. Alongside this overall research framework, the
following questions are addressed:
What is the relationship between the most basic spatial characteristics such as gross
floor area ratio (floor space index), surface-to-volume ratio and surface coverage for
the selected samples?
What is the average theoretical annual heat energy demand per square metre for each
of the real and the idealised morphology samples?
What patterns emerge regarding the heat energy demand of similar building
typologies across the four different cities?
What are the variations of heat-energy demand within similar, and between different
categories of urban morphologies?

4
This work is intended to provide a basis for future research on design-induced heat energy
performance of buildings at the neighbourhood scale. In addition, the categorisation of urban
morphology types aims to contribute to an evolving metric for building typologies.
2 State of Research
2.1 Pioneering work at the macro and micro level
At the macro scale, the relationship between urban form and energy consumption was
initially investigated through large scale observable parameters such as density and shape.
Steadman (1979) was among the first to theorise the energy implications of large scale urban
form. His conclusions were that high-density growth along linear transport infrastructure
would be more efficient than centralised dense growth. Increasing the possibility of passive
solar gains, natural lighting, ventilation and local food production were seen as the benefits of
this kind of urban footprint. These early findings formed the basis for many future studies on
the effects of morphology on energy demand, although more recent literature is less certain of
its conclusions. Some highlight the negative impacts of density on natural light, solar gain
and ventilation as important trade-off factors (Hui, 2001), and the possibility that the
relationship between density and efficiency may not be causal (Lariviere and Lafrance, 1999;
Steemers, 2003) while others generally subscribe to the concept of ‘density equals efficiency’
(Holden, 2004; Mindali, 2004).
At the micro scale, at the level of the individual building, energy demand analysis was
initially based on geometric approximations of building form and basic scientific principles
(Olgyay and Olgyay, 1963) and supported by experimental results (Olgyay, 1967). Martin
(1967; 1972), March and Trace (1969) investigated the relationships between surface
coverage, building height, building depth and density to understand the equivalent levels of
day lighting. The desire to practically apply the learning from such work led Baker and
Steemers to develop the ‘lighting and thermal’ (LT) method (Baker and Steemers, 1995;

5
Baker and Steemers, 1996; Baker and Steemers, 2000; Roaf and Hancock, 1992). The LT
method involves differentiating between passive and non-passive zones within the building.
Passive zones are defined as those with a depth (distance from an exterior wall) normally
twice the floor to ceiling height, therefore having potential access to passive lighting, heating,
cooling and ventilation. Active zones are all those which are unable to take advantage of
passive systems and require the ‘active’ use of energy to provide lighting, heating, cooling
and ventilation. The overriding message using this method was to ‘avoid deep plan’ buildings
(Baker and Steemers, 1996). With a few notable exceptions (Knowles, 1974), research was
generally divided between the macro and micro scales of understanding; those at the city
level, and those at building level.
2.2 New computer-based analysis
Computer-assisted research tools had a profound impact on the field of urban morphological
research. More complex geometries could be explored and calculations could be rapidly
repeated for many buildings in order to expand the analysis to the neighbourhood scale.
Webster (1996) developed image texture analysis techniques for urban morphology research,
showing that urban density data could be extracted from satellite imagery. Richens (1997)
took this work still further by incorporating image processing techniques and a digital
elevation model (DEM), a tool previously used by geographers to overlay three dimensional
topographical features onto two dimensional images, producing something akin to a three-
dimensional figure ground drawing and allowing the automation of the previously manual LT
method (Baker and Steemers, 2000).
At the level of the individual building, Steadman et al. (2000) conducted a comprehensive
categorisation of non-domestic building stock (NDBS) with the primary aim of creating a
database of building form to be used for energy analysis. From a survey of 3,350 buildings in
6
four English towns, classification criteria focused on buildings’ external envelope – already
known to be highly significant in energy demand calculations.
Numerical modelling tools for investigating the neighbourhood scale were further honed by
Ratti and Richens (1999) with the addition of new functions that could calculate built form
statistics from the DEM; including surface coverage, average built height, sky view factors
and shadows. At the same time, by incorporating tools to calculate and display the solar
volume for any given plot, Capeluto and Shaviv (2001) were able to demonstrate that even at
relatively high built densities - Floor Area Ratios (FARs) of around 1.6 to 1.8 - it was
possible to maintain solar access rights to all buildings in a neighbourhood.
From 2000 onwards, improvements allowing models to take account of shading and inter-
reflection between buildings, anisotropic sky lighting and greater surface detail were
implemented (Mardaljevic and Rylatt, 2003; Robinson, 2006). Most importantly however,
models were optimised to become radically more scalable given the finite availability of
computing resources (Mardaljevic and Rylatt, 2003; Robinson and Stone, 2004). Montavon et
al (2004) demonstrated the usefulness of such inherent scalability by conducting some of the
first analyses at the neighbourhood scale, comparing building layouts with respect to daylight
effects across three Swiss cities.
A more recent development was the introduction of the concept of ‘isosolar surfaces’ by Ratti
and Morello (2005). Morello and Ratti (2009) later made isosolar surface calculations more
extensible and demonstrated their usefulness as a planning tool through calculating the
maximum buildable volume of the Milan Trade Fair development site for a given allowable
solar obstruction angle. An overview of the methods for calculating the solar envelope and its
potential uses for policy guidance is given by Sarkar (2009).

7
Ratti, Baker and Steemers (2005a) sought to bridge the divide between the older analogue
methods of calculating building energy demand, and new computer modelling tools. By
integrating algorithms (Richens, 1997) that performed the LT method (Baker and Steemers,
2000) and incorporating parameters to approximate factors such as occupant behaviour,
systems efficiency and insulation standards (U-values), Ratti et al (2005b) (2005a) were able
to automate the calculation of building energy demand at the hitherto impracticable
neighbourhood scale. Initial trials on morphology samples taken from London, Toulouse and
Berlin showed that the surface to volume ratio, contrary to some expectations, did not fully
describe energy consumption.
The ratio of passive to non-passive zones was shown to be a better indicator, with non-
passive zones consuming approximately twice as much energy as unobstructed passive zones
– a finding mostly relevant for non-domestic buildings given that non-passive zones in
residential buildings tend to be limited or non-existent. Though this had the effect of
weakening the relationship between energy consumption and urban morphology, variances as
large as 10 per cent were still observed as a result of morphology differences between
Toulouse and Berlin. This is still a significant potential energy saving and justified future
work towards optimizing urban morphology for reduced energy demand.
2.3 Other contemporary studies
Several other studies have recently focused on using passive solar radiation for lighting and
heating. Like this study, they were conducted in a context where most research has produced
evidence that increased solar gain is associated with reduced built densities while at the same
time leading to greater heat losses. For passive solar house standards, Steemers (2003)
highlights a 22 per cent increase in heating energy for a 30 degree obstruction of a south-
facing façade compared to an unobstructed façade. At the same time he refers to Yannas
(1994) who find 40 per cent higher heat savings when comparing apartments with detached
8
housing and concludes that building densities of a theoretical FAR of 2.5 might represent the
optimum density for reducing heat energy demand.
Cheng et al (2006) studied the impact of randomness in the plot layout and height of
buildings at high urban densities. By independently varying the randomness of the positional
and height parameters in their model, they concluded that randomness in both the vertical and
horizontal dimension is beneficial for increasing overall solar access to buildings and
surrounding space, with a factor of 3 difference being observed in some cases. This is
contrary to the belief by some that increasing urban density will always lead to a deterioration
of the immediate environment with respect to solar access.
Kämpf et al (2010) performed multi-objective evolutionary optimisation of building form
parameters for terrace flat roof, slab sloped roof and terrace court formations. For each of
these, parameters optimised were the height of building facades and the height and
orientation of their roofs. Built volume and solar gains were set as the objective functions
giving rise to a Pareto front showing the trade-off between built volume and potential solar
gains. Basel, Switzerland was selected as the case study site. Results showed that terrace
court formation – a perimeter block arrangement of terrace housing with internal courtyards –
was the optimal in all trade-off cases.
Okeil (2010) performed a comparison on three types of urban form, described as linear, block
and residential solar block (RSB). The RSB formation was a new and optimised building
form alleged to be able to maximise the passive solar heating of building facades without
overshadowing neighbouring buildings. The forms were compared in simulations of
insolation, airflow and urban heat island effects. In a model simulated at 48 degrees latitude,
the RSB was found to perform best in these categories.

9
2.4 Knowledge gaps
As shown above, at the building scale, a number of studies on heat-energy demand have
called into question the common sense understanding that more compact building types like
apartment blocks outperform small-scale, individual building units most commonly
represented by detached, single-family housing (Newton et al., 2000; Utley and Shorrock,
2008). Upon initial inspection these results may seem surprising given the basic physical
relationship between heat-energy demand and the function of surface-to-volume ratio or
massing of buildings in reducing heat loss. However, these results can be better understood
when the more complex trade-offs between the solar heat gains and the surface heat losses of
different urban forms are considered. Indeed, this is now well understood at the level of the
individual building. The tools have recently become available to move this research up to the
scale of the urban block and neighbourhood.
Apart from isolated studies examining the thermal performance of blocks consisting of some
of Martin’s (1967) archetypal building forms, there is a general lack of studies of the thermal
performance of urban morphology types. Perhaps closest to a general study was the work
conducted by APUR (2007) and the CSTB (Salat, 2009) into the thermal performance of the
Parisian building stock. Though this study was comprehensive, its methodology was based on
the classification of buildings by age and not form, making the findings very specific to Paris
and, by weak affiliation, other major French cities. Arboit’s (2008) study on the city of
Mendoza was a good example of the practical application and value of this research field,
although again results were specific to low-density buildings in an arid climate. Apart from
the work developing the tools and techniques for this field, studies into morphology and
thermal performance have been disparate and specific in nature, often concentrating on one
sector of a city (Arboit et al., 2008), a subset of urban form (Okeil, 2010) or the effects of a
particular morphological parameter (Cheng et al., 2006).

10
City planners and policy makers do not differentiate the urban fabric by geometric values, but
rather by neighbourhood qualities and building types. There is still a lack of a larger body of
literature on the general categorisation of urban morphology types in modern European cities,
and by extension, a knowledge gap as to the effect of urban morphology type on building
heat energy demand. It is the closing of this ‘urban geometry gap’ (Mitchell, 2005; Ratti et
al., 2005a) to which this study aims to contribute.
3 Methodology
3.1 Empirical basis
As the empirical basis for this investigation, 25 different residential building configurations
were identified in each of the four largest European cities; London, Paris, Berlin and Istanbul.
Although climatic conditions in these cities differ significantly, all have cold winters
typically requiring some consideration of heat-energy provision. More importantly, the
selection of cities ensured that a wide range of different building types was covered as the
four cities represent diverse national building cultures that over centuries have resulted in
clear differences in building typologies.
These typologies have mostly emerged over the last 150 years with little or no regard for heat
energy demand. The majority of their urban building stock was designed and constructed at a
time when a range of other factors determined the shape of the city; when energy was
relatively cheap and global warming was not an urgent agenda. Some building configurations
even rely entirely on technical, energy intensive heating systems where passive heating and
ventilation aids are largely absent. However, whether the impact of morphology on heat
energy demand was considered at the design stage or not, today’s diversity of existing
building stock in European cities allows for a far-reaching comparative analysis.
Following the selection of case study cities, an initial scanning of residential building types
and urban morphologies was conducted. The first phase of this process utilised a qualitative
11
approach largely relying on conversations with experts knowledgeable of local architectural
styles, building compositions and urban neighbourhoods.
The second phase made use of existing literature and the increasing availability of visual
documentations of urban territories including Google Earth and Streetview as well as
Microsoft Bing Bird View. Exploring each city via the satellite imagery then allowed the
selection of the typologies which were most distinct from a morphological point of view.
Both scanning phases informed the choice of the 5 most dominant building typologies
featured in each city.
For each dominant building typology, five urban morphology samples were identified in each
of the four case study cities – leading to the selection of 100 ‘real’ morphology samples in
total.1 This selection made use of the cataloguing of samples in the previous phase and
selected the most homogenous and representative samples for each building type within each
city. Priority was given to selecting diverse morphological arrangements within the same
broad building typology. All samples were recorded at a scale of 500 by 500 metres, framed
to isolate a single and homogenous urban fabric ideally consisting of a single building type
(though this was not always possible). Digital Elevation Models (DEM) were used to
represent these samples as they allow for both the analysis of the key urban morphology
indicators listed below and for the direct facilitation of the energy simulation discussed in the
next section (Ratti et al., 2005a).
In addition to using ‘real’ urban morphology samples as they exist in the four cities,
‘idealised’ samples were constructed and added to the empirical base. This was critical for
‘purifying’ the real samples which at a scale of 500 by 500 metres rarely exist in isolation
1 It is worth a cautionary note that the selection of urban morphology types was a subjective process. Types were categorised according to how people would generally classify buildings and not on any statistical grouping or cluster analysis of built form parameters. Inevitably, there are some ambiguous cases and categorisation is not an exact science.

12
without interference from other building types and stratified modifications of the original
shape of the buildings. In other words, the idealised samples are the distilled and refined
morphologies.
The process of creating the idealised samples began by identifying the most basic features of
the housing type and reproducing them in the simplest possible way. The basic features
being:
building type (size, volume and shape of the single unit);
number of floors;
plot shape and proportion;
alignments;
street layout/pattern;
street width;
street/ façade proportion;
aggregation principles of parts;
size, volume, shape and proportions of blocks (the aggregation of the single units);
building density (floor area ratio/floor space index);
coverage ratio (ratio of the sum of the building footprint areas to sample area).
An emphasis on accuracy in the volumetric spatial configuration was included as it is the
most important factor in the energy consumption simulation. The methodology to build the
idealized samples was based on averages of the main parameters taken from the selected real
samples. A single detached housing unit, for example, has been calculated using the average
area of every building from each of the five samples for that type. Likewise the number of
units composing the ideal sample has been calculated as the average number from the five
selected real examples. The height of the buildings has been set using a similar calculation.

13
While applying these analytical approaches to control the accuracy of each formal factor in
the modelling of the idealized sample, the visualization of the ‘image’ of the type, its form
and shape were also important. The idealized samples had to ‘look like’ the real samples.
Still, the idealisation of samples leads to a loss of information on the typologies and de-
contextualizes them from their environment but has the advantage of isolating the impact of
their shapes and volumes. In particular, having to decide on a specific orientation of these
samples can have significant consequences for energy demands. For each of the five
morphology types in each of the four cities, one idealised sample was created from the five
real samples of the city’s fabric to give a total of 20 ideal morphology samples.
The quantitative description of all urban morphology samples focuses on five key built
environment indicators which were identified for the entire sample area of 500 by 500
metres:
building density, here referred to is Floor Area Ratio (FAR) / Floor Space Index, is
defined as the ratio of the sum of the areas of all building floors to that of the sample
area (500 by 500 m in this study).
building height, is defined as the average height of buildings within the sample area
measured in ‘number of storeys’.
building coverage ratio, though often referred to as just coverage, is defined as the
ratio of the sum of the building footprint areas to that of the sample area.
surface-to-volume ratio is defined as the ratio of the envelope of a building (external
facades and roof) to the entire volume of that building [sqm/cbm].
open space ratio is defined as the ratio between the un-built area and the gross floor
area of any given site.
Other important descriptors of urban form including, for example, the depth of buildings
in plan are not included due to resource limitations for this study.

14
3.2 Heat energy modelling
The energy demand model used for this study follows the principles of an engineering-based,
bottom-up model (Swan and Ugursal, 2009). The modelling of theoretical heat energy
demands for each of the morphology samples was conducted in two stages. For the first
stage, all parameters apart from those pertaining to form were fixed, including the climatic
conditions. The simulation then modelled solar heat gains and building surface heat losses.
From this, the average annual heat energy demand per square metre of indoor floor space was
calculated for each sample. In the second stage, the effects of wall insulation, window U-
value and glazing ratio, and climate were analysed.
In order to allow for direct comparisons of all different samples of urban morphology and
their theoretical heat energy demand, a scenario was created and applied to all simulations.
The climatic conditions were set to that of Paris and building construction values were kept
constant throughout (Table 1) leaving only urban morphology itself as the changing variable.
Therefore, the effect of the physical dimensions of buildings and their arrangement and
layout at a larger scale on theoretical heat energy demand becomes measurable.
Roof Roof geometry not considered
U‐value same as facade value below
Room Inner temperature 19°C
Habitable surface 80%
Ventilation 0.5 h‐1
Night heating coefficient 0.95
Thermal capacity air 0.34 W/m3K
Internal gains 23 kWh/m2 a.
Average store height 3 m
External wall U‐value 1.15 W/m2K
Environment Vertical solar radiation 410 kWh/m2
Heating degree hours 67425 K
Window Glazing ratio of façade 40%
U‐value 2.8 W/m2K
Frame 15% of window area
Shadowing devices no
Thermal bridges Area x 0.05 W/m2K
Cellar Excluded
Losses reduction factor 0.6
Table 1: Model Assumptions

15
The heat energy assessment calculation was modelled through GIS software, enabling to
combine geometrical aspects and physical simulation within the same model. All our heat
energy demand results depend entirely on the predictions of this simulation model. So far, the
model used has been tested empirically for individual buildings only but not at the urban
scale where actual data availability continues to be limited. Urban morphological factors
effecting heat energy demand, including exposure to sun radiation, the spatial and physical
dimensions of buildings and their environmental context, were incorporated. This enabled the
calculation of the heat energy demand of multiple buildings so that it could be analysed at the
chosen scale. Given that average monthly temperatures in all four selected cities were below
26ºC, this energy assessment focused only on heat energy demand rather than energy for
cooling. While this is clearly a simplification as temperatures do exceed 26 ºC on individual
days, the project objective in this case was to specifically understand the effect of
morphology and heat energy demand. It should also be noted that water heating was
considered a separate issue to space heating and was not included.
The heat energy demand in buildings can be understood as a direct consequence of the
surrounding climatic conditions, the passive heat performance of buildings and the resulting
deficit of heat energy required to achieve accepted thermal comfort levels indoors. Energy
losses occur via the building envelope when outdoor temperature drops below a reference
indoor temperature. These losses derive from the envelope itself, its openings, thermal
bridges and losses amassed by ventilation. Energy gains are generated by solar-radiation
entering through transparent parts of the building, warming the air of the interior. Gains are
also a result of building use: the associated heat generated from either the occupiers
themselves or by appliances within the building.
The main variable in assessing the primary heat energy demand is the outdoor air
temperature in relation to the chosen constant inner temperature which, for this enquiry, has

16
been set to a constant of 19ºC. The heating period is measured according to average annual
city air temperatures measured either hourly, daily or monthly. These are described here as
heating degree hours (HDH) or heating degree days (HDD), depending on the chosen unit.
They are a measure of how many degrees Celsius and for how long (tHp) the outside air
temperature (Tex) is lower than the set reference inner temperature (Tin):
HDD = Σ (Tin-Tex) • tHp
The primary heat energy demand (HD) is therefore calculated as the difference between heat
losses (Htot) and heat gains (Gtot):
HD= Htot - Gtot
The heat losses are defined as the sum of the losses during the heating period through the
building envelope (HT) and the ventilation (HV).
Htot = Σ (Tin-Tex) • tHp • (HT + HV)
The heat gains are defined as the sum of the gains during the heating period from the
incoming solar radiation (GSun) and the internal gains from dwellers and appliances use
(GInt) lowered by their real usage factor (ηp).
Gtot = Σ ηp• (GSun+GInt) • tHp
Heat transmission losses (HT) are expressed as the sum of the losses through the façade
(walls and openings), and the heat losses of thermal bridges (HTb). The façade losses are
expressed as the thermal conductivity of the building materials (Ui) multiplied by the surface
area exposed to the environment (Ai). The thermal conductivity of the building material (Ui)
has not been assessed in this work but set as a constant listed with all the other parameter
values in the previous section.
HT = Σ(Ui • Ai ) + HTb

17
The thermal bridge losses are expressed as the length of the edges of the building’s main
form (Li) multiplied by their thermal conductivity coefficient (ψi):
HTb = Σ Li • ψi
This way of assessing losses related to thermal bridges usually leads to an overestimation in
buildings with higher insulation standards. A simple correction factor accounted for this.
Assuming a certain construction standard, the heat losses through the thermal bridges can be
assessed as the average (Ui) value of the façade construction increased by 0.05 W/m2k .
Therefore, the formula becomes:
HT =Σ (Ui • Ai ) + 0,05 • Ai
Using the ESRI-ArcInfo software for the analysis of building information external and
adjacent walls can be differentiated. This allows walls that have no contact with the exterior
and therefore do not impact on heat energy demand to be removed from the assessment.
Ventilation losses are identified as the volume of air (Vi) exchanged in units overtime (nv),
considering its density at a standard temperature and pressure within a room, and defining its
thermal capacity as 0.34 Wh/m3 k. Ventilation can vary widely, but the value of 0.5 cycles
per hour has been applied here as a reasonable average.
HV = ρA• cA• nv • Vi
It is not necessary or indeed standard practice to heat a building in its entirety, therefore the
‘volume’ does not refer to the net volume but rather the volume excluding the volume of
inner walls, staircases or other uninhabited rooms. The correction value for both the volume
and the related floor space has been set to 0.8 of the total, but this is a value that is adjusted to
the size and use typology of the building.
To derive the internal gains, the value (qi,a) is set according to the German and French
standard of 22 kWh/m2 of inhabitable floor-space area (Ai).

18
GInt = qi,a •Ai
The total gain from solar radiation is defined as the incident solar radiation (ISp,i) during the
heating period on the different facades of a building. The incident solar radiation has to be
defined for each façade separately, and depends on a number of factors:
orientation of a façade and the relative incident radiation energy (ISp,i);
the area of transparent elements of a façade (Ai), lowered by the properties of the
glazing and resulting transmittance of radiation energy (gi);
the fraction of area occupied by the frame (FWf,i);
possible horizontal shading installations (FSh,i) and the shading of outstanding
objects (FSs,i).
GSun = Σ ISp,i • Σ FWf,i • FSs,i • FSh,i • gi • Ai
In the first instance, solar radiation impacting on a vertical surface must be considered. The
solar radiation which actually enters a room is quantified according to the proportion of the
window frame related to the total window area (FWf,i= 0.85). The physical properties of
glass do not allow the transmission of all incident radiation, firstly because the angle of
incidence of the radiation is seldom perpendicular, and secondly because glass is never fully
transparent due to aging or dust (gi = 0.5). Shadowing generated by other volumes in the
vicinity of the building must also be considered as being a major source of influence in
accessibility to solar energy within the urban tissue (FSh,i). These values amount to a
rigorous assessment of the solar radiation for each façade within their typological context and
scale. Horizontal shadowing devices should also be considered if any, though for simplicity
we have assumed them as not installed (FSs = 1.0).
Finally, a comprehensive analysis of incoming solar radiation for each sample was
conducted. The cadastral data, enriched with the height data of the typologies, was

19
transformed into 50cm x 50cm grids. With the urban typologies represented as digital
elevation models (DEMs), the incident solar radiation was able to be quantified at each grid
point. Calculating solar radiation this way considered all obstructions to direct sun light that
are part of the chosen urban morphologies at the neighbourhood scale. During the considered
heating period, the penetration rate of solar radiation in the urban tissue is based on the
analysis of the sun trajectory during 0.5 hour intervals of the day, aggregated to 14 day
averages. Diffuse solar radiation, direct solar radiation and their durations were considered.
The outputs of the calculation model are interpolated with the exposed surfaces of each
building and normalised to a coefficient ranging between 0 and 1. This is multiplied by the
vertical incident solar radiation value of a south facing exposed façade, resulting in a
definitive value for the solar radiation of each façade. Among the constant parameters for all
sample cities is the vertical incident solar radiation of a south facing exposed façade. All
presented results refer to cumulative values for the chosen heating period.
Figure 1: Visualisation of Digital Elevation Model (DEM), solar direct radiation analysis output example and energy
demand calculation output example [kWh/sqm/a]
Clearly, this modelling exercise is far from being comprehensive but for the purpose of this
study was regarded as appropriate. A critical review of the model can be found in the
appendix.
4 Analysis
4.1 Urban Morphology
Overall, similar urban morphologies were identified in all four cities which, at the same time,
feature some unique building types. Across the cities, four common morphologies dominate
and include those based on detached housing, high-rise apartments, slab housing, and
compact urban blocks. City specific morphologies include London’s terraces and Berlin’s

20
row housing, which shared some similarities. The regular urban blocks of Paris feature a
lower density version of the city’s archetype compact urban block, and the Gecekondu of
Istanbul displays a kind of low rise urban housing typology that emerged as a result of the
city’s organic growth. Furthermore, a separate category was formed for detached multi-unit
apartment buildings in Berlin, and for the newer apartments in Istanbul; a dense but modern
housing type which is uniquely prevalent across the city and creates a particular morphology.
Figure 2: Figure grounds of key morphology samples
Figure 3: Figure grounds of ‘idealised’ morphology samples
As introduced above, five quantitative measures of urban morphology were used to describe
the samples chosen for this analysis: Building density, building height, surface coverage of
buildings, surface-to-volume ratio and open space ratio. A comprehensive visualization of
four of these key spatial indicators is facilitated by the so-called Spacemate diagram2
developed by Berghauser Pont and Haupt (2004) combining floor area ratio, surface
coverage, building height and the open space ratio (Figure 4).
Figure 4: SpaceMate diagramm of all real and ‘idealised’ morphology samples
Our analysis showed clearly that among all samples compact urban blocks combine the
highest building densities with low surface-to-volume ratios and high surface coverage. For
the identified compact urban blocks, the building densities typically ranged between FAR 1.5
2 The spacemate diagram simultaneously plots floor area ratio, surface coverage, building height and the open space ratio in one diagram. The surface coverage is assigned to the x-axis and the floor area ratio to the y-axis. These define the two additional parameters building height and open space ratio as gradients expanding across the diagram.

21
and 2.5 with building heights between 4 and 6 storeys. The most significant exception was
Paris where this value ranged between FAR 4 and 5.2 and heights between 7 and 9 storeys.
The surface coverage of compact urban blocks is relatively high and usually ranges between
30 and 60 per cent. The idealised samples displayed the same overall patterns in all four
cities.
Our urban morphology samples also confirmed that detached housing combines the lowest
building densities with high surface-to-volume ratios and low surface coverage.
Unsurprisingly, detached housing in all four cities featured by far the lowest building
densities with typical FARs of below 0.5. Again, the idealised samples displayed the same
overall patterns.
Furthermore, the analysis identified high-rise apartments and slab housing as sharing a
potential for low surface coverage and a wide range of building densities and surface-to-
volume ratios. The overall pattern for high-rise apartments and slab housing within and
across the four cities was less clear. This was likely compounded by the fact that these urban
morphologies were the least likely to exist in isolation within the 500 by 500 m sample areas.
For both, density typically varied between a FAR of 0.6 to 1.7, with a tendency toward higher
densities for high-rise compared to slab housing. Surface coverage of both configurations
ranged from 10 to 20 per cent, similar to that of detached housing. Idealised samples tended
to consist of higher FARs and lower coverage than the real samples, hinting at the lack of
purity of the morphologies in the real samples.
Of further interest was terrace housing in London which combines relatively low density with
relatively low surface coverage and a range of surface-to-volume ratios while row housing in
Berlin has slightly lower surface coverage at same density levels with little surface-to-volume
variation.

22
Finally, Gecekondu in Istanbul and regular urban blocks in Paris feature wide spread
densities and surface coverage values. Gecekondu density spanned from FAR 0.4 to 1.8 with
coverage from 25 to just above 40 per cent. Regular urban blocks in Paris were significantly
denser, ranging from FAR 1.8 to 3.4 and coverage between 15 and 35 per cent. The idealised
samples displayed the averages of these values in both cases.
To conclude, density is achieved either through increasing the average building height or
overall surface coverage, but rarely simultaneously. While density can be seen to increase
steadily up to approximately FAR 1, between FAR 1 and 1.5 there appears to be a bifurcation
of the data points. Past this point, the morphology types appear to either follow a path of fast
height increase with increasing density, or one of very little height increase with increasing
density. It is the high rise apartment and slab housing formations which tend to follow the
former path, with the regular urban blocks of Paris, the modern apartments of Istanbul and
the compact urban blocks of all cities following the latter. This alludes to a mutual exclusivity
in design choices (as regulated for by the planning laws in all four cities) – if one wishes to
increase density, one can either build upwards or increases the surface coverage of the
building. The data suggests that these two strategies are seldom attempted in unison.
4.2 Heat Energy Demand Modelling
Overall, the hypothesis that different building morphologies feature distinctively different
energy demands and that higher density building configurations lead to greater heat-energy
efficiency was confirmed. The ratio between the least and best performing sample is greater
than factor six, emphasising the significance of a better understanding of design-related
impacts on heat-energy demands. The average building height and building density were
found to be good indicators for heat energy efficiency, each correlating negatively with the
heat energy demand. The surface-to-volume ratio also correlates well but positively with heat
energy demand. The correlation coefficients presented below are first aggregated over all

23
samples and then shown as a breakdown by city and by morphology type. Morphology types
which were unique to only one city were omitted as, with so few data points, related results
would not be statistically significant. The Pearson correlation formula was used to calculate
these values.
Figure 5: Correlation with heat energy demand by typology and by city
The absolute results for the theoretical heat energy demand presented below are measured in
kWh per square metre per year.3 The distribution of heat demand in all 100 samples in the
four cities followed a standard normal distribution with an average of 103 kWh/sqm/a. The
highest heat energy demand was calculated for a Gecekondu housing area in Istanbul with
194 kWh/sqm/a, while the lowest value, at about 30 kWh/sqm/a, was identified for an area of
compact urban blocks in Paris. The distribution of the 20 idealised samples tended towards
lower energy efficiency than the real samples with an average heat energy demand of 119
kWh/sqm/a and a range of between 60 and 238 kWh/sqm/a. These results might also be
informed by an effect whereby a greater mix of different urban typologies has been identified
as an overall advantage for energy efficiency (Cheng et al., 2006).
Looking at building typologies, compact urban blocks consistently perform best, detached
housing worst. The majority of compact urban blocks displayed a heat energy demand of less
than 100 kWh/sqm/a and in the case of Paris even below 50 kWh/sqm/a. High-rise
apartments and slab housing can potentially perform very well. With the exception of London
slab housing and Berlin high rise apartments, all idealised samples of these morphology types
showed heat energy demands of less than 80 kWh/sqm/a. The real samples of high rise
apartments seemed to underperform due to the fact that they rarely exist in a pure form within
3 These are theoretical energy values only comparable across the results of the modelling undertaking as part of this study. They cannot be compared to the real energy performances of buildings.

24
the 500 by 500 metres sample areas. The same phenomenon was observed for slab housing,
particularly for the case of London and Paris, where real samples tended to generate heat
energy demands as high as 150 kWh/sqm/a, while idealising the samples pushed this value
down to 105 and 80 kWh/sqm/a respectively. Urban morphologies that featured the most
diverse energy performances included the Gecekondu areas in Istanbul, with heat energy
demands ranging between 100 and 200 kWh/sqm/a, apartment buildings in Berlin ranging
between 90 to 170 kWh/sqm/a, and slab housing in Paris and London ranging between 60 to
150 kWh/sqm/a and 85 to 150 kWh/sqm/a respectively.
Figure 6: Building typology and heat energy demand
With regards to density, the impact of increasing densities is greatest at the lowest density
levels. Those morphologies with the lowest densities (under FAR of 0.5) display a heat-
energy demand of at least 100 kWh/sqm/a easily reaching almost 200 kWh/sqm/a.. At the
same time, efficiency levels of less than 50 kWh/sqm/a are common only above FAR 4
although idealised samples in Paris and Berlin seem to suggest similar efficiency
achievements at densities as low as FAR 1. Minimum building density appears to guarantee
the maximum heat-energy demand. For all samples with a density of above FAR 1.5, heat
energy demand was significantly below 100 kWh/sqm/a (with only two exceptions, both in
Istanbul). All morphologies at density levels above FAR 4 have performances that vary
between 30 and 50 kWh/sqm/a only. Greatest variation in energy demand was found at a
density of FAR 1 where it ranged from 50 to 150 kWh/sqm/a.
Figure 7: Building density and heat energy demand
25
Increasing surface-to-volume ratio increases the range of energy demand in buildings. These
variations in heat energy demand at similar surface-to-volume ratios hint at the trade-off
between surface heat losses and solar gains which both scale positively with building surface
area. At a ratio of 0.15 the range in energy performance is only 35 to 80 kWh/sqm/a, while at
a ratio of 0.4 this increases to a range of near 110 to 200 kWh/sqm/a.
Average building height was found to be a proxy indicator of heat energy demand. This
variable was found to best fit a logarithmic relationship with heat energy demand decreasing
with increasing height. Paris demonstrates the greatest average height with more than half of
the morphologies sampled being above 6 floors. Conversely, London demonstrates the lowest
average height with more than half lying below 4 floors. A corresponding difference in heat
energy demand is seen with Parisian compact urban blocks achieving only 30 kWh/sqm/a,
while the equivalent morphology in London achieves 70 kWh/sqm/a at its lowest.
4.3 The impact of insulation, glazing ratio and climate
Insulating walls should result in greater absolute energy saving if the original through-wall
energy losses (and thus heat energy demand) are high. As one would expect, modelling
results showed that insulating a building which has higher initial heat energy demands results
in a greater absolute reduction in that heat energy demand. Berlin detached housing shows a
heat energy demand of 393 kWh/sqm/a at the high u-value of 2, reducing to 118 kWh/sqm/a
at the low u-value of 0.5; resulting in a net saving of 275 kWh/sqm/a. By comparison, the
Parisian compact urban block has a heat energy demand of 97 kWh/sqm/a with a wall u-value
of 2, reducing to 37 kWh/sqm/a when the u-value is reduced to 0.5; a net energy saving of 60
kWh/sqm/a. However, the relative difference in heat energy demand between the selected
detached and compact housing only reduces from about a factor 4 to 3.2 for the two extreme
u-values. Also, there is of course more wall area to insulate per unit volume in detached
housing, so this will be more expensive and includes higher embedded energy.

26
Figure 8: Changing u-values and heat energy demand
The glazing ratio is another important factor for the overall heat energy performance of
buildings and indicates the proportion of the building which is covered by windows. As the
glazing ratio is increased, heat loss through windows, which is usually much greater than that
which is lost through walls, increases. But solar heat gains through the windows also
increase. The balance of the two is dependent on the window u-value; the rate at which heat
is lost through the windows. Given the relationship described above there can exist a window
u-value above which any further increase in glazing ratio would result in a net energy loss
through the windows and thus an increase in heat energy demand. Conversely, below this u-
value, any further increase in glazing ratio would result in net solar gains and thus a reduction
in heat energy demand. The point at which this critical u-value is reached is dependent on the
form of the building and the surrounding morphology. Our analysis showed that more linear
building forms such as row housing, slab housing and terraced housing show the highest
critical window u-values while compact urban blocks and detached housing tend to have
similar critical window u-values. This seems to imply that the compactness of the building
form is not in itself an important factor in critical u-value determination. It seems more likely
that a morphology’s solar cross-section relative to its volume is a more important indicator of
the critical window u-value.
Figure 9: Critical window u-values of different urban morphology types
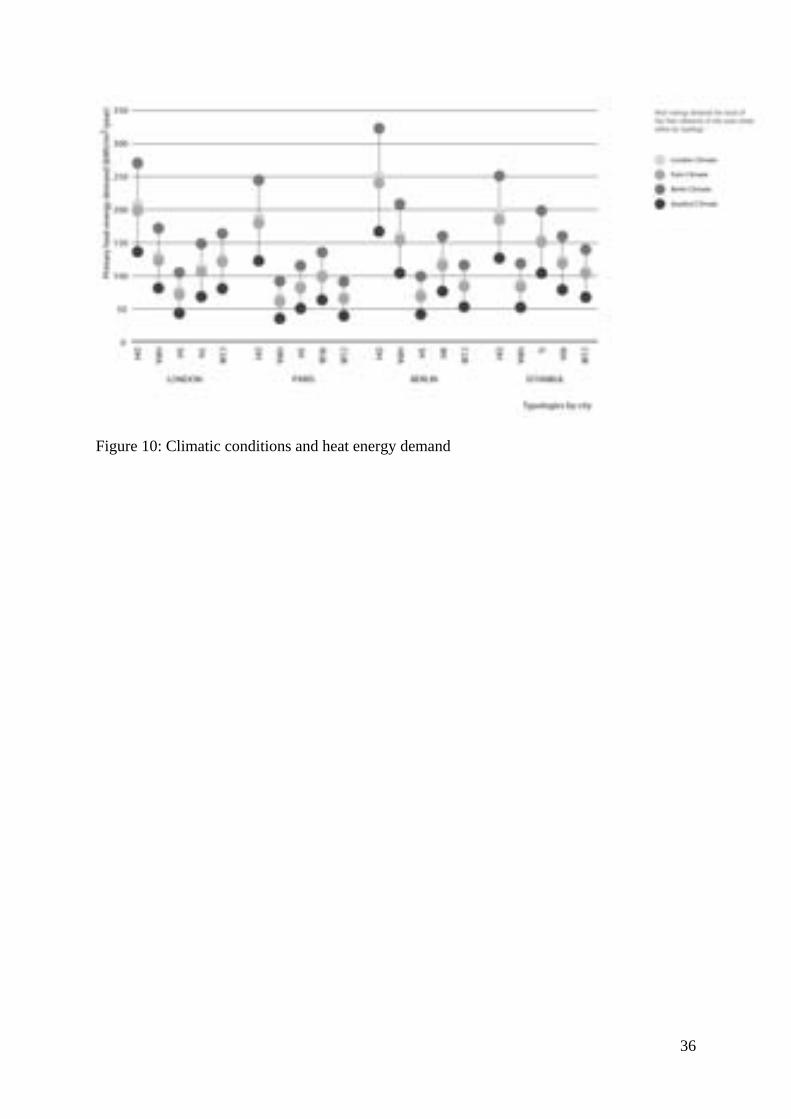
In the absence of the effects that changing latitude may have, the effect of climate is mainly a
scaling one with overall factor differences between the heat energy demand of different urban
morphologies being only marginally affected. The colder the climate the greater the heat

27
energy demand of the buildings. For example, compact urban blocks in Paris displayed a
range of 90 to 38 kWh/sqm/a compared to detached housing in Berlin with 321 and 165
kWh/sqm/a. When comparing the relative difference in heat energy demand for the two
extreme cases, Berlin’s and Istanbul’s climatic conditions, the values for the selected
detached and compact housing increases from about a factor 3.6 to 4.3. With a maximum of
4˚ difference between the latitudes of London (52˚), Paris (49˚) and Berlin (53˚), the effect of
latitude is justifiably small. However, with Istanbul at a latitude of 41˚, the effects of the
angle of the sun may have a noticeable impact on the overshadowing of buildings – the sun
will be higher in the sky and thus shadows will generally be shorter.
Figure 10: Climatic conditions and heat energy demand
5 Conclusions
In summary, the theoretical results of this study suggest that urban morphology induced heat
energy efficiencies are significant. Our main analysis with fixed parameters for all variables
except urban form resulted in theoretical heat energy demand variances for extreme cases of
up to a factor 6. Differences of factor 3 to 4 were common across the most typical urban
morphologies in each city and persisted for different insulation standards and climatic
conditions. This seems to be in line with an assumption by Ratti et al (2005a) that design
related characteristics might explain variations of up to factor 5 (factor 2.5 for building
design and factor 2 for urban geometry). Our findings do, however, diverge from their
analysis for Berlin, Toulouse and London which also included lighting where urban geometry
only explained a variance of 10 per cent.
Overall, our research identifies significant heat energy efficiencies that are achieved by either
higher building densities (for example compact urban blocks) or by taller buildings that in

28
turn allow for lower building densities (as low as a FAR of 1). In contrast to previous work,
this research did not find any effects whereby increasing density decreases heat energy
efficiency – a finding that is certainly important to verify in future follow-up research. Here,
it is particularly relevant to investigate potential trade-offs with other building energy
demands such as for lighting and cooling which might have negative density associations.
The study also highlighted that both the variance in heat energy demand and the diversity of
urban morphologies is greatest for all four case study cities at a density level of FAR 1. Very
tentative evidence which emerged from comparing our results for the real urban morphology
samples with the ‘purified’ samples seems to further confirm previous work that suggested
higher heat energy efficiencies for mixes of building typologies. Again, this seems extremely
relevant for future work.
From a methodological perspective, our research confirmed the usability of digital elevation
models (DEM) for both, an analysis of key urban morphology descriptors as well as GIS
enabled simulations of heat energy demand. We also regard this work as an encouraging
contribution to the on-going development of bottom-up models (Swan and Ugursal, 2009)
that help to determine energy end-use in cities.
Word count: 7,998

29
Appendix
A - Figures
Figure 1: Visualisation of Digital Elevation Model (DEM), solar direct radiation analysis
output example and energy demand calculation output example [kWh/sqm/a]
Figure 2: Figure grounds of key morphology samples

30
Figure 3: Figure grounds of ‘idealised’ morphology samples

31
Figure 4: SpaceMate diagramm of all real and ‘idealised’ morphology samples

32
Figure 5: Correlation with heat energy demand by typology and by city
Figure 6: Building typology and heat energy demand

33
Figure 7: Building density and heat energy demand

34
Figure 8: Changing u-values and heat energy demand

35
Figure 9: Critical window u-values of different urban morphology types
36
Figure 10: Climatic conditions and heat energy demand

37
B – Summary table of key results
CITY TYPOLOGY NEIGHBOURHOODCOVERAGE
RATIO
FLOOR‐AREA
RATIO
SURFACE /
VOLUME RATIO
AVERAGE
BUILT
HEIGHT
(Floors)
HEAT
ENERGY
DEMAND (kWh/sqm/a)
(Paris)
HEAT
ENERGY
DEMAND (kWh/sqm/a)
(Istanbul)
HEAT
ENERGY
DEMAND (kWh/sqm/a)
(London)
HEAT
ENERGY
DEMAND (kWh/sqm/a)
(Berlin)
East Finchley 0.14 0.43 0.31 3.04 112.15
Bickley 0.11 0.25 0.40 2.09 148.29
Falconwood 0.16 0.31 0.38 1.99 132.46
Arnos Grove 0.12 0.25 0.37 1.97 136.65
Putney 0.20 0.61 0.36 2.99 115.01
Idealized Sample 0.14 0.39 0.40 2.50 196.62 134.52 205.69 268.51
Kennington 0.09 0.45 0.26 3.70 111.46
Euston 0.17 0.92 0.25 4.26 101.58
Latimer Road 0.17 0.76 0.24 3.57 117.81
Barbican 0.39 3.04 0.14 5.76 77.08
Camberwell 0.25 1.01 0.58 3.00 129.55
Idealized Sample 0.08 0.84 0.20 10.08 70.25 42.20 74.71 103.41
Pimlico 0.20 1.06 0.26 4.26 95.97
Walworth 0.15 0.73 0.26 4.63 86.04
Manor House 0.12 0.55 0.29 2.63 147.77
Kidbrooke 0.14 0.64 0.25 4.30 105.18
Bayswater 0.34 1.64 0.18 3.89 96.50
Idealized Sample 0.14 0.61 0.17 4.40 104.14 67.20 109.63 146.98
Edmonton 0.24 0.48 0.32 2.01 123.34
Clapham South 0.30 0.91 0.31 3.00 98.54
Tooting 0.29 0.59 0.31 2.00 121.98
Kennington 0.22 0.73 0.42 2.94 109.01
Notting Hill 0.23 0.98 0.25 4.05 89.34
Idealized Sample 0.26 0.79 0.28 3.00 121.29 79.57 127.73 170.40
Victoria 0.36 1.69 0.22 4.18 82.34
Marylebone 0.51 2.35 0.20 4.21 76.23
Paddigton 0.46 2.49 0.32 4.31 82.72
Backer Street 0.41 1.99 0.15 4.17 70.59
West Kensington 0.29 1.35 0.16 3.99 98.60
Idealized Sample 0.42 1.93 0.22 4.06 119.02 78.90 123.75 162.16
CITY TYPOLOGY NEIGHBOURHOODCOVERAGE
RATIO
FLOOR‐AREA
RATIO
SURFACE /
VOLUME RATIO
AVERAGE
BUILT
HEIGHT
(Floors)
HEAT
ENERGY
DEMAND (kWh/sqm/a)
(Paris)
HEAT
ENERGY
DEMAND (kWh/sqm/a)
(Istanbul)
HEAT
ENERGY
DEMAND (kWh/sqm/a)
(London)
HEAT
ENERGY
DEMAND (kWh/sqm/a)
(Berlin)
Satrouvil le 0.23 0.52 0.36 2.08 154.05
L┤Etrang‐la‐vil le 0.14 0.26 0.35 1.89 143.26
Taverny 0.20 0.38 0.37 1.84 158.09
Le Blanc‐Mesnil 0.25 0.52 0.34 1.96 154.39
Maison Alfort 0.28 0.87 0.32 2.87 128.90
Idealized Sample 0.22 0.48 0.39 2.17 177.46 120.68 185.67 242.95
La Defense 0.14 1.35 0.20 9.49 64.71
Creteil Universite 0.13 1.08 0.18 8.41 88.46
Epinay sur Seine 0.18 1.69 0.16 6.73 76.03
Val de Fontenay 0.13 0.99 0.19 7.76 51.48
Porte de Choisy 0.20 2.39 0.16 10.18 89.51
Idealized Sample 0.09 1.50 0.19 16.06 59.72 34.22 64.07 90.62
Nanterre Ville 0.15 0.81 0.20 4.50 90.37
Gare de Gros Noyer 0.12 0.57 0.23 3.01 147.00
Garges Sarcelles 0.21 1.12 0.18 5.61 62.20
Creteil Prefecture 0.15 0.88 0.24 5.08 91.06
Villepinte 0.22 1.37 0.18 5.95 65.35
Idealized Sample 0.17 0.91 0.18 5.31 79.64 49.51 83.82 113.64
Anatole France 0.45 3.09 0.19 6.54 61.94
Saint Denis 0.36 1.85 0.21 5.13 80.75
Aubervil les 0.33 1.71 0.21 4.50 84.55
Buzenval 0.48 3.30 0.18 6.48 66.38
Vincennes 0.47 3.24 0.20 6.66 67.86
Idealized Sample 0.42 2.55 0.24 6.06 96.71 62.41 100.98 134.16
Saint Placide 0.52 4.65 0.15 8.64 36.13
Bonne Nouvelle 0.66 5.11 0.14 7.61 38.35
Courcelles 0.57 4.88 0.11 8.39 29.83
Saint Ambroise 0.54 4.03 0.14 7.34 38.51
Victor Hugo 0.51 4.39 0.16 8.20 52.35
Idealized Sample 0.52 4.21 0.14 8.04 63.41 38.13 66.19 89.84
Paris
Detached Housing
High Rise Apartment
Slab Housing
Regular Urban Block
Compact Urban Block
London
Detached Housing
High Rise Apartment
Slab Housing
Terraced Housing
Compact Urban Block

38
CITY TYPOLOGY NEIGHBOURHOODCOVERAGE
RATIO
FLOOR‐AREA
RATIO
SURFACE /
VOLUME RATIO
AVERAGE
BUILT
HEIGHT
(Floors)
HEAT
ENERGY
DEMAND (kWh/sqm/a)
(Paris)
HEAT
ENERGY
DEMAND (kWh/sqm/a)
(Istanbul)
HEAT
ENERGY
DEMAND (kWh/sqm/a)
(London)
HEAT
ENERGY
DEMAND (kWh/sqm/a)
(Berlin)
Alt‐Karow 0.05 0.11 0.44 2.06 150.17
Falkenhorst 0.12 0.23 0.38 1.92 150.22
Heiligensee 0.13 0.24 0.41 1.87 159.22
Machnow 0.07 0.15 0.42 2.03 157.99
Hönower Siedlung 0.07 0.15 0.42 2.00 152.79
Idealized Sample 0.12 0.14 0.42 1.22 238.41 165.28 248.43 321.32
Neu‐Westend 0.17 0.54 0.25 2.65 129.32
Grünewald 0.20 0.73 0.23 3.42 93.34
Lankwitz 0.14 0.30 0.36 2.08 143.15
Hermsdorf 0.17 0.41 0.32 2.33 138.42
Rudow 0.14 0.27 0.42 1.87 173.89
Idealized Sample 0.16 0.38 0.28 2.29 151.49 102.27 157.92 206.28
Marienfelde 0.16 1.30 0.22 9.27 71.64
Märkisches Viertel 0.14 1.32 0.18 10.18 49.79
Lichtenberg 0.15 1.15 0.17 6.20 75.90
Wartenberg 0.18 1.12 0.17 6.53 58.42
Marzahn 0.14 0.96 0.16 5.75 80.75
Idealized Sample 0.11 1.26 0.18 10.74 67.34 40.44 71.11 97.73
Gartenstadt Falkenhöh 0.15 0.50 0.20 3.19 73.86
Reinickendorf West 0.21 0.84 0.20 3.67 87.29
Hufeisensiedlung Britz 0.15 0.49 0.25 2.98 93.97
Haselhorst 0.22 0.82 0.23 3.85 80.80
Neu‐Karow 0.17 0.65 0.21 3.90 80.25
Idealized Sample 0.18 0.63 0.24 3.43 113.82 74.65 119.12 157.85
Charlottenburg 0.34 1.89 0.19 5.49 64.26
Moabit 0.33 1.61 0.19 4.61 86.14
Friedenau 0.37 1.69 0.16 4.25 77.27
Neukölln 0.37 2.04 0.19 5.38 66.46
Prenzlauer Berg 0.42 2.37 0.16 5.01 78.37
Idealized Sample 0.40 2.03 0.17 5.03 82.14 51.83 85.73 114.67
CITY TYPOLOGY NEIGHBOURHOODCOVERAGE
RATIO
FLOOR‐AREA
RATIO
SURFACE /
VOLUME RATIO
AVERAGE
BUILT
HEIGHT
(Floors)
HEAT
ENERGY
DEMAND (kWh/sqm/a)
(Paris)
HEAT
ENERGY
DEMAND (kWh/sqm/a)
(Istanbul)
HEAT
ENERGY
DEMAND (kWh/sqm/a)
(London)
HEAT
ENERGY
DEMAND (kWh/sqm/a)
(Berlin)
Acarkent 0.14 0.36 0.31 2.51 113.86
Küçük Çaml ıca 0.16 0.43 0.28 2.75 115.33
Levent 0.19 0.43 0.33 2.20 140.07
Beylerbeyi 0.11 0.28 0.31 2.34 145.66
Yeniköy 0.18 0.50 0.31 2.51 145.69
Idealized Sample 0.18 0.39 0.38 2.20 182.64 124.61 190.75 248.80
Erenköy 0.32 2.03 0.25 6.46 81.06
Bahcesehir 0.09 0.90 0.23 10.18 68.12
Kagıthane 0.16 1.09 0.22 4.40 140.56
Ugur Mumcu 0.17 1.39 0.25 7.69 70.02
Basaksehir 0.11 0.99 0.24 9.04 58.07
Idealized Sample 0.18 1.65 0.23 9.34 81.32 50.51 85.94 117.07
50. Yıl 0.44 1.74 0.25 3.76 97.25
Ertugrulgazi 0.26 0.35 0.38 1.29 194.36
Altınsehir 0.26 0.71 0.28 2.47 134.66
Gülensu 0.38 0.85 0.33 1.99 165.13
Sultanbeyli 0.35 0.85 0.29 2.16 150.05
Idealized Sample 0.43 0.99 0.19 2.30 149.51 102.15 153.73 196.72
Nenehatun 0.44 2.05 0.22 4.29 93.06
Nuripasa 0.56 2.74 0.21 4.68 81.28
Oruçreis 0.59 2.49 0.24 4.09 86.99
Zafer 0.56 3.15 0.23 5.45 76.29
Denizköskler 0.44 2.02 0.24 4.46 81.02
Idealized Sample 0.50 2.25 0.24 4.51 116.90 77.67 121.10 157.89
Tophane 0.47 2.19 0.24 4.09 113.70
Tarlabas ı 0.53 2.37 0.28 4.16 108.90
Kasap Demirhun 0.54 1.05 0.24 4.70 145.37
Kumkapı 0.56 2.68 0.20 4.02 95.70
Süleymaniye 0.37 1.14 0.24 2.94 111.47
Idealized Sample 0.55 2.20 0.20 3.99 101.59 66.44 105.35 138.28
Istanbul
Detached Housing
High Rise Apartment
Gecekondu
Modern Apartment
Compact Urban Block
Berlin
Detached Housing
Apartment Building
Slab Housing
Row Housing
Compact Urban Block

39
C - A critical review of the heat energy demand modelling
As explained by Erhorn (2007), when modelling energy consumption of real buildings, a
major question for the modeller is the fair balance of the complexity and comprehensiveness
of the model on one side and the available quality of input data and the use of the model
results on the other. When assessing energy consumption for buildings, the quality of the
input data is still a major problem and often underestimated. This requires frequent revisions
of dynamic models when applied to real cases and when aiming to assess the real energy
consumption.
This problem is even more accentuated at the neighbourhood or city-wide level. Here, the
input data is an even greater problem and often may not be available, requiring various
advanced statistical methods to generate datasets. As a consequence, more simplified model
are often used which lead to less exhaustive, but at least more reliable results.
For this study which included a dataset of around 30 million sqm in total, a static model was
chosen to calculate the annual heat energy demand as a theoretic value. It did not aim to
produce real energy consumption values. Instead, the central question was about the relative
effect of urban morphology on heat energy demand from a purely comparative perspective
across the 120 samples, a task for which a static model offers a suitable level of simplicity.
No doubt, a model that takes into consideration the monthly or hourly climate approach
following EN ISO 13790 would give more detailed results and can easily be integrated as
part of follow-up research, where a range of different questions can be analysed in more
detail.
A further constraint for interpreting the results from common modelling approaches, is the
choice of selecting a base scenario, which includes a range of building parameters that were
set constant. The aim of standardizing values that in the real samples are actually quite
different simply helps with the comparativeness of the calculated heat demand across the

40
different case studies. The values were chosen based on a subjective assessment of the
average performance data for historical and modern buildings while reflecting the main
characteristics of the sample.
For example, the ventilation ratio is closer to a mechanical ventilation standard. Generally,
the distortion is much accentuated in older buildings, where air tightness is not ensured and
the ventilation ratio can vary by up to a factor two in older or low standard buildings. This is
the case for the traditional urban block, whereas in modern tower blocks, higher losses might
be caused by higher exposure to winds, leading to higher penetration. In such contexts, the
behavioural attitudes of residents and the availability of mechanical ventilation can
considerably impact on the final results.
Furthermore, the method to assess thermal bridges was simplified, as the same construction
standard was assumed across all samples. The effect of losses through thermal bridges was
set as 5 per cent over the total losses of the facade, while the actual heat dispersion caused by
thermal bridges can be twice as high.
Also, glazing ratios need to be considered more carefully. Most buildings have a glazed
surface which covers between 20 to 25 per cent of the facade surface, reaching peak levels of
35-40 per cent in normal stone or concrete buildings. In the heat demand assessment this
leads to a higher impact of the heat gains through solar radiation. Having chosen a u-value
which represents double glazing standard, the effect on the heat losses is still noticeable, but
if the standard would be set to passive house or low consumption house standard, glazing can
be increased further for access to daylight while heat losses are minimized

41
Bibliography
APUR, 2007, "Consommations d'énergie et émissions de gaz à effet de serre liées au chauffage des résidences principales parisiennes", (Paris)
Arboit M, Diblasi A, Fernández Llano J C, de Rosa C, 2008, "Assessing the solar potential of low-density urban environments in Andean cities with desert climates: The case of the city of Mendoza, in Argentina" Renewable Energy 33 1733-1748
Baker N, Steemers K, 1995, "The LT Method 2.0: An energy design tool for non-domestic buildings", (Cambridge Architectural Research Ltd., Cambridge (United Kingdom) ; Royal Inst. of British Architects, London (United Kingdom) London) p 83
Baker N, Steemers K, 1996, "LT Method 3.0 — a strategic energy-design tool for Southern Europe" Energy and Buildings 23 251-256
Baker N, Steemers K, 2000 Energy and environment in architecture: a technical design guide (E & FN Spon)
Berghauser Pont M, Haupt P, 2004, "Spacemate: the spatial logic of urban density", ([Delft] : DUP Science)
Capeluto I G, Shaviv E, 2001, "On the use of ‘solar volume’ for determining the urban fabric" Solar Energy 70 275-280
Cheng V, Steemers K, Montavon M, Compagnon R, 2006, "Urban Form, Density and Solar Potential" The 23rd Conference on Passive and Low Energy Architecture 6
Erhorn H, 2007, "Bedarf - Verbrauch: Ein Reizthema ohne Ende oder die Chance für sachliche Energieberatung? ", (Fraunhofer-Institut für Bauphysik Stuttgart)
Holden E, 2004, "Ecological footprints and sustainable urban form" Journal of Housing and the Built Environment 19 91-109
Howard B, Parshall L, Thompson J, Hammer S, Dickinson J, Modi V, 2012, "Spatial distribution of urban building energy consumption by end use" Energy and Buildings 45 141-151
Hui S, 2001, "Low energy building design in high density urban cities" Renewable Energy 24 627-640
Kämpf J H, Montavon M, Bunyesc J, Bolliger R, Robinson D, 2010, "Optimisation of buildings’ solar irradiation availability" Solar Energy 84 596-603
Knowles R L, 1974 Energy and form: an ecological approach to urban growth (Massachusetts Institute of Technology,Cambridge, MA)
Lariviere I, Lafrance G t, 1999, "Modelling the electricity consumption of cities: effect of urban density" Energy Economics 21 53-66
Levine M, Ürge-Vorsatz D, Blok K, Geng L, Harvey D, Lang S, Levermore G, Mongameli Mehlwana A, Mirasgedis S, Novikova A, Rilling J, Yoshino H, 2007, "Residential and commercial buildings", in Climate Change 2007: Mitigation. Contribution of Working Group III to the Fourth Assessment Report of the Intergovernmental Panel on Climate Change Eds E Jochem, H Xu pp 387-446
March L, Trace M, Architecture U o C S o, 1969 The land use performance of selected arrays of built forms (Cambridge University, School of Architecture)

42
Mardaljevic J, Rylatt M, 2003, "Irradiation mapping of complex urban environments: an image-based approach" Energy and Buildings 35 27-35
Martin L, 1967, "Architects' approach to architecture" RIBA Journal
Martin L, March L, 1972 Urban Space and Structures (Cambridge University Press)
Mayor of London, 2010, "Delivering London's energy future. The Mayor's draft Climate Change Mitigation and Energy Strategy for consultation with the London Assembly and functional bodies.", (London)
Mindali O, 2004, "Urban density and energy consumption: a new look at old statistics" Transportation Research Part A: Policy and Practice 38 143-162
Mitchell G, 2005, "Urban Development, Form and Energy Use in Buildings: A review for the Solutions Project", in Sustainability of Land Use and Transport in Outer Neighbourhoods (School of Geography and Institute for Transport Studies, The University of Leeds, Leeds)
Montavon M, Scartezzini J, Compagnon R, 2004, "Comparison of the solar energy utilisation potential of different urban environments ", in Plea2004 - The 21th Conference on Passive and Low Energy Architecture (Eindhoven)
Morello E, Ratti C, 2009, "Sunscapes: ‘Solar envelopes’ and the analysis of urban DEMs" Computers, Environment and Urban Systems 33 26-34
Newton P, Tucker S, Ambrose M, 2000, "Housing form, energy use and greenhouse gas emissions", in Achieving Sustainable Urban Form (E & FN Spon London, New Youk) pp 74-83
Okeil A, 2010, "A holistic approach to energy efficient building forms" Energy and Buildings 42 1437-1444
Olgyay V, 1967, "Bioclimatic orientation method for buildings" International Journal of Biometeorology 11 163-174
Olgyay V, Olgyay A, 1963 Design with climate (Princeton University Press)
Pérez-Lombard L, Ortiz J, Pout C, 2008, "A review on buildings energy consumption information" Energy and Buildings 40 394-398
Pout C, 2000, "The national nondomestic buildings energy and emissions model" Environment and Planning B: Planning and Design 27
Ratti C, Baker N, Steemers K, 2005a, "Energy consumption and urban texture" Energy and Buildings 37 762-776
Ratti C, Di Sabatino S, Britter R, 2005b, "Urban texture analysis with image processing techniques: winds and dispersion" Theoretical and Applied Climatology 84 77-90
Ratti C, Morello E, 2005, "SunScapes: extending the 'solar envelopes' concept through 'iso-solar surfaces'" The 22nd Conference on Passive and Low Energy Architecture
Ratti C, Richens P, 1999, "Urban Texture Analysis with Image Processing Techniques" Proceedings of Computers in Building: CAAD Futures'99 1-16
Richens P, 1997, "Image Processing for Urban Scale Environmental Modelling", (Prague )
Roaf S, Hancock M, 1992 Energy efficient building: a design guide (Halsted Press, New York)

43
Robinson D, 2006, "Urban morphology and indicators of radiation availability" Solar Energy 80 1643-1648
Robinson D, Stone A, 2004, "Solar radiation modelling in the urban context" Solar Energy 77 295-309
Rogner H-H, Zhou D, Bradley R, Crabbé P, Edenhofer O, Hare B, Kuijpers L, Yamaguchi M, 2007, "Introduction", in Climate Change 2007: Mitigation. Contribution of Working Group III to the Fourth Assessment Report of the Intergovernmental Panel on Climate Change Eds H Lee, R Odingo pp 95-116
Salat S, 2009, "Energy loads, CO2 emissions and building stocks: morphologies, typologies, energy systems and behaviour" Building Research & Information 37 589-609
Sarkar A, 2009, "Low Energy Urban Block: Morphology and planning guidelines ",
Steadman P, 1979, "Energy and patterns of land use", in Energy conservation through building design (Mc Graw Hill, New York) pp 246-260
Steadman P, Bruhns H, Holtier S, Gakovic B, 2000, "A classification of built forms" Environment and Planning B: Planning and Design 27 73-91
Steemers K, 2003, "Energy and the city: density, buildings and transport" Energy and Buildings 35 3-14
Swan L G, Ugursal V I, 2009, "Modeling of end-use energy consumption in the residential sector: A review of modeling techniques" Renewable and Sustainable Energy Reviews 13 1819-1835
UN-Habitat, 2008, "State of the World's Cities 2008/2009: Harmonious Cities", (United Nations Human Settlements Programme, London.)
Utley J, Shorrock L, 2008, "Domestic energy fact file 2008", Ed U D o E a C Change (Crown Copyright, London)
WBCSD, 2009, "Energy Efficiency in Buildings: Transforming the Market", (World Business Council for Sustainable Development)
Webster C J, 1996, "Urban Morfological Fingerprints" Environment and Planning B: Planning and Design 23 279-297
Yannas S, 1994 Solar Energy and Housing Design: Principles, objectives, guidelines (Architectural Association)