Philip Chronican Chief Financial Officer · Philip Chronican Chief Financial Officer 21 March 2002....
28
CSFB Asian Investment Conference, March 2002 1 Delivering value Philip Chronican Chief Financial Officer 21 March 2002
Transcript of Philip Chronican Chief Financial Officer · Philip Chronican Chief Financial Officer 21 March 2002....

CS
FB A
sian Investment C
onference, March 2002
1
Delivering value
Philip ChronicanChief Financial Officer21 March 2002

CS
FB A
sian Investment C
onference, March 2002
2
Disclaimer
The material contained in the following presentation is intended to be general background information on Westpac Banking Corporation and its activities as at 21 March 2002.
The information is supplied in summary form and is therefore not necessarily complete. Also, it is not intended that it be relied upon as advice to investors or potential investors, who should consider seeking independent professional advice depending upon their specific investment objectives, financial situation or particular needs.
CS
FB A
sian Investment C
onference, March 2002
3
l Westpac in context
l What’s topical
l Scoping the potential
l Points of differentiation
Today’s focus

CS
FB A
sian Investment C
onference, March 2002
4
Westpac
Established 1817 and one of four majorcommercial banks in Australia
l A$190 billion in assets (30 Sept 2001)
l Market capitalisation A$28 billion
l Within the world’s top 100 banks#
# euromoney June 2001

CS
FB A
sian Investment C
onference, March 2002
5
l MarketsØ Australia, New Zealand & near Pacific
l ProductsØ Full range of corporate, business and
consumer financial services
l CustomersØ 8.2 million
l OperationsØ Multi-channel integrated distribution networkØ Willing to partner/outsource
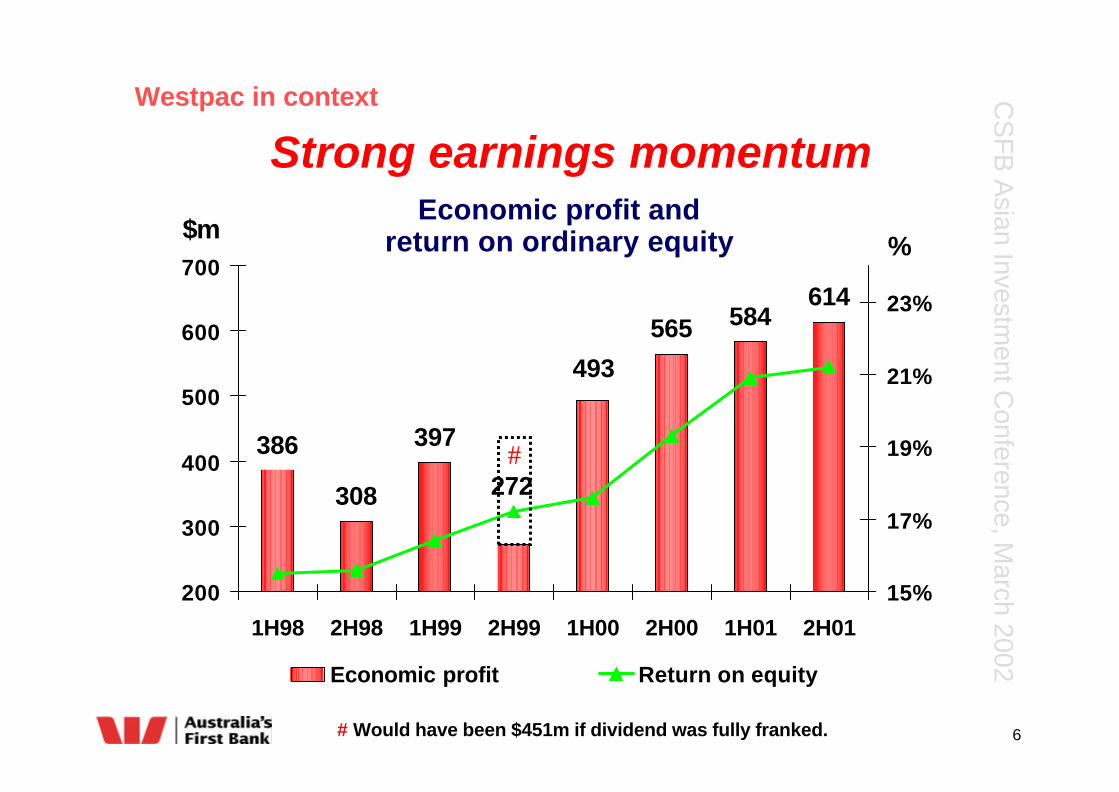
Westpac in context
Meeting customers’ financial services needs
CS
FB A
sian Investment C
onference, March 2002
6
Strong earnings momentum
386
308
397
565 584614
272
493
200
300
400
500
600
700
1H98 2H98 1H99 2H99 1H00 2H00 1H01 2H01
15%
17%
19%
21%
23%
Economic profit Return on equity
Economic profit andreturn on ordinary equity %
$m
# Would have been $451m if dividend was fully franked.
#
Westpac in context

CS
FB A
sian Investment C
onference, March 2002
7
l Westpac in context
l What’s topicalØ Credit qualityØ Wealth managementØ Capital reviewØ Acquisition strategy
l Scoping the potential
l Points of differentiation
Today’s focus

CS
FB A
sian Investment C
onference, March 2002
8
Recent trends positive
0.0
1.0
2.0
3.0
4.0
5.0
6.0
FY 94 FY 95 FY 96 FY 97 FY 98 FY 99 FY 00 1H 01 FY 01
Impaired 90 days past due well secured Watchlist & substandard
%
Stressed loans % of total commitments
Credit Quality

CS
FB A
sian Investment C
onference, March 2002
9
0.0
0.5
1.0
1.5
2.0
2.5
3.0
Sep-96 Sep-97 Sep-98 Sep-99 Sep-00 Sep-01 Dec-01
%
Mortgages Other consumer loans Business Banking *
90 day delinquencies
# Proportion of loans and acceptances* Data not available prior to 1998
7%
27%
49%
#
Credit Quality

CS
FB A
sian Investment C
onference, March 2002
10
0.0%
0.5%
1.0%
1.5%
2.0%
2.5%
3.0%C
BA
BK
WB
C
NA
B
PN
C
AN
Z
BA
C
WF
C
TD
WB
JPM
/Ch
ase
FB
F
RB
C
BM
O
CIB
C
ON
E
BN
S
Australian Peers US Peers Canadian Peers
Impaired assets also below peersImpaired Assets / Loans
(International Peer Comparison *)
Westpac
*Based on most recent published results
Credit Quality

CS
FB A
sian Investment C
onference, March 2002
11
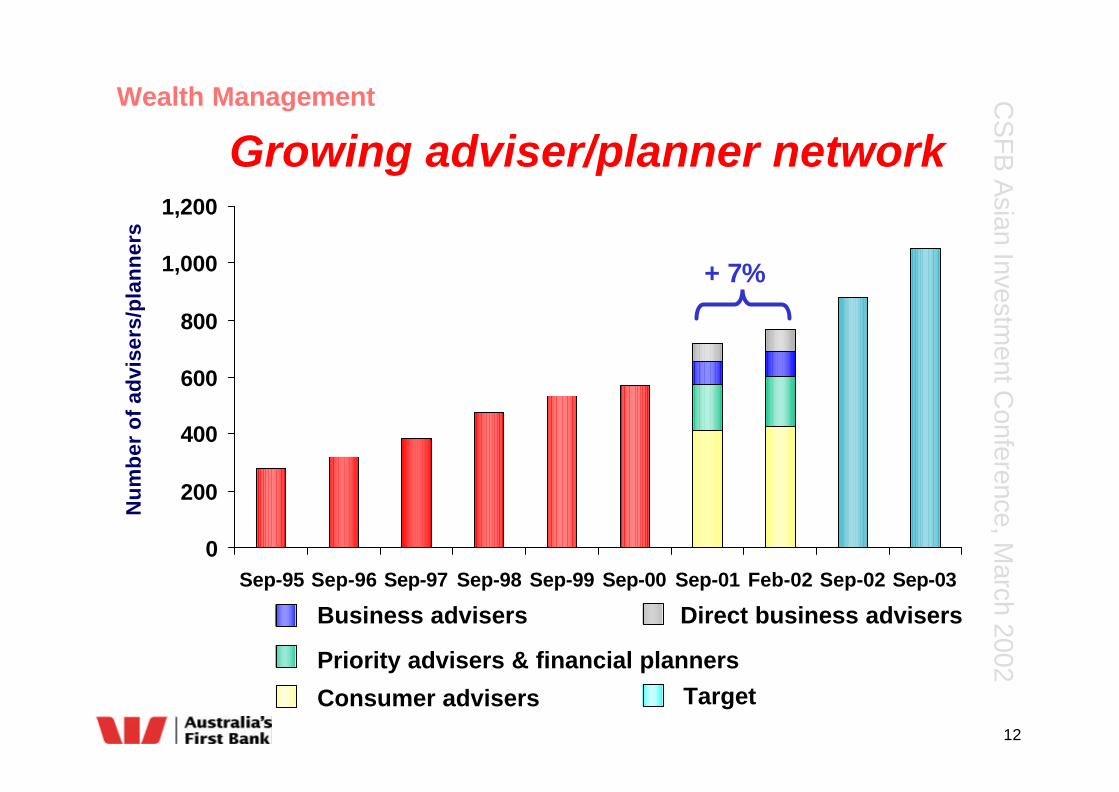
Seeking to increase customer penetration
l Leverage comparative advantageØ large customer baseØ understanding of customer needs
l Expand distribution size and capability
l Access and integrate ‘best of breed’ products
l Balance growth and profitable returns
Wealth Management
CS
FB A
sian Investment C
onference, March 2002
12
Growing adviser/planner network
0
200
400
600
800
1,000
1,200
Sep-95 Sep-96 Sep-97 Sep-98 Sep-99 Sep-00 Sep-01 Feb-02 Sep-02 Sep-03
Nu
mb
er o
f ad
vise
rs/p
lan
ner
s
Consumer advisers
Priority advisers & financial planners
Business advisers
Target
Direct business advisers
+ 7%
Wealth Management

CS
FB A
sian Investment C
onference, March 2002
13
6.7
7.2
6.3
6.66.3
6.1
4.0
4.5
5.0
5.5
6.0
6.5
7.0
7.5
8.0
TOE / RAA Tier 1 ratio1999 2000 2001
Ratios at top end of target range
%
* Target range
6.5%6.0%*
5.8%5.6%*
Capital

CS
FB A
sian Investment C
onference, March 2002
14
Acquisition strategy
l No particular requirement to acquire customers
l Focused on filling strategic gaps and enhancing capabilitiesØ Wealth management - predominantly distribution
Ø Longer term growth options
l Disciplined approachØ Aligned with strategic direction
Ø Strict valuation criteria
Ø Minimal franchise stress

CS
FB A
sian Investment C
onference, March 2002
15
l Westpac in context
l What’s topical
l Scoping the potential
ØCustomer base
ØEfficiency improvements
l Points of differentiation
Today’s focus
CS
FB A
sian Investment C
onference, March 2002
16
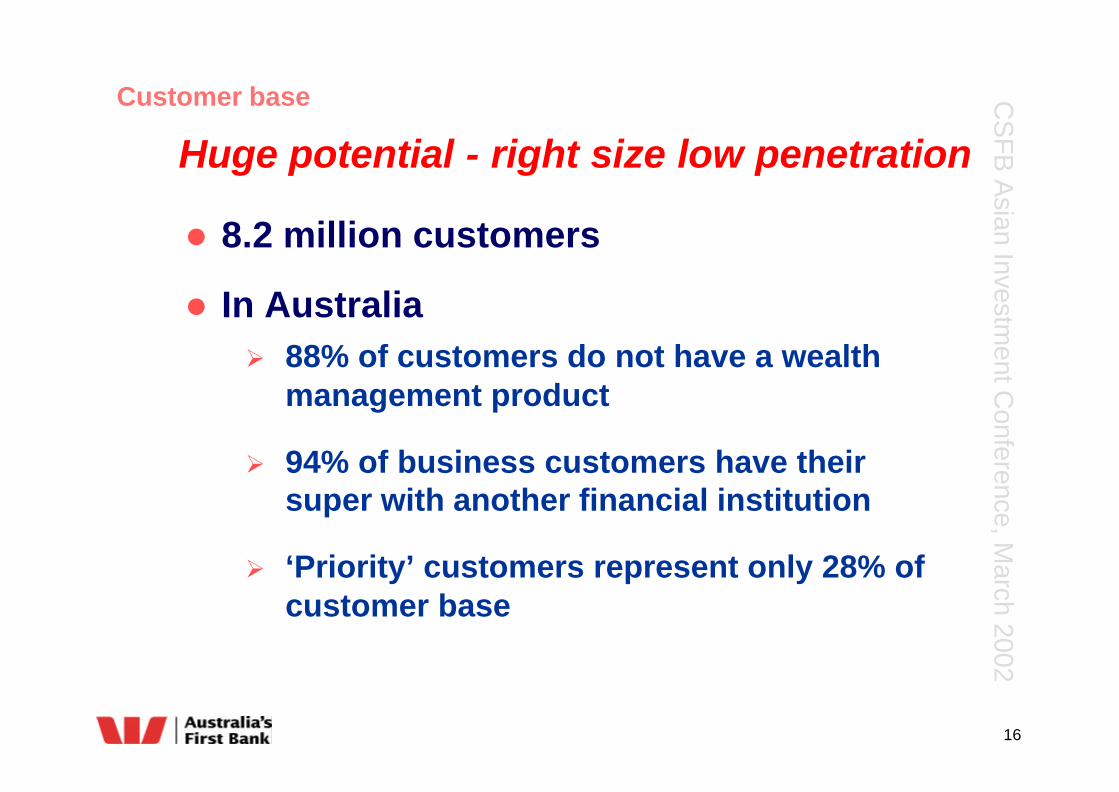
Huge potential - right size low penetration
l 8.2 million customers
l In AustraliaØ 88% of customers do not have a wealth
management product
Ø 94% of business customers have their super with another financial institution
Ø ‘Priority’ customers represent only 28% of customer base
Customer base

CS
FB A
sian Investment C
onference, March 2002
17
11
9
8
6
14
10
0 20 40 60 80 100
Total
Middle Business
Small Business
Private Bank
Priority
Personal
Financial Services penetration
Source : Westpac data and analysis, September 2001
Consum
erB
usin
ess
Customer base

CS
FB A
sian Investment C
onference, March 2002
18
45
50
55
60
65
1997 1998 1999 2000 2001 2H2001
WBC Peer Average
Expense to income ratio*
%
* Excludes goodwill
50.9%
Efficiency improvements
Major efficiency gains

CS
FB A
sian Investment C
onference, March 2002
19
l Westpac in context
l What’s topical
l Scoping the potential
l Points of differentiation
Ø Customer centric focus
Ø Sustainability
Ø Performance culture
Today’s focus

CS
FB A
sian Investment C
onference, March 2002
20
Customer focus
l Segmented customer base
l Doubled number of priority customers between 1998 and 2001
l Major improvement in customer response times
l Leader in customer satisfactionØ Top rated against peers in Consumer, business
middle markets and small business#
# Roy Morgan (consumer) and Greenwich Associates (business) –2001 Surveys – rank against four major Australian banks

CS
FB A
sian Investment C
onference, March 2002
21
Proactive social and environmental agenda...
l Board Social Responsibility Committee
l One of 10 banks globally developing Triple Bottom Line industry reporting standards
l UNEP Financial Institutions working committee for environmental management and reporting
l Active member of Australian Government sustainability finance sector Round Table
Sustainability

CS
FB A
sian Investment C
onference, March 2002
22
l Dow Jones Sustainability IndexØ Rated in top 3 banks worldwide Ø One of only 11 Australian companies in index
l Australian Good Reputation IndexØ 1st in top 100 publicly listed companies
l Corporate Monitor Sustainability RatingsØ Only top 150 listed company with a 5-star social and
environmental rating
Sustainability
Enhancing brand and customer loyalty

CS
FB A
sian Investment C
onference, March 2002
23
Changing behaviours
l Economic profit is the driverØ Incentives and motivational leversØ Alignment to common goals and strategy
l Right people, right job and ‘consequence’ management
l Internal and external benchmarking
l Strong planning, control and accountability
l Simplified structure and autonomy of operation
Performance culture

CS
FB A
sian Investment C
onference, March 2002
24
CUSTOMERSATISFACTION
Flowing through to the bottom line
RETURNS
Incentives / rewards
EMPLOYEE COMMITMENT
Employee Satisfaction
People systems
Sustainability
Simplification
Image & reputation

CS
FB A
sian Investment C
onference, March 2002
25* Westpac internal rolling morale index.
Strong staff morale
Industry Norms75th Percentile
50th Percentile
Staff morale index*Business and Consumer Banking
5.0
5.5
6.0
6.5
7.0
7.5
8.0
8.5
9.0
Jan-
00M
ar-0
0M
ay-0
0Ju
l-00
Sep-
00No
v-00
Jan-
01M
ar-0
1M
ay-0
1Ju
l-01
Sep-
01No
v-01
Jan-
02
CS
FB A
sian Investment C
onference, March 2002
26
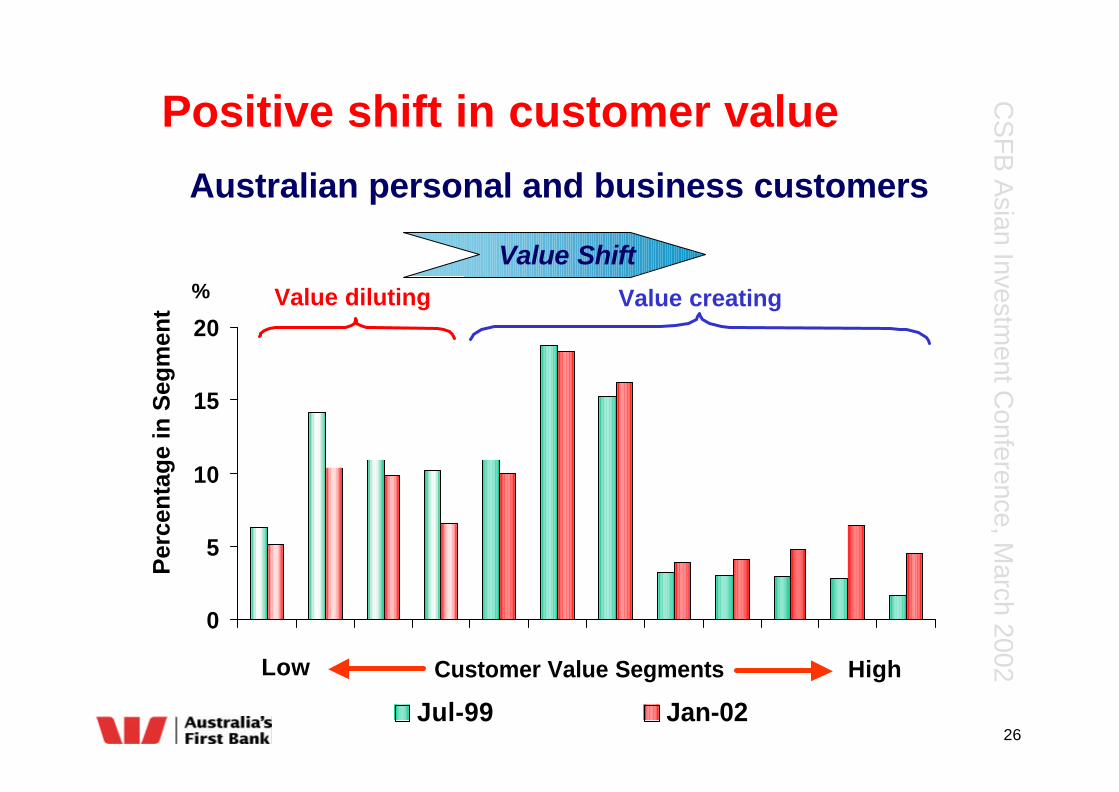
0
5
10
15
20
Customer Value Segments
Jul-99 Jan-02
Positive shift in customer value
Low High
%
Per
cen
tag
e in
Seg
men
tAustralian personal and business customers
Value diluting Value creating
Value Shift

CS
FB A
sian Investment C
onference, March 2002
27
Summary of key driversMedium Term Outlook
Revenue growth 5.5% - 6.5%
Expense growth 0% - 2%
UP growth 11%-13%
Bad debts 25 - 35 bps
Tax rate 29% - 31%
NPAT growth 8% - 13%
Surplus capital growth 3% - 4%
Double digit EPS growth without stretching assumptions

CS
FB A
sian Investment C
onference, March 2002
28