Philadelphia’s Crowded, Costly Jails - Prison Legal …€™s Crowded, Costly Jails: The Search...
44
Philadelphia’s Crowded, Costly Jails: The Search for Safe Solutions
Transcript of Philadelphia’s Crowded, Costly Jails - Prison Legal …€™s Crowded, Costly Jails: The Search...

Philadelphia’s Crowded, Costly Jails:
The Search for Safe Solutions

Aerial photo of the Philadelphia Prison Systemmain campus in Northeast Philadelphia
CREDIT: POLICE AERIAL UNIT
The Pew Charitable Trusts’ Philadelphia Research Initiative provides timely, impartial research and analysis on key issues facing Philadelphia for the benefit of the city’s citizensand leaders. Pew is a nonprofit organization that applies a rigorous, analytical approachto improve public policy, inform the public and stimulate civic life. For more information,visit www.pewtrusts.org/philaresearch.
Philadelphia’s Crowded, Costly Jails:
The Search for Safe Solutions

Foreword 1
Executive Summary 2
1. The Issue 6
2. The Philadelphia Prison System: An Overview 10
3. How Philadelphia’s Jail Population Rose: 1999–2008 13
4. How Philadelphia’s Jail Population Fell: 2009–2010 19
5. Decision Points for Admission to Jail 22
6. What is Being Done to Reduce the Jail Population 29
7. What More Can be Done to Reduce the Jail Population 32
Notes on Methodology 36
Acknowledgements 38
CONTENTS

FO
RE
WO
RD
1
FROM THE MOMENT THE PHILADELPHIA RESEARCH INITIATIVE came into existence, taking a hard
look at the Philadelphia Prison System was near the top of our agenda. We knew that the population in
the city’s jails —and the cost to the taxpayers—had been rising year after year with seemingly no end in
sight. We wondered whether it had to be this way.
In the summer of 2009, as we turned our attention to the subject, there were about 9,400 men and
women housed in the prison system, which occupies a vast complex along State Road in Northeast
Philadelphia. On a per capita basis, among the 50 counties and cities with the most inmates, Philadelphia
had the fourth highest inmate population in the country.
Then, something unexpected happened. The inmate population started to decline. And it kept falling
into 2010.
The recent decline tells us something important: The city’s jail population can be controlled when officials
in the criminal justice system work together to make it happen. And if that work is undertaken with cau-
tion, creativity and an understanding of the makeup of the jail population, reducing the numbers can be
done while protecting public safety.
Much of the drop in Philadelphia’s inmate population is due to state legislation that has moved one
group of convicted criminals from the city jails to the state prisons. Some of it is due to a reduction in ar-
rests. Measures are being taken to make the criminal justice system more efficient and more innovative
in the ways it deals with incarceration.
This report does a number of things. It analyzes why the city’s jail population rose for most of the last
decade. It studies why the population fell in the past year. It examines what is being done to manage the
population, and it looks at measures in place elsewhere that might be worth considering for Philadelphia.
In doing so, it builds on the work on state prisons and corrections done by our colleagues at the Public
Safety Performance Project of the Pew Center on the States. The Public Safety Performance Project has
helped states such as Texas, Nevada and Kansas advance fiscally sound, data-driven policies and practices
in sentencing and corrections that protect public safety, hold offenders accountable and control correc-
tions costs.
This is not a report about conditions inside the city jails. The focus is on how people come to be in jail,
how long they stay and how they get out.
Philadelphia’s Crowded, Costly Jails: The Search for Safe Solutions is primarily the work of Claire Shu-
bik-Richards, senior associate at the Philadelphia Research Initiative. Our original data analysis, which is
central to this report, was performed by Don Stemen, assistant professor of criminal justice at Loyola
University Chicago.
The Philadelphia Prison System is an integral part of a criminal justice system designed to protect the
lives and property of all Philadelphians. Our purpose in this report is to give policy makers and the public
the information and perspective necessary to understand the issues connected to managing this system.
Larry Eichel
Project Director
The Philadelphia Research Initiative
Foreword >>

2
PH
ILA
DE
LPH
IA’S
CR
OW
DE
D,
CO
ST
LY J
AIL
S:
TH
E S
EA
RC
H F
OR
SA
FE
SO
LUT
ION
S
This increase in spending has been driven by a rising number
of inmates. As of mid-2008, the most recent date for which
comparative numbers are available, Philadelphia had the
fourth-highest jail population on a per capita basis among the
cities and counties with the nation’s 50 largest jail populations.
From 1999 through 2008, the Philadelphia Prison System saw
its average daily inmate count climb by 45 percent, peaking
at 9,787 for the month of January 2009. This was one of the
largest such increases in the country, and it came at a time
when jail populations in the nation’s two largest jurisdictions,
New York City and Los Angeles County, were declining.
Since mid-2009, however, the population in the prison system
has fallen steadily; the average daily population stood at
8,464 for March 2010, down 13 percent from the peak. And
some city officials, including Prison Commissioner Louis Giorla
and Deputy Mayor for Public Safety Everett Gillison, say that
they believe that the population can be substantially lowered
without jeopardizing public safety.
These developments in the inmate population—both the
long-term rise and short-term fall—generally have not tracked
the crime rate; for most of the past decade, as the inmate
Executive SummaryToday, the government of the city of Philadelphia spends seven cents out of every tax dollar on holding people
in its jails. That is more than it spends on any other function besides police and human services—and as much
as it spends on the streets and health departments combined. Its spending on jails is nearly as high as that of
Cook County, Illinois, even though Cook County, which includes the city of Chicago, has more than three times
as many residents as Philadelphia. Over the last 10 years, the departmental budget has more than doubled,
reaching $240 million in the current fiscal year. That figure, however, understates the true cost of prison oper-
ations, as it does not include employee benefits. With benefits, the number is about $290 million.
PHILADELPHIA PRISON SYSTEM BUDGET
Source: Philadelphia Prison System; Mayor’s Budget
Note: Does not include employee benefits.
* Estimated FY2010 budget from the Mayor’s proposed FY2011-2015 Five-Year Financial Plan
** Projected FY2011 budget from the Mayor’s proposed FY2011-2015 Five-Year Financial Plan
0
50
100
150
200
250
1999
2009
2010
*
2008
2007
2006
2005
2004
2003
2002
2001
2000
2011
**
$118$131
$142$155
$172$184
$193 $194$208
$224$241 $240
$234
[IN M
ILLI
ON
S]

EX
EC
UT
IVE
SU
MM
AR
Y
3
population numbers were rising, the arrest numbers often
were declining. Rather, the shifts in the population are related
primarily to changes in procedures, legislation and policies in-
volving the police, the courts and the various elements of the
criminal justice system.
To a large extent, the evidence in this report indicates that the
size of the population of the Philadelphia Prison System is
within the power of policy makers to control—without com-
promising the fight against crime. It suggests that Philadelphia
can have fewer people in jail, save money and be no less safe.
Some of the factors that dictate the size of the inmate popu-
lation have also contributed to other problems in the city’s
criminal justice system. The same delays that can result in the
guilty going free can keep the accused in custody longer than
is necessary.
Leaders of Philadelphia’s criminal justice system, motivated in
part by the pressure to control spending throughout city gov-
ernment, have been working together for the last few years to
reduce the inmate population, largely under the auspices of the
city’s Criminal Justice Advisory Board. As the latest numbers in-
dicate, they have had a measure of success. They see no con-
tradiction between a lower jail population and safe streets.
The recent population drop has allowed the city to budget
about $15 million less for the prison system for the year be-
ginning July 1, 2010 than for the previous year. More substan-
tial savings will be realized if the population continues to fall.
That would allow for the closure of individual facilities and re-
ductions in the size of the system’s workforce.
It is often said that it costs $95 to keep someone in a Philadel-phia jail for a day. But that figure—which is derived by taking
the total annual cost of the system and dividing it by the num-ber of inmate-days consumed in a year—does not representhow much the system saves by reducing the daily populationby one. Because most jail costs are fixed, the savings is onlyabout $20 for the first day, when clothing is distributed andmedical tests are conducted, and less for every day thereafter,our analysis shows. The savings are higher for inmates whoneed costly medical or mental-health treatment.
Despite its name, the Philadelphia Prison System is actually acomplex of jails; prisons are usually thought of as state andfederal institutions where convicted criminals serve out sen-tences of substantial length. As such, Philadelphia’s inmatepopulation consists of three groups: accused individuals beingheld pretrial, convicts serving out sentences of less than twoyears, and probationers and parolees who have violated theterms of their community supervision.
Behind the Long Rise and RecentDecline of the Jail PopulationOur data analysis shows that the rise in the inmate populationfrom 1999 through 2008 had little to do with the convictedcriminals and mostly to do with the pretrial population:
• During that decade, the percentage of bed-days in thePhiladelphia jails consumed by pretrial inmates on an an-nual basis rose from 44 percent of the total to 57 percent.
• Most of the increase in pretrial admissions came fromindividuals charged with misdemeanors, which rangefrom disorderly conduct and loitering to simple assaultand some types of theft of up to $2,000. The number ofinmates admitted pretrial on felony charges remainedrelatively constant.
Riverside Correctional Facility
CREDIT: ROBERT LECONEY
4
PH
ILA
DE
LPH
IA’S
CR
OW
DE
D,
CO
ST
LY J
AIL
S:
TH
E S
EA
RC
H F
OR
SA
FE
SO
LUT
ION
S
• In recent years, fewer individuals have been releasedwithout bail than in years past; in cases where bail hasbeen set, the average amount of the bail has risen.These two factors, higher bail and more people being or-dered to post it, have driven up the number of peoplewho spend time in jail before the resolution of theircases. The guidelines laid out for the magistrates whoset bail have not changed, but the magistrates are fol-lowing the guidelines in only about half of the cases.
• In the past few years, several other factors have con-tributed to the rising pretrial numbers. The police havemade more arrests for drug possession. And changes instate law have led to more arrests for drunk driving andto higher bail being set for individuals charged with car-rying a firearm without a license.
• Compared to other urban jurisdictions, Philadelphiahad—and still has—a relatively large group of inmates,15 percent, who stayed in jail for 120 days or more await-ing trial. This is due primarily to the length of the courtprocess. Many pretrial stays are less than two weeks.
In addition, the Philadelphia Prison System experienced asteady increase in the number of inmates jailed for violatingthe terms of their probation (community supervision in lieuof incarceration) and parole (community supervision after in-carceration):
• The number of individuals admitted for such violationswent from a low of 3,101 in 2000 to 5,900 in 2008, a riseof 90 percent.
• Those individuals were staying in jail longer. Their aver-age length of stay, which was 49 days in 2000, rose ashigh as 73 days in 2007. One reason is that the courtprocess for hearing a violation can be cumbersome andlengthy.
The decline in the inmate population started early in 2009 andaccelerated as the year went on. Several factors contributedto the drop:
• Most important, there was a sharp decrease in thenumber of sentenced inmates in the city jails due largelyto a change in state law. In the fall of 2008, the state leg-islature ended a practice that had given individuals withsentences of two to five years the option of staying in thePhiladelphia Prison System, at city expense, rather than
doing their time in a state prison at state expense. As aresult, several hundred inmates were moved from thecity to the Pennsylvania Department of Corrections. Oth-ers are now going to state prison upon sentencing ratherthan staying in the city jails.
• In addition, crime declined in Philadelphia in 2009, and
arrests were down by 11 percent. Admissions declined
by 5 percent. While the jail population and the arrest to-
tals have not always moved in the same direction, they
are doing so now.
• A number of changes related to probation appear to
have played a role in reducing the city’s jail population. In
2009, for the first time in a decade, new cases accepted
by the Adult Probation and Parole Department leveled off
and, with it, the number of people incarcerated for viola-
tions. At the same time, the department’s reorganization
made it easier for individuals deemed to be at low risk of
committing major crimes to comply with the terms of
their supervision. And the Philadelphia court system inau-
gurated a specialty court to hear violations of probation
and parole more quickly.
Strategies to Reduce the Jail Population SafelyIn Philadelphia’s criminal justice system, there are six decision
points that determine whether an individual will be sent to jail.
They are arrest, charging by the district attorney’s office, pre-
liminary arraignment, disposition, probation violations and
outstanding warrants.
For policy makers looking to control the jail population, there
is no one decision point that holds the key, nor is there any
single solution. Their challenge is to build on progress already
made while protecting public safety; crime is far and away the
top local concern of city residents, according to polls done by
the Philadelphia Research Initiative in 2009 and 2010.
Our analysis shows that the size of the jail population in
Philadelphia is driven largely by inmates held prior to trial, not
by convicted criminals. So the greatest advances are likely to
be achieved by focusing on the parts of the criminal justice
system that impact that group.

EX
EC
UT
IVE
SU
MM
AR
Y
5
Among the steps being taken to streamline the criminal justice
system—and reduce the jail population—are these:
• District Attorney R. Seth Williams is restructuring his of-
fice’s charging unit with the intent of weeding out weak
cases early. Although reducing the jail population is not the
primary goal of this change, it could contribute to that end.
• Through the use of videoconferencing and other meas-
ures, the court system is expanding the use of “crash
court,” an expedited-plea process in Municipal Court for
people accused of lower-level misdemeanors and being
held pretrial. One purpose of crash court is to avoid situa-
tions in which the indigent, if unable to post even modest
bail, wind up spending more time in jail pretrial than they
would have if convicted.
• City officials have begun the process of planning what is
known as a day reporting center as an alternative to jail.
Exactly who would be eligible to use the center remains
to be seen.
As part of this study, we examined measures taken to address
the size of the jail populations in other jurisdictions. From that
research, a number of policy options emerged. They include
the following:
• Expanding the options for diverting troubled, low-leveloffenders out of the court system so that their addictionsor mental health problems can be addressed in a more ap-propriate setting, as happens in Bexar County, Texas.
• Revitalizing Philadelphia’s often-ignored bail guidelineswith the goal of identifying defendants accused of rela-tively minor crimes who are at low-risk of failing to appearin court and allowing as many of them as possible to stayout of jail pending trial. Guidelines in New York City andMontgomery County, Maryland, appear to be working.
• Expanding the range of pretrial services so that more de-fendants can remain in the community, as has been donein Washington, D.C.
• Developing new responses to probation violations sothat so-called technical infractions, such as missing a meet-ing with a probation officer, can be punished without send-ing the individual back to jail. The state of Georgia hasdone this.
• Devising programs—as New York City and Santa CruzCounty, California, have—to allow defendants not in cus-tody to deal with missed court dates and probation ap-pointments quickly and effectively without the threat ofswift incarceration.
• Taking some of the savings from reducing the jail popu-lation and putting the money into programs aimed at fur-ther reducing the population—with the goal of producingadditional savings in the years to come. Federal legislationto encourage such investment is pending.
• Tracking the performance of the criminal justice systemto give officials a clear sense of the impact of various re-forms and potential reforms—on the jail population andother elements of the system.
This is a time of great ferment in the Philadelphia criminal jus-
tice system. A series of budget crises has placed renewed em-
phasis on reducing the jail population, saving money and
making the entire system more efficient. Local criminal justice
stakeholders, having made some progress on both fronts, are
planning additional reforms. More are likely to come from the
Pennsylvania Supreme Court, which has created a panel to
look into the operations of the criminal courts in Philadelphia.
This report is intended to help those policy makers and inter-
ested citizens chart an informed course for the future.
6
PH
ILA
DE
LPH
IA’S
CR
OW
DE
D,
CO
ST
LY J
AIL
S:
TH
E S
EA
RC
H F
OR
SA
FE
SO
LUT
ION
S
The decline in the number of inmates caused prison spending,
which had more than doubled in the previous decade, to level off
at an estimated $240 million for fiscal year 2010—about $9 million
below the figure officials had budgeted. It also allowed city officials
to do something they had not done in a very long time: allocate
less money for the prison system for the next fiscal year than for the
current one.
Neither the long-term rise in the prison population nor the recent
fall is an inexplicable phenomenon. Nor is either one directly con-
nected to the crime rate in Philadelphia, although the drop in ar-
rests starting last year is a factor in the recent population decline.
Rather, the rise and fall of the population are the result of adminis-
trative, legislative and policy decisions made at various levels of the
criminal justice system.
The overriding lesson from these developments is this: to a substan-
tial degree, the size of Philadelphia’s prison population is within the
control of public officials.
DEFINING THE SYSTEM
Although Philadelphia calls its detention facilities “prisons,” they
are, in fact, “jails,” as the term is commonly used, meaning local in-
stitutions for housing individuals awaiting trial or those convicted
of relatively minor crimes. The word “prison” usually is reserved for
state institutions for the confinement of people convicted of more
serious crimes.
This report looks at the size and nature of the inmate population that
drives the city’s spending on its jails. Our research shows that the
changes in the inmate population over the last 10 years, first up and
now down, have had less to do with murderers, rapists and robbers
than with individuals charged with offenses such as drug possession
and drunk driving. And the long-term rise in population had less to
do with convicted criminals than accused individuals being held pre-
trial.
The factors at the heart of the long-term growth in the population
of the Philadelphia Prison System are some of the same ones that
have contributed to other problems in the city’s criminal justice sys-
tem, including how long it takes to resolve cases. Prolonged court
proceedings can result in dangerous criminals going free without
ever facing the charges against them. And they can keep nonviolent
individuals in custody for months, awaiting resolution of their cases.
None of this is news to the criminal justice stakeholders. Earlier this
year, District Attorney R. Seth Williams said that the criminal justice
system in general—and the city’s prisons in particular—have been
burdened with “junk” cases that consume resources better allo-
cated to more serious ones. Said Ellen T. Greenlee, the city’s chief
public defender: “For justice and for economic reasons, we can’t
continue to jail everyone we’re now jailing. We have to find a better
way.” Pamela P. Dembe, president judge of the Philadelphia Com-
mon Pleas Court, put it another way: “Incarceration should be used
to keep the monsters away.”
Mayor Nutter’s point-person on criminal justice, Deputy Mayor for
Public Safety Everett A. Gillison, agrees and has said that the prison
population could be lowered further, to 6,500, without jeopardizing
public safety. Prisons Commissioner Louis Giorla said that he looks
forward to a day when the facilities he runs will have 6,000 inmates.
Such a decline would result in substantial savings for the city’s tax-
payers.
What makes the population decrease of the past year particularly
notable is the magnitude and persistence of the population in-
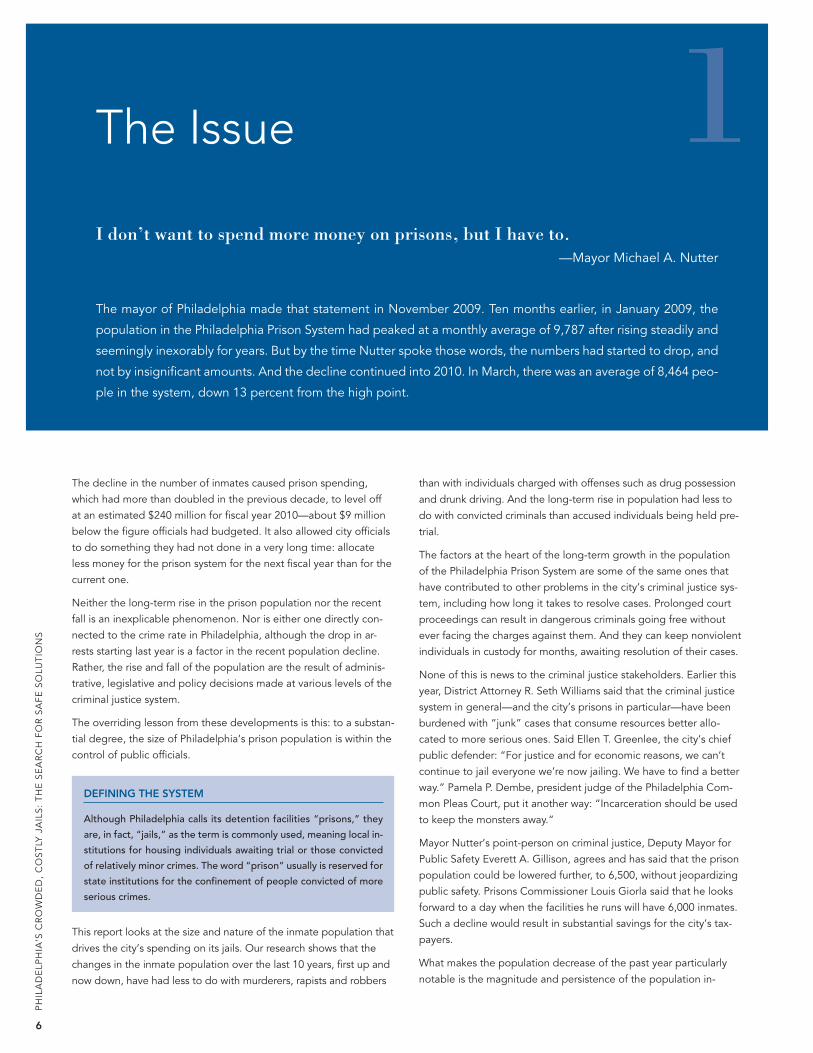
I don’t want to spend more money on prisons, but I have to.—Mayor Michael A. Nutter
The mayor of Philadelphia made that statement in November 2009. Ten months earlier, in January 2009, the
population in the Philadelphia Prison System had peaked at a monthly average of 9,787 after rising steadily and
seemingly inexorably for years. But by the time Nutter spoke those words, the numbers had started to drop, and
not by insignificant amounts. And the decline continued into 2010. In March, there was an average of 8,464 peo-
ple in the system, down 13 percent from the high point.
The Issue 1

Ch
apte
r 1
T
HE
IS
SU
E
7
creases throughout the past decade. From 1999 to 2009, the aver-
age daily population of the Philadelphia Prison System grew from
6,578 to 9,321, an increase of 45 percent. See Figure 1.1.
The recent decline in the population is only barely reflected in the
average daily population for 2009 because the big fall-off did not
start until last autumn. For 2009 as a whole, the average daily popu-
lation decreased only a small amount, from 9,399 to 9,321. The
population for 2010 is on track to be much lower.
The decade-long population growth that peaked early in 2009 took
place at a time when the number of people arrested in Philadelphia
was trending lower, fluctuating between a high of approximately
77,281 in 2001 and a low of 65,955 in 2003. See Figure 1.2.
As Figures 1.1 and 1.2 indicate, there appears to be no direct rela-
tionship between the size of the population in the prison system
and the crime rate, as reflected by total arrests.
Even with the reduced inmate population this year, the Philadelphia
Prison System remains the third-biggest department in the city
budget, trailing only human services and police. The city plans to
spend $51 million more this year on its prison system than on fire
protection. It spends about as much on prisons as for the streets
and health departments combined. The growth of the system’s
budget is shown in the figure on page 4.
Actually, the current $240 million figure understates the true cost of
the prison system, since Philadelphia places the healthcare and
pension benefits of all city employees in a separate category. When
those benefits are included, the total cost rises to about $290 mil-
lion, slightly more than 7 percent of the city’s general fund budget.
1.1 AVERAGE DAILY POPULATION, PHILADELPHIA PRISON SYSTEM 1999 – 2009
Source: Philadelphia Prison System
Note: *2010 shows average daily population from January through March. Source: Pennsylvania Uniform Crime Reporting System
1.2 ADULT ARRESTS IN PHILADELPHIA
While the jail population rose for most of the past decade, the number of adult arrests fell slightly.
The National PerspectiveHow does what is happening in the Philadelphia jails compare to
what is happening in other jurisdictions around the country?
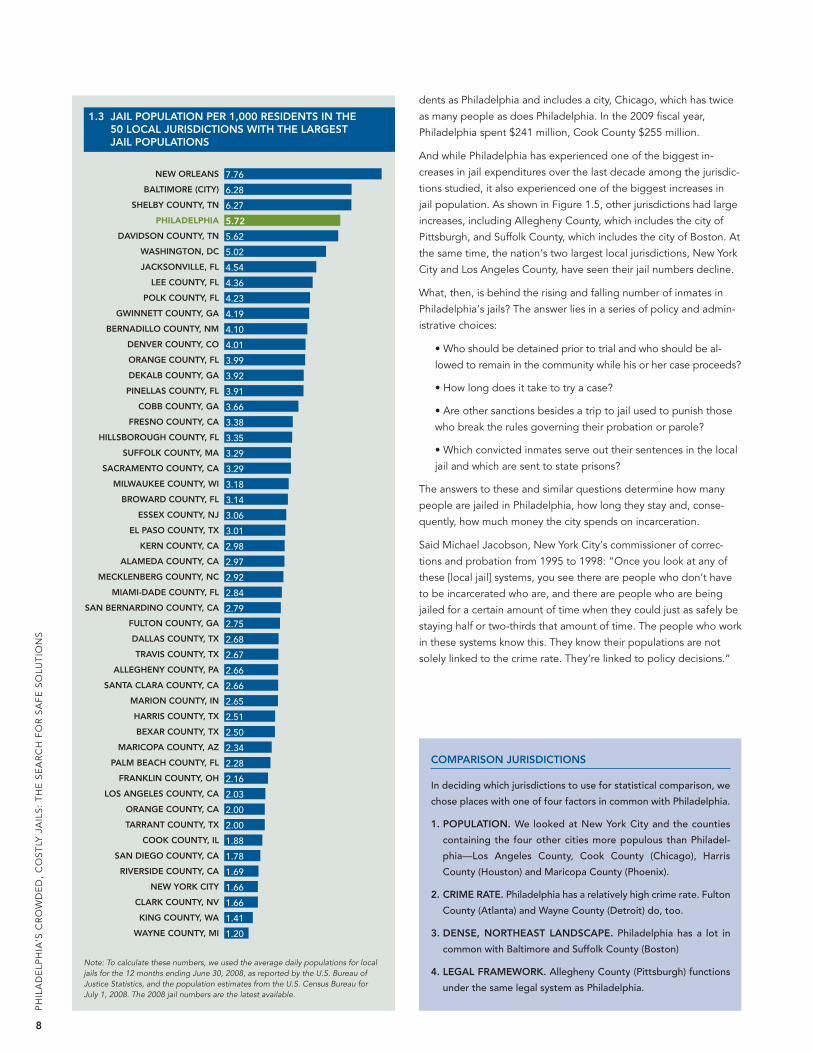
One of the most telling ways to look at Philadelphia in a national
context is by jail population per capita. Among the 50 jurisdictions
in the country with the largest jail populations, Philadelphia had
the fourth highest rate of incarceration as of mid-2008, the last date
for which data from the federal Bureau of Justice Statistics are avail-
able. As shown in Figure 1.3, Philadelphia had 5.72 individuals be-
hind bars for every 1,000 residents; the highest figure for any large
jurisdiction was New Orleans at 7.76.
In most places, jails are county institutions, meaning that the areas
they cover—unlike the area covered by the Philadelphia Prison
System—include suburbanites as well as city residents. This makes
precise city-to-city comparisons impossible and, to some degree,
overstates Philadelphia’s incarceration rate compared to urban coun-
ties that also have large numbers of suburbanites.
Even so, and taking into account the recent decline in the popula-
tion in Philadelphia jails, the city’s population number on a per
capita basis is among the highest in the country.
Another way to compare Philadelphia to other jurisdictions is in terms
of spending. Many metropolitan jurisdictions have struggled with ris-
ing jail spending in recent years, but the growth in Philadelphia in the
past decade has been dramatic. See Figure 1.4.
Consider that last year the city spent almost as much on incarcera-
tion as Cook County, which has three-and-a-half times as many resi-
6
8
10
5
7
9
AV
ER
AG
E D
AIL
Y PO
PULA
TIO
N [I
N T
HO
USA
ND
S]
6,578
9,3219,399
8,602
8,892
8,289
7,916
7,574
7,818
7,397
6,908
8,562
1999
2009
2008
2007
2006
2005
2004
2003
2002
2001
2000
2010
*
60 –
70 –
80 –
50 –
40 –
90 –
100 –
66
,09
7
76
,75
0
76
,29
3
77
,28
1
69
,49
9
65
,95
5
68
,15
8
66
,69
3 71
,42
0
72
,08
0
74
,44
4
2009
2008
2007
2006
2005
2004
2003
2002
2001
2000
1999
NU
MB
ER
OF
AR
RE
STS
[IN T
HO
USA
ND
S]
8
PH
ILA
DE
LPH
IA’S
CR
OW
DE
D,
CO
ST
LY J
AIL
S:
TH
E S
EA
RC
H F
OR
SA
FE
SO
LUT
ION
S
dents as Philadelphia and includes a city, Chicago, which has twice
as many people as does Philadelphia. In the 2009 fiscal year,
Philadelphia spent $241 million, Cook County $255 million.
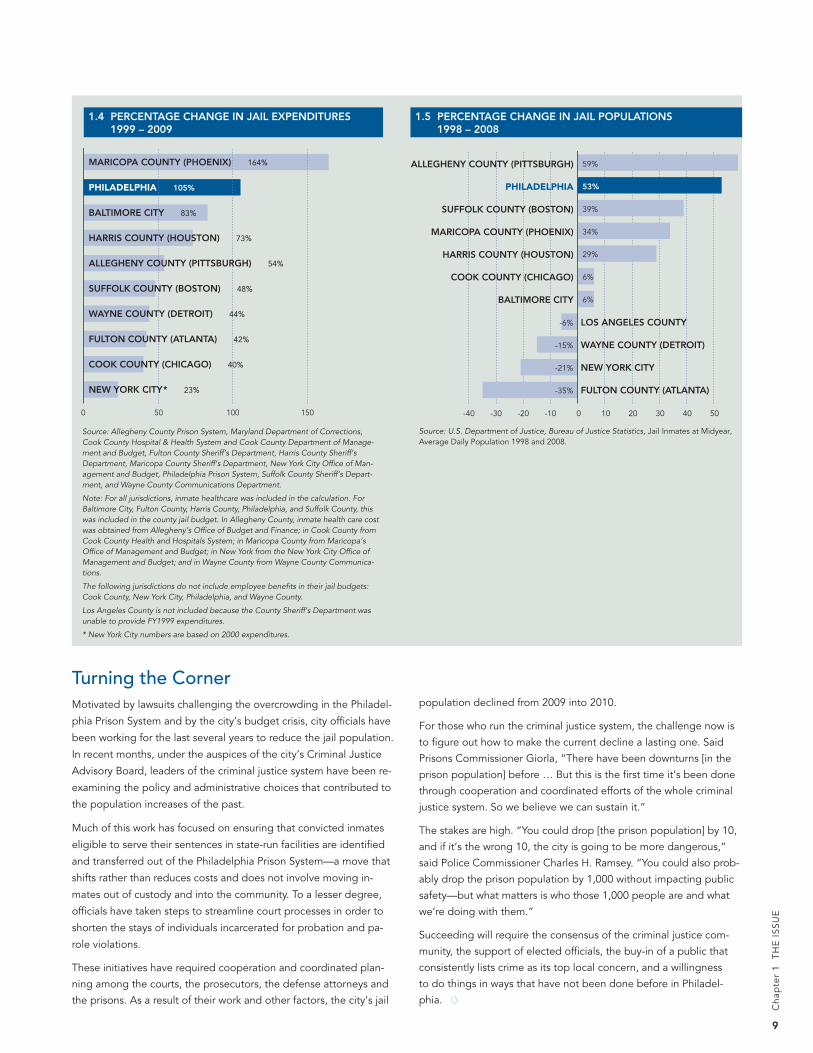
And while Philadelphia has experienced one of the biggest in-
creases in jail expenditures over the last decade among the jurisdic-
tions studied, it also experienced one of the biggest increases in
jail population. As shown in Figure 1.5, other jurisdictions had large
increases, including Allegheny County, which includes the city of
Pittsburgh, and Suffolk County, which includes the city of Boston. At
the same time, the nation’s two largest local jurisdictions, New York
City and Los Angeles County, have seen their jail numbers decline.
What, then, is behind the rising and falling number of inmates in
Philadelphia’s jails? The answer lies in a series of policy and admin-
istrative choices:
• Who should be detained prior to trial and who should be al-
lowed to remain in the community while his or her case proceeds?
• How long does it take to try a case?
• Are other sanctions besides a trip to jail used to punish those
who break the rules governing their probation or parole?
• Which convicted inmates serve out their sentences in the local
jail and which are sent to state prisons?
The answers to these and similar questions determine how many
people are jailed in Philadelphia, how long they stay and, conse-
quently, how much money the city spends on incarceration.
Said Michael Jacobson, New York City’s commissioner of correc-
tions and probation from 1995 to 1998: “Once you look at any of
these [local jail] systems, you see there are people who don’t have
to be incarcerated who are, and there are people who are being
jailed for a certain amount of time when they could just as safely be
staying half or two-thirds that amount of time. The people who work
in these systems know this. They know their populations are not
solely linked to the crime rate. They’re linked to policy decisions.”
1.3 JAIL POPULATION PER 1,000 RESIDENTS IN THE 50 LOCAL JURISDICTIONS WITH THE LARGEST JAIL POPULATIONS
Note: To calculate these numbers, we used the average daily populations for localjails for the 12 months ending June 30, 2008, as reported by the U.S. Bureau of Justice Statistics, and the population estimates from the U.S. Census Bureau for July 1, 2008. The 2008 jail numbers are the latest available.
COMPARISON JURISDICTIONS
In deciding which jurisdictions to use for statistical comparison, we
chose places with one of four factors in common with Philadelphia.
1. POPULATION. We looked at New York City and the counties
containing the four other cities more populous than Philadel-
phia—Los Angeles County, Cook County (Chicago), Harris
County (Houston) and Maricopa County (Phoenix).
2. CRIME RATE. Philadelphia has a relatively high crime rate. Fulton
County (Atlanta) and Wayne County (Detroit) do, too.
3. DENSE, NORTHEAST LANDSCAPE. Philadelphia has a lot in
common with Baltimore and Suffolk County (Boston)
4. LEGAL FRAMEWORK. Allegheny County (Pittsburgh) functions
under the same legal system as Philadelphia.
NEW ORLEANS
BALTIMORE (CITY)
SHELBY COUNTY, TN
PHILADELPHIA
DAVIDSON COUNTY, TN
WASHINGTON, DC
JACKSONVILLE, FL
LEE COUNTY, FL
POLK COUNTY, FL
GWINNETT COUNTY, GA
BERNADILLO COUNTY, NM
DENVER COUNTY, CO
ORANGE COUNTY, FL
DEKALB COUNTY, GA
PINELLAS COUNTY, FL
COBB COUNTY, GA
FRESNO COUNTY, CA
HILLSBOROUGH COUNTY, FL
SUFFOLK COUNTY, MA
SACRAMENTO COUNTY, CA
MILWAUKEE COUNTY, WI
BROWARD COUNTY, FL
ESSEX COUNTY, NJ
EL PASO COUNTY, TX
KERN COUNTY, CA
ALAMEDA COUNTY, CA
MECKLENBERG COUNTY, NC
MIAMI-DADE COUNTY, FL
SAN BERNARDINO COUNTY, CA
FULTON COUNTY, GA
DALLAS COUNTY, TX
TRAVIS COUNTY, TX
ALLEGHENY COUNTY, PA
SANTA CLARA COUNTY, CA
MARION COUNTY, IN
HARRIS COUNTY, TX
BEXAR COUNTY, TX
MARICOPA COUNTY, AZ
PALM BEACH COUNTY, FL
FRANKLIN COUNTY, OH
LOS ANGELES COUNTY, CA
ORANGE COUNTY, CA
TARRANT COUNTY, TX
COOK COUNTY, IL
SAN DIEGO COUNTY, CA
RIVERSIDE COUNTY, CA
NEW YORK CITY
CLARK COUNTY, NV
KING COUNTY, WA
WAYNE COUNTY, MI
7.76
6.28
6.27
5.72
5.62
5.02
4.54
4.36
4.23
4.19
4.10
4.01
3.99
3.92
3.91
3.66
3.38
3.35
3.29
3.29
3.18
3.14
3.06
3.01
2.98
2.97
2.92
2.84
2.79
2.75
2.68
2.67
2.66
2.66
2.65
2.51
2.50
2.34
2.28
2.16
2.03
2.00
2.00
1.88
1.78
1.69
1.66
1.66
1.41
1.20
Ch
apte
r 1
TH
E I
SS
UE
9
Turning the Corner Motivated by lawsuits challenging the overcrowding in the Philadel-
phia Prison System and by the city’s budget crisis, city officials have
been working for the last several years to reduce the jail population.
In recent months, under the auspices of the city’s Criminal Justice
Advisory Board, leaders of the criminal justice system have been re-
examining the policy and administrative choices that contributed to
the population increases of the past.
Much of this work has focused on ensuring that convicted inmates
eligible to serve their sentences in state-run facilities are identified
and transferred out of the Philadelphia Prison System—a move that
shifts rather than reduces costs and does not involve moving in-
mates out of custody and into the community. To a lesser degree,
officials have taken steps to streamline court processes in order to
shorten the stays of individuals incarcerated for probation and pa-
role violations.
These initiatives have required cooperation and coordinated plan-
ning among the courts, the prosecutors, the defense attorneys and
the prisons. As a result of their work and other factors, the city’s jail
1.4 PERCENTAGE CHANGE IN JAIL EXPENDITURES 1999 – 2009
Source: U.S. Department of Justice, Bureau of Justice Statistics, Jail Inmates at Midyear,Average Daily Population 1998 and 2008.
1.5 PERCENTAGE CHANGE IN JAIL POPULATIONS1998 – 2008
population declined from 2009 into 2010.
For those who run the criminal justice system, the challenge now is
to figure out how to make the current decline a lasting one. Said
Prisons Commissioner Giorla, “There have been downturns [in the
prison population] before … But this is the first time it’s been done
through cooperation and coordinated efforts of the whole criminal
justice system. So we believe we can sustain it.”
The stakes are high. “You could drop [the prison population] by 10,
and if it’s the wrong 10, the city is going to be more dangerous,”
said Police Commissioner Charles H. Ramsey. “You could also prob-
ably drop the prison population by 1,000 without impacting public
safety—but what matters is who those 1,000 people are and what
we’re doing with them.”
Succeeding will require the consensus of the criminal justice com-
munity, the support of elected officials, the buy-in of a public that
consistently lists crime as its top local concern, and a willingness
to do things in ways that have not been done before in Philadel-
phia.
Source: Allegheny County Prison System, Maryland Department of Corrections,Cook County Hospital & Health System and Cook County Department of Manage-ment and Budget, Fulton County Sheriff’s Department, Harris County Sheriff’s Department, Maricopa County Sheriff’s Department, New York City Office of Man-agement and Budget, Philadelphia Prison System, Suffolk County Sheriff’s Depart-ment, and Wayne County Communications Department.
Note: For all jurisdictions, inmate healthcare was included in the calculation. ForBaltimore City, Fulton County, Harris County, Philadelphia, and Suffolk County, thiswas included in the county jail budget. In Allegheny County, inmate health care costwas obtained from Allegheny’s Office of Budget and Finance; in Cook County fromCook County Health and Hospitals System; in Maricopa County from Maricopa’s Office of Management and Budget; in New York from the New York City Office ofManagement and Budget; and in Wayne County from Wayne County Communica-tions.
The following jurisdictions do not include employee benefits in their jail budgets:Cook County, New York City, Philadelphia, and Wayne County.
Los Angeles County is not included because the County Sheriff’s Department wasunable to provide FY1999 expenditures.
* New York City numbers are based on 2000 expenditures.
0 50 100 150
MARICOPA COUNTY (PHOENIX) 164%
PHILADELPHIA 105%
BALTIMORE CITY 83%
HARRIS COUNTY (HOUSTON) 73%
ALLEGHENY COUNTY (PITTSBURGH) 54%
SUFFOLK COUNTY (BOSTON) 48%
WAYNE COUNTY (DETROIT) 44%
FULTON COUNTY (ATLANTA) 42%
COOK COUNTY (CHICAGO) 40%
NEW YORK CITY* 23%
-40 -30 -20 -10 0 10 20 30 40 50
59%
53%
39%
34%
29%
6%
6%
ALLEGHENY COUNTY (PITTSBURGH)
PHILADELPHIA
SUFFOLK COUNTY (BOSTON)
MARICOPA COUNTY (PHOENIX)
HARRIS COUNTY (HOUSTON)
COOK COUNTY (CHICAGO)
BALTIMORE CITY
LOS ANGELES COUNTY
WAYNE COUNTY (DETROIT)
NEW YORK CITY
FULTON COUNTY (ATLANTA)
-6%
-15%
-21%
-35%

10
PH
ILA
DE
LPH
IA’S
CR
OW
DE
D,
CO
ST
LY J
AIL
S:
TH
E S
EA
RC
H F
OR
SA
FE
SO
LUT
ION
S
The Curran-Fromhold Correctional Facility is the system’s intake and
administrative building; it opened in 1995 and houses approximately
3,000 inmates. There are three other jails for men: the Philadelphia
Industrial Correctional Center (opened in 1986; 1,100 inmates), the
Detention Center (opened in 1964; 1,300 inmates) and the House
of Correction (opened in 1925; 1,500 inmates). The jail for women,
the Riverside Correctional Facility, opened in 2004, houses approxi-
mately 750 inmates. The Alternative and Special Detention Divi-
sion—a group of buildings and trailers on State Road and a number
of small facilities throughout the city—houses up to 1,000 work-
release, weekend-stay and other minimum-security inmates.
To manage overflow population, Philadelphia, like other cities,
employs two main strategies:4
• Philadelphia pays other counties to house inmates in their jails.
In fiscal year 2009, the city had contracts with Lehigh County in
Pennsylvania and Passaic and Monmouth Counties in New Jer-
sey, paying Lehigh $90 per inmate per day, Passaic $88 and Mon-
mouth $105. When the population in the Philadelphia jails
started to fall, the city stopped sending inmates to New Jersey,
saving roughly $4.9 million on an annual basis.5 The contract with
Lehigh County remains in place. Other metropolitan jurisdic-
tions—including Fulton County (Atlanta) and Harris County
(Houston)—have similar arrangements.
• In some facilities, Philadelphia assigns a third inmate to cellsthat are rated for two, a practice known as triple celling.6 At theDetention Center, where inmates live in open dorms rather thanseparate cells, extra bunks have been added to housing areasthat were already considered full; other jurisdictions employ simi-lar measures. These practices are the subject of a civil rights law-suit against the city.
Although putting additional inmates into existing space is not as expensive as sending them to other counties, it does result in in-creased overtime pay for guards—about $1.5 million per year inPhiladelphia, according to local officials. In addition, the litigation resulting from these conditions has a high price; according to esti-mates provided by the city, the annual cost of dealing with the cur-rent cases and settling prior ones is about $1.2 million.7 All of thecosts associated with overcrowding give city officials a financial in-centive to reduce the population in the Philadelphia Prison Systemas much as possible, assuming they can protect the public at thesame time.
The Philadelphia Prison System consists of six facilities on a sprawling main campus on State Road in Northeast
Philadelphia, as well as several other smaller, privately run facilities throughout the city.
The buildings on State Road were designed to accommodate roughly 6,500 inmates—the size of the 1999 jail
population.1 By adding dormitory space to areas built for common or administrative use, the prison system has
increased its rated capacity to about 8,500.2 Despite the added beds, Philadelphia’s jails, like those in Baltimore,
Houston, Phoenix and Chicago, have struggled to operate within this expanded capacity; in 2009, the jail pop-
ulation in Philadelphia fluctuated between 100 and 112 percent of rated capacity.3
The Philadelphia Prison System: An Overview
1. Talking about jail capacity is less straightforward than it might seem. There is design capacity, which is the number of people the jail was designed to house. This can bedifferent from rated capacity—the number of people a rating agency has certified the jail to house—especially if, as in Philadelphia, additional beds have been added tospaces not originally designed as dormitories. And there is operational capacity, which is the number of people the jail can accommodate while keeping a sufficient num-ber of beds unoccupied in order to allow inmate movement and repairs.
2. Todd D. Minton and William J. Sabol, Jail Inmates at Mid-Year 2008 (U.S. Department of Justice, Bureau of Justice Statistics, 2009).
3. Ibid.
4. In addition to these two strategies, starting in 2006 Philadelphia retrofitted the gymnasium area at the old Holmesburg jail to serve as a temporary intake center. Holmes-burg, site of a 1973 riot in which two correctional officers were killed, was closed in 1995 as the result of federal litigation related to prison conditions. The temporary in-take area was closed in September 2009 when the population decreased to 9,300.
5. In FY2008, Philadelphia paid Monmouth County approximately $4,400,000 and Passaic approximately $500,000 for housing Philadelphia inmates.
6. The House of Corrections, Philadelphia’s oldest facility, was designed to house one inmate per cell. For decades, two inmates per cell have been the norm in this facility,and some cells currently have three inmates.
7. This figure combines settlement costs (indemnities) paid by the prison system for civil rights cases ($925,000) and the average annual cost of hiring outside counsel inthese cases. According to Michael Resnick, chief of staff to the deputy mayor for public safety, the city has paid a combined $820,000 over the last three years for outsidecounsel in prison-related civil rights litigation.
2

Ch
apte
r 2
T
HE
PH
ILA
DE
LPH
IA P
RIS
ON
SY
ST
EM
: A
N O
VE
RV
IEW
11
Who is in Jail?There are several ways to answer the question of who is in Philadel-phia’s jails. One is through demographics. On a typical day lastyear, as shown in Figure 2.1, 66 percent of the inmates in thePhiladelphia Prison System were African American men.
Inmates also were young: as shown in Figure 2.2, 48 percent ofthem were between the ages of 18 and 29. Note that 18 percent ofPhiladelphia’s overall population is in this age group.8
A second way to describe the jail population is by how inmatescome to be incarcerated. There are three main pathways to jail:
• Individuals are held prior to trial out of concern that they willnot show up for court if they are allowed to remain at liberty.This is the pretrial population.
• Individuals are convicted of crimes and sentenced to a periodof incarceration. This is the sentenced population.
• Individuals already convicted of a crime and sentenced to aperiod of supervision in the community are incarcerated as a re-sult of an alleged or proven violation of the conditions of theircommunity supervision. This is the violator population.
On a typical day last year, as shown in Figure 2.3, less than a quarterof the inmates in the Philadelphia jails were convicted criminalsserving sentences. More than half were being held pretrial, and al-most all of the rest were violators.
A third way to look at who is in jail is by the severity of the chargesinmates have faced or will face.
On a typical day last year, 82 percent of Philadelphia’s jail inmates
were charged with or convicted of felonies; in Pennsylvania, felonies
include all crimes in which the maximum sentence is greater than
five years. Sixteen percent were charged with or convicted of first-
or second-degree misdemeanors (crimes with maximum penalties
between two and five years). The other 2 percent were charged with
or convicted of summary offenses, such as minor shoplifting and
disorderly conduct, or third-degree misdemeanors, such as prostitu-
tion, loitering and persistent disorderly conduct.9 These numbers
are broken down by type of inmate—pretrial, violator or sen-
tenced—in Figure 2.4.
8. U.S. Census Bureau, 2008 American Community Survey 1-Year Estimates (2008), Table B01001 (accessed April 12, 2010).
9. In most other states, a felony is defined as a crime with a maximum sentence of one year or more. So what is a first- or second-degree misdemeanor in Pennsylvania is afelony in most other jurisdictions. And a misdemeanor in most jurisdictions is classified as a third-degree misdemeanor in Pennsylvania.
10. John S. Goldkamp, E. Rely Vilcicã, Doris Weiland, Wang Ke, Confinement and the Justice Process in Philadelphia: Its Features and Implications for Planning, Crime andJustice Research Center, Temple University (2006) 72.
11. Philadelphia Prison System, Homelessness Among PPS Inmates (2004), provided by the Philadelphia Prison System (unpublished memoranda on file with the author).
2.1 DAILY JAIL POPULATION BY RACE AND GENDER
2.2 DAILY JAIL POPULATION BY AGE
2.3 DAILY JAIL POPULATION BYPATHWAY
MENTAL HEALTH, SUBSTANCE ABUSE AND HOMELESSNESS
Another way to examine Philadelphia’s jail population is by the con-ditions that have contributed to inmates’ criminal behavior. Priorstudies estimate that:
• About 30 percent of inmates in the Philadelphia Prisons experi-ence mental illness;
• About 42 percent report having abused drugs and alcohol;10
• And a third expects to be homeless at the time of release.11
For some, said Bruce Herdman, chief of medical operations for thePhiladelphia Prison System, “the prison has by default become theprimary source of social, medical and psychiatric care.”
BLACK MALE66%
11%12%
7%
WHITE FEMALE3%
HISPANIC FEMALE1%
BLACK FEMALE
HISPANIC MALEWHITE MALE
18–2430%
30–3924% 25–29
18%
40–4920%
OVER 50
UNDER 181%
7%
OTHER2%
SENTENCED23%
PROBATION/ PAROLEVIOLATORS
PRETRIAL57%
18%
Source: Philadelphia Prison System
Note: Daily Population on June 30, 2009. In Figure 2.3, “other” represents individuals held for other jurisdictions.

12
PH
ILA
DE
LPH
IA’S
CR
OW
DE
D,
CO
ST
LY J
AIL
S:
TH
E S
EA
RC
H F
OR
SA
FE
SO
LUT
ION
S
A fourth way of looking at the population is in terms of the substan-
tive nature of the most serious or “top” charges lodged against
them.
Thirty percent of all inmates had an offense against a person—such
as assault, armed robbery, harassment, rape or murder—as their
top charge. Twenty-eight percent were charged with property
offenses including theft, robbery and arson, and 25 percent with
drug offenses. These numbers are broken down by type of inmate
in Figure 2.5.
2.4 DAILY JAIL POPULATION BY CHARGE SEVERITY
Source: Philadelphia Prison System
Note: Daily Population on June 30, 2009.
Pretrial charge is defined as the top charge the inmate was facing on June 30, 2009. Violator charge is defined as the top charge the inmate was convicted of in the case that resultedin a sentence of probation or a period on parole.
2.5 DAILY JAIL POPULATION BY CHARGE TYPE
PRETRIAL PROBATION/PAROLE VIOLATOR SENTENCED
Source: Philadelphia Prison System
Note: Daily Population on June 30, 2009.
Person offenses include all offenses listed under Offenses Involving Danger to the Person in the criminal code, such as assault, neglect of a care-dependant person, rape, and homicide.
Property offenses include all offenses listed under Offenses against Property in the criminal code, such as theft, vandalism, trespass, and burglary.
Drug offenses include all offenses listed under Title 35, Chapter 6 of the Penn. Statutes such as purchase, manufacturing, and sale of a controlled substance.
Vehicle offenses include offenses such as failure to properly insure a vehicle, DUI, and vehicular homicide.
Weapons offenses include offenses such as possession of a firearm by a former convict and carrying a firearm without a license.
Other offenses include all other offenses listed under 18 Pa.C.S.A. or other section of the Penn. Statutes that were not included in other offense categories such as bribery, perjury,resisting arrest, obstruction of justice, disorderly conduct, public drunkenness, and prostitution.
FELONY90%
9%FIRST- AND
SECOND- DEGREEMISDEMEANOR
SUMMARY OFFENSE/THIRD- DEGREE MISDEMEANOR
1%
FELONY74%
SUMMARY OFFENSE/THIRD- DEGREE MISDEMEANOR
3%
FIRST- AND SECOND-DEGREEMISDEMEANOR
23%
FELONY68%
FIRST- AND SECOND-DEGREEMISDEMEANOR
30%
SUMMARY OFFENSE/THIRD- DEGREE MISDEMEANOR
2%
PRETRIAL PROBATION/PAROLE VIOLATOR SENTENCED
PROPERTY29%
DRUGS19%
PERSON40%
WEAPONS4%
VEHICLE2%
OTHER6%
PROPERTY31%
DRUGS37%
PERSON16%
WEAPONS7%
VEHICLE3%
OTHER6%
PROPERTY27%
DRUGS30%
PERSON17%
WEAPONS8%
VEHICLE9%
OTHER9%
THE CHALLENGE OF MULTIPLE HOLDS
Some inmates are in jail for more than one reason. They may be held
on bail for a new arrest combined with a probation violation and/or
an outstanding bench warrant. Criminal-justice stakeholders refer
to such inmates as having “multiple holds.” And because there are
multiple reasons for keeping them in jail, it can require multiple ac-
tions to get them out in a timely fashion, even if none of those rea-
sons on its own would merit a prolonged stay in custody.

Ch
apte
r 3
H
OW
PH
ILA
DE
LPH
IA’S
JA
IL P
OP
ULA
TIO
N R
OS
E:
19
99
–20
08
13
To understand what caused the population to increase over the past decade—and what has caused it to go
down in the past year—one needs to look at the population in another way. The size of the jail population is a
function of the number of inmates admitted and the length of time they stay: the number of bed-days consumed.
One inmate who stays one day takes up one bed-day. Another inmate who stays 50 days takes up 50 bed-days
and has a much larger impact on the prison’s budget. In the past decade, as Figure 3.1 shows, the annual number
of bed-days consumed in the Philadelphia Prison System has risen 38 percent.
3How Philadelphia’s Jail Population Rose: 1999–2008
In 2009, the total number of bed-days was 3,310,991, up from
2,400,970 in 1999. This increase was caused by a rise in the number
of jail admissions combined with the relatively long lengths of stay ex-
perienced by many inmates.
Over that period, our data analysis shows that admissions to the
Philadelphia jails grew 27 percent, from 30,599 to 38,890. See Figure
3.2. This increase was due largely to increases in pretrial admissions
(40 percent) and admissions for probation/parole violations (80 per-
cent).
Length of stay varies by inmate type. Sentenced inmates typically
have the longest stays; many pretrial inmates make bail after only a
few days. This is illustrated in Figure 3.3. As a result of these varia-
tions, the profile of inmates admitted in a year looks quite different
from the profile of inmates in the prison system on any one day. For
example, 39 percent of all pretrial admissions last year were for in-
mates charged with misdemeanors, but only 10 percent of the pre-
trial inmates jailed on a given day were facing such charges.
The rise in total bed-days was caused by the pretrial and violator
populations and was offset somewhat by a decrease by the sen-
tenced population. This is shown in Figure 3.4.
From 1999 through 2009, the number of bed-days used by pretrial
inmates increased from approximately 1,050,000 to nearly 1,900,000;
in 2009, pretrial inmates consumed 57 percent of all bed-days, up
from 44 percent in 1999. This meant that the Philadelphia Prison Sys-
tem was populated mostly by people awaiting trial, not by convicted
criminals serving sentences.
3.1 JAIL BED-DAYS CONSUMED 1999 – 2009
2.0
2.5
3.5
3.0
4.0
DA
YS [I
N M
ILLI
ON
S]
2008 2009200720062005200420032002200120001999
2,4
00
,97
0
2,5
24
,52
2
2,7
00
,05
7
2,8
53
,57
0
2,7
64
,44
9
2,8
89
,34
0
3,0
25
,60
6
3,1
39
,85
1
3,2
30
,75
9
3,3
65
,42
0
3,3
10
,99
1
Source: Philadelphia Prison System
Note: Individuals who were admittedbut stay less than one day are countedas staying half a day regardless of theamount of time they actually spent inthe facility. Numbers are calculatedbased on number of days spent in thePhiladelphia Prison System at time ofrelease. Because some individuals ad-mitted in 2009 have not yet been re-leased, bed-days in 2009 areundercounted.

14
PH
ILA
DE
LPH
IA’S
CR
OW
DE
D,
CO
ST
LY J
AIL
S:
TH
E S
EA
RC
H F
OR
SA
FE
SO
LUT
ION
S
3.4 JAIL BED-DAYS CONSUMED BY PATHWAY 1999 – 2009
20,000
25,000
30,000
35,000
45,000
40,000
NU
MB
ER O
F A
DM
ISSI
ON
S
30
,59
9
31
,51
6
33
,65
4
33
,25
6
31
,06
6
31
,54
8 32
,74
7 34
,12
7
38
,39
8
40
,85
8
38
,89
0
2008
2009
2007
2006
2005
2004
2003
2002
2001
2000
1999
Source: Philadelphia Prison System
Note: Data reflects number of intakes not number of individuals.
3.2 ADMISSIONS TO THE PHILADELPHIA PRISON SYSTEM 3.3 LENGTH OF JAIL STAY BY PATHWAY
THE ROLE OF “FREQUENT FLYERS”
Twenty-eight percent of the people admitted to the Philadelphia
prison return at least once in any given year. Forty percent return
within two years. At the prison, these inmates are known as fre-
quent flyers.
Our analysis of prison admissions and releases shows that these
chronic offenders are predominantly male, single and unemployed.
Most are accused of drug offenses, others of the kind of property
crimes that, while non-violent, can have a real impact on the lives
of the victims. Many suffer from some form of mental illness. Most
are readmitted for the same type of crime for which they’ve gone
to jail in the past. And the majority, 75 percent, are readmitted ei-
ther pretrial or for a probation or parole violation.
“Chronic, low-level, offenders, they’re the biggest pain in our neck,”
said Prisons Commissioner Giorla. “We have one guy who’s been
coming in and out of here for 30 years. Usually [he’s picked up on]
retail theft. Each time, they set his bail higher so he’s here a little
longer. He’s functionally mentally ill. His medical treatment alone is
costing a fortune.”
Source: Philadelphia Prison System
PR
ETR
IAL
PR
OB
ATI
ON
/PA
RO
LE V
IOLA
TOR
SSE
NTE
NC
ED
PERCENT
0% 20 40 60 80 100
LESSTHAN
7 DAYS13%
LESSTHAN
7 DAYS31%
8–30 DAYS14%
31–120DAYS31%
OVER 120
DAYS33%
8–30 DAYS43%
31–120DAYS29%
OVER 120
DAYS16%
LESSTHAN
7 DAYS42%
8–30 DAYS21%
31–120DAYS22%
OVER 120
DAYS15%
0
.5
1.0
1.5
2.0
DA
YS [I
N M
ILLI
ON
S]
19
99
20
09
20
08
20
07
20
06
20
05
20
04
20
03
20
02
20
01
20
00
PRETRIAL
SENTENCED
PROBATION/PAROLE VIOLATORS
OTHER
Source: Philadelphia Prison System

Ch
apte
r 3
H
OW
PH
ILA
DE
LPH
IA’S
JA
IL P
OP
ULA
TIO
N R
OS
E:
19
99
–20
08
15
The Rise in the Pretrial PopulationIn 1999, 18,605 inmates were admitted to jail pretrial; by 2009 that
number had jumped 40 percent to 26,095. Most of the increase in
pretrial admissions came from individuals who were charged with
first- or second-degree misdemeanors. The number of inmates ad-
mitted pretrial charged with felonies rose by a smaller amount. See
Figure 3.5.
Three variables factor into pretrial admissions: the number of peo-
ple arrested, the number of people required to post bail and the
amount of bail set. In Philadelphia, all of these factors have been
working at times to push up pretrial admissions.
ARREST: DRIVING UNDER THE INFLUENCE ANDDRUG POSSESSION. Overall, the number of arrests in
Philadelphia has remained fairly constant over the last decade,
trending downward. In 2009, for instance, there were roughly the
same number as in 2002. But from 2005 to 2008, the total went up,
due largely to an increase in arrests for driving under the influence
(DUI) and drug possession. See Figure 3.6.
For DUI, legislative changes produced much of the increase in ar-
rests and pretrial admissions. Starting in 2004, Pennsylvania enacted
new laws which, among other things, lowered the minimum blood
alcohol level for DUI from .10 to .08.12 These efforts to get tougher
on drunk driving led to more arrests: 5,478 in 2008, up from an av-
erage of 4,000 per year between 2000 and 2005. More people were
admitted to jail pretrial as a result.
For drug possession, a change of focus by the police appears to
account for a 7 percent increase in arrests from 2005 to 2009.
According to Deputy Police Commissioner William Blackburn, the
department intensified its street-patrol efforts to combat street-
corner crime with an emphasis on clearing high-crime locations.
BAIL: CHANGED DECISIONS AND RISINGAMOUNTS. From 2003 to 2009, a higher percentage of accused
offenders had bail set. This meant that a lower percentage was re-
leased on their own recognizance (ROR), meaning without bail—40
percent in 2009 compared to 46 percent in 2003. See Figure 3.7.
The decline in the use of ROR and increase in bail were seen across
the board. But it was particularly pronounced for those accused of
third-degree misdemeanors, such as disorderly conduct and prosti-
tution. In 2003, 74 percent of such defendants were released on
their own recognizance; in 2009, 60 percent were.
Another shift in bail decisions came in cases in which the most serious
charge was carrying a firearm without a license.
In 2005, Pennsylvania changed the sentencing guidelines to increase
the punishment for carrying a firearm without a license. The new
guidelines called for a presumed jail sentence of one to two years;
the previous ones had called for community-based sanctions in
some cases.13 This change appears to have had an impact on bail
YEAR RELEASED BAIL SET MEAN BAIL WITHOUT BAIL
3.7 BAIL DECISIONS
2003 46% 54% $14,445
2004 44% 56% $15,335
2005 40% 59% $17,402
2006 40% 59% $21,417
2007 45% 54% $24,940
2008 44% 56% $21,164
2009 40% 60% $20,008
3.5 PRETRIAL ADMISSIONS BY CHARGE SEVERITY
0
5,000
10,000
15,000
20,000
NU
MB
ER
OF
AD
MIS
SIO
NS
19
99
20
09
20
08
20
07
20
06
20
05
20
04
20
03
20
02
20
01
20
00
SUMMARY/THIRD-DEGREE MISDEMEANOR
FIRST- OR SECOND-DEGREE MISDEMEANOR
FELONY
20
09
20
08
20
07
20
06
20
05
2,000
4,000
6,000
8,000
10,000
12,000
9,216
3,778
9,836
11,86511,450
10,499
3,9394,578
5,478
4,748
DRUG POSSESSION
DUI
3.6 ARRESTS FOR DRUG POSSESSION AND DRIVINGUNDER THE INFLUENCE
12. For a description of the law change, see Pennsylvania Driver and Vehicle Services, “0.8 DUI Legislation,” Pennsylvania Department of Transportation,http://www.dmv.state.pa.us/legislation/dui.shtml (accessed April 12, 2010).
13. Adoption of Sentencing Guidelines, 35 Pa. Bull. 1508 (March 5, 2005).
Source: Philadelphia Prison System
Source: Preliminary Arraignment System
Note: Each year less than one percent of defendants are detained with bail denied at preliminary arraignment. Bail amounts of $1,000,000 or more wereexcluded from this calculation; overall, these represented just 0.4 percent of all bail amounts set. Their inclusion would distort typical bail amounts.
Source: Pennsylvania Uniform Crime Reporting System

16
PH
ILA
DE
LPH
IA’S
CR
OW
DE
D,
CO
ST
LY J
AIL
S:
TH
E S
EA
RC
H F
OR
SA
FE
SO
LUT
ION
S
3.8 PRETRIAL LENGTHS OF STAY
Source: Sherriff’s departments of Cook, Fulton, Harris, and Los Angeles counties, New York City Department of Corrections, and the Philadelphia Prison System.
Note: Cook County includes Chicago. Fulton County includes Atlanta. Harris County includes Houston.
DOING TIME FOR TRAFFIC VIOLATIONS
You do not expect to get jail time for failing to pay a parking fine.
And that almost never happens unless you are already in jail.
In 2008, our analysis shows that more than 1,500 inmates had their
stays in the Philadelphia Prison System extended—typically by one
or two days—so that they could be transported by the sheriff’s de-
partment to traffic court to pay fines. That number was up from less
than 200 inmates in 2003. While other circumstances initially
brought these inmates to jail, they were kept in jail after those issues
were resolved so that they could appear in traffic court.
In a system that uses about three million bed-days a year, this prac-
tice, which accounts for perhaps 2,000 bed-days, is not a big item.
But city officials are concerned about the propriety of incarcerating
people for traffic fines. And they know that holding inmates for
extra days and transporting them to traffic court may cost more
than the system recoups in fines paid. They are working to change
this practice.
decisions. Prior to the change, about 50 percent of defendants fac-
ing that charge were released on their own recognizance. Last year,
only 5 percent were, meaning more of them wound up in jail pretrial.
Bail determination is not meant to be an element of punishment;
while a case is pending, the presumption of innocence remains in
place. The point of pretrial detention and bail is to deal with people
who might not otherwise appear in court. Several factors go into
making the bail determination: whether the defendant has a valid
phone number, has a job, lives with a spouse or children, has a crim-
inal history or has missed court dates in the past.14 The severity of
the offense with which the individual is accused also is taken into
account. In the case of carrying a firearm without a license, it appar-
ently made a big difference.
While the use of bail was increasing, so was the amount of bail
being set. From 2003 to 2009, our analysis shows, the mean bail set
for all offenses rose nearly 39 percent, from $14,445 to $20,008, as
shown in Figure 3.7, although it has fallen in the past few years.
These two factors, higher bail and more people being asked to post
it, drove up the number of defendants who could not make bail and
consequently ended up spending time in jail pretrial, thereby
adding to the overall jail population in Philadelphia.
0
20
40
60
80
100
LESS THAN 3 DAYS
3 TO 7 DAYS 8 TO 30 DAYS 31 TO 60 DAYS 61 TO 120 DAYS GREATER THAN 120 DAYS
COOK COUNTY FULTON COUNTY HARRIS COUNTY NEW YORK CITY PHILADELPHIALOS ANGELES COUNTY
14. These are the factors collected and weighed by Philadelphia’s bail guidelines according to Todd Van Gunten, Preliminary Arraignment System (PARS) Technical Lead forthe Philadelphia Department of Technology. They include several of the factors the criminal code enumerates for consideration at preliminary arraignment. See ReleaseCriteria, 234 PA. CODE §523 (2001).
In Philadelphia, nearly a quarter of detained pretrial defendants are jailed for more than 60 days, a higher share than in some other jurisdictions.

Ch
apte
r 3
H
OW
PH
ILA
DE
LPH
IA’S
JA
IL P
OP
ULA
TIO
N R
OS
E:
19
99
–20
08
17
PRETRIAL LENGTHS OF STAY: VERY SHORT ORVERY LONG. In Philadelphia, defendants are required to post
10 percent of the assigned bail amount. Almost all defendants with
bail set at $500 or less are able to post the money within one day of
arraignment.15 For those with bail over $500, the picture is very dif-
ferent. Forty percent of them never post bail. The other 60 percent
typically spend 5 to 15 days in jail while they put together the
money required for their release.
About half of the pretrial population stays in jail for less than seven
days. These people are not being detained to protect public safety;
one way or another, they will be out on the street for most of the
time prior to the resolution of their cases. The fact that they are ad-
mitted to jail in the first place—as well as how long they stay—is pri-
marily a function of how long it takes them to post bail.
For the Philadelphia Prison System, these short stays are particularly
expensive. Much of the cost of incarcerating someone is incurred at
intake. At admission, prison officials conduct medical examinations,
issue clothing, catalogue belongings and begin a lengthy paperwork
process. This is true even for inmates who stay one day or less.16
Philadelphia also has a comparatively large group of pretrial in-
mates who stay for more than 120 days, about 15 percent of all
pretrial admissions. In other jurisdictions, including the counties that
include Atlanta, Chicago and Houston, 5 percent of the pretrial
population stays this long. See Figure 3.8. The difference is due,
at least in part, to the length of the court process in Philadelphia.
Our analysis of data from the Administrative Office of Pennsylvania
Courts shows that 75 percent of cases in the city remain unresolved
after three months. As a result, criminal justice stakeholders report,
defendants sometime serve more time before their cases are re-
solved than they would have received in a sentence. Ultimately,
many defendants held pretrial are released on time served.
While pretrial stays in Philadelphia may be long compared to other
jurisdictions, they did not get any longer during the past decade.
One factor that appears to have helped—even though bail amounts
were going up—was the opening in 2007 of a bail office at the pris-
ons. Before then, bail could be posted only at the Criminal Justice
Center in Center City. Anyone wanting to post bail for an inmate
had to go to Center City to deliver the bail deposit, then head out
to Northeast Philadelphia to pick up the inmate. Now both tasks
can be accomplished at once. This change has resulted in a notice-
able decrease in the time it takes to post bail. In 2006, it took a de-
fendant with bail set at less than $500 an average of five days to
post the 10 percent needed. Today it takes an average of one day.
Similar trends are evident for defendants with higher bail rates.
STAYING TOO LONG IN JAIL
Philadelphia inmates sometimes spend additional time in jail be-
cause the orders releasing them were late getting from the court
to the jail.
In 2001, Philadelphia civil rights lawyers sued the city on behalf of
defendants who remained in jail past the date they were supposed
to be released. Plaintiffs included a mix of both pretrial and sen-
tenced inmates. According to David Rudovksy, one of the lawyers
in the case, the problem was that “sometimes the Clerk of Quarter
Sessions wasn’t sending the release paperwork from court, and on
the prison end, sometimes the paperwork did not reach the file or
the officer in charge of releases. Simply, there was not a system in
place to ensure that an ordered release was, in fact, effectuated.”
Thanks to procedures enacted as part of the settlement of the litiga-
tion, the staff of the Defenders Association now generates a daily list
of their clients whose releases have been ordered. They then check
the files at the prison to make sure all of the releases actually hap-
pen.17 Attorney Tom Innes, who does most of the checking, counted
20 instances in October 2009 when defendants would have remained
in jail past their release dates had he not notified the prison.
15. Ninety percent of defendants with bail of $500 or less eventually post bail. Some defendants who do not post bail do so as the result of a legal calculation rather than alack of money. Many defendants in the Philadelphia prison system have more than one reason for being in custody at a given time (see “The Challenge of Multiple Holds”on page 12.) For example, a defendant might have bail set for $500 on a new arrest and also be detained on a bench warrant in a previous court case. In such a situation,the defendant would be detained on the warrant even after posting bail. Individuals in this situation often choose not to post bail, as they would not be released anyway.
16. New York City is piloting a program in two boroughs designed to reduce the number of inmates who spend only a few hours or days in jail while putting together smallamounts of bail. In the program, defendants ordered to post $250 or less are reinterviewed after preliminary arraignment. If they are able to identify people who can postbail for them soon, they are kept in the police holding cell rather than transported to jail for intake processing.
17. No similar process exists for inmates represented by private counsel.
18. Individuals who, because of sentence length, serve sentences in state facilities are supervised by the Pennsylvania Board of Probation and Parole. For purposes of this re-port, admissions to the Philadelphia Prison System based on community supervision violations include inmates under the supervision of both the Philadelphia and stateagencies. Of the 5,943 admissions based on violations in 2009, 9 percent (or 535) involved individuals supervised by the state’s probation and parole agency.
19. Pew Center on the States, One in 31: The Long Reach of American Corrections (2009).
Admissions for Violations IncreasedThe Philadelphia Prison System also experienced a steady increase
in the number of inmates admitted for violating the terms of commu-
nity supervision. Such supervision falls into two categories: probation
and parole. Probation is community supervision in lieu of incarcera-
tion; parole is supervision after incarceration. Both are supervised by
Philadelphia’s Adult Probation and Parole Department.18
As shown in Figure 3.9, the number of individuals admitted to
Philadelphia’s jails for violating probation or parole rose from 3,101 in
2000 to a high of 5,943 in 2009, contributing to the overall growth of
the prison population during that time. In 2009, violators accounted
for 15 percent of all jail admissions, up from 10 percent in 2000.
This rise tracks with the overall increase in the number of probation
and parole cases. From 2004 to 2009, new cases accepted by the
Philadelphia probation department rose from 19,065 to 26,318. See
Figure 3.10.
Philadelphia’s experience in this regard is similar to the experiences
of jurisdictions across the country. From 1984 to 2009, the number
of Americans under community supervision rose from 1.6 million to
5 million—one in every 45 adults.19

One reason for these significant lengths of stay is the cumbersome
and lengthy court process for hearing a violation of probation or pa-
role. Violation hearings traditionally have been held in front of the
judge who sentenced the defendant in the first place. Scheduling a
hearing before that judge can take time. And when the defendant’s
alleged violation is for a new crime, a different judge is assigned to
hear the new arrest. The original judge often waits until after the
new case is concluded before conducting a hearing on the proba-
tion violation, delaying final resolution and keeping in jail a defen-
dant who might otherwise have been released.
18
PH
ILA
DE
LPH
IA’S
CR
OW
DE
D,
CO
ST
LY J
AIL
S:
TH
E S
EA
RC
H F
OR
SA
FE
SO
LUT
ION
S
7,000
6,000
5,000
4,000
3,000
2,000
3,2
88
3,1
01
3,3
89
3,3
31
3,4
77 3,8
03
4,0
12
4,3
64
5,1
11
5,9
00
5,9
43
20
08
20
09
20
07
20
06
20
05
20
04
20
03
20
02
20
01
20
00
19
99
NU
MB
ER
OF
AD
MIS
SIO
NS
Source: Philadelphia Prison System
3.9 PROBATION/PAROLE VIOLATORS ADMITTED TO JAIL
20
08
20
09
20
07
20
06
20
05
20
04
30,000
25,000
20,000
15,000
10,000
19
,06
5
19
,20
0 22
,20
5
22
,60
5 26
,21
6
26
,31
8
CA
SES
Source: Adult Probation and Parole Department
Note: Data not available prior to 2004.
3.10 PHILADELPHIA’S ADULT PROBATION AND PAROLE DEPARTMENT NEW CASES
Source: Philadelphia Prison System
Note: Length of stay calculated based on number of days spent in the PhiladelphiaPrison System at time of release. Length of stay not calculated for 2009 admissionsbecause many had not been released at the time of data collection.
3.11 PROBATION/PAROLE VIOLATORS LENGTH OF STAY IN JAIL
10
20
30
40
50
60
70
80
0
DA
YS
1999
2008
2007
2006
2005
2004
2003
2002
2001
2000
57.7
49.452.4
57.854.6
60.6 63.267.7
73.167.9As new probation and parole cases rose from
2004 to 2008, so did admissions to jail forprobation and parole violations.
The idea behind the use of probation is to try to punish and rehabil-
itate offenders without incarcerating them. But a lot of offenders on
probation end up in jail. How many? It’s hard to say because no one
keeps track. Some get there by failing to comply with what is known
as a “technical condition” of their supervision. A probationer fails a
drug test, and a court hearing on the violation is scheduled—or
misses a meeting with a probation officer and a warrant is issued.
Others are re-arrested for new crimes.
While admissions for probation and parole violations have risen
steadily, the length of stay for this population has gone up as well,
thereby contributing to the growth in the jail population. The aver-
age length of stay, which was as low as 49 days in 2000 and as high
as 73 days in 2007, stood at 68 days in 2008.20 See Figure 3.11.
HOW LONG IT CAN TAKE TO
RESOLVE A PROBATION VIOLATION
To illustrate the impact of the court process on the jail population,
we asked several attorneys to share with us examples from their case-
loads. A criminal defense attorney pulled the following case:
A twenty-five year old man was on probation for a 2006 drug convic-
tion. On November 7, 2009, he was a passenger in a car that was
pulled over by the police. An altercation ensued, and the driver and
the probationer were charged with aggravated assault. The bail com-
missioner set the probationer’s bail at $2,500 on the new charge. The
man chose not to post the bail since the arrest meant that he would
be held on the probation violation anyway. And he went to jail.
On January 11, 2010, after the case was continued four times, there
was a preliminary hearing on the assault charges, and the charges
were withdrawn. But the man’s hearing on the probation violation—
for getting arrested—had yet to take place. So he was sent back to
jail to wait to appear before the judge who had sentenced him on
the drug charges back in 2006.
On February 3, the violation hearing was held before the original sen-
tencing judge, who ordered him released. Total time in jail: nearly
three months.
20. The median length of stay was 26 days at the low in 2000 and 34 days at the high in 2007. In 2008 it was 30 days.
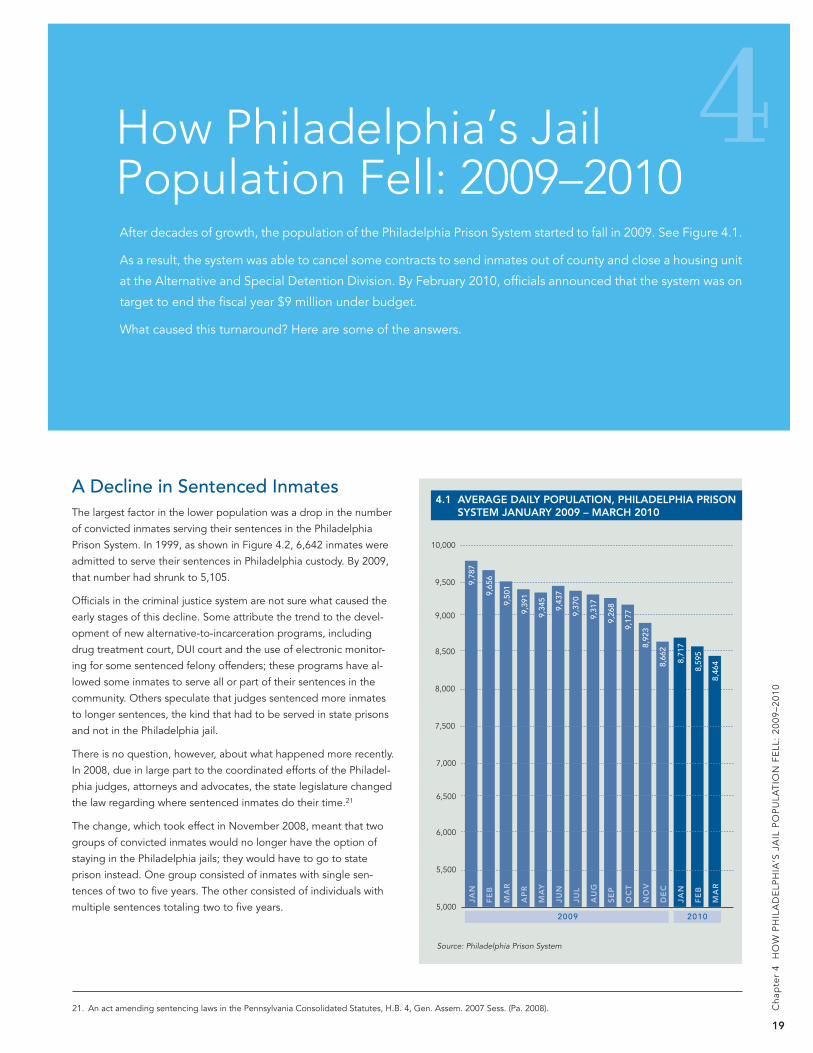
Ch
apte
r 4
H
OW
PH
ILA
DE
LPH
IA’S
JA
IL P
OP
ULA
TIO
N F
ELL
: 2
00
9–2
01
0
19
After decades of growth, the population of the Philadelphia Prison System started to fall in 2009. See Figure 4.1.
As a result, the system was able to cancel some contracts to send inmates out of county and close a housing unit
at the Alternative and Special Detention Division. By February 2010, officials announced that the system was on
target to end the fiscal year $9 million under budget.
What caused this turnaround? Here are some of the answers.
4How Philadelphia’s Jail Population Fell: 2009–2010
A Decline in Sentenced InmatesThe largest factor in the lower population was a drop in the number
of convicted inmates serving their sentences in the Philadelphia
Prison System. In 1999, as shown in Figure 4.2, 6,642 inmates were
admitted to serve their sentences in Philadelphia custody. By 2009,
that number had shrunk to 5,105.
Officials in the criminal justice system are not sure what caused the
early stages of this decline. Some attribute the trend to the devel-
opment of new alternative-to-incarceration programs, including
drug treatment court, DUI court and the use of electronic monitor-
ing for some sentenced felony offenders; these programs have al-
lowed some inmates to serve all or part of their sentences in the
community. Others speculate that judges sentenced more inmates
to longer sentences, the kind that had to be served in state prisons
and not in the Philadelphia jail.
There is no question, however, about what happened more recently.
In 2008, due in large part to the coordinated efforts of the Philadel-
phia judges, attorneys and advocates, the state legislature changed
the law regarding where sentenced inmates do their time.21
The change, which took effect in November 2008, meant that two
groups of convicted inmates would no longer have the option of
staying in the Philadelphia jails; they would have to go to state
prison instead. One group consisted of inmates with single sen-
tences of two to five years. The other consisted of individuals with
multiple sentences totaling two to five years.
21. An act amending sentencing laws in the Pennsylvania Consolidated Statutes, H.B. 4, Gen. Assem. 2007 Sess. (Pa. 2008).
4.1 AVERAGE DAILY POPULATION, PHILADELPHIA PRISONSYSTEM JANUARY 2009 – MARCH 2010
7,500
8,000
8,500
9,000
9,500
10,000
2009 2010
9,78
7
9,65
6
9,50
1
9,39
1
9,34
5
9,43
7
9,37
0
9,31
7
9,26
8
9,17
7
8,92
3
8,66
2
8,71
7
8,59
5
8,46
4
JAN
FE
B
MA
R
AP
R
MA
Y
JUN
JUL
AU
G
SE
P
OC
T
NO
V
DE
C
JAN
FE
B
MA
R
5,000
5,500
6,000
6,500
7,000
Source: Philadelphia Prison System

20
PH
ILA
DE
LPH
IA’S
CR
OW
DE
D,
CO
ST
LY J
AIL
S:
TH
E S
EA
RC
H F
OR
SA
FE
SO
LUT
ION
S
According to Philadelphia Deputy District Attorney Sarah V. Hart,
one of the prime movers behind the legislation, “We looked at
other states, and we were one of only three states where inmates
with sentences of over two years could end up in the county jail. It
didn’t make sense. From the budget perspective, we wanted long-
term inmates with the state, not with the city. The state has better
services to meet the treatment needs for long-term inmates.”
As soon as the change became law, city officials moved aggressively
to start transferring an estimated 400 inmates already serving two-
to five-year terms in Philadelphia to state facilities.22 Almost all sen-
tenced inmates in this category (except work release prisoners) now
go to state prison at the start of their sentence.23 Although Philadel-
phia does not keep track of how many inmates go to the state as a
result of the legislation, there is no doubt the change has reduced
the number of sentenced admissions. It also should eventually de-
crease the average length of stay for the sentenced population in
the city facilities.24 And ultimately, it should reduce the caseload of
the Philadelphia Probation and Parole Department as more proba-
tioners and parolees are supervised by the Pennsylvania Board of
Probation and Parole.
10,000
9,000
8,000
7,000
6,000
5,000
4,000
3,000
6,6
42 7
,26
8
8,4
09 8,7
82
7,6
55
6,9
54
6,8
69
6,9
05
7,0
92
6,6
13
5,1
05
NU
MB
ER O
F A
DM
ISSI
ON
S
20
08
20
09
20
07
20
06
20
05
20
04
20
03
20
02
20
01
20
00
19
99
Source: Philadelphia Prison System
4.2 SENTENCED ADMISSIONS TO PHILADELPHIA PRISONSYSTEM
Fewer ArrestsAnother factor in the decreasing jail population was the decline in
arrests. In 2009, the Philadelphia police made 8,000 fewer arrests
than in 2008, a decrease of about 11 percent. See Figure 1.2 on
page 7. This appears to have contributed to several trends: the lev-
eling off of pretrial admissions (26,095 in 2008 and 26,346 in 2009),
a 27 percent decrease in the number of inmates admitted for viola-
tions, and an overall 5 percent drop in admissions. That said, the
degree to which this drop in arrests caused the population decline
is not clear. As we have seen, a variety of factors play into the num-
bers, and in years past, arrest rates and the jail population have not
always moved in the same direction.
Changes in Probation and ParoleFrom 2000 to 2008, the number of probation and parole violators
admitted to the Philadelphia Prison System grew by an average of 7
percent a year. In 2009, however, this trend leveled off. And the
number of bed-days consumed by violators fell somewhat.25
Two factors appear to have contributed to these trends. One was
that the number of new probation and parole cases remained con-
stant at just over 26,000. See Figure 3.10. The other was that signifi-
cant changes were taking place at the Philadelphia Adult Probation
and Parole Department.
22. This estimate, provided by the District Attorney’s Office, includes both inmates transferred under General Transfer Authorization, 61 Pa. Cons. Stat. § 1151 (2009) whichpermits the temporary transfer of inmates from county to state facilities and vice versa and under separate petitions based on the law change. See Sentencing Proceed-ing; Place of Confinement, 42 Pa. Cons. Stat. §9762 (2008).
23. After conviction, inmates sentenced to state time return to the Philadelphia Prison System for a few days prior to being transferred. They are not, however, counted assentenced “admissions” in the prison case management system.
24. Data for this report was run in January, 2010, a time at which many inmates sentenced in 2009 were still in custody. Consequently, a length of stay analysis could not becompleted for this group.
25. As discussed in the Notes on Methodology section, bed-day consumption for 2009 is an estimate.
26. Pew Center on the States, Prison Count 2010 (2010).
27. Joseph N. DiStefano and Amy Worden, “2,000 Pa. Prisoners to be Housed Out-of-State,” Philadelphia Inquirer, 22 December 2009, B01.
28. Pennsylvania Governor’s Budget Office, 2010-11 Governor’s Proposed Budget (Harrisburg, 2010), 27.
A GROWING STATE PRISON POPULATION
From 2008 to 2009, even as Philadelphia’s inmate population
peaked and then fell, Pennsylvania’s Prison System was recording
the largest increase in prisoners of any state in the nation in ab-
solute numbers. Only two states, Indiana and West Virginia, had big-
ger percentage increases than Pennsylvania’s 4 percent. Over the
same period, 26 states had population declines.26
Philadelphia is responsible for a significant share of the increase
being experienced by the state. Last year, the number of new in-
mates going to the Pennsylvania Department of Corrections from
the Philadelphia courts rose by 6 percent.
Without enough capacity to handle the growing population, Penn-
sylvania is sending prisoners to Michigan and Virginia.27 Plans are
in place to build four new state prisons. For fiscal year 2011, Gov-
ernor Edward G. Rendell requested an additional $137 million for
the corrections department.28

Ch
apte
r 4
H
OW
PH
ILA
DE
LPH
IA’S
JA
IL P
OP
ULA
TIO
N F
ELL
: 2
00
9–2
01
0
21
With a nearly flat budget and a shrinking staff—probation and pa-
role was short 56 probation officers out of 324 approved officer-po-
sitions early in 2010—the department was having trouble managing
its caseload. So it looked for ways to better utilize its resources.
Working with criminologist Lawrence W. Sherman and statistician
Richard A. Berk, both of the University of Pennsylvania, the depart-
ment developed a statistical model to determine what factors made
probationers and parolees likely to commit major crimes within two
years after entering the probation or parole system. Using the
model, the department began a controlled experiment in October
2008, giving each probationer or parolee a risk-score based on
those factors including age and first contact with the criminal justice
system. The department took a portion of its clients who had scored
“low risk” and assigned large numbers of them (400 as opposed to
the previous 160) to individual officers. In addition, the reporting
conditions for low-risk probationers and parolees were reduced:
they would have to make contact with the probation department
only once every three months, alternating between phone calls and
in-person visits as opposed to one in-person visit per month.
As it turned out, the probationers and parolees involved in the ex-
periment had few new arrests for major crimes.30 The reduction in re-
porting requirements also gave them fewer opportunities to violate
the terms of their supervision. As a result, there were fewer viola-
tions. All of this translated into fewer probationers being sent to jail.
THE COST OF HOUSING INMATES—NOT A SIMPLE CALCULATION
29. In 2009, the prison spent around $7.2 million on medication and $14 million in hospital fees.
30. Lindsay Ahlman and Ellen Kurtz, The APPD Randomized Controlled Trial in Low Risk Supervision: The Effect of Low Risk Supervision on Rearrest (First Judicial District ofPennsylvania, Adult Probation and Parole Department, 2008).
31. On a given day, about half of the offenders supervised by an officer with a high-risk caseload are incarcerated. Consequently, probation officers with high-risk caseloadstypically supervise about 25 offenders in the community.
4.3 ESTIMATED DAILY COST FOR ONE INMATE
Based on the results of the experiment, the department began last
year to change its reporting requirements and the distribution of its
caseload.
In the new system
• high-risk clients are seen by officers with caseloads of 50 and
have a weekly reporting requirement;31
• medium-risk clients are seen by officers with caseloads of 120
cases and must report on a monthly basis; and
• low-risk clients are seen by officers with caseloads of 400 and
must report in-person once every six months.
“Before now, we’ve dealt with many offenders the same way; now
we’re shifting to dealing with offenders in a more individual, a more
targeted way,” said the department’s director, Robert Malvasutto.
“It’s helped the individual offender; it’s helped the department.”
Along with these changes within the Adult Probation and Parole
Department, the court system has begun to streamline the court
process for violators. These changes, discussed in detail later in this
report, have resolved some probation violations sooner than would
otherwise have been the case. Our own courtroom observations,
however, suggest that many of the individuals who have benefited
from these changes were not in custody when they appeared in
court.
Officials often say that it costs $95 to house one inmate in jail for
one day, implying that reducing the population by one inmate would
save that much. But it does not work that way.
The $95 figure is simply the total annual cost of the system divided
by the number of inmate-days. Decrease the population by one in-
mate, and the system must still operate the same facilities and pro-
grams.
What does Philadelphia actually save per day by reducing the pop-
ulation by one inmate? It depends on who the inmate is. For every
inmate, the city saves on the cost of that person’s food and clothing.
As Figure 4.3 shows, this runs about $20 for the first day of incar-
ceration—when clothing is issued and medical tests are conducted.
The savings is only about $7 for subsequent days, much more if the
inmate has serious medical or mental health needs.29 (If the inmate
had been housed in Lehigh County, the daily savings for Philadel-
phia would be $90.)
Should the jail population continue to decrease, there would be
more significant savings to be realized. At some point, the prison
system would be able to reduce triple-celling, saving legal costs and
overtime for the additional staff needed for triple-celled areas. And
it would be able to end the practice of sending inmates out of
county.
The biggest savings would come through closing an entire housing
area or jail facility. That could happen only if there were a large and
seemingly lasting drop in the inmate population.
Note: Information on costs of individual items and services providedby the Philadelphia Prison System. Analysis of daily cost per inmateconducted by the Philadelphia Research Initiative.
Food $ 3.84
Pharmacy 2.29
Lab Work 1.34
Intake diagnostics (one time) 3.82
Clothing (one time) 9.00
Total $20.29

22
PH
ILA
DE
LPH
IA’S
CR
OW
DE
D,
CO
ST
LY J
AIL
S:
TH
E S
EA
RC
H F
OR
SA
FE
SO
LUT
ION
S
Four of the six main decision points for sending someone to jail are
related to pretrial incarceration: arrest, charging by the district attor-
ney’s office, preliminary arraignment and enforcement of outstand-
ing warrants. A fifth, case disposition, determines the number of
sentenced inmates in jail. The sixth, probation or parole, has impact
on the number of inmates jailed for violations.
The flow chart on page 23, Figure 5.1, provides a basic map of how
defendants travel through the Philadelphia criminal justice system
and either do or do not enter the Philadelphia Prison System.
Arrest If a police officer believes there is probable cause that a person has
committed a crime, the officer can take the suspect into custody or,
for some lower level crimes, give the individual a paper notice to
appear in court at a later date.32
Charging by the District Attorney’s Office
When arrested defendants are brought to a police district for pro-
cessing, the paperwork is transmitted to the charging unit of the
district attorney’s office. The charging unit then determines whether
there is enough evidence to charge the defendant and, if so, what
the charges should be.33
Charging involves a balancing of priorities and resources. Among
the factors in play are the need to complete the process expedi-
tiously so that suspects are not held in police lock-ups for excessive
lengths of time; the need to select the correct charges so that those
charges will not be reduced or thrown out later on; and the need to
see that justice is done.
In recent years, getting the work done expeditiously has been the
focus of the charging unit in Philadelphia. Under long-time District
Attorney Lynne M. Abraham, who left office in January 2010 after
nearly 19 years in office, charges typically were issued and cases
sent to preliminary arraignment within 24 hours of arrest. Philadel-
phia was known for having one of the fastest-charging units in the
country.
The new district attorney, R. Seth Williams, says that the emphasis
on speed made the charging unit an “inefficient gatekeeper” in
which weak cases were allowed to go to court. In his view, weeding
out weak cases, if done with care, allows prosecutors to focus on
stronger cases. It also helps manage the jail population. With fewer
cases being charged, there are fewer people who can be detained
pretrial.
CHARGING STANDARD. Under Abraham, the district attor-
ney’s office used a “probable cause” standard to assess what
charges to bring. That meant that charges were lodged if the facts
and circumstances alleged in the police report would lead a reason-
At various points in the criminal justice process, decisions are made about who should go to jail and how long
they should spend there. This next section of this report looks at the six main decision points. It describes how
they play out in Philadelphia and in some other jurisdictions.
Understanding all of this is essential to understanding what is being done to try to reduce the jail population in
Philadelphia and what else might be done—without jeopardizing public safety.
5Decision Points for Admission to Jail
32. Under Pennsylvania criminal procedure, there is a presumption that officers will give paper notices rather than make custodial arrests for all third-degree misdemeanors—those in which the maximum sentence is less than one year, including prostitution, theft of less than $50 from a motor vehicle and public drunkenness. See Summons andArrest Warrant Procedures, 234 PA. CODE §1003(C)(1) (2010). It is the custom in Philadelphia, however, to arrest individuals on these types of charges.
33. Approval of Police Complaints and Arrest Warrant Affidavits by Attorney for the Commonwealth to Local Option, 234 PA. CODE § 507 (2010).

Ch
apte
r 5
D
EC
ISIO
N P
OIN
TS
FO
R A
DM
ISS
ION
TO
JA
IL
23
1
6
2
3
4
5
NO PROBABLE CAUSE NO OUTSTANDING
CRIMINAL JUSTICE MATTER
POLICE INTERACTION
PROBABLE CAUSE
OUTSTANDING WARRANT
SUMMONS/CITATION ARREST
CHARGING BY THE DISTRICTATTORNEY'S OFFICE
PRELIMINARY ARRAIGNMENT
— C O U R T P R O C E S S —
INSUFFICIENT EVIDENCE TO CHARGE OR
DIVERSION
PROBATION OR PAROLETERM CONCLUDED
PROBATION OR PAROLE VIOLATION
NOT GUILTY/ALTERNATIVE SENTENCE/TIME SERVED
SENTENCE OF INCARCERATION
RE
LE
AS
E
PH
IL
AD
EL
PH
IA
P
RI
SO
N
SY
ST
EM
— V
IOL
AT
ION
S O
F P
RO
BA
TIO
N/P
AR
OL
E —
— C
OU
RT
——
PR
E-T
RIA
L —
DISPOSITION
PROBATION OR PAROLE
HELD ON BAILRELEASED WITH OR WITHOUT BAIL
PENNSYLVANIA DEPARTMENT OF
CORRECTIONS
5.1 PHILADELPHIA CRIMINAL JUSTICE SYSTEM FLOW CHART

able person to believe that the suspect had committed a specific of-
fense. As a result, most cases were charged with the highest offense
arguable under the facts alleged in the report. Cindy Martelli, who
headed the charging unit for Abraham, said the idea was to look “at
what we can charge if everything on the police report is true” and
not “to determine the quality of the case.”
Other jurisdictions, such as San Diego County, California, employ a
different standard at charging. “To issue a charge, we use proof be-
yond a reasonable doubt, meaning that we have to believe we can
get a conviction on this charge before we’ll bring it,” said Terri
Wyatt, chief of the case issuance division in the district attorney’s of-
fice there. “If we read the police report, and we can tell we won’t
have the evidence to prove a case, we’ll send it back to the police
and ask for further investigation if appropriate.”
PLEA OFFERS. In Philadelphia, an offer from the district attor-
ney to the defendant for a plea bargain generally comes several
weeks or months into a case. Other jurisdictions move more speed-
ily. In San Diego County, a recent study that looked at cases enter-
ing criminal court over a three-week span found that 60 percent of
felony cases were concluded within 10 days.34 In New York, plea
bargains are reached at the preliminary arraignment—the post-ar-
rest court hearing where bail is set—in 30 percent of all cases, and
another 17 percent are dismissed or diverted at this stage.35 In
Philadelphia, few cases are disposed of at preliminary arraignment.
And only 25 percent of all cases are concluded in the first 90 days,
with the majority of cases taking 120 days or more, according to our
analysis of court data. These processing times contribute to pretrial
inmates in Philadelphia experiencing long stays in jail.
DIVERSION PROGRAMS. For decades, it has been the prac-
tice in Philadelphia and other jurisdictions to divert some lower-level
offenders out of the formal court process. Once diverted from the
criminal justice process into social-service programs, these defen-
dants are no longer at immediate risk of being incarcerated. In
Philadelphia, as elsewhere, the district attorney’s office identifies
cases eligible for diversion at the charging stage.
Although Philadelphia’s diversion programs are generally lauded,
they apply only to certain categories of individuals, with an emphasis
on first-time offenders. Currently, the city operates five programs:
• Accelerated Rehabilitative Disposition, in which first time, non-
violent offenders agree to a period of probation supervision.
• Alternative Treatment for Misdemeanants, in which defendants
charged with prostitution, retail theft or drug possession who do
not have prior convictions for violent felonies or any felony con-
victions in the past five years are supervised by probation offi-
cers for two years and can be referred to drug and alcohol
treatment.
• Community Court, in which individuals charged in Center City
with “quality of life crimes” (such as retail theft, minor drug pos-
session and prostitution) perform community service or get help
obtaining job training, health benefits and other services.
• Diverting Offenders into Treatment, in which defendants
charged with domestic-violence misdemeanors participate in
counseling classes or substance abuse treatment.
• Drug Treatment Court, in which drug-dependent defendants
charged with first-time drug offenses receive treatment. This
program can be used as a diversion program or an alternative
sentence.
Preliminary Arraignment For defendants who are arrested and then charged by the district
attorney’s office, the question becomes whether they should be put
in jail or permitted to remain in the community pending the out-
come of their cases. Under Pennsylvania law, a defendant may be
detained prior to conviction only if there is reason to believe he or
she will not appear at subsequent court proceedings. (In some juris-
dictions, the law allows public safety to be taken into account—not
in Pennsylvania.) A variety of factors may be considered in making
the determination of how likely a defendant is to appear for court
dates, including his or her community ties, criminal history and
record of appearing or not appearing in court.36
Much of the information related to community ties and past non-ap-
pearances is collected by the Pretrial Services Division, an agency of
the courts. In the first several hours after arrest, a social worker from
34. “Disposition Trends of Felonies for Sept. 1, 2009 Through Sept. 30, 2009 For All Divisions and Units for All Branches,” provided by the San Diego District Attorney’s Of-fice (unpublished chart on file with the author).
35. New York City Criminal Justice Agency, Annual Report 2009 (2010), 16. “Preliminary arraignment” refers to the hearing in Pennsylvania in which the court rules on proba-ble cause and pretrial detention.
36. Release Criteria, 234 PA. CODE § 523 (2001).
24
PH
ILA
DE
LPH
IA’S
CR
OW
DE
D,
CO
ST
LY J
AIL
S:
TH
E S
EA
RC
H F
OR
SA
FE
SO
LUT
ION
S
FRONT END V. BACK END
Philadelphia operates a number of alternative court and sentencing
programs. These programs, which include Mental Health Court, DUI
Court and Intermediate Punishment, come into play at the “back
end” of the criminal justice system, after an offender has accepted
a guilty plea or has been convicted.
Some of these programs, like the newly-created Mental Health
Court, are designed to shorten the stays of already-incarcerated in-
mates by helping them make the transition back into the commu-
nity. The expansion of such alternative-sentencing options may be
partially responsible for the decline in the number of sentenced in-
mates in the Philadelphia Prison System.
Diversion programs are different. They take offenders out of the
criminal justice system at the “front end,” often before preliminary
arraignment. The idea is that certain types of offenders can be
treated more appropriately outside the traditional criminal justice
process and need not be incarcerated.

Ch
apte
r 5
D
EC
ISIO
N P
OIN
TS
FO
R A
DM
ISS
ION
TO
JA
IL
25
pretrial services interviews the defendant to determine the defen-
dant’s living situation and employment status. This information is
entered into the Preliminary Arraignment System (PARS), a comput-
erized data collection system shared by the police, district attor-
ney’s office and the courts. Using a formula, PARS weights this
information along with information retrieved from the court system’s
database on criminal history, history of appearing in court and the
current charges. The formula then produces a “score” with a corre-
sponding recommendation that the individual should be released,
detained or have a specified amount of bail set.
Once the guideline recommendation has been calculated, the de-
fendant, who is being held in the police district where the arrest
took place, is linked by video to a hearing room in the basement of
the Criminal Justice Center.37 At that point, a Municipal Court mag-
istrate determines whether the defendant will be released or have
bail set—and if so, how much. The magistrate takes account of the
guideline recommendation, arguments from the lawyers and the
magistrate’s own judgment.
In Philadelphia, 40 percent of the defendants arraigned in 2009
were released on their own recognizance while 60 percent were or-
37. The use of videoconferencing at preliminary arraignment has grown in acceptance around the country. However, the chief judge in Cook County, Illinois, eliminated thepractice in 2008 after reviewing a study that compared bail decisions before and after its introduction. The study found a significant increase in bail amounts for the samecharges under videoconferencing. One contributing factor was the inability of the defendant to consult privately with the public defender prior to the preliminary arraign-ment. In addition, the authors concluded that the removal of the human presence in the room possibly “encourages harsher responses than would occur if the judge werefaced with a live individual.” Shari Diamond, et al. “Efficiency and Cost: The Impact of Video-conferenced Hearings on Bail Decisions,” Journal of Criminal Law & Criminol-ogy, 100 (forthcoming). See also Matthew Walberg, “Video bond court to end; Northwestern study found it set bail 65% higher,” Chicago Tribune, 12 December 2008, 29.
38. Less than one percent were held without bail.
39. New York City Criminal Justice Agency, Annual Report 2009 (2010), 16.
40. Spurgeon Kennedy, Director of Research for the District of Columbia Pretrial Service Agency, “Memoranda regarding council member request for information,” March 26,2010, provided by the District of Columbia Pretrial Service Agency (unpublished memoranda on file with the author). For publicly available data on this topic, see Districtof Columbia Pretrial Service Agency, Leading the Field: FY 2008 Annual Report (2008). Use of pretrial detention also has consequences for the sentenced population. De-fendants who are incarcerated pretrial are significantly more likely to be incarcerated after conviction, even controlling for other predictors of sentence severity. See CassiaC. Spohn, How Do Judges Decide (Thousand Oaks, California: SAGE Publications, Inc., 2008), 101.
41. New York City Criminal Justice Agency, Annual Report 2009 (2010), 26.
42. Clifford T. Keenan (deputy director of the District of Columbia Pretrial Services Agency), interview with the author March 24, 2009.
43. In calculating the percentage of pretrial defendants in the community who miss court dates, we linked two data sources. From the courts, we looked at all cases in which abench warrant was issued. We removed all cases in which it was obvious that the warrant was issued for another purpose. In many cases, the bench warrant did not spec-ify a cause. So we may have included some cases with warrants for reasons other than missed court dates. All of these cases were then linked with prison data. If the de-fendant did not appear in the prison data or was listed as having posted bail within the first few months after admission, the defendant was counted as being in thecommunity. Stakeholders report that some warrants are issued when the defendant is not absent intentionally. The defendant may be in custody, in the hospital or other-wise unable to get to court. Or the defendant may have left the courtroom temporarily and missed hearing the case called.
dered to pay bail.38 In New York City, the numbers were reversed,
with 65 percent of defendants released on their own recognizance
and 34 percent having bail set.39 In Washington, D.C., where the
law restricts the use of monetary bail, 85 percent of all defendants
were released at preliminary arraignment and the rest held.40 See
Figure 5.2.
Not only do New York and Washington release a higher percentage
of defendants into the community pretrial, they also have fewer of
them missing court dates. In New York, in 2009, 16 percent of re-
leased defendants failed to show up for their court appearances.41
In Washington, it was 12 percent.42 Unlike New York City and Wash-
ington, Philadelphia does not keep track of its failure-to-appear rate
for defendants released at preliminary arraignment. But our analysis
shows that the percentage in Philadelphia was about 30 percent.43
Why are Philadelphia defendants less likely to make their court ap-
pearances even though more of them have had to post bail? The
answer lies largely in how the two main tools designed to ensure
that defendants released into the community appear in court—the
bail guidelines and pretrial supervision—have been implemented
and maintained.
5.2 JURISDICTIONS COMPARED: PRELIMINARY ARRAIGNMENT DECISIONS
NEW YORK CITY PHILADELPHIA WASHINGTON, D.C.
Source: District of Columbia Pretrial Service Agency, New York City Criminal Justice Agency and Philadelphia Preliminary Arraignment System
Note: New York City numbers are for 2008, the most recent data available. Philadelphia and Washington, D.C., numbers are for 2009. The New York chart includes only the 52percent of cases that were not resolved at preliminary arraignment (by dismissal or plea).
RELEASED ON RECOGNIZANCE
65%BAIL SET
34%
HELD WITHOUT BAIL1%
RELEASED ON RECOGNIZANCE
40%
BAIL SET60%
RELEASED ON RECOGNIZANCE OR
WITH SERVICES85%
BAIL SETOR HELD
15%

BAIL GUIDELINES. The bail guidelines were adopted inPhiladelphia in the early 1980s. Officials viewed them as a tool tohelp manage jail overcrowding and to standardize bail decision-making.
The factors considered in the guidelines were based on empiricalresearch about what might predict a defendant’s appearance ornonappearance in court including strength of community ties andemployment status. The idea was to help the court make sure thatall defendants who could remain in the community and make theircourt dates were allowed to do so, thereby reducing the pretrial jailpopulation without endangering the public.
At the time the guidelines were introduced, researchers and crimi-nal justice officials expected that magistrates would follow the rec-ommendations 70 to 75 percent of the time. The expectation wasthat the other 25 to 30 percent of cases would involve factors thatthe guidelines could not take into account. In 1981 and 1982, whenthe guidelines were tested, magistrate decisions matched the rec-ommendations in 76 percent of all cases. When the guidelines wereupdated in 1997, magistrate decisions matched recommendations65 percent of the time.44
Today, according to the most recent analysis of bail decisions, mag-istrates follow the guideline recommendations in only 50 percent ofcases. When magistrates do not follow the recommendations, theyusually set higher bail.45 Most criminal justice stakeholders, includ-ing some who participate in preliminary arraignments, appear toknow little about what factors the guidelines consider or how thosefactors are weighted.46 Attorneys report that the argument at pre-
liminary arraignment often focuses on the severity of charges andwhether these charges will be reduced at a later date, rather thanthe totality of the factors in the guidelines. And once again, theamount of bail set varies widely from magistrate to magistrate.47
Many magistrates, judges and lawyers believe that the guidelines are
out of date. It has been more than a decade since research was con-
ducted on how well the guidelines predict whether an individual will
appear for court dates.48 One problem with the guidelines, said Mu-
nicipal Court President Judge Marsha H. Neifield, is that “there are
now offenses that weren’t even on the radar screen when the guide-
lines were developed, such as gun straw-purchase [purchasing a gun
for someone else] and violations of protection from abuse orders.”
PRETRIAL SUPERVISION AND SERVICES. Currently,
Philadelphia’s magistrates have four main choices at preliminary ar-
raignment: set bail, hold the defendant without bail, release the de-
fendant without conditions pending trial or order the defendant to
check-in periodically with pretrial services.49 Defendants ordered to
check-in attend an orientation about the court process and then call
into an interactive voice-response system once or twice a week.
For some defendants who cannot make bail and thus are jailed, a
judge may reduce bail at a later court hearing. Or the judge may
order that the defendant be released on an electronic monitor or
with intensive supervision and restricted movement. Pennsylvania
criminal procedure limits the amount of time anyone can be held
pretrial to 180 days.50 Frequently, electronic monitoring and inten-
sive supervision are used for defendants who have already been
held for 180 days.
In other jurisdictions, judges have additional choices. They can
order defendants with higher risk profiles to begin substance-abuse
treatment, receive mental health services and engage in frequent
face-to-face contact with pretrial staff. All of this occurs in the com-
munity rather than in jail. In Harris County, Texas, which includes the
city of Houston, one option is for defendants charged with DUI to
be given a device that prevents them from starting their vehicles
without passing a breathalyzer test.51 In Washington, D.C., some
pretrial defendants are ordered to wear electronic monitors from
the outset; in Philadelphia, such monitors are used primarily for sen-
tenced offenders. The more options that are available, the more
ways there are to manage accused offenders safely without putting
them in jail or increasing the risk of their not appearing in court.
44. John S. Goldkamp and E. Rely Vilcicã, “Judicial Discretion and the Unfinished Agenda of American Bail Reform,” Studies in Law, Politics and Society 47 (2009) 133-142.
45. John S. Goldkamp et al., Confinement, 72. Our request for data on guideline scores was denied by the PARS steering committee. Consequently, we were unable to con-duct our own analysis of bail guidelines recommendations and magistrate decisions. The numbers cited rely on the 2006 analysis conducted by Goldkamp, a professor inthe department of criminal justice at Temple University.
46. In conducting research for this report, we asked for copies of the bail guidelines from the District Attorney’s Office, the court system and the Defenders Association. No one was able to provide a copy.
47. John S. Goldkamp, et al., Confinement, 72.
48. The 1994 Philadelphia guidelines manual states that the guidelines will be used to “collect data on a periodic basis showing the use of the guidelines and their results (failures to appear and re-arrests) so that use of the guidelines, the impact of conditions of release and the performance of defendants can be reviewed and modificationscan be made if necessary.” John S. Goldkamp and M. Kay Harris, “Pretrial Release Guidelines,” vol. 3 (draft operational manual, Crime and Justice Research Center 1994).Little research on guideline effectiveness or revision has been done since those words were written 16 years ago.
49. In addition, pretrial services calls all released defendants—both those released on their own recognizance and those released after posting bail—to remind them of courtdates.
50. Prompt Trial, 234 PA. CODE § 600 (2000).
51.. Harris County Pretrial Services, 2008 Annual Report (2008), 5-6. In 2008, approximately 660 Harris County defendants were required to install ignition interlock deviceswhile on pretrial supervision.
26
PH
ILA
DE
LPH
IA’S
CR
OW
DE
D,
CO
ST
LY J
AIL
S:
TH
E S
EA
RC
H F
OR
SA
FE
SO
LUT
ION
S
SPECIAL RELEASE
Since the 1990s, the city has had a “special release” procedure in
place. It mandates review of all cases in which an individual has been
sent to jail even though the bail guidelines recommended that he
or she be released on his or her own recognizance.
The city’s director of prison management looks at these cases on a
regular basis and sends some of them back to a magistrate. Twice
a week, a magistrate re-hears bail decisions. This process, from pre-
liminary arraignment to re-hearing, can take five to 10 days. Each
week, about 40 cases are reheard. Most result in the immediate re-
lease of the defendant.
Ch
apte
r 5
D
EC
ISIO
N P
OIN
TS
FO
R A
DM
ISS
ION
TO
JA
IL
27
Disposition Every case eventually concludes in a verdict, a plea agreement or
dismissal of charges. If the defendant is found guilty, the court can
send him or her to the Philadelphia Prison System if the sentence is
less than two years. Those sentenced to more than two years go to
the Pennsylvania Department of Corrections. The court can also
sentence the defendant to a period of probation or community-
based programming such as substance-abuse or behavior-health
treatment. If the individual has been held in jail pending resolution
of the case, the court can sentence that person to time served and
thus immediate release.
As discussed in the last section, this is the decision point that has
been a prime focus of the recent changes that have helped drive
down the Philadelphia jail population.
Probation or Parole Defendants who are sentenced to periods of probation or released
on parole typically sign agreements committing to comply with a
series of conditions. These conditions may include regular check-ins
with a probation officer, passing drug tests, attending therapy ses-
sions and refraining from criminal activity.
If there comes a time when the probation officer decides that theoffender has violated his or her agreement, the officer can file a “violation”—a request that the court revoke the offender’s proba-tionary status and put him or her in jail. If the offender’s violation is for missing an appointment, the department may also issue a warrant for the arrest of the offender.
The types of people jailed for probation violations range from violentcriminals who have committed new crimes to individuals originally arrested for low-level offenses who have failed to show up for a meet-ing with a probation officer and are picked up on a warrant. Whateverthe circumstances, violators can be held in jail for up to 12 days be-fore seeing a magistrate who has the authority to release them.
Every weekday, a magistrate rules on the detention of between 60and 100 recently-admitted inmates alleged to have violated theconditions of their supervision. At those hearings, 20 to 25 percentare released.
Rev. Ernest McNear, founder of the Kingdom Care Offender Reentry
Network, a support program for offenders headquartered in South
Philadelphia, says that the decision to jail someone for a probation
violation often seems arbitrary. “Much of what we see is someone
who smoked drugs and doesn’t want to report so he wouldn’t get a
hot urine [a positive drug test], or someone who is tired and forget-
ful about reporting after a year or two,” McNear said. “Depending
on the officer, that guy might get a violation even though he’s been
living safely in the community for years. Or he might not.”
52. Philadelphia Prison System, Homelessness Among PPS Inmates (2004), provided by the Philadelphia Prison System (unpublished memoranda on file with the author).
53. Cooperation for Supportive Housing, Frequent Users of Public Services: Ending the Institutional Circuit (2009).
54. “First Judicial District Budget Submissions FY02-FY09,” provided by the First Judicial District Office of Financial Services (on file with the author).
Probation officials say that in the past there has been “no hard and
fast rule” for when a violation is filed or a warrant issued but add
that all have always required supervisor approval. They say that
some discretion is needed in order to manage clients on an individ-
ual basis.
One thing is clear. In Philadelphia, the probation and parole depart-
ment is overwhelmed. In 2001, the city spent $1 on probation and
parole for every $100 spent on jail; today, it spends 70 cents.54 During
this time the number of probation officers declined while the number
of cases grew. Today, probation officers have less time and few tools
to deal with individuals who do not comply with their conditions of
probation and parole. After admonishing an offender verbally or
sending a letter reminding a missing client of a skipped appointment,
there is little an officer can do other than file a violation or issue a
warrant that may send the individual to jail.
WHEN LANDING IN JAIL MAKES YOU HOMELESS AND
WHEN BEING HOMELESS KEEPS YOU IN JAIL
A 2004 survey of inmates in the Philadelphia Prison System found
that a third of prisoners expected to be homeless at the time of re-
lease.52 Of that group, a quarter reported that they were not home-
less when they entered jail but had become homeless as the result
of being incarcerated—through losing a job, falling behind in rent
or developing strained relationships with family members and room-
mates.
According to Byron Cotter, director of alternative sentencing for
the Defenders Association, many inmates find themselves caught
in another bind: incarceration makes them homeless, and being
homeless makes them ineligible for programs that could get them
released. Said Cotter, “We could get a lot more inmates released
both pretrial and after sentencing if they had appropriate housing
available; inmates don’t qualify for alternative programs like elec-
tronic monitoring if they’re returning to a shelter or to the street.
The fact is, the city can’t implement alternatives to incarceration
without supportive housing.”
This situation, which adds to the jail population, is not unique to
Philadelphia. In Chicago and New York, the local jails and human
services agencies have partnered with a nonprofit group, the Cor-
poration for Supportive Housing, to identify and provide housing,
advocacy and mental health services to individuals who cycle in and
out of jails and shelters. Early evaluations of these programs show
a significant decrease in shelter and jail stays for participating indi-
viduals.53 Philadelphia’s Office of Health and Opportunity has begun
discussion with the group to create a similar program for Philadel-
phia’s homeless.
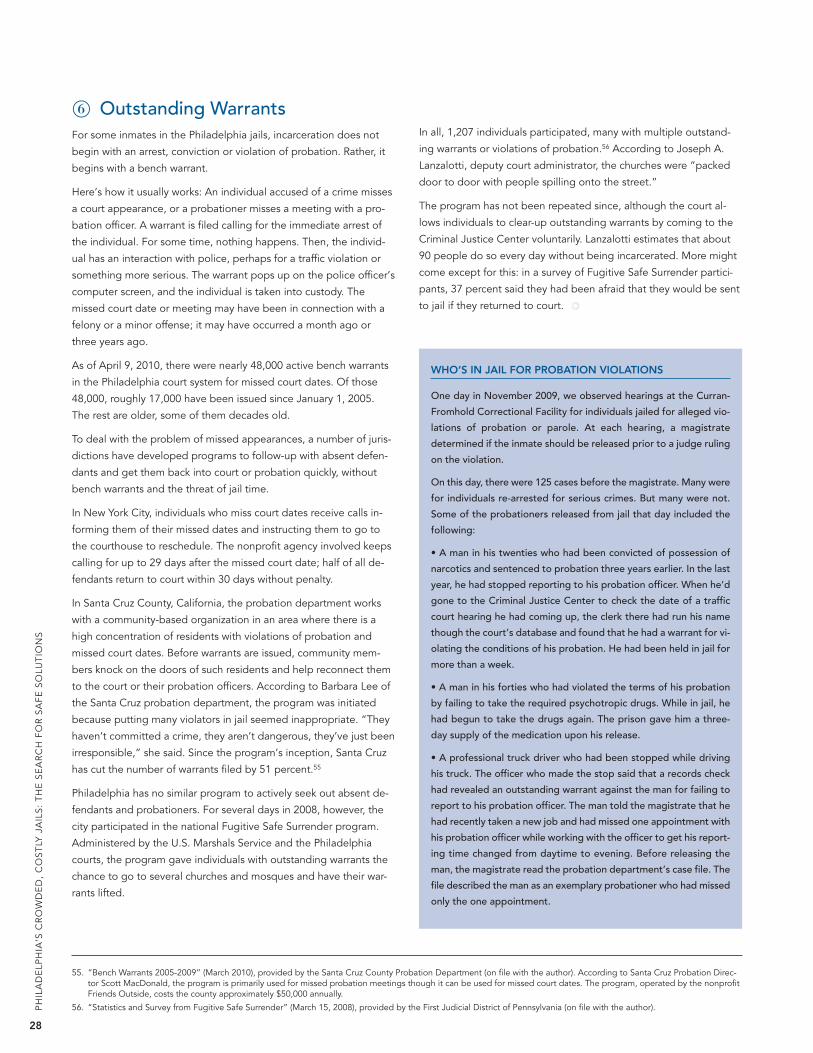
Outstanding Warrants For some inmates in the Philadelphia jails, incarceration does not
begin with an arrest, conviction or violation of probation. Rather, it
begins with a bench warrant.
Here’s how it usually works: An individual accused of a crime misses
a court appearance, or a probationer misses a meeting with a pro-
bation officer. A warrant is filed calling for the immediate arrest of
the individual. For some time, nothing happens. Then, the individ-
ual has an interaction with police, perhaps for a traffic violation or
something more serious. The warrant pops up on the police officer’s
computer screen, and the individual is taken into custody. The
missed court date or meeting may have been in connection with a
felony or a minor offense; it may have occurred a month ago or
three years ago.
As of April 9, 2010, there were nearly 48,000 active bench warrants
in the Philadelphia court system for missed court dates. Of those
48,000, roughly 17,000 have been issued since January 1, 2005.
The rest are older, some of them decades old.
To deal with the problem of missed appearances, a number of juris-
dictions have developed programs to follow-up with absent defen-
dants and get them back into court or probation quickly, without
bench warrants and the threat of jail time.
In New York City, individuals who miss court dates receive calls in-
forming them of their missed dates and instructing them to go to
the courthouse to reschedule. The nonprofit agency involved keeps
calling for up to 29 days after the missed court date; half of all de-
fendants return to court within 30 days without penalty.
In Santa Cruz County, California, the probation department works
with a community-based organization in an area where there is a
high concentration of residents with violations of probation and
missed court dates. Before warrants are issued, community mem-
bers knock on the doors of such residents and help reconnect them
to the court or their probation officers. According to Barbara Lee of
the Santa Cruz probation department, the program was initiated
because putting many violators in jail seemed inappropriate. “They
haven’t committed a crime, they aren’t dangerous, they’ve just been
irresponsible,” she said. Since the program’s inception, Santa Cruz
has cut the number of warrants filed by 51 percent.55
Philadelphia has no similar program to actively seek out absent de-
fendants and probationers. For several days in 2008, however, the
city participated in the national Fugitive Safe Surrender program.
Administered by the U.S. Marshals Service and the Philadelphia
courts, the program gave individuals with outstanding warrants the
chance to go to several churches and mosques and have their war-
rants lifted.
In all, 1,207 individuals participated, many with multiple outstand-
ing warrants or violations of probation.56 According to Joseph A.
Lanzalotti, deputy court administrator, the churches were “packed
door to door with people spilling onto the street.”
The program has not been repeated since, although the court al-
lows individuals to clear-up outstanding warrants by coming to the
Criminal Justice Center voluntarily. Lanzalotti estimates that about
90 people do so every day without being incarcerated. More might
come except for this: in a survey of Fugitive Safe Surrender partici-
pants, 37 percent said they had been afraid that they would be sent
to jail if they returned to court.
55. “Bench Warrants 2005-2009” (March 2010), provided by the Santa Cruz County Probation Department (on file with the author). According to Santa Cruz Probation Direc-tor Scott MacDonald, the program is primarily used for missed probation meetings though it can be used for missed court dates. The program, operated by the nonprofitFriends Outside, costs the county approximately $50,000 annually.
56. “Statistics and Survey from Fugitive Safe Surrender” (March 15, 2008), provided by the First Judicial District of Pennsylvania (on file with the author).
28
PH
ILA
DE
LPH
IA’S
CR
OW
DE
D,
CO
ST
LY J
AIL
S:
TH
E S
EA
RC
H F
OR
SA
FE
SO
LUT
ION
S
WHO’S IN JAIL FOR PROBATION VIOLATIONS
One day in November 2009, we observed hearings at the Curran-
Fromhold Correctional Facility for individuals jailed for alleged vio-
lations of probation or parole. At each hearing, a magistrate
determined if the inmate should be released prior to a judge ruling
on the violation.
On this day, there were 125 cases before the magistrate. Many were
for individuals re-arrested for serious crimes. But many were not.
Some of the probationers released from jail that day included the
following:
• A man in his twenties who had been convicted of possession of
narcotics and sentenced to probation three years earlier. In the last
year, he had stopped reporting to his probation officer. When he’d
gone to the Criminal Justice Center to check the date of a traffic
court hearing he had coming up, the clerk there had run his name
though the court’s database and found that he had a warrant for vi-
olating the conditions of his probation. He had been held in jail for
more than a week.
• A man in his forties who had violated the terms of his probation
by failing to take the required psychotropic drugs. While in jail, he
had begun to take the drugs again. The prison gave him a three-
day supply of the medication upon his release.
• A professional truck driver who had been stopped while driving
his truck. The officer who made the stop said that a records check
had revealed an outstanding warrant against the man for failing to
report to his probation officer. The man told the magistrate that he
had recently taken a new job and had missed one appointment with
his probation officer while working with the officer to get his report-
ing time changed from daytime to evening. Before releasing the
man, the magistrate read the probation department’s case file. The
file described the man as an exemplary probationer who had missed
only the one appointment.

Ch
apte
r 6
W
HA
T I
S B
EIN
G D
ON
E T
O R
ED
UC
E T
HE
JA
IL P
OP
ULA
TIO
N
29
Changing the Charging Standard District Attorney Williams has overhauled the charging unit, crafting
new procedures and giving it a bigger and more experienced staff
than in the past. “The reinvigorated unit is in the process of chang-
ing the charging standards from `probable cause’ to `reasonable
doubt,’” Williams said. “I want people to know that only the right
cases are being charged; that when we charge a case, we can con-
vict beyond a reasonable doubt.”
Williams and his team hope that this approach will help speed up
the court process by encouraging more defendants to accept plea
bargains earlier and by keeping more low-level cases out of the
courts. He also hopes that it will allow his office to focus its re-
sources on the cases that remain. In April 2010, he announced that
his office would no longer charge low-level marijuana possession
cases as misdemeanors; instead, it would treat them as summary of-
fenses—cases that receive citations and do not go through the pre-
liminary arraignment process.57
These changes have the potential to shrink the jail population and
save money, although Williams said that is not his primary concern.
“My role is to seek justice in individual cases,” he said. “We should
be more efficient in assessing our cases, determining to whom pleas
should be offered and for whom diversionary programs are most ap-
propriate. Such a strategy will allow us to focus more energy and re-
sources at targeting violent criminals.”
The challenge, according to other prosecutors and defense attor-
neys, will be how to make these determinations when, at preliminary
arraignment, the charging unit often has little more than a bare-
bones police report. And the risk is that an individual released with-
out being charged will go on to commit a serious crime.
57. Nancy Philips, Dylan Purcell, and Craig McCoy, "Philadelphia to Ease MarijuanaPenalty," Philadelphia Inquirer, April 5, 2010, A01.
Expediting Plea Agreements“Crash court” is an expedited plea process run through Municipal
Court to deal with individuals being held pretrial on certain lower-
level misdemeanor charges. Cases are selected by the city’s director
of prison management and the public defender’s office. Under an
accelerated time frame, the public defender and district attorney
negotiate pleas. If a defendant agrees to the plea offer, the case is
placed on the crash-court docket. On a typical week, about 50
cases are heard in this manner. According to the public defenders,
cases referred to crash court are completed within two to three
weeks after preliminary arraignment.
Crash court has been in existence for several decades, but now the
district attorney’s office has broadened the range of eligible cases
to include some domestic violence cases and individuals with war-
rants. In addition, the court, the prison system and the attorneys are
working to speed up the process through videoconferencing; previ-
ously, defendants were transported to the Criminal Justice Center
twice a week for crash court. Thanks to videoconferencing, the court
is now able to operate on a daily basis, thereby getting eligible in-
mates out sooner.
Said chief public defender Greenlee: “The changes to crash court
are making a big difference. The defendants are getting the [plea]
offers earlier. It’s taken a lot of effort, and all of the different stake-
holders working together. But it’s paying off.”
A lot is changing in the Philadelphia criminal justice system, much of it aimed at reducing the jail population
while maintaining public safety. Many of these reforms affect the decision points that determine whether people
go to jail and how long they stay.
6What is Being Done to Reduce the Jail Population
Day Reporting CenterPhiladelphia is making plans for a day reporting center—a place
where nonviolent individuals who otherwise would be in jail can
report daily and be supervised while remaining in the community.
Eligibility to participate would be limited, and the proposed center
would provide participants with a range of supportive services.
Plans for the Philadelphia center are taking shape. Policy makers are
deciding whether it would be used by the probation department for
violators, by judges for alternative sentencing, or by the courts and
pretrial services for individuals who otherwise would be in jail await-
ing trial.
Said Deputy Mayor for Public Safety Gillison: “What do we need
to reduce the jail population? We need a place for people to go if
we’re not putting them in jail. That’s what this will be.”
DAY REPORTING
The term “day reporting center” has different meanings in different
communities.
Generally speaking, a day reporting center is a place where individ-
uals who would otherwise be in jail go for supervision and social
services. Hours of reporting vary. Most centers require that partic-
ipants stay at the facility for the better part of the day, but some
allow participants with jobs or other obligations merely to check in.
In the last 20 years, day reporting centers have been established
from western Massachusetts to central California, from Chicago to
Orlando. They have been used for individuals who have violated
conditions of probation, for individuals awaiting trial who would oth-
erwise be incarcerated and for people who would otherwise be
serving sentences.
Some centers focus on ensuring that people show up and keep off
the streets. Others concentrate on providing social services.
There are few studies on the impact of the centers. Research done
in 1998 and 1999 on the center in Cook County, Illinois, which is de-
signed for pretrial defendants, found that less than 1 percent of the
individuals being supervised failed to appear in court and that 5 per-
cent were arrested while in the program.58
One of the obstacles to establishing a day reporting center, of
course, is finding a neighborhood that accepts it.
Sentencing and Reentry In 2009, Philadelphia opened the Mayor’s Office of Reentry Serv-
ices, since renamed the Mayor’s Office of Reintegration Service for
Ex-Offenders. The office provides services to help convicted in-
mates leaving state or local incarceration reintegrate into the com-
munity; the focus is on employment assistance and mentoring.
Advocates for reentry services argue that these services can reduce
the populations of the city jail and state prison in two ways. First,
successful reintegration reduces the number of people who commit
new crimes. Second, judges and the state parole board are more
likely to release convicted inmates early if inmates can be released
to an established program.
The city’s new Mental Health Court also has the potential to shorten
the jail-stays of sentenced inmates. Opened in 2009, it provides
behavioral health services and judicial supervision to convicted in-
mates with histories of mental illness. Individuals, identified while
in jail, can have their periods of incarceration shortened by agreeing
to participate.
Streamlining the Court Process for ViolatorsThe city is also updating court practices regarding individuals onprobation or parole. Since March 2009, the courts have launchedthree programs designed to reduce the time it takes to get a viola-tion of probation heard by a judge:
• Accelerated Violation of Probation Program. Individuals al-leged to have violated a “technical” term of their probation—by missing a meeting or failing a drug test—now can have theircases heard on an expedited basis by a judge specializing insuch hearings. To participate, they need the consent of thejudge who originally put them on probation. Our observation ofthe program indicates that many of the 440 cases it handled in2009 involved probationers who were not in jail at the time oftheir hearings; no statistics on this matter are available. The pro-gram affects the jail population to the degree that it deals withviolators who are in custody.
• Non-Sitting Judges Cases. A problem for some probationersawaiting violation hearings is that the judge who sentencedthem originally now sits in civil court and has trouble makingtime for a violation hearing. Since last year, however, more than1,000 of these hearings have been reassigned to the judge specializing in violation hearings.
• Advanced Review and Consolidation Program. This covers pro-bationers accused of new crimes. They typically face two legalproblems: the new accusation and a probation violation stemmingfrom the new arrest. Defendants who accept a plea agreement onthe new charges can have those charges and the probation viola-tion heard together by the violations judge. Many of these casesalso involve people not in jail at the time of the hearing. In 2009,1,635 cases were resolved through the program.
58. Christine Martin, Arthur J. Lirigio, and David E. Olson, “An Examination of Rearrest and Reincarceration Among Discharged Day Reporting Center Clients,” Federal Probation, 2003: 26.
30
PH
ILA
DE
LPH
IA’S
CR
OW
DE
D,
CO
ST
LY J
AIL
S:
TH
E S
EA
RC
H F
OR
SA
FE
SO
LUT
ION
S

Ch
apte
r 6
W
HA
T I
S B
EIN
G D
ON
E T
O R
ED
UC
E T
HE
JA
IL P
OP
ULA
TIO
N
31
THE IMPORTANCE OF GOOD PAPERWORK
Whom to admit, whom to detain, whom to let out and when—the
Philadelphia Prison System gets its instructions from the Clerk of
Quarter Sessions.
For 18 years, Vivian T. Miller, an elected official, had the responsi-
bility for recording court orders and transmitting them to the prison.
Her office lacked the necessary technology and quality controls.
Judges, lawyers and prison officials complained that the clerk’s of-
fice often recorded and transmitted inaccurate, late or confusing
orders. These mistakes led to some high-profile cases of inmates
getting out too early while others were held too long.
In March, Miller announced her retirement, and on April 1, Mayor
Nutter and President Judge Dembe announced that the court sys-
tem would take charge of the work. “We are excited to bring the
functions of the clerk’s office to 21st century standards,” Judge
Dembe said.
Cautiously rolled out last year, these new programs are gaining ac-
ceptance. The experience of other jurisdictions indicates that the
programs, if expanded to include more of the people who are in
detention, have the potential to reduce the jail population. For ex-
ample, in Hillsborough County, Florida, which includes Tampa, it
used to take 37 days on average for a violation of probation to
make it through the court system. Now, the county has a specialty
court that hears all violations and new cases related to the viola-
tions. All outstanding matters are consolidated, and cases get re-
solved in less than half the time. The county’s former detention
department commander, David Parrish, said the change has been
a substantial contributor to a decline in the inmate population by
1,000 from 2005 to 2009.
Other Changes to Court ProcessesIn Philadelphia, it often takes six months or more for a case to move
though the criminal justice system. Judges, prosecutors and de-
fenders agree that continuances are at the heart of this problem.
Once a case is approaching trial, the most frequent cause of contin-
uances is unfinished discovery, said D. Webster Keogh, administra-
tive judge for the trial division. Discovery is the requirement that
prosecution and defense provide each other certain evidence prior
to trial.
To address this issue, the Court of Common Pleas in January 2010
opened Discovery Court, a courtroom dedicated to working out dis-
covery issues prior to trial. All cases headed to trial must first stop in
discovery court. The goal, said Keogh, is to “reduce disposition im-
pediments and get the parties to address the case in a meaningful
way earlier on” and thereby “reduce continuances, witness appear-
ances, police overtime and busy work for the court and move the
process along.”
Although it is too soon to know, this new court could impact the jail
population by reducing the time spent in jail by inmates awaiting
trial and by reducing the number of bench warrants issued for those
not in custody. Why fewer warrants? Research indicates that the
longer a case lasts, the more likely defendants are to miss court
dates.59 So, speeding up the court process may result in fewer war-
rants and fewer people in jail as a result.
While Discovery Court may reduce how long some defendants stay
in jail, the impact of another recent court practice is open to de-
bate. On April 17, 2010, the rules governing Philadelphia courts
were changed to increase the time between the preliminary arraign-
ment, when bail is set, and the preliminary hearing, when the court
determines whether the prosecution has grounds to proceed with
the charges.60 Under the old system, proponents of the change say,
prosecutors often did not have time to notify witnesses; as a result,
hearings were postponed, keeping jailed defendants behind bars
pretrial. Others counter that the new system means it will take
longer for some cases to be dismissed, resulting in longer pretrial
stays for some.
59. Goldkamp, et al., Confinement, 66.
60. Amendment to Rule 1003 (Procedure in Non-Summary Municipal Court Cases) 40 PA Bulletin 2012 (2010).
Some work is already going on in this area, including the changes in
the district attorney’s charging unit and the planning for a day re-
porting center.
The final section of this report outlines additional options for
change, based on programs already in place in other jurisdictions. If
any of these options are adopted, they would have to be tailored to
Philadelphia’s needs. Unlike the transfer of inmates to the state sys-
tem, some of these changes would be slow in producing measura-
ble results. Several are items the city has considered and worked on
in the past.
The key to building on recent gains is not just creating individual
new programs; it is designing a coordinated plan that allows for on-
going monitoring and adjustment. Said Joanne Fuller, former direc-
tor of the Department of Community Justice in Multnomah County,
Oregon, and a noted criminal-justice reform leader: “System reform
is never done—it is an ongoing process where each reform leads to
better understanding both of what is working well and what is not.
So each reform exposes the need for the next reform. It becomes
not a thing you do but a way of thinking about your work and the
work of whole systems.”
None of this is easy. Most of the measures discussed here have
up-front costs. And all must be tested against the need to maintain
public safety and get defendants who are not in jail to appear in
court.
Expanding Options for DivertingCases away from the CourtsIn interviews for this report, multiple stakeholders in the Philadel-
phia criminal justice system expressed a desire to see the system
expand its programs to divert various types of cases away from the
criminal justice system and thus the possibility of individuals going
to jail. In particular, they cited the need to create alternative re-
sponses for nonviolent, chronic offenders who have underlying is-
sues that contribute to their criminal behavior but that are not
addressed through the traditional court process.
“Some of these people go through intake three or four times during
a year,” said Chip Junod, the city’s director for prison management.
“Every time they come through, the city has to pay for initial cost
of intake. It’s easier not to put them in than trying to get them out
after the fact. What we need is something other than jail for these
people.”
It was this type of thinking that led Milwaukee County, Wisconsin,
to expand its diversion programs. “There are low risk offenders in
need of treatment,” said John Chisholm, the district attorney there.
“I said to the public, ‘Let me create responsive diversion programs
for the categories of offenses and offenders who annoy us but don’t
scare us.’ In the process, we’ll reduce violent crime, and we’ll put
less people in jail.”
None of Philadelphia’s five diversion programs, described earlier,
is targeted at chronic offenders or defendants whose mental health
contributes to their criminal conduct. And while the city has an array
of alternative sentences and specialty courts for these types of of-
fenders, they come into play only after a defendant has entered the
The population in the Philadelphia Prison System has fallen, thanks largely to a sharp decline in the number of sen-
tenced inmates there. But the overall population continues to be driven primarily by inmates sent to jail prior to
trial, many of whom only stay for a matter of days. Unless innovations are made at the decision points that influence
pretrial detention, Philadelphia’s gains in controlling its jail population may be hard to maintain or build upon.
7What More Can Be Done to Reduce the Jail Population
32
PH
ILA
DE
LPH
IA’S
CR
OW
DE
D,
CO
ST
LY J
AIL
S:
TH
E S
EA
RC
H F
OR
SA
FE
SO
LUT
ION
S

Ch
apte
r 7
WH
AT
MO
RE
CA
N B
E D
ON
E T
O R
ED
UC
E T
HE
JA
IL P
OP
ULA
TIO
N
33
criminal justice system. Without alternatives diverting offenders
from the beginning, the city will continue to send chronic, low-level
offenders to jail over and over again, particularly pretrial.
Here are some examples of what other jurisdictions are doing:
• In Milwaukee County, a network of community-based agencies
provides services to clients diverted from court. These include
drug and alcohol counseling, general equivalency diploma and
work-placement programming for men between the ages of 17
and 19, healthcare for the homeless, life skills and esteem-build-
ing for women, and anger management education.
• In Allegheny County, Pennsylvania, at preliminary arraignment,
workers from the county’s Office of Behavioral Health screen de-
fendants suspected of having behavioral-health problems. When
services are needed, the behavioral-health workers design appro-
priate service-plans. With the consent of all parties, the defen-
dants are released into services without further court involvement.
• In Bexar County, Texas, which includes San Antonio, individuals
suspected of minor crimes and thought to be mentally ill are
taken by police officers directly to a 60-bed facility known as the
Crisis Care Center. If these individuals turn out to be mentally ill
and accept treatment, they are not at risk of going to jail. “Treat-
ment works,” said Leon Evans, who conceived the program and
heads the agency that runs it. “When they’re lucid, these people
have no propensity to commit crimes.”
61. New York judges are also given information on factors not considered in their guideline recommendation. When New York revised its guideline tools in 2003, the researchthat led to the revision indicated that several elements previously included—someone meeting the defendant at preliminary arraignment as well as the absence of any priorbench warrants or unresolved cases—were no longer predictive of appearance in court. The Criminal Justice Agency, which compiles the pretrial reports, took these factorsout of the calculation. But at the request of the judges, it continues to include them in its write-ups to the court.
Revitalizing the Bail GuidelinesAs discussed earlier, the guidelines for determining whether a defen-
dant should be released at preliminary arraignment or have bail set—
and how much that bail should be—are frequently ignored in
Philadelphia. Bail is being set in an increasing number of cases, bail
amounts have risen and the city has a relatively high rate of defen-
dants who miss court dates. Other cities, including New York and
Washington, set bail in a lower percentage of cases and yet report
lower levels of missed court dates. For Philadelphia, the challenge is
to transform the existing guidelines into a useful and effective deci-
sion-making tool.
What does such a decision-making tool look like? In New York City
and Montgomery County, Maryland, courts rely consistently on the
recommendations generated by bail guidelines—and a relatively
high percentage of released defendants show up for their court
dates. The guidelines in those places have three things in common:
• Magistrates and judges get full write-ups of all of the factors
that go into a guideline recommendation, such as the defen-
dant’s living and employment situation. In Philadelphia, the
magistrates get only a guideline score.61
• The guidelines are used as the basis for ongoing research into
the predictors of whether a defendant will appear in court. No
such research is being done in Philadelphia.
• In New York City and Montgomery County, the guideline rec-
ommendations do not suggest specific bail amounts, as do
Philadelphia Detention Center
CREDIT: ROBERT LECONEY

Philadelphia’s guidelines. Rather, they simply sort defendants
into three categories: low risk of failure to appear (recom-
mended release), moderate risk of failure to appear (no recom-
mendation), and high risk of failure to appear (bail or detention
recommended).
A transformed bail-guideline tool—one that is shown to be effective
and presents useful information in a clear format—could change
current practice. It would have the potential of increasing the per-
centage of defendants who show up for court and reducing the
number of pretrial admissions to jail.
Creating a Broader Range of Pretrial ServicesAt preliminary arraignment, Philadelphia’s magistrates have limited
choices: release defendants on their own recognizance, require
them to check-in weekly with a voice-response system, set bail or
order them held without bail. This could change if the city opens a
day reporting center. But even with this addition, Philadelphia’s pre-
trial options would remain relatively thin.
Jurisdictions including Washington, D.C., and Montgomery County,
Maryland, tie pretrial services to their bail guidelines. Defendants
who score in the moderate-risk category—meaning that they pose
some risk of failing to appear for court dates—are linked to services
designed to counterbalance the factors that make them flight risks.
These services typically include drug counseling and housing sup-
port. Intensive supervision, including electronic monitoring or as-
signment to a day reporting center, is reserved for the members of
the group considered least likely to appear in court.
Said Nola Joyce, chief administrative officer of the Philadelphia Po-
lice Department and a former police official in the District of Colum-
bia, “When you put people back into the street without doing an
effective sort and matching on risk and need, I don’t feel safer be-
cause all you’re doing is putting people back on the street. But
what happened in the District made more sense. D.C. Pretrial Serv-
ices worked to match individuals with programs and appropriate
levels of supervision. You knew that the [pretrial defendants] who
needed it were getting the support they required.”
A broader selection of pretrial services would allow more members
of the moderate-risk population to remain in the community safely
pretrial while potentially increasing court appearance rates.
Developing New Responses to Probation ViolationsIn 2009, there were 5,943 admissions to the Philadelphia Prison Sys-
tem for violations of probation or parole. These violations ran the
gamut from individuals getting arrested for new and violent crimes
to those who missed single meetings with probation officers.
Recognizing that probation officers have growing caseloads and
limited options, community corrections departments around the
country are working to standardize the circumstances under which
violations and warrants can be filed. These departments are estab-
lishing clear policies about when to issue formal violations; they are
developing administrative sanctions that allow probation officers to
respond to infractions without using incarceration or involving the
court. Sanctions include requiring probationers to make more fre-
quent check-ins, do weekend community service, accept electronic
monitoring or go to day reporting centers.
In Georgia, the state probation department began employing such
sanctions in select counties in 2004. An initial study of the practice
found that probationers in those counties spent far fewer days in jail
than probationers in other counties.62 The program has been ex-
panded to include the entire state.
Getting People to Show Up Every day in the Philadelphia Prison System, a magistrate hears
dozens of cases of people jailed on warrants, usually for missed
court dates or missed probation appointments. As discussed earlier,
jurisdictions such as New York City and Santa Cruz County, Califor-
nia, have developed programs that reach out to defendants who
miss court dates. These programs give defendants the chance to get
back into court promptly without punishment, saving jail bed-days.
Reinvesting for Safety and SavingsJurisdictions that have experienced savings from reduced jail or
prison populations are hungry for more. And they are eager to use
these savings to fund other priorities. Philadelphia is no exception.
But some programs that could reduce the population further have
up-front costs. Under a concept known as “justice reinvestment,”
some of the savings generated by reduced incarceration-levels is
put back into such programs. In Texas, for example, state officials
put a portion of the funds no longer needed for prison construction
into community alternatives to imprisonment. The result has been a
continued decline in incarceration levels and an estimated savings
of $230 million over two years.63
A national Justice Reinvestment Act is currently under consideration
in Congress.64 If enacted, the act would provide federal grants to
local and state jurisdictions that use data analysis to help craft policy
options that safely “manage the growth of corrections spending”
and agree to reinvest “averted prison or jail costs” into programs
that improve public safety.
62. Applied Research Services, Inc., An Evaluation of Georgia's Probation Options Management Act (Atlanta: Applied Research Services, Inc., 2007).
63. Council of State Governments Justice Center, Justice Reinvestment State Brief: Texas (New York, NY: Council of State Governments Justice Center, 2007).
64. Criminal Justice Reinvestment Act, H.R. 4080, 111th Cong. (2009).
34
PH
ILA
DE
LPH
IA’S
CR
OW
DE
D,
CO
ST
LY J
AIL
S:
TH
E S
EA
RC
H F
OR
SA
FE
SO
LUT
ION
S

Ch
apte
r 7
WH
AT
MO
RE
CA
N B
E D
ON
E T
O R
ED
UC
E T
HE
JA
IL P
OP
ULA
TIO
N
35
65. Performance indicators can be implemented without integrating data systems. Stakeholders identify a few, easily collectable statistics for each decision point or innova-tion. The agencies responsible for those points or reforms then report out from existing data sources.
Tracking PerformanceWhat impact are various measures having on the jail population?
Which decision points in the criminal justice system are functioning
as intended and which are not working as well?
How many sentenced inmates are going to state prisons? What is
the effect of the revamping of the district attorney’s charging unit?
Are new court practices changing the pretrial lengths of stay for in-
mates? Has the number of violations and warrants in probation and
parole cases risen or fallen since the probation department changed
its supervision model?
On a monthly basis, Philadelphia’s Criminal Justice Advisory Board
reviews aggregate daily population numbers from the prison. And
the Court of Common Pleas provides numbers on hearings and dis-
positions. But these statistics are not sufficient to let criminal justice
stakeholders track the performance of the system in general or their
reforms in particular.
An increasing number of other jurisdictions are adopting perform-
ance indicators—statistics that help describe changes over time,
establish key benchmarks, identify when a course correction is
needed and figure out what the new goals should be.65 In many
places, one of those goals is managing the use of incarceration.
“We need to set milestones and track our performance,” said
Deputy District Attorney Hart. “We need to be able to see how
the system is performing and be able to systematically identify the
types of cases that are falling through the cracks.”
Without careful monitoring, programs designed to reduce jail popu-
lations such as day reporting centers and electronic monitoring can
end up serving defendants who would be in the community anyway.
These programs ultimately cost money instead of saving it and have
little or no impact on how many people are in custody. Absent reli-
able and current data, the public is unlikely to support innovations
that claim to reduce jail populations without compromising public
safety.
Philadelphia Industrial Correction Center
CREDIT: ROBERT LECONEY

36
PH
ILA
DE
LPH
IA’S
CR
OW
DE
D,
CO
ST
LY J
AIL
S:
TH
E S
EA
RC
H F
OR
SA
FE
SO
LUT
ION
S
PPS Data
Data on the population of the prison were obtained from the case-
management system maintained by PPS. Data included information
for all persons admitted between January 1, 1999 and December
31, 2009. A series of individual-level variables extracted from the
data included demographic information (such as gender, race, and
marital status), arrest charges, admission date, admission reason, re-
lease date, release reason, case number, charge disposition and
sentence and sentence date (if applicable).
PPS data were used to examine the number of admissions, the daily
population on June 30 of each year, the lengths of stay for persons
released from PPS and the number of bed-days consumed. For
each of these, the analyses focused on the individual’s pathway to
jail or hold status (pretrial, violator, sentenced, or other) and the
most serious holding offense for each pathway.
Determining hold status, most serious holding offense and length of
stay in each hold status is a complicated process. Individuals can be
held in jail for multiple reasons at the same time, and their status
can change over time as charges are dropped or adjudicated. For
example, an individual can be admitted pretrial on a new arrest and
as a probation violator at the same time. For each unique intake
into PPS—each time an individual physically enters PPS from out-
side the jail—the case management system assigns a unique intake
number.
To examine admissions, our analysis counts unique intake num-
bers—the same method used by the prison system. The analysis al-
lowed individuals to have only one status per unique intake
(admission). To determine this status, we ranked serving a sentence
first, being held on a probation or parole violation second, being
held pretrial third and being held for another jurisdiction fourth. In-
dividuals with multiple holds for the same intake number or whose
hold status changed while incarcerated (without a new intake) were
categorized as having only one status for the purposes of counting
admissions. Thus, an individual who had a status of “sentenced” at
any point during an intake was categorized as “sentenced” for
counting admissions. Individuals could have multiple admissions on
the same case—if, for instance, they posted bail and were released
pretrial but later came back sentenced. ME
TH
OD
OLO
GY
Notes on Methodology
This report relies on five data sources to
examine population trends in the Philadel-
phia Prison System: admissions data main-
tained by the Philadelphia Prison System
(PPS), arraignment data maintained by the
Preliminary Arraignment System (PARS),
case-processing data maintained by the
Administrative Office of the Pennsylvania
Courts (AOPC), crime data maintained by
the Pennsylvania Uniform Crime Reporting
System and jail population data collected
by the Bureau of Justice Statistics.

ME
TH
OD
OLO
GY
37
After ranking the hold status, the analyses further ranked admissions
by most serious offense as determined by the offense gravity score
contained in the Pennsylvania Sentencing Guidelines. When it was
impossible to match the specific offense to a specific score, the low-
est offense applicable gravity score was assigned to the offense.
To examine the daily population, the lengths of stay and bed-days
consumed, our analysis categorized individuals by a different
method. For daily population, we looked at hold status on June 30.
For length of stay and bed-days consumed, we looked at an individ-
ual’s entire admissions period and calculated how long the individ-
ual was incarcerated on a given hold status. Because individuals
may have multiple hold statuses at the same time, the previously-
described ranking of hold statuses was used to determine the pri-
mary hold status at any given point.
In counting length of stay and bed-days consumed, an inmate’s stay
was assigned to the year in which the defendant was released, re-
gardless of when he or she was admitted. Because data was pro-
vided to us in January 2010, many inmates admitted in 2009
(particularly sentenced and violator inmates) had not been released
by then. Consequently, length of stay and bed-day numbers for
2009 were estimated.
PARS Data
Data on preliminary arraignment decisions were obtained from the
case management system maintained by PARS. Data included infor-
mation for all persons who had preliminary arraignments between
January 1, 2003 and December 31, 2009. A series of individual-level
variables extracted from the data included demographic informa-
tion, most serious charge, offense tracking number (OTN), arrest
date, bail disposition and bail amount.
PARS data were used to examine the bail decisions for individuals
who had preliminary arraignments between 2003 and 2009. The
analysis focused on the decision to release individuals on their own
recognizance (ROR) pretrial or to set bail and, if bail was set, the
amount. The analysis examined bail decisions for unique OTNs or
arrest incidents.
AOPC Data
Data on the processing of cases through the court system were ob-
tained from the system maintained by AOPC. Data included infor-
mation for all persons with criminal cases filed against them in
Municipal or Common Pleas Court between October 1, 2006 and
December 31, 2009. This time period was chosen because the
Philadelphia court system began reporting data into the AOPC sys-
tem starting in September 2006.
The AOPC data were developed from several data sets, containing
information on bail, confinement, charges, dispositions, sentences,
case events and warrants. Data from these sets were merged using
common case number identifiers, which allowed for the creation of
a single database and the analysis of linked demographic and case
information.
AOPC data were used primarily to examine bail outcomes and war-
rants issued for individuals arraigned between 2006 and 2009. The
analysis focused on the individuals who posted bail and the time it
took them to post bail. The analysis also considered the cases with
warrants issued and the warrants issued for individuals released pre-
trial. This required merging AOPC data with PARS and PPS data to
determine which individuals were released ROR and which individu-
als with bail set were released pretrial. Data from AOPC were first
merged with PARS data using the OTN assigned to each charge;
the data were then merged with PPS data using the docket number
assigned at arraignment.
Crime and Arrest Data
Longitudinal data describing crime and arrest trends were obtained
from public data sets through the Pennsylvania Uniform Crime Re-
porting System.
National Jail Data
Data describing jail populations in other jurisdictions were obtained
from public data sets maintained by the Bureau of Justice Statistics,
a division of the U.S. Department of Justice. Additional data on cor-
rections spending were obtained directly through interviews and
surveys of corrections administrators in other jurisdictions.

38
PH
ILA
DE
LPH
IA’S
CR
OW
DE
D,
CO
ST
LY J
AIL
S:
TH
E S
EA
RC
H F
OR
SA
FE
SO
LUT
ION
S
We gratefully acknowledge the judges and administrative staff of
the Philadelphia Court system who gave us their time and insights.
They include Common Pleas Court President Judge Pamela P.
Dembe; Judge D. Webster Keogh, administrative judge of the trial
division; Judge Sheila Woods-Skipper, supervising judge of the
criminal section of the trial division; Municipal Court President
Judge Marsha H. Neifield; and David C. Lawrence, Joseph A. Lan-
zolotti, Kathleen M. Rapone, Kevin Cross, Keith Smith and their col-
leagues in court administration. In addition, we would like to thank
all of the members of the Preliminary Arraignment System working
group for providing us data on preliminary arraignments and Todd
Van Gunten, the system’s technical lead, for making sure that we
understood the data.
Additional officials throughout Philadelphia’s criminal justice system
have shared with us their perspective: Director Robert Malvestuto,
Ellen Kurtz, Kathleen M. Intenzo and the staff of the Adult Probation
and Parole Department; William Babcock from Community Court,
Chief Defender Ellen T. Greenlee and her staff at the Defender As-
sociation, including Byron C. Cotter, Charles A. Cunningham, Abi-
gail Horn, Elizabeth Hurt, John M. Konchack, Thomas J. Innes III,
Joanna McClinton, Stuart Schuman and Adrienne Winney; District
Attorney R. Seth Williams and his staff, including John Delaney,
Christopher P. Diviny, Robert Foster, Sarah V. Hart, Deborah Harley,
Kristen Heine, Dawn M. Holtz, John Andrew Jenemann, Thomas
Lipscomb and Catherine Thurston; Deputy Mayor for Public Safety
Everett A. Gillison and his staff, including Chip Junod and Michael
Resnick; Police Commissioner Charles H. Ramsey and members of
the Philadelphia Police Department, including Kevin Bethel, Francis
Healy, and Nola Joyce; former District Attorney Lynne M. Abraham;
Councilman Bill Green; former Prison Commissioner Leon A. King II;
and former candidate for district attorney Michael Untermeyer. AC
KN
OW
LED
GE
ME
NT
S
This report would not have been possible
without the cooperation of Commissioner
Louis Giorla and his staff at the Philadel-
phia Prison System. In addition to provid-
ing much of the raw data used for the
analysis in this report, the staff at the
prison worked with us to make sure we
understood the nuances of the system. In
particular, we would like to acknowledge
James DiNubile, Roseanne Duzinski,
Robert Eskind, Robert Fitzmartin, Marco
Giannetta, Bruce Herdman, Cheryl Morri-
son, Richard Petrelli, Christopher Thomas
and Robert Tomaszewski.

AC
KN
OW
LED
GE
ME
NT
S
39
This report was enriched by our conversations with several service-
providers and advocates: Rev. Ernest McNear and Greg Thomas from
the Kingdom Care Reentry Network; Angus R. Love and Su Ming Yeh
from the Institutional Law Project; Amy Augustine and Deborah
Schlater from the Philadelphia Health Management Corporation;
Cameron Holmes, Betty-Ann Soiefer Izenman and Ann Schwartzman
from the Prison Society; and David Rudovsky, civil rights attorney and
professor at the University of Pennsylvania Law School.
A welcome orientation to the Philadelphia criminal justice system,
its data and its history was provided by Temple University professor
John S. Goldkamp.
In addition to these individuals listed by name, many Philadelphia
attorneys, clerks, judges, inmates, scholars and magistrates spoke
with us about their experiences and ideas. We are truly grateful for
their contribution.
We would also like to thank the officials throughout the country who
took time to talk with us about their jails and jail reforms, particularly
Scott MacDonald and Barbara Lee in Santa Cruz County, California;
Jerome McElroy in New York City; Sharon Trexler in Montgomery
County, Maryland; David Parrish in Hillsborough County, Florida;
and Leon Evans in Bexar County, Texas.
And we are thankful for the support and guidance we received from
Adam Gelb, Jake Horowitz and Richard Jerome, our colleagues at the
Public Safety Performance Project of the Pew Center on the States.
Their broad expertise in the field of corrections provided us with wise
counsel in conceiving, executing and completing this report.
Other Pew colleagues contributed to this effort as well. They include
Cindy Jobbins, Donald Kimelman, Jennifer Lowes and Emily
Cheramie Walz. Kristen-Elise Brooks, a student at the University of
Pennsylvania Law School, joined the Pew team as an intern to assist
on this report.
About the Authors
Claire Shubik-Richards, senior associate of the Philadelphia Re-
search Initiative at The Pew Charitable Trusts, was the primary au-
thor and researcher on this report. Data analysis was performed by
Don Stemen, assistant professor of criminal justice at Loyola Univer-
sity Chicago. The report was overseen and edited by Philadelphia
Research Initiative project director Larry Eichel.

THE PEW CHARITABLE TRUSTS
2005 MARKET STREET, SUITE 1700
PHILADELPHIA, PA 19103-7077
www.pewtrusts.org
www.pewtrusts.org/philaresearch