Phil Carden Design Analysis - leonardointegration.it · definitive design phase for timing drive...
35
© Ricardo plc 2006 Timing drive analysis Phil Carden Design Analysis RD06/340901.1 Japan, November 2006
Transcript of Phil Carden Design Analysis - leonardointegration.it · definitive design phase for timing drive...
© Ricardo plc 2006
Timing drive analysis
Phil Carden
Design Analysis
RD06/340901.1
Japan, November 2006

© R
icard
o p
lc 2
006
RD06/340901.1 2
Agenda
Introduction
Chain drive
Belt drive
Gear drive
Conclusions

© R
icard
o p
lc 2
006
RD06/340901.1 3
Introduction – History (1)
Until 10 years ago timing drives were designed using rules of thumb developed over many years by engine designers and timing drive component suppliers
– maximum span length
– minimum wrap angle
These guidelines were supplemented by
– rudimentary analysis
– rig testing using constant speed input
Mostly this process led to
– conservative drive layouts
– long development process
– over-engineered components
Occasionally disasters occurred
– Failure to complete development process
– Requiring radical redesign of whole engine
– Warranty problems for life of engine
Introduction
Source:

© R
icard
o p
lc 2
006
RD06/340901.1 4
Introduction – History (2)
In the late 1990s change came from many directions
Increased excitation from camshafts and crankshafts on passenger cars
– higher cylinder pressures from diesel engines and fuel pumps driven by timing chain
– adoption of dual mass flywheels led to increased crank nose motion at low speed
– higher engine speeds on some high performance gasoline engines
Adoption of overhead camshaft layout on heavy duty truck engines to drive injectors with required precision
Increased need for low cost solutions in most market segments
– Reduce design/development costs/timescales
– Reduce component/system costs
– Reduce warranty costs
Wide-spread availability of computing power and development of hi-fidelity analysis tools such as VALDYN
Introduction

© R
icard
o p
lc 2
006
RD06/340901.1 5
Introduction – History (3)
Use of VALDYN
– Software developed initially to investigate the failure of a balancer chain drive during development
– Results gave much improved understanding of system dynamics and durability
– Correlation with measured data by Ricardo and other users increased confidence in predictions
– Gradually use of VALDYN became standard part of definitive design phase for timing drive and balancer drives
Timing drive design is now led by analysis
– Routine analysis at concept phase for chain drives
– Analysis of belts and gears is slightly behind but Ricardo are ready
– Analysis increasingly used for NVH studies
VALDYN is used by engine manufacturers and chain suppliers as well as Ricardo
Introduction
© R
icard
o p
lc 2
006
RD06/340901.1 6
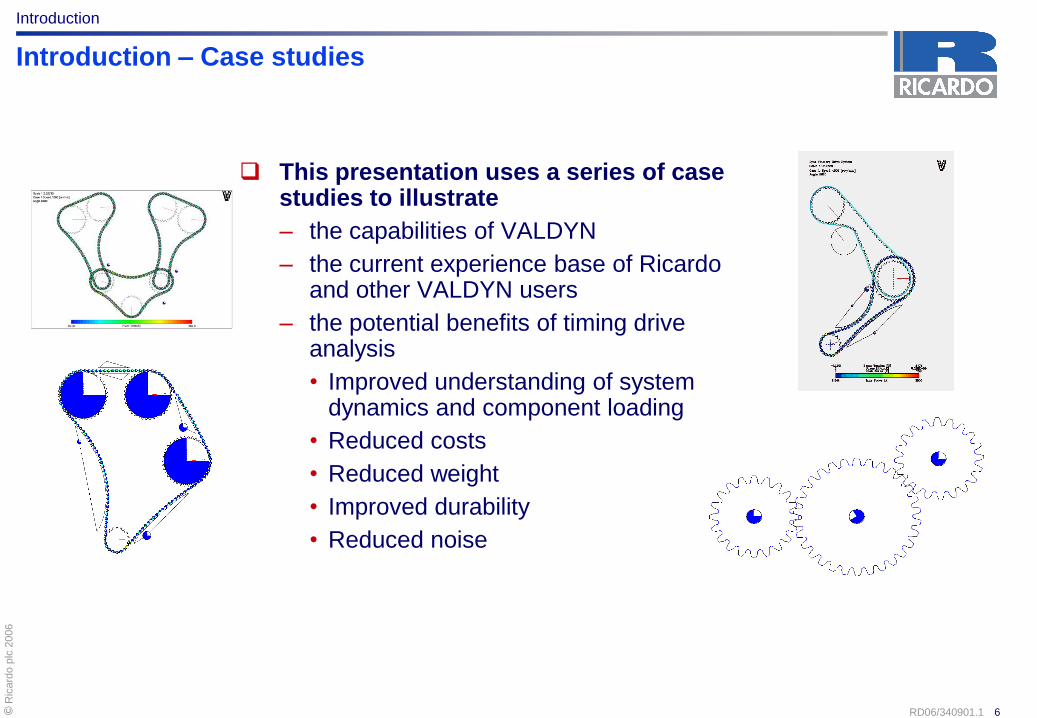
Introduction – Case studies
This presentation uses a series of case studies to illustrate
– the capabilities of VALDYN
– the current experience base of Ricardo and other VALDYN users
– the potential benefits of timing drive analysis
• Improved understanding of system dynamics and component loading
• Reduced costs
• Reduced weight
• Improved durability
• Reduced noise
Introduction

© R
icard
o p
lc 2
006
RD06/340901.1 7
Agenda
Introduction
Chain drive
Belt drive
Gear drive
Conclusions

© R
icard
o p
lc 2
006
RD06/340901.1 8
Chain drive – VALDYN capability (1)
VALDYN has the capability to model the following chain types and has a simple user interface
– Roller chain
– Bush chain
– Silent chain
– Other special chains with novel designs
Each chain link is modelled as a separate mass
– connected to adjacent links by stiffness
– connected to sprockets and guides by contact stiffness elements
The detailed geometry of the chain, sprockets and guides is modelled accurately
Effects of polygon action and lateral chain vibration are captured
Chain drive
Contact force between chain link and guide
Contact force between chain roller/bush and
sprocket
Sliding force (friction) between chain link and guide
Sliding force (friction) between roller/bush and
sprocket
Contact force between pin and bush
Sliding force (friction) between
pin and bush
Contact force between chain link and guide
Contact force between chain roller/bush and
sprocket
Sliding force (friction) between chain link and guide
Sliding force (friction) between roller/bush and
sprocket
Contact force between pin and bush
Sliding force (friction) between
pin and bush

© R
icard
o p
lc 2
006
RD06/340901.1 9
Chain drive – VALDYN capability (2)
There are special elements for modelling hydraulic tensioners and hydraulic vane phasers
VALDYN is also capable of modelling dynamics of valve trains and rotational dynamics of crankshafts
– so coupled dynamics of the whole system can be studied
Animator included
Co-simulation is possible
– With other Ricardo Software
– With other programs
Chain drive
Phaser
Valvetrain
Chain Drive
Crankshaft
Camshaft
© R
icard
o p
lc 2
006
RD06/340901.1 10
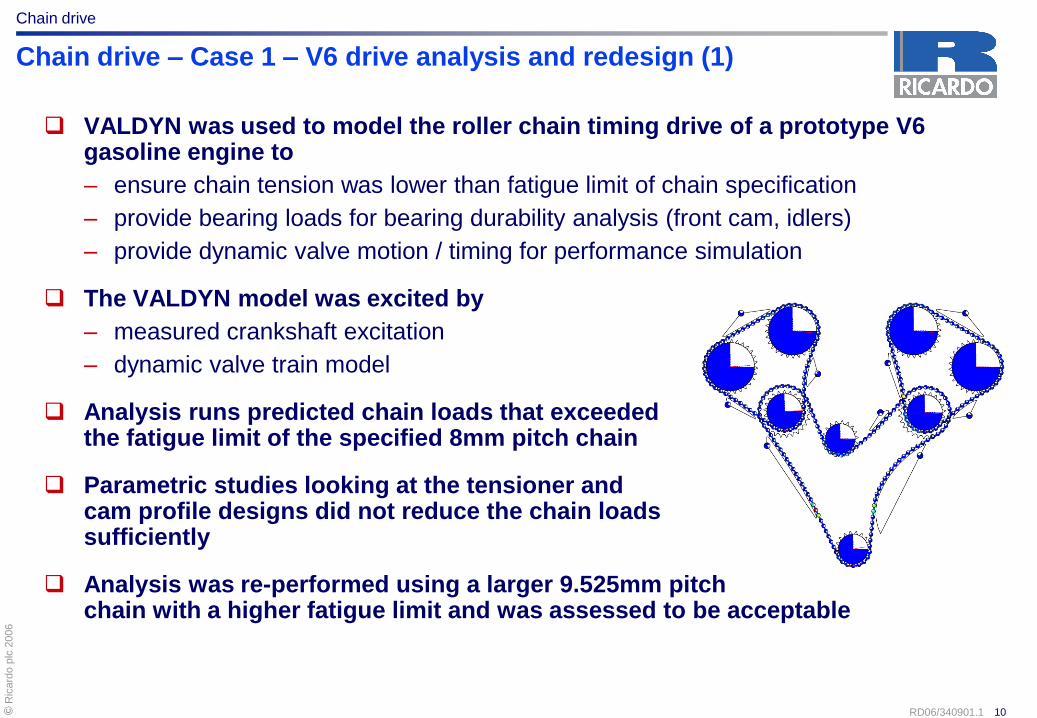
Chain drive – Case 1 – V6 drive analysis and redesign (1)
VALDYN was used to model the roller chain timing drive of a prototype V6 gasoline engine to
– ensure chain tension was lower than fatigue limit of chain specification
– provide bearing loads for bearing durability analysis (front cam, idlers)
– provide dynamic valve motion / timing for performance simulation
The VALDYN model was excited by
– measured crankshaft excitation
– dynamic valve train model
Analysis runs predicted chain loads that exceeded the fatigue limit of the specified 8mm pitch chain
Parametric studies looking at the tensioner and cam profile designs did not reduce the chain loads sufficiently
Analysis was re-performed using a larger 9.525mm pitch chain with a higher fatigue limit and was assessed to be acceptable
Chain drive
© R
icard
o p
lc 2
006
RD06/340901.1 11
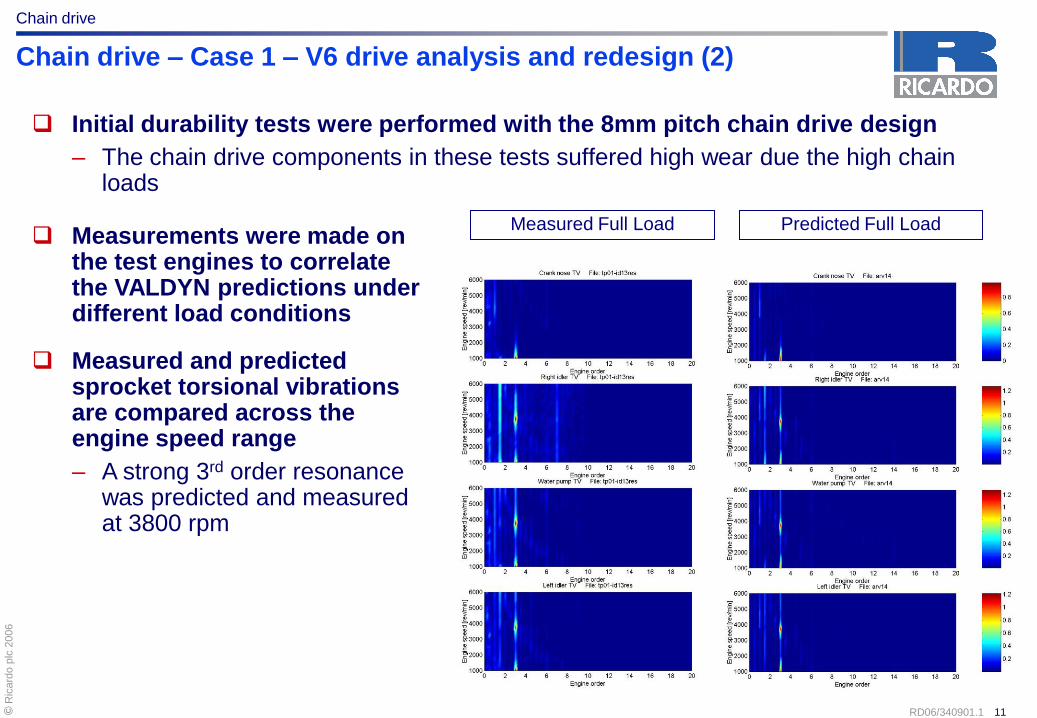
Chain drive – Case 1 – V6 drive analysis and redesign (2)
Initial durability tests were performed with the 8mm pitch chain drive design
– The chain drive components in these tests suffered high wear due the high chain loads
Measured Full Load Predicted Full Load
Chain drive
Measurements were made on the test engines to correlate the VALDYN predictions under different load conditions
Measured and predicted sprocket torsional vibrations are compared across the engine speed range
– A strong 3rd order resonance was predicted and measured at 3800 rpm

© R
icard
o p
lc 2
006
RD06/340901.1 12
Chain drive – Case 1 – V6 drive analysis and redesign (3)
Excellent correlation was achieved between predicted and measured data at all sprockets under different load conditions
– Full load
– 25% load
The significant redesign of the timing drive layout was successful in reducing the chain loads and the final design is now in production
Full load 25% load
Chain drive

© R
icard
o p
lc 2
006
RD06/340901.1 13
Chain drive – Case 1 – V6 drive friction analysis
Timing drive friction loss was measured on the same V6 engine under motored conditions with no valve trains present
The latest version of VALDYN was used to determine friction coefficients at various locations to give reasonable agreement with measured data
– friction coefficient at pin/bush contacts and link/guide contacts varied linearly with engine speed between 0.06 at 1000 rpm and 0.013 at 5500 rpm
– Correlation could be improved by using non-linear variation of friction coefficient
VALDYN results indicate that at low speed (2000 rpm)
– pin/bush friction accounts for 38% of total
– link/guide friction accounting for 55% of total
0
200
400
600
800
1000
1200
1400
1600
1800
1000 1500 2000 2500 3000 3500 4000 4500 5000 5500
engine speed (rpm)
po
we
r lo
ss
(W
)
predicted
measured
0
200
400
600
800
1000
1200
1400
1600
1800
1000 1500 2000 2500 3000 3500 4000 4500 5000 5500
engine speed (rpm)
po
we
r lo
ss
(W
)
link/guide
roller/sprocket
pin/bush
cam bearings
idler bearings
measured

© R
icard
o p
lc 2
006
RD06/340901.1 14
Chain drive – Case 2 - Improved design and maintained durability (1)
2.4L diesel engine upgrade with targets of
– reduced cost
– reduced weight
Baseline engine had duplex bush chain timing drive
– required to cope with high chain forces due to system resonance excited by fuel pump
A different fuel pump with fewer lobes was introduced for the upgrade
VALDYN was used at the concept stage
– Maximum allowable simplex chain load 3000 N
– Based on predicted reduction in peak chain loads a simplex bush chain was chosen for the upgrade
– Chain layout (guides and tensioner) was optimised in conjunction with supplier
Chain drive
2.4L baseline
2.4L upgrade
2.2L upgrade

© R
icard
o p
lc 2
006
RD06/340901.1 15
Chain drive – Case 2 - Improved design and maintained durability (2)
VALDYN was later used to assess sensitivity of chain loads to many parameters to prove system robustness
Measurements of chain load were taken during development phase
The layout chosen at the concept stage was not altered significantly and is now in production
– Minimised development costs
– Significant component cost saving
– Weight saving of 1.2 kg was achieved
Chain drive
Min
Mean
Max
Mean
Max
Min
Measured data
Predicted sensitivity to chain damping

© R
icard
o p
lc 2
006
RD06/340901.1 26
Chain drive – Case 4 – Modelling silent chains
VALDYN was used to optimise the chain timing drive of a V engine with
respect to chain noise
The timing drive included a reduction drive with a silent chain
– Detailed geometry of the chain links and sprocket teeth were modelled
Iterations with different tensioner properties, cam profiles and sprocket tooth profiles were analysed to optimise the design
– The noise was assessed by comparing the forces at the chain sprockets

© R
icard
o p
lc 2
006
RD06/340901.1 27
Chain drive – Case 5 – Modelling silent chains
Double sided silent chains have also been modelled successfully

© R
icard
o p
lc 2
006
RD06/340901.1 28
Chain drive – Case 6 – Detailed ratchet tensioner modelling (1)
VALDYN was used to model the details of a new ratchet tensioner mechanism using lamina elements
– Prototype tensioners experienced failures due to insufficient ratchet preload
– VALDYN was successfully used to optimise the ratchet spring preload for operation under both new and worn chain conditions
New chain Worn chain

© R
icard
o p
lc 2
006
RD06/340901.1 29
Chain drive – Case 6 – Detailed ratchet tensioner modelling (2)
The VALDYN tensioner contact force predictions correlated well with measured data
The graphs show measured and predicted tensioner piston loading during the cranking event, with no oil pressure at the tensioner
– Black (measured piston force)
• Peak contact force 1500-2000N
– Red line (measured crank speed)
– Blue data (predicted piston force) - shown overlaid with measured data and separately for clarity
• Peak contact force 1500-2000N

© R
icard
o p
lc 2
006
RD06/340901.1 30
Chain drive – Case 7 – Design validation for an engine up-rate
Ricardo were responsible for the design verification of a chain drive system as part of an engine up-rate program
FMEA (Failure Modes and Effects Analysis) was used to highlight all the potential failure mechanisms of the chain drive
– To verify the chain drive under the new loading conditions it was necessary to prove that a ‘worst case’ engine build would be durable for the life cycle
– It was impractical and prohibitively expensive to build test engines to all tolerance combinations
VALDYN analysis and DoE methodology were combined to provide a robust validation considering a wide range of noise factors in a practical time frame
– Correlated VALDYN models of the baseline engine existed from a previous study to provide confidence to the study
– The commercial package MODDE was used for the DoE analysis
Screening Experiment to
identify key design
parameters
Detailed Experiment to
assess the interaction of
important design parameters
Predictions and
optimisation
© R
icard
o p
lc 2
006
RD06/340901.1 31
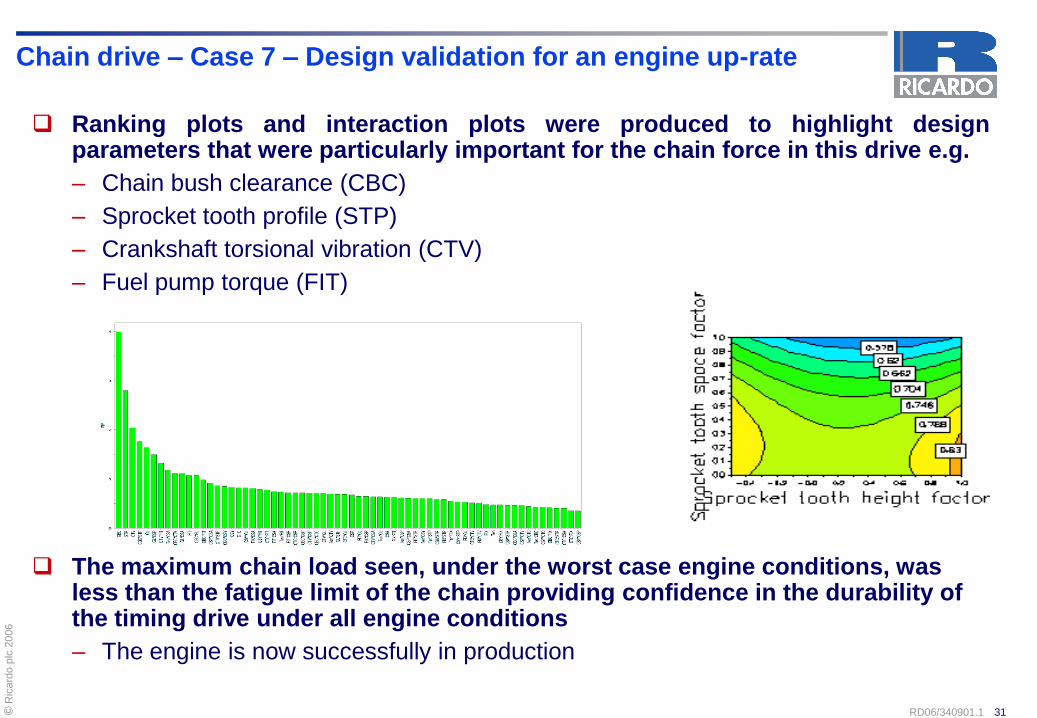
Chain drive – Case 7 – Design validation for an engine up-rate
Ranking plots and interaction plots were produced to highlight design parameters that were particularly important for the chain force in this drive e.g.
– Chain bush clearance (CBC)
– Sprocket tooth profile (STP)
– Crankshaft torsional vibration (CTV)
– Fuel pump torque (FIT)
The maximum chain load seen, under the worst case engine conditions, was less than the fatigue limit of the chain providing confidence in the durability of the timing drive under all engine conditions
– The engine is now successfully in production

© R
icard
o p
lc 2
006
RD06/340901.1 32
Agenda
Introduction
Chain drive
Belt drive
Gear drive
Conclusions

© R
icard
o p
lc 2
006
RD06/340901.1 33
Belt drive – VALDYN capability (1)
VALDYN has the capability to model timing belts and has a simple user interface
The latest belt element employs a geometrically non-linear representation
– Axial belt stiffness changes with preload
– Bending belt stiffness dependent on the axial tension and the bending angle so the bending stiffness will change around a sprocket
Belt modelled as a series of beam elements to represent belt axial and bending stiffness connected by nodes representing belt mass
Also attached to the nodes are stiffness elements to represent the facing and backing of the belt and belt teeth
– From these elements the normal forces between the belt and the pulleys are computed
– From the friction coefficients tangential forces are computed
Belt drive
Tensioner
Crankshaft
Camshafts
Tensioner
Crankshaft
Camshafts
Knb
Knf
KyKy Ky Ky
KtKt
Ksb
Ksf
Kx KxKxKx
Mass and inertia
lumped at bushes
Beam elements
representing the axial
and bending stiffnessKnb
Knf
KyKy Ky Ky
KtKt
Ksb
Ksf
Kx KxKxKx
Mass and inertia
lumped at bushes
Beam elements
representing the axial
and bending stiffness
Kx Beam axial stiffness
Ky Beam shear stiffness
Knb Backing normal stiffness
Ksb Backing shear stiffness
Knf Land normal stiffness
Ksf Land shear stiffness
Kt Tooth normal stiffness

© R
icard
o p
lc 2
006
RD06/340901.1 34
Belt drive – VALDYN capability (2)
Typical outputs include
– Belt forces plotted against location number
– Belt forces plotted against engine speed
– Pulley rotational displacements
– Tensioner motion
– Belt flap amplitudes
Animator to visualise meshing and flapping
Belt drive
Cra
nkshaft
Cra
nk t
o
tensio
ner
Tensio
ner
Tensio
ner
to e
x
cam
Ex c
am
pulle
y
Cam
to
cam
Inta
ke c
am
pulle
y
Cam
to
idle
r
Idle
r
Idle
r to
w.
pum
p
Wate
r pum
p
Wate
r pum
p t
o
cra
nk
cra
nkshaft
Cra
nkshaft
Cra
nk t
o
tensio
ner
Tensio
ner
Tensio
ner
to e
x
cam
Ex c
am
pulle
y
Cam
to
cam
Inta
ke c
am
pulle
y
Cam
to
idle
r
Idle
r
Idle
r to
w.
pum
p
Wate
r pum
p
Wate
r pum
p t
o
cra
nk
cra
nkshaft
Cra
nkshaft
Cra
nk t
o
tensio
ner
Tensio
ner
Tensio
ner
to e
x
cam
Ex c
am
pulle
y
Cam
to
cam
Inta
ke c
am
pulle
y
Cam
to
idle
r
Idle
r
Idle
r to
w.
pum
p
Wate
r pum
p
Wate
r pum
p t
o
cra
nk
cra
nkshaft

© R
icard
o p
lc 2
006
RD06/340901.1 35
In-line 4 cylinder
engine with cam
phaser on intake
cam
RMS amplitude of
2nd order TVs for
– intake camshaft
pulley
– exhaust camshaft
pulley
– Crankshaft
Good agreement
between
measurements and
predictions
Phaser not functioning below
2000rpm
Ac yc l is m e s
8 0 0 1 8 0 0 2 8 00 3 8 0 0 4 8 0 0 5 8 0 0
R é g i m e m o te u r [T r/m n ]
0
0 .2
0 .4
0 .6
0 .8
1 .0
Ac
yc
lis
me
s [
°rm
s]
A d m . E c h . V i l o .
p ro je c t:
R e n a u ltE 5 4 0 8
v e h ic le / te s t b e n c h :D é c a le u r: Aà C a d m .C o n tre c â m e s :Aà C e c h .
s y s te m :T e n d e u r:G a te s n o m in a l p o s . n o m in a leC o u rro ie : G D 5 0C h a rg e m o te u r: P C
m e a s u re m e n t:T h u i le :1 1 5 °C -1 2 0 °CT e a u :9 0 °C -1 0 0 °C# 1 1Va l la d o l id
2 7 .0 5 .0 3M. Ma s lo u h y
V 5.20 D :\r otec \us er \M M \R enaul t\K 4P LU S 22\O F F D A T A \R O T M E A S .29
Belt drive – Correlation data (1)
Belt drive
© R
icard
o p
lc 2
006
RD06/340901.1 36
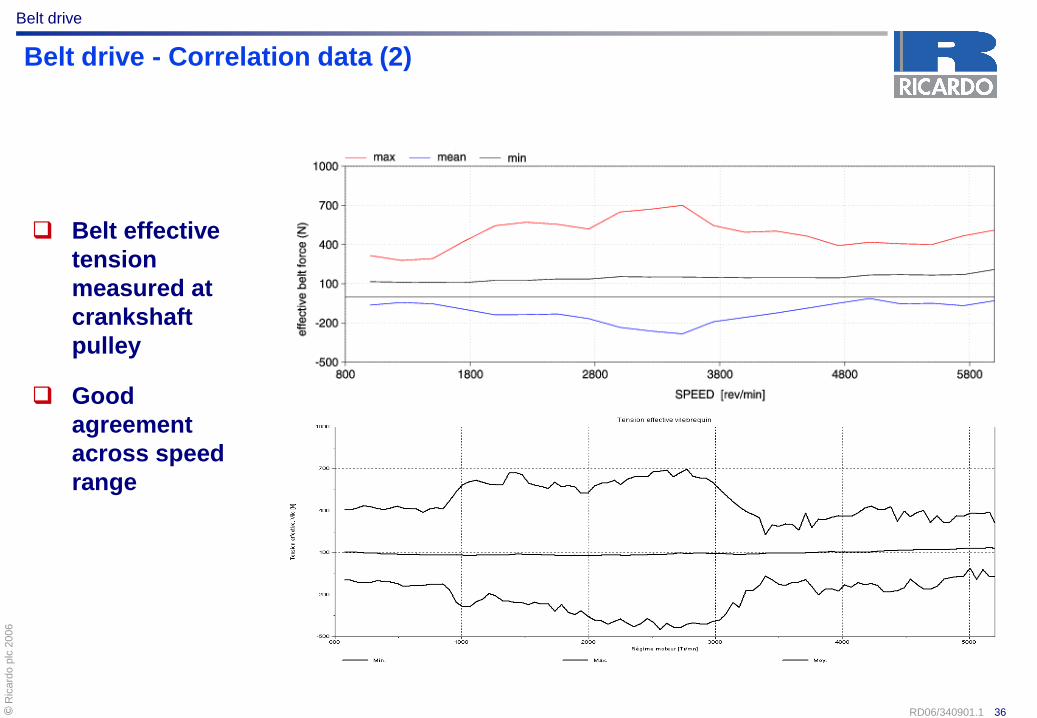
Belt effective
tension
measured at
crankshaft
pulley
Good
agreement
across speed
range
Belt drive - Correlation data (2)
Belt drive

© R
icard
o p
lc 2
006
RD06/340901.1 37
Belt drive – Case 1 – Effect of cam phasers on belt force
Modern gasoline engines increasingly use vane type cam phasers to adjust cam timing and so give improved balance between fuel economy, emissions and performance
– Maximum benefit is obtained by using phaser on both intake and exhaust systems
However introduction of these phasers can result in significantly increased belt forces due to
– increased inertia of camshafts resulting in lower timing drive natural frequency
– unfavourable cam phasing resulting in increased excitation into timing drive
The effect is shown in the graphs of belt load for an in-line 4 cylinder gasoline engine
– Worst case belt occurs with part load phasing in 2000-3000 rpm speed range so could have significant effect on belt life
– Minimum belt force is close to zero
Belt drive

© R
icard
o p
lc 2
006
RD06/340901.1 38
Belt drive – Case 1 – Countermeasures
The problem can be addressed by
– increasing belt preload
– using high strength belt
– using camshaft TV damper
– using additional cams on one camshaft to generate torque to oppose camshaft excitation torque
– using non-circular “oval” crankshaft pulley
VALDYN can be used to investigate the potential of all of the above including the non-circular crankshaft pulley (which is now in production on Audi 2.0L FSI)
Belt drive
2.441
2.283
30°
Nominal Diameter - 1.0 mm
Nominal Diameter + 1.0 mm

© R
icard
o p
lc 2
006
RD06/340901.1 39
Belt drive – Case 1 – Oval pulley results
Graphs show the effect of an oval pulley on belt force
– Peak force at resonance reduced by ~25%
– Peak forces increased at high speed
– Minimum force positive at all times
– INA claim this could lead to ~40% improvement in belt life
Sprocket displacement at resonance is also significantly removed leading to improved control of valve timing
Belt drive
© R
icard
o p
lc 2
006
RD06/340901.1 40
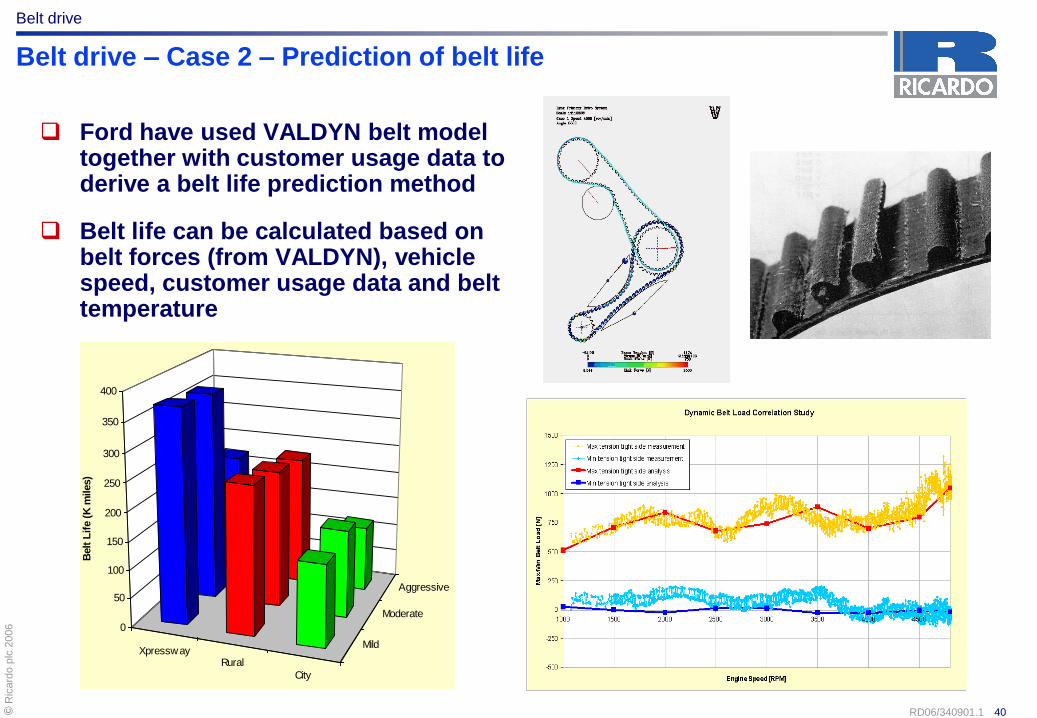
Belt drive – Case 2 – Prediction of belt life
Ford have used VALDYN belt model together with customer usage data to derive a belt life prediction method
Belt life can be calculated based on belt forces (from VALDYN), vehicle speed, customer usage data and belt temperature
Belt drive
Mild
Moderate
Aggressive
City
RuralXpressway
0
50
100
150
200
250
300
350
400
Belt
Lif
e (
K m
iles)
Belt Life for Test Condition 1

© R
icard
o p
lc 2
006
RD06/340901.1 54
Agenda
Introduction
Chain drive
Belt drive
Gear drive
Conclusions

© R
icard
o p
lc 2
006
RD06/340901.1 55
Conclusions – Benefits of analysis
Timing drive analysis using VALDYN leads to improved designs with
– Reduced weight
– Reduced cost
– Improved durability
– Lower noise
Previous experience is required to maximise the benefits of analysis at concept stage
– Typical component stiffness values
– Typical damping levels
– Expected behaviour of similar systems
Understanding of chain drive system dynamics is now reasonably mature
– Analysis of belts and geared systems not far behind
Conclusions
Timing chain drive
cassette on BMW 1.8L I4
Parameter Value
Contact Stiffness (N/mm) 20000
Sprocket Contact Damping (N*s/m) 130
Sprocket Contact Friction Coefficient 0.1
Contact Friction Damping (N*s/m) 50000
Guide Contact Damping (N*s/m) 110
Guide Contact Friction Coefficient 0.05
Tensioner Pivot Inertia (kg*mm^2) 200
Chain Pitch (mm) 6.36
Pivot Radial Stiffness (N/mm) 65000
Pivot Radial Damping (N*s/m) 50.9
Pivot Radial Non-Linear Stiffness (N/mm) 0
Pivot Rotary Damping (N*m*s/rad) 0.0001
Pivot Friction Coefficient 0
Pivot Friction Damping (N*s/m) 0
Pivot Pin Radius (mm) 1
Pivot Radial Clearance (mm) 0.01
Maximum Lamina Interference (mm) 1.5
Number of Links 134
X Ordinate of Right-Hand Pivot 3.17
Y Ordinate of Right-Hand Pivot 0
Mass of Even Link (kg) 3.219
Mass of Odd Link (kg) 3.26
Inertia of Even Link (kg*mm^2) 0.54
Inertia of Odd Link (kg*mm^2) 0.55
Camshaft Sprocket Radius (mm) 34.41
Crankshaft Sprocket Radius (mm) 17.279
Reasonable Value
Reasonable Value
Reasonable Value
Reasonable Value
From Layout Drawing
Reasonable Value
Reasonable Value
Linear Model Used
Notes
Reasonable Value
Reasonable Value
Reasonable Value
Reasonable Value
Reasonable Value
Reasonable Value
Reasonable Value
Reasonable Value
Reasonable Value
From Layout Drawing
Calculated from pitch
Sprocket_16.mcd
Sprocket_16.mcd
Assumed from Previous Report
Calculated from pitch
Assumed from Previous Report
Assumed from Previous Report
Assumed from Previous Report

© R
icard
o p
lc 2
006
RD06/340901.1 56
Conclusions – Expected future developments in design (1)
Lighter chains to reduce weight, friction and noise
Increased use of silent chains for low noise
Increased use of flexible guides
Resurgence in use of belt drives
– Significant improvements in belt durability mean that some engines now have belts fitted for life
– Belts have potential for lowest friction and noise
Use of camshaft dampers, contra-cams and oval sprockets/pulleys to reduce chain/belt forces
– Particularly in systems with cam phasers
Timing belt with
oval crank pulley
on AUDI 2.0L I4
FSI
Silent chain with low
cost tensioner on Honda
1.3L I4 Simplex
roller chain and
cam/cam gears on
BMW 5.0L V10

© R
icard
o p
lc 2
006
RD06/340901.1 57
Conclusions – Expected future developments in design (2)
Use of more complex drive layouts (possibly involving gears and chains) to improve package/durability in particular applications
– Audi V engines
– Volvo I6
– VW TDI engines Combined gear/chain
timing drive at rear of
new Volvo I6
Layout for rear timing drive of new Audi V6 TDI
Timing gear drive
on VW 2.5L I5
TDI

© R
icard
o p
lc 2
006
RD06/340901.1 58
Thank you for your attention
Any Questions?
ありがとうございました
どうぞご質問を