Uncovering metabolic pathway relevant to phenotypic traits of microbial genomes

J. evol. Biol. 6: I 16 (1993) 1010 061X,:93,‘01001 16 $ 1.50+0.20/O *-,, 1993 Birkhauser Verlag, Base1
Phenotypic plasticity for life history traits in Drosophila melanogaster. I. Effect on phenotypic and environmental correlations
M. D. Gebhardt’ and S. C. Stearns
Zoologisches tnstitut, Rheinsprung 9, CH-4051 Basel, Switzerlund
Key uordsr Phenotypic plasticity; reaction norm; fluctuating environment; environmental covariance; growth model.
Abstract
All 36 possible crosses among 6 homozygous lines of Drosophila melunoguster were tested for their phenotypic response in developmental time and dry weight at eclosion to variation in temperature and yeast concentration. This method was chosen because it allows one to produce the same heterozygous offspring repeatedly for testing under more conditions than could be handled at once. We estimated the effects of yeast concentration and temperature and their interaction on both the phenotypic and the environmental components of variation and covariation of the two traits. Development was slower at low temperatures and yeast concentrations, and dry weight and viability were lower at higher temperatures and lower yeast levels. Interactions of the two factors with the crosses and with each other indicated that there were genetic differences in plasticity and that the sensitivity of a trait to one factor depended on the level of the other. The covariation of the two traits was generally weak within an environment. Across environments, its sign depended on the factor that changed between the environments: positive for temperature, nega- tive for yeast concentration. These findings can be explained in terms of an established growth model for Drosophilu larvae. We conclude that for plastic traits with moderate or low heritability, the relationship between the phenotypic and genetic covariance matrices may be a complex function of the environmental factors that affect the traits. Some implications for the prediction of the evolution in fluctuating environments are outlined.
- ’ Current Address: SWISS Federal Office of Public Health, Epidemiology and Infectious Diseases,
CH 3097, BerniLiebefeld, Switzerland
2
Introduction
Gebhardt and Stearns
The importance of phenotypic plasticity and the fact that the phenotypic re- sponse to environmental variables depends on the genotype was recognized early (Woltereck, 1909; Wright, 1931; Schmalhausen, 1949; Dobzhansky, 19.51; Wad- dington, 1957; Bradshaw, 1965). After a period of relative neglect, these topics are again central issues (Gupta and Lewontin, 1982; Via and Lande, 1985; Schlichting, 1986; Sultan, 1987; Newman, 1988). One aspect of phenotypic plasticity important for evolution is that it can lead to different heritabilities in different environments (Gupta and Lewontin, 1982; de Jong, 1990). This may happen, for example, when the phenotypic variances become larger in a variable environment because they include the increased environmental variation of the traits, but other mechanisms are also possible. We need to know the mechanisms that cause the heritabilities to change if we want to predict rates of evolution with quantitative genetic principles (Bell and Koufopanou, 1986).
In the multivariate case, the analogues of the genetic and phenotypic variances are the corresponding variance-covariance matrices, G and P. The product GP-’ is the analogue of heritability and determines the evolutionary dynamics of the traits (Lande, 1979). Therefore a long-term prediction of evolution would depend on the stability of both these matrices. If we cannot assume stability because they depend on environmental factors that are changing in the habitat, then we need to know how they are influenced by the environmental factors.
In this study, we used genetically homogenous lines of Drosophila melanogaster to analyze the phenotypic responses of developmental time and weight at eclosion to changes in temperature and yeast concentration. We estimated directly both the phenotypic and environmental variances and covariances and specifically ask how the correlations between the two characters are affected by the environmental factors. Our findings suggest that different environmental factors can induce different patterns of covariation of traits. In our case, these patterns can be interpreted in terms of an established physiological growth model for D. malanogaster larvae (Bakker 1959, 1961; Robertson 1963, 1964). Because it predicts the phenotypic covariation of developmental time and weight at eclosion, this model could be incorporated in the quantitative genetic equations that describe the evolutionary dynamics of the two traits in fluctuating environments.
Materials and methods
Flies
Twenty-one isofemale lines were established from inseminated D. melanogaster females caught at several sites in and around Basel, Switzerland, in late summer 1986. They were maintained in vials (2.8 cm diam., 7 cm height) containing 15 ml of a cornmeal medium (Gebhardt and Stearns, 1988) at a population size of 100&200 by serial transfer (Buzzati-Traverso, 1955) with a period of 7 days and 3 serial vials

Phenotypic plasticity in Drosrq~hikr 3
to minimize selection on developmental time. About one year after the isofemale lines had been established, homozygous stocks were derived by stepwise extraction of the first, second and third chromosomes using a protocol similar to that of Craymer ( 1984). From each isofemale line, IO replicate extraction lines were started. Presumably due to the expression of lethals, many lines were lost, especially in the step that made the third chromosome homozygous. Of the 210 lines, 43 were left, which represented 18 of the 21 isofemale lines. Thus, most losses occurred among replicate lines from a given isofemale origin. A detailed description of the extraction procedure is presented elsewhere (Gebhardt, 1989).
Experimental design
Six homozygous stocks were chosen from different isofemale lines but otherwise randomly. The use of homozygous stocks allowed us to produce the same het- erozygotes repeatedly for testing in more environments than could be handled at one time. They were used to set up the complete diallel crossing scheme under different environmental conditions defined by different temperatures and concentra- tions of dead dry yeast. The diallel crossing scheme consisted of all 36 possible crosses among the stocks and was replicated within each environment in three randomized blocks. One block consisted of one vial for each of the 30 heterozygous crosses and two vials for each of the 6 homozygous within-stock crosses, which are identical to the homozygous parental stocks. The latter were included for the purpose of a genetic analysis (Gebhardt, 1989). The 42 vials were randomly positioned in a device that sampled emerging flies at regular intervals to determine their developmental time (described in detail in Stearns et al., 1987). Three such devices (each representing one block) were placed on separate shelves within the same climate chamber that controlled temperature to an accuracy of f 0.1 C and humidity to 80&10%. Flies emerging within a specified time interval were anaes- thetized by flushing with carbon dioxide for 30 seconds and dropped into collecting vials that were then automatically shifted.
The treatments were defined by the regime of temperature and yeast concentra- tion and were carried out one at a time. Unknown factors could have changed between the different dates and the reaction norms presented below are therefore not strictly due only to temperature and yeast concentration. However, it seems unlikely that such confounding factors could have dominated, and our choice of factors was mainly for experimental convenience. Any other factors of ecological importance would have served our purpose.
Laborutory procedures
A given treatment was carried out in three main steps: raising the parental flies under standardized conditions, setting up the crosses to obtain eggs, and incubating the hatching larvae under the experimental conditions. To avoid confounding environmental and genetic similarities, the series of steps was performed for each

4 Gebhardt and Stearns
block separately. In a few instances, this principle was violated because of insuffi- cient numbers of eggs or larvae at a particular step in a block.
First, 20 females (3-6 days old, mated in groups with 10 males) laid eggs for l-2 days (depending on stock differences in egg laying rate) for each planned experi- mental vial (3 blocks x 6 stocks x 7 crosses = 126 groups of females). The flies hatching from these eggs served as the parents in the experiment. They were collected over 2 days and fed with live yeast until used in the crosses 4-5 days later ( l2-- I5 virgin females kept separately for each planned experimental vial and 60-70 males kept in 223 vials).
Second, diallel crosses were made by combining groups of 12-15 females and 8 males in fresh vials. Two days later, egg laying substrate was exposed to the mated flies from 8 am to noon at the experimental temperature. The substrate consisted of 9 ml of the experimental medium, poured into petri dishes (5.3 cm diam.), supple- mented with charcoal powder and three drops of live yeast. After 4 hours, the flies were removed and the live yeast was scraped away. Ten to twenty hours later (depending on the temperature), the petridishes were screened for early developing larvae (originating from “held” eggs; Bakker, 19.59) which were removed. Larvae from held eggs start development before egg laying and would have distorted the statistics on developmental time.
Third, the day after egg laying 12 larvae were collected from each petridish and transferred to vials ( 16 mm diam.) containing 2 ml of the experimental medium. In an effort to avoid hatching periodicity due to the diurnal light cycle (Bakker and Nelissen, 1963) the vials were kept in the dark. This method did not suffice, however, as some periodicity was still observed. When most of the larvae had pupated (6thh7th day after hatching), the vials were placed in the sampling devices. Emerging flies were sampled every 6 hours until all had emerged. Every 48 hours, the array of vials containing the sampled flies was replaced and shock-frozen; then the flies were dried for 3 hours at 70” C and immediately weighed on a Mettler microbalance to the nearest 0.01 mg.
The experimental food medium was prepared after a modified recipe developed by Backhaus et al. (1984) and contained no live yeast (0.2554 g dead dry Brewer’s yeast according to experiment, 0.5 g Difco yeast extract, 1 g Agar, 3 g Sucrose, 6 g Glucose, 0.05 g MgSO, x 6H,O, 0.05 g CaCl, x 2H,O, 1 ml 10% alcoholic Nipagin solution, 0.6 ml propionic acid, distilled water ad 100 ml).
The experiment was repeated with three yeast concentrations: 40, 10 and 5 g dried yeast per kg medium at three temperatures: 28, 25 and 22O C. A yeast concentration of 2.5 g/kg caused excessive mortality and resulted in a strongly unbalanced design when applied at 25” C and was for this reason not applied at the other temperatures.
Stutistial unalysis
Most statistical analyses were done using routines compiled in the SAS package (Version 5, 1985). Apart from the descriptive statistics, the lowest yeast level at
Phenotypic plasticity in Drosophila 5
25” C was not included in any analysis to make the comparison of the effect of yeast levels among temperatures possible. An analysis of covariance (GLM-procedure) was used to evaluate the effects of the environmental covariates temperature (TEMP) and yeast concentration (YEAST) and their interactions with the crosses (treated as fixed effects) and between themselves. Temperature and yeast concentra- tion were specified as linear and quadratic regressors (TEMP, YEAST, TEMP*TEMP, TEMP*YEAST and YEAST*YEAST). Means of replicate vials were used as data points, both with original data and after the individual data had been transformed to remove scaling between within-replicate means and variances (In(x) for developmental time, ln(6-x) for dry weight and arcsin( sqrt(x)) for viability). The maximal number of degrees of freedom was therefore (3 blocks x 42 vials x 9 environments) - 1 = 1133, which was not realized because both sexes did not hatch in all vials. Type III sums of squares were therefore used to construct tests. Since these do not sum up to the total sum of square of the model, the R’ values given in the results are different from what would be expected based on the presented ANOVA tables.
The relationship between the two traits was analyzed both within and across environments. Within environments, phenotypic and environmental correlations were calculated using individual data points. Environmental correlations are the partial correlations based on the error matrix of sums of squares and cross products in the multivariate ANOVA that contains all genetic, maternal and reciprocal-cross effects (PRINTE option in the SAS GLM-procedure). Across environments, we describe the relationship between developmental time and dry weight by the slope of the compound reaction norm which is obtained when dry weight is plotted against developmental time. Because there are no dependent and independent variables in this case, and both variables are prone to random variation and measurement error, a model II regression was used to calculate the slopes. To do this we used the standard major axes through the data points (Sokal and Rohlf, 1981, p. 550). The slope of the standard major axis is simply the ratio of the standard deviations of the two variables. A slope was calculated for the three reaction norms of the two traits across temperatures (one for each yeast level), and in an analogous way three slopes were calculated for the yeast gradient. The corresponding Pearson correlations were also calculated. Meaningful statistical tests are not available, however, since there were only three independent points (treat- ment means) on each reaction norm, leaving I degree of freedom for a test (a significant correlation would have to be larger than 0.997 in magnitude).
Results
u) Phenotypic response in general
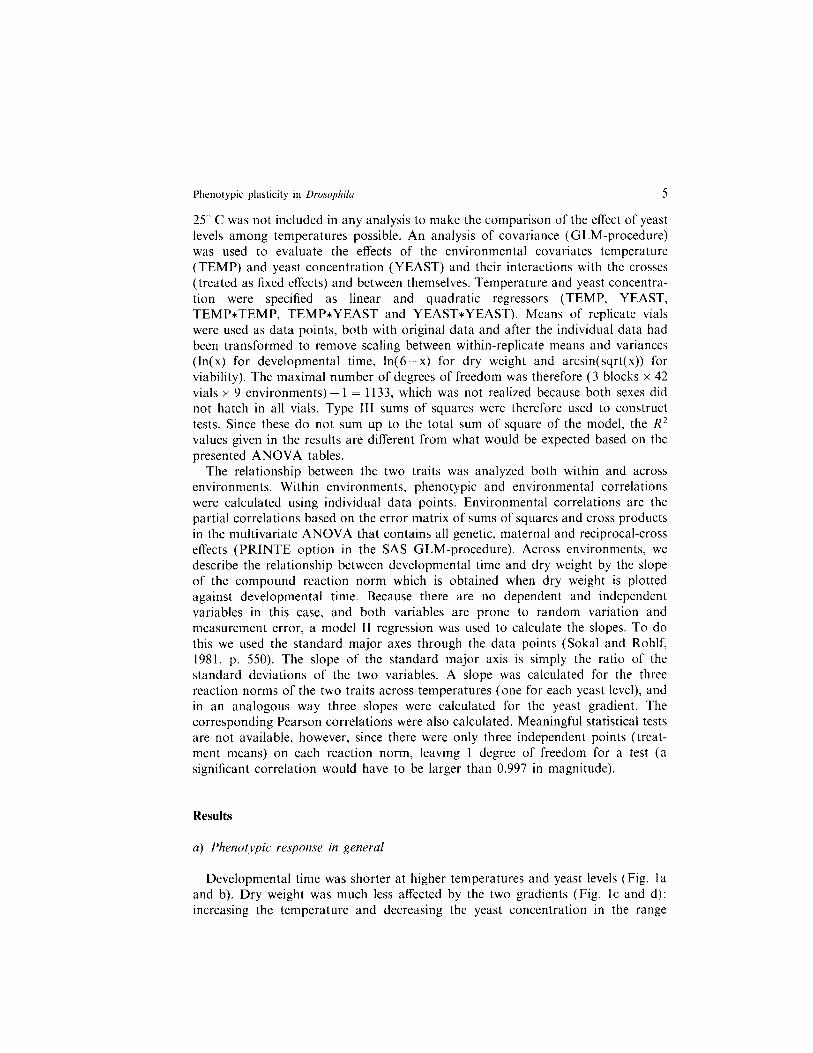
Developmental time was shorter at higher temperatures and yeast levels (Fig. la and b). Dry weight was much less affected by the two gradients (Fig. lc and d): increasing the temperature and decreasing the yeast concentration in the range
Gebhardt and Stearns
Fig I. Reaction norms of developmental time (a and b) and dry weight (c and d) due to variation in temperature and yeast concentration. The responses to temperature (a and c) are shown at three different yeast concentrations. The responses to yeast concentration (b and d) are shown at the three different temperatures. Only female data are shown for developmental time because the male data would be simrlar on this scale. Vertical bars indicate three standard errors of the means. Each point on the graphs is the mean of all observed flies (rangmg from 412 to 636 individuals). Note the logarithmic scale on the yeast axis.
between 40 g/kg and 5 g/kg caused only a slight decrease in dry weight (and not consistently for temperature at different yeast levels, Fig. lc); reducing the yeast concentration below 5 g/kg caused a considerable reduction in dry weight and a marked increase in mortality.
Both environmental factors had a strong effect on viability (Table 1, Table 2C). In general, more flies hatched at lower temperatures and at higher yeast concentra- tions. There was an interaction in that deleterious environmental conditions com- bined more than additively. For example, contrasts in separate analyses of variance at each temperature showed that the difference in survival between the two extreme yeast concentrations was higher at 28 C (0.53 vs. 0.69, F,,,80 = 21.1, P < 0.0001) than at 22 C (0.76 vs. 0.84, F ,,,, y = 46.6, P < 0.0001). It is not known which factors caused the bulk of mortality and whether they were different between environments. Cannibalism (Bakker, 1969) was not observed and seems to be unlikely because of the low larval densities, although it cannot be ruled out. In environments with high mortality, the surviving larvae could have fed upon the corpses. If some of the
Phenotypic plasticity in Dro.sophilr 7
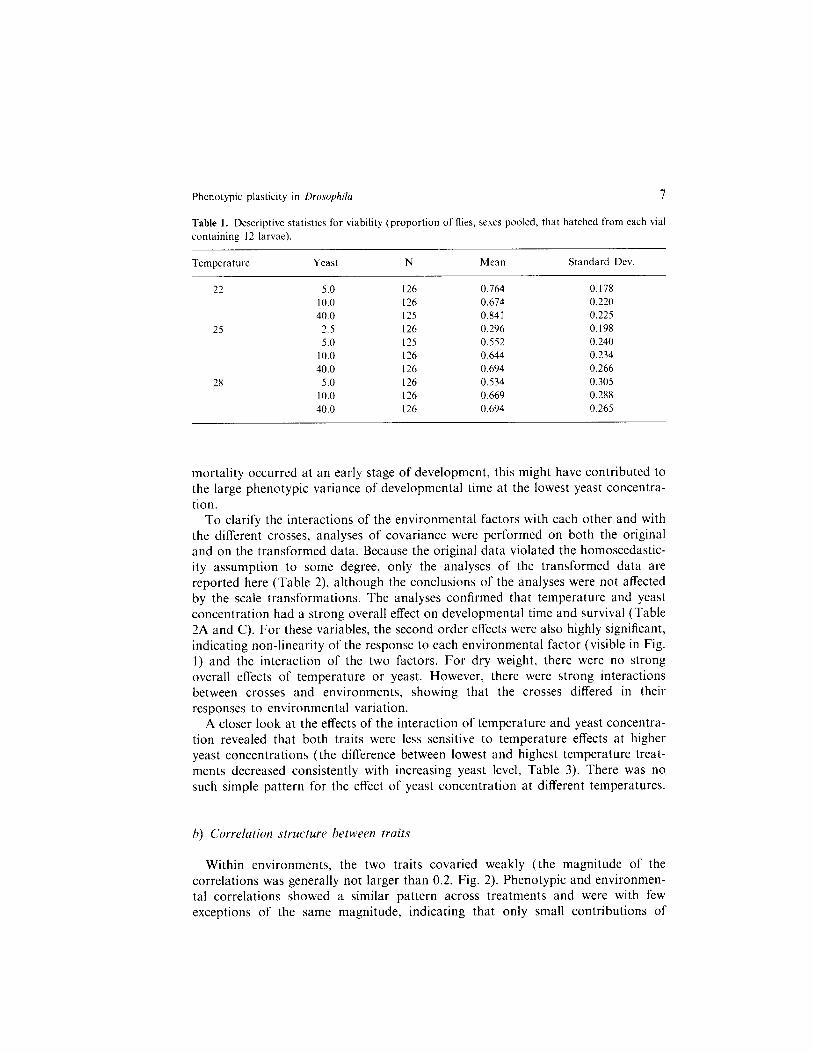
Table 1. Descriptive statistics for viability (proportion of flies, sexes pooled, that hatched from each vial containing 12 larvae).
Temperature Yeast N Mean Standard Dev
22 5.0 126 0.764 0.178 10.0 126 0.674 0.220 40.0 125 0.841 0.225
25 2.5 126 0.296 0.198 5.0 125 0.552 0.240
10.0 126 0.644 0.234 40.0 126 0.694 0.266
28 5.0 126 0.534 0.305 10.0 126 0.669 0.288 40.0 126 0.694 0.265
mortality occurred at an early stage of development, this might have contributed to the large phenotypic variance of developmental time at the lowest yeast concentra- tion.
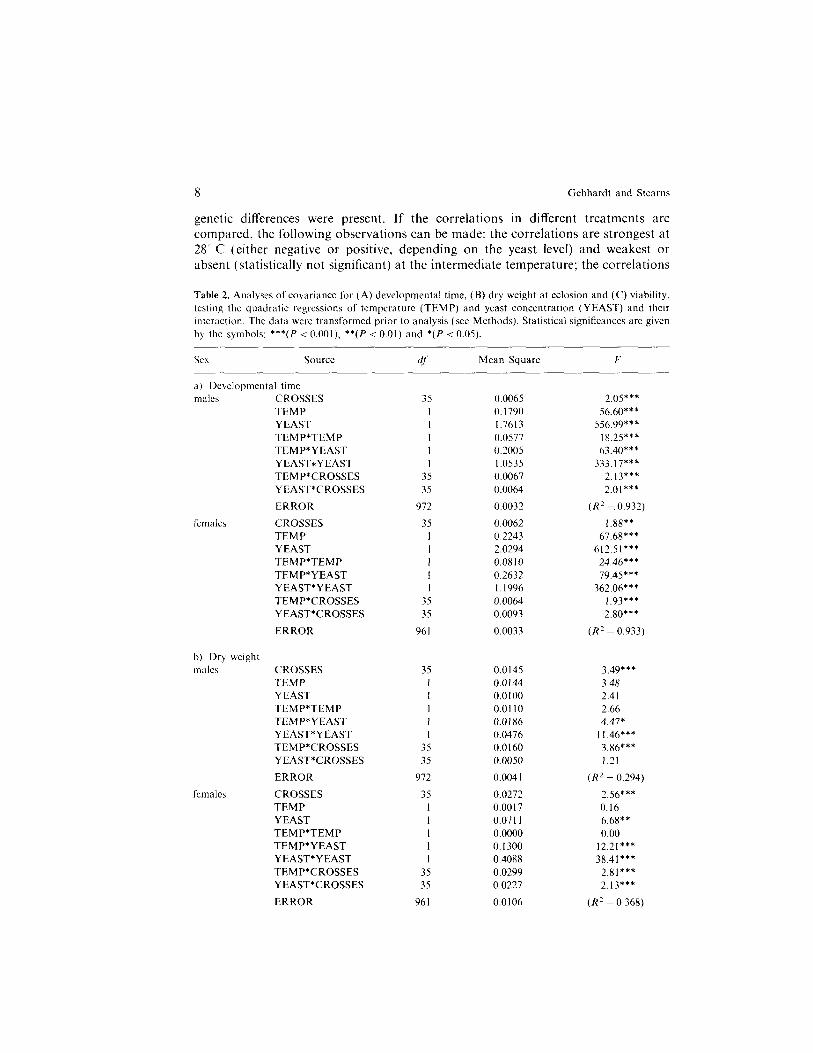
To clarify the interactions of the environmental factors with each other and with the different crosses, analyses of covariance were performed on both the original and on the transformed data. Because the original data violated the homoscedastic- ity assumption to some degree, only the analyses of the transformed data are reported here (Table 2) although the conclusions of the analyses were not affected by the scale transformations. The analyses confirmed that temperature and yeast concentration had a strong overall effect on developmental time and survival (Table 2A and C). For these variables, the second order effects were also highly significant, indicating non-linearity of the response to each environmental factor (visible in Fig. 1) and the interaction of the two factors. For dry weight, there were no strong overall effects of temperature or yeast. However, there were strong interactions between crosses and environments, showing that the crosses differed in their responses to environmental variation.
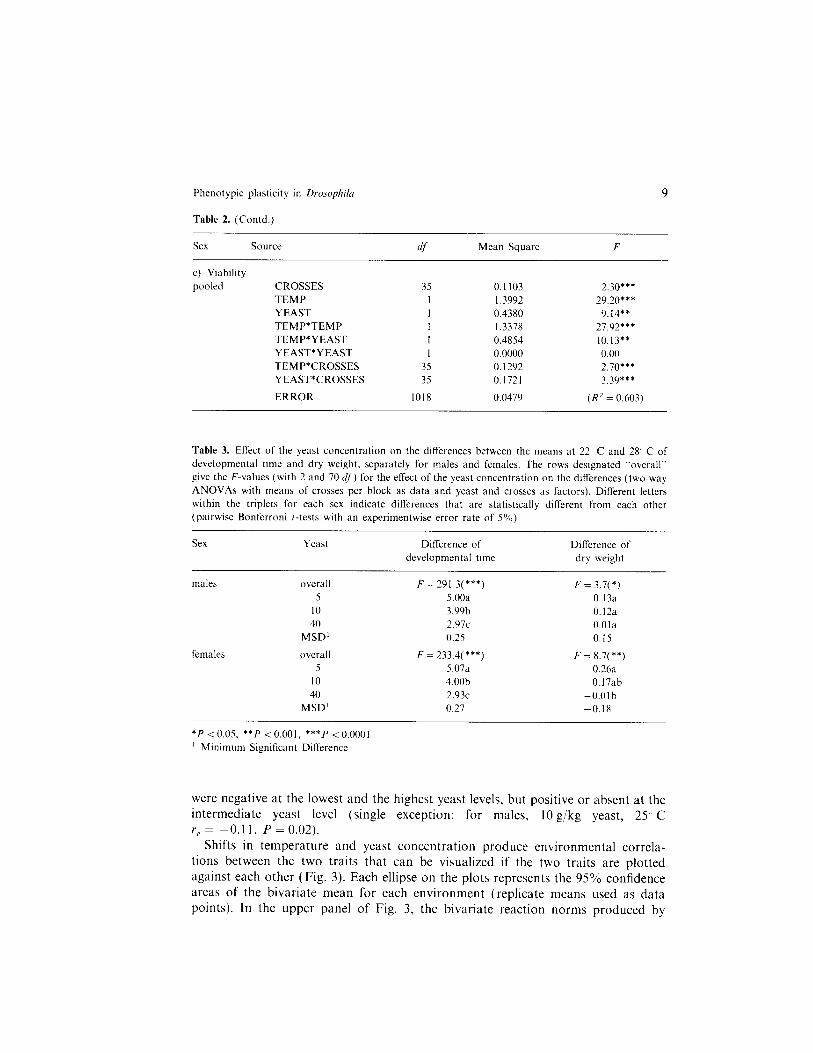
A closer look at the effects of the interaction of temperature and yeast concentra- tion revealed that both traits were less sensitive to temperature effects at higher yeast concentrations (the difference between lowest and highest temperature treat- ments decreased consistently with increasing yeast level, Table 3). There was no such simple pattern for the effect of yeast concentration at different temperatures.
h) Correlation structure between traits
Within environments, the two traits covaried weakly (the magnitude of the correlations was generally not larger than 0.2, Fig. 2). Phenotypic and environmen- tal correlations showed a similar pattern across treatments and were with few exceptions of the same magnitude, indicating that only small contributions of
8 Gebhardt and Stearns
genetic differences were present. If the correlations in different treatments are compared, the following observations can be made: the correlations are strongest at 28 C (either negative or positive, depending on the yeast level) and weakest or absent (statistically not significant) at the intermediate temperature; the correlations
Table 2. Analyses of covariance for (A) developmental time, (B) dry weight at eclosion and (C) viability, testing the quadratic regressions of temperature (TEMP) and yeast concentration (YEAST) and their mtcraction. The data were transformed prior to analysis (SW Methods). Statistical significances are given by the symbols: ***(I’ < O.OOl), **(P < 0.01) and *(P < 0.05).
Sex Source di Mean Square F
female,
a) Developmental time IIXikS CROSSES
TEMP YEAST TEMP*TEMP TEMP*YEAST YEAST*YEAST TEMP*CROSSES YEAST*CROSSES
ERROR
CROSSES TEMP YEAST TEMP*TEMP TEMP*YEAST YEAST*YEAST TEMP*CROSSES YEAST*CROSSES
ERROR
b) Dry weight males CROSSES
TEMP YEAST TEMP*TEMP TEMP*YEAST Y EAST*YEAST TEMP*CROSSES YEAST*CROSSES
ERROR
females CROSSES TEMP YEAST TEMP*TEMP TEMP*YEAST Y EAST*YEAST TEMP*CROSSES YEAST*CROSSES
ERROR
35
35 35
972
35
35 35
961
35
35 35
912
35
35 35
961
0.0065 0.1790 1.7613 0.0577 0.2005 I .0535 0.0067 0.0064
0.0032
0.0062 0.2243 2.0294 0.0810 0.2632 1.1996 0.0064 0.0093
0.0033
0.0145 0.0144 0.0100 0.01 IO 0.0186 0.0476 0.0160 0.0050 0.0041
0.0272 0.0017 0.0711 0.0000 0.1300 0.4088 0.0299 0.0227
0.0106
2.05*** 56.60***
556.99*** 18.25*** 63.40***
333.17*** 2.13*** 2.01***
(R’ =. 0.932)
1.8x** 67.68***
612.51*** 24.46*** 79.45***
362.06*** 1.93*** 2.80***
(R* = 0.933)
3.49*** 3.48 2.4 I 2.66 4.47*
I I .46*** 3.X6*** 1.21
(R'=0.294) 2.56*** 0.16 6.68** 0.00
12.21*** 38.41***
2.81*** 2.13***
(R'=0.368)
Phenotypic plasticity in Drosophila
Table 2. (Contd.)
SCX Source df Mean Square
9
F
c) Viability pooled CROSSES
TEMP YEAST TEMP*TEMP TEMP*YEAST YEAST*YEAST TEMP*CROSSES YEAST*CROSSES
ERROR
35 0. II03 I I .3992 1 0.4380 1 I .3378 I 0.4854 I 0.0000
35 0.1292 35 0.1721
1018 0.0479
2.30*** 29.20***
9.14** 27.92*+* 10.13** 0.00 2.70*** 3.39***
(R’ = 0.603)
Table 3. Effect of the yeast concentration on the differences between the means at 22 C and 28 C of developmental time and dry weight. separately for males and females. The rows designated “overall” give the F-values (with 2 and 70 cif) for the effect of the yeast concentration on the differences (two-way ANOVAs with means of crosses per block as data and yeast and crosses as factors). Different letters within the triplets for each sex indicate differences that are statistically different from each other (pairwise Bonferroni I-tests with an experimentwise error rate of 5%)
Sex Yeast Difference of developmental time
Difference of dry weight
males
females
overall F = 291.3(***) 5 5.00a
IO 3.99b 40 2.97~
MSD’ 0.25
overall F = 233.4(***) 5 5.07a
IO 4.00b 40 2.93~
MSD’ 0.27
F = 3.7( *) 0.13a 0.12a O.Ola 0.15
F = 8.7(**) 0.26a 0.17ab
-O.Olb -0.18
*P < 0.05, **p < 0.001, ***p < 0.0001 ’ Minimum Significant Difference
were negative at the lowest and the highest yeast levels, but positive or absent at the intermediate yeast level (single exception: for males, 10 g/kg yeast, 25’ C r,. = -0.11, P = 0.02).
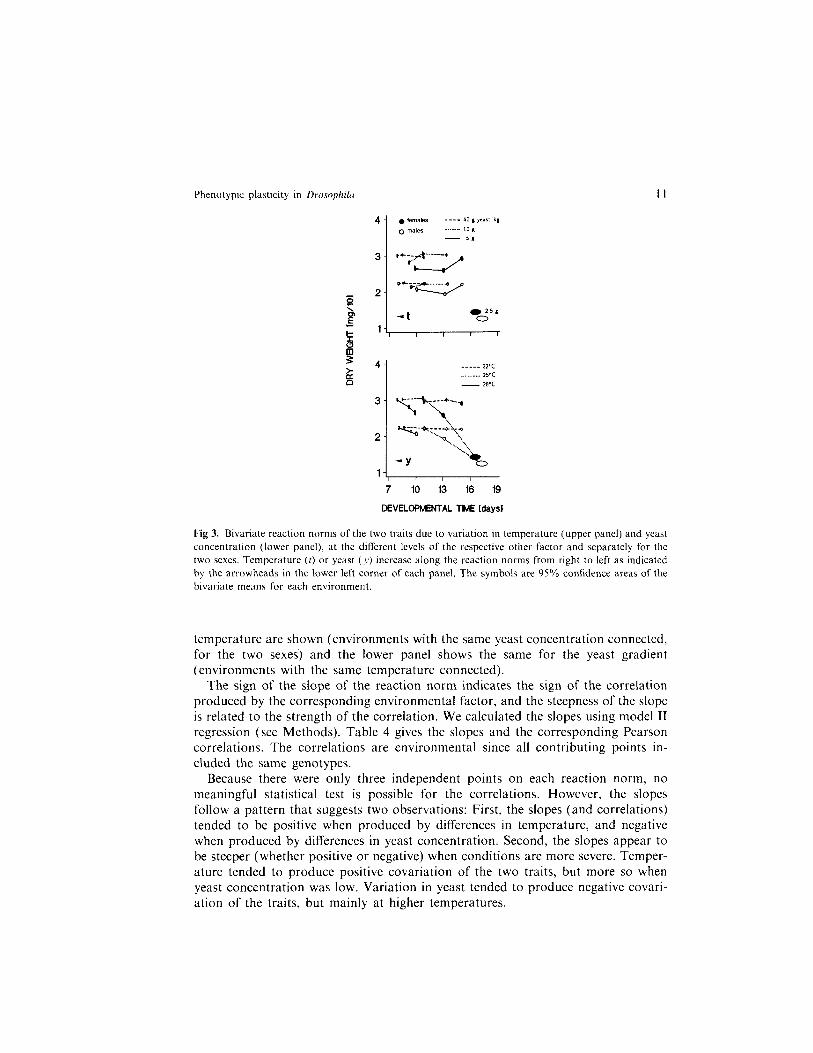
Shifts in temperature and yeast concentration produce environmental correla- tions between the two traits that can be visualized if the two traits are plotted against each other (Fig. 3). Each ellipse on the plots represents the 95% confidence areas of the bivariate mean for each environment (replicate means used as data points). In the upper panel of Fig. 3, the bivariate reaction norms produced by

IO Gebhardt and Stearns
Fig 2. Bar graphs representing the phenotypic and environmental correlations between developmental time and dry weight for each environment. The environmental correlations were computed from a multivariate ANOVA (see Methods). Bars transgressing the horizontal dotted lines represent correla- tions that are significant at the 5% level. Degrees of freedom for phenotypic and environmental correlations are d& = N - 2 and gfL = N--37, respectively (the model has 35 d’). where N is the total number of observed flies (ranging from 412 to 636).
Table 4. Slopes of the reaction norms in the plane defined by dry weight and developmental time that show the responses of the two traits to changes in temperature and yeast concentration (at specified levels of the respective other environmental factor; compare with Fig. 4). The slopes are for a model II regression (see Methods). r,, is the corresponding Pearson correlation.
Sex Yeast Temperature Slope ‘/J
males
females
5 22-28 IO 22-28 40 22 28
5- 40 22 5-40 25 5-40 28
5 22m 28 10 22 ~28 40 22m 28
5-40 22 5 -40 25 5 40 28
0.0523 0.358 0.0234 0.704
-0.0096 -0.755
- 0.0060 -0.979 -0.0783 - 0.907 -0.0845 -0.995
0.0662 0.662 0.0623 0.663
-0.2447 -0.900
-0.0242 -0.278 -0.1153 -0.838 -0.1736 - 0.990
Phenotypic plasticity in Drosophila 11
Fig 3. Bivariate reaction norms of the two tracts due to variation in temperature (upper panel) and yeast concentration (lower panel). at the different levels of the respective other factor and separately for the two sexes. Temperature (t) or yeast 0’) increase along the reaction norms from right to left as indicated by the arrowheads in the lower left corner of each panel. The symbols are 95% confidence areas of the bivariate means for each environment.
temperature are shown (environments with the same yeast concentration connected, for the two sexes) and the lower panel shows the same for the yeast gradient (environments with the same temperature connected).
The sign of the slope of the reaction norm indicates the sign of the correlation produced by the corresponding environmental factor, and the steepness of the slope is related to the strength of the correlation. We calculated the slopes using mode1 II regression (see Methods). Table 4 gives the slopes and the corresponding Pearson correlations. The correlations are environmental since all contributing points in- cluded the same genotypes.
Because there were only three independent points on each reaction norm, no meaningful statistical test is possible for the correlations. However, the slopes follow a pattern that suggests two observations: First, the slopes (and correlations) tended to be positive when produced by differences in temperature, and negative when produced by differences in yeast concentration. Second, the slopes appear to be steeper (whether positive or negative) when conditions are more severe. Temper- ature tended to produce positive covariation of the two traits, but more so when yeast concentration was low. Variation in yeast tended to produce negative covari- ation of the traits, but mainly at higher temperatures.

12 Gebhardt and Stearns
Discussion
The observed responses of developmental time and weight at eclosion to varia- tion in food and temperature agree well in genera1 with data reported in the literature (Imai. 1933; Parsons, 1961; David et al., 1983) although the response of weight to a change in temperature was smaller than usual. New aspects in this study are the analysis of the interactions of temperature and yeast and a direct observation of the environmental variation and covariation, made possible by genetically homogeneous stocks. We interpret these data in the framework of the growth mechanics of Drosophila larvae, point out consequences for the role of genotypic and phenotypic covariance matrices, and comment on optimality models that predict adaptive phenotypic plasticity.
u) C’orrelutions between the twits und c( growth model
Based on growth experiments with Drosophilu larvae raised with different amounts of food, Bakker (19.59) proposed a growth model which was confirmed in later studies (Bakker, 1961; Robertson, 1963, 1964). It was used by Gebhardt and Stearns (1988) to show how different environmental influences could produce all possible correlations between developmental time and weight at eclosion. Briefly, the model supposes that there are two critical periods during larval development. The first encompasses the first two instars and ends shortly after the second larval moult. It is quite variable in length and terminates when the minimum weight is attained that allows pupation even if no food is available afterwards. The second period encompasses essentially the stage of the third larval instar and the pupal stage and is much less variable in length, but the amount of food consumed by third instar larvae largely determines the final weight at eclosion. Therefore, according to whether and how a factor influences the first two, the third, or all three instars, positive, negative or zero correlations between the traits are possible. In the next three paragraphs, we show that this growth model can explain our observations because it makes predictions that are consis- tent with our data if the most likely effects of yeast concentration and temperature on the different growth stages are assumed. Furthermore, the mode1 immediately suggests experiments that would further elucidate the mechanics of growth and the way temperature and yeast concentration affect the covariation of weight and development time.
Temperature tended to produce a positive correlution As temperature was constant throughout development, growth rates during all
instars were affected similarly. Raising the temperature shortens developmental time and also reduces weight, probably due to a higher proportion of respiratory losses or to a shift of the relative speed of cell differentiation and cell growth (Church and Robertson, 1966). Furthermore, if not only the final weight at eclosion, but also the

Phenotypic plasticity in Drosophila 13
minimum weight at the beginning of the third larval instar is reduced, this also tends to produce a positive correlation, because a smaller minimum weight is reached in a shorter time and leads to reduced weight at pupation (Fig. 4a in Gebhardt and Stearns, 1988). Further experiments would be needed to show whether indeed smaller third instar larvae can pupate at higher temperatures.
Yeast variation tended to produce a ncgutive correlution Unlike the situation in Bakker’s (1959, 1961) experiments, where the amount of
food was varied without changing the concentration by spreading the nutritious paste over a neutral agar, we accomplished the reduction of food by a higher degree of dilution. Therefore the rate at which nutrients could be taken up was reduced. As a consequence, the duration of the first two instars (which are the variable part in the growth model) had to be increased for the minimum weight to be attained, and the weight gain during the third instar was reduced, because the length of this stage is fixed. Therefore, a longer developmental time was associated with a lower dry weight.
There were hurdly uny within-environmental correlations Because the developmental period is subdivided into a part that largely deter-
mines its length and a part that largely determines weight at pupation, the two traits are independent from a physiological point of view and therefore uncorrelated if no correlation enters through the correlation of the environmental factors that are important during the different stages of development. Because within-environmental variation has many different, independent sources, we expect their combined influence on the two periods during development, and thus on the two traits, to be uncorrelated. Furthermore, the effects of different sources of variation can cancel each other, as is the case for temperature and yeast concentration that cause correlations of opposite sign.
h) Genotypic and phenotypic covuriunce
Because we used genetically homogenous stocks, we could measure phenotypic and environmental correlations directly. This and the fact that we measured correlations due to two different factors allows us to make two points about genotypic and phenotypic covariance matrices.
The first point concerns the role of environmental covariance in evolutionary dynamics. Temperature and yeast concentration tended to produce correlations of opposite signs between developmental time and dry weight, and the sensitivity of a trait to change in one factor depended on the level of the other factor. This indicates that the environmental correlations among different traits and the expressions of a trait in different environments (say food levels) can change if some other factor (say temperature) fluctuates in all of these environments. It has often been emphasized that a longterm prediction of trait evolution depends on the stability of the genetic matrix (Lande, 1979). However, our results illustrate that the phenotypic variance- covariance matrix may also be unstable, with equally complicating consequences on
14 Gebhardt and Stearns
the evolutionary dynamics, especially if the environmental components are large (small heritabilities of the traits) and more than one enviromental factor is involved.
Our second point is a comment on the relationship between genetic and pheno- typic covariance. The estimation of genetic covariance matrices in natural popula- tions is difficult because of the notoriously large sampling errors (Bell and Koufopanou, 1986; Roff and Mousseau, 1987; Cheverud, 1988). Cheverud (1988) argued that in most cases, the estimated genetic covariance matrices are much too inaccurate to allow reliable inferences of phenotypic evolution. Because he found close agreement of genetic and phenotypic matrices in cases where the estimates were accurate enough, he suggested using phenotypic correlations as approxima- tions instead of inaccurate genetic estimates.
However, Cheverud noted himself that the similarity of the two matrices will increase with the heritability of the involved traits. For traits with a low heritability, and these are just the cases where estimates of the genetic variances are least accurate, our data indicate that we cannot trust in a strict relationship between the genetic and the phenotypic matrices, because we cannot expect a constant structure in the environmental covariances. In such cases, it would be more reliable to get information on the environmental part of the covariance. If this is possible, a much better approximation to the additive genetic matrix would be the difference between the phenotypic and the environmental matrices.
c) Optimality qf phenotypic plasticity
Stearns and Koella (1986) presented a theoretical framework for the prediction of an optimal shape of reaction norms for life-history characters. Their model predicts an optimal reaction norm for age and size at maturity for a range of environments. The quality of the environments was measured by the growth rate an individual is able to realize, and not by a parameter of the environment independent of the organism. Our experiments involving two different environmental factors show that one has to be careful not to introduce ambiguities if this approach is used. We varied the growth rate by changing temperature and yeast concentration. Different com- pound reaction norms for developmental time and dry weight at eclosion were the results (Fig. 3). This indicates that at least one of the response curves could not be optimal if fitness were determined by the realized growth rate alone. However, because different environments that can produce the same growth are probably associated with different mortality and fecundity schedules, it is not possible with these data to decide whether the observed plastic responses were optimal.
Acknowledgements
We thank H. Bachmann, T. Diggelmann and H. Zingerli who ran the lab and turned most of the data mto computerized form. The manuscript was much improved by the comments of K. Bakker, D. Ebert,

Phenotypic plasticity in Drosophila 15
S. Henrich. E. Hillesheim, A. van Noordwijk, V. Perrot, W. Scharloo and anonymous reviewers. W. Gehring and T. Kaufman provided laboratory stocks for the derivation of the homozygous lines, and advise on the extracting scheme was given by H. Bellen and U. Kloter in W. Gehring’s department. Financial support was provided by the Swiss National Fonds (grants # 3.642-084 and 3.643-087 to S. c. S).
References
Backhaus, B., E. Sulkowski and F. W. Schlote. 1984. A semi-synthetic, general-purpose medium for Drosophila melunogusrer. Dros. Inf. Serv. 60: 210-212
Bakker, K. 1959. Feeding period, growth, and pupation in larvae of Drosophilu melanogasrer. Ent. Exp. & Appl. 2: 171 -186
Bakker, K. 1961. An analysis of factors which determine success in competition for food among larvae of Drosophila melanogaster. Arch. Neerl. Zool. 14: 200 281
Bakker, K. 1969. Selection for rate of growth and its influence on competitive ability of larvae of Drosophila melanogaster. Neth. J. Zool. 19: 541-595
Bakker, K. and F. X. Nelissen, 1963. On the relations between the duration of the larval and pupal period, weight and diurnal rhythm in emergence in Drosophila melanoguster. Ent. Exp. & Appl. 6: 37 52.
Bell, G. and V. Koufopanou. 1986. The cost of reproduction. Oxford Surveys of Evolutionary Biology 3: 83-131
Bradshaw, A. D. 1965. Evolutionary significance of phenotypic plasticity in plants. Adv. Genet. 13: 115 155
Buzzati-Traverse, A. A. 1955. Evolutionary changes in components of fitness and other polygenic traits in Drosophilu mekmoguster populations. Heredity 9: 153 186
Cheverud, J. M. 1988. A comparison of genetic and phenotypic correlations. Evolution 42: 958-968 Church, R. B. and F. W. Robertson. 1966. Biochemical analysis of genetic differences in the growth of
Drosophila. Genet. Res. Camb. 7: 383-407 Craymer, L. 1984. A procedure for constructing isogenic stocks. Dros. Inf. Serv. 60: 78879 David, J. R., R. Allemand, J. van Herrewege and Y. Cohet. 1983. Ecophysiology: abiotic factors. pp.
1055170 in: The genetics and biology of Drosophila (M. Ashburner, H. L. Carson and J. N. Thompson, Jr. eds.), Vol. 3d, Academic Press, London
Dobzhansky, Th. 1951. Genetics and the origin of species. 3d ed., Columbia Univ. Press, New York Gebhardt, M. D. 1989. The quantitative genetics of phenotypic plasticity of life history traits in
Drosophila. PhD Thesis, University of Base]., Switzerland Gebhardt, M. D., and S. C. Stearns. 1988. Reaction norms for developmental time and weight at
eclosion in Drosophila mercaforum. J. Evol. Biol. 1: 335 --354 Gupta, A. P., and R. C. Lewontin. 1982. A study of reaction norms in natural populations of Drosophi/u
pseudoobscuru. Evolution 36: 934 -948 Imai, T. 1933. The influence of temperature on variation and inheritance of bodily dimensions in
Drosophila melanogusfer. Wilhelm Roux’ Archiv f. Entwicklungsmechanik 128: 634 -660 de Jong, G. 1990. Quantitative genetics of reaction norms. J. Evol. Biol. 3: 4477468 Lande, R. 1979. Quantitative genetic analysis of multivariate evolution, applied to brain: body size
allometry. Evolution 33: 402 -416 Newman, R. A. 1988. Adaptive plasticity in development of Scaphiopus couchii tadpoles in desert ponds.
Evolution 42: 774 783 Parsons, P. A. 1961. Fly size, emergence time and sternopleural chaeta number in Drosophila. Heredity
16: 4555473 Robertson, F. W. 1963. The ecological genetics of growth in Drosophila. 6. The genetic correlation
between the duration of the larval period and body size in relation to larval diet. Genet. Res. Camb. 2: 3466360
16 Gebhardt and Stearns
Robertson, F. W. 1964. The ecological genetics of growth in Drosophila. 7. The role of canalization in the stability of growth relations. Genet. Res. Camb. 5: 107- 126
Roff, D. A. and T. A. Mousseau 1987. Quantitative genetics and fitness: lessons from Drosophilu. Heredity 58: 103 i18
SAS Institute Inc. 1985. SAS User’s guide: Statistics, Version 5 Edition. Cary, North Carolina Schlichting, C. D. 1986. The evolution of phenotypic plasticity in plants. Ann. Rev. Ecol. Syst. 17:
667 693 Schmalhausen, 1. 1. 1949. Factors of Evolution. Blakiston Press, New York Sokal, R. R. and F. J. Rohlf. 1981. Biometry. W. H. Freeman and Company, San Francisco Stearns, S. C., T. Diggelmann, M. Gebhardt, H. Bachmann and R. Wechsler. 1987. A device for
collecting flies of precisely determined post-hatching age. Dros. Inf. Serv. 66: l67-- 169 Stearns, S. C. and J. C. Koella. 1986. The evolution of phenotypic plasticity on life-history traits:
predictions of reaction norms for age and size at maturity. Evolution 40: 893-913 Sultan S. E. 1987. Evolutionary implications of phenotypic plasticity in plants. Evol. Biol. 21: 127 I78 Via. S., and R. Lande. 1985. Genotype-environment interaction and the evolution of phenotypic
plasticity. Evolution 39: 505- 522 Waddington, C. H. 1957. The strategy of the genes. Allen and Unwin, London Woltereck, R. 1909. Weitere experimentelle Untersuchungen iiber Artveranderung, speziell iiber das
Wesen quantitativer Artunterschiede bei Daphniden. Verh. Deutsch. Zool. Gesell. 19: 110 172 Wright. S. 1931. Evolution in mendelian populations. Genetics 16: 97 159
Received 12 August 1991: accepted 17 June 1992. Corresponding Editor: G. de Jong


![Plasticity Regulators Modulate Specific Root Traits in ... regulators modulate...plasticity, as there is growing interest in the genes underlying phenotypic plasticity [13,16,17].](https://static.fdocuments.in/doc/165x107/5afe51797f8b9a994d8ecb65/plasticity-regulators-modulate-specific-root-traits-in-regulators-modulateplasticity.jpg)