
PhD Thesis Signalling detection of DNA damage induced … · Université de Versailles et...
144
Université de Versailles et Saint-Quentin en Yvelines Institut de Radioprotection et de Sûreté Nucléaire PhD Thesis Signalling detection of DNA damage induced by low doses of ionizing radiation in human lymphocytes Détection de la signalisation des cassures de l’ADN dans les lymphocytes humains par de faibles doses de rayonnements ionisants Marco VALENTE Directeurs de thèse : Laurence ROY, Patrick LALOI Tutelle : Sandrine ROCH-LEFEVRE
Transcript of PhD Thesis Signalling detection of DNA damage induced … · Université de Versailles et...
Université de Versailles et Saint-Quentin en Yvelines
Institut de Radioprotection et de Sûreté Nucléaire
PhD Thesis
Signalling detection of DNA damage
induced by low doses of ionizing
radiation in human lymphocytes
Détection de la signalisation des cassures de l’ADN dans les
lymphocytes humains par de faibles doses de
rayonnements ionisants
Marco VALENTE
Directeurs de thèse : Laurence ROY, Patrick LALOI
Tutelle : Sandrine ROCH-LEFEVRE

This work is dedicated to
Cármen Valente and Fábio Valente

ACKNOWLEDGEMENTS
These last few years at the IRSN were quite eventful and left me many reasons to be thankful for.
The members of the biodosimetry lab welcomed me like an old friend and each and every one of
them have made my life richer.
Firstly, I would like to thank my supervisor Sandrine. Her guidance and scientific knowledge were
vital for this work. I believe that we have both learned a lot together and I hope that we will have
more opportunities to do so in the future. Thank you for everything!
I would like to express my gratitude to Laurence. Her professionalism, energy and incredible capacity
to supervise have always impressed me and pushed me forward. I don’t think you know how much of
a role model you are to me.
To my good friend Pascale: I don’t believe “thanks” is enough to convey my gratitude. You were a
source of strength when I needed it. I could not have been luckier than to have had the chance to
work beside you.
Special thanks to Gaëtan. We were sometimes too alike for our own good. Thank you for all your
help and support. I will really miss our discussions my friend.
I would like to thanks Aurélie for our discussions, her kindness, and her sense of humor. Her patience
and help were priceless. I wish you a very bright future.
Thanks Cécile. Your dedication and professionalism did not stay unnoticed. I really hope that you
realize just how far you can go. I wish you all the happiness and prosperity for both your professional
and personal projects.
Thanks to Eric. You have the most contagious laughter and you are a true friend to all that surround
you. Thank you so much for all our discussions and help.
Thanks to Odile, my companion in the “Portuguese invasion”. You were the “smoking” free electron
of the lab. Thanks for your motivational speeches and your help. Your blunt honesty was always
refreshing. You are a hard worker and I wish you find the good project to harness your energy.
I would like to thank Ingrid, for her support and her “medical advices” ;) I know you will thrive in your
research. You are in good hands.
Muriel, you have been a supportive friend, thank you.
I also extend my thanks to, Sandrine, Veronique, Malika and Keltoum, our fierce administrative
assistants. I want to say thanks to all our collaborators: Frédérique, Pierre, Serge, Maria Victoria,
Leticia, Ivone, Maria, Belen, Jorge, Leo and to our neighboring colleagues Valerie and Georges.
Thanks to Philippe VOISIN. It was a real honor to work with and learn from one of the “pillars of the
biological dosimetry”. You always made me feel welcomed at the SRBE and LDB.

Many thanks to Patrick LALOI: his scientific guidance and corrections were very helpful and his
management resourcefulness was inspiring.
Thanks to all the members of the DRPH. You’ve always been very nice and helpful.
I am forever in your debt for and I’m sure to leave having made good friends.
I thank Hubert THIERENS, Joke WERBROUCK and Laurence BEELS for our scientific exchanges and
their radiotherapy patient samples that made part of this work possible.
I would like to thank Nicolas FORAY, Kai ROTHKAMM and Bernard MIGNOTTE who have accepted to
be a very important part of my PhD Jury. All your advices and corrections were a great help.
And last, but certainly not least…
To my family and friends, I can never thank you enough: for all your support, now and always.
A special thanks to my father, for all that he has taught me (and still does). Your courage inspires me
to go forward. Literally none of this would have been possible without you.
Um “Obrigado” muito especial para o meu Pai. Por tudo o que me ensinaste (e continuas a ensinar). A
tua coragem inspira-me a continuar a avançar. Literalmente nada disto teria sido possível sem ti Pai.
SUMMARY
Individuals spontaneously present different sensitivities to ionizing radiation,
measured by the severity of their post-radiotherapy side-effects. Cells from some
patients with extreme clinical radiosensitivity have shown altered cellular
radiosensitivity measured by different endpoints as apoptosis or DNA damage.
Linking clinical and cellular sensitivity is of fundamental importance to establish a
clinical test capable of predicting a person‟s radiosensitivity from a sample. Easily
sampled, peripheral blood lymphocytes (PBL) are an appealing cellular model to
study individual radiosensitivity as they have been shown to be the most
radiosensitive hematopoietic cells. DNA damages and repair can be visualized by
observing the kinetics of appearance and disappearance of gamma-H2AX foci on
DNA double-strand breaks through immunofluorescence microscopy. The
experimental strategy chosen here was to follow lymphocyte gamma-H2AX foci
kinetics in response to different levels of irradiation as delayed gamma-H2AX foci
disappearance has been observed in cells of individuals with high clinical
radiosensitivity.
For our initial study we irradiated in vitro samples of radiotherapy patients with
different clinical radiosensitivities. The groups of distinct clinical sensitivities
showed no corresponding differences in their cellular gamma-H2AX response. In
addition, several samples were lost, mainly due to the long transportation period
before being treated in our lab.
To render this method usable for clinical applications, several changes were made:
after improving sample viability, speed was increased by automation of image
acquisition (Metasystem) and gamma-H2AX focus scoring (freeware CellProfiler).
This technique was able to detect doses as low as 0.005 Gy and gave similar results
to manual focus scoring. The possibility of discriminating different lymphocyte
subsets (CD4, CD8 and CD19) during analysis was added to identify among the
lymphocyte subsets the one producing more gamma-H2AX foci in response to
irradiation. Using the methodological tools developed during this thesis we
established for the various lymphocyte subsets the relationship between radiation
dose and gamma-H2AX foci frequency as well as the kinetics of
appearance/disappearance of gamma-H2AX foci.
Finally, since no additional samples from patients of known radiosensitivity were
available to continue the initial study with the improved protocol, we focused on
radiosensitivity in another context: radio-adaptive response. This phenomenon
corresponds to a lower cellular response to high dose of ionizing radiation exposure
if it is preceded by an exposure to low doses. With the conditions used here we did
not observe a radio-adaptive response in terms of gamma-H2AX signalling
regardless of the lymphocyte subpopulation studied. However, the translocation
rate of pre-irradiated CD4-positive lymphocytes was significantly different when
compared to cells only irradiated acutely. This result thus indicates a differential
repair of double strand breaks in lymphocytes after a radio-adaptation.
RESUME
Les individus présentent de façon spontanée une sensibilité variable aux
rayonnements ionisants. Elle peut être mesurée par la gravité des effets
secondaires observés post-radiothérapie. Les cellules de certains patients,
présentant une hypersensibilité clinique aux rayonnements ionisants, ont montré
une radiosensibilité cellulaire altérée, mesurable par différents critères tels que
l'apoptose ou les dommages à l'ADN. Etudier le lien entre les radiosensibilités
cliniques et cellulaires est d'une importance fondamentale pour établir un test
capable de prédire la radiosensibilité d'une personne à partir d'un échantillon.
Faciles à prélever, les lymphocytes du sang périphérique sont un modèle cellulaire
attirant pour étudier la radiosensibilité individuelle étant qu‟ils se sont avérés être
les cellules hématopoïétiques les plus radiosensibles. Dans la cellule, les cassures
de l‟ADN ainsi que leur réparation peuvent être visualisées grâce à la cinétique
d‟apparition et de disparition des foyers formés par la protéine gamma-H2AX. Ils
sont observés par microscopie à l‟aide de technique d‟immunofluorescence. La
stratégie expérimentale choisie est la quantification des foyers gamma-H2AX lors
de cette cinétique, dans les lymphocytes de personnes présentant une
radiosensibilité clinique élevée.
Pour notre étude initiale, nous avons irradié in vitro des échantillons de patients de
radiothérapie ayant des radiosensibilités cliniques différentes. L‟analyse de la
cinétique de réponse de la protéine gamma-H2AX n‟a pas permis de mettre en
évidence une corrélation directe entre le nombre de cassures et le niveau de
radiosensibilité des patients. Cependant, plusieurs échantillons ont été perdus,
principalement à cause du temps de transport entre le prélèvement du patient et
l‟arrivée de l‟échantillon au laboratoire.
Ainsi, pour rendre cette méthode utilisable en application clinique, plusieurs
changements ont été faits : l'amélioration de la viabilité de l'échantillon ainsi que
l‟augmentation de la vitesse d‟analyse grâce à l'automatisation de l'acquisition des
images (logiciel « Metafer4 » de MetaSystems) et du dénombrement des foyers
gamma-H2AX (logiciel gratuit « CellProfiler »). Cette méthodologie a permis la
détection de doses d‟irradiation in vitro à partir de 0,005 Gy, tout en donnant des
résultats similaires au comptage manuel.
De plus, nous avons étudié la réponse à différentes doses d‟irradiation des sous-
populations lymphocytaires CD4, CD8 et CD19. Les outils méthodologiques
développés lors de cette thèse, nous ont permis d‟établir pour les différentes sous-
populations lymphocytaires, d‟une part la relation entre la dose d„irradiation et la
fréquence de foyers gamma-H2AX et d‟autre part la cinétique d'apparition /
disparition de ces foyers.
Enfin, nous n‟avons pas eu à la possibilité d‟obtenir d‟autres échantillons provenant
de patients de radiosensibilité connue. Nous aurions pu ainsi, poursuivre l'étude
initiale avec le nouveau protocole. Nous nous sommes donc concentrés sur la
radiosensibilité dans un autre contexte: la réponse radio-adaptative.
La réponse radio-adaptative est caractérisée par une réponse cellulaire, à une
forte dose d‟exposition, moins importante lorsqu‟elle est précédée par
l‟exposition à une faible dose.
Dans nos conditions expérimentales, nous n'avons pas observé de réponse radio-
adaptative par l‟analyse de la signalisation gamma-H2AX indépendamment de la
sous-population de lymphocytes étudiée. Néanmoins, le taux de translocations
observé dans les lymphocytes CD4-positifs pré-irradiés est significativement
différent du taux observé dans les lymphocytes irradiés directement avec la forte
dose. Ce résultat nous permet de penser que la réponse radio-adaptative dans les
lymphocytes impliquerait une réparation des cassures double-brin différente.
1
INDEX
INDEX ...................................................................................... 1
1 INTRODUCTION ...................................................................... 3
1.1 Ionizing radiation .............................................................. 3
1.1.1 High LET radiation ........................................................ 3
1.1.2 Low LET radiation ......................................................... 4
1.1.3 Units used in radiobiology ............................................... 6
1.1.4 Relative biological effectiveness ....................................... 6
1.2 Biological effects of ionizing radiation ..................................... 7
1.2.1 Radiation-induced lesions................................................ 7
1.3 DNA Damage Response ........................................................ 9
1.3.1 DSB signalling - Gamma-H2AX IRIF.................................... 10
1.3.2 DNA double strand break repair ...................................... 13
1.4 Radiosensitivity .............................................................. 18
1.4.1 Clinical Radiosensitivity ................................................ 19
1.4.2 Cellular Radiosensitivity ............................................... 21
1.5 Radio-adaptive response .................................................... 22
1.6 Cell model used in this work: lymphocytes .............................. 24
2 OBJECTIVES OF THIS WORK ..................................................... 27
3 MATERIALS AND METHODS ....................................................... 30
3.1 Sample Collection ............................................................ 30
3.2 Irradiation Conditions ....................................................... 30
3.2.1 Irradiations with a cesium-137 gamma source ...................... 31
3.2.2 Irradiations with a cobalt-60 gamma source ........................ 31
3.3 Gamma-H2AX assay .......................................................... 31
3.3.1 Sample processing ...................................................... 31
3.3.2 Slide preservation ....................................................... 32
3.3.3 Immunofluorescence staining ......................................... 32
3.3.4 Image Acquisition and Processing .................................... 33
3.3.5 Image Analysis ........................................................... 34
3.4 FISH-3 assay ................................................................... 34
3.4.1 Sample processing ...................................................... 34
3.4.2 FISH-3 painting .......................................................... 35
3.4.3 Chromosome aberration scoring ...................................... 36
3.5 Apoptosis assay ............................................................... 36
4 RESULTS ............................................................................ 38
4.1 Using cellular DNA damage signalling as a measure of clinical radiosensitivity ...................................................................... 38
4.1.1 Gamma-H2AX signalling kinetics of individuals with different clinical responses to radiation .................................................. 39
4.2 Assessing the impact of the changes made to the protocol ........... 40
4.2.1 Improving lymphocyte recovery of 24-hours old blood with RPMI medium dilution .................................................................. 41
4.2.2 Slide preservation ....................................................... 43
4.2.3 Protocol speed........................................................... 44
4.3 Development of automated acquisition and analysis ................... 44
4.3.1 Cell type selection ...................................................... 45
2
4.3.2 Gamma-H2AX focus scoring............................................ 50
4.4 Dose response ................................................................ 55
4.4.1 General lymphocyte population ...................................... 56
4.4.2 Lymphocyte Subsets .................................................... 58
4.5 Radio-adaptive response .................................................... 61
4.5.1 DNA damage signalling of the general lymphocyte population ... 61
4.5.2 Chromosomal aberrations in CD4-positive lymphocytes – the result of DNA repair ...................................................................... 64
4.5.3 Apoptosis ................................................................. 67
5 DISCUSSION ........................................................................ 69
5.1 Establishing and validating a fast and sensible gamma-H2AX protocol 69
5.1.1 Speed of processing and analysis ..................................... 69
5.1.2 Characterization and validation of the automated analysis ...... 71
5.1.3 Comparison with other approaches in the literature .............. 72
5.1.4 Potential and limitations of the gamma-H2AX protocol ........... 73
5.2 Low-dose response ........................................................... 74
5.2.1 Variation of lymphocyte subset response ........................... 75
5.3 Individual Clinical radiosensitivity ......................................... 75
5.4 Radio-adaptive response .................................................... 77
General conclusions and perspectives .............................................. 81
References .............................................................................. 83
3
1 INTRODUCTION
1.1 Ionizing radiation
Mankind has always been exposed to ionizing radiation (IR), mainly of natural
origin (like radon gas and cosmic rays) and varying with location and altitude.
Since the discoveries of Becquerel and the Curie, different types of ionizing
radiation have been used in several technological fields. Therefore, since the
end of the 19th century there is also an artificial component to human
exposure, from certain medical treatments (radiography and cancer
radiotherapy, for example), nuclear testing fallout, the Chernobyl accident,
and industrial discharges.
Radiation is said to be ionizing if composed of particles that individually carry
enough energy to detach electrons from atoms or molecules. Ionizing
radiation is generally the result of the natural decay of unstable atomic nuclei
(radioactivity) but can also be artificially generated (by particle accelerators,
for instance). When particles traverse matter they transfer their energy to the
medium primarily by ionizing atoms along their path. This energy is measured
in electron volt (eV). A molecule of water (H2O), for example, can be ionized
by approximately 14 eV. The Linear Energy Transfer (LET) is the amount of
energy released by the particle over the length of its decay track. When used
to describe the dosimetry of ionizing radiation in a biomedical context, LET is
usually expressed in keV/µm. Therefore, the different types of ionizing
radiation vary by their emitted particle and penetration power and can be
classified into two groups according to the density of the deposited energy:
High LET and Low LET radiation.
1.1.1 High LET radiation
High LET radiation typically releases 400 eV or more within target areas of
approximately 5 to 10 nm (Goodhead 1989).
4
The spontaneous emission of alpha particles occurs during the radioactive
decay of elements that have a mass number greater than about 150 (uranium
and plutonium, for example). Alpha particles are helium atom nucleus,
consisting of two protons and two neutrons. They are therefore heavy and
electrically charged, rapidly depositing their energy within a short (20 to 100
µm) and almost linear track. The energy lost by these particles during their
travel through matter peaks immediately before they come to rest (a
phenomenon called "Bragg peak"). This happens because the total interaction
cross section increases as the charged particle's kinetic energy approaches
zero.
Similarly to alpha radiation, in ion radiation the particle is charged and also
has a linear track with a Bragg peak. The particles penetration power and
distance of the Bragg peak depend on the atom that generated the ion (iron,
carbon, protons, etc.) and the initial energy. A variety of ion beam sources
exist, from mercury vapour thrusters to particle accelerators.
Neutrons, as their name suggests, are not charged particles. They are not
ionizing but their collisions with atom nuclei result in a chain reaction that
leads to the release of charged particles (like alpha, heavy ions or protons)
that do cause ionization. Therefore, the neutrons energy deposition will
depend on the secondary particles produced. Neutrons are very penetrating
and have a non-linear energy deposition track since free neutrons change
direction with each collision.
1.1.2 Low LET radiation
Low LET radiation typically releases 100 eV or less within target areas of
approximately 2 nm (Goodhead 1989).
1.1.2.1 Beta radiation
There are two types of beta particles: electrons and positrons ("anti-
electrons"). They are originated by the beta decay of atom nuclei with an
excess of neutrons or protons, respectively. This radiation has a weak
penetrating power, with an energy track profile that depends on the initial
5
energy. For higher energy values, the track starts off linear and gets more and
more deviated as the energy is lost. Also to be considered is the possible
ramification of this track due to secondary electrons generated by the
deposition of energy. Beta decay is a common by-product in nuclear reactors
and free neutrons also decay via this process.
1.1.2.2 Gamma-rays and X-rays
Gamma-rays are an electromagnetic radiation of high frequency (1019 Hz, with
energies above 100 keV and almost always less than 10 MeV) produced by sub-
atomic particle interactions such as electron-positron annihilation, neutral
pion decay, radioactive decay, fusion, or fission. After a decay reaction, the
nucleus is often in an “excited” state. This means that the decay results in
producing a nucleus which still has energy excess to get rid of. Rather than
emitting another beta or alpha particle, this energy is lost by emitting a pulse
of electromagnetic radiation called gamma-ray. The gamma-ray is identical in
nature to light or microwaves, but of very high energy.
The upper limit of energy for such radiation is about 20 MeV, and there is
effectively no lower limit (they are sometimes classed as X-rays if their
frequencies are lower than 1019 Hz). The distinction between gamma- and X-
rays is not based on their intrinsic nature but rather on their origins. X-rays
are emitted during atomic processes involving energetic electrons. Gamma-
rays are emitted by excited nuclei or other processes involving subatomic
particles. The applications of gamma-rays are much the same as those of X-
rays.
Like all forms of electromagnetic radiation, gamma-rays have no mass and no
charge. Gamma-rays interact with material by colliding with the electrons in
the shells of atoms. They lose their energy slowly in material, being able to
travel significant distances before stopping. Depending on their initial energy,
gamma rays can travel from 1 to hundreds of meters in air. It is important to
note that most alpha- and beta- emitters also emit gamma-rays as part of
their decay process.
6
In the work reported here we are using 2 sources of gamma-rays: cobalt-60
and cesium-137.
1.1.3 Units used in radiobiology
The unit currently used to measure the energy absorbed is the Gray (Gy,
honouring the physicist Stephen Gray). One Gy corresponds to 1 joule per
kilogramme of irradiated matter. Previously the dose was expressed in RAD
(for Radiation Absorbed Dose), where 100 RAD = 1 Gy. This way of measuring
does not take into account the LET of the ionizing radiation but varies with
both the number of ionizing particles and the atomic number of the traversed
material. Dose rate is the dose absorbed per unit of time. This rate can be
important as different dose rates can lead to distinct biological responses
(Boreham et al. 2000). The equivalent dose is a measure of the radiation
dose to tissue where an attempt has been made to allow for the different
relative biological effects of different types of ionizing radiation. Equivalent
dose is therefore a less fundamental quantity than radiation absorbed dose,
but is more biologically significant. Equivalent dose has units of sieverts (Sv).
1.1.4 Relative biological effectiveness
Relative biological effectiveness (RBE) is the ratio of a dose of a reference
radiation to the dose of the radiation of interest required to cause the same
level of biological effect (chromosomal aberrations, apoptosis, etc). In
human, studying radiation RBE has direct practical implications in therapy
applications and in assessing risks from environmental and occupational
exposures. Moreover, it provides analytic information on the underlying
mechanisms of radiation biology. For many relevant effects in mammalian
systems there is a general tendency to an increase in RBE with increasing LET,
up to a maximum followed by a decrease at very high LET. However, the
values of RBE for a given LET can vary by large amounts (even orders of
magnitude) depending on other physical and biological conditions. Common
general tendencies in mammalian systems are: RBE for mutations to be
7
greater than for cell inactivation; for particles such as protons or electrons to
reach their peak at lower LET than heavy ions (such as alpha particles or
carbon ions); for RBE to be larger at lower doses and dose rates; and for
radiosensitive cells to show lower RBE than radioresistant cells. There are,
however, many exceptions to such generalities. Therefore, we can conclude
that there are a number of competing mechanisms and diverse factors that
determine the effectiveness of high-LET radiations. This makes it difficult to
identify the individual mechanisms and to predict RBE for individual practical
application.
1.2 Biological effects of ionizing radiation
1.2.1 Radiation-induced lesions
Biological systems are structured in various levels of organization: atoms,
molecules, cells, tissues, and organisms. Ionizing radiation primarily interacts
with atoms and biological responses may become observable ascending to
every level of organization. The probability of such observation largely
depends on complex signalling within and between cells at every level of
organization controlling homeostasis and adaptation of the whole system
(Feinendegen et al. 2007). Proteins, cell membranes and DNA are targets of
radiation exposure, and effects on these structures can be produced by direct
damage as well as free radicals, including reactive oxygen and reactive
nitrogen species (ROS and RNS, respectively)(Daly et al. 2007). DNA damage is
formed by the ionizations/excitations of DNA or the surrounding material,
mostly water within a radical-diffusion distance of 4 nm from the DNA in the
cellular environment (Goodhead 1999). Various forms of DNA damage are
induced by ionizing radiation. Previous publications allow the rough
estimation of the yields of DNA damage in mammalian cells caused by low-LET
radiation exposure: for each diploid cell, 1 Gy induces 1000 simple-strand
breaks, 10000 base damage, 150 protein-DNA cross-links, 70 bulky lesions (ie,
clusters of base damage), and 40 double-strand breaks (DSB) (Averbeck 2000).
8
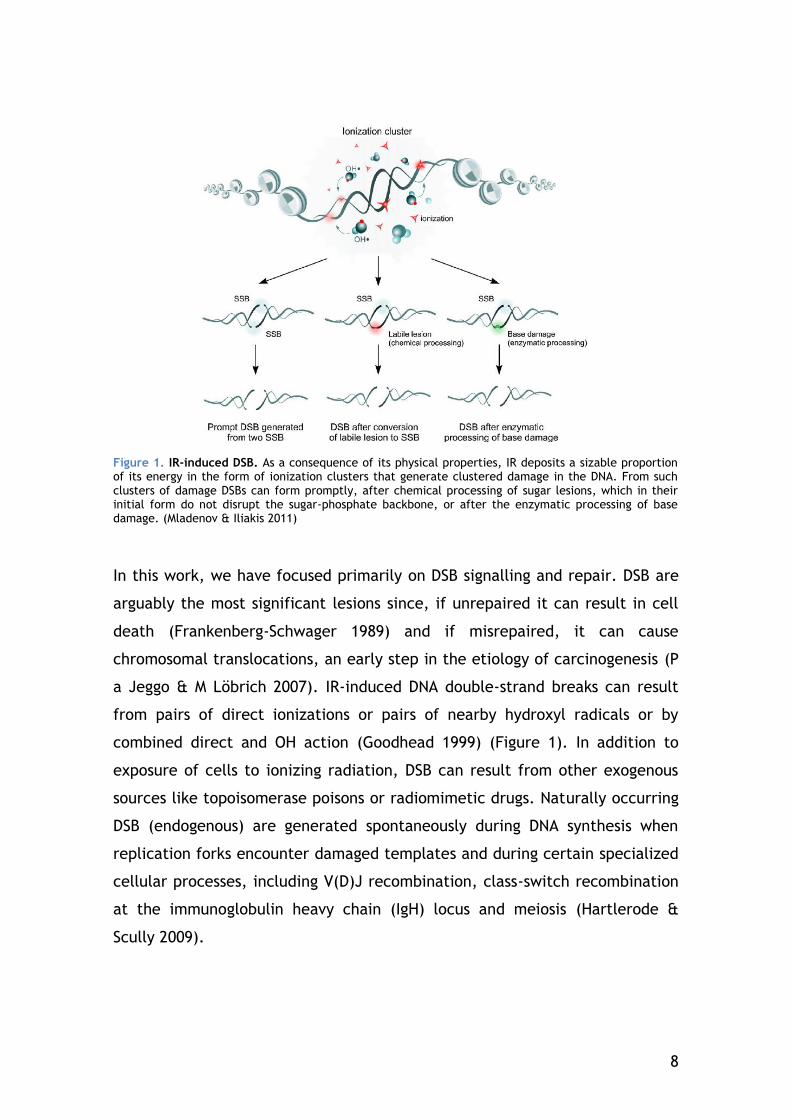
Figure 1. IR-induced DSB. As a consequence of its physical properties, IR deposits a sizable proportion of its energy in the form of ionization clusters that generate clustered damage in the DNA. From such clusters of damage DSBs can form promptly, after chemical processing of sugar lesions, which in their initial form do not disrupt the sugar-phosphate backbone, or after the enzymatic processing of base damage. (Mladenov & Iliakis 2011)
In this work, we have focused primarily on DSB signalling and repair. DSB are
arguably the most significant lesions since, if unrepaired it can result in cell
death (Frankenberg-Schwager 1989) and if misrepaired, it can cause
chromosomal translocations, an early step in the etiology of carcinogenesis (P
a Jeggo & M Löbrich 2007). IR-induced DNA double-strand breaks can result
from pairs of direct ionizations or pairs of nearby hydroxyl radicals or by
combined direct and OH action (Goodhead 1999) (Figure 1). In addition to
exposure of cells to ionizing radiation, DSB can result from other exogenous
sources like topoisomerase poisons or radiomimetic drugs. Naturally occurring
DSB (endogenous) are generated spontaneously during DNA synthesis when
replication forks encounter damaged templates and during certain specialized
cellular processes, including V(D)J recombination, class-switch recombination
at the immunoglobulin heavy chain (IgH) locus and meiosis (Hartlerode &
Scully 2009).
9
1.3 DNA Damage Response
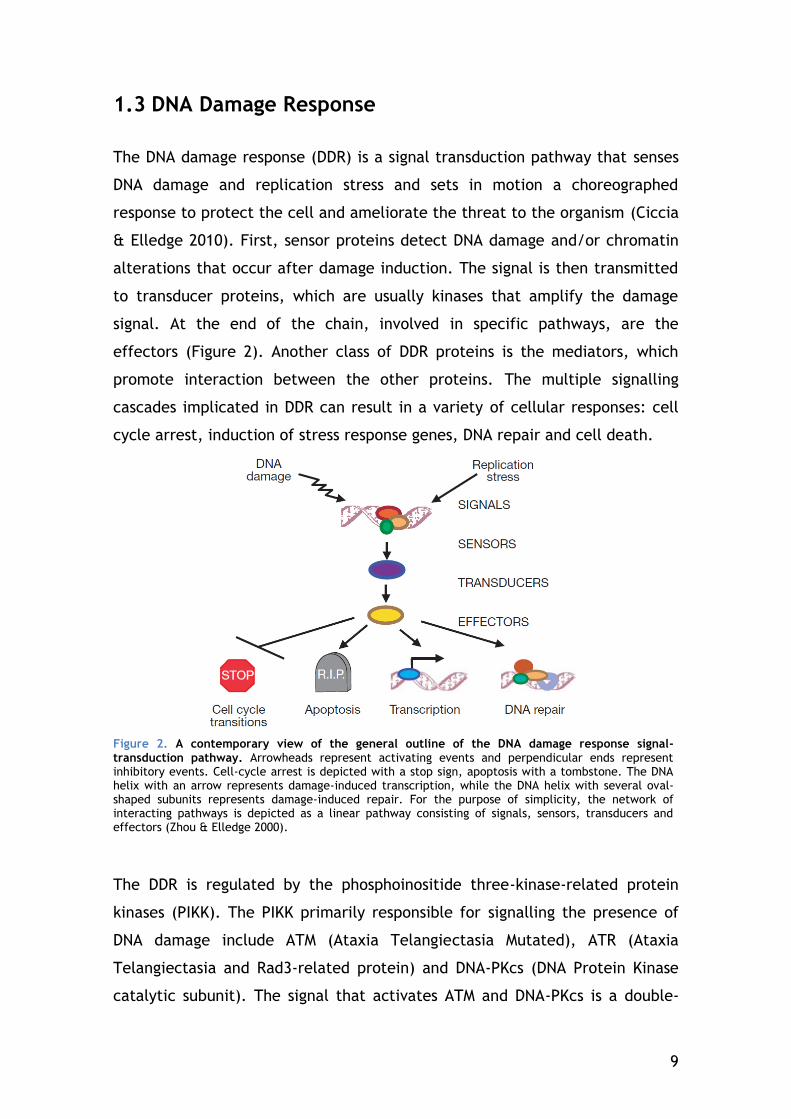
The DNA damage response (DDR) is a signal transduction pathway that senses
DNA damage and replication stress and sets in motion a choreographed
response to protect the cell and ameliorate the threat to the organism (Ciccia
& Elledge 2010). First, sensor proteins detect DNA damage and/or chromatin
alterations that occur after damage induction. The signal is then transmitted
to transducer proteins, which are usually kinases that amplify the damage
signal. At the end of the chain, involved in specific pathways, are the
effectors (Figure 2). Another class of DDR proteins is the mediators, which
promote interaction between the other proteins. The multiple signalling
cascades implicated in DDR can result in a variety of cellular responses: cell
cycle arrest, induction of stress response genes, DNA repair and cell death.
Figure 2. A contemporary view of the general outline of the DNA damage response signal-transduction pathway. Arrowheads represent activating events and perpendicular ends represent inhibitory events. Cell-cycle arrest is depicted with a stop sign, apoptosis with a tombstone. The DNA helix with an arrow represents damage-induced transcription, while the DNA helix with several oval-shaped subunits represents damage-induced repair. For the purpose of simplicity, the network of interacting pathways is depicted as a linear pathway consisting of signals, sensors, transducers and effectors (Zhou & Elledge 2000).
The DDR is regulated by the phosphoinositide three-kinase-related protein
kinases (PIKK). The PIKK primarily responsible for signalling the presence of
DNA damage include ATM (Ataxia Telangiectasia Mutated), ATR (Ataxia
Telangiectasia and Rad3-related protein) and DNA-PKcs (DNA Protein Kinase
catalytic subunit). The signal that activates ATM and DNA-PKcs is a double-
10
strand break, while ATR responds to single-stranded DNA gaps. All three
kinases are recruited to the DNA lesion site, which promotes kinase
activation. These PIKK phosphorylate hundreds of proteins that maintain
genome integrity through regulation of cell cycle progression, DNA repair,
apoptosis, and cellular senescence (Lovejoy & Cortez 2009).
1.3.1 DSB signalling - Gamma-H2AX IRIF
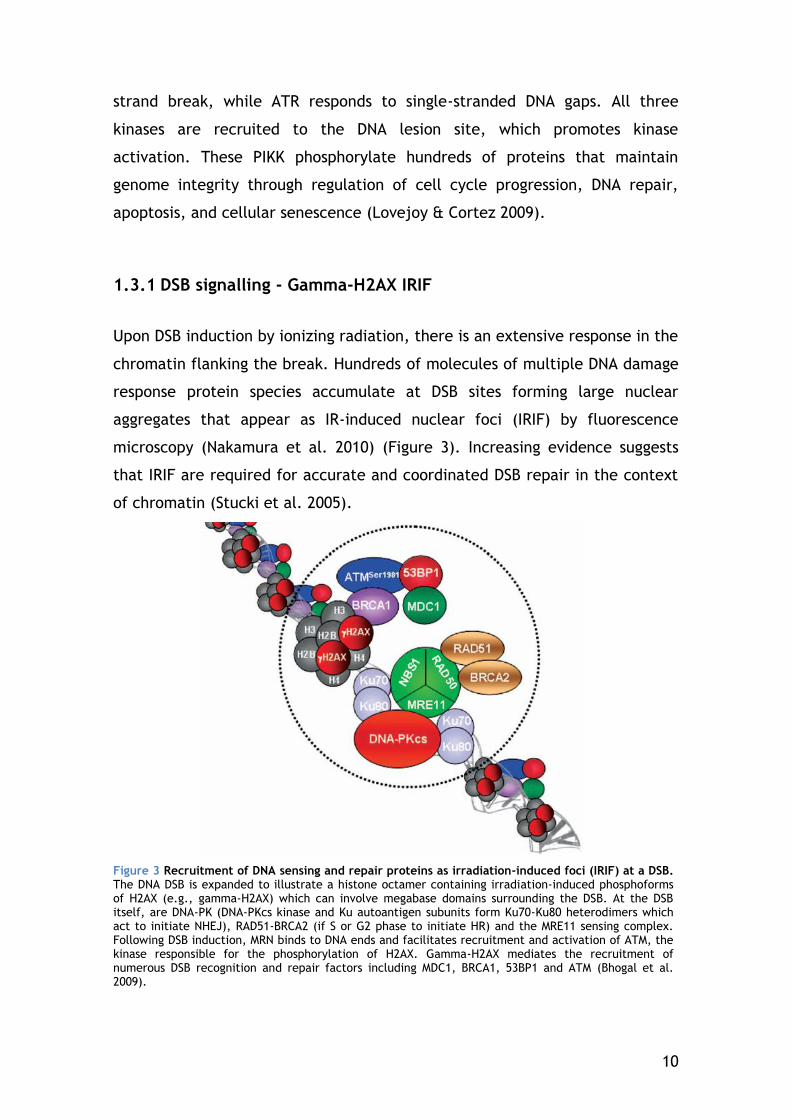
Upon DSB induction by ionizing radiation, there is an extensive response in the
chromatin flanking the break. Hundreds of molecules of multiple DNA damage
response protein species accumulate at DSB sites forming large nuclear
aggregates that appear as IR-induced nuclear foci (IRIF) by fluorescence
microscopy (Nakamura et al. 2010) (Figure 3). Increasing evidence suggests
that IRIF are required for accurate and coordinated DSB repair in the context
of chromatin (Stucki et al. 2005).
Figure 3 Recruitment of DNA sensing and repair proteins as irradiation-induced foci (IRIF) at a DSB. The DNA DSB is expanded to illustrate a histone octamer containing irradiation-induced phosphoforms of H2AX (e.g., gamma-H2AX) which can involve megabase domains surrounding the DSB. At the DSB itself, are DNA-PK (DNA-PKcs kinase and Ku autoantigen subunits form Ku70-Ku80 heterodimers which act to initiate NHEJ), RAD51-BRCA2 (if S or G2 phase to initiate HR) and the MRE11 sensing complex. Following DSB induction, MRN binds to DNA ends and facilitates recruitment and activation of ATM, the kinase responsible for the phosphorylation of H2AX. Gamma-H2AX mediates the recruitment of numerous DSB recognition and repair factors including MDC1, BRCA1, 53BP1 and ATM (Bhogal et al. 2009).
11
A key regulator of IRIF formation in mammalian cells is the histone subtype
H2A isoform X (H2AX), a component of the nucleosome core structure that
comprises 10%–15% of total cellular H2A in higher organisms (Fernandez-
Capetillo et al. 2004).
Some DDR factors have intrinsic affinity for free DNA ends. The MRN complex
(Mre11/Rad50/NBS1) can detect DSB and bind to the DNA ends (M F Lavin
2007). Given its structure, the MRN complex is thought to form a
microenvironment that holds the two DNA ends together (van Gent & van der
Burg 2007).
ATM is then indirectly recruited to DSB and activated by the MRN complex via
an interaction between the C-terminus of NBS1 and ATM (M F Lavin 2007).
One of the first substrates of ATM to be phosphorylated is histone H2AX: at
the sites of DSB, H2AX becomes phosphorylated on C-terminal Ser139 (E P
Rogakou et al. 1998). This modified H2AX called “gamma-H2AX” forms within
seconds, and reaches its maximum level at about 30 min after irradiation (E P
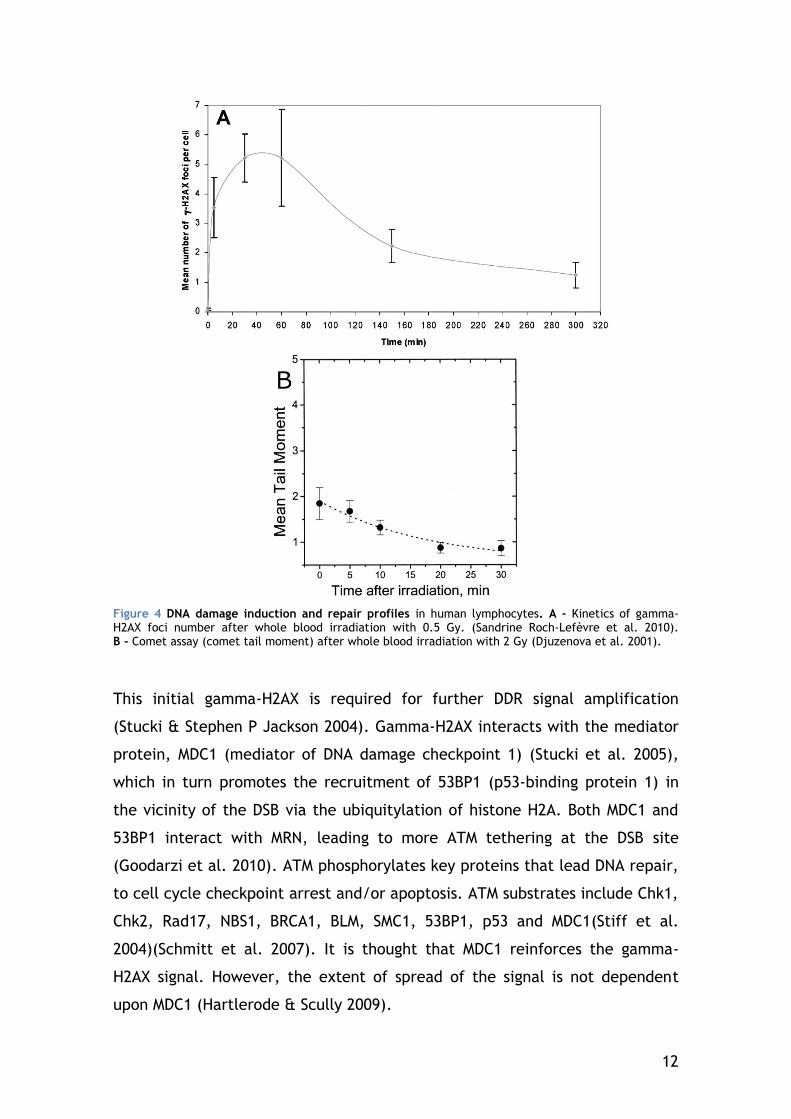
Rogakou et al. 1998) (Figure 4 A).
In this work, we used fluorochome-coupled antibodies against gamma-H2AX to
be able to quantify gamma-H2AX foci using fluorescence microscopy. Scoring
gamma-H2AX foci has been described as an assay capable of DSB
quantification induced by ionizing radiation (E P Rogakou et al. 1998).
However it is important to keep in mind that a gamma-H2AX assay measures a
biological response to DSB and not the actual “physical” DNA damage. There
is DNA repair within the 30 min gamma-H2AX takes to peak (measured in
Figure 4 B by the comet assay), given the fast kinetics of DNA repair. This
implies that the DSB detected by the gamma-H2AX assay are probably an
underestimation of the “real” DSB formed.
ATM seems to be the main kinase associated with gamma-H2AX formation
under normal physiological conditions but all three major PIKK members,
ATM, ATR and DNA-PKcs can phosphorylate H2AX (Stiff et al. 2004; Shrivastav
et al. 2008; Hartlerode & Scully 2009).
12
Figure 4 DNA damage induction and repair profiles in human lymphocytes. A - Kinetics of gamma-H2AX foci number after whole blood irradiation with 0.5 Gy. (Sandrine Roch-Lefèvre et al. 2010). B - Comet assay (comet tail moment) after whole blood irradiation with 2 Gy (Djuzenova et al. 2001).
This initial gamma-H2AX is required for further DDR signal amplification
(Stucki & Stephen P Jackson 2004). Gamma-H2AX interacts with the mediator
protein, MDC1 (mediator of DNA damage checkpoint 1) (Stucki et al. 2005),
which in turn promotes the recruitment of 53BP1 (p53-binding protein 1) in
the vicinity of the DSB via the ubiquitylation of histone H2A. Both MDC1 and
53BP1 interact with MRN, leading to more ATM tethering at the DSB site
(Goodarzi et al. 2010). ATM phosphorylates key proteins that lead DNA repair,
to cell cycle checkpoint arrest and/or apoptosis. ATM substrates include Chk1,
Chk2, Rad17, NBS1, BRCA1, BLM, SMC1, 53BP1, p53 and MDC1(Stiff et al.
2004)(Schmitt et al. 2007). It is thought that MDC1 reinforces the gamma-
H2AX signal. However, the extent of spread of the signal is not dependent
upon MDC1 (Hartlerode & Scully 2009).
13
Other DNA damage response proteins like BRCA1/BARD1 (BRCA1-associated
RING domain 1) and chromatin remodeling factors accumulate on gamma-
H2AX-containing chromatin (Kusch et al. 2004; A. J. Morrison et al. 2004).
Chromatin architecture is of fundamental importance to proteins that need to
access DNA for transcription or replication, so it is not surprising that this is
also the case for proteins involved in DNA repair (Goodarzi et al. 2010)
(Rossetto et al. 2010).
H2AX phosphorylation is not limited to the immediate vicinity: it spreads to a
large chromatin region surrounding the DSB. It has been estimated that in
mammals 0.03% of H2AX is phosphorylated per DSB. It is not clear how H2AX
phosphorylation is spatially confined, but 4 Pi microscopy suggests that H2AX
is not distributed randomly throughout bulk chromatin but exists in distinct
clusters that define the boundaries of gamma-H2AX spreading (Kinner et al.
2008).
Other DDR proteins such as Mre11 and Rad51 exhibit a different distribution,
accumulating in smaller regions at the DSB site. These data suggest that
different DDR proteins may have their own territory in a DSB focus (Nakamura
et al. 2010).
Although not crucial, gamma-H2AX facilitates DSB repair by either of the two
main pathways (Celeste et al. 2002; Hartlerode & Scully 2009; Bassing et al.
2002).
1.3.2 DNA double strand break repair
The integrity of the DNA is essential for the correct information transfer and
mechanical segregation of the chromosomes during cell division. Evolution has
put in place several surveillance mechanisms to allow a higher fidelity of
genetic material transmission from a cell to its daughter cells. The cell cycle
has 4 checkpoints to verify genome integrity: the end of G1, the S phase, the
end of G2 and the end of the M phase. Dividing cells after irradiation can be
blocked at G1 or G2. This is due to the activation of p53 by ATM or ATR. Cells
take advantage of the cycle arrest to repair the radiation-induced damage
14
done to their DNA. The cell only continues through the checkpoint after
having dealt with the “repairable” DNA damage.
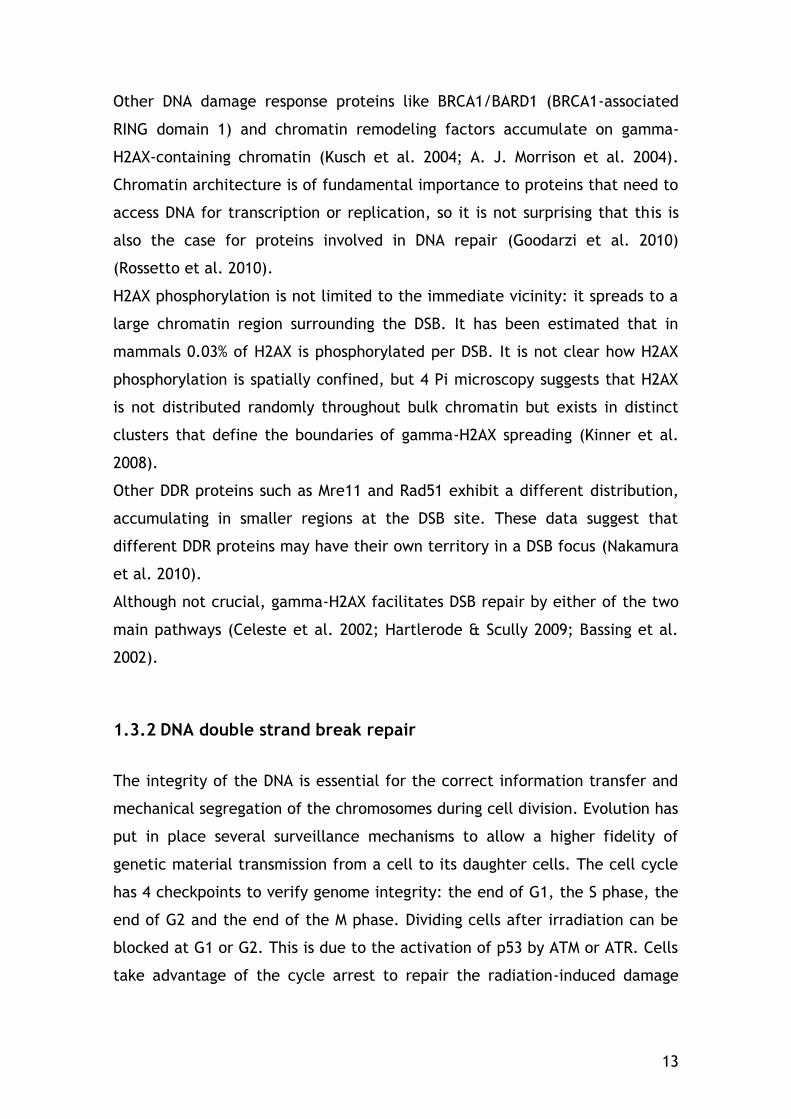
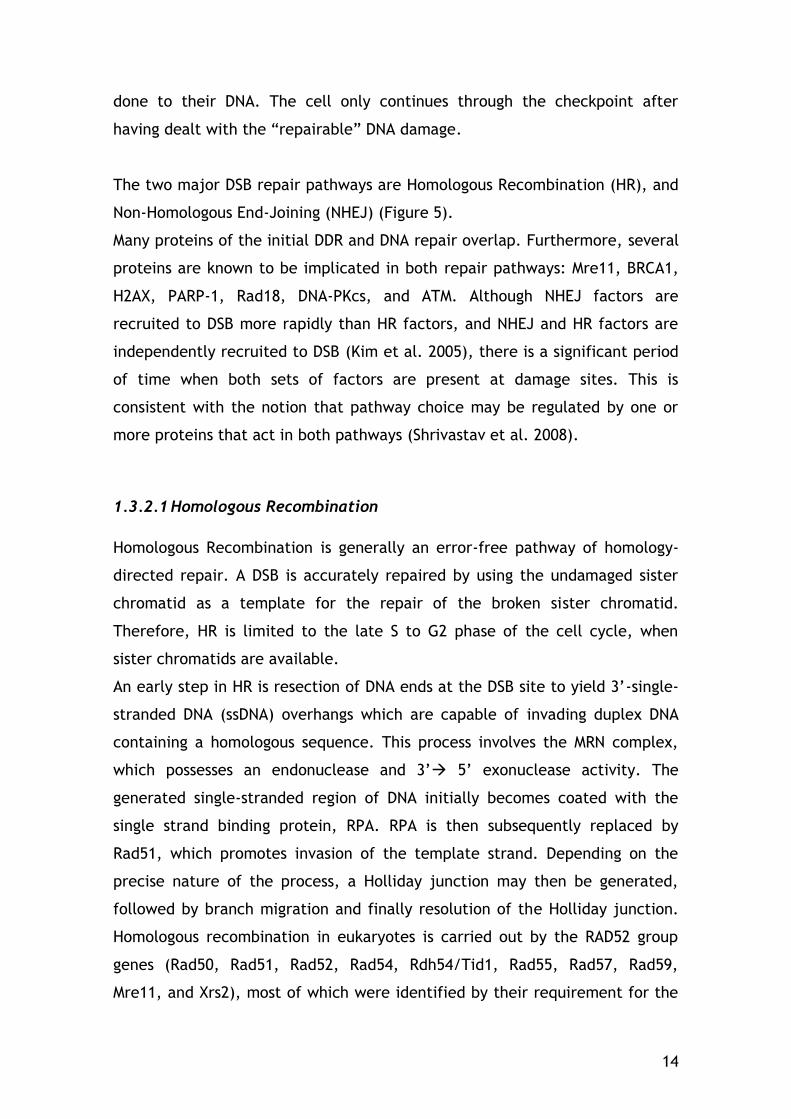
The two major DSB repair pathways are Homologous Recombination (HR), and
Non-Homologous End-Joining (NHEJ) (Figure 5).
Many proteins of the initial DDR and DNA repair overlap. Furthermore, several
proteins are known to be implicated in both repair pathways: Mre11, BRCA1,
H2AX, PARP-1, Rad18, DNA-PKcs, and ATM. Although NHEJ factors are
recruited to DSB more rapidly than HR factors, and NHEJ and HR factors are
independently recruited to DSB (Kim et al. 2005), there is a significant period
of time when both sets of factors are present at damage sites. This is
consistent with the notion that pathway choice may be regulated by one or
more proteins that act in both pathways (Shrivastav et al. 2008).
1.3.2.1 Homologous Recombination
Homologous Recombination is generally an error-free pathway of homology-
directed repair. A DSB is accurately repaired by using the undamaged sister
chromatid as a template for the repair of the broken sister chromatid.
Therefore, HR is limited to the late S to G2 phase of the cell cycle, when
sister chromatids are available.
An early step in HR is resection of DNA ends at the DSB site to yield 3’-single-
stranded DNA (ssDNA) overhangs which are capable of invading duplex DNA
containing a homologous sequence. This process involves the MRN complex,
which possesses an endonuclease and 3’ 5’ exonuclease activity. The
generated single-stranded region of DNA initially becomes coated with the
single strand binding protein, RPA. RPA is then subsequently replaced by
Rad51, which promotes invasion of the template strand. Depending on the
precise nature of the process, a Holliday junction may then be generated,
followed by branch migration and finally resolution of the Holliday junction.
Homologous recombination in eukaryotes is carried out by the RAD52 group
genes (Rad50, Rad51, Rad52, Rad54, Rdh54/Tid1, Rad55, Rad57, Rad59,
Mre11, and Xrs2), most of which were identified by their requirement for the
15
repair of ionizing radiation-induced DNA damage in Saccharomyces cerevisiae
(Symington 2002).
Figure 5 DNA DSB repair. Homologous recombination (part a) and non-homologous end joining (part b) (van Attikum & Gasser 2005).
The products of the breast cancer susceptibility genes, BRCA1 and BRCA2, are
also involved in the modulation of the homologous recombination. Brca2
functions in regulating Rad51 loading onto DNA and Brca1, also, most probably
plays a regulatory role in the process (P. Jeggo & Markus Löbrich 2006).
16
1.3.2.2 Non-Homologous End Joining
NHEJ is a repair pathway that does not require a homologous DNA template,
although short patches of homologous nucleotides (microhomologies of one or
a few base pairs) are frequently used to align the DNA ends (van Gent & van
der Burg 2007). The NHEJ pathway seems to be the main DSB repair pathway
in mammals (Roth & J. H. Wilson 1985) and is not restricted to a particular
phase in the cell cycle and hence DSB can be repaired via NHEJ throughout
the cell cycle (Takata et al. 1998).
NHEJ repair starts with the Ku complex (the heterodimer of Ku70 and Ku80)
recognizing and binding to the DSB ends of the damaged site (Mahaney et al.
2009). DNA-dependent protein kinase catalytic subunit (DNA-PKcs) is recruited
to DSB ends and becomes activated. Together, the Ku complex and DNA-PKcs
are referred to as DNA-PK. The activated DNA-PKcs phosphorylates itself as
well as several substrates including p53, the Ku complex, DNA Ligase
IV/XRCC4 (X-ray repair complementing defective repair in Chinese hamster
cells 4)(Drouet et al. 2005) and replication protein A (RPA) (Hongyan Wang et
al. 2001), all of which may facilitate end processing reactions (Roberts et al.
2010).
Since DSB can occur with a variety of different ends, a number of processing
enzymes may be required to repair breaks. Together with the Artemis
nuclease, DNA-PKcs can stimulate processing of the DNA ends (Hartlerode &
Scully 2009). End processing involves the removal of damaged or mismatched
nucleotides by nucleases and/or re-synthesis of ssDNA by DNA polymerases
Pol-mu and Pol-lambda DNA polymerases. The end processing step can be
skipped if DNA ends are compatible. It is particularly important when DSB
contain unligatable ends, because all DNA ligases, catalyze the formation of a
phosphodiester bond between 5’-phosphate and 3’-hydroxyl termini. DSB
located within heterochromatin require additional factors for their repair
prior to rejoining by NHEJ. For heterochromatic DSB, ATM phosphorylation of
Kap1 allows localised chromatin relaxation facilitating repair by NHEJ. This
process requires Artemis and the mediator proteins in addition to ATM (P.
Jeggo & Martin F Lavin 2009).
17
Finally, the compatible ends are rejoined by the DNA Ligase IV/XRCC4/XLF
complex (Grawunder et al. 1997; Mahaney et al. 2009).
1.3.2.3 Chromosomal aberrations – Erroneous DSB repair
The efficiency of the DNA damage repair processes determines the outcome
of the cell: most commonly, the structure of DNA is repaired correctly and
cellular functions return to normal. If repair is unsuccessful or incomplete
cells die. It has been established a direct link between radiation-induced
unrepaired DSB and cell death (N Foray et al. 1997). In the other hand, if DSB
repair is imprecise, cells suffer alteration and loss of genetic information seen
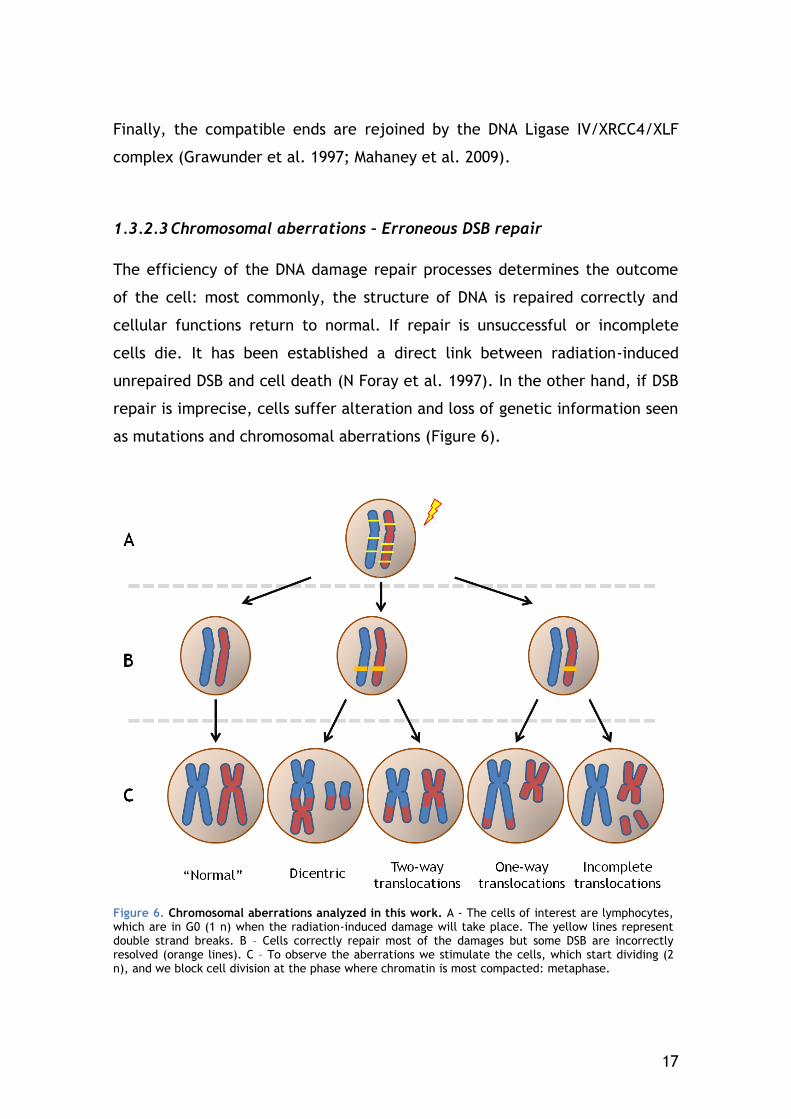
as mutations and chromosomal aberrations (Figure 6).
Figure 6. Chromosomal aberrations analyzed in this work. A - The cells of interest are lymphocytes, which are in G0 (1 n) when the radiation-induced damage will take place. The yellow lines represent double strand breaks. B – Cells correctly repair most of the damages but some DSB are incorrectly resolved (orange lines). C – To observe the aberrations we stimulate the cells, which start dividing (2 n), and we block cell division at the phase where chromatin is most compacted: metaphase.
18
The resulting translocations can activate oncogenes and lead to cancer
(Agarwal et al. 2006).
1.3.2.4 Radiation-induced cell death
Unrepaired or misrepaired DSB can lead to p53-mediated apoptosis or mitosis-
associated cell death (Kolesnick & Fuks 2003).
The p53 is activated by ATM directly or indirectly through Chk2
phosporylation. Apoptosis is a physiological process in which the cell initiates
a highly regulated and evolutionary conserved molecular program, resulting in
its own death.
An early event in apoptosis is the flipping of phosphatidylserine (PS) of the
plasma membrane from the inside surface to the outside surface. In the
experiments reported here, apoptotic cells were distinguished from their
intact counterparts using Annexin V, which is a phospholipid-binding protein
that binds selectively and with a high affinity to PS (D Vokurková et al. 2006).
A late apoptotic event is DNA fragmentation, during which gamma-H2AX focus
formation can occur (Emmy P Rogakou et al. 2000).
In dividing lymphocytes, exposure to ionizing radiation leads to mitotic death.
This phenomenon occurs as the result of incomplete or unsuccessful
segregation of chromosomes. This disturbance in chromosome segregation can
induce apoptosis in the mother (or daughter) cells. It can also induce the
formation of micronuclei (which are easily confused in terms of recognition,
with apoptotic fragments)(Potten & J. W. Wilson 2004).
1.4 Radiosensitivity
Radiosensitivity is the relative susceptibility of cells, tissues, organs or
organisms to the harmful effect of ionizing radiation. In this work, we focused
on radiosensitivity at two of these levels: Clinical radiosensitivity and Cellular
radiosensitivity.
19
1.4.1 Clinical Radiosensitivity
Radiotherapy is a very important non-surgical modality for the curative
treatment of cancer. With improved cancer cure rates, the intensity of the
side-effects becomes an increasingly important issue.
The clinical manifestations of radiosensitivity can be either acute (occurring
during or within weeks of treatment) or late (occurring 6 months to many
years later) radiation toxicity and are well documented. Acute effects are
usually reversible and occur in rapidly proliferating tissues, such as skin,
gastrointestinal tract and the haematopoietic system. Late side effects can be
permanent and typically occur in more slowly proliferating tissues, such as
kidney, heart and central nervous system. The pathogenesis includes fibrosis,
atrophy and vascular damage. Other important late normal tissue side effects
include hormone deficiencies, infertility and second malignancies. Generally,
no clear severity correlation between acute and late radiotherapy side-effects
has been found (Azria & Ozsahin 2009). Exceptions to this are some recent
aggressive treatments, involving unconventional fractionation protocols or
radiochemotherapy schedules (Dörr & Hendry 2001).
Exposure to therapeutic doses of ionizing radiation revealed an inter-
individual variability in terms of the intensity of normal tissue responses. In
this work the clinical reactions were determined in respect to acute
dysphagia, dermatitis and mucositis using the Common Terminology Criteria
for Adverse Events (CTCAE) scale, version 3.0, of the National Cancer
Institute. Patients were subdivided according to their total average acute
radiosensitivity. Patients without grade 3 dysphagia, mucositis or dermatitis
were assigned to group CTC1 (mild acute radiosensitivity), patients showing at
least two grade 3 toxicities were considered to be severely radiosensitive and
assigned to group CTC3. Patients showing only one grade 3 reaction were
considered as an intermediate category (moderate acute radiosensitivity;
group CTC2).
20
Although a number of factors, such as patient size and variation in dose
distribution, are believed to influence radiotherapy side-effects, it has been
estimated that up to 70% of the inter-individual differences in clinical
radiosensitivity may be due to genetic predisposition (Turesson et al. 1996).
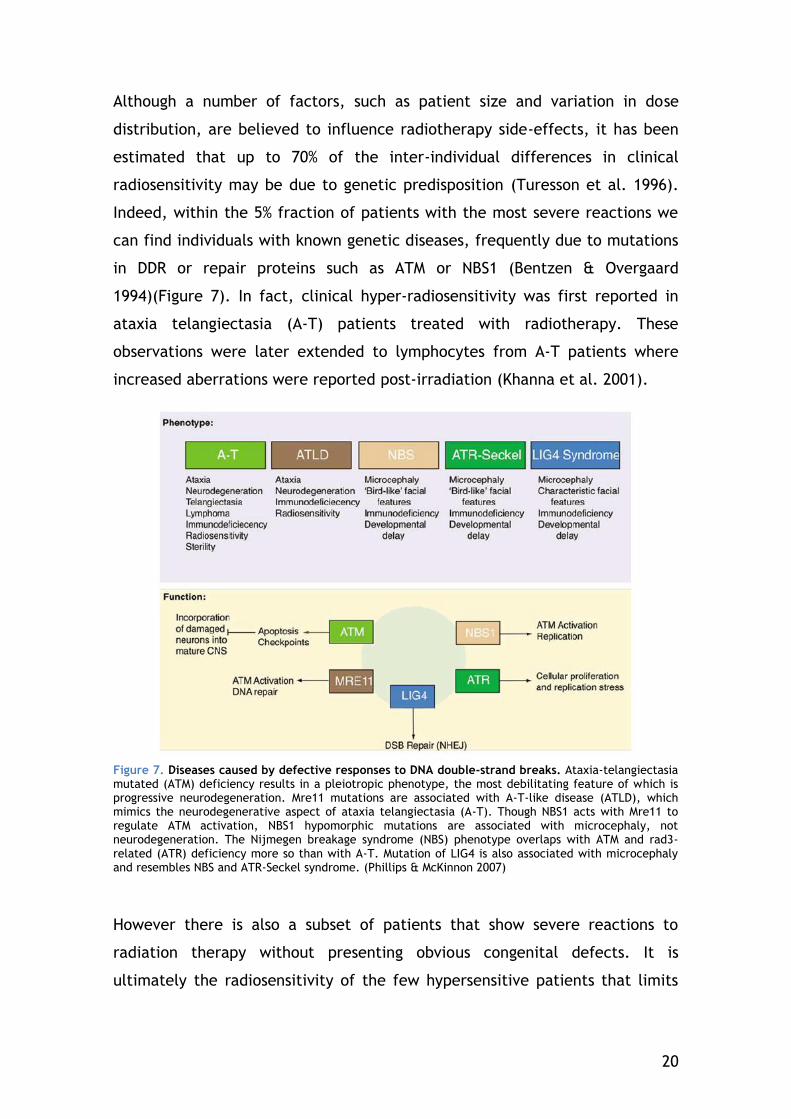
Indeed, within the 5% fraction of patients with the most severe reactions we
can find individuals with known genetic diseases, frequently due to mutations
in DDR or repair proteins such as ATM or NBS1 (Bentzen & Overgaard
1994)(Figure 7). In fact, clinical hyper-radiosensitivity was first reported in
ataxia telangiectasia (A-T) patients treated with radiotherapy. These
observations were later extended to lymphocytes from A-T patients where
increased aberrations were reported post-irradiation (Khanna et al. 2001).
Figure 7. Diseases caused by defective responses to DNA double-strand breaks. Ataxia-telangiectasia mutated (ATM) deficiency results in a pleiotropic phenotype, the most debilitating feature of which is progressive neurodegeneration. Mre11 mutations are associated with A-T-like disease (ATLD), which mimics the neurodegenerative aspect of ataxia telangiectasia (A-T). Though NBS1 acts with Mre11 to regulate ATM activation, NBS1 hypomorphic mutations are associated with microcephaly, not neurodegeneration. The Nijmegen breakage syndrome (NBS) phenotype overlaps with ATM and rad3-related (ATR) deficiency more so than with A-T. Mutation of LIG4 is also associated with microcephaly and resembles NBS and ATR-Seckel syndrome. (Phillips & McKinnon 2007)
However there is also a subset of patients that show severe reactions to
radiation therapy without presenting obvious congenital defects. It is
ultimately the radiosensitivity of the few hypersensitive patients that limits
21
our ability to increase the treatment dose in non-sensitive patients, which in
turn should increase local control and cure (Barnett et al. 2009).
Radiosensitivity syndromes illustrate that specific genes influence the
radiosensitivity of tissues and cells derived from them, but even cells cultured
from apparently normal populations present a wide range of cellular
radiosensitivities (Little et al. 1988). Therefore, much remains to be
discovered about the more moderate radiosensitivity cases and the influence
of other genes, not associated with these syndromes.
1.4.2 Cellular Radiosensitivity
Different cell types have distinct radiosensitivities. In general, it has been
found that cell radiosensitivity is directly proportional to the rate of cell
division and inversely proportional to the degree of cell differentiation.
Therefore, actively dividing cells or those not fully mature are most at risk
from radiation (Bergonie & Tribondeau 1906). The same cell type can also
vary in sensitivity to radiation depending on the phase of the cell cycle it was
going through at the moment it was exposed. Cells are least sensitive when in
the S phase, then the G1 phase, then G2 phase and the most sensitive in the
M phase of the cell cycle.
Historically, cell survival has been used as a reference endpoint for
determining the radiosensitivity status of the cell. The doses used in this
work, however, induce low levels of apoptosis in resting lymphocytes.
Therefore, we measured “radiosensitivity” by quantifying gamma-H2AX
response. This is important to mention because the degree of cellular
radiosensitivity can vary depending on the endpoint used to quantify the
response to radiation. Some cell types respond with higher intensity with one
endpoint but are considered less radiosensitive in experiments using different
endpoints. Using cell survival as the endpoint, B-lymphocytes are more
radiosensitive than T-lymphocytes, as their numbers decline more rapidly
even after relatively low doses (Prosser 1976). However, using gamma-H2AX
response as the measure of radiosensitivity, Andrievski and Wilkins found that
B-cells were the lymphocytes with the lowest response to radiation
22
(Andrievski & Wilkins 2009). This is logical if we consider that failure to
recognise and/or repair DNA lesions can negatively influence the survival of
the cell and, therefore increase its radiosensitivity status.
1.5 Radio-adaptive response
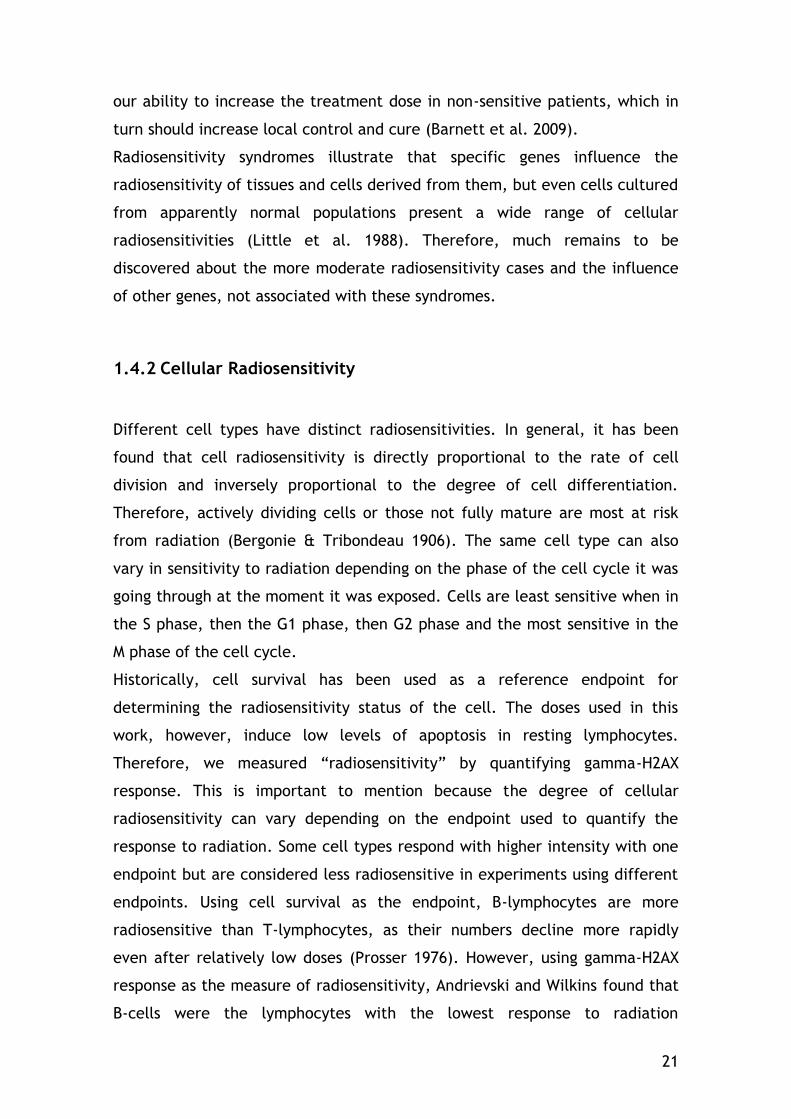
First described by Olivieri et al. (Olivieri et al. 1984), radio-adaptive response
(or radioadaptation) is defined as the reduced damaging effect of a
challenging radiation dose when induced by a previous low priming dose (or
conditioning dose). This damaging effect has been measured using various
biological endpoints in both in vitro and in vivo studies: cell lethality, gene
mutations, repetitive DNA loci mutations, chromosomal aberrations and
micronuclei induction, neoplastic transformation, microarrays showing gene
expression changes, DNA single- and double-strand breaks, biochemical
analyses of enzymatic and/or non-enzymatic antioxidant defence system
(Tapio & Jacob 2007; Dimova et al. 2008) (Figure 8).
Radio-adaptive response belongs to the group of non-targeted effects that do
not require direct exposure of the cell nucleus and is reported to be tightly
related to cellular responses such as a bystander effect, genetic instability,
and hyper-radiosensitivity (HRS) (Ojima et al. 2011; Matsumoto et al. 2009;
Joiner et al. 1996).
Figure 8. Some underlying mechanisms probably involved in radio-adaptive response. (Dimova et al. 2008)
Bystander effects are radiobiological effects in unexposed cells caused by
transferable factors. Genetic instability is defined as the delayed onset of de
23
novo aberrations and mutations or a delayed reproductive death; and
hypersensitivity is a change in the dose–effect relationship which occurs at
doses around 0.5 Gy.
An important factor that separates radio-adaptive response from these other
responses is that there are 2 exposures to radiation in radio-adaptive
response.
Although adaptive response seems to function by an on/off principle, it has
shown to have a high degree of inter- and intra- individual variability (Leal et
al. 1995; K. J. Sorensen et al. 2002). Extensively observed in lymphocytes,
radio-adaptive response is known to have considerable diversity in these cells:
in some cases lymphocytes show additive effects or no response at all.
Furthermore, the observation of this phenomenon seems to be restricted to
somewhat specific conditions: the range of the priming doses (from 0.005 to
0.2 Gy, depending on cell type), the range of the challenging doses (0.4 to 8
Gy, depending on cell type), the dose-rate, cell cycle stage at the moment of
the conditioning, and the time between the priming and challenge (K. J.
Sorensen et al. 2002; Stoilov et al. 2007). In most of the studies done in
lymphocyte radio-adaptive response both priming and challenging irradiations
were performed on PHA-stimulated cells. Mainly because the first attempts of
inducing this type of response in G0 cells were unsuccessful (Jeffery D Shadley
et al. 1987; J D Shadley 1994). This is important since most circulating
lymphocytes are in this stage of the cell cycle. Since then, a few publications
were able to show that this response could also be observed in resting
lymphocytes (Cramers et al. 2005). Moreover, there is some reason to believe
that this protective effect of a low priming exposure can take place in vivo (J
F Barquinero et al. 1995; Mohammadi et al. 2006).
These fractioned irradiation conditions have shown to decrease chromosomal
aberrations in lymphocytes. However, there is limited information regarding
the signalling of the DNA DSB that precedes this lower frequency of
chromosomal aberrations.
Low doses, as those generally used for priming have shown produce gamma-
H2AX signaled DSB that remain unrepaired for longer periods of time than
higher doses (Rothkamm & Markus Löbrich 2003).
24
Histone H2AX stabilizes broken DNA strands to suppress chromosome breaks
and translocations during V(D)J recombination (B. Yin et al. 2009), so it is
possible that gamma-H2AX signalling has changed in a radio adapted cell,
supposed to have less translocations.
In this thesis, this radio-adaptive response will be studied with a particular
focus on CD4-positive lymphocytes since these cells seem to have higher post-
irradiation gamma-H2AX signalling and genetic modulation. In our laboratory,
Gruel et al. found that 3 h after whole blood exposure to doses as low as 0.05
Gy, CD4-positive lymphocytes have several down-modulated genes - 10 times
more for than for all other subsets (Gruel et al. 2008). Many of these genes
were found to have a modified expression during the radio-adaptive response
to a challenge dose of 2 Gy after a priming dose of 0.05 Gy in lymphoblastoid
cells (Coleman et al. 2005).
1.6 Cell model used in this work: lymphocytes
Lymphocytes are a vital part of the humoral immune system. They can be
divided into different classes or subsets including T-lymphocytes and B-
lymphocytes. T-lymphocytes are involved in fighting intracellular infections,
cancer cells, and foreign tissue. B-lymphocytes are involved in the immune
response against bacterial and viral infections.
These lymphocyte subsets can be discerned by the antigenic properties of cell
surface (membrane) markers. B-lymphocytes are CD19-positive and T-
lymphocytes are CD3-positive. T-cells can be divided further: helper cells
(CD4-positive) and cytotoxic cells (CD8-positive).
As a reference, according to website of the Clinical Laboratory of the
University of Arkansas for Medical Sciences
(http://www.uams.edu/clinlab/flow.htm), the lymphocyte subset fractions
expected in a human peripheral blood sample are as follows: 8-16% of CD19-
positive cells, 64-82% of CD3-positive cells, 39-57% of CD4-positive cells and
17-31% of CD8-positive cells.
25
In a clinical context, peripheral blood lymphocytes (PBL) are a very attractive
test material. A blood sample containing considerable amounts of these cells
can be easily obtained in a standardized manner, with little medical
intervention or inconvenience for the donor/patient. As such, experiments on
PBL dominate the literature in comparison to any other normal tissues in
assessing DNA damage.
Most predictive assay research on normal tissues to date has been based on
the radiosensitivity of normal lymphocytes and skin fibroblasts. Using survival
as an endpoint, radiosensitivity of lymphocytes and fibroblasts from the same
individual do not correlate (Green et al. 1991). In general, the analysis of
lymphocytes appears to be more promising than studies using fibroblasts
(Markus Löbrich & Kiefer 2006).
Because radiosensitivity is dependent on cell cycle, for fibroblasts, this type
of studies has to be performed in non-dividing (confluent) cultures (Dikomey
& Brammer 2000). Lymphocytes constitute a sample of already non-
proliferating normal tissue cells within the body. Because they are in the G0
phase, variations in radiosensitivity as cells move though the cell cycle should
be avoided. This is an important advantage for the evaluation of gamma-H2AX
focus formation since it can occur not only in cells in which DSB have been
induced, but also in those undergoing DNA synthesis and mitosis (Furuta et al.
2003) or apoptotic DNA fragmentation (Emmy P Rogakou et al. 2000).
Resting lymphocytes are a viable model to study radiosensitivity since they
belong to a unique population of cells that can be killed by low irradiation
doses in the absence of mitosis (Woods & Lowenthal 1984).
However, different lymphocyte subsets have different radiosensitivities,
which constitutes a possible source of variability. Using cell survival as the
endpoint, B-lymphocytes are more radiosensitive than T-lymphocytes, as their
numbers decline more rapidly even after relatively low doses (Prosser 1976).
However, the T lymphocytes are a heterogeneous group made out of different
subsets. CD8-positive T lymphocytes are twice as radiosensitive as CD4-
positive T-lymphocytes. And B-cells have actually an intermediate
radiosensitivity in terms of survival (Stewart et al. 1988). This highlights the
26
importance of discriminating the response to radiation of different subsets to
decrease the heterogeneity of the results.
In this thesis, we discriminated subset response to determine if one of them
had a particularly high response to low doses or better correlation with
clinical radiosensitivity.
27
2 OBJECTIVES OF THIS WORK
Although much is known about the quantitative effects of exposure to
ionising radiation, considerable uncertainties and divergent views remain
about the health effects at low doses. The importance of low dose risk
research is now recognised globally. It is accepted that there is much
uncertainty on the shape of the dose-response for cancer derived from
epidemiological studies below doses of 0.1 Gy and on the cellular mechanisms
that determine the response, including the potential roles of non-targeted
processes and of radiation sensitivity. Therefore, many questions about the
effects of low-dose exposure to radiation remain unanswered and, in this
context, a tool which has to meet numerous requirements is hardly needed:
(i) able to detect DSB -highly misrepair-prone cellular damages, (ii) very
sensitive with very low detection threshold, (iii) able to underline non-
targeted effects such as bystander or radio-adaption, (iv) able to underline
inter-individual radiosensitivity.
Recently, gamma-H2AX foci have been used as a biomarker for
radiation-induced effects. When the gamma-H2AX foci which mark the DSB
are stained, individual foci are detectible, making the assay suitable for
studies requiring great sensitivity. Notably, this biomarker has been used in
cell lines to detect doses of ionizing radiation as low as 0.001 Gy. The gamma-
H2AX assay is also able to take into account the radiation sensitivity not
available with physical modelling. Actually, it has been shown that
lymphocytes from patients with clinical radiosensitivity show unusual residual
gamma-H2AX foci after low-dose medical exposure to IR. This latter effect
could allow determining the radiosensitivity of individuals but is however
rather low and is the result of a mix of the different lymphocyte subtype
responses. By isolating the most sensitive lymphocyte subtype, this would
expand a specific lymphocyte response; the gamma-H2AX assay could
therefore be a very sensitive marker of radiation sensitivity.
Originally, the aim of this work was to develop an in vitro assay able
to evaluate individual radiation sensitivity in human peripheral
lymphocytes by using gamma-H2AX quantification. This assay needed to be
both sensitive and fast enough to be used on a large scale.
28
In the interest of sensitivity gamma-H2AX response was measured by
scoring individual foci in microscope images instead of quantifying the general
cellular response by a flow cytometry approach. Furthermore, in order to
isolate a potentially specific low-dose effect, the gamma-H2AX response was
analysed not only by considering the general lymphocyte population but also
by discriminating specific lymphocyte subsets. To allow future clinical
applications of this microscopy approach, the image acquisition and focus
scoring steps were automated. This not only increases the speed of the results
but also insures that there is no operator bias during focus scoring.
To reach our objective, this gamma-H2AX quantification assay had to
be tested in lymphocytes of a large cohort of individuals with characterized
clinical radiosensitivity. In mid 2008 we worked on samples from Belgian
radiotherapy patients of known clinical acute radiosensitivity. We felt that a
whole blood context was important to study doses known to induce non-
targeted responses. However, when working with whole blood instead of
isolated lymphocytes we were faced with complications due to sample aging
before processing. To establish a sensitive and fast gamma-H2AX protocol to
study low-dose responses in whole blood, changes were made to guarantee
the viability of the blood sample. The improved protocol was validated by
comparison with manual and semi-automated focus scoring. Furthermore, the
gamma-H2AX response of different lymphocyte subsets was characterized
after low doses of gamma-irradiation and was compared to the response
observed in the general lymphocyte population.
In view of the difficulties found in obtaining additional blood
samples from radiotherapy donors in France for a more complete study,
the initial work plan was reoriented. Consequently we focused in
lymphocyte gamma-H2AX signalling in another context of different
radiosensitivity: radio-adaptive response. This adaptive response can be
seen as a decrease in radiosensitivity due to a pre-exposure to a low dose.
Therefore, instead of discriminating clinical radiosensitivity, we would
determine if changes in cellular radiosensitivity seen using other endpoints
such as chromosome aberrations and apoptosis were detectable by our
gamma-H2AX assay. Given that we observed the highest radiation-induced
29
gamma-H2AX signalling in CD4-positive lymphocytes, we focused on this
subset to study the radio-adaptive response. Our aim was to determine the
potential of CD4-positive lymphocytes in distinguishing radiosensitivity
through the gamma-H2AX assay.
30
3 MATERIALS AND METHODS
3.1 Sample Collection
For the individual radiosensitivity study, the blood samples were collected
from 27 individuals treated for histologically confirmed head and neck
squamous cell carcinoma (HNSCC) at the Ghent University Hospital. The blood
samples were collected in heparin during the periodical medical examination
in the follow-up of the treatment and were sent to Fontenay-aux-Roses
(France) to be processed 24 to 48 h later. This study was approved by the
Ethics Committee of Ghent University Hospital.
For the other series of experiments, the blood was collected in citrate from
healthy volunteers by the "Etablissement Français du Sang" (EFS) which
obtained written informed consent for all donors, according to the agreement
between EFS and IRSN (reference n° 10/EFS/056). EFS provided to IRSN the
anonymous blood samples used for this study in accordance with French law
(L. 2004-800) on bioethics. Transportation from the medical centre to the lab
was done at ambient temperature and did not exceed one hour.
3.2 Irradiation Conditions
For the individual radiosensitivity study (Ghent), the whole blood samples
were irradiated without dilution upon reception.
For all other experiments, the blood was diluted (1:1) with Roswell Park
Institute medium (RPMI) with L-glutamine, unless stated otherwise. The blood
used to characterize and validate our protocol was sampled close to our lab.
The blood was routinely diluted 1:1 with RPMI and L-glutamine shortly after
sampling.
31
The samples were irradiated in Falcon tubes for samples with a volume of 50
mL or below. Samples with a volume above 50 mL were irradiated in culture
flasks. All irradiations were performed at room temperature, at the IRSN site
of Fontenay-aux-Roses. Two gamma sources were used in this work: cesium-
137 and cobalt-60.
3.2.1 Irradiations with a cesium-137 gamma source
The irradiator (IBL637, CisBio, France) can be easily handled by any operator
formed in radioprotection. However it has the inconvenient of being more
limited in the dose-rates range. For the Ghent experiments and the samples
used to validate automated scoring, the cesium-137 source at a dose rate of
0.5 Gy per min was used. Doses ranged from 0.05 Gy up to 0.5 Gy.
3.2.2 Irradiations with a cobalt-60 gamma source
The following experiments were performed with a Cobalt-60 irradiator
(ICO4000) with a dose-rate of 0.05 Gy per min. This alternative offered a
more precise estimation of the delivered dose, particularly important for
procedures involving doses as low as 0.005 Gy.
For the adaptive response studies the Cobalt-60 source was also used, but
with a dose rate of 0.5 Gy per min to avoid 40-min exposures (for 2 Gy and
2.05 Gy).
3.3 Gamma-H2AX assay
3.3.1 Sample processing
After irradiation the blood was incubated at 37°C for a period of time of 30
min, 3 h, 5 h or 24 h. The blood samples were immerged in ice immediately
after incubation to reduce gamma-H2AX signalling variations and DNA repair.
The cold blood was carefully layered onto cold Ficoll-Histopaque and
32
centrifuged at 1000 g for 20 min at 0°C. The lymphocytes from the interphase
were transferred and washed three times with cold phosphate buffered saline
(PBS) at 400 g for 8 min at 0°C. The lymphocytes were then resuspended in
PBS and spotted in DakoPen® (Dako, Glostrup, Denmark) circles of a fixed
diameter onto Superfrost® (Menzel-Glaser, Braunschweig, Germany) slides for
adhesion at 0°C. After an adhesion period of 30 min the cells were
immediately fixed in 1% PFA for 10 min at room temperature and washed
thoroughly in PBS.
3.3.2 Slide preservation
3.3.2.1 Samples from Ghent University
For the Ghent experiments, many samples arrived at a time when we were
experiencing batch quality issues with the anti-gamma-H2AX antibody.
Therefore, the adherent lymphocytes had to be dried and stored at -20°C for
long-term preservation (up to 3 months) before staining.
After gamma-H2AX staining, only 9 samples produced images acceptable for
analysis, two of which were CTC3 and the 7 others were CTC1 and 2.
3.3.2.2 Samples used in all remaining experiments
The adherent lymphocytes were preserved in PBS at 4°C for 1 to 7 days before
staining.
3.3.3 Immunofluorescence staining
Adherent cells were permeabilized in PBS + 0.1% Triton X-100 for 10 min.
After two short PBS washes, the cells were blocked in PBS with 20% goat
serum for 30 min at room temperature. Slides were incubated with
monoclonal anti-H2AX Phosphorylated (Ser139) antibody (1:500 dilution,
BioLegend, San Diego, CA, USA) for 60 min, washed in PBS for 5 min, and
incubated with Texas Red X conjugated goat anti-mouse secondary antibody
(1:1500) for 60 min, all at room temperature.
33
For CD3-specific (cluster of differentiation 3) staining the slides were
incubated with AlexaFluor® 647-coupled anti-human CD3 (1:100 dilution) (BD
Pharmingen, Franklin Lakes, NJ, USA) for 30 min. For other CD-specific
staining (CD4, CD8 and CD19), FITC-coupled and Cy5-coupled antibodies were
used, from the same manufacturer and at the same dilution.
Finally, the slides were washed in PBS for 10 min and mounted with cover
slips; DAPI Prolong® Gold solution was used according to the manufacturer's
instructions.
All the experiments that have been quantitatively compared were done using
reagents from the same batches to minimise inter-experiment variations.
3.3.4 Image Acquisition and Processing
Slides were viewed with an epifluorescence microscope (Imager.Z1, Carl
Zeiss, Oberkochen, Germany) equipped with a non-cooled CCD (charge-
coupled device) camera and an external fluorescence light source (EL6000,
Leica, Solms, Germany). We chose to use an alignment-free light source to
minimise illumination calibration issues. The automated image acquisition
used Metafer 4 software (version 3.6.0, from MetaSystemsTM, Altlussheim,
Germany), which controlled the motorized microscope slide plate, filters, and
digital camera. The different cell spot coordinates were noted and, for each
spot, a grid of non-overlapping fields was selected for acquisition with the
basic function "compute coordinates". Depending on the average cell density,
100 to 250 fields of each spot were selected and acquired by the Metafer
Autocapt module, using an immersion plan Apochromat oil 63x objective (Carl
Zeiss). To compile all of the 3-dimensionally distributed gamma-H2AX foci
throughout the lymphocyte nuclei in one image, the Autocapt classifier was
programmed to acquire 26 2D images for each field, with a 0.3 µm z-axis step
between two slices.
To avoid loss of information, the images were not overexposed. Acquisition
programs like Autocapt prevent overexposure when capturing images with an
automatic exposure time. However, to perform rigorous comparisons, the
34
integration times chosen by the program were fixed and kept constant
throughout the acquisition of all doses, including 0.5 Gy.
The resulting fields of view (FOV) were transformed into training images (TRN)
with the "Create TRN from FOV" command to allow each colour channel to be
exported as an individual greyscale tiff file.
All the steps described above from sample collection to image acquisition
were shared by all the subsequent methods of analysis used.
3.3.5 Image Analysis
Both manual and automatic focus scoring were performed in uncompressed
high-quality images. The manual scoring was done by 3 operators that were
unaware of the doses corresponding to the images they were analysing. Each
person counted a minimum of 150 foci or 250 cells per condition. The
operators were told to consider every focus that they could discriminate from
the background regardless of their intensity. For the automatic detection, two
different programs were used: the commercial software HistoLabTM (version
7.5.2, Microvision Instruments, Evry, France) and the free cell image analysis
software, CellProfiler (version 2.0, Broad Institute, MA, USA).
The specific settings used for both HistoLabTM and CellProfiler are supplied in
the annexed material. All image analysis parameters were kept constant
throughout the duration of this study. This protocol was used in the published
article of Valente and colleagues (M. Valente et al. 2011)
3.4 FISH-3 assay
3.4.1 Sample processing
CD4-positive lymphocytes were separated from the whole blood during
recovery by density gradient using the RosetteSep Human CD4-positive cell
Enrichment Cocktail (StemCell Technologies, Grenoble, France).
35
Dynabeads® Human T-Activator CD3⁄CD28 for cell expansion and activation
(Invitrogen) were used to stimulate the isolated CD4-positive lymphocytes
during a 72-hour incubation at 37°C.
Colcemid (KaryoMAX, Invitrogen, France) was added to a final concentration
of 0.1 μg/ mL and the cultures were continued for 2 h. After harvesting, the
cells were treated by hypotonic shock (0.075 M KCl, Sigma, USA) for 8 min at
37°C and were fixed three times in 10 mL methanol:acetic acid mixture (3:1,
v/v). Cells were dropped onto clean slides, air-dried and kept at -20°C until
preparation of slides for analysis by FISH methods.
Simultaneously, 500 μL of whole blood from the same donor was stimulated
with phytohemagglutinin (PHA, Invitrogen, France) and incubated for 46 h.
3.4.2 FISH-3 painting
FISH-3 was performed on freshly spread slides containing metaphases and
incubated overnight at 37°C. Slides were pretreated with 0.05% pepsin
(Roche, Switzerland) for 10 min at 37°C and subsequently washed in PBS
(Invitrogen, France) for 5 min. They were incubated in a post-fixation
solution, 1% formaldehyde (VWR, France) and 50 mM MgCl2 (Sigma, USA) in 1X
PBS for 10 min at room temperature, and then washed in PBS for 5 min. After
dehydration (70, 90, 100% ethanol for 2 min each), the slides were denatured
for 2 min in 70% formamide (VWR, France) at 65°C, dehydrated (70, 90, 100%
ethanol for 2 min each), and air-dried. Commercial whole chromosome probes
for chromosome 2 (mix FITC:Cy3, Cambio, UK), chromosome 4 (Cy3, Cambio,
UK), and chromosome 12 (FITC, Cambio, UK) were denatured for 10 min at
65°C and then incubated for 30 min at 37°C. Slides were hybridized overnight
at 37°C before washing in 50% formamide at 45°C for 5 min and three times in
4X SSC plus 0.05% Tween at 45°C for 4 min.
Chromosomes were counterstained using DAPI/Antifade solution (Qbiogene,
USA).
36
Fluorescent images were captured with a Zeiss Axioplan epifluorescent
microscope connected to the ISIS/M-FISH imaging system (MetaSystems,
Germany).
3.4.3 Chromosome aberration scoring
Normal human metaphases have 46 chromosomes. To speed up the scoring
process, the exact number of chromosomes was not checked. Therefore, any
metaphase containing approximately 46 chromosomes was scored. Cells with
dicentrics, rings or fragments were included in the scoring but only
aberrations containing painted chromosomes were considered. We considered
total translocations as the sum of apparently simple two-way and one-way
translocations. Metaphases suspected to be a clone were eliminated, to avoid
clonal cell bias. For CD4-positive lymphocytes from one individual we were
able to score: 396 metaphases for the 0 Gy, 1290 for 0.05+2Gy and 1512 for
the 2.05Gy condition. Protocol based on the work of Pouzoulet and colleagues
(Pouzoulet et al. 2007).
3.5 Apoptosis assay
The apoptosis assay started with a red blood cell lysis: for each condition, 4
mL of RPMI-diluted blood was diluted in 40mL of lysis buffer (NH4Cl 8.32g/L,
NaHCO3 1g/L, Na4EDTA 0.037g/L) and incubated in ice for 30 min. All the
manipulations that followed were performed at 0°C unless stated otherwise.
The samples were centrifuged for 8 min at 350g and the resulting pellet was
resuspended in 10 mL of a PBS/1%BSA (v/m) solution and transferred to a
FACS tube. The cells were then washed three times by repeating the previous
step. After the final centrifugation, the pellet of each condition was
resuspended in 350µL of the PBS/1%BSA (v/m) solution.
IGg1 FITC was used as a stainning negative control in a separate tube at a
concentration of 3:20. In the test tubes, FITC-coupled anti-human CD4 (1:20
dilution) (BD Pharmingen) was added to the cells for a 10-min incubation at
37
room temperature and in the dark. The cells were washed with 2ml de PBS
per tube and concentrated with a 8-min centrifugation at 350g. The
supernatant was discarded and the pallet was diluted in 100µL of annexin
buffer per tube (10mM HEPES, 140mM NaCl, 2.5mM CaCl2, pH 7.4). 5 µL of
annexine V was added to each tube to incubate for 15 min at room
temperature and in the dark. After adding 400µL of annexine V buffer + PI
(1µg/mL) the tubes were kept on ice, awaiting flow cytometry analysis. The
cells were analyzed using a FACSort (Becton Dickinson).
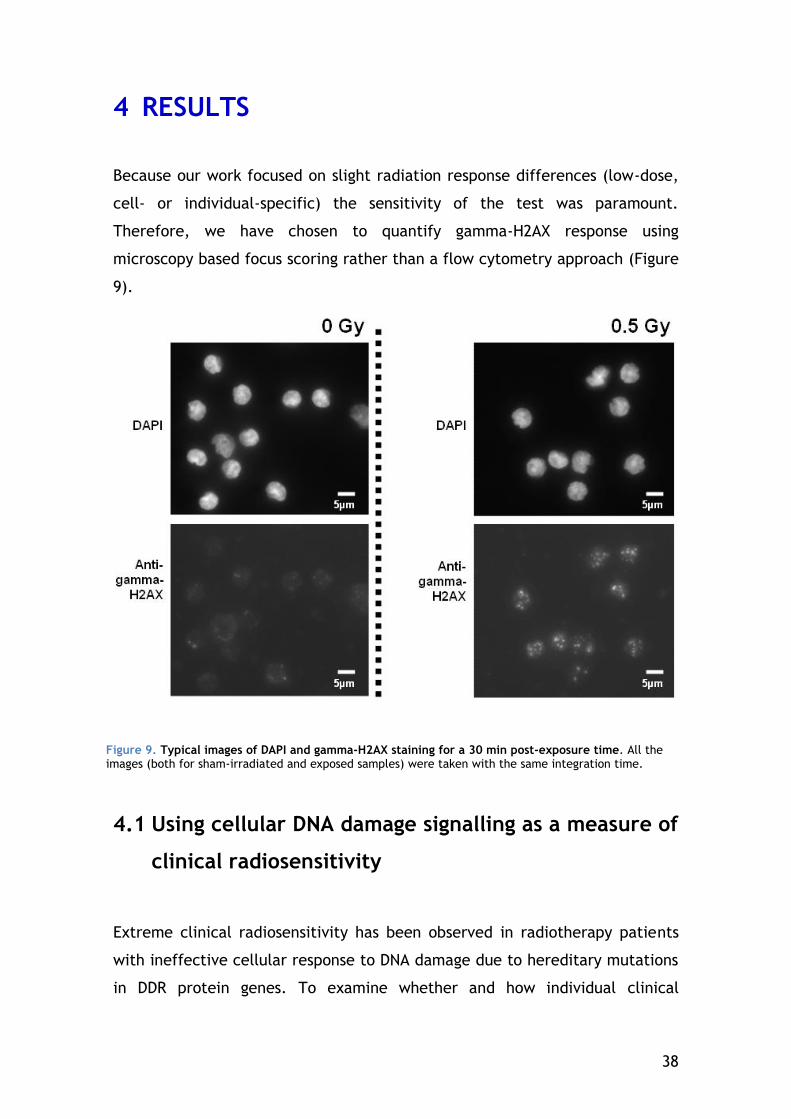
38
4 RESULTS
Because our work focused on slight radiation response differences (low-dose,
cell- or individual-specific) the sensitivity of the test was paramount.
Therefore, we have chosen to quantify gamma-H2AX response using
microscopy based focus scoring rather than a flow cytometry approach (Figure
9).
4.1 Using cellular DNA damage signalling as a measure of
clinical radiosensitivity
Extreme clinical radiosensitivity has been observed in radiotherapy patients
with ineffective cellular response to DNA damage due to hereditary mutations
in DDR protein genes. To examine whether and how individual clinical
Figure 9. Typical images of DAPI and gamma-H2AX staining for a 30 min post-exposure time. All the images (both for sham-irradiated and exposed samples) were taken with the same integration time.
39
radiosensitivity is related to cellular DNA damage response we irradiated ex
vivo samples from individuals of known clinical radiosensitivity. The intensity
and kinetics of the resulting cellular DNA damage signaling was determined
using gamma-H2AX focus scoring to verify if this response varied with clinical
radiosensitivity.
In mid 2008 we worked on samples from Belgian radiotherapy patients of
known clinical acute radiosensitivity. The clinical reactions were determined
in respect to acute dysphagia, dermatitis and mucositis using the CTCAE scale.
In order of increasing clinical radiosensitivity: 8 patients were CTC1, 10 were
CTC2 and 9 were CTC3. Blood from the 27 individuals was sampled at Ghent
and treated (irradiated then incubated at 37ºC) 24 to 48 h later at Fontenay-
aux-Roses, France. Gamma-H2AX foci were scored at different times post-
irradiation to determine if this DSB signalling peaked (30 min) or evolved
during repair (180 and 300 min) differently between the CTC groups. Samples
from the same donors had been used by a Gent University lab (Werbrouck et
al. 2011). After irradiating isolated T-lymphocytes, Werbrouck et al. found no
difference in intensity or kinetics of gamma-H2AX signaling. Based in the
previous observations of Löbrich et al. (Markus Löbrich et al. 2005) it was
hypothesized that irradiating whole blood could reveal responses to radiation
that are not observed when irradiating isolated T-lymphocytes. Therefore, we
repeated their experiments but irradiated whole blood, to come closer to the
in vivo cellular context.
After gamma-H2AX staining, only 9 samples produced images acceptable for
analysis, two of which were CTC3 and the 7 others were CTC1 and 2.
4.1.1 Gamma-H2AX signalling kinetics of individuals with different clinical responses to radiation
The basal levels of gamma-H2AX in sham-irradiated samples are similar
whatever the clinical radiosensitivity or time of analysis: a mean of 0.45 foci
per cell (between 0.37 and 0.51) (Figure 10). Furthermore, there is no clear
difference between the CTC1/2 group (low and mild clinical acute
radiosensitivity) and the CT3 group (higher clinical radiosensitivity) in terms
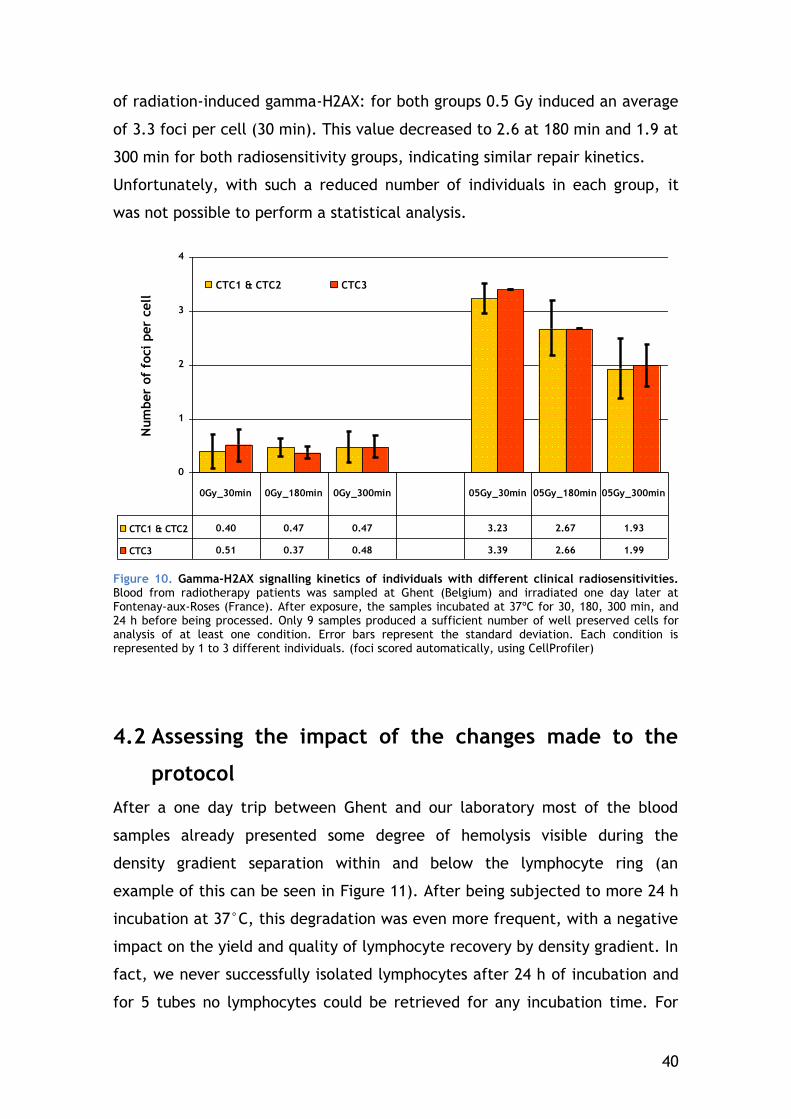
40
of radiation-induced gamma-H2AX: for both groups 0.5 Gy induced an average
of 3.3 foci per cell (30 min). This value decreased to 2.6 at 180 min and 1.9 at
300 min for both radiosensitivity groups, indicating similar repair kinetics.
Unfortunately, with such a reduced number of individuals in each group, it
was not possible to perform a statistical analysis.
0
1
2
3
4
Num
ber
of
foci
per
cell
CTC1 & CTC2 CTC3
CTC1 & CTC2 0.40 0.47 0.47 3.23 2.67 1.93
CTC3 0.51 0.37 0.48 3.39 2.66 1.99
0Gy_30min 0Gy_180min 0Gy_300min 05Gy_30min 05Gy_180min 05Gy_300min
Figure 10. Gamma-H2AX signalling kinetics of individuals with different clinical radiosensitivities. Blood from radiotherapy patients was sampled at Ghent (Belgium) and irradiated one day later at Fontenay-aux-Roses (France). After exposure, the samples incubated at 37ºC for 30, 180, 300 min, and 24 h before being processed. Only 9 samples produced a sufficient number of well preserved cells for analysis of at least one condition. Error bars represent the standard deviation. Each condition is represented by 1 to 3 different individuals. (foci scored automatically, using CellProfiler)
4.2 Assessing the impact of the changes made to the
protocol
After a one day trip between Ghent and our laboratory most of the blood
samples already presented some degree of hemolysis visible during the
density gradient separation within and below the lymphocyte ring (an
example of this can be seen in Figure 11). After being subjected to more 24 h
incubation at 37°C, this degradation was even more frequent, with a negative
impact on the yield and quality of lymphocyte recovery by density gradient. In
fact, we never successfully isolated lymphocytes after 24 h of incubation and
for 5 tubes no lymphocytes could be retrieved for any incubation time. For
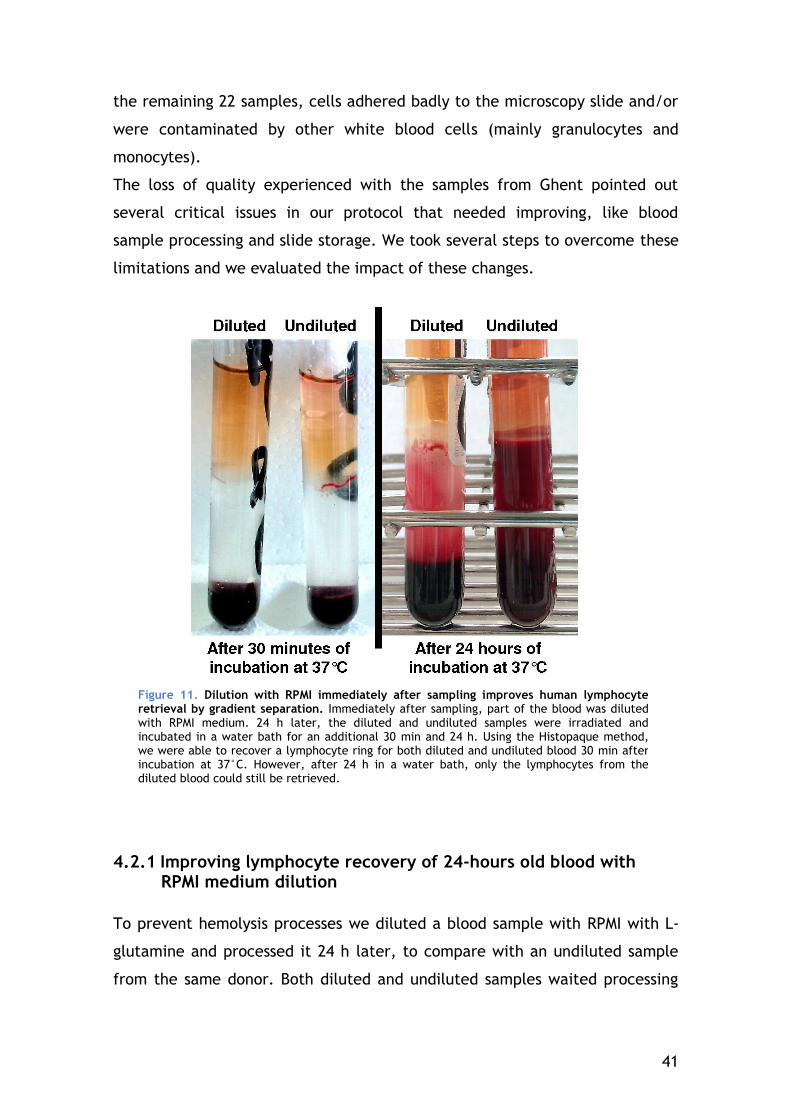
41
the remaining 22 samples, cells adhered badly to the microscopy slide and/or
were contaminated by other white blood cells (mainly granulocytes and
monocytes).
The loss of quality experienced with the samples from Ghent pointed out
several critical issues in our protocol that needed improving, like blood
sample processing and slide storage. We took several steps to overcome these
limitations and we evaluated the impact of these changes.
4.2.1 Improving lymphocyte recovery of 24-hours old blood with RPMI medium dilution
To prevent hemolysis processes we diluted a blood sample with RPMI with L-
glutamine and processed it 24 h later, to compare with an undiluted sample
from the same donor. Both diluted and undiluted samples waited processing
Figure 11. Dilution with RPMI immediately after sampling improves human lymphocyte retrieval by gradient separation. Immediately after sampling, part of the blood was diluted with RPMI medium. 24 h later, the diluted and undiluted samples were irradiated and incubated in a water bath for an additional 30 min and 24 h. Using the Histopaque method, we were able to recover a lymphocyte ring for both diluted and undiluted blood 30 min after incubation at 37°C. However, after 24 h in a water bath, only the lymphocytes from the diluted blood could still be retrieved.
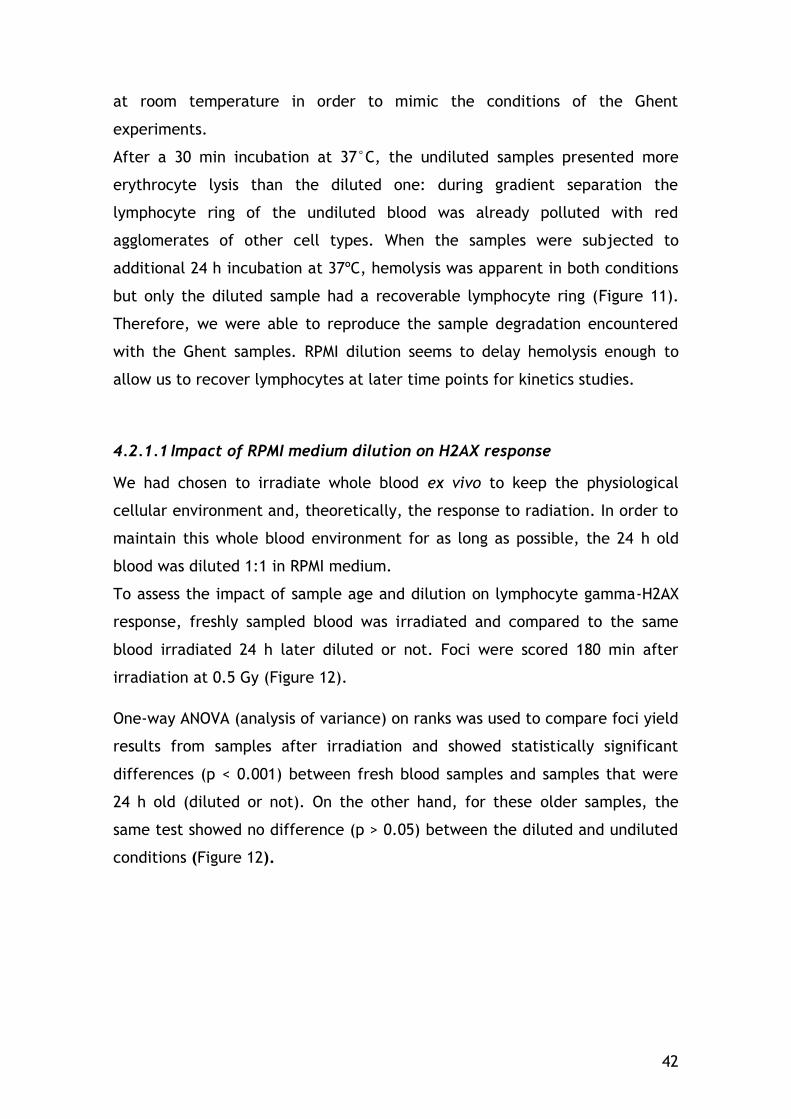
42
at room temperature in order to mimic the conditions of the Ghent
experiments.
After a 30 min incubation at 37°C, the undiluted samples presented more
erythrocyte lysis than the diluted one: during gradient separation the
lymphocyte ring of the undiluted blood was already polluted with red
agglomerates of other cell types. When the samples were subjected to
additional 24 h incubation at 37ºC, hemolysis was apparent in both conditions
but only the diluted sample had a recoverable lymphocyte ring (Figure 11).
Therefore, we were able to reproduce the sample degradation encountered
with the Ghent samples. RPMI dilution seems to delay hemolysis enough to
allow us to recover lymphocytes at later time points for kinetics studies.
4.2.1.1 Impact of RPMI medium dilution on H2AX response
We had chosen to irradiate whole blood ex vivo to keep the physiological
cellular environment and, theoretically, the response to radiation. In order to
maintain this whole blood environment for as long as possible, the 24 h old
blood was diluted 1:1 in RPMI medium.
To assess the impact of sample age and dilution on lymphocyte gamma-H2AX
response, freshly sampled blood was irradiated and compared to the same
blood irradiated 24 h later diluted or not. Foci were scored 180 min after
irradiation at 0.5 Gy (Figure 12).
One-way ANOVA (analysis of variance) on ranks was used to compare foci yield
results from samples after irradiation and showed statistically significant
differences (p < 0.001) between fresh blood samples and samples that were
24 h old (diluted or not). On the other hand, for these older samples, the
same test showed no difference (p > 0.05) between the diluted and undiluted
conditions (Figure 12).
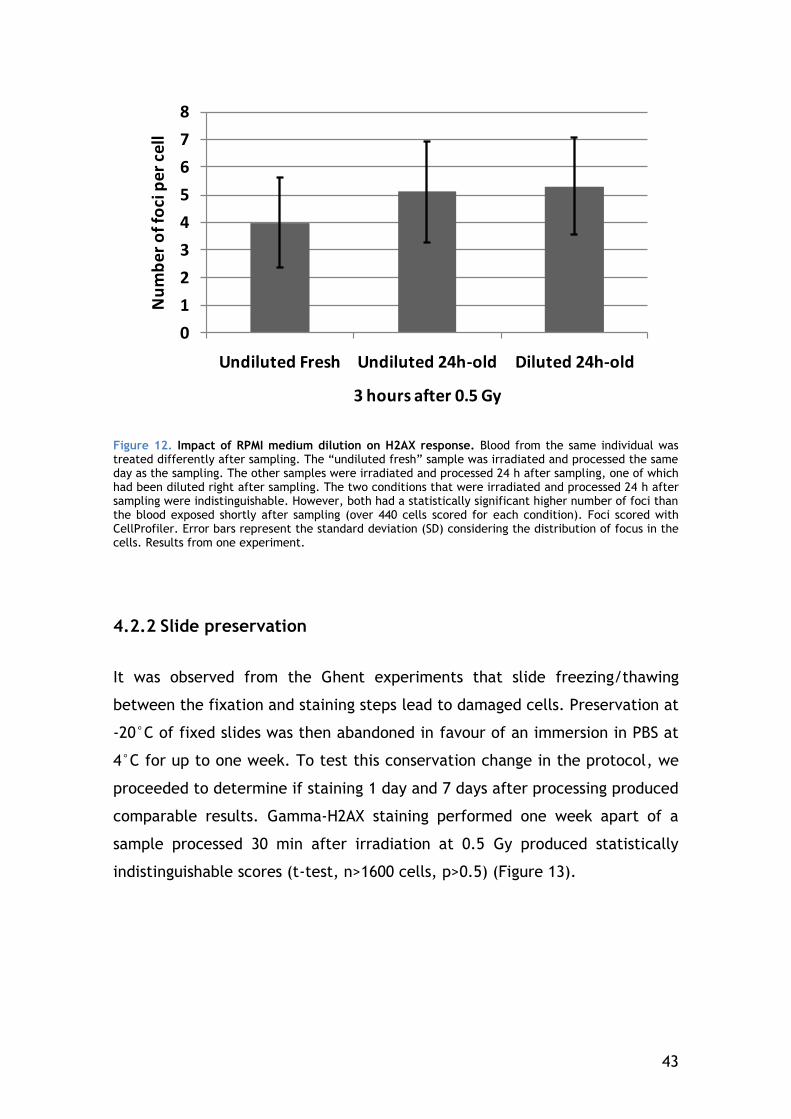
43
0
1
2
3
4
5
6
7
8
Undiluted Fresh Undiluted 24h-old Diluted 24h-old
Nu
mb
er
of
foci
pe
r ce
ll
3 hours after 0.5 Gy
Figure 12. Impact of RPMI medium dilution on H2AX response. Blood from the same individual was treated differently after sampling. The “undiluted fresh” sample was irradiated and processed the same day as the sampling. The other samples were irradiated and processed 24 h after sampling, one of which had been diluted right after sampling. The two conditions that were irradiated and processed 24 h after sampling were indistinguishable. However, both had a statistically significant higher number of foci than the blood exposed shortly after sampling (over 440 cells scored for each condition). Foci scored with CellProfiler. Error bars represent the standard deviation (SD) considering the distribution of focus in the cells. Results from one experiment.
4.2.2 Slide preservation
It was observed from the Ghent experiments that slide freezing/thawing
between the fixation and staining steps lead to damaged cells. Preservation at
-20°C of fixed slides was then abandoned in favour of an immersion in PBS at
4°C for up to one week. To test this conservation change in the protocol, we
proceeded to determine if staining 1 day and 7 days after processing produced
comparable results. Gamma-H2AX staining performed one week apart of a
sample processed 30 min after irradiation at 0.5 Gy produced statistically
indistinguishable scores (t-test, n>1600 cells, p>0.5) (Figure 13).
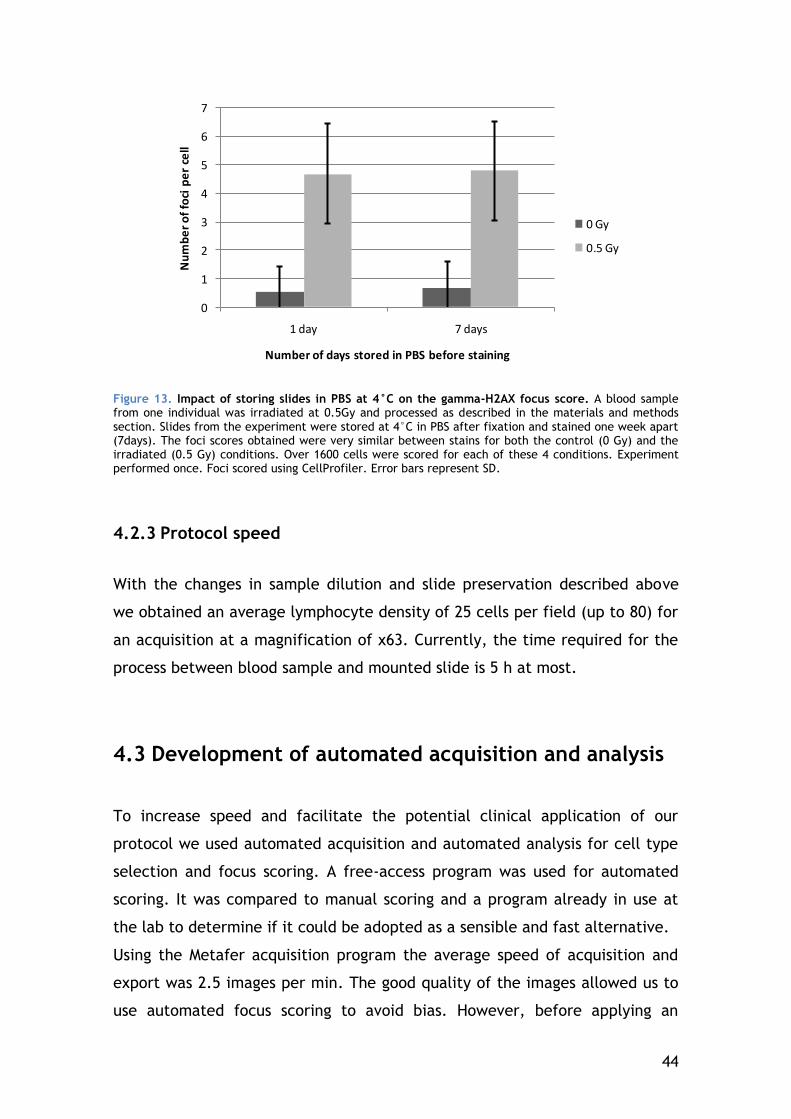
44
0
1
2
3
4
5
6
7
1 day 7 days
Nu
mb
er
of
foci
pe
r ce
ll
Number of days stored in PBS before staining
0 Gy
0.5 Gy
Figure 13. Impact of storing slides in PBS at 4°C on the gamma-H2AX focus score. A blood sample from one individual was irradiated at 0.5Gy and processed as described in the materials and methods section. Slides from the experiment were stored at 4°C in PBS after fixation and stained one week apart (7days). The foci scores obtained were very similar between stains for both the control (0 Gy) and the irradiated (0.5 Gy) conditions. Over 1600 cells were scored for each of these 4 conditions. Experiment performed once. Foci scored using CellProfiler. Error bars represent SD.
4.2.3 Protocol speed
With the changes in sample dilution and slide preservation described above
we obtained an average lymphocyte density of 25 cells per field (up to 80) for
an acquisition at a magnification of x63. Currently, the time required for the
process between blood sample and mounted slide is 5 h at most.
4.3 Development of automated acquisition and analysis
To increase speed and facilitate the potential clinical application of our
protocol we used automated acquisition and automated analysis for cell type
selection and focus scoring. A free-access program was used for automated
scoring. It was compared to manual scoring and a program already in use at
the lab to determine if it could be adopted as a sensible and fast alternative.
Using the Metafer acquisition program the average speed of acquisition and
export was 2.5 images per min. The good quality of the images allowed us to
use automated focus scoring to avoid bias. However, before applying an
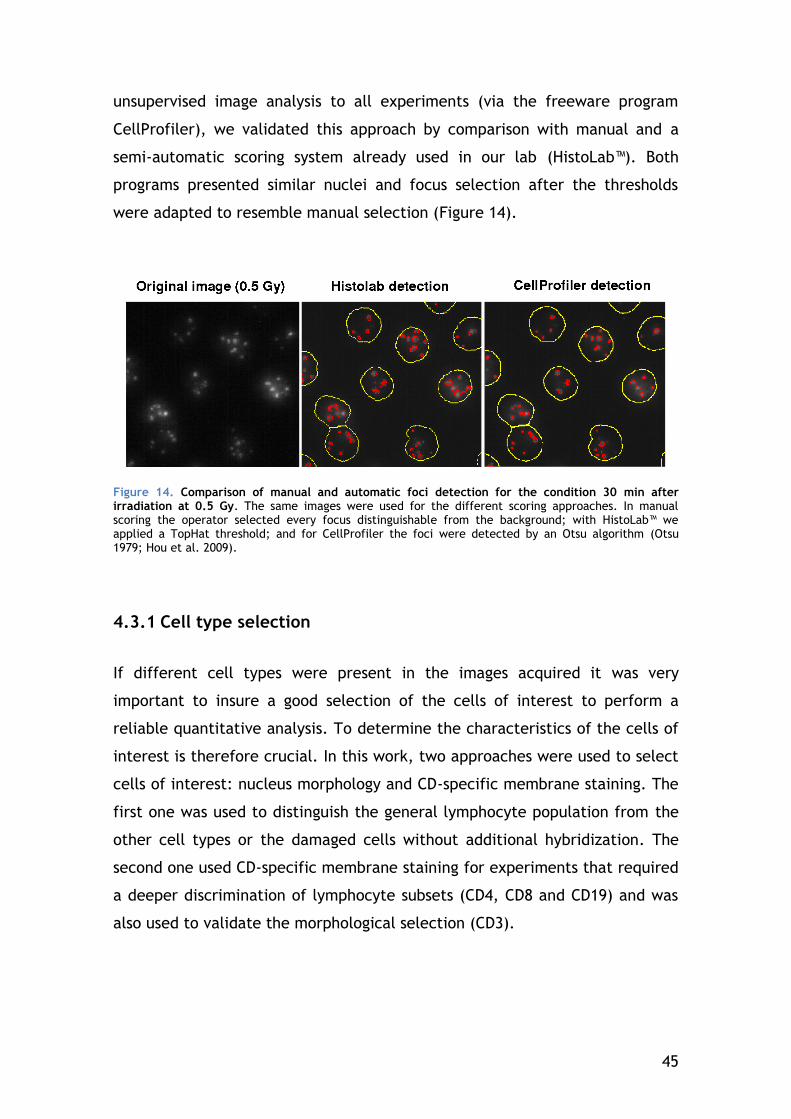
45
unsupervised image analysis to all experiments (via the freeware program
CellProfiler), we validated this approach by comparison with manual and a
semi-automatic scoring system already used in our lab (HistoLab™). Both
programs presented similar nuclei and focus selection after the thresholds
were adapted to resemble manual selection (Figure 14).
Figure 14. Comparison of manual and automatic foci detection for the condition 30 min after irradiation at 0.5 Gy. The same images were used for the different scoring approaches. In manual scoring the operator selected every focus distinguishable from the background; with HistoLab™ we applied a TopHat threshold; and for CellProfiler the foci were detected by an Otsu algorithm (Otsu 1979; Hou et al. 2009).
4.3.1 Cell type selection
If different cell types were present in the images acquired it was very
important to insure a good selection of the cells of interest to perform a
reliable quantitative analysis. To determine the characteristics of the cells of
interest is therefore crucial. In this work, two approaches were used to select
cells of interest: nucleus morphology and CD-specific membrane staining. The
first one was used to distinguish the general lymphocyte population from the
other cell types or the damaged cells without additional hybridization. The
second one used CD-specific membrane staining for experiments that required
a deeper discrimination of lymphocyte subsets (CD4, CD8 and CD19) and was
also used to validate the morphological selection (CD3).
46
4.3.1.1 The use of nucleus morphology to discriminate lymphocytes
Because lymphocytes in general tend to have a round shape and brighter DAPI
staining, their morphology allows operators to score them manually. In the
current version of HistoLab™, the user has also the possibility of removing
cells that have aberrant staining or morphology. Because the CellProfiler
approach has no operator intervention, the cell type selection was done
graphically during data analysis by the use of the nuclei "form factor" and
"DAPI integrated intensity" measures. An example can be found in Figure 15 A:
the two cells at the middle would not have been considered lymphocytes by
the operator during manual scoring because they are not as round and have
weaker DAPI staining. By quantifying these two parameters, it is possible to
establish thresholds that insure that automatic scoring will also exclude them.
"Form factor" is a parameter that quantifies "roundness" in the CellProfiler
"Measure Object Area" module. Cells for which this parameter is closer to "1"
are rounder and thus more likely to be lymphocytes. The comet-shaped dot
cloud (Figure 15 B) obtained reflects the general quality of the slide: the
presence of burst cells or granulocytes increases the comet tail and forms a
cloud of less intense nuclei underneath the "comet". The example presented
in Figure 15 B is the extreme case of a slide considerably polluted by cells
different from lymphocytes.
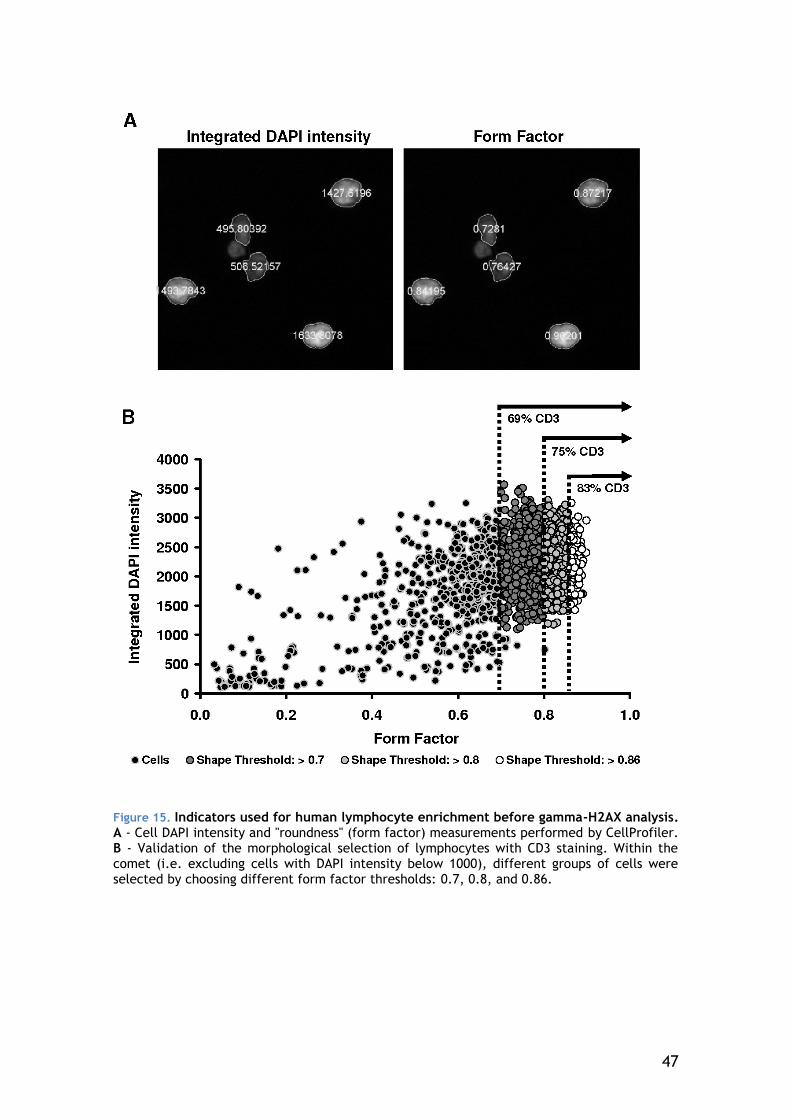
47
Figure 15. Indicators used for human lymphocyte enrichment before gamma-H2AX analysis. A - Cell DAPI intensity and "roundness" (form factor) measurements performed by CellProfiler. B - Validation of the morphological selection of lymphocytes with CD3 staining. Within the comet (i.e. excluding cells with DAPI intensity below 1000), different groups of cells were selected by choosing different form factor thresholds: 0.7, 0.8, and 0.86.
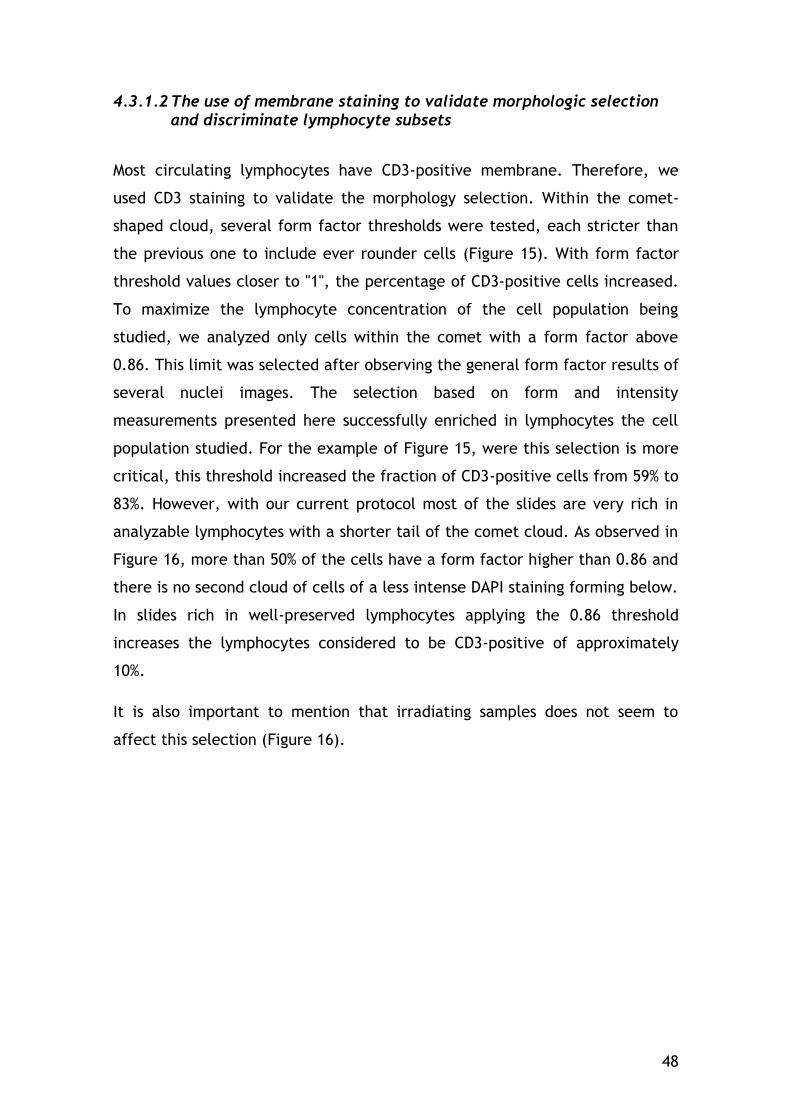
48
4.3.1.2 The use of membrane staining to validate morphologic selection and discriminate lymphocyte subsets
Most circulating lymphocytes have CD3-positive membrane. Therefore, we
used CD3 staining to validate the morphology selection. Within the comet-
shaped cloud, several form factor thresholds were tested, each stricter than
the previous one to include ever rounder cells (Figure 15). With form factor
threshold values closer to "1", the percentage of CD3-positive cells increased.
To maximize the lymphocyte concentration of the cell population being
studied, we analyzed only cells within the comet with a form factor above
0.86. This limit was selected after observing the general form factor results of
several nuclei images. The selection based on form and intensity
measurements presented here successfully enriched in lymphocytes the cell
population studied. For the example of Figure 15, were this selection is more
critical, this threshold increased the fraction of CD3-positive cells from 59% to
83%. However, with our current protocol most of the slides are very rich in
analyzable lymphocytes with a shorter tail of the comet cloud. As observed in
Figure 16, more than 50% of the cells have a form factor higher than 0.86 and
there is no second cloud of cells of a less intense DAPI staining forming below.
In slides rich in well-preserved lymphocytes applying the 0.86 threshold
increases the lymphocytes considered to be CD3-positive of approximately
10%.
It is also important to mention that irradiating samples does not seem to
affect this selection (Figure 16).
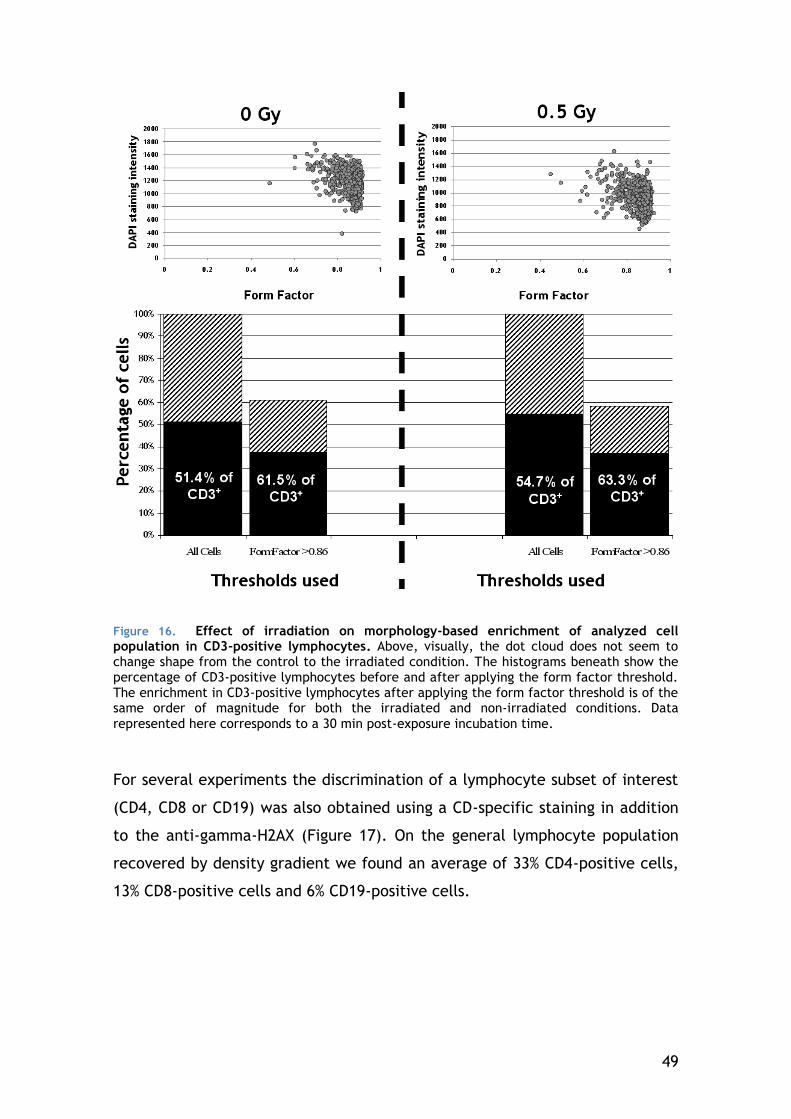
49
For several experiments the discrimination of a lymphocyte subset of interest
(CD4, CD8 or CD19) was also obtained using a CD-specific staining in addition
to the anti-gamma-H2AX (Figure 17). On the general lymphocyte population
recovered by density gradient we found an average of 33% CD4-positive cells,
13% CD8-positive cells and 6% CD19-positive cells.
Figure 16. Effect of irradiation on morphology-based enrichment of analyzed cell population in CD3-positive lymphocytes. Above, visually, the dot cloud does not seem to change shape from the control to the irradiated condition. The histograms beneath show the percentage of CD3-positive lymphocytes before and after applying the form factor threshold. The enrichment in CD3-positive lymphocytes after applying the form factor threshold is of the same order of magnitude for both the irradiated and non-irradiated conditions. Data
represented here corresponds to a 30 min post-exposure incubation time.
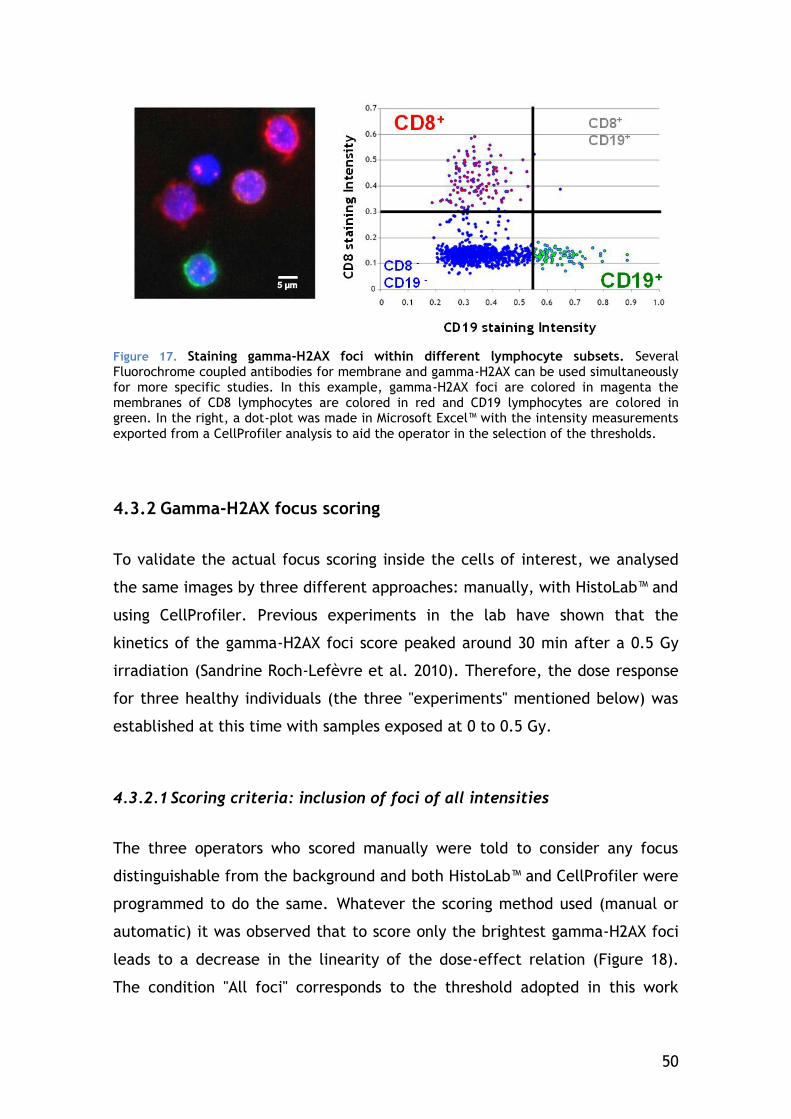
50
Figure 17. Staining gamma-H2AX foci within different lymphocyte subsets. Several Fluorochrome coupled antibodies for membrane and gamma-H2AX can be used simultaneously for more specific studies. In this example, gamma-H2AX foci are colored in magenta the membranes of CD8 lymphocytes are colored in red and CD19 lymphocytes are colored in green. In the right, a dot-plot was made in Microsoft Excel™ with the intensity measurements
exported from a CellProfiler analysis to aid the operator in the selection of the thresholds.
4.3.2 Gamma-H2AX focus scoring
To validate the actual focus scoring inside the cells of interest, we analysed
the same images by three different approaches: manually, with HistoLab™ and
using CellProfiler. Previous experiments in the lab have shown that the
kinetics of the gamma-H2AX foci score peaked around 30 min after a 0.5 Gy
irradiation (Sandrine Roch-Lefèvre et al. 2010). Therefore, the dose response
for three healthy individuals (the three "experiments" mentioned below) was
established at this time with samples exposed at 0 to 0.5 Gy.
4.3.2.1 Scoring criteria: inclusion of foci of all intensities
The three operators who scored manually were told to consider any focus
distinguishable from the background and both HistoLab™ and CellProfiler were
programmed to do the same. Whatever the scoring method used (manual or
automatic) it was observed that to score only the brightest gamma-H2AX foci
leads to a decrease in the linearity of the dose-effect relation (Figure 18).
The condition "All foci" corresponds to the threshold adopted in this work
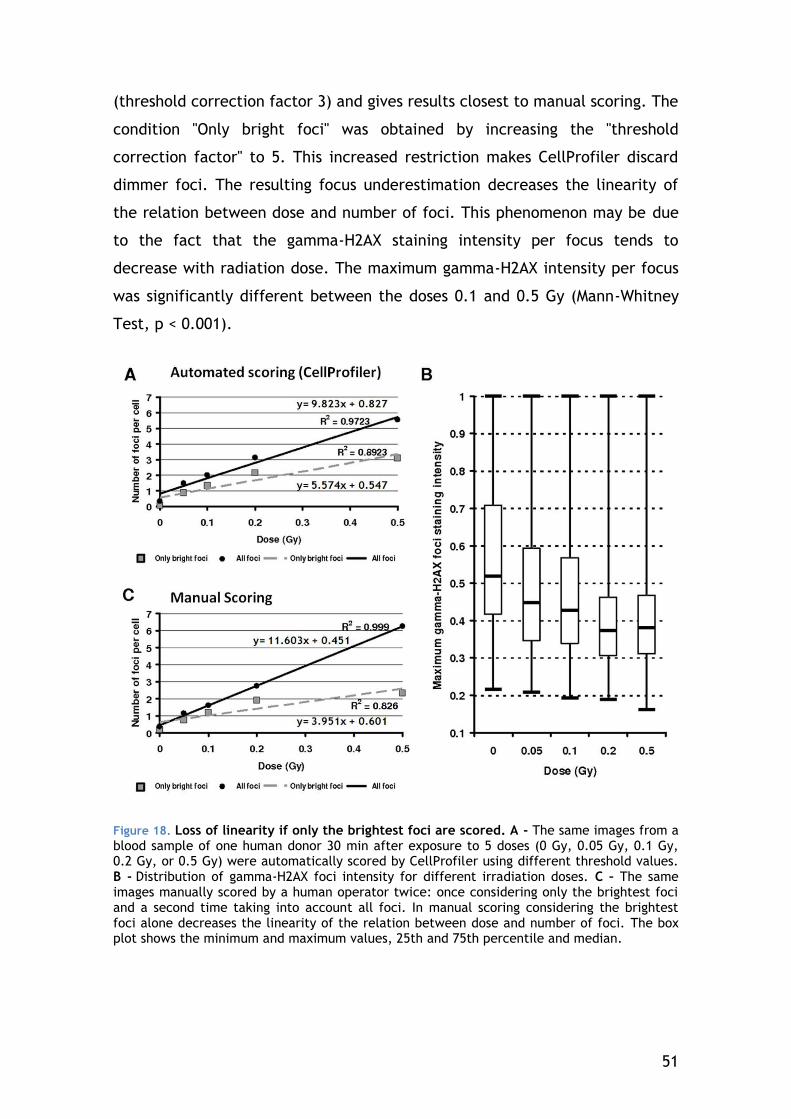
51
(threshold correction factor 3) and gives results closest to manual scoring. The
condition "Only bright foci" was obtained by increasing the "threshold
correction factor" to 5. This increased restriction makes CellProfiler discard
dimmer foci. The resulting focus underestimation decreases the linearity of
the relation between dose and number of foci. This phenomenon may be due
to the fact that the gamma-H2AX staining intensity per focus tends to
decrease with radiation dose. The maximum gamma-H2AX intensity per focus
was significantly different between the doses 0.1 and 0.5 Gy (Mann-Whitney
Test, p < 0.001).
Figure 18. Loss of linearity if only the brightest foci are scored. A - The same images from a blood sample of one human donor 30 min after exposure to 5 doses (0 Gy, 0.05 Gy, 0.1 Gy, 0.2 Gy, or 0.5 Gy) were automatically scored by CellProfiler using different threshold values. B - Distribution of gamma-H2AX foci intensity for different irradiation doses. C – The same images manually scored by a human operator twice: once considering only the brightest foci and a second time taking into account all foci. In manual scoring considering the brightest foci alone decreases the linearity of the relation between dose and number of foci. The box plot shows the minimum and maximum values, 25th and 75th percentile and median.
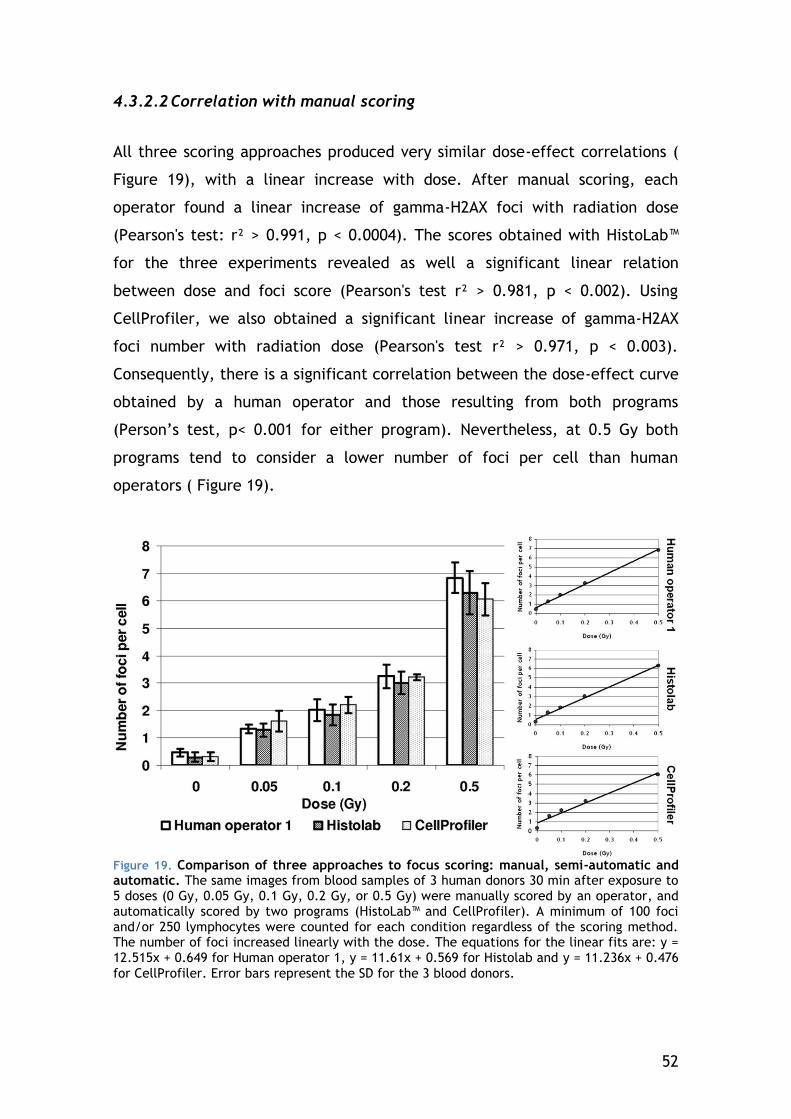
52
4.3.2.2 Correlation with manual scoring
All three scoring approaches produced very similar dose-effect correlations (
Figure 19), with a linear increase with dose. After manual scoring, each
operator found a linear increase of gamma-H2AX foci with radiation dose
(Pearson's test: r² > 0.991, p < 0.0004). The scores obtained with HistoLab™
for the three experiments revealed as well a significant linear relation
between dose and foci score (Pearson's test r² > 0.981, p < 0.002). Using
CellProfiler, we also obtained a significant linear increase of gamma-H2AX
foci number with radiation dose (Pearson's test r² > 0.971, p < 0.003).
Consequently, there is a significant correlation between the dose-effect curve
obtained by a human operator and those resulting from both programs
(Person’s test, p< 0.001 for either program). Nevertheless, at 0.5 Gy both
programs tend to consider a lower number of foci per cell than human
operators ( Figure 19).
Figure 19. Comparison of three approaches to focus scoring: manual, semi-automatic and automatic. The same images from blood samples of 3 human donors 30 min after exposure to 5 doses (0 Gy, 0.05 Gy, 0.1 Gy, 0.2 Gy, or 0.5 Gy) were manually scored by an operator, and automatically scored by two programs (HistoLab™ and CellProfiler). A minimum of 100 foci and/or 250 lymphocytes were counted for each condition regardless of the scoring method. The number of foci increased linearly with the dose. The equations for the linear fits are: y = 12.515x + 0.649 for Human operator 1, y = 11.61x + 0.569 for Histolab and y = 11.236x + 0.476
for CellProfiler. Error bars represent the SD for the 3 blood donors.
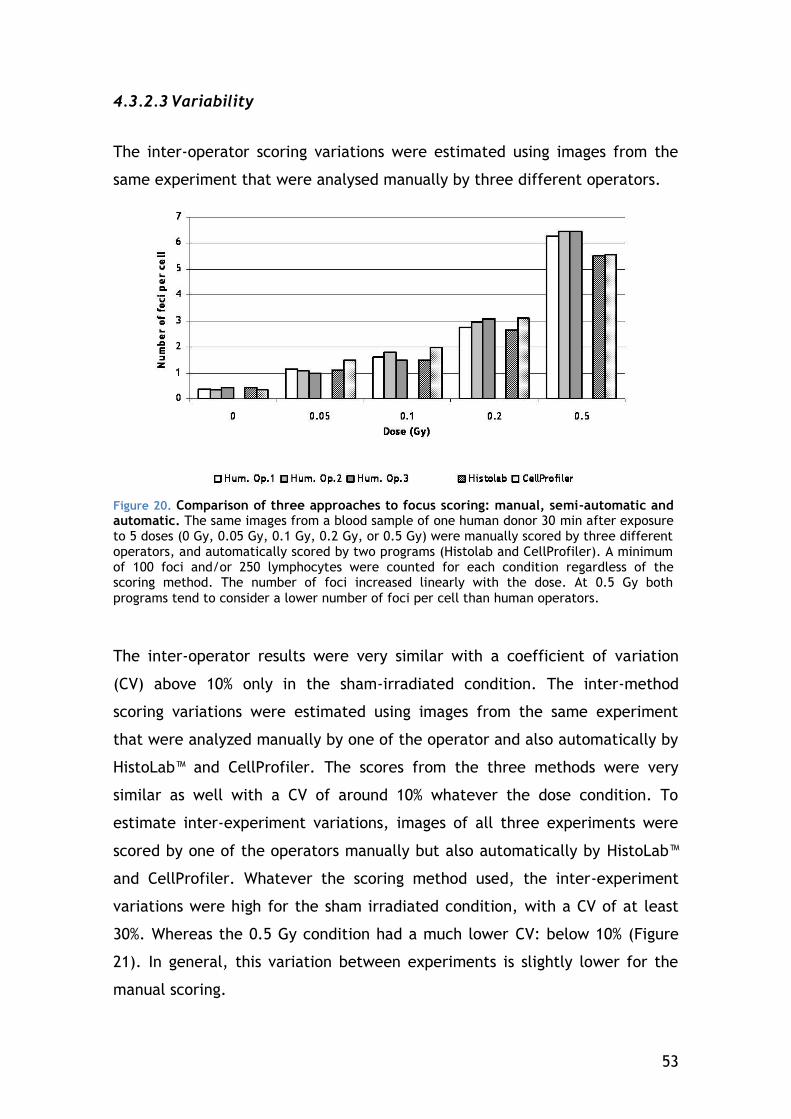
53
4.3.2.3 Variability
The inter-operator scoring variations were estimated using images from the
same experiment that were analysed manually by three different operators.
Figure 20. Comparison of three approaches to focus scoring: manual, semi-automatic and automatic. The same images from a blood sample of one human donor 30 min after exposure to 5 doses (0 Gy, 0.05 Gy, 0.1 Gy, 0.2 Gy, or 0.5 Gy) were manually scored by three different operators, and automatically scored by two programs (Histolab and CellProfiler). A minimum of 100 foci and/or 250 lymphocytes were counted for each condition regardless of the scoring method. The number of foci increased linearly with the dose. At 0.5 Gy both
programs tend to consider a lower number of foci per cell than human operators.
The inter-operator results were very similar with a coefficient of variation
(CV) above 10% only in the sham-irradiated condition. The inter-method
scoring variations were estimated using images from the same experiment
that were analyzed manually by one of the operator and also automatically by
HistoLab™ and CellProfiler. The scores from the three methods were very
similar as well with a CV of around 10% whatever the dose condition. To
estimate inter-experiment variations, images of all three experiments were
scored by one of the operators manually but also automatically by HistoLab™
and CellProfiler. Whatever the scoring method used, the inter-experiment
variations were high for the sham irradiated condition, with a CV of at least
30%. Whereas the 0.5 Gy condition had a much lower CV: below 10% (Figure
21). In general, this variation between experiments is slightly lower for the
manual scoring.
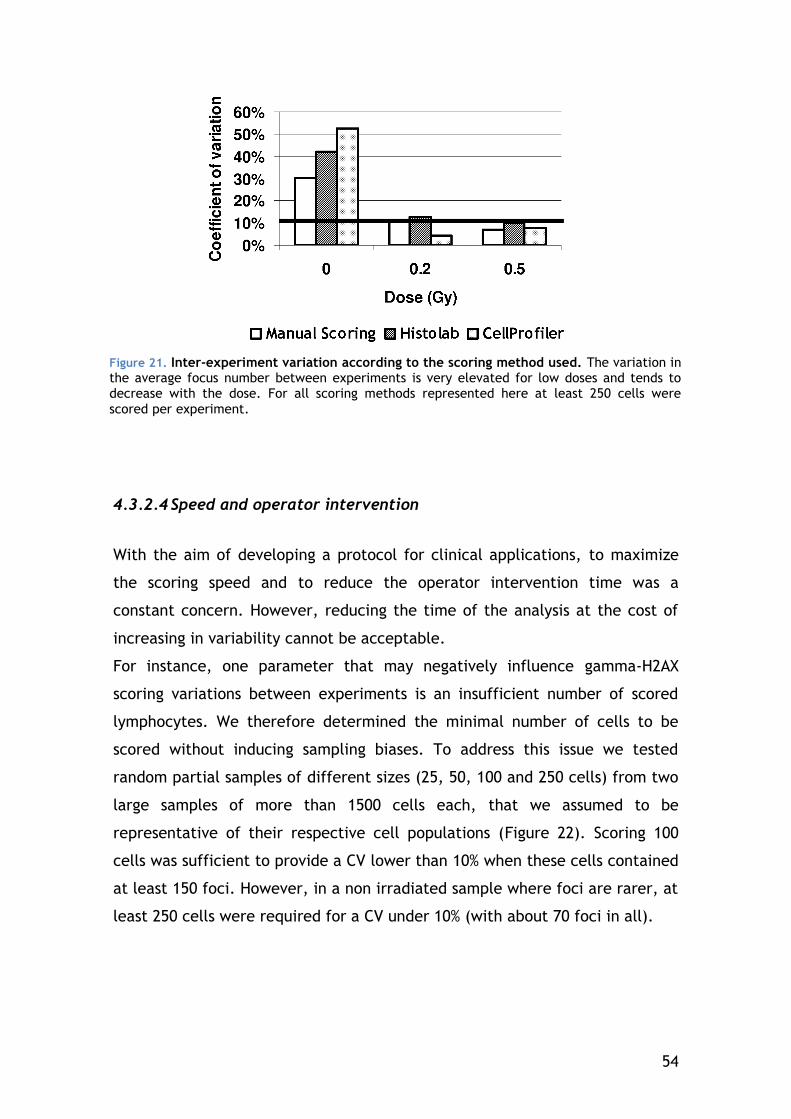
54
4.3.2.4 Speed and operator intervention
With the aim of developing a protocol for clinical applications, to maximize
the scoring speed and to reduce the operator intervention time was a
constant concern. However, reducing the time of the analysis at the cost of
increasing in variability cannot be acceptable.
For instance, one parameter that may negatively influence gamma-H2AX
scoring variations between experiments is an insufficient number of scored
lymphocytes. We therefore determined the minimal number of cells to be
scored without inducing sampling biases. To address this issue we tested
random partial samples of different sizes (25, 50, 100 and 250 cells) from two
large samples of more than 1500 cells each, that we assumed to be
representative of their respective cell populations (Figure 22). Scoring 100
cells was sufficient to provide a CV lower than 10% when these cells contained
at least 150 foci. However, in a non irradiated sample where foci are rarer, at
least 250 cells were required for a CV under 10% (with about 70 foci in all).
Figure 21. Inter-experiment variation according to the scoring method used. The variation in the average focus number between experiments is very elevated for low doses and tends to decrease with the dose. For all scoring methods represented here at least 250 cells were
scored per experiment.
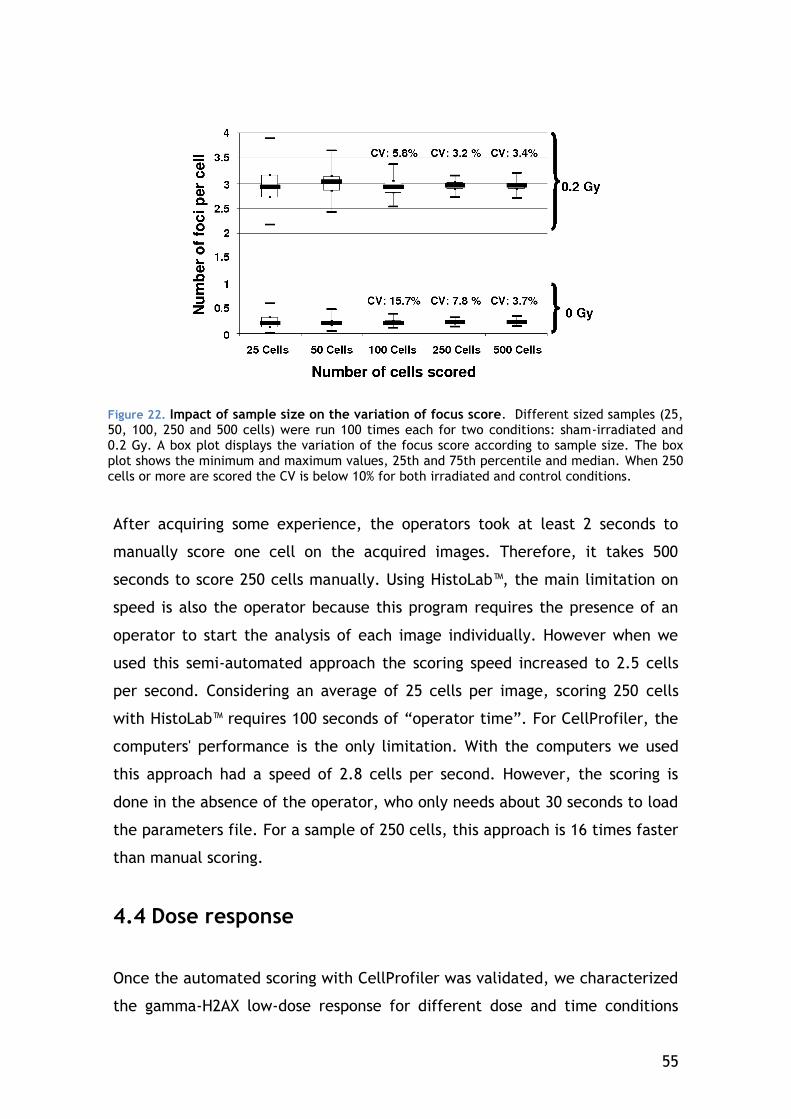
55
After acquiring some experience, the operators took at least 2 seconds to
manually score one cell on the acquired images. Therefore, it takes 500
seconds to score 250 cells manually. Using HistoLab™, the main limitation on
speed is also the operator because this program requires the presence of an
operator to start the analysis of each image individually. However when we
used this semi-automated approach the scoring speed increased to 2.5 cells
per second. Considering an average of 25 cells per image, scoring 250 cells
with HistoLab™ requires 100 seconds of “operator time”. For CellProfiler, the
computers' performance is the only limitation. With the computers we used
this approach had a speed of 2.8 cells per second. However, the scoring is
done in the absence of the operator, who only needs about 30 seconds to load
the parameters file. For a sample of 250 cells, this approach is 16 times faster
than manual scoring.
4.4 Dose response
Once the automated scoring with CellProfiler was validated, we characterized
the gamma-H2AX low-dose response for different dose and time conditions
Figure 22. Impact of sample size on the variation of focus score. Different sized samples (25, 50, 100, 250 and 500 cells) were run 100 times each for two conditions: sham-irradiated and 0.2 Gy. A box plot displays the variation of the focus score according to sample size. The box plot shows the minimum and maximum values, 25th and 75th percentile and median. When 250 cells or more are scored the CV is below 10% for both irradiated and control conditions.
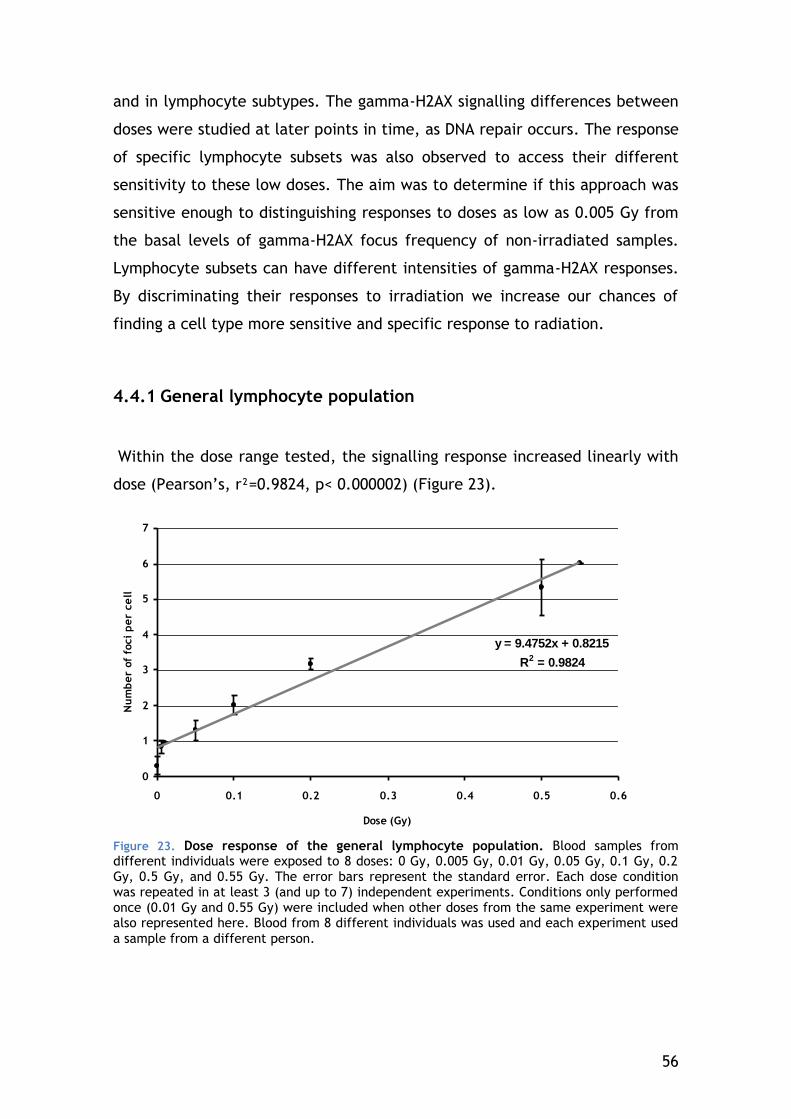
56
and in lymphocyte subtypes. The gamma-H2AX signalling differences between
doses were studied at later points in time, as DNA repair occurs. The response
of specific lymphocyte subsets was also observed to access their different
sensitivity to these low doses. The aim was to determine if this approach was
sensitive enough to distinguishing responses to doses as low as 0.005 Gy from
the basal levels of gamma-H2AX focus frequency of non-irradiated samples.
Lymphocyte subsets can have different intensities of gamma-H2AX responses.
By discriminating their responses to irradiation we increase our chances of
finding a cell type more sensitive and specific response to radiation.
4.4.1 General lymphocyte population
Within the dose range tested, the signalling response increased linearly with
dose (Pearson’s, r²=0.9824, p< 0.000002) (Figure 23).
y = 9.4752x + 0.8215
R2 = 0.9824
0
1
2
3
4
5
6
7
0 0.1 0.2 0.3 0.4 0.5 0.6
Dose (Gy)
Nu
mb
er
of
foci
pe
r ce
ll
Figure 23. Dose response of the general lymphocyte population. Blood samples from different individuals were exposed to 8 doses: 0 Gy, 0.005 Gy, 0.01 Gy, 0.05 Gy, 0.1 Gy, 0.2 Gy, 0.5 Gy, and 0.55 Gy. The error bars represent the standard error. Each dose condition was repeated in at least 3 (and up to 7) independent experiments. Conditions only performed once (0.01 Gy and 0.55 Gy) were included when other doses from the same experiment were also represented here. Blood from 8 different individuals was used and each experiment used
a sample from a different person.
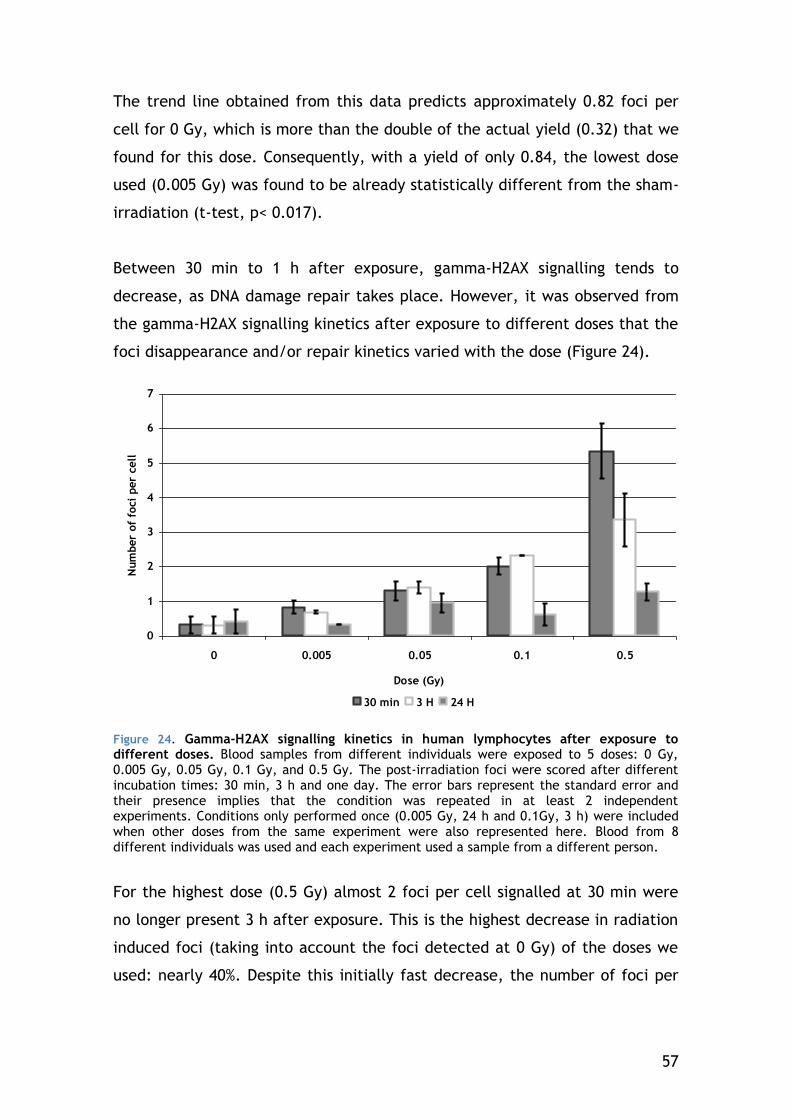
57
The trend line obtained from this data predicts approximately 0.82 foci per
cell for 0 Gy, which is more than the double of the actual yield (0.32) that we
found for this dose. Consequently, with a yield of only 0.84, the lowest dose
used (0.005 Gy) was found to be already statistically different from the sham-
irradiation (t-test, p< 0.017).
Between 30 min to 1 h after exposure, gamma-H2AX signalling tends to
decrease, as DNA damage repair takes place. However, it was observed from
the gamma-H2AX signalling kinetics after exposure to different doses that the
foci disappearance and/or repair kinetics varied with the dose (Figure 24).
0
1
2
3
4
5
6
7
0 0.005 0.05 0.1 0.5
Dose (Gy)
Num
ber
of
foci
per
cell
30 min 3 H 24 H
Figure 24. Gamma-H2AX signalling kinetics in human lymphocytes after exposure to different doses. Blood samples from different individuals were exposed to 5 doses: 0 Gy, 0.005 Gy, 0.05 Gy, 0.1 Gy, and 0.5 Gy. The post-irradiation foci were scored after different incubation times: 30 min, 3 h and one day. The error bars represent the standard error and their presence implies that the condition was repeated in at least 2 independent experiments. Conditions only performed once (0.005 Gy, 24 h and 0.1Gy, 3 h) were included when other doses from the same experiment were also represented here. Blood from 8 different individuals was used and each experiment used a sample from a different person.
For the highest dose (0.5 Gy) almost 2 foci per cell signalled at 30 min were
no longer present 3 h after exposure. This is the highest decrease in radiation
induced foci (taking into account the foci detected at 0 Gy) of the doses we
used: nearly 40%. Despite this initially fast decrease, the number of foci per
58
cell induced by a 0.5 Gy irradiation is still significantly different from the 0 Gy
baseline 24 h after exposure.
For the lower doses, the foci yield varied little 3 h after exposure (0.2 foci per
cell on average) since the supposed signalling peek at 30 min. Because of this
difference in the signalling/repair rate among doses, their correlation with
foci yield is less linear at 3 h and 24 h.
4.4.2 Lymphocyte Subsets
In many of these experiments, the response of specific lymphocyte subsets
(CD4, CD8 and CD19) was also quantified. At 30 min, the post-irradiation
gamma-H2AX signalling response of all the studied subsets was very similar to
the one observed for the whole lymphocyte population. The CD4 positive
cells, the largest fraction of the lymphocytes, showed both the slope and zero
values the closest to the general lymphocyte population. On the other hand,
CD19 positive lymphocytes had consistently less radiation-induced gamma-
H2AX foci than CD4 positive cells at 30 min. In fact, for the average of 3
independent experiments, CD19 cells had a significantly lower number of foci
than CD4 positive lymphocytes 30 min after exposure to 0.5 Gy (t-test, p<
0.004) (Figure 25).
The kinetics of the 3 lymphocyte subsets studied was similar to the response
observed with the general population: a decrease in number of foci from 30
min to 3 h after exposure to 0.5 Gy but not for the lower doses (Figure 26).
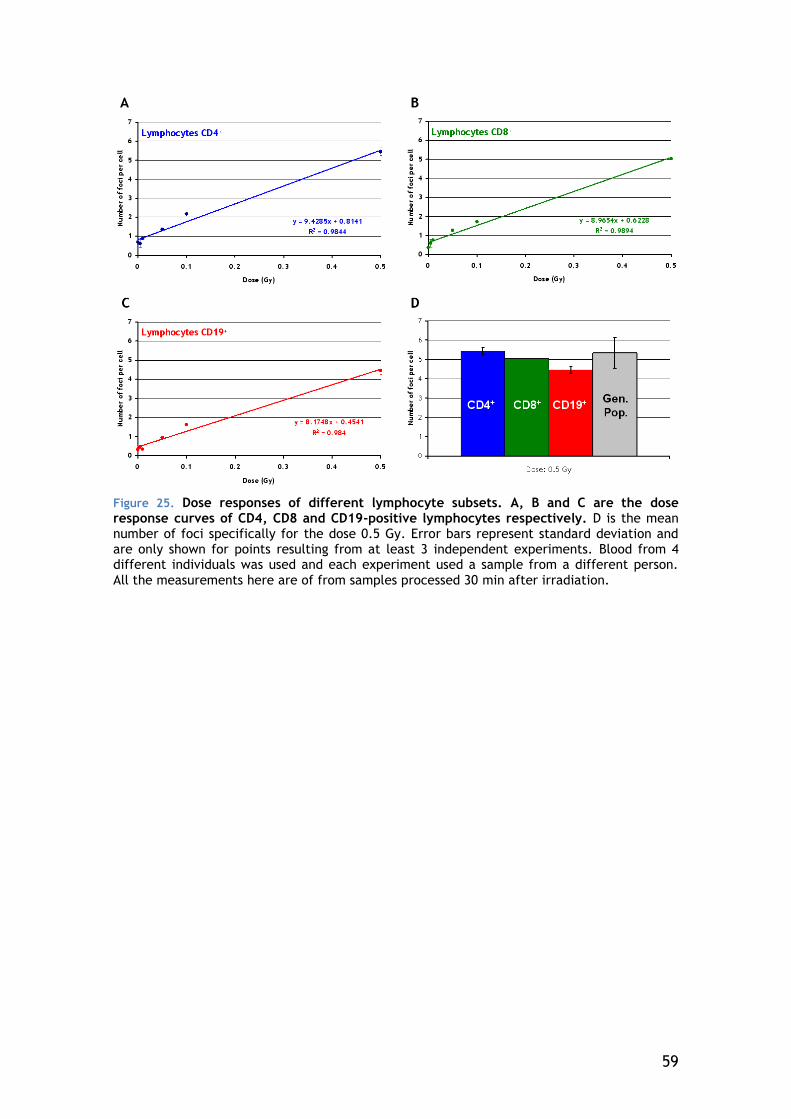
59
Figure 25. Dose responses of different lymphocyte subsets. A, B and C are the dose response curves of CD4, CD8 and CD19-positive lymphocytes respectively. D is the mean number of foci specifically for the dose 0.5 Gy. Error bars represent standard deviation and are only shown for points resulting from at least 3 independent experiments. Blood from 4 different individuals was used and each experiment used a sample from a different person.
All the measurements here are of from samples processed 30 min after irradiation.
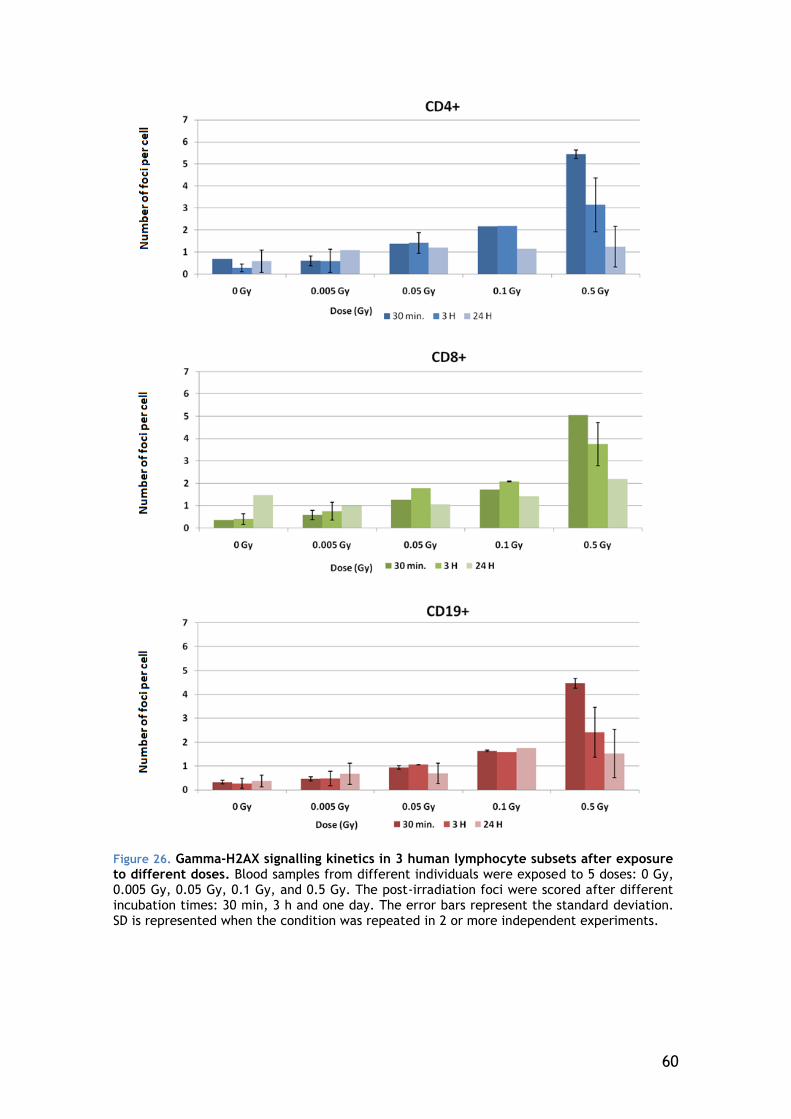
60
Figure 26. Gamma-H2AX signalling kinetics in 3 human lymphocyte subsets after exposure to different doses. Blood samples from different individuals were exposed to 5 doses: 0 Gy, 0.005 Gy, 0.05 Gy, 0.1 Gy, and 0.5 Gy. The post-irradiation foci were scored after different incubation times: 30 min, 3 h and one day. The error bars represent the standard deviation. SD is represented when the condition was repeated in 2 or more independent experiments.
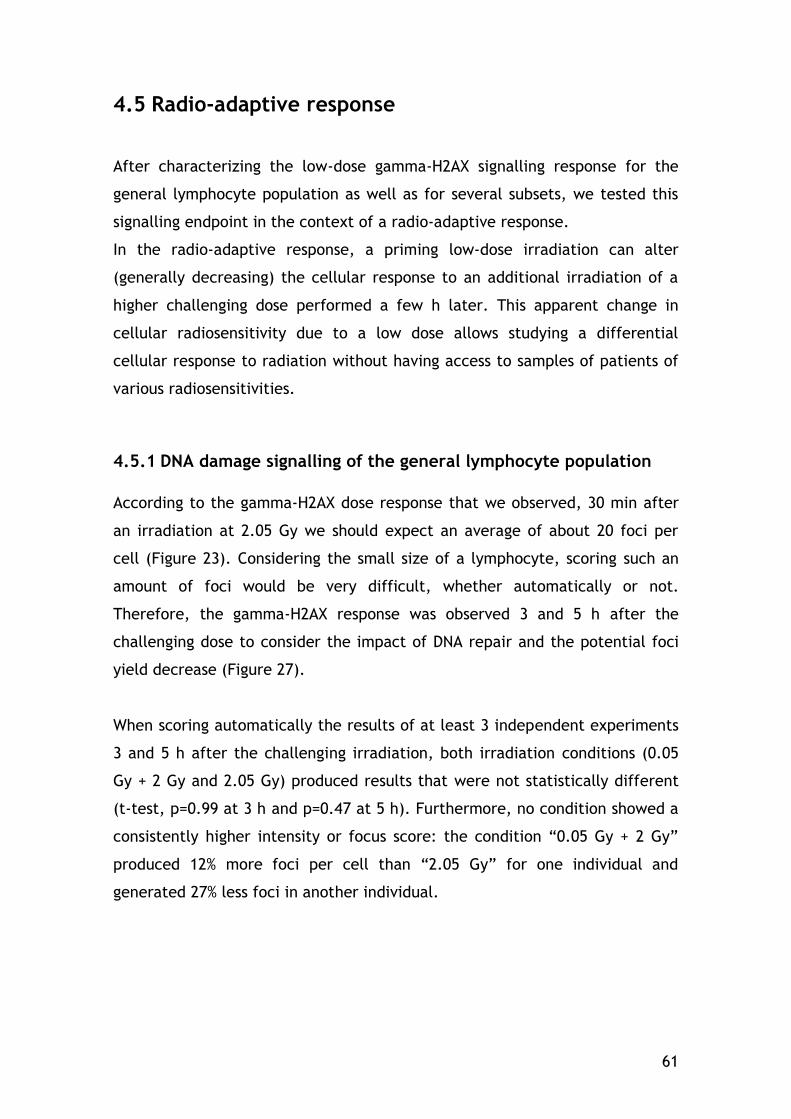
61
4.5 Radio-adaptive response
After characterizing the low-dose gamma-H2AX signalling response for the
general lymphocyte population as well as for several subsets, we tested this
signalling endpoint in the context of a radio-adaptive response.
In the radio-adaptive response, a priming low-dose irradiation can alter
(generally decreasing) the cellular response to an additional irradiation of a
higher challenging dose performed a few h later. This apparent change in
cellular radiosensitivity due to a low dose allows studying a differential
cellular response to radiation without having access to samples of patients of
various radiosensitivities.
4.5.1 DNA damage signalling of the general lymphocyte population
According to the gamma-H2AX dose response that we observed, 30 min after
an irradiation at 2.05 Gy we should expect an average of about 20 foci per
cell (Figure 23). Considering the small size of a lymphocyte, scoring such an
amount of foci would be very difficult, whether automatically or not.
Therefore, the gamma-H2AX response was observed 3 and 5 h after the
challenging dose to consider the impact of DNA repair and the potential foci
yield decrease (Figure 27).
When scoring automatically the results of at least 3 independent experiments
3 and 5 h after the challenging irradiation, both irradiation conditions (0.05
Gy + 2 Gy and 2.05 Gy) produced results that were not statistically different
(t-test, p=0.99 at 3 h and p=0.47 at 5 h). Furthermore, no condition showed a
consistently higher intensity or focus score: the condition “0.05 Gy + 2 Gy”
produced 12% more foci per cell than “2.05 Gy” for one individual and
generated 27% less foci in another individual.
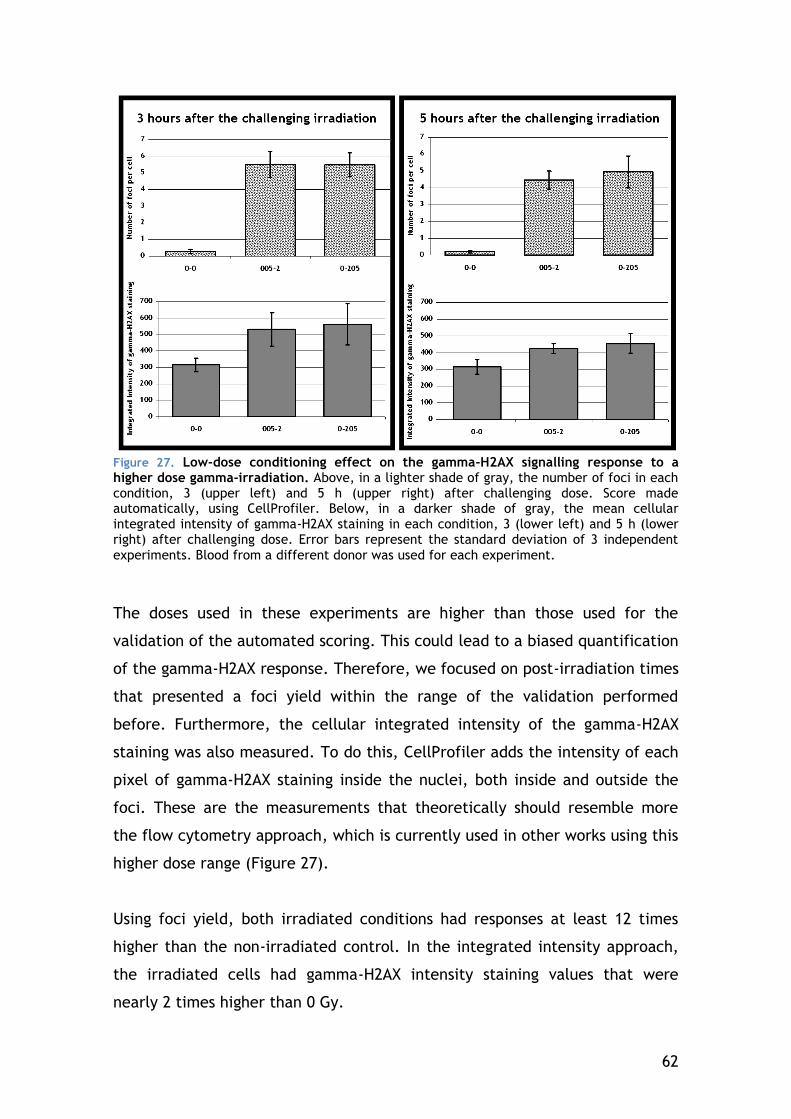
62
Figure 27. Low-dose conditioning effect on the gamma-H2AX signalling response to a higher dose gamma-irradiation. Above, in a lighter shade of gray, the number of foci in each condition, 3 (upper left) and 5 h (upper right) after challenging dose. Score made automatically, using CellProfiler. Below, in a darker shade of gray, the mean cellular integrated intensity of gamma-H2AX staining in each condition, 3 (lower left) and 5 h (lower right) after challenging dose. Error bars represent the standard deviation of 3 independent
experiments. Blood from a different donor was used for each experiment.
The doses used in these experiments are higher than those used for the
validation of the automated scoring. This could lead to a biased quantification
of the gamma-H2AX response. Therefore, we focused on post-irradiation times
that presented a foci yield within the range of the validation performed
before. Furthermore, the cellular integrated intensity of the gamma-H2AX
staining was also measured. To do this, CellProfiler adds the intensity of each
pixel of gamma-H2AX staining inside the nuclei, both inside and outside the
foci. These are the measurements that theoretically should resemble more
the flow cytometry approach, which is currently used in other works using this
higher dose range (Figure 27).
Using foci yield, both irradiated conditions had responses at least 12 times
higher than the non-irradiated control. In the integrated intensity approach,
the irradiated cells had gamma-H2AX intensity staining values that were
nearly 2 times higher than 0 Gy.
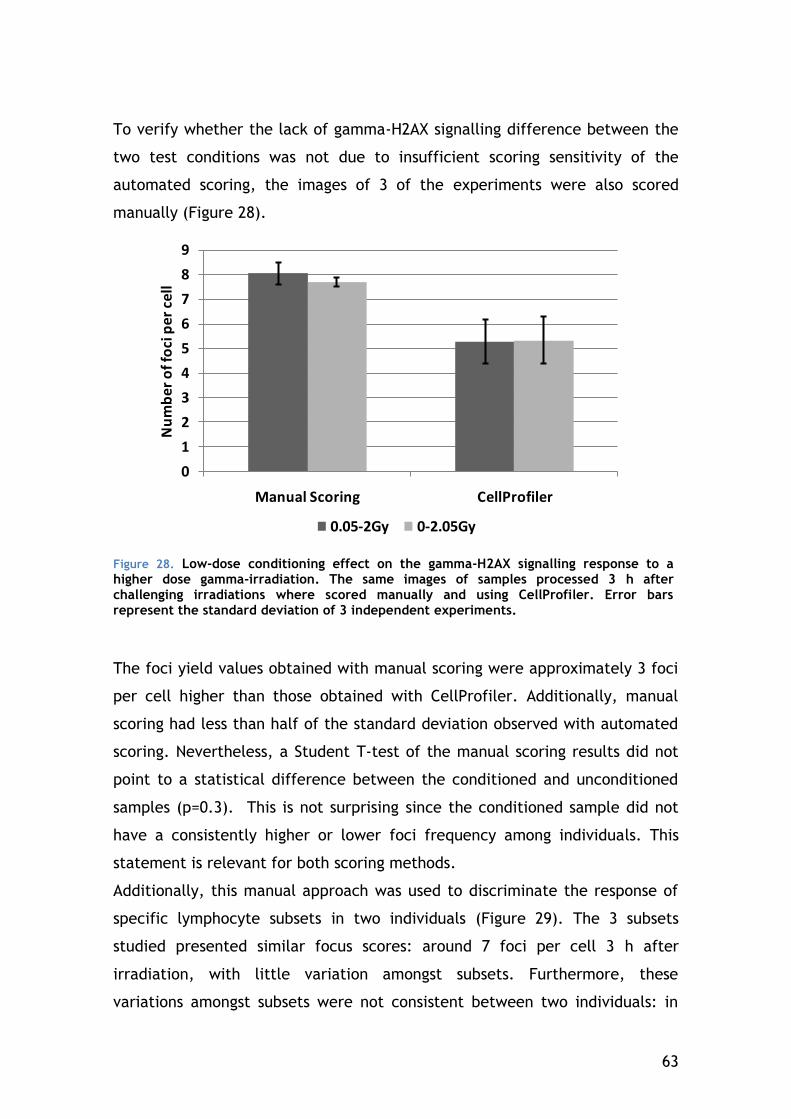
63
To verify whether the lack of gamma-H2AX signalling difference between the
two test conditions was not due to insufficient scoring sensitivity of the
automated scoring, the images of 3 of the experiments were also scored
manually (Figure 28).
0
1
2
3
4
5
6
7
8
9
Manual Scoring CellProfiler
Nu
mb
er
of f
oci
pe
r ce
ll
0.05-2Gy 0-2.05Gy
Figure 28. Low-dose conditioning effect on the gamma-H2AX signalling response to a higher dose gamma-irradiation. The same images of samples processed 3 h after challenging irradiations where scored manually and using CellProfiler. Error bars represent the standard deviation of 3 independent experiments.
The foci yield values obtained with manual scoring were approximately 3 foci
per cell higher than those obtained with CellProfiler. Additionally, manual
scoring had less than half of the standard deviation observed with automated
scoring. Nevertheless, a Student T-test of the manual scoring results did not
point to a statistical difference between the conditioned and unconditioned
samples (p=0.3). This is not surprising since the conditioned sample did not
have a consistently higher or lower foci frequency among individuals. This
statement is relevant for both scoring methods.
Additionally, this manual approach was used to discriminate the response of
specific lymphocyte subsets in two individuals (Figure 29). The 3 subsets
studied presented similar focus scores: around 7 foci per cell 3 h after
irradiation, with little variation amongst subsets. Furthermore, these
variations amongst subsets were not consistent between two individuals: in
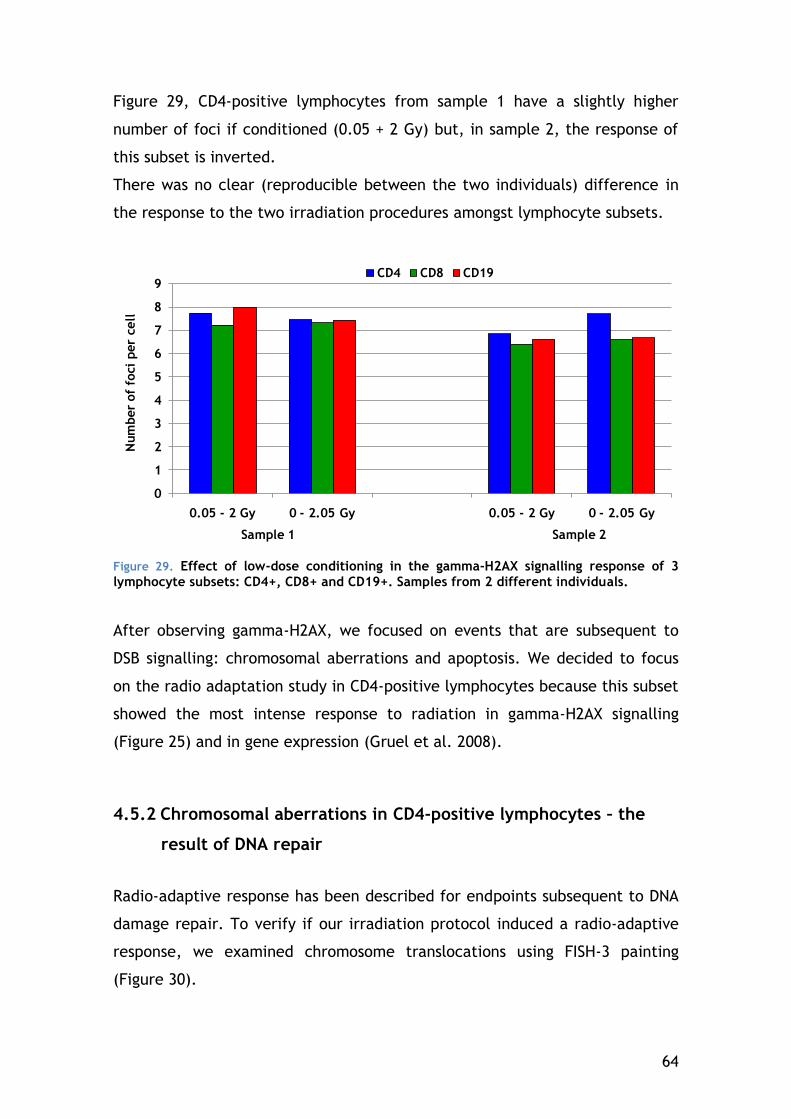
64
Figure 29, CD4-positive lymphocytes from sample 1 have a slightly higher
number of foci if conditioned (0.05 + 2 Gy) but, in sample 2, the response of
this subset is inverted.
There was no clear (reproducible between the two individuals) difference in
the response to the two irradiation procedures amongst lymphocyte subsets.
0
1
2
3
4
5
6
7
8
9
0.05 - 2 Gy 0 - 2.05 Gy 0.05 - 2 Gy 0 - 2.05 Gy
Num
ber
of
foci
per
cell
Sample 1 Sample 2
CD4 CD8 CD19
Figure 29. Effect of low-dose conditioning in the gamma-H2AX signalling response of 3
lymphocyte subsets: CD4+, CD8+ and CD19+. Samples from 2 different individuals.
After observing gamma-H2AX, we focused on events that are subsequent to
DSB signalling: chromosomal aberrations and apoptosis. We decided to focus
on the radio adaptation study in CD4-positive lymphocytes because this subset
showed the most intense response to radiation in gamma-H2AX signalling
(Figure 25) and in gene expression (Gruel et al. 2008).
4.5.2 Chromosomal aberrations in CD4-positive lymphocytes – the
result of DNA repair
Radio-adaptive response has been described for endpoints subsequent to DNA
damage repair. To verify if our irradiation protocol induced a radio-adaptive
response, we examined chromosome translocations using FISH-3 painting
(Figure 30).
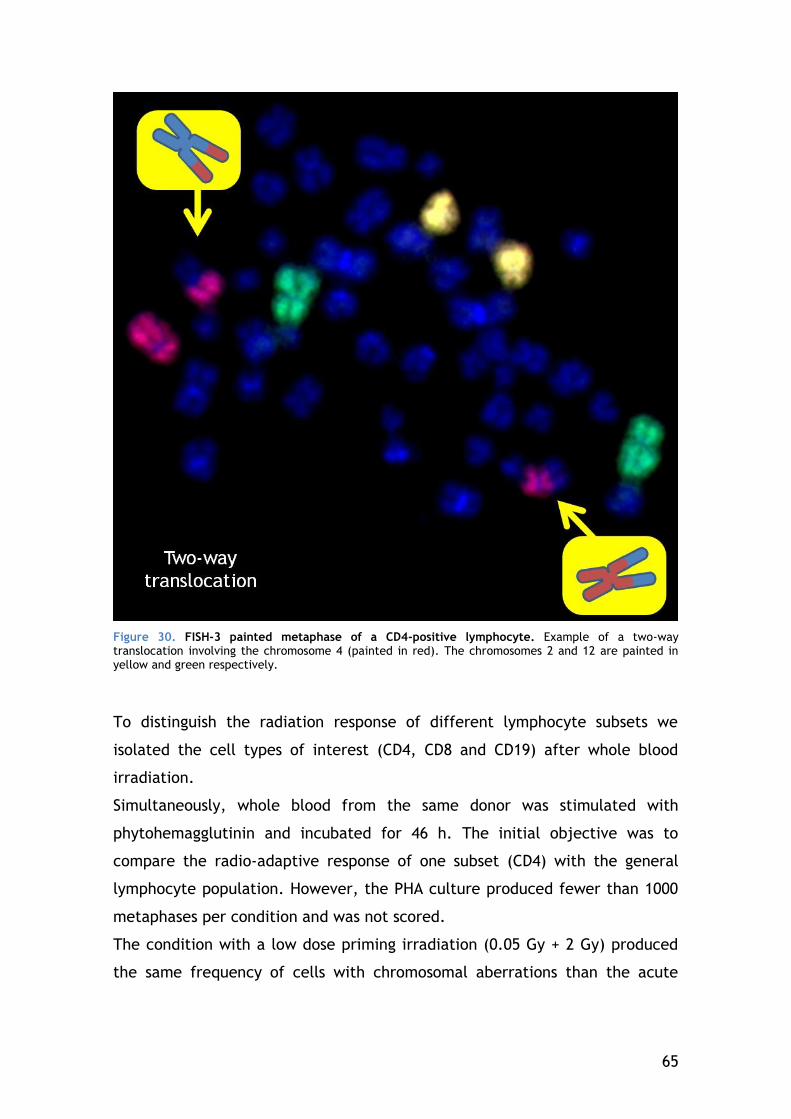
65
Figure 30. FISH-3 painted metaphase of a CD4-positive lymphocyte. Example of a two-way translocation involving the chromosome 4 (painted in red). The chromosomes 2 and 12 are painted in yellow and green respectively.
To distinguish the radiation response of different lymphocyte subsets we
isolated the cell types of interest (CD4, CD8 and CD19) after whole blood
irradiation.
Simultaneously, whole blood from the same donor was stimulated with
phytohemagglutinin and incubated for 46 h. The initial objective was to
compare the radio-adaptive response of one subset (CD4) with the general
lymphocyte population. However, the PHA culture produced fewer than 1000
metaphases per condition and was not scored.
The condition with a low dose priming irradiation (0.05 Gy + 2 Gy) produced
the same frequency of cells with chromosomal aberrations than the acute
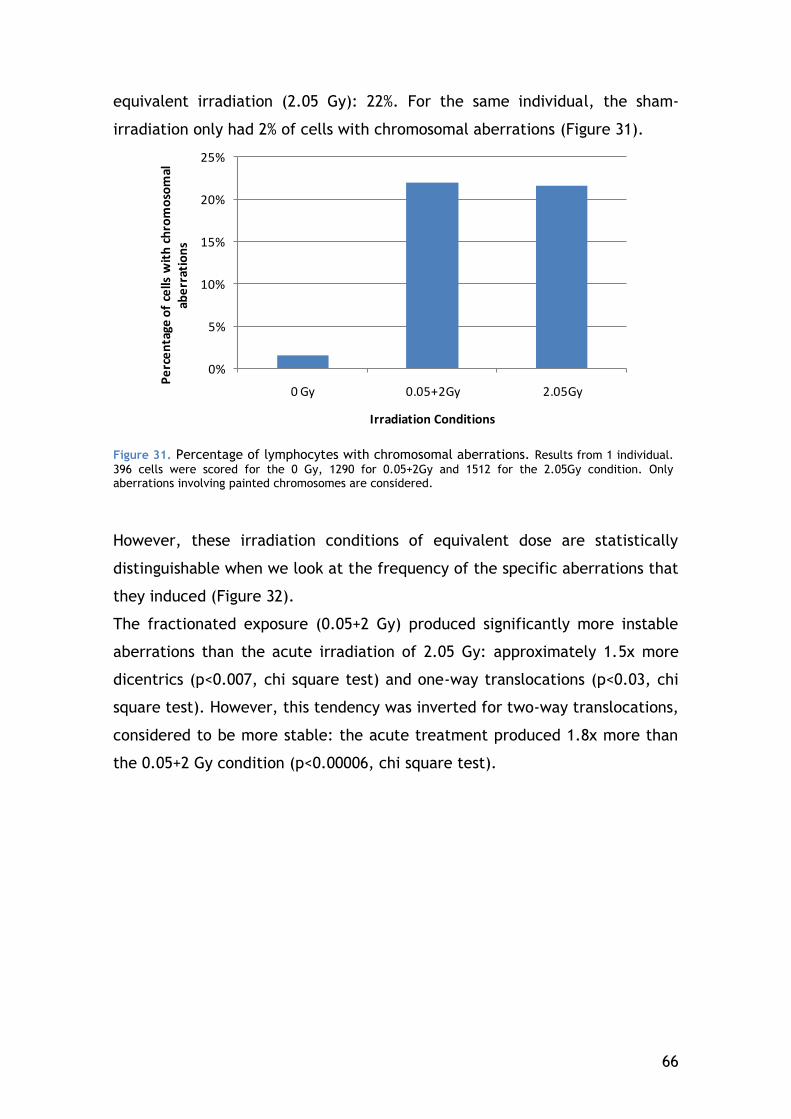
66
equivalent irradiation (2.05 Gy): 22%. For the same individual, the sham-
irradiation only had 2% of cells with chromosomal aberrations (Figure 31).
0%
5%
10%
15%
20%
25%
0 Gy 0.05+2Gy 2.05Gy
Pe
rce
nta
ge o
f ce
lls w
ith
ch
rom
oso
mal
ab
err
atio
ns
Irradiation Conditions
Figure 31. Percentage of lymphocytes with chromosomal aberrations. Results from 1 individual.
396 cells were scored for the 0 Gy, 1290 for 0.05+2Gy and 1512 for the 2.05Gy condition. Only aberrations involving painted chromosomes are considered.
However, these irradiation conditions of equivalent dose are statistically
distinguishable when we look at the frequency of the specific aberrations that
they induced (Figure 32).
The fractionated exposure (0.05+2 Gy) produced significantly more instable
aberrations than the acute irradiation of 2.05 Gy: approximately 1.5x more
dicentrics (p<0.007, chi square test) and one-way translocations (p<0.03, chi
square test). However, this tendency was inverted for two-way translocations,
considered to be more stable: the acute treatment produced 1.8x more than
the 0.05+2 Gy condition (p<0.00006, chi square test).
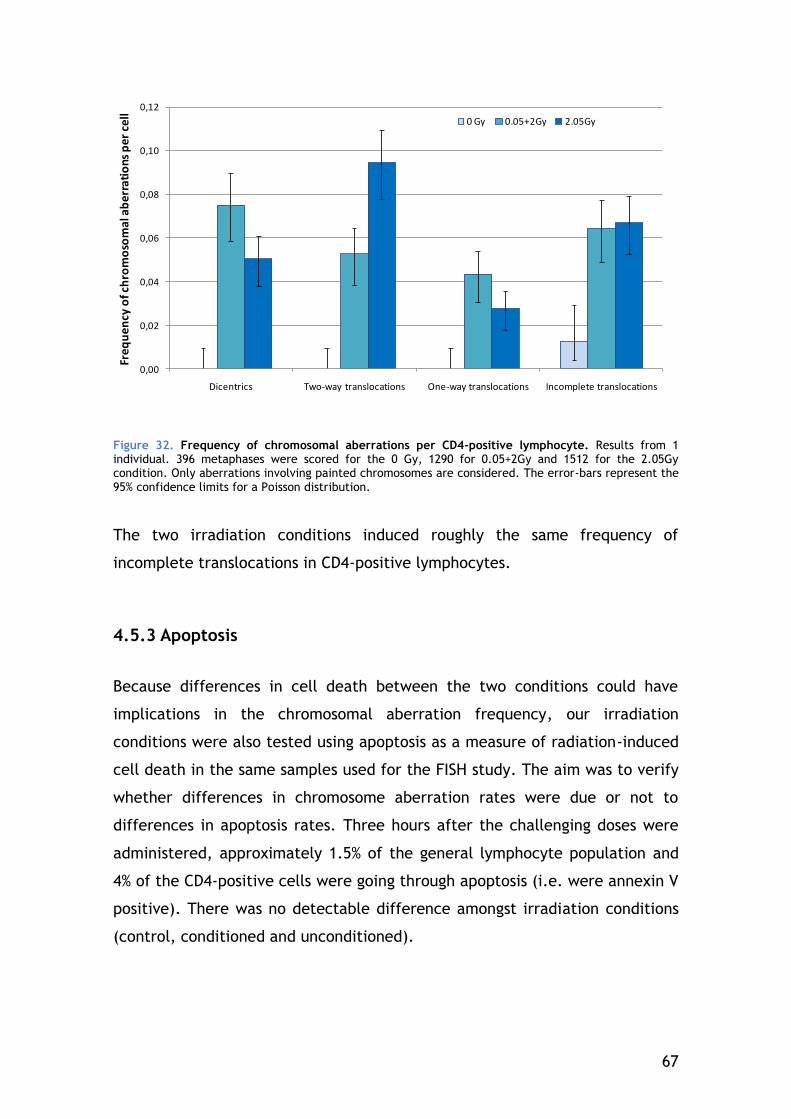
67
0,00
0,02
0,04
0,06
0,08
0,10
0,12
Dicentrics Two-way translocations One-way translocations Incomplete translocations
Freq
uen
cy o
f ch
rom
oso
mal
ab
erra
tio
ns p
er c
ell
0 Gy 0.05+2Gy 2.05Gy
Figure 32. Frequency of chromosomal aberrations per CD4-positive lymphocyte. Results from 1 individual. 396 metaphases were scored for the 0 Gy, 1290 for 0.05+2Gy and 1512 for the 2.05Gy condition. Only aberrations involving painted chromosomes are considered. The error-bars represent the 95% confidence limits for a Poisson distribution.
The two irradiation conditions induced roughly the same frequency of
incomplete translocations in CD4-positive lymphocytes.
4.5.3 Apoptosis
Because differences in cell death between the two conditions could have
implications in the chromosomal aberration frequency, our irradiation
conditions were also tested using apoptosis as a measure of radiation-induced
cell death in the same samples used for the FISH study. The aim was to verify
whether differences in chromosome aberration rates were due or not to
differences in apoptosis rates. Three hours after the challenging doses were
administered, approximately 1.5% of the general lymphocyte population and
4% of the CD4-positive cells were going through apoptosis (i.e. were annexin V
positive). There was no detectable difference amongst irradiation conditions
(control, conditioned and unconditioned).
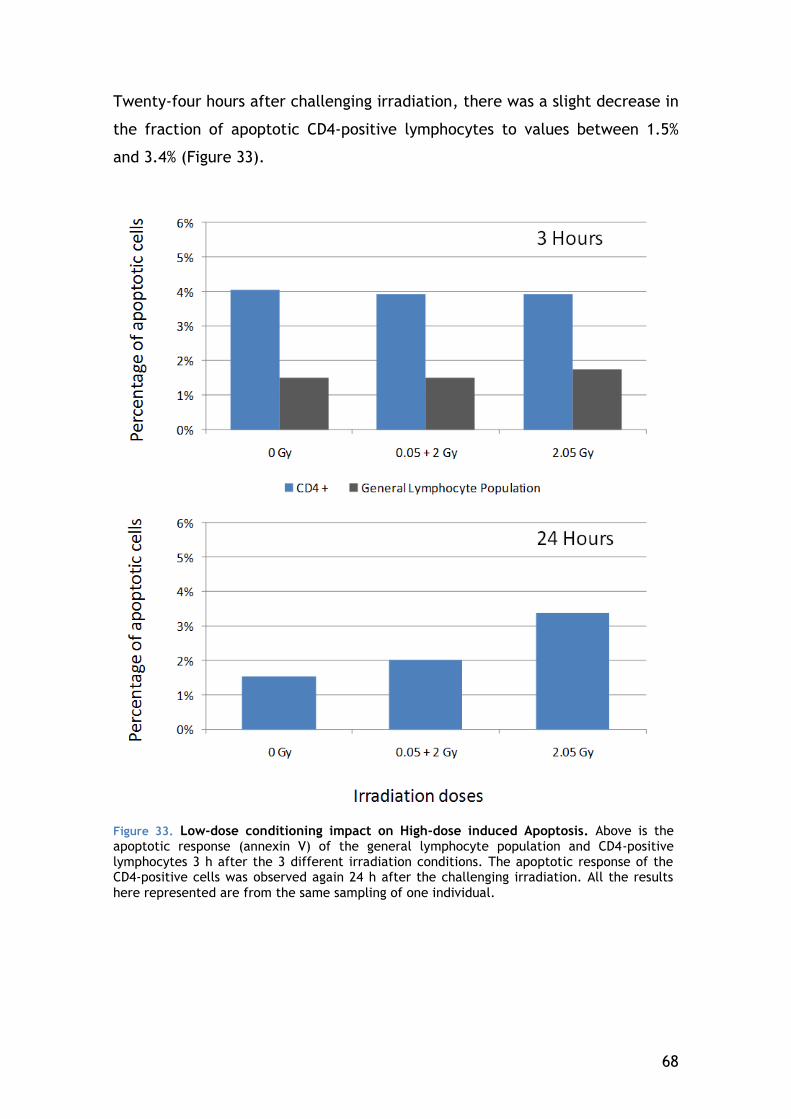
68
Twenty-four hours after challenging irradiation, there was a slight decrease in
the fraction of apoptotic CD4-positive lymphocytes to values between 1.5%
and 3.4% (Figure 33).
Figure 33. Low-dose conditioning impact on High-dose induced Apoptosis. Above is the apoptotic response (annexin V) of the general lymphocyte population and CD4-positive lymphocytes 3 h after the 3 different irradiation conditions. The apoptotic response of the CD4-positive cells was observed again 24 h after the challenging irradiation. All the results
here represented are from the same sampling of one individual.
69
5 DISCUSSION
5.1 Establishing and validating a fast and sensible
gamma-H2AX protocol
Gamma-H2AX signalling has been described as an assay capable of quantifying
DSB induced by ionizing radiation (E P Rogakou et al. 1998). In a clinical
context, most attempts of developing a fast gamma-H2AX assay, used a flow
cytometry approach (Olive & Banáth 2004; Porcedda et al. 2008; Bourton et
al. 2011; Ismail et al. 2007; Muslimovic et al. 2008). This technique has the
advantage of analyzing a high number of cells but measures the relative
intensity of the gamma-H2AX staining instead of scoring the actual number of
foci. Actually, manual scoring of gamma-H2AX foci with a microscope gives
the true number of foci per cell allowing the detection of ionizing radiation
doses almost ten times lower than with flow cytometry (Ismail et al. 2007).
Scoring gamma-H2AX foci has proven to be an approach sensitive to the point
of detecting doses as low as 0.001 Gy (Rothkamm & Markus Löbrich 2003).
Since our work focused on subtle low-dose responses, we needed a tool that
could detect small changes in focus scores and that was fast enough to be
used on a large scale. To be able to analyze microscope images as quickly as
possible image acquisition of the slides as well as focus scoring were therefore
done automatically.
5.1.1 Speed of processing and analysis
Manual scoring of gamma-H2AX foci through microscope eyepieces is time-
consuming and may become tiresome if many samples need to be analyzed.
The alternative used in this work was to acquire z-stacked images
automatically and score on images instead of slides avoiding issues of slide
prolonged conservation and fluorescence fading. The automation of image
acquisition, although not essential for the focus scoring that follows, will
render it less time consuming for the operator. Automatic acquisition is
70
becoming a standard function in many systems of computer-controlled
microscopes. The acquisition software that we used is relatively common in
cytogenetic labs and several alternatives exist, both commercial and open
source, like micro-manager (http://micro-manager.org/). Also in the interest
of shortening acquisition and analysis time, 250 cells were established as the
minimum number of cells to score in order to reach CV values below 10%.
With our current configuration, acquisition took under 8 min per condition
(500 cells acquired to insure the analysis of 250).
The number of scored cells varies greatly across publications and very few
describe their scoring limits. Similarly to this work, Beels et al. scored
manually on images gamma-H2AX foci of 200 to 250 T-lymphocytes (Beels et
al. 2010). However, other authors establish their limits by the number of foci.
Kuefner et al. scored manually until reaching 40 foci (Kuefner et al. 2010),
which, with our conditions, would not have been enough since at least 70 foci
needed to be counted to insure a CV below 10%.
In terms of scoring speed, we were able, after some training, to score
manually 0.5 cells per second on images. The automated alternatives
(HistoLab™ and CellProfiler) used in this study were at least 5 times faster
than manual scoring on the same images. However, these two automatic
scoring systems are not equivalent since they vary in terms of “operator
time”. The use of HistoLab™ allows the user to associate the unbiased
automatic cell and focus detection with a visual supervision during the manual
loading of each image. On the other hand, the analysis step is still dependent
on the operators’ availability, increasing the “operator time” needed for the
analysis. Our goal was to develop a complete automated image cytometry
with an acceptable compromise between operator time and scoring quality
(i.e. a protocol that requires operator intervention time as low as possible,
while keeping a good scoring sensitivity). With CellProfiler, the user only
takes about 30 seconds to launch the analysis, which will continue in his
absence. Moreover, if several conditions need to be analysed several
computers can work simultaneously, multiplying the speed analysis by the
number of machines available.
71
Given our current protocol, which uses CellProfiler, it is possible to obtain the
analysis results of an irradiated blood sample in less than 6 h.
5.1.2 Characterization and validation of the automated analysis
As long as the blood sample is in good condition to allow lymphocyte isolation
and processing, the slides obtained using our method are very rich in
analyzable lymphocytes. However in degraded experimental conditions
lymphocytes are frequently polluted by granulocytes and other cell debris; it
is therefore needed to insure that the analysis of the resulting images is
limited to the cells of interest. Because lymphocytes tend to be rounder and
to have brighter DAPI staining, their morphology allows operators scoring
manually to count them alone. In Histolab™, after all the nuclei in the image
are detected, the user has also the possibility to manually remove cells which
have aberrant staining or morphology. CellProfiler is a freeware image
analysis program that offers a great number of measurement and detection
options. The general nuclei detection in the images used an Ostu algorithm,
as seen in other works on fibroblasts (Hou et al. 2009). However, in our case,
a more specific selection was required to discard non-lymphocytes and
damaged cells from the analysis. Therefore we used these measurements to
choose only the brighter and rounder cells therefore limiting the analysis to
lymphocytes. This morphology-based lymphocyte selection was validated by
comparison with a CD3 staining and can be performed in the absence of
human intervention.
For gamma-H2AX foci analysis, we chose to score all detectable foci whatever
the scoring method used. The coherence of such selection was validated by
the linear relationship of gamma-H2AX foci rate with radiation dose. Actually,
restricting the selection to the brightest foci reduced the linearity of this
correlation. The results obtained in our sham-irradiated condition have shown
that the background number of foci per cell was of 0.31. This is acceptable as
there are great variations concerning this background level across the
different labs working with lymphocytes. The mean yield of gamma-H2AX in
72
non-irradiated lymphocytes has been described to be as low as 0.09 (Sandrine
Roch-Lefèvre et al. 2010) or as high as 0.67 (Beels et al. 2010).
Given the dose response that we observed, our protocol estimates that an
irradiation of 1 Gy should induce an average of 10 foci per cell. This is well
within the range of the published works on radiation induced gamma-H2AX
signalling response in lymphocytes. As examples: Beels et al. obtained a
relation of 8.6 foci per cell per Gy (Beels et al. 2010), Vilasová et al. obtained
15 foci per cell per Gy (Vilasová et al. 2008) and Löbrich et al. obtained 20
foci per cell per Gy (Markus Löbrich et al. 2005).
5.1.3 Comparison with other approaches in the literature
The number of image cytometry applications that are capable of automated
scoring is increasing. In the publications that applied them to gamma-H2AX
focus scoring in lymphocytes, all seem to present good correlations to manual
scoring once the good parameters are inputted (Jost et al. 2009; Garty et al.
2010; Sandrine Roch-Lefèvre et al. 2010; Ivashkevich et al. 2011). We believe
that the choice of the ideal program probably depends more on the type of
experiment rather than the sensitivity of the program itself. The scope of the
comparison was reduced to the free alternatives to the programs used in our
work.
A free alternative that resembles HistoLab™ is FociCounter (Jucha et al.
2010): it was developed specifically to score foci, with a simple interface and
few parameters to change (faster to set up). Both programs are ideal for
simple scoring of a reduced number of cells/conditions, where the quality of
the images/slides frequently requires operator intervention (to eliminate
aberrant objects, for example). Since these programs require user
intervention to select nuclei, the time of the analysis is their main
disadvantage.
CellProfiler is a freeware image analysis program that offers a great number
of measurement and detection options. The main drawback of CellProfiler is a
less user-friendly graphical user interface that may render the vast number of
73
detection algorithms and measurements overwhelming to a beginner.
However, once the pipeline is set up, it requires very little operator
intervention for analysis. We do not compare it to imageJ (Jost et al. 2009)
since a CellProfiler module has been recently created to allow the user to run
ImageJ macros and plugins as part of a CellProfiler image processing pipeline
(http://cellprofiler.org/CPmanual/RunImageJ.html).
In a recent publication, Ivashkevich et al. (2011) present a new image
cytometry program that will become freely available. The details on the
measurements that will be possible to obtain with this software are not yet
disclosed, so we cannot fairly compare it with CellProfiler. However, the
computational approach that they present is a good reference to help
researchers in selecting the parameters of other programs of this type
(Ivashkevich et al. 2011).
5.1.4 Potential and limitations of the gamma-H2AX protocol
The loss of viability of the samples from Ghent showed an important
limitation to consider: the fast sample degradation of whole blood. After
changing and characterizing our protocol, we believe it to be well adapted for
experiments using whole blood irradiations preformed 24 h or less after
sampling. Furthermore it possess the sensitivity required for the low-dose
context.
Besides the experiments here reported, this method could be used to obtain
potentially relevant information only retrievable by a microscope approach. A
good example can be found in the work of Böcker and Iliakis, where they use
a microscope-based automated analysis to quantify gamma-H2AX and Rad51
foci colocalisation (Böcker & Iliakis 2006). To measure data of gamma-H2AX
foci can also be useful to study focus spatial distribution and bystander effect
after microbeam irradiations (Ivashkevich et al. 2011). Another possible
application is to compare conditions in terms of focus intensity, as done in
this work to reveal the bias of scoring only the brightest foci.
However, this technique has also limitations that need to be mentioned. It is
better adapted to experiments involving a reduced number of foci per cell.
74
Foci overlap occurs quite easily in small cells like lymphocytes. Here it is
possibly the factor behind the small foci underestimation at 0.5 Gy for
automated scoring. Others have also reported underestimations when using
automated detection. Jost et al. found twice more foci when scoring manually
lymphocytes irradiated at 1 Gy than their ImageJ module (Jost et al. 2009).
When using this protocol to study colocalization, it is important to be
attentive to possible bias due to antibody competition or fluorochrome bleed-
through (Rénier et al. 2007).
In conclusion, the protocol presented here can combine automated acquisition
with high-throughput image cytometry to produce a focus score similar to that
of manual scoring, with typical kinetics and a linear correlation with dose.
This method has proven to be fast and sufficiently sensitive to detect doses as
low as 0.005 Gy. Given our current protocol conditions it is possible to obtain
the analysis results of an irradiated blood sample in less than 6 h. Our
automatic scoring technique produced results fast enough to be seriously
considered as an alternative to flow cytometry, for studies that need more
detailed information about foci number, distribution, size or intensity.
Moreover, any kind of microscopically visible nuclear domains can be
quantified in the same manner. Although our research focused more on
gamma-H2AX foci, its flexibility allows this method to be adapted to other
human lymphocyte-related projects or even other cell types.
5.2 Low-dose response
The gamma-H2AX scoring results of both HistoLab™ and CellProfiler were
similar to manual scoring and sensitive enough to statistically distinguish 30
min after exposure the sham-irradiated condition from the 0.05 Gy dose. In
fact, using CellProfiler to score foci, it was possible to detect doses as low as
0.005 Gy.
In terms of repair kinetics, we found that low doses (0.005 to 0.05 Gy)
induced foci that disappeared at a slower rate than those induced by higher
doses (0.1 to 0.5 Gy). This is also in accordance with the findings of Löbrich et
al. in lymphocytes and scoring manually: his group found that 5 h after X-ray
75
irradiation, only 10 % of the foci induced by 0.5 Gy were present whereas still
half of the foci induced by 0.005 Gy were present at the same time (Markus
Löbrich et al. 2005).
5.2.1 Variation of lymphocyte subset response
By using CD-specific membrane staining we were able to discriminate the
response of the different lymphocyte subsets. CD4-positive lymphocytes were
the subset that had the highest radiation-induced gamma-H2AX signalling.
CD19-positive lymphocytes were the cell fraction that presented the lowest
gamma-H2AX focus score. These results are consistent with the work of
Andrievski and Wilkins. Using flow cytometry, they observed that CD4-positive
lymphocytes had a response 1.10 times higher than CD8-positive and 1.56
times higher than CD19-positive cells after being irradiated at 2 Gy
(Andrievski & Wilkins 2009). However, at 2.05 Gy, we did not find a consistent
difference of response among the subsets.
Given that different lymphocyte subsets could have distinct gamma-H2AX
signalling responses, we discriminated the response of lymphocyte subsets to
determine if that reduced variation in some of our radio adaptation response
experiments. Nevertheless, at the conditions we used to test lymphocyte
radio adaptation, we did not find any subset of consistent response between
two individuals.
Given the generally higher gamma-H2AX response of CD4-positive lymphocytes
at low-dose, it would be interesting to observe more closely this subset using
doses below 0.005 Gy to improve even further the sensitivity of the test.
5.3 Individual Clinical radiosensitivity
At Ghent University, Joke Werbrouck and colleges used gamma-H2AX focus
scoring to evaluate DNA damage signalling kinetics of HNC patients of
76
characterized clinical acute radiosensitivity (using the CTCAE classification)
(Werbrouck et al. 2011). They irradiated isolated T-lymphocytes and
processed them at different times post-irradiation. After analyzing 31
samples, no statistically different gamma-H2AX response was found among the
3 CTCAE radiosensitivity groups. It was hypothesized that the absence of
difference in gamma-H2AX signalling kinetics could be due to the irradiation
conditions: isolated lymphocytes. Indeed, most of the few published works
that tried to link post-irradiation gamma-H2AX response in lymphocytes to
clinical radiosensitivity (both acute and late) irradiated isolated lymphocytes
and found no correlation (Olive et al. 2008; Vasireddy et al. 2010; Werbrouck
et al. 2010). Furthermore, another research group had reported that
irradiating whole blood from a highly radiosensitive individual produced
similar gamma-H2AX results to in vivo irradiation (CT scan) though in vitro
irradiation of isolated lymphocytes from the same person resulted in a normal
gamma-H2AX signalling response (Markus Löbrich et al. 2005).
To verify this hypothesis, we received samples from the same patients to
repeat the Ghent experiments irradiating whole blood instead of isolated
lymphocytes. However, after the travel between the two labs, many blood
samples became unusable and no statistical comparison of the results could
be done neither with the work of Joke Werbrouck nor between
radiosensitivity groups. Given the small amount of analyzable samples, we
had to join the results of the CTC1 and CTC2 patients to have an equivalent
quantity of data to compare to the patients of highest clinical acute
sensitivity (CTC3). We failed to see a difference in DNA damage signalling
between these two radiosensitivity groups (CTC1+2 and CTC3).
Presently, it is not possible to conclude whether there was a difference in
gamma-H2AX signalling in this study group to be found. The irradiation
conditions were not necessarily impairing the test’s sensitivity: Rübe et al.
(2010) irradiated both whole blood and isolated lymphocytes and
demonstrated that, using the gamma-H2AX foci approach, patients at high risk
of developing high- grade life-threatening or lethal toxicities after radio-/
chemotherapy could be identified (C. E. Rübe et al. 2010). Moreover, Bourton
et al. (2011), only irradiated isolated lymphocytes to follow DSB repair with
77
gamma-H2AX and was able to discriminate 3 groups: cancer patients with
extreme secondary overreactions, cancer patients with none to mild
secondary effects to radiotherapy and a non-cancer control group (Bourton et
al. 2011). They attributed their successful results to the selection of
extremely radiosensitive cases for their study groups. This is coherent with
other works that have been able to point out particularly overreacting
patients inside their more radiosensitive groups (but not all) or individuals
with known DSB repair deficiencies (like ATM-/- or Ligase IV -/-) using gamma-
H2AX (Vasireddy et al. 2010; Markus Löbrich et al. 2005; Werbrouck et al.
2011).
These results show that gamma-H2AX has promise in detecting quickly and
sensitively individuals with an atypical response to DSB and, therefore,
potentially more susceptible to cancer or life-threatening reactions to
radiotherapy. Assays like this may therefore help doctors tailor radiotherapy
treatments in the future. However, many radiosensitive patients cannot be
detected this way, particularly those with moderate radiosensitivity.
Furthermore, studies only focussing on the extreme radiosensitivity cases are
not representative of the general population. A better understanding of the
link between DSB repair and clinical sensitivity is necessary in order to
improve the predictive power of these tests. A possible starting point would
be to include the co-localization of gamma-H2AX with other DNA repair
proteins like ATM or MRE11 (Joubert et al. 2008).
5.4 Radio-adaptive response
In the final part of this work, we turned to a low-dose response currently
known as radio-adaptive response in which an exposure to a low-dose (0.005
to 0.2Gy) reduces the damages that result from a higher dose (0.4 to 8 Gy)
delivered some time after (Sheldon Wolff 1998; Tapio & Jacob 2007).
Here, we report the results of experiments where whole blood from the same
individual was irradiated in two distinct ways to achieve a total dose of 2.05
Gy: either an acute (single) exposure or a fractionated irradiation of 0.05 Gy
followed by 2Gy 3 h later.
78
It was not possible to measure the maximum induction of DSB (that would be
detected around 30 min after the challenging dose) since too many
overlapping foci would result of these doses. So we cannot draw any
conclusions regarding the initial radiation-induced DNA damage between the
two tested conditions. Nevertheless, the similar foci yield obtained at 3 and 5
h post-challenging indicate that the two conditions we were comparing had
very similar DSB repair kinetics. In terms of gamma-H2AX signalling, we found
no statistical difference between the two conditions. To insure that these
results were not due to a limitation of the automated scoring to separate
overlapped foci, we confirmed the results by scoring manually some
individuals. Even though manual scoring detected more foci per cell than
automated scoring, the final result did not change. There was no detectable
difference in gamma-H2AX response between the conditioned and
unconditioned samples. This is consistent with previous findings of gamma-
H2AX response in fibroblasts. With a 0.1 Gy conditioning dose given 4 h
before challenging, they observed no difference in gamma-H2AX fluorescence
between conditioned and unconditioned cells, for challenging doses up to 3
Gy. No differences in the kinetics of disappearance of foci were found either
(Cramers et al. 2005).
Because different lymphocyte subsets can have distinct gamma-H2AX
signalling responses at low doses, we discriminated the radio-adaptive
response for the 3 lymphocyte subsets. We found no specific changes in
gamma-H2AX response due to priming irradiation for any lymphocyte subset.
We then focused in the response to radiation of CD4-positive lymphocytes.
Given their generally higher gamma-H2AX and gene modulation responses
(Gruel et al. 2008) to low-doses (in the dose range of the priming dose), this
subtype seemed to be the more adequate study the differences in DNA
damage that arise due to a pre-irradiation.
Although we did not find any difference between these two conditions in
gamma-H2AX signalling at 3 and 5 h, when we used FISH painting to see the
specific result of this DNA repair, we found indications that DNA repair had in
79
fact been changed by the priming dose. The lymphocytes conditioned by the
low dose exposure had almost half the two-way translocations of the
unconditioned counterparts. This cannot be called a radio-adaptive response
since the conditioning also increased significantly the number of dicentrics
and one-way translocations.
This increase in dicentrics is not consistent with the previous works of
Barquinero (1995) and Sasaki (2002). Barquinero worked with peripheral blood
lymphocytes isolated from a group of twelve hospital workers occupationally
exposed to X- and gamma-rays. Their cells were considered to be primed in
vivo and showed lower frequencies of dicentrics after in vitro irradiation at 2
Gy than the non-exposed control group (J F Barquinero et al. 1995). Sasaki
induced adaptive response with a 0.02 Gy pre-irradiation of embryonic CB17
mouse cells. After the 3 Gy challenging dose, the conditioned cells exhibited
less dicentrics than the unconditioned controls (Masao S Sasaki et al. 2002).
There are a few possible explanations for the results reported here. For the
acute 2.05 Gy irradiation, it would be probabilistically expected to generate
the same number of apparently simple translocations (one way, two-way, and
incomplete) and apparently simple dicentrics (Duran et al. 2009), however
this condition has quite less dicentrics. This can be explained by the fact that
we used 72 h of culture and dicentrics are more negatively selected by
division than translocations (considered more stable). Cell division could also
be the reason why the conditioned sample had more dicentrics than the
unconditioned sample: if the fractioned irradiation induced more (or longer)
cell cycle arrest than the acute 2.05 Gy irradiation, the higher division rate of
the latter would account for its lower dicentrics frequency.
Another factor of importance to explain the differences found between
0.05+2 Gy and 2.05 Gy is apoptosis. It is important to mention that the
apoptosis test used here was performed in lymphocytes that were not
activated by magnetic beads. Given the low apoptotic rate induced by both
conditions and the fact that cell proliferation is known to rescue human
peripheral blood lymphocytes from radiation induced apoptosis (Carloni et al.
80
2001) it is relatively unlikely that apoptosis would be the main pathway
behind these different chromosomal aberration frequencies.
Given the known variability in radio-adaptive response and the unexpected
ratio of dicentrics versus two-way aberrations in the unconditioned sample
these experiments need to be repeated before concrete conclusions can be
drawn. Moreover, gamma-H2AX signalling response should be observed at
later times to have a wider study of DNA repair kinetics. There has been
recently observed that the lower priming irradiation increases cell survival by
stimulation of NHEJ repair, with consequences to H2AX signalling kinetics.
Apoptosis should be quantified in cultured cells as well as non-cultured cells,
to better understand the potential effect in radio-adaptive response.
To better understand these results, this experiment should be repeated with
some changes. Firstly, gamma-H2AX response should be observed at later
post-irradiation times to better follow the progression of DNA repair. At times
intervals were the number of foci has lowered enough automatic scoring
should be able to produce more accurate results.
To assess if pre-irradiating induces a longer cell cycle arrest, we could
determine a simple mitotic index at different post irradiation times, before
and after the 72-hour point presented here. An alternative would be to do a
giemsa colouring at 72 h and compare the secondary metaphase frequencies
of the two test conditions.
Additionally, apoptosis and micronuclei assays should be performed for the
same times and using cultured cells, to better assess the impact of cell death
in the resulting chromosomal aberration frequencies.
81
General conclusions and perspectives
The first objective of this work was to develop a sensitive and fast in
vitro assay to evaluate individual radiation sensitivity in human peripheral
lymphocytes by using gamma-H2AX quantification.
To reach this aim, we used a microscopy approach to score foci and
applied automation to the image acquisition and focus scoring steps to reduce
the operator time, making the procedure more viable to be used in a large
scale. We were able to distinguish from the sham-irradiated condition doses
as low as 0.005 Gy, 30 minutes after exposure. In terms of speed, our
approach allows us to obtain the focus yield of a sample in less than 24 h,
with only 30 seconds of operator time for the focus scoring step.
Several steps were taken to characterize and validate this protocol.
However more are needed before it can be used routinely in an analysis lab:
more individuals need to be added to the dose-effect curves
established
doses below 0.005 Gy should be included to better establish the
detection threshold
the intra-individual variability should be assessed
Additionally, the specific response of different lymphocyte subsets was
discriminated. Different subsets respond to radiation with different
intensities. Therefore, by focusing on the response of one subset, it should be
possible to develop clinical tests that are potentially more specific and/or
more sensitive. We found a higher gamma-H2AX response in CD4-positive
lymphocytes, which makes it the most promising in this regard.
More doses and individuals should also be included in the dose-effet
curve of CD4-positive lymphocytes, to determine if the detection threshold is
improved by focusing on this subset.
To determine the potential of this approach to predict clinical
radiosensitivity, an initial version of the protocol was applied to determine de
foci yield of samples from Belgian radiotherapy patients of different known
82
radiosensitivities. The samples were irradiated in vitro and the foci yield of
the general lymphocyte population was determined for different post-
exposure times. No noticeable difference was detected in the foci yield of
patients with different clinical radiosensitivities.
Since this experiment, our approach has been improved and validated.
So much so that we believe that another test should be performed with
samples from individuals of different clinical radiosensitivities. For this new
test, however, we would focus on CD4-positive lymphocytes and include a few
extreme cases of clinical radiosensitivity.
In view of the difficulties found in obtaining additional blood samples
from radiotherapy donors in France for a more complete study, the initial
work plan was reoriented. Consequently we focused in lymphocyte gamma-
H2AX signalling in another context of different radiosensitivity: radio-adaptive
response. This phenomenon has been primarily seen using other endpoints like
cell survival and chromosomal aberrations. Therefore, we performed
apoptosis and FISH assays to determine if our experimental conditions induced
this response before quantifying the gamma-H2AX response. Our preliminary
results show a radio-adaptive response in terms of the two-way translocations
induced but not for the apoptosis or the gamma-H2AX assays. Furthermore,
the dicentrics frequency increased in the fractionated irradiation instead of
presenting a radio-adaptive response.
These experiments need to be repeated in at least two other
individuals before concrete conclusions can be made. Furthermore, the
apoptosis and gamma-H2AX responses need to be quantified at later post-
exposure times (between 24 and 72 hours), to better understand the
observations made with the FISH assay.
83
References
Agarwal, S., Tafel, A. a & Kanaar, R., 2006. DNA double-strand break repair and chromosome translocations. DNA repair, 5(9-10), pp.1075-81. Available at: http://www.ncbi.nlm.nih.gov/pubmed/16798112 [Accessed July 4, 2010].
Andrievski, A. & Wilkins, R.C., 2009. The response of gamma-H2AX in human lymphocytes and lymphocytes subsets measured in whole blood cultures. International journal of radiation biology, 85(4), pp.369-76. Available at: http://www.ncbi.nlm.nih.gov/pubmed/19399682 [Accessed September 9, 2010].
Averbeck, D., 2000. Mécanismes de réparation et mutagenèse radio-induite chez les eucaryotes supérieurs. Cancer / Radiothérapie, 4(5), pp.335-354.
Azria, D. & Ozsahin, M., 2009. Individual radiosensitivity measured with lymphocytes: late effects are the key point: in regard to borgmann et Al. (Int j radiat oncol biol phys 2008;71:256-264). International journal of radiation oncology, biology, physics, 74(2), pp.654; author reply 654-5. Available at: http://www.ncbi.nlm.nih.gov/pubmed/19327902 [Accessed April 23, 2011].
Barnett, G.C. et al., 2009. Normal tissue reactions to radiotherapy: towards tailoring treatment dose by genotype. Nature reviews. Cancer, 9(2), pp.134-42. Available at: http://www.pubmedcentral.nih.gov/articlerender.fcgi?artid=2670578&tool=pmcentrez&rendertype=abstract [Accessed September 15, 2010].
Barquinero, J F et al., 1995. Occupational exposure to radiation induces an adaptive response in human lymphocytes. International journal of radiation biology, 67(2), pp.187-91. Available at: http://www.ncbi.nlm.nih.gov/pubmed/7884287.
Bassing, C.H. et al., 2002. Increased ionizing radiation sensitivity and genomic instability in the absence of histone H2AX. Proceedings of the National Academy of Sciences of the United States of America, 99(12), pp.8173-8. Available at: http://www.pubmedcentral.nih.gov/articlerender.fcgi?artid=123040&tool=pmcentrez&rendertype=abstract [Accessed October 18, 2010].
Beels, L., Werbrouck, J. & Thierens, H., 2010. Dose response and repair kinetics of gamma-H2AX foci induced by in vitro irradiation of whole blood and T-lymphocytes with X- and gamma-radiation. International journal of radiation biology, 86(9), pp.760-8. Available at: http://www.ncbi.nlm.nih.gov/pubmed/20597840 [Accessed October 7, 2010].
84
Bentzen, S. & Overgaard, J., 1994. Patient-to-Patient Variability in the Expression of Radiation-Induced Normal Tissue Injury. Seminars in radiation oncology, 4(2), pp.68-80. Available at: http://www.ncbi.nlm.nih.gov/pubmed/10717093 [Accessed April 21, 2011].
Bergonie, J. & Tribondeau, L., 1906. Interpretation de quelques resultats de la radiotherapie et essai de fixation dʼ une technique “rationelle.” Comptes-Rendus des Séances de lʼ Académie des Sciences, 143, pp.983-985.
Bhogal, N., Jalali, F. & Bristow, R.G., 2009. Microscopic imaging of DNA repair foci in irradiated normal tissues. International journal of radiation biology, 85(9), pp.732-46. Available at: http://www.ncbi.nlm.nih.gov/pubmed/19296345 [Accessed September 29, 2010].
Boreham, D.R. et al., 2000. Dose-rate effects for apoptosis and micronucleus formation in gamma-irradiated human lymphocytes. Radiation research, 153(5 Pt 1), pp.579-86. Available at: http://www.ncbi.nlm.nih.gov/pubmed/10790279.
Bourton, E.C. et al., 2011. Prolonged expression of the γ-H2AX DNA repair biomarker correlates with excess acute and chronic toxicity from radiotherapy treatment. International journal of cancer. Journal international du cancer. Available at: http://www.ncbi.nlm.nih.gov/pubmed/21491423 [Accessed April 26, 2011].
Böcker, W. & Iliakis, G., 2006. Computational Methods for analysis of foci: validation for radiation-induced gamma-H2AX foci in human cells. Radiation research, 165(1), pp.113-24. Available at: http://www.ncbi.nlm.nih.gov/pubmed/16392969 [Accessed September 8, 2010].
Carloni, M. et al., 2001. PHA-induced cell proliferation rescues human peripheral blood lymphocytes from X-ray-induced apoptosis. Mutagenesis, 16(2), pp.115-20. Available at: http://www.ncbi.nlm.nih.gov/pubmed/11230552.
Celeste, A. et al., 2002. Genomic instability in mice lacking histone H2AX. Science (New York, N.Y.), 296(5569), pp.922-7. Available at: http://www.ncbi.nlm.nih.gov/pubmed/11934988 [Accessed May 26, 2011].
Ciccia, A. & Elledge, S.J., 2010. The DNA damage response: making it safe to play with knives. Molecular cell, 40(2), pp.179-204. Available at: http://www.pubmedcentral.nih.gov/articlerender.fcgi?artid=2988877&tool=pmcentrez&rendertype=abstract [Accessed May 22, 2011].
85
Coleman, M. a et al., 2005. Low-dose irradiation alters the transcript profiles of human lymphoblastoid cells including genes associated with cytogenetic radioadaptive response. Radiation research, 164(4 Pt 1), pp.369-82. Available at: http://www.ncbi.nlm.nih.gov/pubmed/16187739 [Accessed May 27, 2011].
Cramers, P. et al., 2005. Pre-exposure to low doses: modulation of X-ray-induced dna damage and repair? Radiation research, 164(4 Pt 1), pp.383-90. Available at: http://www.ncbi.nlm.nih.gov/pubmed/16187740 [Accessed September 9, 2010].
Daly, M.J. et al., 2007. Protein oxidation implicated as the primary determinant of bacterial radioresistance. PLoS biology, 5(4), p.e92. Available at: http://www.ncbi.nlm.nih.gov/pubmed/17373858.
Dikomey, E. & Brammer, I., 2000. Relationship between cellular radiosensitivity and non-repaired double-strand breaks studied for different growth states, dose rates and plating conditions in a normal human fibroblast line. International journal of radiation biology, 76(6), pp.773-81. Available at: http://www.ncbi.nlm.nih.gov/pubmed/10902731 [Accessed April 23, 2011].
Dimova, E.G., Bryant, P.E. & Chankova, S.G., 2008. Adaptive response: some underlying mechanisms and open questions. Genetics and Molecular Biology, 31(2), pp.396-408. Available at: http://www.scielo.br/scielo.php?script=sci_arttext&pid=S1415-47572008000300002&lng=en&nrm=iso&tlng=en.
Djuzenova, C.S. et al., 2001. Response to X-irradiation of Fanconi anemia homozygous and heterozygous cells assessed by the single-cell gel electrophoresis (comet) assay. Laboratory investigation; a journal of technical methods and pathology, 81(2), pp.185-92. Available at: http://www.ncbi.nlm.nih.gov/pubmed/11232640 [Accessed August 15, 2011].
Drouet, J. et al., 2005. DNA-dependent protein kinase and XRCC4-DNA ligase IV mobilization in the cell in response to DNA double strand breaks. The Journal of biological chemistry, 280(8), pp.7060-9. Available at: http://www.ncbi.nlm.nih.gov/pubmed/15520013 [Accessed August 18, 2010].
Duran, A. et al., 2009. Persistence of radiation-induced chromosome aberrations in a long-term cell culture. Radiation research, 171(4), pp.425-37. Available at: http://www.ncbi.nlm.nih.gov/pubmed/19397443.
Dörr, W. & Hendry, J.H., 2001. Consequential late effects in normal tissues. Radiotherapy and oncology : journal of the European Society for
86
Therapeutic Radiology and Oncology, 61(3), pp.223-31. Available at: http://www.ncbi.nlm.nih.gov/pubmed/11730991.
Feinendegen, L.E., Pollycove, M. & Neumann, R.D., 2007. Whole-body responses to low-level radiation exposure: new concepts in mammalian radiobiology. Experimental hematology, 35(4 Suppl 1), pp.37-46. Available at: http://www.ncbi.nlm.nih.gov/pubmed/17379086 [Accessed September 8, 2010].
Fernandez-Capetillo, O. et al., 2004. H2AX: the histone guardian of the genome. DNA repair, 3(8-9), pp.959-67. Available at: http://www.ncbi.nlm.nih.gov/pubmed/15279782.
Foray, N et al., 1997. Hypersensitivity of ataxia telangiectasia fibroblasts to ionizing radiation is associated with a repair deficiency of DNA double-strand breaks. International journal of radiation biology, 72(3), pp.271-83. Available at: http://www.ncbi.nlm.nih.gov/pubmed/9298107.
Frankenberg-Schwager, M., 1989. Review of repair kinetics for DNA damage induced in eukaryotic cells in vitro by ionizing radiation. Radiotherapy and oncology : journal of the European Society for Therapeutic Radiology and Oncology, 14(4), pp.307-20. Available at: http://www.ncbi.nlm.nih.gov/pubmed/2657873 [Accessed April 23, 2011].
Furuta, T. et al., 2003. Phosphorylation of histone H2AX and activation of Mre11, Rad50, and Nbs1 in response to replication-dependent DNA double-strand breaks induced by mammalian DNA topoisomerase I cleavage complexes. The Journal of biological chemistry, 278(22), pp.20303-12. Available at: http://www.ncbi.nlm.nih.gov/pubmed/12660252.
Garty, G. et al., 2010. The RABIT: a rapid automated biodosimetry tool for radiological triage. Health physics, 98(2), pp.209-17. Available at: http://www.pubmedcentral.nih.gov/articlerender.fcgi?artid=2923588&tool=pmcentrez&rendertype=abstract [Accessed October 7, 2010].
Goodarzi, A. a, Jeggo, P. & Lobrich, M., 2010. The influence of heterochromatin on DNA double strand break repair: Getting the strong, silent type to relax. DNA repair, 9(12), pp.1273-1282. Available at: http://www.ncbi.nlm.nih.gov/pubmed/21036673 [Accessed November 10, 2010].
Goodhead, D.T., 1999. Mechanisms for the biological effectiveness of high-LET radiations. Journal of radiation research, 40 Suppl, pp.1-13. Available at: http://www.ncbi.nlm.nih.gov/pubmed/10804988.
Goodhead, D.T., 1989. The initial physical damage produced by ionizing radiations. International journal of radiation biology, 56(5), pp.623-34. Available at: http://www.ncbi.nlm.nih.gov/pubmed/2573657.
87
Grawunder, U. et al., 1997. Activity of DNA ligase IV stimulated by complex formation with XRCC4 protein in mammalian cells. Nature, 388(6641), pp.492-5. Available at: http://www.ncbi.nlm.nih.gov/pubmed/9242410.
Green, M.H. et al., 1991. Comparative human cellular radiosensitivity: III. Gamma-radiation survival of cultured skin fibroblasts and resting T-lymphocytes from the peripheral blood of the same individual. International journal of radiation biology, 59(3), pp.749-65. Available at: http://www.ncbi.nlm.nih.gov/pubmed/1672363.
Gruel, G. et al., 2008. Broad modulation of gene expression in CD4+ lymphocyte subpopulations in response to low doses of ionizing radiation. Radiation research, 170(3), pp.335-44. Available at: http://www.ncbi.nlm.nih.gov/pubmed/18763857.
Hartlerode, A.J. & Scully, R., 2009. Mechanisms of double-strand break repair in somatic mammalian cells. The Biochemical journal, 423(2), pp.157-68. Available at: http://www.pubmedcentral.nih.gov/articlerender.fcgi?artid=2983087&tool=pmcentrez&rendertype=abstract [Accessed November 24, 2010].
Hou, Y.-N. et al., 2009. Development of an automated gamma-H2AX immunocytochemistry assay. Radiation research, 171(3), pp.360-7. Available at: http://www.ncbi.nlm.nih.gov/pubmed/19267563.
Ismail, I.H., Wadhra, T.I. & Hammarsten, O., 2007. An optimized method for detecting gamma-H2AX in blood cells reveals a significant interindividual variation in the gamma-H2AX response among humans. Nucleic acids research, 35(5), p.e36. Available at: http://www.pubmedcentral.nih.gov/articlerender.fcgi?artid=1865071&tool=pmcentrez&rendertype=abstract [Accessed September 9, 2010].
Ivashkevich, A.N. et al., 2011. γH2AX foci as a measure of DNA damage: A computational approach to automatic analysis. Mutation research. Available at: http://www.ncbi.nlm.nih.gov/pubmed/21216255 [Accessed April 28, 2011].
Jeggo, P a & Löbrich, M, 2007. DNA double-strand breaks: their cellular and clinical impact? Oncogene, 26(56), pp.7717-9. Available at: http://www.ncbi.nlm.nih.gov/pubmed/18066083 [Accessed September 27, 2010].
Jeggo, P. & Lavin, Martin F, 2009. Cellular radiosensitivity: how much better do we understand it? International journal of radiation biology, 85(12), pp.1061-81. Available at: http://www.ncbi.nlm.nih.gov/pubmed/19995233 [Accessed March 1, 2011].
Jeggo, P. & Löbrich, Markus, 2006. Radiation-induced DNA damage responses. Radiation protection dosimetry, 122(1-4), pp.124-7. Available at:
88
http://www.ncbi.nlm.nih.gov/pubmed/17351270 [Accessed September 27, 2010].
Joiner, M.C. et al., 1996. Hypersensitivity to very-low single radiation doses: its relationship to the adaptive response and induced radioresistance. Mutation research, 358(2), pp.171-83. Available at: http://www.ncbi.nlm.nih.gov/pubmed/8946022 [Accessed April 25, 2011].
Jost, G. et al., 2009. The influence of x-ray contrast agents in computed tomography on the induction of dicentrics and gamma-H2AX foci in lymphocytes of human blood samples. Physics in medicine and biology, 54(20), pp.6029-39. Available at: http://www.ncbi.nlm.nih.gov/pubmed/19779223 [Accessed October 7, 2010].
Joubert, A. et al., 2008. DNA double-strand break repair defects in syndromes associated with acute radiation response: at least two different assays to predict intrinsic radiosensitivity? International journal of radiation biology, 84(2), pp.107-25. Available at: http://www.ncbi.nlm.nih.gov/pubmed/18246480 [Accessed September 8, 2010].
Jucha, A. et al., 2010. FociCounter: A freely available PC programme for quantitative and qualitative analysis of gamma-H2AX foci. Mutation research, 696(1), pp.16-20. Available at: http://dx.doi.org/10.1016/j.mrgentox.2009.12.004 [Accessed August 18, 2010].
Khanna, K.K. et al., 2001. ATM, a central controller of cellular responses to DNA damage. Cell death and differentiation, 8(11), pp.1052-65. Available at: http://www.ncbi.nlm.nih.gov/pubmed/11687884.
Kim, J.-S. et al., 2005. Independent and sequential recruitment of NHEJ and HR factors to DNA damage sites in mammalian cells. The Journal of cell biology, 170(3), pp.341-7. Available at: http://www.pubmedcentral.nih.gov/articlerender.fcgi?artid=2171485&tool=pmcentrez&rendertype=abstract [Accessed August 18, 2010].
Kinner, A. et al., 2008. Gamma-H2AX in recognition and signaling of DNA double-strand breaks in the context of chromatin. Nucleic acids research, 36(17), pp.5678-94. Available at: http://www.pubmedcentral.nih.gov/articlerender.fcgi?artid=2553572&tool=pmcentrez&rendertype=abstract [Accessed September 8, 2010].
Kolesnick, R. & Fuks, Z., 2003. Radiation and ceramide-induced apoptosis. Oncogene, 22(37), pp.5897-906. Available at: http://www.ncbi.nlm.nih.gov/pubmed/12947396 [Accessed June 13, 2011].
89
Kuefner, M. a et al., 2010. Effect of CT scan protocols on x-ray-induced DNA double-strand breaks in blood lymphocytes of patients undergoing coronary CT angiography. European radiology. Available at: http://www.ncbi.nlm.nih.gov/pubmed/20625737 [Accessed September 27, 2010].
Kusch, T. et al., 2004. Acetylation by Tip60 is required for selective histone variant exchange at DNA lesions. Science (New York, N.Y.), 306(5704), pp.2084-7. Available at: http://www.ncbi.nlm.nih.gov/pubmed/15528408 [Accessed February 8, 2011].
Lavin, M F, 2007. ATM and the Mre11 complex combine to recognize and signal DNA double-strand breaks. Oncogene, 26(56), pp.7749-58. Available at: http://www.ncbi.nlm.nih.gov/pubmed/18066087 [Accessed April 23, 2011].
Leal, B.Z., Deahl, T.S. & Meltz, M.L., with Vijayalaxmi, 1995. Variability in adaptive response to low dose radiation in human blood lymphocytes: consistent results from chromosome aberrations and micronuclei. Mutation research, 348(1), pp.45-50. Available at: http://www.ncbi.nlm.nih.gov/pubmed/7565914 [Accessed September 9, 2010].
Little, J.B. et al., 1988. Survival of human diploid skin fibroblasts from normal individuals after X-irradiation. International journal of radiation biology, 54(6), pp.899-910. Available at: http://www.ncbi.nlm.nih.gov/pubmed/2903888 [Accessed April 23, 2011].
Lovejoy, C. a & Cortez, D., 2009. Common mechanisms of PIKK regulation. DNA repair, 8(9), pp.1004-8. Available at: http://www.pubmedcentral.nih.gov/articlerender.fcgi?artid=2725225&tool=pmcentrez&rendertype=abstract [Accessed October 15, 2010].
Löbrich, Markus & Kiefer, J., 2006. Assessing the likelihood of severe side effects in radiotherapy. International journal of cancer. Journal international du cancer, 118(11), pp.2652-6. Available at: http://www.ncbi.nlm.nih.gov/pubmed/16425223 [Accessed September 9, 2010].
Löbrich, Markus et al., 2005. In vivo formation and repair of DNA double-strand breaks after computed tomography examinations. Proceedings of the National Academy of Sciences of the United States of America, 102(25), pp.8984-9. Available at: http://www.pubmedcentral.nih.gov/articlerender.fcgi?artid=1150277&tool=pmcentrez&rendertype=abstract.
Mahaney, B.L., Meek, K. & Lees-Miller, S.P., 2009. Repair of ionizing radiation-induced DNA double-strand breaks by non-homologous end-
90
joining. The Biochemical journal, 417(3), pp.639-50. Available at: http://www.pubmedcentral.nih.gov/articlerender.fcgi?artid=2975036&tool=pmcentrez&rendertype=abstract [Accessed May 22, 2011].
Matsumoto, H. et al., 2009. A new paradigm in radioadaptive response developing from microbeam research. Journal of radiation research, 50 Suppl A(Suppl.A), pp.A67-79. Available at: http://www.ncbi.nlm.nih.gov/pubmed/19346687 [Accessed October 24, 2010].
Mladenov, E. & Iliakis, G., 2011. Induction and Repair of DNA Double Strand Breaks: The Increasing Spectrumof Non-homologous End Joining Pathways. Mutation research. Available at: http://www.ncbi.nlm.nih.gov/pubmed/21329706 [Accessed February 25, 2011].
Mohammadi, S. et al., 2006. Adaptive response of blood lymphocytes of inhabitants residing in high background radiation areas of ramsar- micronuclei, apoptosis and comet assays. Journal of radiation research, 47(3-4), pp.279-85. Available at: http://www.ncbi.nlm.nih.gov/pubmed/16988494 [Accessed September 9, 2010].
Morrison, A.J. et al., 2004. INO80 and gamma-H2AX interaction links ATP-dependent chromatin remodeling to DNA damage repair. Cell, 119(6), pp.767-75. Available at: http://www.ncbi.nlm.nih.gov/pubmed/15607974.
Muslimovic, A. et al., 2008. An optimized method for measurement of gamma-H2AX in blood mononuclear and cultured cells. Nature protocols, 3(7), pp.1187-93. Available at: http://www.ncbi.nlm.nih.gov/pubmed/18600224 [Accessed August 18, 2010].
Nakamura, A.J. et al., 2010. The complexity of phosphorylated H2AX foci formation and DNA repair assembly at DNA double-strand breaks. Cell cycle (Georgetown, Tex.), 9(2), pp.389-97. Available at: http://www.ncbi.nlm.nih.gov/pubmed/20046100 [Accessed September 15, 2010].
Ojima, M. et al., 2011. RADIATION-INDUCED BYSTANDER EFFECTS INDUCE RADIOADAPTIVE RESPONSE BY LOW-DOSE RADIATION. Radiation protection dosimetry, p.ncr169-. Available at: http://www.ncbi.nlm.nih.gov/pubmed/21561936 [Accessed May 16, 2011].
Olive, P.L. & Banáth, J.P., 2004. Phosphorylation of histone H2AX as a measure of radiosensitivity. International journal of radiation oncology, biology, physics, 58(2), pp.331-5. Available at:
91
http://www.ncbi.nlm.nih.gov/pubmed/14751500 [Accessed September 8, 2010].
Olive, P.L., Banáth, J.P. & Keyes, M., 2008. Residual gammaH2AX after irradiation of human lymphocytes and monocytes in vitro and its relation to late effects after prostate brachytherapy. Radiotherapy and oncology : journal of the European Society for Therapeutic Radiology and Oncology, 86(3), pp.336-46. Available at: http://www.ncbi.nlm.nih.gov/pubmed/17904670 [Accessed December 14, 2010].
Olivieri, G., Bodycote, J. & Wolff, S, 1984. Adaptive response of human lymphocytes to low concentrations of radioactive thymidine. Science (New York, N.Y.), 223(4636), pp.594-7. Available at: http://www.ncbi.nlm.nih.gov/pubmed/6695170 [Accessed May 16, 2011].
Otsu, N., 1979. A Threshold Selection Method from Gray-Level Histograms. IEEE Transactions on Systems, Man and Cybernetics, 9(1), pp.62-66.
Phillips, E.R. & McKinnon, P.J., 2007. DNA double-strand break repair and development. Oncogene, 26(56), pp.7799-808. Available at: http://www.ncbi.nlm.nih.gov/pubmed/18066093 [Accessed October 11, 2010].
Porcedda, P. et al., 2008. A rapid flow cytometry test based on histone H2AX phosphorylation for the sensitive and specific diagnosis of ataxia telangiectasia. Cytometry. Part A : the journal of the International Society for Analytical Cytology, 73(6), pp.508-16. Available at: http://www.ncbi.nlm.nih.gov/pubmed/18431795 [Accessed September 30, 2010].
Potten, C.S. & Wilson, J.W., 2004. Apoptosis: the life and death of cells, Cambridge Univ Pr. Available at: http://books.google.com/books?hl=en&lr=&id=YZRzeAEhsSsC&oi=fnd&pg=PR11&dq=Apoptosis:+the+life+and+death+of+cells&ots=1AnfzXT9_b&sig=qSCj7UwwurIc30VO9NTegMiLtMA [Accessed August 16, 2011].
Pouzoulet, F. et al., 2007. Monitoring Translocations by M-FISH and Three-color FISH Painting Techniques: A Study of Two Radiotherapy Patients. Journal of Radiation Research, 48(5), pp.425-434. Available at: http://joi.jlc.jst.go.jp/JST.JSTAGE/jrr/07013?from=CrossRef [Accessed May 25, 2011].
Prosser, J.S., 1976. Survival of human T and B lymphocytes after X-irradiation. International journal of radiation biology and related studies in physics, chemistry, and medicine, 30(5), pp.459-65. Available at: http://www.ncbi.nlm.nih.gov/pubmed/1087286 [Accessed June 13, 2011].
92
Roberts, S.A. et al., 2010. Ku is a 5ʼ-dRP/AP lyase that excises nucleotide damage near broken ends. Nature, 464(7292), pp.1214-7. Available at: http://www.pubmedcentral.nih.gov/articlerender.fcgi?artid=2859099&tool=pmcentrez&rendertype=abstract [Accessed May 14, 2011].
Roch-Lefèvre, Sandrine et al., 2010. Quantification of gamma-H2AX foci in human lymphocytes: a method for biological dosimetry after ionizing radiation exposure. Radiation research, 174(2), pp.185-94. Available at: http://www.ncbi.nlm.nih.gov/pubmed/20681785 [Accessed September 8, 2010].
Rogakou, E P et al., 1998. DNA double-stranded breaks induce histone H2AX phosphorylation on serine 139. The Journal of biological chemistry, 273(10), pp.5858-68. Available at: http://www.ncbi.nlm.nih.gov/pubmed/9488723.
Rogakou, Emmy P et al., 2000. Initiation of DNA fragmentation during apoptosis induces phosphorylation of H2AX histone at serine 139. The Journal of biological chemistry, 275(13), pp.9390-5. Available at: http://www.ncbi.nlm.nih.gov/pubmed/10734083 [Accessed September 9, 2010].
Rossetto, D. et al., 2010. Epigenetic Modifications in Double-Strand Break DNA Damage Signaling and Repair. Clinical cancer research : an official journal of the American Association for Cancer Research, pp.4543-4552. Available at: http://www.ncbi.nlm.nih.gov/pubmed/20823147 [Accessed September 9, 2010].
Roth, D.B. & Wilson, J.H., 1985. Relative rates of homologous and nonhomologous recombination in transfected DNA. Proceedings of the National Academy of Sciences of the United States of America, 82(10), pp.3355-9. Available at: http://www.pubmedcentral.nih.gov/articlerender.fcgi?artid=397774&tool=pmcentrez&rendertype=abstract [Accessed May 23, 2011].
Rothkamm, K. & Löbrich, Markus, 2003. Evidence for a lack of DNA double-strand break repair in human cells exposed to very low x-ray doses. Proceedings of the National Academy of Sciences of the United States of America, 100(9), pp.5057-62. Available at: http://www.pubmedcentral.nih.gov/articlerender.fcgi?artid=154297&tool=pmcentrez&rendertype=abstract [Accessed September 9, 2010].
Rénier, W. et al., 2007. Consequences of the bleed-through phenomenon in immunofluorescence of proteins forming radiation-induced nuclear foci. International journal of radiation biology, 83(8), pp.543-9. Available at: http://www.ncbi.nlm.nih.gov/pubmed/17613127 [Accessed October 4, 2010].
Rübe, C.E. et al., 2010. DNA repair alterations in children with pediatric malignancies: novel opportunities to identify patients at risk for high-
93
grade toxicities. International journal of radiation oncology, biology, physics, 78(2), pp.359-69. Available at: http://www.ncbi.nlm.nih.gov/pubmed/20153123 [Accessed April 22, 2011].
Sasaki, Masao S et al., 2002. DNA damage response pathway in radioadaptive response. Mutation research, 504(1-2), pp.101-18. Available at: http://www.ncbi.nlm.nih.gov/pubmed/12106651.
Schmitt, E. et al., 2007. DNA-damage response network at the crossroads of cell-cycle checkpoints, cellular senescence and apoptosis. Journal of Zhejiang University. Science. B, 8(6), pp.377-97. Available at: http://www.ncbi.nlm.nih.gov/pubmed/17565509.
Shadley, J D, 1994. Chromosomal adaptive response in human lymphocytes. Radiation research, 138(1 Suppl), pp.S9-12. Available at: http://www.ncbi.nlm.nih.gov/pubmed/8146337 [Accessed April 25, 2011].
Shadley, Jeffery D, Afzal, V. & Wolff, Sheldon, 1987. Characterization of the adaptive response to ionizing radiation induced by low doses of X rays to human lymphocytes. Radiation research, 111(3), pp.511-7. Available at: http://www.ncbi.nlm.nih.gov/pubmed/3659285 [Accessed April 26, 2011].
Shrivastav, M., De Haro, L.P. & Nickoloff, J. a, 2008. Regulation of DNA double-strand break repair pathway choice. Cell research, 18(1), pp.134-47. Available at: http://www.ncbi.nlm.nih.gov/pubmed/18157161.
Sorensen, K.J. et al., 2002. Adaptive response induction and variation in human lymphoblastoid cell lines. Mutation research, 519(1-2), pp.15-24. Available at: http://www.ncbi.nlm.nih.gov/pubmed/12160888.
Stewart, C.C., Stevenson, A.P. & Habbersett, R.C., 1988. The effect of low-dose irradiation on unstimulated and PHA-stimulated human lymphocyte subsets. International journal of radiation biology and related studies in physics, chemistry, and medicine, 53(1), pp.77-87. Available at: http://www.ncbi.nlm.nih.gov/pubmed/3257480 [Accessed May 23, 2011].
Stiff, T. et al., 2004. ATM and DNA-PK function redundantly to phosphorylate H2AX after exposure to ionizing radiation. Cancer research, 64(7), pp.2390-6. Available at: http://www.ncbi.nlm.nih.gov/pubmed/15059890.
Stoilov, L.M. et al., 2007. Adaptive response to DNA and chromosomal damage induced by X-rays in human blood lymphocytes. Mutagenesis, 22(2), pp.117-22. Available at: http://www.ncbi.nlm.nih.gov/pubmed/17229819.
94
Stucki, M. et al., 2005. MDC1 directly binds phosphorylated histone H2AX to regulate cellular responses to DNA double-strand breaks. Cell, 123(7), pp.1213-26. Available at: http://www.ncbi.nlm.nih.gov/pubmed/16377563 [Accessed September 15, 2010].
Stucki, M. & Jackson, Stephen P, 2004. MDC1/NFBD1: a key regulator of the DNA damage response in higher eukaryotes. DNA repair, 3(8-9), pp.953-7. Available at: http://www.ncbi.nlm.nih.gov/pubmed/15279781 [Accessed May 26, 2011].
Symington, L.S., 2002. Role of RAD52 epistasis group genes in homologous recombination and double-strand break repair. Microbiology and molecular biology reviews : MMBR, 66(4), pp.630-70, table of contents. Available at: http://www.pubmedcentral.nih.gov/articlerender.fcgi?artid=134659&tool=pmcentrez&rendertype=abstract [Accessed July 17, 2010].
Takata, M. et al., 1998. Homologous recombination and non-homologous end-joining pathways of DNA double-strand break repair have overlapping roles in the maintenance of chromosomal integrity in vertebrate cells. The EMBO journal, 17(18), pp.5497-508. Available at: http://www.pubmedcentral.nih.gov/articlerender.fcgi?artid=1170875&tool=pmcentrez&rendertype=abstract.
Tapio, S. & Jacob, V., 2007. Radioadaptive response revisited. Radiation and environmental biophysics, 46(1), pp.1-12. Available at: http://www.ncbi.nlm.nih.gov/pubmed/17131131 [Accessed August 27, 2010].
Turesson, I. et al., 1996. Prognostic factors for acute and late skin reactions in radiotherapy patients. International journal of radiation oncology, biology, physics, 36(5), pp.1065-75. Available at: http://www.ncbi.nlm.nih.gov/pubmed/8985028 [Accessed January 6, 2011].
Valente, M. et al., 2011. Automated gamma-H2AX focus scoring method for human lymphocytes after ionizing radiation exposure. Radiation Measurements. Available at: http://linkinghub.elsevier.com/retrieve/pii/S135044871100179X [Accessed May 20, 2011].
van Attikum, H. & Gasser, S.M., 2005. The histone code at DNA breaks: a guide to repair? Nature reviews. Molecular cell biology, 6(10), pp.757-65. Available at: http://www.ncbi.nlm.nih.gov/pubmed/16167054 [Accessed May 30, 2011].
van Gent, D.C. & van der Burg, M., 2007. Non-homologous end-joining, a sticky affair. Oncogene, 26(56), pp.7731-40. Available at:
95
http://www.ncbi.nlm.nih.gov/pubmed/18066085 [Accessed August 7, 2010].
Vasireddy, R.S. et al., 2010. H2AX phosphorylation screen of cells from radiosensitive cancer patients reveals a novel DNA double-strand break repair cellular phenotype. British journal of cancer, 102(10), pp.1511-8. Available at: http://www.pubmedcentral.nih.gov/articlerender.fcgi?artid=2869166&tool=pmcentrez&rendertype=abstract [Accessed January 3, 2011].
Vilasová, Z. et al., 2008. Changes in phosphorylation of histone H2A.X and p53 in response of peripheral blood lymphocytes to gamma irradiation. Acta biochimica Polonica, 55(2), pp.381-90. Available at: http://www.ncbi.nlm.nih.gov/pubmed/18596987.
Vokurková, D et al., 2006. CD8+ natural killer cells have a potential of a sensitive and reliable biodosimetric marker in vitro. Physiological research / Academia Scientiarum Bohemoslovaca, 55(6), pp.689-98. Available at: http://www.ncbi.nlm.nih.gov/pubmed/17177634 [Accessed September 8, 2010].
Wang, Hongyan, Guan, J. & Wang, Huichen, 2001. Replication Protein A2 Phosphorylation after DNA Damage by the Coordinated Action of Ataxia Telangiectasia-Mutated and DNA-dependent Protein Kinase Replication Protein A2 Phosphorylation after DNA Damage by the Coordinated Action of Ataxia Telangiectasia-. Cancer Research, pp.8554-8563.
Werbrouck, J. et al., 2010. Prediction of late normal tissue complications in RT treated gynaecological cancer patients: potential of the gamma-H2AX foci assay and association with chromosomal radiosensitivity. Oncology reports, 23(2), pp.571-8. Available at: http://www.ncbi.nlm.nih.gov/pubmed/20043123 [Accessed January 31, 2011].
Werbrouck, J. et al., 2011. Lack of a correlation between γH2AX foci kinetics in lymphocytes and the severity of acute normal tissue reactions during IMRT treatment for head and neck cancer. International journal of radiation biology, 87(1), pp.46-56. Available at: http://www.ncbi.nlm.nih.gov/pubmed/21142613 [Accessed January 24, 2011].
Wolff, Sheldon, 1998. The adaptive response in radiobiology: evolving insights and implications. Environmental health perspectives, 106 Suppl (February), pp.277-83. Available at: http://www.pubmedcentral.nih.gov/articlerender.fcgi?artid=1533272&tool=pmcentrez&rendertype=abstract [Accessed September 9, 2010].
Woods, G.M. & Lowenthal, R.M., 1984. Effects of irradiation on PHA-induced T-lymphocyte colonies: differential effects according to the timing of irradiation. Radiation research, 98(3), pp.606-13. Available at:
96
http://www.ncbi.nlm.nih.gov/pubmed/6610183 [Accessed August 16, 2011].
Yin, B. et al., 2009. Histone H2AX stabilizes broken DNA strands to suppress chromosome breaks and translocations during V(D)J recombination. The Journal of experimental medicine, 206(12), pp.2625-39. Available at: http://www.pubmedcentral.nih.gov/articlerender.fcgi?artid=2806628&tool=pmcentrez&rendertype=abstract [Accessed September 10, 2010].
Yu, X. et al., 2010. The ku dependent non-homologous end-joining pathway contributes to low dose radiation-stimulated cell survival. Journal of cellular physiology, 226(2), pp.369-74. Available at: http://www.ncbi.nlm.nih.gov/pubmed/20665702 [Accessed August 27, 2010].
Zhou, B.-bing B. & Elledge, S.J., 2000. The DNA damage response: putting checkpoints in perspective. Nature, 408(6811), pp.433-9. Available at: http://www.ncbi.nlm.nih.gov/pubmed/11100718 [Accessed May 30, 2011].
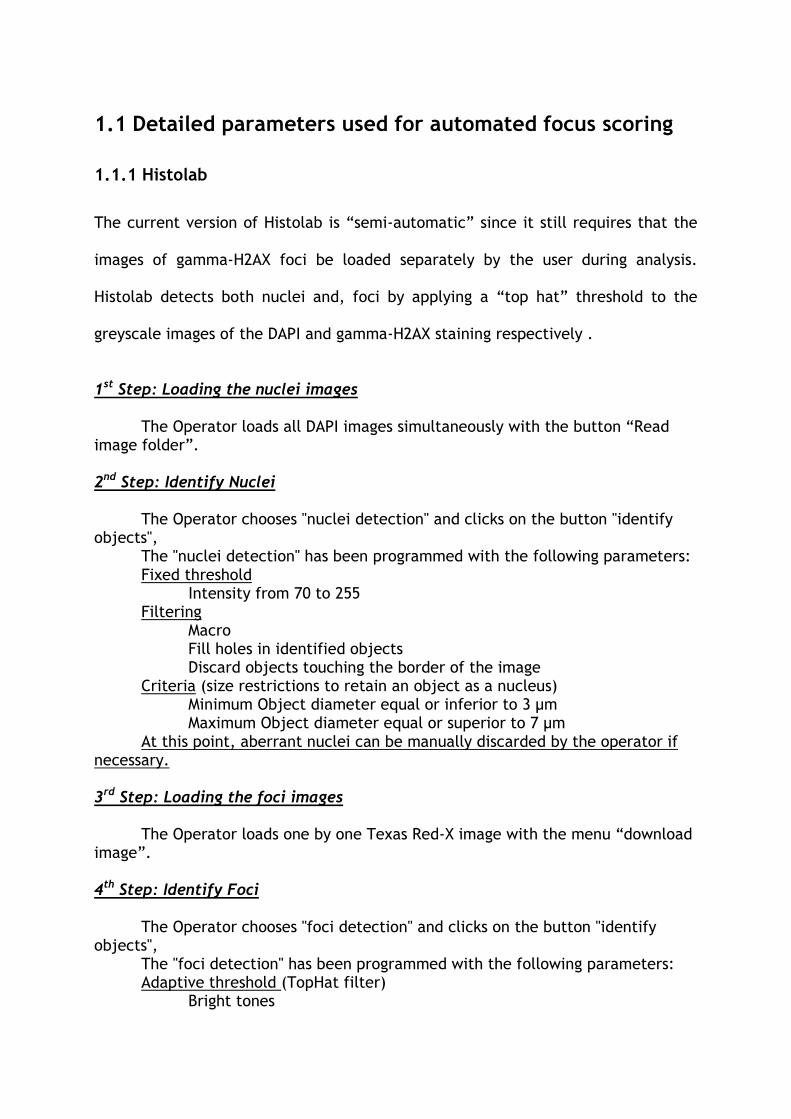
1.1 Detailed parameters used for automated focus scoring
1.1.1 Histolab
The current version of Histolab is “semi-automatic” since it still requires that the
images of gamma-H2AX foci be loaded separately by the user during analysis.
Histolab detects both nuclei and, foci by applying a “top hat” threshold to the
greyscale images of the DAPI and gamma-H2AX staining respectively .
1st Step: Loading the nuclei images
The Operator loads all DAPI images simultaneously with the button “Read image folder”.
2nd Step: Identify Nuclei
The Operator chooses "nuclei detection" and clicks on the button "identify
objects", The "nuclei detection" has been programmed with the following parameters: Fixed threshold Intensity from 70 to 255 Filtering Macro Fill holes in identified objects Discard objects touching the border of the image Criteria (size restrictions to retain an object as a nucleus) Minimum Object diameter equal or inferior to 3 µm Maximum Object diameter equal or superior to 7 µm At this point, aberrant nuclei can be manually discarded by the operator if
necessary.
3rd Step: Loading the foci images
The Operator loads one by one Texas Red-X image with the menu “download image”.
4th Step: Identify Foci
The Operator chooses "foci detection" and clicks on the button "identify
objects", The "foci detection" has been programmed with the following parameters: Adaptive threshold (TopHat filter) Bright tones
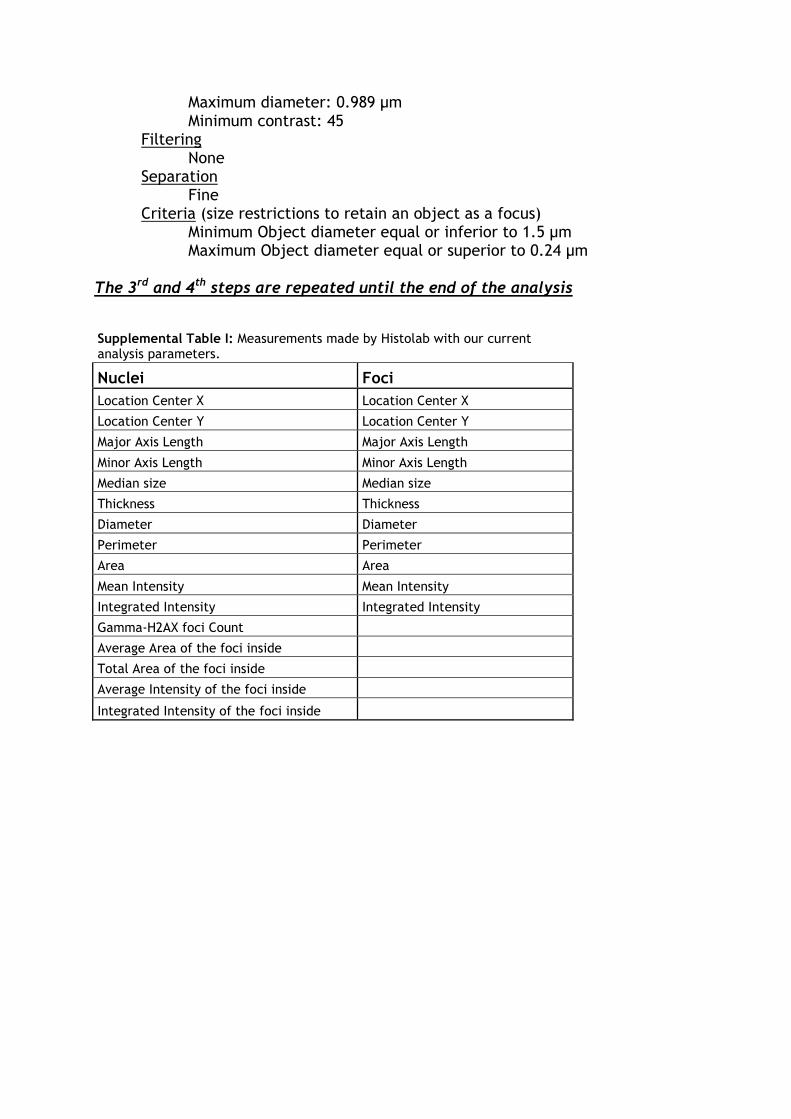
Maximum diameter: 0.989 µm Minimum contrast: 45 Filtering None Separation Fine Criteria (size restrictions to retain an object as a focus) Minimum Object diameter equal or inferior to 1.5 µm Maximum Object diameter equal or superior to 0.24 µm
The 3rd and 4th steps are repeated until the end of the analysis
Supplemental Table I: Measurements made by Histolab with our current analysis parameters.
Nuclei Foci
Location Center X Location Center X
Location Center Y Location Center Y
Major Axis Length Major Axis Length
Minor Axis Length Minor Axis Length
Median size Median size
Thickness Thickness
Diameter Diameter
Perimeter Perimeter
Area Area
Mean Intensity Mean Intensity
Integrated Intensity Integrated Intensity
Gamma-H2AX foci Count
Average Area of the foci inside
Total Area of the foci inside
Average Intensity of the foci inside
Integrated Intensity of the foci inside
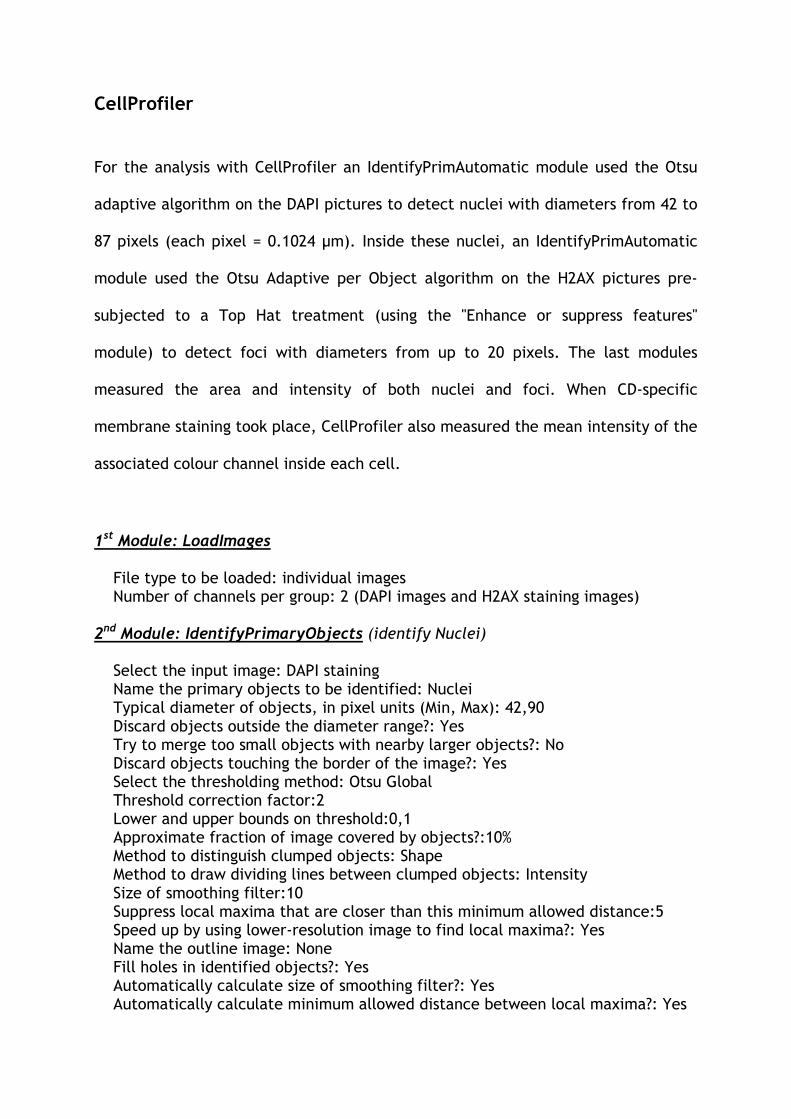
CellProfiler For the analysis with CellProfiler an IdentifyPrimAutomatic module used the Otsu
adaptive algorithm on the DAPI pictures to detect nuclei with diameters from 42 to
87 pixels (each pixel = 0.1024 µm). Inside these nuclei, an IdentifyPrimAutomatic
module used the Otsu Adaptive per Object algorithm on the H2AX pictures pre-
subjected to a Top Hat treatment (using the "Enhance or suppress features"
module) to detect foci with diameters from up to 20 pixels. The last modules
measured the area and intensity of both nuclei and foci. When CD-specific
membrane staining took place, CellProfiler also measured the mean intensity of the
associated colour channel inside each cell.
1st Module: LoadImages File type to be loaded: individual images Number of channels per group: 2 (DAPI images and H2AX staining images) 2nd Module: IdentifyPrimaryObjects (identify Nuclei) Select the input image: DAPI staining Name the primary objects to be identified: Nuclei Typical diameter of objects, in pixel units (Min, Max): 42,90 Discard objects outside the diameter range?: Yes Try to merge too small objects with nearby larger objects?: No Discard objects touching the border of the image?: Yes Select the thresholding method: Otsu Global Threshold correction factor:2 Lower and upper bounds on threshold:0,1 Approximate fraction of image covered by objects?:10% Method to distinguish clumped objects: Shape Method to draw dividing lines between clumped objects: Intensity Size of smoothing filter:10 Suppress local maxima that are closer than this minimum allowed distance:5 Speed up by using lower-resolution image to find local maxima?: Yes Name the outline image: None Fill holes in identified objects?: Yes Automatically calculate size of smoothing filter?: Yes Automatically calculate minimum allowed distance between local maxima?: Yes
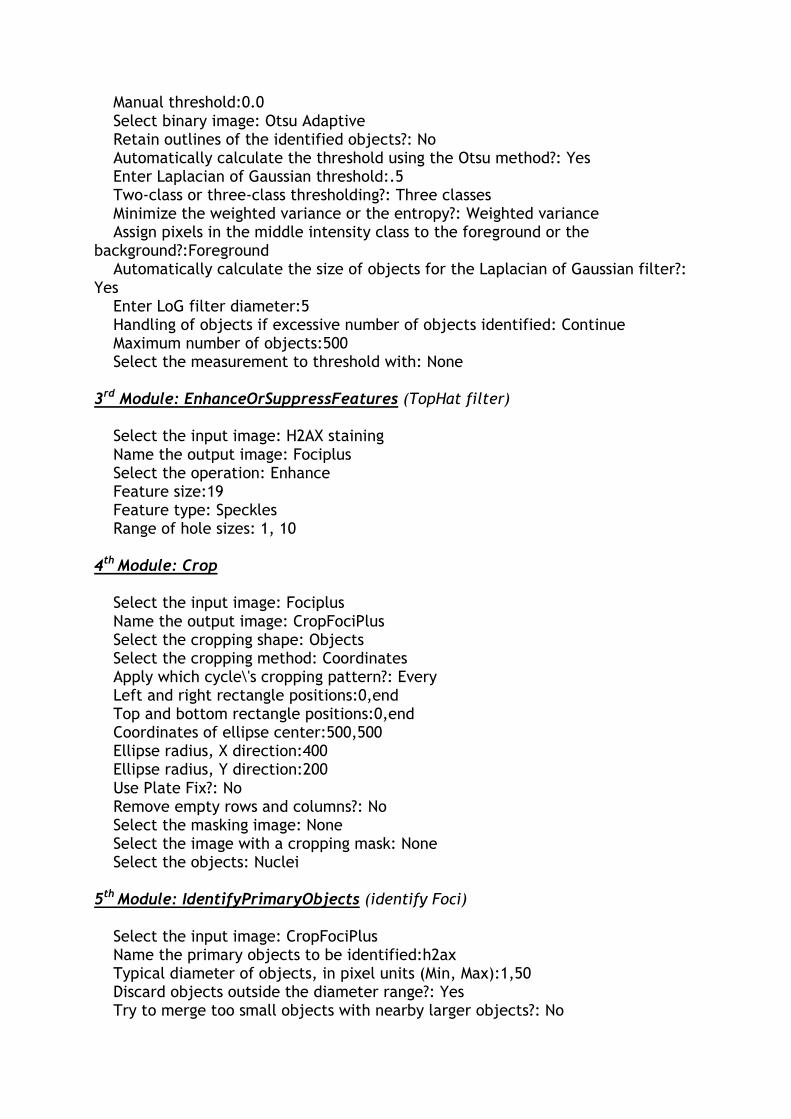
Manual threshold:0.0 Select binary image: Otsu Adaptive Retain outlines of the identified objects?: No Automatically calculate the threshold using the Otsu method?: Yes Enter Laplacian of Gaussian threshold:.5 Two-class or three-class thresholding?: Three classes Minimize the weighted variance or the entropy?: Weighted variance Assign pixels in the middle intensity class to the foreground or the background?:Foreground Automatically calculate the size of objects for the Laplacian of Gaussian filter?: Yes Enter LoG filter diameter:5 Handling of objects if excessive number of objects identified: Continue Maximum number of objects:500 Select the measurement to threshold with: None 3rd Module: EnhanceOrSuppressFeatures (TopHat filter) Select the input image: H2AX staining Name the output image: Fociplus Select the operation: Enhance Feature size:19 Feature type: Speckles Range of hole sizes: 1, 10 4th Module: Crop Select the input image: Fociplus Name the output image: CropFociPlus Select the cropping shape: Objects Select the cropping method: Coordinates Apply which cycle\'s cropping pattern?: Every Left and right rectangle positions:0,end Top and bottom rectangle positions:0,end Coordinates of ellipse center:500,500 Ellipse radius, X direction:400 Ellipse radius, Y direction:200 Use Plate Fix?: No Remove empty rows and columns?: No Select the masking image: None Select the image with a cropping mask: None Select the objects: Nuclei 5th Module: IdentifyPrimaryObjects (identify Foci) Select the input image: CropFociPlus Name the primary objects to be identified:h2ax Typical diameter of objects, in pixel units (Min, Max):1,50 Discard objects outside the diameter range?: Yes Try to merge too small objects with nearby larger objects?: No
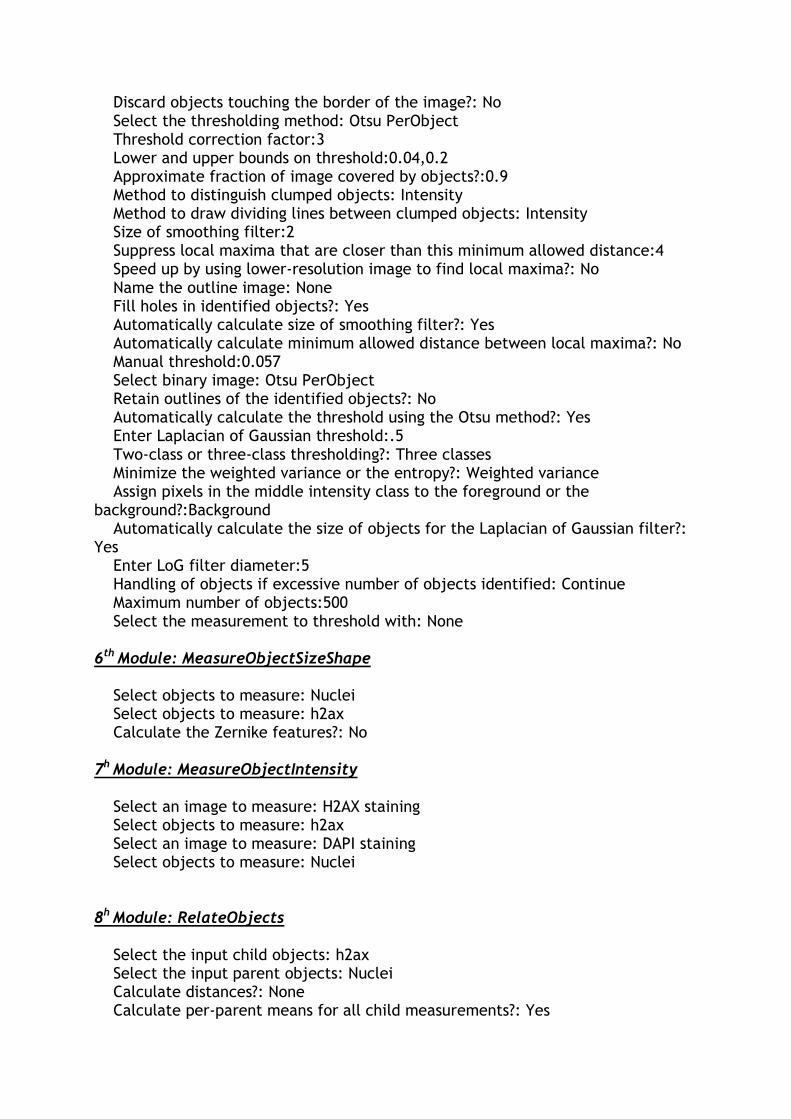
Discard objects touching the border of the image?: No Select the thresholding method: Otsu PerObject Threshold correction factor:3 Lower and upper bounds on threshold:0.04,0.2 Approximate fraction of image covered by objects?:0.9 Method to distinguish clumped objects: Intensity Method to draw dividing lines between clumped objects: Intensity Size of smoothing filter:2 Suppress local maxima that are closer than this minimum allowed distance:4 Speed up by using lower-resolution image to find local maxima?: No Name the outline image: None Fill holes in identified objects?: Yes Automatically calculate size of smoothing filter?: Yes Automatically calculate minimum allowed distance between local maxima?: No Manual threshold:0.057 Select binary image: Otsu PerObject Retain outlines of the identified objects?: No Automatically calculate the threshold using the Otsu method?: Yes Enter Laplacian of Gaussian threshold:.5 Two-class or three-class thresholding?: Three classes Minimize the weighted variance or the entropy?: Weighted variance Assign pixels in the middle intensity class to the foreground or the background?:Background Automatically calculate the size of objects for the Laplacian of Gaussian filter?: Yes Enter LoG filter diameter:5 Handling of objects if excessive number of objects identified: Continue Maximum number of objects:500 Select the measurement to threshold with: None 6th Module: MeasureObjectSizeShape Select objects to measure: Nuclei Select objects to measure: h2ax Calculate the Zernike features?: No 7h Module: MeasureObjectIntensity Select an image to measure: H2AX staining Select objects to measure: h2ax Select an image to measure: DAPI staining Select objects to measure: Nuclei 8h Module: RelateObjects Select the input child objects: h2ax Select the input parent objects: Nuclei Calculate distances?: None Calculate per-parent means for all child measurements?: Yes
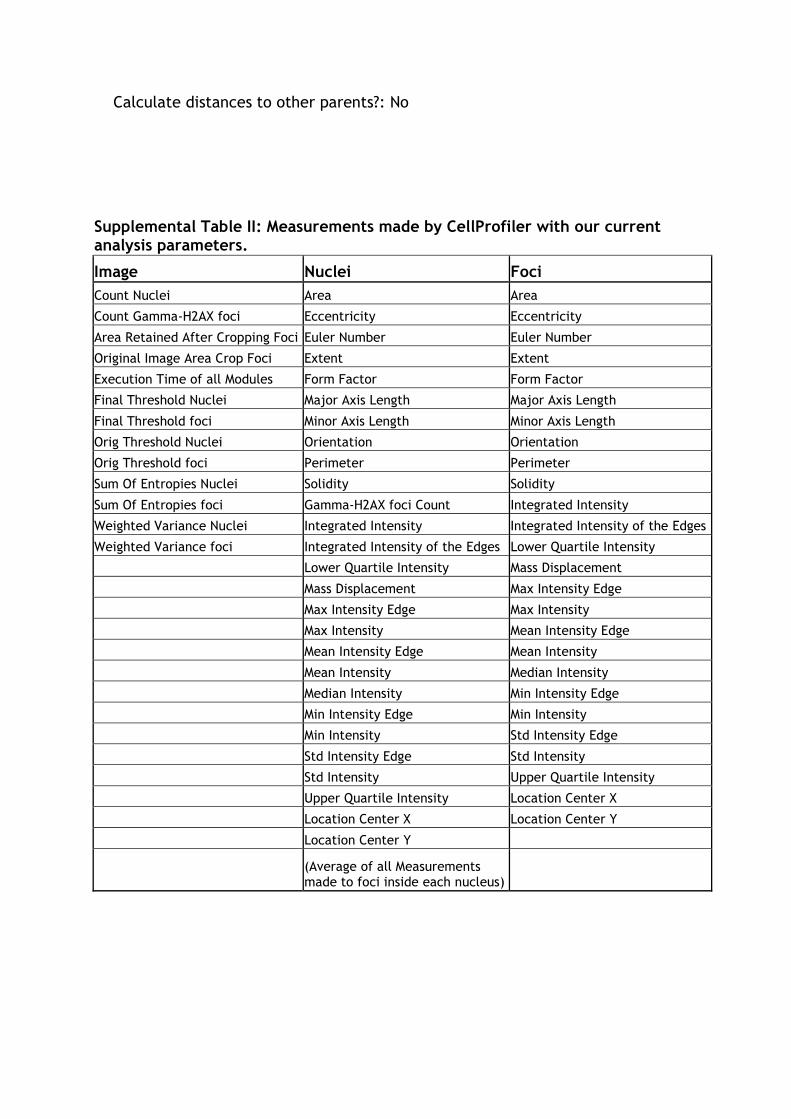
Calculate distances to other parents?: No
Supplemental Table II: Measurements made by CellProfiler with our current analysis parameters.
Image Nuclei Foci
Count Nuclei Area Area
Count Gamma-H2AX foci Eccentricity Eccentricity
Area Retained After Cropping Foci Euler Number Euler Number
Original Image Area Crop Foci Extent Extent
Execution Time of all Modules Form Factor Form Factor
Final Threshold Nuclei Major Axis Length Major Axis Length
Final Threshold foci Minor Axis Length Minor Axis Length
Orig Threshold Nuclei Orientation Orientation
Orig Threshold foci Perimeter Perimeter
Sum Of Entropies Nuclei Solidity Solidity
Sum Of Entropies foci Gamma-H2AX foci Count Integrated Intensity
Weighted Variance Nuclei Integrated Intensity Integrated Intensity of the Edges
Weighted Variance foci Integrated Intensity of the Edges Lower Quartile Intensity
Lower Quartile Intensity Mass Displacement
Mass Displacement Max Intensity Edge
Max Intensity Edge Max Intensity
Max Intensity Mean Intensity Edge
Mean Intensity Edge Mean Intensity
Mean Intensity Median Intensity
Median Intensity Min Intensity Edge
Min Intensity Edge Min Intensity
Min Intensity Std Intensity Edge
Std Intensity Edge Std Intensity
Std Intensity Upper Quartile Intensity
Upper Quartile Intensity Location Center X
Location Center X Location Center Y
Location Center Y
(Average of all Measurements made to foci inside each nucleus)

Publications
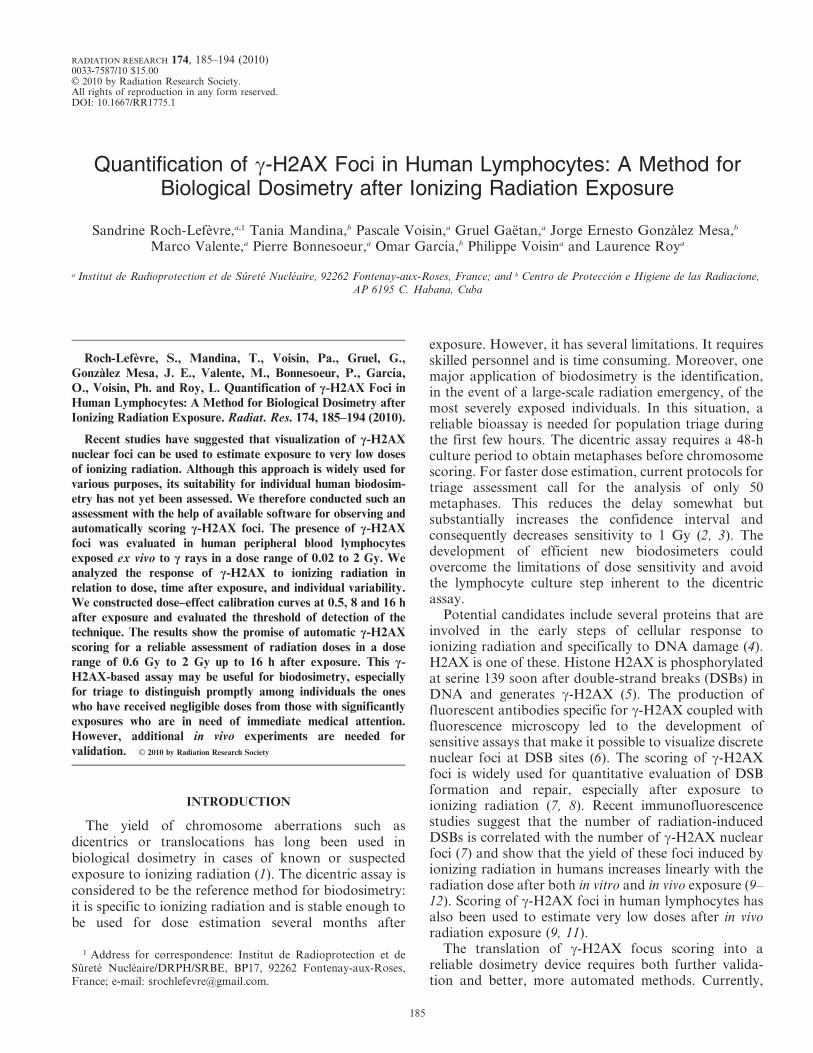
Quantification of c-H2AX Foci in Human Lymphocytes: A Method forBiological Dosimetry after Ionizing Radiation Exposure
Sandrine Roch-Lefevre,a,1 Tania Mandina,b Pascale Voisin,a Gruel Gaetan,a Jorge Ernesto Gonzalez Mesa,b
Marco Valente,a Pierre Bonnesoeur,a Omar Garcıa,b Philippe Voisina and Laurence Roya
a Institut de Radioprotection et de Surete Nucleaire, 92262 Fontenay-aux-Roses, France; and b Centro de Proteccion e Higiene de las Radiacione,AP 6195 C. Habana, Cuba
Roch-Lefevre, S., Mandina, T., Voisin, Pa., Gruel, G.,Gonzalez Mesa, J. E., Valente, M., Bonnesoeur, P., Garcıa,O., Voisin, Ph. and Roy, L. Quantification of c-H2AX Foci inHuman Lymphocytes: A Method for Biological Dosimetry afterIonizing Radiation Exposure. Radiat. Res. 174, 185–194 (2010).
Recent studies have suggested that visualization of c-H2AXnuclear foci can be used to estimate exposure to very low dosesof ionizing radiation. Although this approach is widely used forvarious purposes, its suitability for individual human biodosim-etry has not yet been assessed. We therefore conducted such anassessment with the help of available software for observing andautomatically scoring c-H2AX foci. The presence of c-H2AXfoci was evaluated in human peripheral blood lymphocytesexposed ex vivo to c rays in a dose range of 0.02 to 2 Gy. Weanalyzed the response of c-H2AX to ionizing radiation inrelation to dose, time after exposure, and individual variability.We constructed dose–effect calibration curves at 0.5, 8 and 16 hafter exposure and evaluated the threshold of detection of thetechnique. The results show the promise of automatic c-H2AXscoring for a reliable assessment of radiation doses in a doserange of 0.6 Gy to 2 Gy up to 16 h after exposure. This c-H2AX-based assay may be useful for biodosimetry, especiallyfor triage to distinguish promptly among individuals the oneswho have received negligible doses from those with significantlyexposures who are in need of immediate medical attention.However, additional in vivo experiments are needed forvalidation. g 2010 by Radiation Research Society
INTRODUCTION
The yield of chromosome aberrations such asdicentrics or translocations has long been used inbiological dosimetry in cases of known or suspectedexposure to ionizing radiation (1). The dicentric assay isconsidered to be the reference method for biodosimetry:it is specific to ionizing radiation and is stable enough tobe used for dose estimation several months after
exposure. However, it has several limitations. It requiresskilled personnel and is time consuming. Moreover, onemajor application of biodosimetry is the identification,in the event of a large-scale radiation emergency, of themost severely exposed individuals. In this situation, areliable bioassay is needed for population triage duringthe first few hours. The dicentric assay requires a 48-hculture period to obtain metaphases before chromosomescoring. For faster dose estimation, current protocols fortriage assessment call for the analysis of only 50metaphases. This reduces the delay somewhat butsubstantially increases the confidence interval andconsequently decreases sensitivity to 1 Gy (2, 3). Thedevelopment of efficient new biodosimeters couldovercome the limitations of dose sensitivity and avoidthe lymphocyte culture step inherent to the dicentricassay.
Potential candidates include several proteins that areinvolved in the early steps of cellular response toionizing radiation and specifically to DNA damage (4).H2AX is one of these. Histone H2AX is phosphorylatedat serine 139 soon after double-strand breaks (DSBs) inDNA and generates c-H2AX (5). The production offluorescent antibodies specific for c-H2AX coupled withfluorescence microscopy led to the development ofsensitive assays that make it possible to visualize discretenuclear foci at DSB sites (6). The scoring of c-H2AXfoci is widely used for quantitative evaluation of DSBformation and repair, especially after exposure toionizing radiation (7, 8). Recent immunofluorescencestudies suggest that the number of radiation-inducedDSBs is correlated with the number of c-H2AX nuclearfoci (7) and show that the yield of these foci induced byionizing radiation in humans increases linearly with theradiation dose after both in vitro and in vivo exposure (9–12). Scoring of c-H2AX foci in human lymphocytes hasalso been used to estimate very low doses after in vivoradiation exposure (9, 11).
The translation of c-H2AX focus scoring into areliable dosimetry device requires both further valida-tion and better, more automated methods. Currently,
1 Address for correspondence: Institut de Radioprotection et deSurete Nucleaire/DRPH/SRBE, BP17, 92262 Fontenay-aux-Roses,France; e-mail: [email protected].
RADIATION RESEARCH 174, 185–194 (2010)0033-7587/10 $15.00g 2010 by Radiation Research Society.All rights of reproduction in any form reserved.DOI: 10.1667/RR1775.1
185
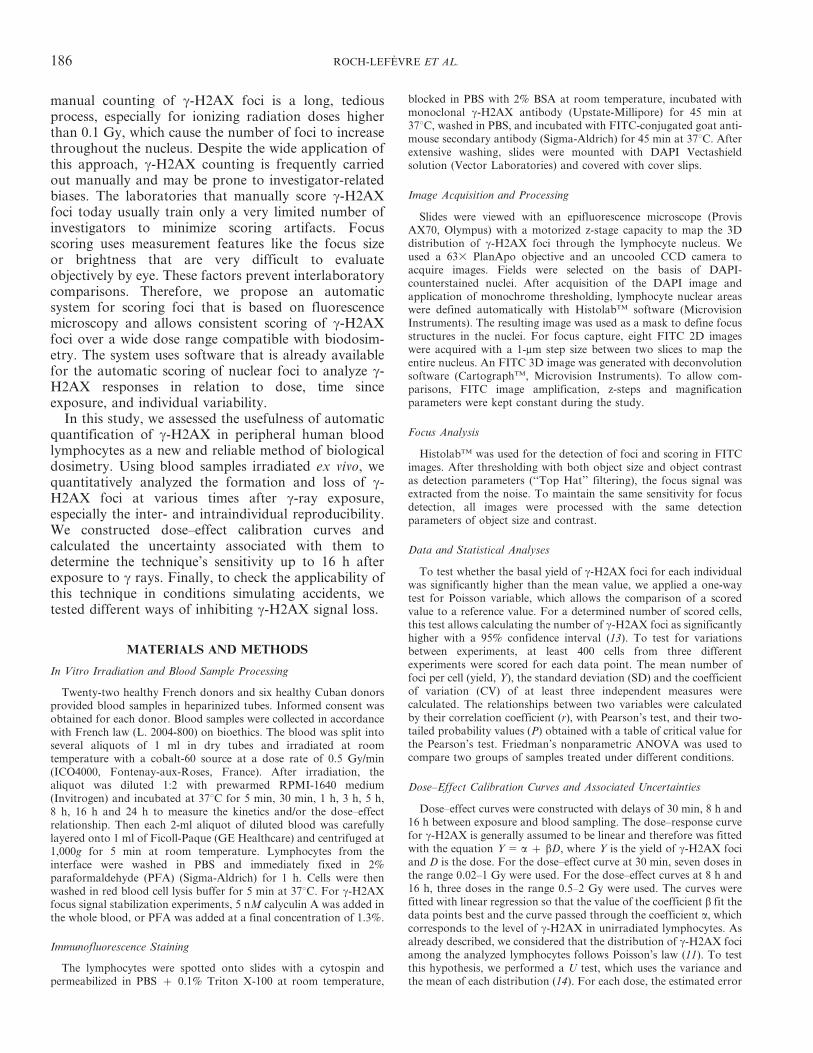
manual counting of c-H2AX foci is a long, tediousprocess, especially for ionizing radiation doses higherthan 0.1 Gy, which cause the number of foci to increasethroughout the nucleus. Despite the wide application ofthis approach, c-H2AX counting is frequently carriedout manually and may be prone to investigator-relatedbiases. The laboratories that manually score c-H2AXfoci today usually train only a very limited number ofinvestigators to minimize scoring artifacts. Focusscoring uses measurement features like the focus sizeor brightness that are very difficult to evaluateobjectively by eye. These factors prevent interlaboratorycomparisons. Therefore, we propose an automaticsystem for scoring foci that is based on fluorescencemicroscopy and allows consistent scoring of c-H2AXfoci over a wide dose range compatible with biodosim-etry. The system uses software that is already availablefor the automatic scoring of nuclear foci to analyze c-H2AX responses in relation to dose, time sinceexposure, and individual variability.
In this study, we assessed the usefulness of automaticquantification of c-H2AX in peripheral human bloodlymphocytes as a new and reliable method of biologicaldosimetry. Using blood samples irradiated ex vivo, wequantitatively analyzed the formation and loss of c-H2AX foci at various times after c-ray exposure,especially the inter- and intraindividual reproducibility.We constructed dose–effect calibration curves andcalculated the uncertainty associated with them todetermine the technique’s sensitivity up to 16 h afterexposure to c rays. Finally, to check the applicability ofthis technique in conditions simulating accidents, wetested different ways of inhibiting c-H2AX signal loss.
MATERIALS AND METHODS
In Vitro Irradiation and Blood Sample Processing
Twenty-two healthy French donors and six healthy Cuban donorsprovided blood samples in heparinized tubes. Informed consent wasobtained for each donor. Blood samples were collected in accordancewith French law (L. 2004-800) on bioethics. The blood was split intoseveral aliquots of 1 ml in dry tubes and irradiated at roomtemperature with a cobalt-60 source at a dose rate of 0.5 Gy/min(ICO4000, Fontenay-aux-Roses, France). After irradiation, thealiquot was diluted 1:2 with prewarmed RPMI-1640 medium(Invitrogen) and incubated at 37uC for 5 min, 30 min, 1 h, 3 h, 5 h,8 h, 16 h and 24 h to measure the kinetics and/or the dose–effectrelationship. Then each 2-ml aliquot of diluted blood was carefullylayered onto 1 ml of Ficoll-Paque (GE Healthcare) and centrifuged at1,000g for 5 min at room temperature. Lymphocytes from theinterface were washed in PBS and immediately fixed in 2%
paraformaldehyde (PFA) (Sigma-Aldrich) for 1 h. Cells were thenwashed in red blood cell lysis buffer for 5 min at 37uC. For c-H2AXfocus signal stabilization experiments, 5 nM calyculin A was added inthe whole blood, or PFA was added at a final concentration of 1.3%.
Immunofluorescence Staining
The lymphocytes were spotted onto slides with a cytospin andpermeabilized in PBS z 0.1% Triton X-100 at room temperature,
blocked in PBS with 2% BSA at room temperature, incubated withmonoclonal c-H2AX antibody (Upstate-Millipore) for 45 min at37uC, washed in PBS, and incubated with FITC-conjugated goat anti-mouse secondary antibody (Sigma-Aldrich) for 45 min at 37uC. Afterextensive washing, slides were mounted with DAPI Vectashieldsolution (Vector Laboratories) and covered with cover slips.
Image Acquisition and Processing
Slides were viewed with an epifluorescence microscope (ProvisAX70, Olympus) with a motorized z-stage capacity to map the 3Ddistribution of c-H2AX foci through the lymphocyte nucleus. Weused a 633 PlanApo objective and an uncooled CCD camera toacquire images. Fields were selected on the basis of DAPI-counterstained nuclei. After acquisition of the DAPI image andapplication of monochrome thresholding, lymphocyte nuclear areaswere defined automatically with HistolabTM software (MicrovisionInstruments). The resulting image was used as a mask to define focusstructures in the nuclei. For focus capture, eight FITC 2D imageswere acquired with a 1-mm step size between two slices to map theentire nucleus. An FITC 3D image was generated with deconvolutionsoftware (CartographTM, Microvision Instruments). To allow com-parisons, FITC image amplification, z-steps and magnificationparameters were kept constant during the study.
Focus Analysis
HistolabTM was used for the detection of foci and scoring in FITCimages. After thresholding with both object size and object contrastas detection parameters (‘‘Top Hat’’ filtering), the focus signal wasextracted from the noise. To maintain the same sensitivity for focusdetection, all images were processed with the same detectionparameters of object size and contrast.
Data and Statistical Analyses
To test whether the basal yield of c-H2AX foci for each individualwas significantly higher than the mean value, we applied a one-waytest for Poisson variable, which allows the comparison of a scoredvalue to a reference value. For a determined number of scored cells,this test allows calculating the number of c-H2AX foci as significantlyhigher with a 95% confidence interval (13). To test for variationsbetween experiments, at least 400 cells from three differentexperiments were scored for each data point. The mean number offoci per cell (yield, Y), the standard deviation (SD) and the coefficientof variation (CV) of at least three independent measures werecalculated. The relationships between two variables were calculatedby their correlation coefficient (r), with Pearson’s test, and their two-tailed probability values (P) obtained with a table of critical value forthe Pearson’s test. Friedman’s nonparametric ANOVA was used tocompare two groups of samples treated under different conditions.
Dose–Effect Calibration Curves and Associated Uncertainties
Dose–effect curves were constructed with delays of 30 min, 8 h and16 h between exposure and blood sampling. The dose–response curvefor c-H2AX is generally assumed to be linear and therefore was fittedwith the equation Y 5 a z bD, where Y is the yield of c-H2AX fociand D is the dose. For the dose–effect curve at 30 min, seven doses inthe range 0.02–1 Gy were used. For the dose–effect curves at 8 h and16 h, three doses in the range 0.5–2 Gy were used. The curves werefitted with linear regression so that the value of the coefficient b fit thedata points best and the curve passed through the coefficient a, whichcorresponds to the level of c-H2AX in unirradiated lymphocytes. Asalready described, we considered that the distribution of c-H2AX fociamong the analyzed lymphocytes follows Poisson’s law (11). To testthis hypothesis, we performed a U test, which uses the variance andthe mean of each distribution (14). For each dose, the estimated error
186 ROCH-LEFEVRE ET AL.
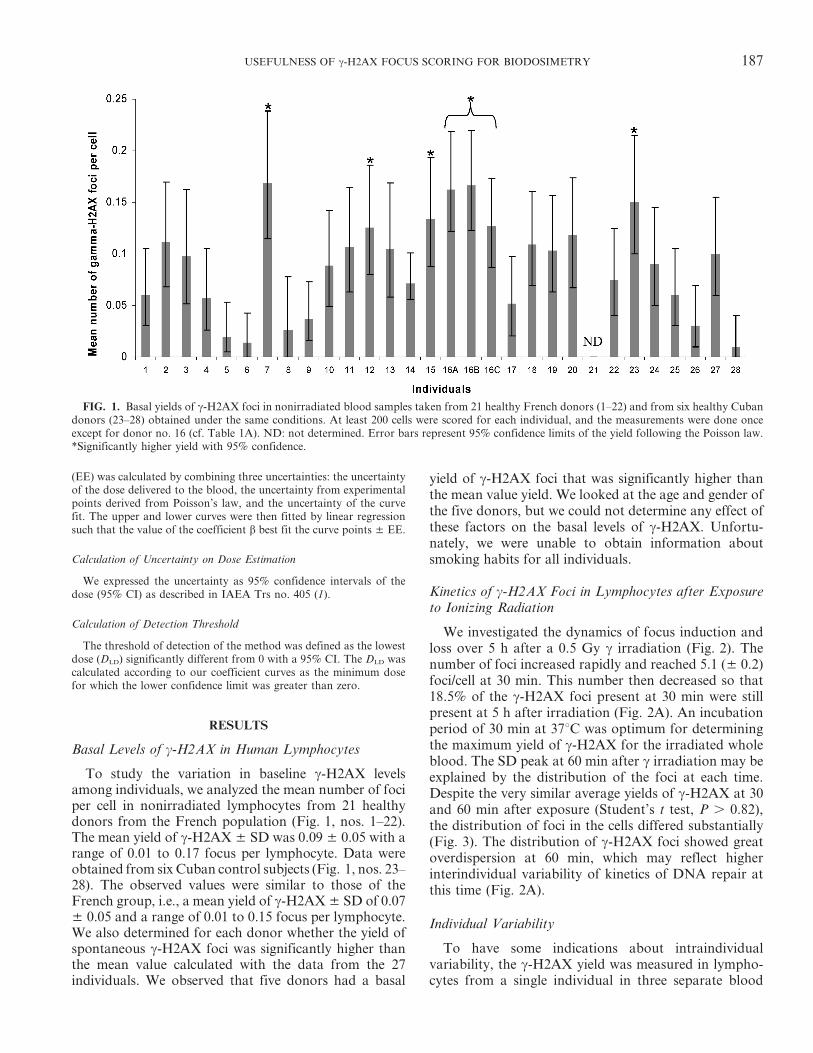
(EE) was calculated by combining three uncertainties: the uncertaintyof the dose delivered to the blood, the uncertainty from experimentalpoints derived from Poisson’s law, and the uncertainty of the curvefit. The upper and lower curves were then fitted by linear regressionsuch that the value of the coefficient b best fit the curve points ± EE.
Calculation of Uncertainty on Dose Estimation
We expressed the uncertainty as 95% confidence intervals of thedose (95% CI) as described in IAEA Trs no. 405 (1).
Calculation of Detection Threshold
The threshold of detection of the method was defined as the lowestdose (DLD) significantly different from 0 with a 95% CI. The DLD wascalculated according to our coefficient curves as the minimum dosefor which the lower confidence limit was greater than zero.
RESULTS
Basal Levels of c-H2AX in Human Lymphocytes
To study the variation in baseline c-H2AX levelsamong individuals, we analyzed the mean number of fociper cell in nonirradiated lymphocytes from 21 healthydonors from the French population (Fig. 1, nos. 1–22).The mean yield of c-H2AX ± SD was 0.09 ± 0.05 with arange of 0.01 to 0.17 focus per lymphocyte. Data wereobtained from six Cuban control subjects (Fig. 1, nos. 23–28). The observed values were similar to those of theFrench group, i.e., a mean yield of c-H2AX ± SD of 0.07± 0.05 and a range of 0.01 to 0.15 focus per lymphocyte.We also determined for each donor whether the yield ofspontaneous c-H2AX foci was significantly higher thanthe mean value calculated with the data from the 27individuals. We observed that five donors had a basal
yield of c-H2AX foci that was significantly higher thanthe mean value yield. We looked at the age and gender ofthe five donors, but we could not determine any effect ofthese factors on the basal levels of c-H2AX. Unfortu-nately, we were unable to obtain information aboutsmoking habits for all individuals.
Kinetics of c-H2AX Foci in Lymphocytes after Exposureto Ionizing Radiation
We investigated the dynamics of focus induction andloss over 5 h after a 0.5 Gy c irradiation (Fig. 2). Thenumber of foci increased rapidly and reached 5.1 (± 0.2)foci/cell at 30 min. This number then decreased so that18.5% of the c-H2AX foci present at 30 min were stillpresent at 5 h after irradiation (Fig. 2A). An incubationperiod of 30 min at 37uC was optimum for determiningthe maximum yield of c-H2AX for the irradiated wholeblood. The SD peak at 60 min after c irradiation may beexplained by the distribution of the foci at each time.Despite the very similar average yields of c-H2AX at 30and 60 min after exposure (Student’s t test, P . 0.82),the distribution of foci in the cells differed substantially(Fig. 3). The distribution of c-H2AX foci showed greatoverdispersion at 60 min, which may reflect higherinterindividual variability of kinetics of DNA repair atthis time (Fig. 2A).
Individual Variability
To have some indications about intraindividualvariability, the c-H2AX yield was measured in lympho-cytes from a single individual in three separate blood
FIG. 1. Basal yields of c-H2AX foci in nonirradiated blood samples taken from 21 healthy French donors (1–22) and from six healthy Cubandonors (23–28) obtained under the same conditions. At least 200 cells were scored for each individual, and the measurements were done onceexcept for donor no. 16 (cf. Table 1A). ND: not determined. Error bars represent 95% confidence limits of the yield following the Poisson law.*Significantly higher yield with 95% confidence.
USEFULNESS OF c-H2AX FOCUS SCORING FOR BIODOSIMETRY 187
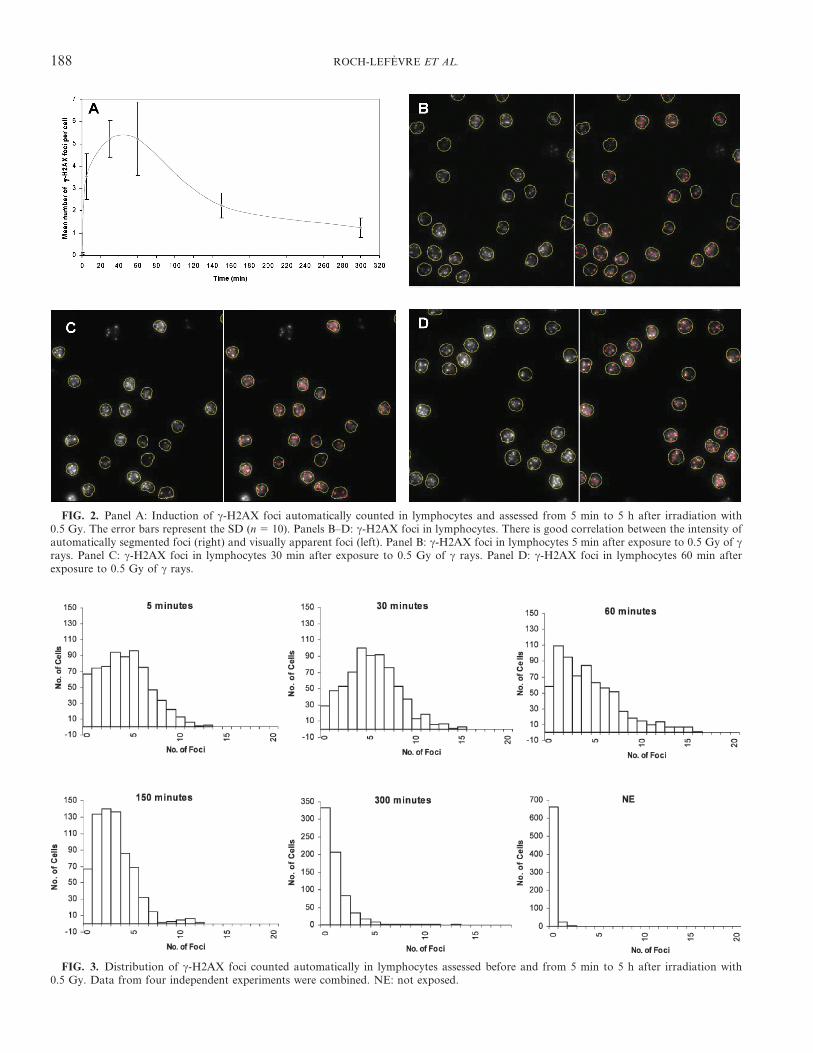
FIG. 2. Panel A: Induction of c-H2AX foci automatically counted in lymphocytes and assessed from 5 min to 5 h after irradiation with0.5 Gy. The error bars represent the SD (n 5 10). Panels B–D: c-H2AX foci in lymphocytes. There is good correlation between the intensity ofautomatically segmented foci (right) and visually apparent foci (left). Panel B: c-H2AX foci in lymphocytes 5 min after exposure to 0.5 Gy of crays. Panel C: c-H2AX foci in lymphocytes 30 min after exposure to 0.5 Gy of c rays. Panel D: c-H2AX foci in lymphocytes 60 min afterexposure to 0.5 Gy of c rays.
FIG. 3. Distribution of c-H2AX foci counted automatically in lymphocytes assessed before and from 5 min to 5 h after irradiation with0.5 Gy. Data from four independent experiments were combined. NE: not exposed.
188 ROCH-LEFEVRE ET AL.
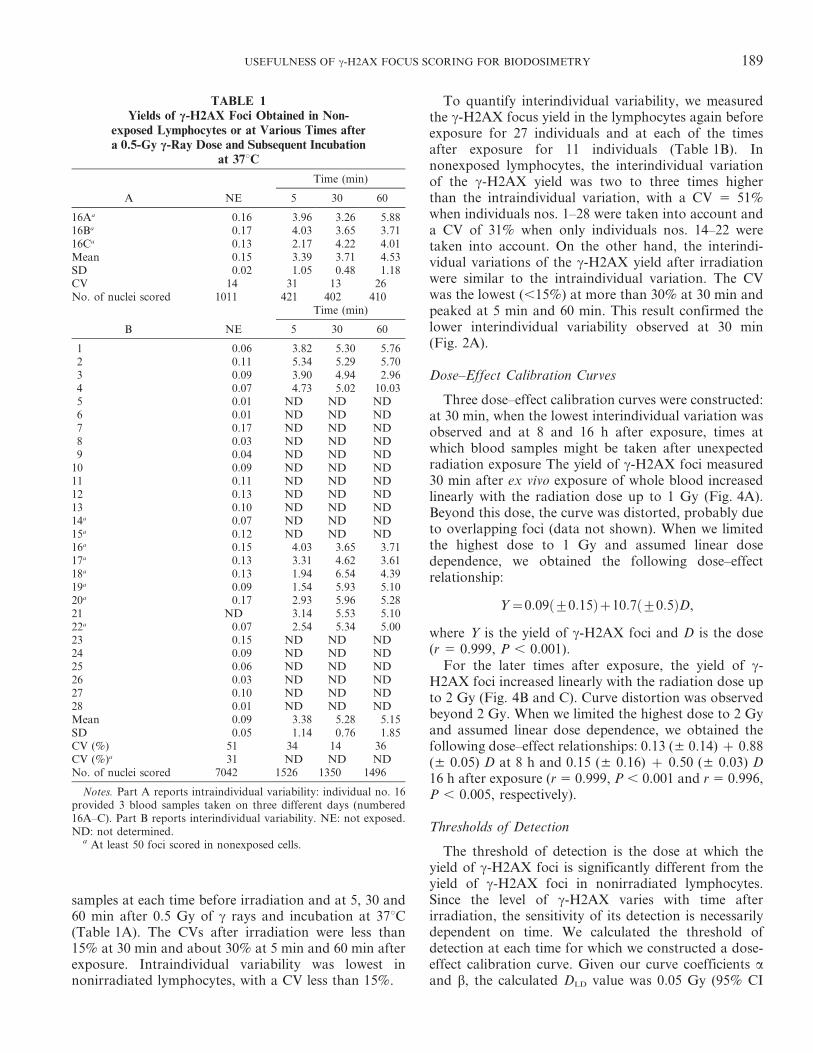
samples at each time before irradiation and at 5, 30 and60 min after 0.5 Gy of c rays and incubation at 37uC(Table 1A). The CVs after irradiation were less than15% at 30 min and about 30% at 5 min and 60 min afterexposure. Intraindividual variability was lowest innonirradiated lymphocytes, with a CV less than 15%.
To quantify interindividual variability, we measuredthe c-H2AX focus yield in the lymphocytes again beforeexposure for 27 individuals and at each of the timesafter exposure for 11 individuals (Table 1B). Innonexposed lymphocytes, the interindividual variationof the c-H2AX yield was two to three times higherthan the intraindividual variation, with a CV 5 51%when individuals nos. 1–28 were taken into account anda CV of 31% when only individuals nos. 14–22 weretaken into account. On the other hand, the interindi-vidual variations of the c-H2AX yield after irradiationwere similar to the intraindividual variation. The CVwas the lowest (,15%) at more than 30% at 30 min andpeaked at 5 min and 60 min. This result confirmed thelower interindividual variability observed at 30 min(Fig. 2A).
Dose–Effect Calibration Curves
Three dose–effect calibration curves were constructed:at 30 min, when the lowest interindividual variation wasobserved and at 8 and 16 h after exposure, times atwhich blood samples might be taken after unexpectedradiation exposure The yield of c-H2AX foci measured30 min after ex vivo exposure of whole blood increasedlinearly with the radiation dose up to 1 Gy (Fig. 4A).Beyond this dose, the curve was distorted, probably dueto overlapping foci (data not shown). When we limitedthe highest dose to 1 Gy and assumed linear dosedependence, we obtained the following dose–effectrelationship:
Y~0:09 +0:15ð Þz10:7 +0:5ð ÞD,
where Y is the yield of c-H2AX foci and D is the dose(r 5 0.999, P , 0.001).
For the later times after exposure, the yield of c-H2AX foci increased linearly with the radiation dose upto 2 Gy (Fig. 4B and C). Curve distortion was observedbeyond 2 Gy. When we limited the highest dose to 2 Gyand assumed linear dose dependence, we obtained thefollowing dose–effect relationships: 0.13 (± 0.14) z 0.88(± 0.05) D at 8 h and 0.15 (± 0.16) z 0.50 (± 0.03) D16 h after exposure (r 5 0.999, P , 0.001 and r 5 0.996,P , 0.005, respectively).
Thresholds of Detection
The threshold of detection is the dose at which theyield of c-H2AX foci is significantly different from theyield of c-H2AX foci in nonirradiated lymphocytes.Since the level of c-H2AX varies with time afterirradiation, the sensitivity of its detection is necessarilydependent on time. We calculated the threshold ofdetection at each time for which we constructed a dose-effect calibration curve. Given our curve coefficients aand b, the calculated DLD value was 0.05 Gy (95% CI
TABLE 1Yields of c-H2AX Foci Obtained in Non-
exposed Lymphocytes or at Various Times aftera 0.5-Gy c-Ray Dose and Subsequent Incubation
at 37uC
A NE
Time (min)
5 30 60
16Aa 0.16 3.96 3.26 5.8816Ba 0.17 4.03 3.65 3.7116Ca 0.13 2.17 4.22 4.01Mean 0.15 3.39 3.71 4.53SD 0.02 1.05 0.48 1.18CV 14 31 13 26No. of nuclei scored 1011 421 402 410
B NE
Time (min)
5 30 60
1 0.06 3.82 5.30 5.762 0.11 5.34 5.29 5.703 0.09 3.90 4.94 2.964 0.07 4.73 5.02 10.035 0.01 ND ND ND6 0.01 ND ND ND7 0.17 ND ND ND8 0.03 ND ND ND9 0.04 ND ND ND
10 0.09 ND ND ND11 0.11 ND ND ND12 0.13 ND ND ND13 0.10 ND ND ND14a 0.07 ND ND ND15a 0.12 ND ND ND16a 0.15 4.03 3.65 3.7117a 0.13 3.31 4.62 3.6118a 0.13 1.94 6.54 4.3919a 0.09 1.54 5.93 5.1020a 0.17 2.93 5.96 5.2821 ND 3.14 5.53 5.1022a 0.07 2.54 5.34 5.0023 0.15 ND ND ND24 0.09 ND ND ND25 0.06 ND ND ND26 0.03 ND ND ND27 0.10 ND ND ND28 0.01 ND ND NDMean 0.09 3.38 5.28 5.15SD 0.05 1.14 0.76 1.85CV (%) 51 34 14 36CV (%)a 31 ND ND NDNo. of nuclei scored 7042 1526 1350 1496
Notes. Part A reports intraindividual variability: individual no. 16provided 3 blood samples taken on three different days (numbered16A–C). Part B reports interindividual variability. NE: not exposed.ND: not determined.
a At least 50 foci scored in nonexposed cells.
USEFULNESS OF c-H2AX FOCUS SCORING FOR BIODOSIMETRY 189
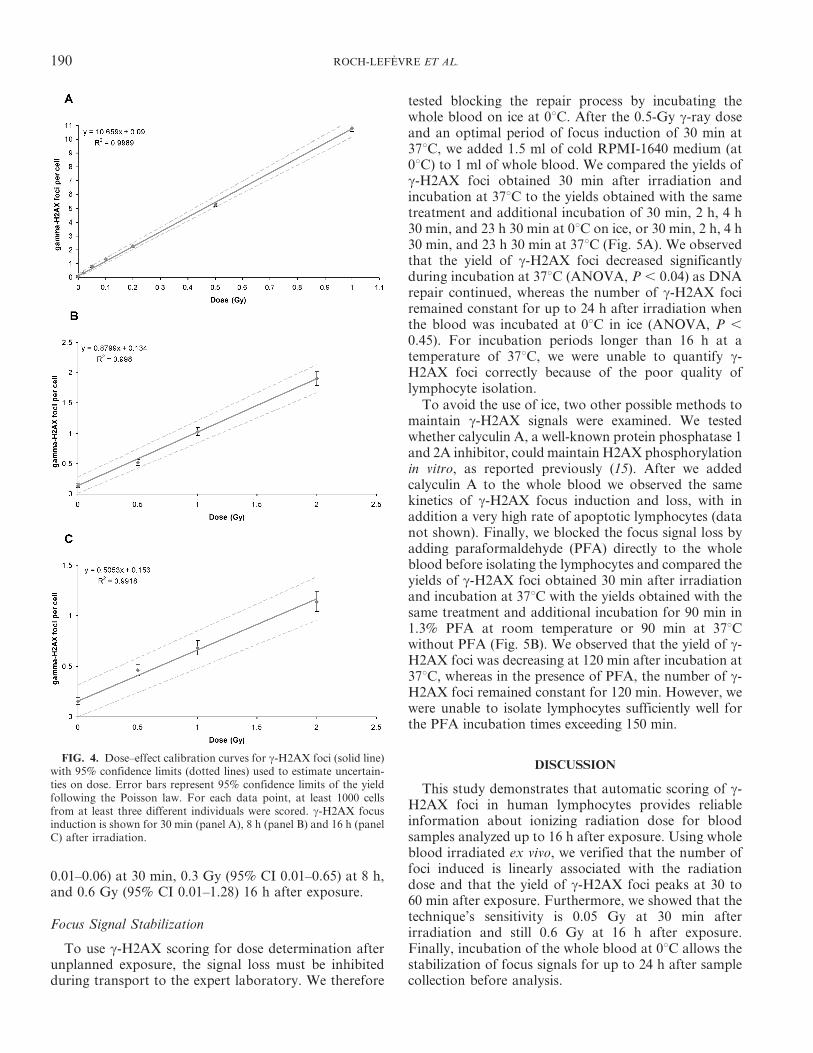
0.01–0.06) at 30 min, 0.3 Gy (95% CI 0.01–0.65) at 8 h,and 0.6 Gy (95% CI 0.01–1.28) 16 h after exposure.
Focus Signal Stabilization
To use c-H2AX scoring for dose determination afterunplanned exposure, the signal loss must be inhibitedduring transport to the expert laboratory. We therefore
tested blocking the repair process by incubating thewhole blood on ice at 0uC. After the 0.5-Gy c-ray doseand an optimal period of focus induction of 30 min at37uC, we added 1.5 ml of cold RPMI-1640 medium (at0uC) to 1 ml of whole blood. We compared the yields ofc-H2AX foci obtained 30 min after irradiation andincubation at 37uC to the yields obtained with the sametreatment and additional incubation of 30 min, 2 h, 4 h30 min, and 23 h 30 min at 0uC on ice, or 30 min, 2 h, 4 h30 min, and 23 h 30 min at 37uC (Fig. 5A). We observedthat the yield of c-H2AX foci decreased significantlyduring incubation at 37uC (ANOVA, P , 0.04) as DNArepair continued, whereas the number of c-H2AX fociremained constant for up to 24 h after irradiation whenthe blood was incubated at 0uC in ice (ANOVA, P ,
0.45). For incubation periods longer than 16 h at atemperature of 37uC, we were unable to quantify c-H2AX foci correctly because of the poor quality oflymphocyte isolation.
To avoid the use of ice, two other possible methods tomaintain c-H2AX signals were examined. We testedwhether calyculin A, a well-known protein phosphatase 1and 2A inhibitor, could maintain H2AX phosphorylationin vitro, as reported previously (15). After we addedcalyculin A to the whole blood we observed the samekinetics of c-H2AX focus induction and loss, with inaddition a very high rate of apoptotic lymphocytes (datanot shown). Finally, we blocked the focus signal loss byadding paraformaldehyde (PFA) directly to the wholeblood before isolating the lymphocytes and compared theyields of c-H2AX foci obtained 30 min after irradiationand incubation at 37uC with the yields obtained with thesame treatment and additional incubation for 90 min in1.3% PFA at room temperature or 90 min at 37uCwithout PFA (Fig. 5B). We observed that the yield of c-H2AX foci was decreasing at 120 min after incubation at37uC, whereas in the presence of PFA, the number of c-H2AX foci remained constant for 120 min. However, wewere unable to isolate lymphocytes sufficiently well forthe PFA incubation times exceeding 150 min.
DISCUSSION
This study demonstrates that automatic scoring of c-H2AX foci in human lymphocytes provides reliableinformation about ionizing radiation dose for bloodsamples analyzed up to 16 h after exposure. Using wholeblood irradiated ex vivo, we verified that the number offoci induced is linearly associated with the radiationdose and that the yield of c-H2AX foci peaks at 30 to60 min after exposure. Furthermore, we showed that thetechnique’s sensitivity is 0.05 Gy at 30 min afterirradiation and still 0.6 Gy at 16 h after exposure.Finally, incubation of the whole blood at 0uC allows thestabilization of focus signals for up to 24 h after samplecollection before analysis.
FIG. 4. Dose–effect calibration curves for c-H2AX foci (solid line)with 95% confidence limits (dotted lines) used to estimate uncertain-ties on dose. Error bars represent 95% confidence limits of the yieldfollowing the Poisson law. For each data point, at least 1000 cellsfrom at least three different individuals were scored. c-H2AX focusinduction is shown for 30 min (panel A), 8 h (panel B) and 16 h (panelC) after irradiation.
190 ROCH-LEFEVRE ET AL.
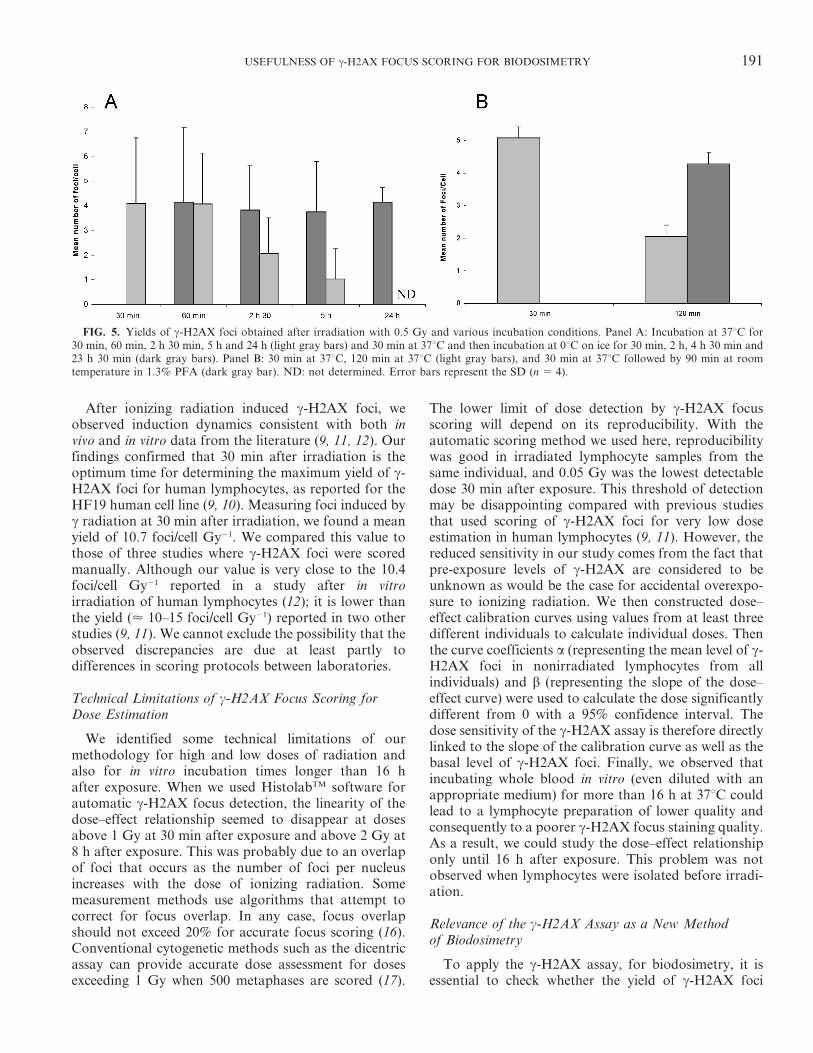
After ionizing radiation induced c-H2AX foci, weobserved induction dynamics consistent with both invivo and in vitro data from the literature (9, 11, 12). Ourfindings confirmed that 30 min after irradiation is theoptimum time for determining the maximum yield of c-H2AX foci for human lymphocytes, as reported for theHF19 human cell line (9, 10). Measuring foci induced byc radiation at 30 min after irradiation, we found a meanyield of 10.7 foci/cell Gy21. We compared this value tothose of three studies where c-H2AX foci were scoredmanually. Although our value is very close to the 10.4foci/cell Gy21 reported in a study after in vitroirradiation of human lymphocytes (12); it is lower thanthe yield (< 10–15 foci/cell Gy21) reported in two otherstudies (9, 11). We cannot exclude the possibility that theobserved discrepancies are due at least partly todifferences in scoring protocols between laboratories.
Technical Limitations of c-H2AX Focus Scoring forDose Estimation
We identified some technical limitations of ourmethodology for high and low doses of radiation andalso for in vitro incubation times longer than 16 hafter exposure. When we used HistolabTM software forautomatic c-H2AX focus detection, the linearity of thedose–effect relationship seemed to disappear at dosesabove 1 Gy at 30 min after exposure and above 2 Gy at8 h after exposure. This was probably due to an overlapof foci that occurs as the number of foci per nucleusincreases with the dose of ionizing radiation. Somemeasurement methods use algorithms that attempt tocorrect for focus overlap. In any case, focus overlapshould not exceed 20% for accurate focus scoring (16).Conventional cytogenetic methods such as the dicentricassay can provide accurate dose assessment for dosesexceeding 1 Gy when 500 metaphases are scored (17).
The lower limit of dose detection by c-H2AX focusscoring will depend on its reproducibility. With theautomatic scoring method we used here, reproducibilitywas good in irradiated lymphocyte samples from thesame individual, and 0.05 Gy was the lowest detectabledose 30 min after exposure. This threshold of detectionmay be disappointing compared with previous studiesthat used scoring of c-H2AX foci for very low doseestimation in human lymphocytes (9, 11). However, thereduced sensitivity in our study comes from the fact thatpre-exposure levels of c-H2AX are considered to beunknown as would be the case for accidental overexpo-sure to ionizing radiation. We then constructed dose–effect calibration curves using values from at least threedifferent individuals to calculate individual doses. Thenthe curve coefficients a (representing the mean level of c-H2AX foci in nonirradiated lymphocytes from allindividuals) and b (representing the slope of the dose–effect curve) were used to calculate the dose significantlydifferent from 0 with a 95% confidence interval. Thedose sensitivity of the c-H2AX assay is therefore directlylinked to the slope of the calibration curve as well as thebasal level of c-H2AX foci. Finally, we observed thatincubating whole blood in vitro (even diluted with anappropriate medium) for more than 16 h at 37uC couldlead to a lymphocyte preparation of lower quality andconsequently to a poorer c-H2AX focus staining quality.As a result, we could study the dose–effect relationshiponly until 16 h after exposure. This problem was notobserved when lymphocytes were isolated before irradi-ation.
Relevance of the c-H2AX Assay as a New Methodof Biodosimetry
To apply the c-H2AX assay, for biodosimetry, it isessential to check whether the yield of c-H2AX foci
FIG. 5. Yields of c-H2AX foci obtained after irradiation with 0.5 Gy and various incubation conditions. Panel A: Incubation at 37uC for30 min, 60 min, 2 h 30 min, 5 h and 24 h (light gray bars) and 30 min at 37uC and then incubation at 0uC on ice for 30 min, 2 h, 4 h 30 min and23 h 30 min (dark gray bars). Panel B: 30 min at 37uC, 120 min at 37uC (light gray bars), and 30 min at 37uC followed by 90 min at roomtemperature in 1.3% PFA (dark gray bar). ND: not determined. Error bars represent the SD (n 5 4).
USEFULNESS OF c-H2AX FOCUS SCORING FOR BIODOSIMETRY 191
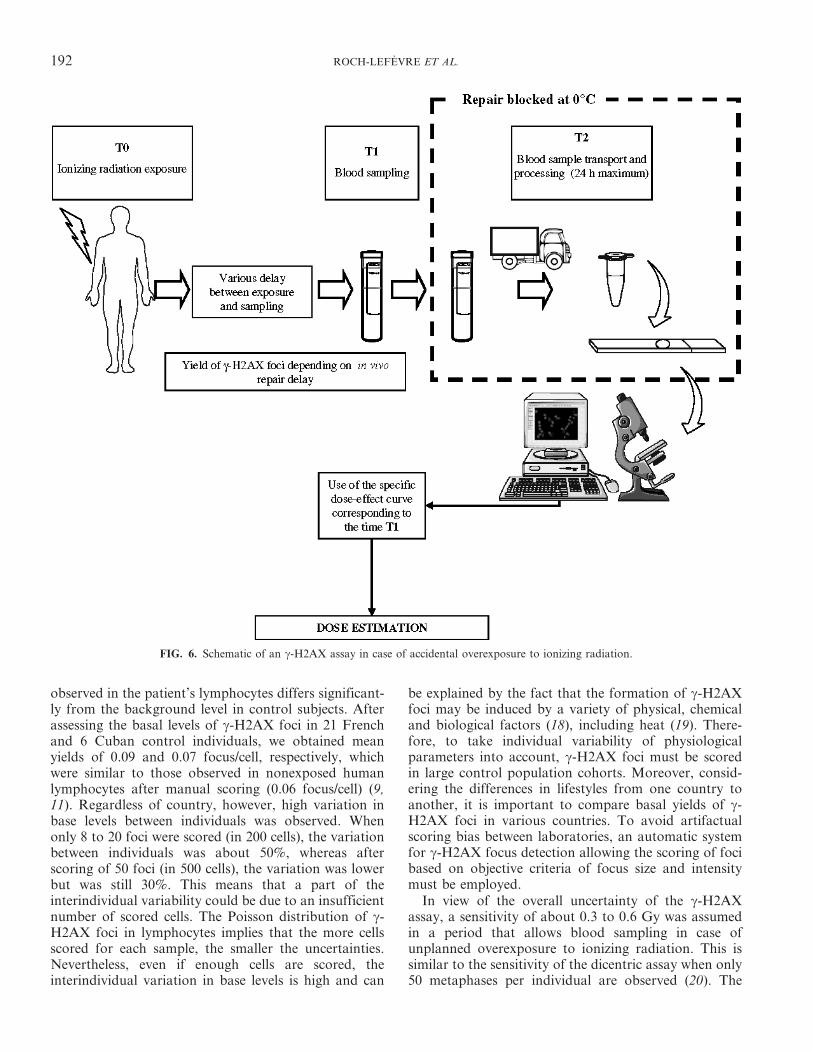
observed in the patient’s lymphocytes differs significant-ly from the background level in control subjects. Afterassessing the basal levels of c-H2AX foci in 21 Frenchand 6 Cuban control individuals, we obtained meanyields of 0.09 and 0.07 focus/cell, respectively, whichwere similar to those observed in nonexposed humanlymphocytes after manual scoring (0.06 focus/cell) (9,11). Regardless of country, however, high variation inbase levels between individuals was observed. Whenonly 8 to 20 foci were scored (in 200 cells), the variationbetween individuals was about 50%, whereas afterscoring of 50 foci (in 500 cells), the variation was lowerbut was still 30%. This means that a part of theinterindividual variability could be due to an insufficientnumber of scored cells. The Poisson distribution of c-H2AX foci in lymphocytes implies that the more cellsscored for each sample, the smaller the uncertainties.Nevertheless, even if enough cells are scored, theinterindividual variation in base levels is high and can
be explained by the fact that the formation of c-H2AXfoci may be induced by a variety of physical, chemicaland biological factors (18), including heat (19). There-fore, to take individual variability of physiologicalparameters into account, c-H2AX foci must be scoredin large control population cohorts. Moreover, consid-ering the differences in lifestyles from one country toanother, it is important to compare basal yields of c-H2AX foci in various countries. To avoid artifactualscoring bias between laboratories, an automatic systemfor c-H2AX focus detection allowing the scoring of focibased on objective criteria of focus size and intensitymust be employed.
In view of the overall uncertainty of the c-H2AXassay, a sensitivity of about 0.3 to 0.6 Gy was assumedin a period that allows blood sampling in case ofunplanned overexposure to ionizing radiation. This issimilar to the sensitivity of the dicentric assay when only50 metaphases per individual are observed (20). The
FIG. 6. Schematic of an c-H2AX assay in case of accidental overexposure to ionizing radiation.
192 ROCH-LEFEVRE ET AL.
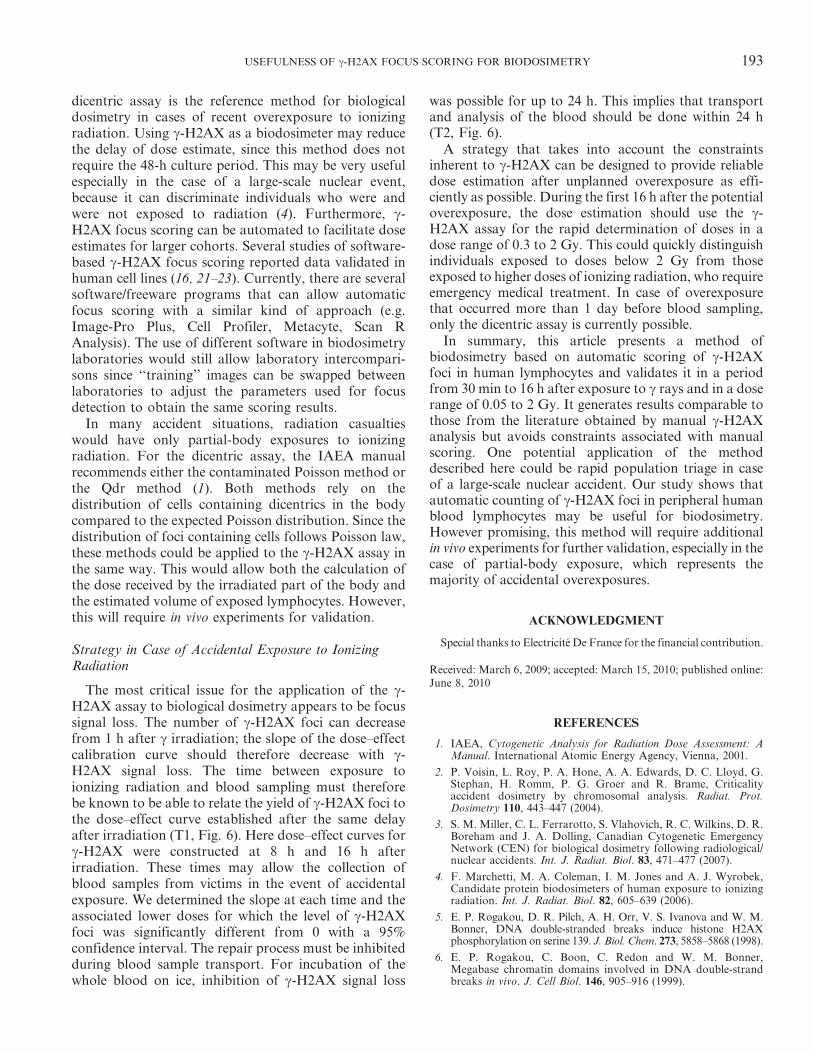
dicentric assay is the reference method for biologicaldosimetry in cases of recent overexposure to ionizingradiation. Using c-H2AX as a biodosimeter may reducethe delay of dose estimate, since this method does notrequire the 48-h culture period. This may be very usefulespecially in the case of a large-scale nuclear event,because it can discriminate individuals who were andwere not exposed to radiation (4). Furthermore, c-H2AX focus scoring can be automated to facilitate doseestimates for larger cohorts. Several studies of software-based c-H2AX focus scoring reported data validated inhuman cell lines (16, 21–23). Currently, there are severalsoftware/freeware programs that can allow automaticfocus scoring with a similar kind of approach (e.g.Image-Pro Plus, Cell Profiler, Metacyte, Scan RAnalysis). The use of different software in biodosimetrylaboratories would still allow laboratory intercompari-sons since ‘‘training’’ images can be swapped betweenlaboratories to adjust the parameters used for focusdetection to obtain the same scoring results.
In many accident situations, radiation casualtieswould have only partial-body exposures to ionizingradiation. For the dicentric assay, the IAEA manualrecommends either the contaminated Poisson method orthe Qdr method (1). Both methods rely on thedistribution of cells containing dicentrics in the bodycompared to the expected Poisson distribution. Since thedistribution of foci containing cells follows Poisson law,these methods could be applied to the c-H2AX assay inthe same way. This would allow both the calculation ofthe dose received by the irradiated part of the body andthe estimated volume of exposed lymphocytes. However,this will require in vivo experiments for validation.
Strategy in Case of Accidental Exposure to IonizingRadiation
The most critical issue for the application of the c-H2AX assay to biological dosimetry appears to be focussignal loss. The number of c-H2AX foci can decreasefrom 1 h after c irradiation; the slope of the dose–effectcalibration curve should therefore decrease with c-H2AX signal loss. The time between exposure toionizing radiation and blood sampling must thereforebe known to be able to relate the yield of c-H2AX foci tothe dose–effect curve established after the same delayafter irradiation (T1, Fig. 6). Here dose–effect curves forc-H2AX were constructed at 8 h and 16 h afterirradiation. These times may allow the collection ofblood samples from victims in the event of accidentalexposure. We determined the slope at each time and theassociated lower doses for which the level of c-H2AXfoci was significantly different from 0 with a 95%confidence interval. The repair process must be inhibitedduring blood sample transport. For incubation of thewhole blood on ice, inhibition of c-H2AX signal loss
was possible for up to 24 h. This implies that transportand analysis of the blood should be done within 24 h(T2, Fig. 6).
A strategy that takes into account the constraintsinherent to c-H2AX can be designed to provide reliabledose estimation after unplanned overexposure as effi-ciently as possible. During the first 16 h after the potentialoverexposure, the dose estimation should use the c-H2AX assay for the rapid determination of doses in adose range of 0.3 to 2 Gy. This could quickly distinguishindividuals exposed to doses below 2 Gy from thoseexposed to higher doses of ionizing radiation, who requireemergency medical treatment. In case of overexposurethat occurred more than 1 day before blood sampling,only the dicentric assay is currently possible.
In summary, this article presents a method ofbiodosimetry based on automatic scoring of c-H2AXfoci in human lymphocytes and validates it in a periodfrom 30 min to 16 h after exposure to c rays and in a doserange of 0.05 to 2 Gy. It generates results comparable tothose from the literature obtained by manual c-H2AXanalysis but avoids constraints associated with manualscoring. One potential application of the methoddescribed here could be rapid population triage in caseof a large-scale nuclear accident. Our study shows thatautomatic counting of c-H2AX foci in peripheral humanblood lymphocytes may be useful for biodosimetry.However promising, this method will require additionalin vivo experiments for further validation, especially in thecase of partial-body exposure, which represents themajority of accidental overexposures.
ACKNOWLEDGMENT
Special thanks to Electricite De France for the financial contribution.
Received: March 6, 2009; accepted: March 15, 2010; published online:June 8, 2010
REFERENCES
1. IAEA, Cytogenetic Analysis for Radiation Dose Assessment: AManual. International Atomic Energy Agency, Vienna, 2001.
2. P. Voisin, L. Roy, P. A. Hone, A. A. Edwards, D. C. Lloyd, G.Stephan, H. Romm, P. G. Groer and R. Brame, Criticalityaccident dosimetry by chromosomal analysis. Radiat. Prot.Dosimetry 110, 443–447 (2004).
3. S. M. Miller, C. L. Ferrarotto, S. Vlahovich, R. C. Wilkins, D. R.Boreham and J. A. Dolling, Canadian Cytogenetic EmergencyNetwork (CEN) for biological dosimetry following radiological/nuclear accidents. Int. J. Radiat. Biol. 83, 471–477 (2007).
4. F. Marchetti, M. A. Coleman, I. M. Jones and A. J. Wyrobek,Candidate protein biodosimeters of human exposure to ionizingradiation. Int. J. Radiat. Biol. 82, 605–639 (2006).
5. E. P. Rogakou, D. R. Pilch, A. H. Orr, V. S. Ivanova and W. M.Bonner, DNA double-stranded breaks induce histone H2AXphosphorylation on serine 139. J. Biol. Chem. 273, 5858–5868 (1998).
6. E. P. Rogakou, C. Boon, C. Redon and W. M. Bonner,Megabase chromatin domains involved in DNA double-strandbreaks in vivo. J. Cell Biol. 146, 905–916 (1999).
USEFULNESS OF c-H2AX FOCUS SCORING FOR BIODOSIMETRY 193
7. K. Rothkamm and M. Lobrich, Evidence for a lack ofDNA double-strand break repair in human cells exposed tovery low x-ray doses. Proc. Natl. Acad. Sci. USA 100, 5057–5062(2003).
8. P. L. Olive and J. P. Banath, Phosphorylation of histone H2AXas a measure of radiosensitivity. Int. J. Radiat. Oncol. Biol. Phys.58, 331–335 (2004).
9. M. Lobrich, N. Rief, M. Kuhne, M. Heckmann, J. Fleckenstein,C. Rube and M. Uder, In vivo formation and repair of DNAdouble-strand breaks after computed tomography examinations.Proc. Natl. Acad. Sci. USA 102, 8984–8989 (2005).
10. E. L. Leatherbarrow, J. V. Harper, F. A. Cucinotta and P.O’Neill, Induction and quantification of gamma-H2AX focifollowing low and high LET-irradiation. Int. J. Radiat. Biol. 82,111–118 (2006).
11. K. Rothkamm, S. Balroop, J. Shekhdar, P. Fernie and V. Goh,Leukocyte DNA damage after multi-detector row CT: aquantitative biomarker of low-level radiation exposure.Radiology 242, 244–251 (2007).
12. A. Sak, S. Grehl, P. Erichsen, M. Engelhard, A. Grannass, S.Levegrun, C. Pottgen, M. Groneberg and M. Stuschke, Gamma-H2AX foci formation in peripheral blood lymphocytes of tumorpatients after local radiotherapy to different sites of the body:dependence on the dose-distribution, irradiated site and timefrom start of treatment. Int. J. Radiat. Biol. 83, 639–652 (2007).
13. M. Neuilly and CETAMA, Modelisation et Estimation desErreurs de Mesure. Lavoisier, Paris, 1998.
14. J. Savage, Curve fitting by maximum likehood method. Radiat.Bot. 15, 127–131 (1975).
15. F. Antonelli, M. Belli, G. Cuttone, V. Dini, G. Esposito, G.Simone, E. Sorrentino and M. A. Tabocchini, Induction and
repair of DNA double-strand breaks in human cells:dephosphorylation of histone H2AX and its inhibition bycalyculin A. Radiat. Res. 164, 514–517 (2005).
16. W. Bocker and G. Iliakis, Computational methods for analysis offoci: validation for radiation-induced gamma-H2AX foci inhuman cells. Radiat. Res. 165, 113–124 (2006).
17. P. Voisin, L. Roy and M. Benderitter, Why can’t we find a betterbiological indicator of dose? Radiat. Prot. Dosimetry 112, 465–469 (2004).
18. A. Takahashi and T. Ohnishi, Does gammaH2AX foci formationdepend on the presence of DNA double strand breaks? CancerLett. 229, 171–179 (2005).
19. A. Takahashi, E. Mori, G. I. Somakos, K. Ohnishi and T.Ohnishi, Heat induces gammaH2AX foci formation inmammalian cells. Mutat. Res. 656, 88–92 (2008).
20. P. Voisin, M. Benderitter, M. Claraz, V. Chambrette, I.Sorokine-Durm, M. Delbos, V. Durand, A. Leroy and N.Paillole, The cytogenetic dosimetry of recent accidentaloverexposure. Cell. Mol. Biol. (Noisy-le-grand) 47, 557–564(2001).
21. O. F. Qvarnstrom, M. Simonsson, K. A. Johansson, J. Nymanand I. Turesson, DNA double strand break quantification in skinbiopsies. Radiother. Oncol. 72, 311–317 (2004).
22. P. R. Barber, R. J. Locke, G. P. Pierce, K. Rothkamm and B.Vojnovic, Gamma-H2AX foci counting: image processing andcontrol software for high content screening. Proc. SPIE 6441,64411M (2007).
23. Y. N. Hou, A. Lavaf, D. Huang, S. Peters, R. Huq, V. Friedrich,B. S. Rosenstein and J. Kao, Development of an automatedgamma-H2AX immunocytochemistry assay. Radiat. Res. 171,360–367 (2009).
194 ROCH-LEFEVRE ET AL.
Accepted Manuscript
Title: Automated gamma-H2AX focus scoring method for human lymphocytes afterionizing radiation exposure
Authors: M. Valente, P. Voisin, P. Laloi, L. Roy, S. Roch-Lefèvre
PII: S1350-4487(11)00179-X
DOI: 10.1016/j.radmeas.2011.05.012
Reference: RM 4398
To appear in: Radiation Measurements
Please cite this article as: Valente, M., Voisin, P., Laloi, P., Roy, L., Roch-Lefèvre, S. Automatedgamma-H2AX focus scoring method for human lymphocytes after ionizing radiation exposure, RadiationMeasurements (2011), doi: 10.1016/j.radmeas.2011.05.012
This is a PDF file of an unedited manuscript that has been accepted for publication. As a service toour customers we are providing this early version of the manuscript. The manuscript will undergocopyediting, typesetting, and review of the resulting proof before it is published in its final form. Pleasenote that during the production process errors may be discovered which could affect the content, and alllegal disclaimers that apply to the journal pertain.
MANUSCRIP
T
ACCEPTED
ACCEPTED MANUSCRIPT
1
Automated gamma-H2AX focus scoring method for human
lymphocytes after ionizing radiation exposure
M. Valente a, P. Voisin a; P. Laloi a, L. Roya and S. Roch-Lefèvre a,*
1 Institut de Radioprotection et de Sureté Nucléaire (IRSN), DRPH, SRBE, LDB. BP 17
92262 Fontenay-aux-Roses, France
* Corresponding author: [email protected]
MANUSCRIP
T
ACCEPTED
ACCEPTED MANUSCRIPT
2
Abstract
The purpose of this study was to develop a microscopy-based foci quantification protocol in
human lymphocyte capable of supplying useful data for radiation sensitivity assays. Human
peripheral blood was exposed to gamma-rays and isolated lymphocytes were stained with
fluorochrome-coupled anti-gamma-H2AX (Histone 2AX phosphorylation of serine 139)
antibodies. Microscopy slides were automatically acquired and the resulting images were
subjected to 3 focus scoring methods: manual, semi-automated and fully automated. All
scoring methods were sufficiently sensitive to detect an irradiation of at least 0.05 Gy with
low variation between experiments. For higher doses, both automated approaches tend to
detect fewer foci than manual scoring but still obtaining a linear correlation (lowest r2 >
0.971). Compared with manual scoring on the images, the automated approaches are at least 5
times faster with minimum operator intervention needed. We can conclude that our method is
able to obtain the foci score of a blood sample in less than 6 hours. In addition to the foci
score the programs used perform several cell and foci measurements of potential biological
importance.
Keywords: lymphocytes; gamma-H2AX foci; automated scoring
MANUSCRIP
T
ACCEPTED
ACCEPTED MANUSCRIPT
3
1. Introduction
Humans can be exposed to several sources of ionizing radiation (IR), from cosmic rays to
medical scans and different types of radiotherapy. Since the discovery of radioactivity, much
has been learned about the effects of high-dose exposure and of radiosensitizing diseases such
as ataxia telangiectasia. However, many questions about the effects of low-dose exposure and
of hypersensitivity to radiation remain unanswered, perhaps because no tool is both sensitive
and fast enough to be used on a large scale, in epidemiological studies for example.
One of the primary cellular effects of ionizing radiation is the induction of DSB (double-
strand breaks). Following DSB induction, hundreds of histone H2AX molecules are
phosphorylated (gamma-H2AX) in the chromatin flanking the DSB site (Rogakou et al.,
1998). Specific antibodies against gamma-H2AX allow the visualization of a "focus" at each
DSB site. The scoring of nuclear gamma-H2AX foci is widely accepted as a very sensitive
method for quantifying radiation-induced DSB.
Several protocols of automated image acquisition and/or analysis are used to study gamma-
H2AX foci in human cellular models (Bocker and Iliakis, 2006; Costes et al., 2006; Hou et
al., 2009; Leatherbarrow et al., 2006; Mistrik et al., 2009). Recently, this approach has also
been used to score gamma-H2AX foci in lymphocytes (Roch-Lefevre et al., 2010) (Jost et al.,
2009) but without taking advantage of any other type of measurements. Here we describe the
optimization of this approach for human lymphocytes isolated from blood exposed ex vivo to
different doses of radiation. We used resources common in cytogenetic labs for automatic
acquisition and both a commercial and a freeware program for image analysis. In addition to
focus counting, the latter was used to measure DAPI (4',6-diamidino-2-phenylindole)
intensity and morphology allowing the operator to enrich the lymphocyte fraction of the
analyzed cell population. Based on our extensive experience with microscopy, we optimized
and validated this morphological cell selection, an alternative less expensive than using a
dedicated cellular membrane staining. Then, to further accelerate the protocol, we determined
the minimum number of cells to analyze. The scoring results obtained automatically were
very similar to manual scoring. Furthermore, we could verify that gamma-H2AX focus
frequency increased linearly with ionizing radiation dose from 0 to 0.5 Gy with a detection
threshold of 0.05 Gy at 30 minutes post-exposure.
MANUSCRIP
T
ACCEPTED
ACCEPTED MANUSCRIPT
4
2. Materials and methods
2.1 Ethics and Sample Collection
The blood was collected from healthy volunteers by the "Etablissement Francais du Sang"
(EFS) which obtained written informed consent for all donors, according to the agreement
between EFS and IRSN (reference n° 10/EFS/056). The blood samples were collected in
citrate and were processed shortly after sampling.
2.2 Irradiation Conditions and Lymphocyte Separation
The dose-response curve was established with blood samples from 3 healhty donors 30
minutes after exposure to gamma-rays Five doses were used: 0, 0.05, 0.1 0.2 and 0.5 Gy.
Total blood was irradiated at room temperature (RT) with a cesium-137 source (IBL637,
CisBio, France) at a dose rate of 0.5 Gy per minute, and then incubated at 37°C to induce
gamma-H2AX formation. All subsequent procedures until cell fixation were performed on ice
to reduce variations in gamma-H2AX by preventing ongoing DNA double-strand break
repair.
The lymphocytes were isolated using Ficoll-Histopaque (Invitrogen, Carlsbad, CA, USA) and
washed three times with cold phosphate buffered saline (PBS) (Invitrogen, Carlsbad, CA,
USA). The lymphocytes were then spotted by adhesion in DakoPen® (Dako, Glostrup,
Denmark) circles onto Superfrost® slides (Menzel-Glaser, Braunschweig, Germany) at 0°C.
Then, the cells were immediately fixed in 1% PFA for 10 minutes at RT and washed in PBS.
Finally, the adherent lymphocytes were preserved in PBS at 4°C for one to three days before
staining.
2.3 Immunofluorescence Staining
Adherent cells were permeabilized in PBS + 0.1% TritonX-100 for 10 minutes. The cells
were blocked in PBS with 20% goat serum for 30 minutes at RT. Slides were incubated with
monoclonal anti-H2AX Phosphorylated (Ser139) antibody (1:500 dilution, BioLegend, San
Diego, CA, USA) for 60 minutes, washed in PBS for 5 minutes, and incubated with Texas
Red X conjugated goat anti-mouse secondary antibody (1:1500) for 60 minutes, all at RT.
For CD3-specific (cluster of differentiation 3) staining the slides were incubated with
AlexaFluor® 647-coupled anti-human CD3 (1:100 dilution) (BD Pharmingen, Franklin
Lakes, NJ, USA) for 30 minutes.
MANUSCRIP
T
ACCEPTED
ACCEPTED MANUSCRIPT
5
Finally, the slides were mounted with cover slips; DAPI Prolong® Gold solution (Invitrogen,
Carlsbad, CA, USA) was used according to the manufacturer's instructions.
2.4 Image Acquisition and Processing
Slides were viewed with an epifluorescence microscope (Imager.Z1, Carl Zeiss, Oberkochen,
Germany) equipped with a non-cooled CCD (charge-coupled device) camera and an
alignment-free external fluorescence light source (EL6000, Leica, Solms, Germany). The
automated image acquisition used Metafer 4 software (version 3.6.0, from MetaSystemsTM,
Altlussheim, Germany). 100 to 250 fields of each spot were selected and acquired by the
Metafer Autocapt module, using an immersion plan Apochromat oil 63x objective (Carl
Zeiss). To compile all of the 3-dimensionally distributed gamma-H2AX foci throughout the
lymphocyte nuclei in one image, 26 2D-images for each field were acquired with a 0.3 µm z-
axis step between two slices. The resulting fields of view (FOV) were transformed into
training images (TRN) with the "Create TRN from FOV" to allow each colour channel to be
exported as an individual greyscale tiff file.
All the steps described above from sample collection to image acquisition are shared by all
the subsequent methods of analysis used.
2.5 Image Analysis
Both manual and automatic focus scoring were performed in uncompressed high-quality
images. Even the manual scoring mentioned in this work was performed in the images and not
through the eyepieces. The manual scoring was done by 3 operators that were unaware of the
doses corresponding to the images they were analysing. The lymphocytes were identified
under the microscope by morphological criteria thanks to their roundness and their bright
DAPI staining. Each operator counted a minimum of 150 foci or 250 cells per condition. The
operators were told to consider every focus that they could discriminate from the background
regardless of their intensity. For the automatic detection, two different programs were used:
the commercial software HistoLabTM (version 7.5.2, Microvision Instruments, Evry, France)
and the free cell image analysis software, CellProfiler (version 2.0, Broad Institute, MA,
USA) (Carpenter et al., 2006). For the CellProfiler analysis the PC specifications were:
windows XP Professional, Processor Intel Core 2 Duo 2 GHz, 512 Mo RAM.
The specific settings used for both HistoLabTM and CellProfiler are supplied in Table 1. All
image analysis parameters were kept constant throughout the duration of this study.

MANUSCRIP
T
ACCEPTED
ACCEPTED MANUSCRIPT
6
2.6 Statistical analysis
Statistical analysis was performed using SigmaPlot (Version 11, from Systat Software Inc,
San Jose, California) and Microsoft Excel (Version 2003, Redmond, Washington, USA). To
test the sensitivity of the scoring approaches the foci frequency of 0 Gy (3 individuals) was
compared with the foci frequency of 0.05Gy (3 individuals) with a Students’ T-test.
MANUSCRIP
T
ACCEPTED
ACCEPTED MANUSCRIPT
7
Results
Here, we describe a microscopy-based method for gamma-H2AX foci scoring in human
lymphocytes after gamma-ray exposure. The images automatically acquired using Metafer™
were analysed by three different methods: manual, semi-automatic (HistoLabTM) and
automatic (Cellprofiler). We compare for each method: the selection of the lymphocytes to be
analyzed, the linearity of gamma-H2AX dose response, the sensitivity, the measurement
variations, and the time of operator intervention needed for analysis.
3.1 Sample Processing and Image Acquisition
Using the protocol described in the “Material and methods” section, the time required for the
process, from the blood sample to the mounted slide, is 5 hours at most. With our
experimental conditions, we obtained an average lymphocyte density of 25 cells per field (up
to 80) for an acquisition at x63 magnification. The average speed of image acquisition and
export with our conditions was 2.5 images per minute. The images acquired this way were the
source of the comparison between that follows.
3.2 Image Analysis: Cell Type Selection
Operators scoring manually were able to exclude monocytes and granulocytes from the
analysis. With the current version of HistoLabTM the user has the possibility of removing
manually the cells with aberrant staining or morphology. Because the CellProfiler approach
has no operator intervention, the cell type selection was done graphically using two
measurements: the nuclei "form factor" that quantifies "roundness" and the "DAPI integrated
intensity". To maximize the lymphocyte concentration of the cell population we studied, we
analyzed only the cells with a form factor above 0.86 and a DAPI-integrated intensity above
1000 (Figure 1A). To verify that this morphologic selection by CellProfiler was able to
increase efficiently the proportion of lymphocytes in the cell group, we quantified the
proportion of CD3-positive lymphocytes. The selection based on form and intensity
measurements presented here successfully enriched in CD3-positive lymphocytes the cell
population from 59% to 83% (Figure 1B). It is also important to mention it was verified that
irradiating samples does not influence this selection (data not shown).
3.3 Image Analysis: Gamma-H2AX Foci scoring
To evaluate the potential of CellProfiler to score gamma-H2AX foci, this automatic method
was compared to the manual one and a semi-automatic scoring system already being used in
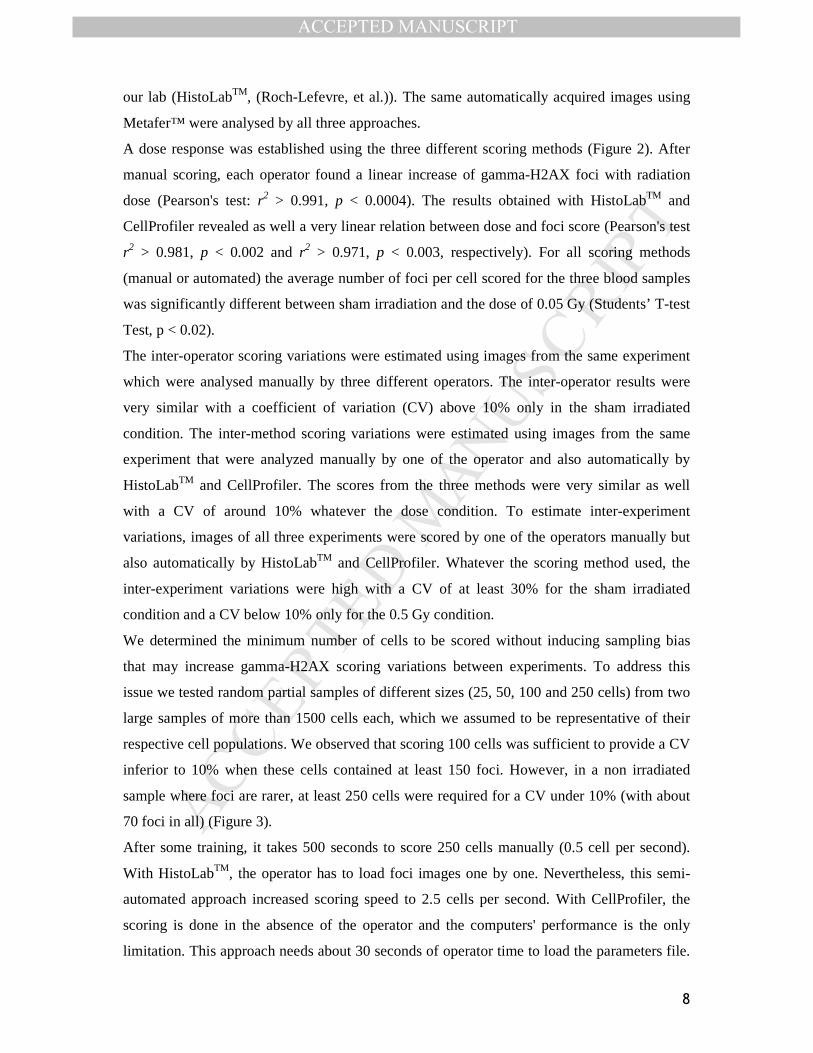
MANUSCRIP
T
ACCEPTED
ACCEPTED MANUSCRIPT
8
our lab (HistoLabTM, (Roch-Lefevre, et al.)). The same automatically acquired images using
Metafer™ were analysed by all three approaches.
A dose response was established using the three different scoring methods (Figure 2). After
manual scoring, each operator found a linear increase of gamma-H2AX foci with radiation
dose (Pearson's test: r2 > 0.991, p < 0.0004). The results obtained with HistoLabTM and
CellProfiler revealed as well a very linear relation between dose and foci score (Pearson's test
r2 > 0.981, p < 0.002 and r2 > 0.971, p < 0.003, respectively). For all scoring methods
(manual or automated) the average number of foci per cell scored for the three blood samples
was significantly different between sham irradiation and the dose of 0.05 Gy (Students’ T-test
Test, p < 0.02).
The inter-operator scoring variations were estimated using images from the same experiment
which were analysed manually by three different operators. The inter-operator results were
very similar with a coefficient of variation (CV) above 10% only in the sham irradiated
condition. The inter-method scoring variations were estimated using images from the same
experiment that were analyzed manually by one of the operator and also automatically by
HistoLabTM and CellProfiler. The scores from the three methods were very similar as well
with a CV of around 10% whatever the dose condition. To estimate inter-experiment
variations, images of all three experiments were scored by one of the operators manually but
also automatically by HistoLabTM and CellProfiler. Whatever the scoring method used, the
inter-experiment variations were high with a CV of at least 30% for the sham irradiated
condition and a CV below 10% only for the 0.5 Gy condition.
We determined the minimum number of cells to be scored without inducing sampling bias
that may increase gamma-H2AX scoring variations between experiments. To address this
issue we tested random partial samples of different sizes (25, 50, 100 and 250 cells) from two
large samples of more than 1500 cells each, which we assumed to be representative of their
respective cell populations. We observed that scoring 100 cells was sufficient to provide a CV
inferior to 10% when these cells contained at least 150 foci. However, in a non irradiated
sample where foci are rarer, at least 250 cells were required for a CV under 10% (with about
70 foci in all) (Figure 3).
After some training, it takes 500 seconds to score 250 cells manually (0.5 cell per second).
With HistoLabTM, the operator has to load foci images one by one. Nevertheless, this semi-
automated approach increased scoring speed to 2.5 cells per second. With CellProfiler, the
scoring is done in the absence of the operator and the computers' performance is the only
limitation. This approach needs about 30 seconds of operator time to load the parameters file.

MANUSCRIP
T
ACCEPTED
ACCEPTED MANUSCRIPT
9
This is more than 16 times less than scoring manually if we consider only one sample of 250
cells (8.33 cells per second)
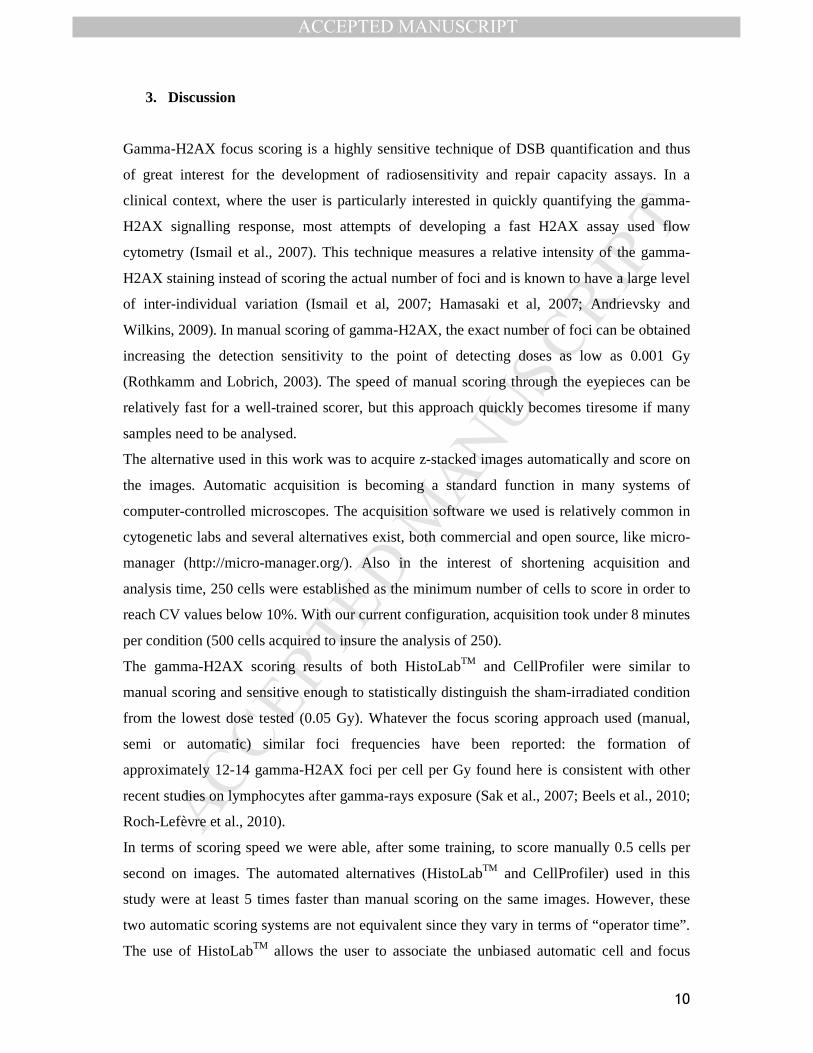
MANUSCRIP
T
ACCEPTED
ACCEPTED MANUSCRIPT
10
3. Discussion
Gamma-H2AX focus scoring is a highly sensitive technique of DSB quantification and thus
of great interest for the development of radiosensitivity and repair capacity assays. In a
clinical context, where the user is particularly interested in quickly quantifying the gamma-
H2AX signalling response, most attempts of developing a fast H2AX assay used flow
cytometry (Ismail et al., 2007). This technique measures a relative intensity of the gamma-
H2AX staining instead of scoring the actual number of foci and is known to have a large level
of inter-individual variation (Ismail et al, 2007; Hamasaki et al, 2007; Andrievsky and
Wilkins, 2009). In manual scoring of gamma-H2AX, the exact number of foci can be obtained
increasing the detection sensitivity to the point of detecting doses as low as 0.001 Gy
(Rothkamm and Lobrich, 2003). The speed of manual scoring through the eyepieces can be
relatively fast for a well-trained scorer, but this approach quickly becomes tiresome if many
samples need to be analysed.
The alternative used in this work was to acquire z-stacked images automatically and score on
the images. Automatic acquisition is becoming a standard function in many systems of
computer-controlled microscopes. The acquisition software we used is relatively common in
cytogenetic labs and several alternatives exist, both commercial and open source, like micro-
manager (http://micro-manager.org/). Also in the interest of shortening acquisition and
analysis time, 250 cells were established as the minimum number of cells to score in order to
reach CV values below 10%. With our current configuration, acquisition took under 8 minutes
per condition (500 cells acquired to insure the analysis of 250).
The gamma-H2AX scoring results of both HistoLabTM and CellProfiler were similar to
manual scoring and sensitive enough to statistically distinguish the sham-irradiated condition
from the lowest dose tested (0.05 Gy). Whatever the focus scoring approach used (manual,
semi or automatic) similar foci frequencies have been reported: the formation of
approximately 12-14 gamma-H2AX foci per cell per Gy found here is consistent with other
recent studies on lymphocytes after gamma-rays exposure (Sak et al., 2007; Beels et al., 2010;
Roch-Lefèvre et al., 2010).
In terms of scoring speed we were able, after some training, to score manually 0.5 cells per
second on images. The automated alternatives (HistoLabTM and CellProfiler) used in this
study were at least 5 times faster than manual scoring on the same images. However, these
two automatic scoring systems are not equivalent since they vary in terms of “operator time”.
The use of HistoLabTM allows the user to associate the unbiased automatic cell and focus
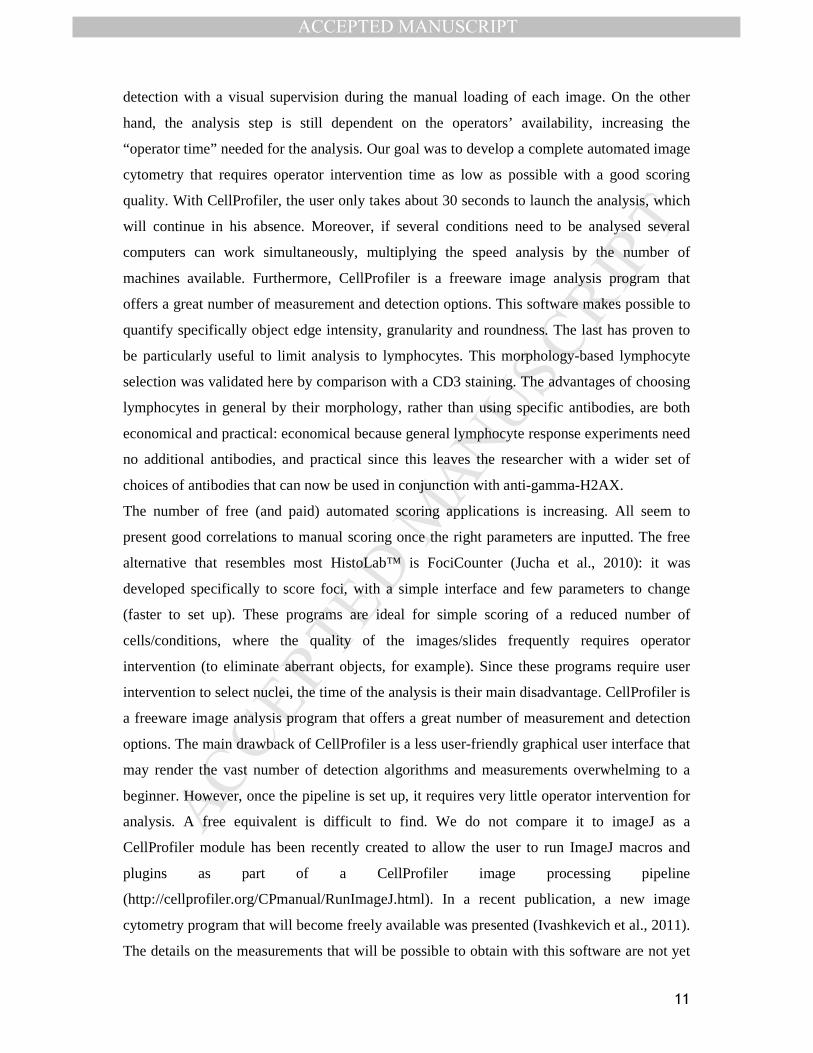
MANUSCRIP
T
ACCEPTED
ACCEPTED MANUSCRIPT
11
detection with a visual supervision during the manual loading of each image. On the other
hand, the analysis step is still dependent on the operators’ availability, increasing the
“operator time” needed for the analysis. Our goal was to develop a complete automated image
cytometry that requires operator intervention time as low as possible with a good scoring
quality. With CellProfiler, the user only takes about 30 seconds to launch the analysis, which
will continue in his absence. Moreover, if several conditions need to be analysed several
computers can work simultaneously, multiplying the speed analysis by the number of
machines available. Furthermore, CellProfiler is a freeware image analysis program that
offers a great number of measurement and detection options. This software makes possible to
quantify specifically object edge intensity, granularity and roundness. The last has proven to
be particularly useful to limit analysis to lymphocytes. This morphology-based lymphocyte
selection was validated here by comparison with a CD3 staining. The advantages of choosing
lymphocytes in general by their morphology, rather than using specific antibodies, are both
economical and practical: economical because general lymphocyte response experiments need
no additional antibodies, and practical since this leaves the researcher with a wider set of
choices of antibodies that can now be used in conjunction with anti-gamma-H2AX.
The number of free (and paid) automated scoring applications is increasing. All seem to
present good correlations to manual scoring once the right parameters are inputted. The free
alternative that resembles most HistoLab™ is FociCounter (Jucha et al., 2010): it was
developed specifically to score foci, with a simple interface and few parameters to change
(faster to set up). These programs are ideal for simple scoring of a reduced number of
cells/conditions, where the quality of the images/slides frequently requires operator
intervention (to eliminate aberrant objects, for example). Since these programs require user
intervention to select nuclei, the time of the analysis is their main disadvantage. CellProfiler is
a freeware image analysis program that offers a great number of measurement and detection
options. The main drawback of CellProfiler is a less user-friendly graphical user interface that
may render the vast number of detection algorithms and measurements overwhelming to a
beginner. However, once the pipeline is set up, it requires very little operator intervention for
analysis. A free equivalent is difficult to find. We do not compare it to imageJ as a
CellProfiler module has been recently created to allow the user to run ImageJ macros and
plugins as part of a CellProfiler image processing pipeline
(http://cellprofiler.org/CPmanual/RunImageJ.html). In a recent publication, a new image
cytometry program that will become freely available was presented (Ivashkevich et al., 2011).
The details on the measurements that will be possible to obtain with this software are not yet
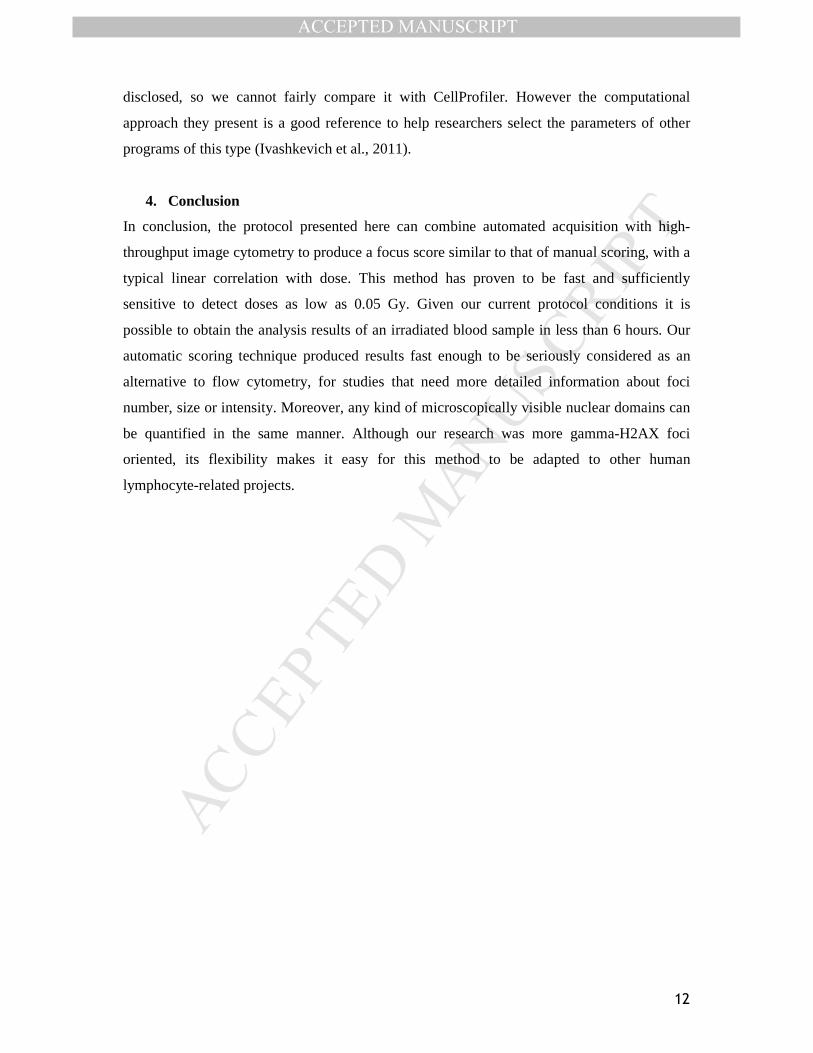
MANUSCRIP
T
ACCEPTED
ACCEPTED MANUSCRIPT
12
disclosed, so we cannot fairly compare it with CellProfiler. However the computational
approach they present is a good reference to help researchers select the parameters of other
programs of this type (Ivashkevich et al., 2011).
4. Conclusion
In conclusion, the protocol presented here can combine automated acquisition with high-
throughput image cytometry to produce a focus score similar to that of manual scoring, with a
typical linear correlation with dose. This method has proven to be fast and sufficiently
sensitive to detect doses as low as 0.05 Gy. Given our current protocol conditions it is
possible to obtain the analysis results of an irradiated blood sample in less than 6 hours. Our
automatic scoring technique produced results fast enough to be seriously considered as an
alternative to flow cytometry, for studies that need more detailed information about foci
number, size or intensity. Moreover, any kind of microscopically visible nuclear domains can
be quantified in the same manner. Although our research was more gamma-H2AX foci
oriented, its flexibility makes it easy for this method to be adapted to other human
lymphocyte-related projects.
MANUSCRIP
T
ACCEPTED
ACCEPTED MANUSCRIPT
13
References
Bocker, W. and Iliakis, G., Computational Methods for analysis of foci: validation for
radiation-induced gamma-H2AX foci in human cells. Radiat Res 165, 113-124 (2006).
Carpenter, A. E.; Jones, T. R.; Lamprecht, M. R.; Clarke, C.; Kang, I. H.; Friman, O.; Guertin,
D. A.; Chang, J. H.; Lindquist, R. A. et al., CellProfiler: image analysis software for
identifying and quantifying cell phenotypes. Genome Biol 7, R100 (2006).
Costes, S. V.; Boissiere, A.; Ravani, S.; Romano, R.; Parvin, B. and Barcellos-Hoff, M. H.,
Imaging features that discriminate between foci induced by high- and low-LET
radiation in human fibroblasts. Radiat Res 165, 505-515 (2006).
Hou, Y. N.; Lavaf, A.; Huang, D.; Peters, S.; Huq, R.; Friedrich, V.; Rosenstein, B. S. and
Kao, J., Development of an automated gamma-H2AX immunocytochemistry assay.
Radiat Res 171, 360-367 (2009).
Ismail, I. H.; Wadhra, T. I. and Hammarsten, O., An optimized method for detecting gamma-
H2AX in blood cells reveals a significant interindividual variation in the gamma-
H2AX response among humans. Nucleic Acids Res 35, e36 (2007).
Ivashkevich, A. N.; Martin, O. A.; Smith, A. J.; Redon, C. E.; Bonner, W. M.; Martin, R. F.
and Lobachevsky, P. N., gammaH2AX foci as a measure of DNA damage: A
computational approach to automatic analysis. Mutat Res (2011).
Jost, G.; Golfier, S.; Pietsch, H.; Lengsfeld, P.; Voth, M.; Schmid, T. E.; Eckardt-Schupp, F.
and Schmid, E., The influence of x-ray contrast agents in computed tomography on
the induction of dicentrics and gamma-H2AX foci in lymphocytes of human blood
samples. Phys Med Biol 54, 6029-6039 (2009).
Jucha, A.; Wegierek-Ciuk, A.; Koza, Z.; Lisowska, H.; Wojcik, A.; Wojewodzka, M. and
Lankoff, A., FociCounter: A freely available PC programme for quantitative and
qualitative analysis of gamma-H2AX foci. Mutat Res 696, 16-20 (2010).
MANUSCRIP
T
ACCEPTED
ACCEPTED MANUSCRIPT
14
Leatherbarrow, E. L.; Harper, J. V.; Cucinotta, F. A. and O'Neill, P., Induction and
quantification of gamma-H2AX foci following low and high LET-irradiation. Int J
Radiat Biol 82, 111-118 (2006).
Mistrik, M.; Oplustilova, L.; Lukas, J. and Bartek, J., Low-dose DNA damage and replication
stress responses quantified by optimized automated single-cell image analysis. Cell
Cycle 8, 2592-2599 (2009).
Roch-Lefèvre, S.; Mandina, T.; Voisin, P.; Gaetan, G.; Mesa, J. E.; Valente, M.; Bonnesoeur,
P.; Garcia, O.; Voisin, P. and Roy, L., Quantification of gamma-H2AX foci in human
lymphocytes: a method for biological dosimetry after ionizing radiation exposure.
Radiat Res 174, 185-194 (2010).
Rogakou, E. P.; Pilch, D. R.; Orr, A. H.; Ivanova, V. S. and Bonner, W. M., DNA double-
stranded breaks induce histone H2AX phosphorylation on serine 139. J Biol Chem
273, 5858-5868 (1998).
Rothkamm, K. and Lobrich, M., Evidence for a lack of DNA double-strand break repair in
human cells exposed to very low x-ray doses. Proc Natl Acad Sci U S A 100, 5057-
5062 (2003).
Sak A, Grehl S, Erichsen P, Engelhard M, Grannass A, Levegrün S, Pöttgen C, Groneberg M,
Stuschke M. gamma-H2AX foci formation in peripheral blood lymphocytes of tumor
patients after local radiotherapy to different sites of the body: dependence on the dose-
distribution, irradiated site and time from start of treatment. Int J Radiat Biol. 83, 639-
52 (2007).
MANUSCRIP
T
ACCEPTED
ACCEPTED MANUSCRIPT
1
Figure 1: Indicators used for human lymphocyte enrichment for the gamma-H2AX
analysis. A) Cell DAPI intensity and "roundness" (form factor) measurement. The two cells
at the middle would not have been considered lymphocytes by the operator during manual
scoring because they are less round and have weaker DAPI staining. By quantifying these two
parameters, it is possible to establish thresholds that insure that automatic scoring will also
exclude them. B) Validation of the morphological selection of lymphocytes with CD3
staining. Within the comet (i.e. excluding cells with DAPI intensity below 1000), different
groups of cells were selected by choosing different form factor thresholds: 0.7, 0.8, and 0.86.
Choosing fractions of the dot cloud with higher form factor values increases the proportion of
CD3-positive cells.
Figure 2: Comparison of the correlation between dose and focus score found by three
different scoring methods. The same images from blood samples of three different human
donors (three experiments) exposed to 5 IR doses were scored manually by one human
operator, semi-automatically by HistoLabTM and automatically by CellProfiler. A minimum of
100 foci and/or 250 lymphocytes were scored for each condition of each donor regardless of
the scoring method. The error bars correspond to the standard deviation of the three different
donors.
Figure 3: Impact of sample size on the variation of focus score. Focus score results
presented here were obtained using CellProfiler. Different sized samples (25, 50, 100, 250 and
500 cells) were run 100 times each for two conditions: sham-irradiated and 0.2 Gy. A box plot
that displays the variation of the focus score according to sample size. When 250 cells or
more are scored the CV is below 10% for both irradiated and control conditions.
Table 1: Steps for the automated and semi-automated approaches used in this work.
Each step includes the parameters for both programs, when applicable. Highlighted in grey
are the steps that require operator intervention.
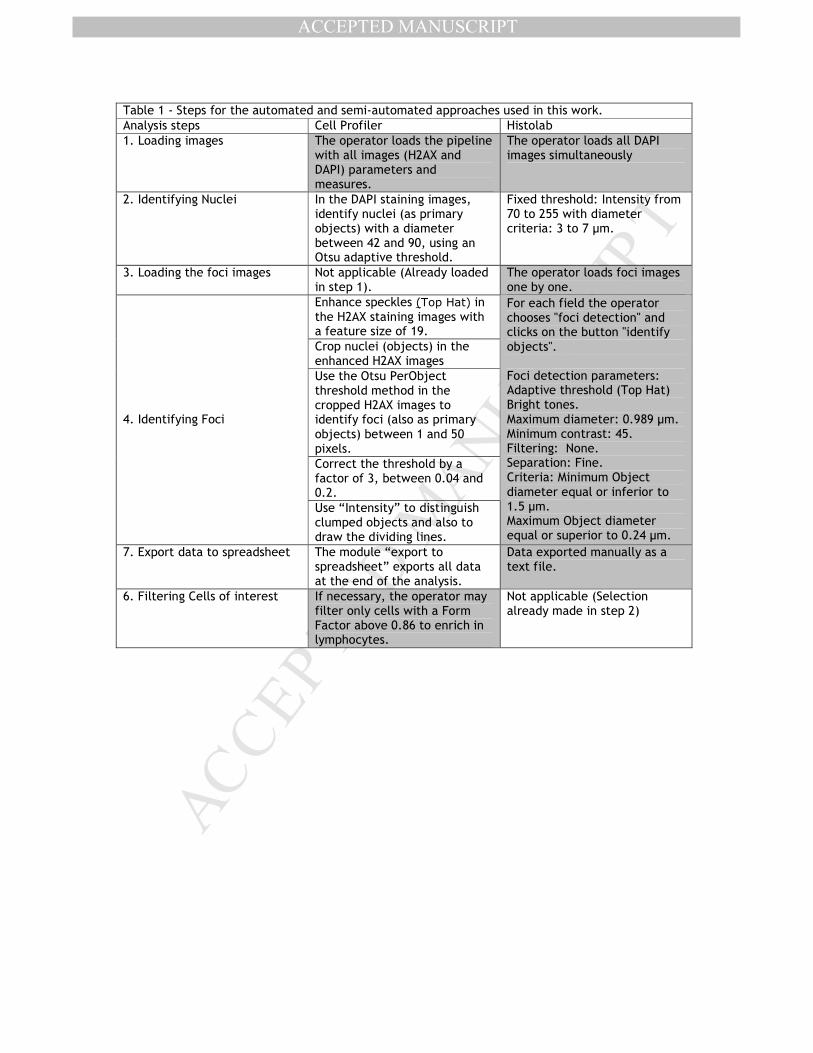
MANUSCRIP
T
ACCEPTED
ACCEPTED MANUSCRIPT
Table 1 - Steps for the automated and semi-automated approaches used in this work.
Analysis steps Cell Profiler Histolab
1. Loading images The operator loads the pipeline with all images (H2AX and DAPI) parameters and measures.
The operator loads all DAPI images simultaneously
2. Identifying Nuclei In the DAPI staining images, identify nuclei (as primary objects) with a diameter between 42 and 90, using an Otsu adaptive threshold.
Fixed threshold: Intensity from 70 to 255 with diameter criteria: 3 to 7 µm.
3. Loading the foci images Not applicable (Already loaded in step 1).
The operator loads foci images one by one.
Enhance speckles (Top Hat) in the H2AX staining images with a feature size of 19.
Crop nuclei (objects) in the enhanced H2AX images
Use the Otsu PerObject threshold method in the cropped H2AX images to identify foci (also as primary objects) between 1 and 50 pixels.
Correct the threshold by a factor of 3, between 0.04 and 0.2.
4. Identifying Foci
Use “Intensity” to distinguish clumped objects and also to draw the dividing lines.
For each field the operator chooses "foci detection" and clicks on the button "identify objects". Foci detection parameters: Adaptive threshold (Top Hat) Bright tones. Maximum diameter: 0.989 µm. Minimum contrast: 45. Filtering: None. Separation: Fine. Criteria: Minimum Object diameter equal or inferior to 1.5 µm. Maximum Object diameter equal or superior to 0.24 µm.
7. Export data to spreadsheet The module “export to spreadsheet” exports all data at the end of the analysis.
Data exported manually as a text file.
6. Filtering Cells of interest If necessary, the operator may filter only cells with a Form Factor above 0.86 to enrich in lymphocytes.
Not applicable (Selection already made in step 2)
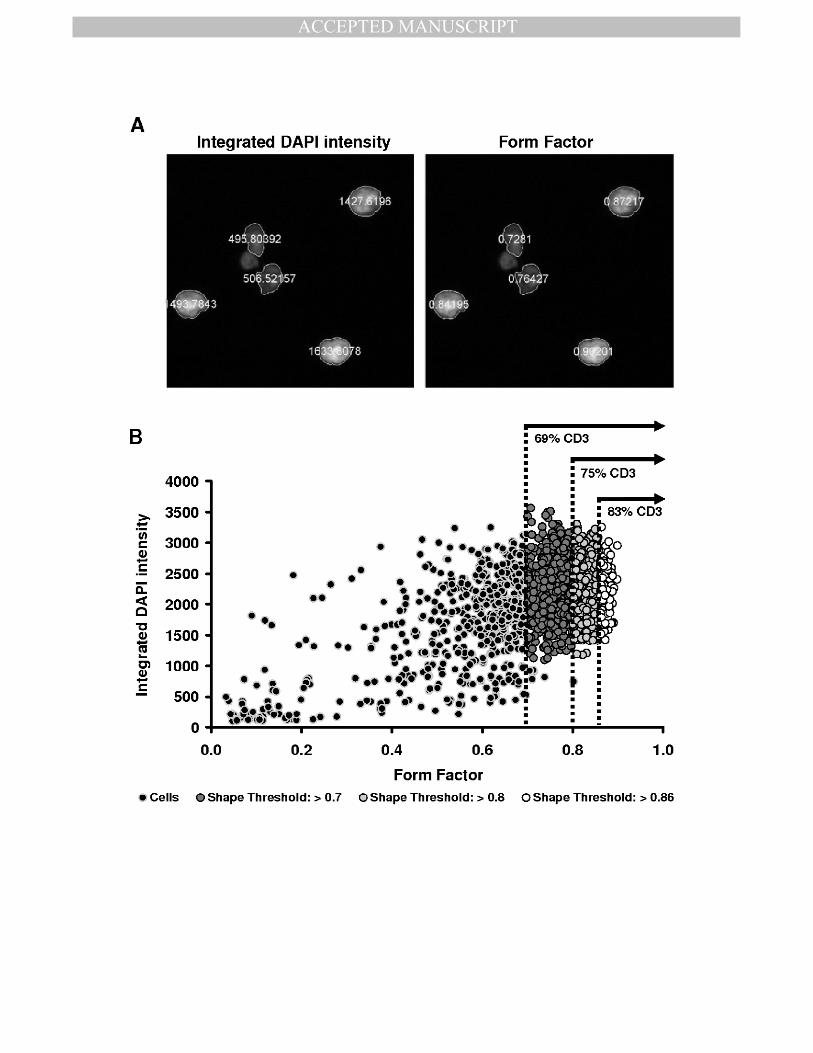
MANUSCRIP
T
ACCEPTED
ACCEPTED MANUSCRIPT
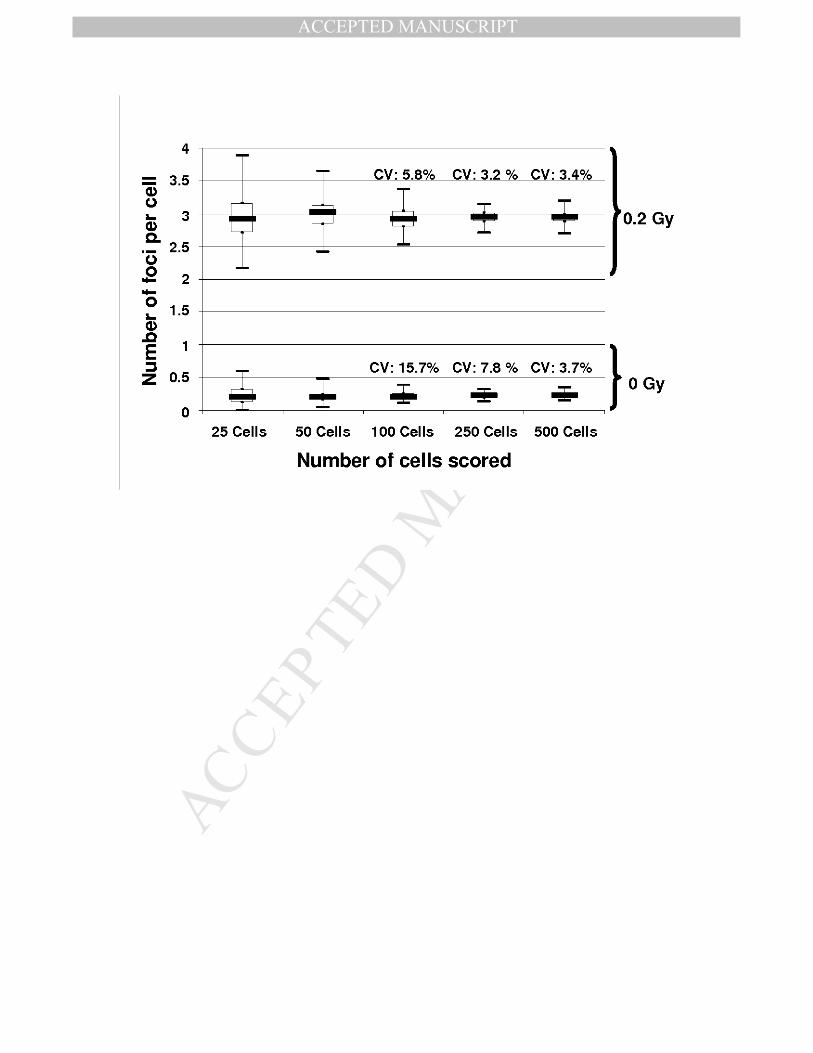
MANUSCRIP
T
ACCEPTED
ACCEPTED MANUSCRIPT
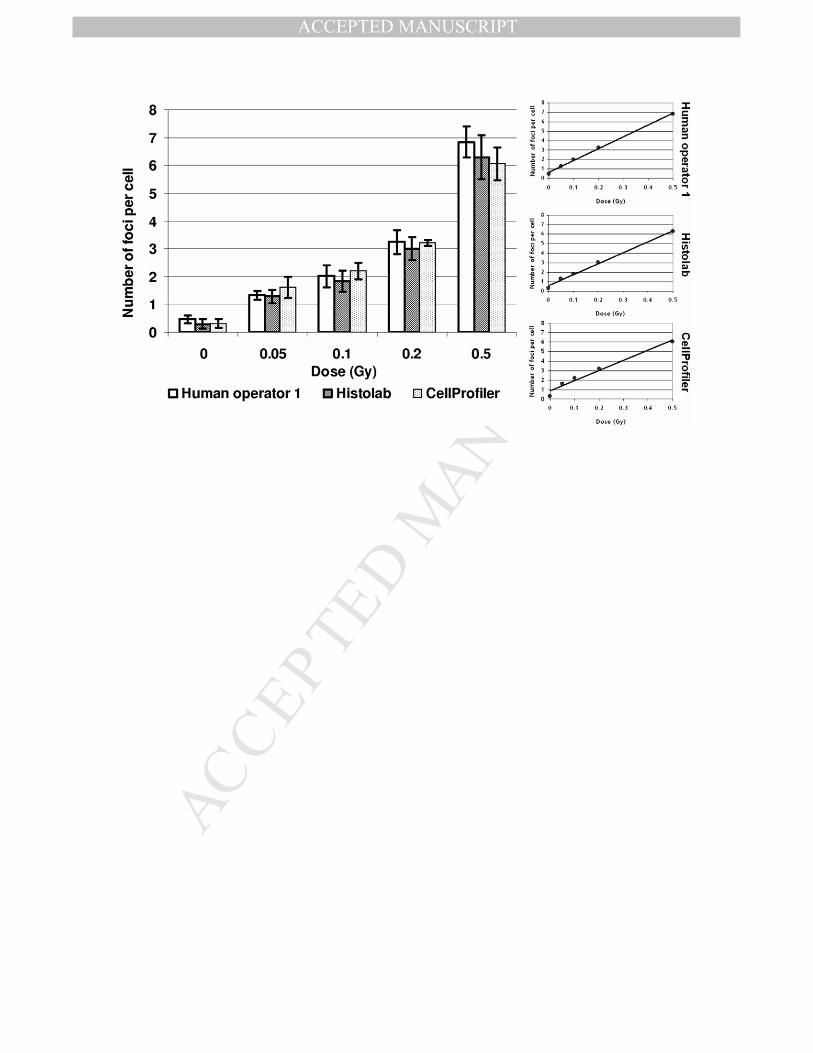
MANUSCRIP
T
ACCEPTED
ACCEPTED MANUSCRIPT
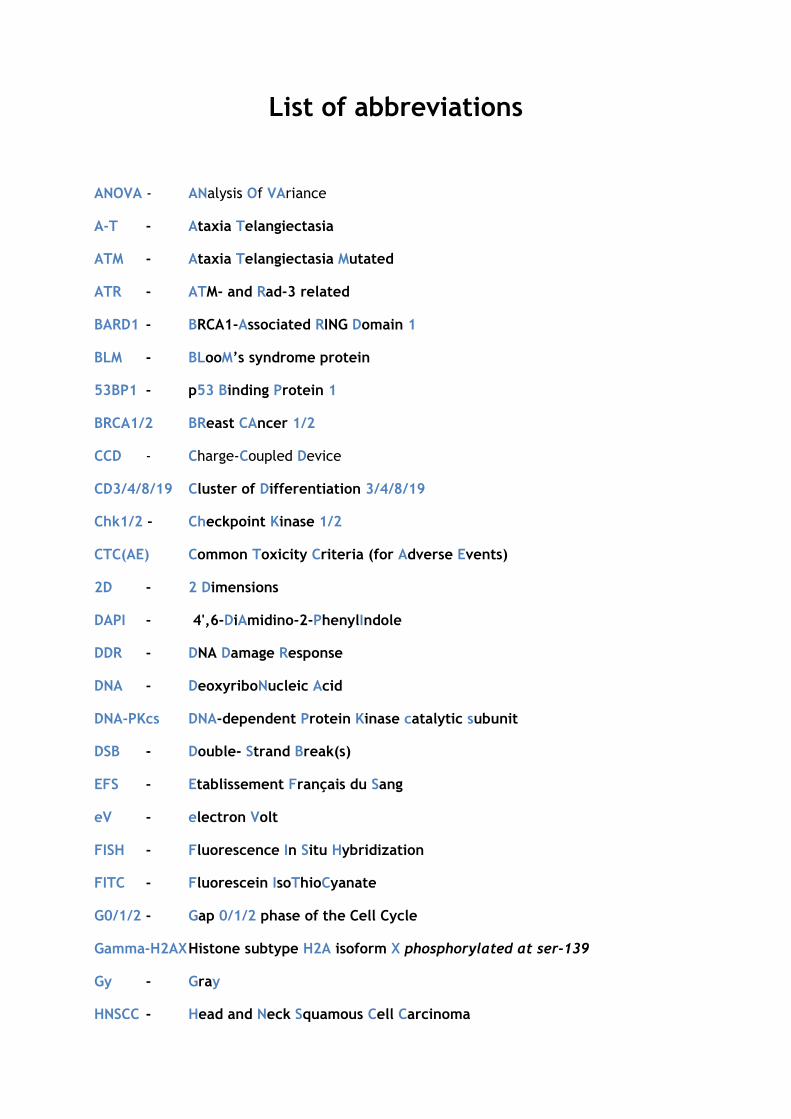
List of abbreviations
ANOVA - ANalysis Of VAriance
A-T - Ataxia Telangiectasia
ATM - Ataxia Telangiectasia Mutated
ATR - ATM- and Rad-3 related
BARD1 - BRCA1-Associated RING Domain 1
BLM - BLooM’s syndrome protein
53BP1 - p53 Binding Protein 1
BRCA1/2 BReast CAncer 1/2
CCD - Charge-Coupled Device
CD3/4/8/19 Cluster of Differentiation 3/4/8/19
Chk1/2 - Checkpoint Kinase 1/2
CTC(AE) Common Toxicity Criteria (for Adverse Events)
2D - 2 Dimensions
DAPI - 4',6-DiAmidino-2-PhenylIndole
DDR - DNA Damage Response
DNA - DeoxyriboNucleic Acid
DNA-PKcs DNA-dependent Protein Kinase catalytic subunit
DSB - Double- Strand Break(s)
EFS - Etablissement Français du Sang
eV - electron Volt
FISH - Fluorescence In Situ Hybridization
FITC - Fluorescein IsoThioCyanate
G0/1/2 - Gap 0/1/2 phase of the Cell Cycle
Gamma-H2AX Histone subtype H2A isoform X phosphorylated at ser-139
Gy - Gray
HNSCC - Head and Neck Squamous Cell Carcinoma
HR - Homologous Recombination
HRS - Hyper-RadioSensitivity
Hz - Hertz
IgH - Immunoglobulin Heavy
IR - Ionizing Radiation(s)
IRIF - Ionizing Radiation Induced Focus
IRSN - Institut de Radioprotection et de Sûreté Nucléaire
keV - kilo electron Volt
LET - Linear Energy Transfer
Lig4 - Ligase 4
LNT - Linear-Non-Threshold
M - Mitosis phase of the Cell Cycle
MDC1 - Mediator of DNA damage Checkpoint 1
Mdm2 - Murine double Minute 2
MeV - Mega electron Volt
µg - micro (µ) gram
µm - micro (µ) meter
MRN - Mre11/Rad50/NBS1 complex
mSv - mili Sieverts
NBS1 - Nijmegen Breakage Syndrome protein 1
NHEJ - Non-Homologous End Joining
nm - nano meter
PARP-1 Poly(ADP-Ribose) Polymerase 1
PBL - Peripheral Blood Lymphocytes
PBS - Phosphate Buffered Saline
PFA - ParaFormAldehyde
PHA - PhytoHaemAgglutinin
PS - PhosphatidylSerine
PIKK - PhosphoInositide three-Kinase-related protein Kinases
RAD - Radiation Absorbed Dose
RBE - Relative Biological Effectiveness
RNS - Reactive Nitrogen Species
ROS - Reactive Oxygen Species
RPA - Replication Protein A
RPMI - Roswell Park Institute Medium
RT - Room Temperature
S - Synthesis phase of the Cell Cycle
SD - Standard Deviation
SEM - Standard Error of the Mean
SMC1 - Structural Maintenance of Chromatine 1
SSB - Single- Strand Break(s)
ssDNA - single stranded DNA
Sv - Sieverts
V(D)J - Variable (Diverse) Joining
v/m - volume/mass
XLF - XRCC4-Like Factor
XRCC4 - X-ray Repair Complementing defective repair in Chinese hamster cells
4


