
PhD Seminar David Dahan 2005
66
1 Raman and Parametric mediated amplification and all optical processing for high speed fiber optics communication systems David Dahan Electrical Engineering Department Technion 27/06/2005
-
Upload
david-dahan -
Category
Technology
-
view
315 -
download
1
Transcript of PhD Seminar David Dahan 2005
1
Raman and Parametric mediated
amplification and all optical
processing for high speed fiber
optics communication systems
David Dahan
Electrical Engineering Department
Technion 27/06/2005
2
Acknowledgements My supervisor : Prof. Gadi Eisenstein
Former and current students
Dr. Kobi Lasri
Dr. Alberto Bilenca
Evgeny Shumakher
Robert Alizon
Din Hadass
Ido Ben-Aroya
Laboratory staff
Dr. Mark Sogolov
Dr. Boris Levit
Dr. Alex Bekker
Vladimir Smulakovsky
Scholarships and prices
Technion: Martin Prosserman fellowship Ministry of Science: Levy Eskhol scholarship
IEEE/LEOS: Graduate student fellowship award (2005)
3
Research Topics
Stimulated Raman Scattering (SRS) in fiber
ASE Noise properties of saturated Raman Fiber amplifier in CW regime
Inter band Raman mediated wavelength converter and reshaper
Parametric Processes in fibers for optical pulse source generation A Self Starting Ultra Low Jitter Pulse Source Using Coupled Optoelectronic
Oscillators with an Intra Cavity Fiber Parametric Amplifier
Multi wavelength pulse sources based on saturated OPA without spectral broadening
SRS + Parametric processes All optical tunable delay line via Slow and fast light propagation in a narrow
band parametric amplifier : a route to optical buffering
4
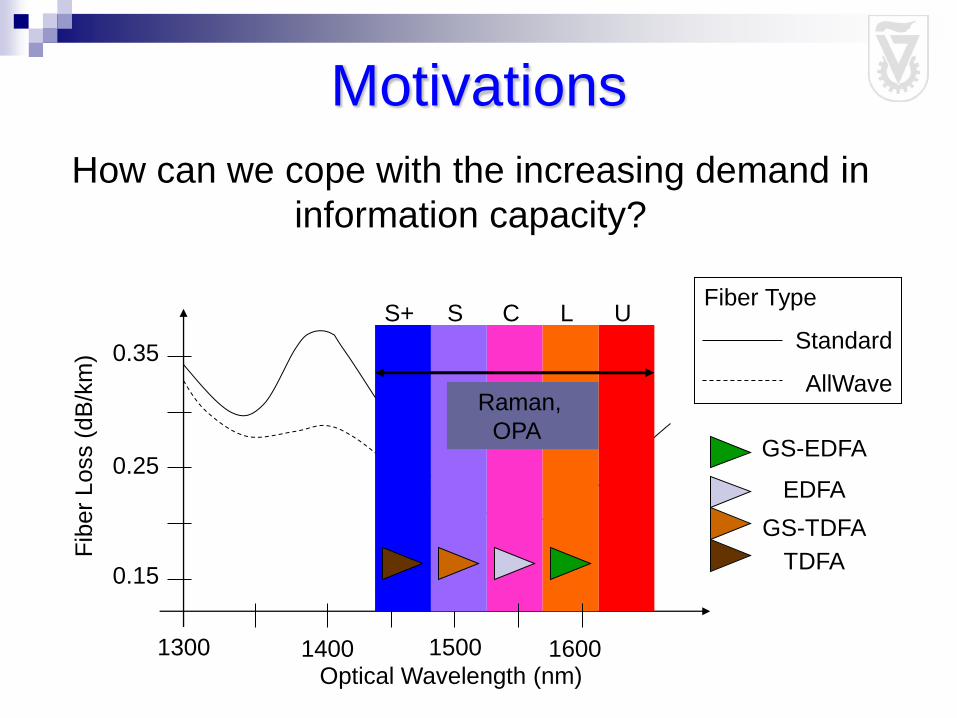
Motivations
1300 1400 1500 1600
U Fiber Type
Standard
AllWave
Fib
er
Loss (
dB
/km
)
0.15
EDFA 0.25
0.35
C L S+ S
TDFA
GS-TDFA
GS-EDFA
Raman,
OPA
Optical Wavelength (nm)
How can we cope with the increasing demand in
information capacity?

Motivations Operation over these extremely large optical
bandwidths requires that several key
components be developed !
All optical processing devices : Wavelength converter and re-shapers
All optical buffers
High bit rate stable optical pulse sources Low jitter self starting source
Multi wavelength source
Wide Band Amplifiers (Raman, OPA) Noise properties

6
Inter band Raman - Mediated
Wavelength Converter with Noise
Reduction Capabilities

7
Raman wavelength converter :
Principle of operation Signal at wavelength λs
t
t
P1s
P0s
Ppr
t
t Probe : λpr~ λs-100 nm,
Ppr<<P1s
Optical fiber
(L km)
Large detuning may degrade the conversion because of large walk off
Need to operate almost symmetrically around the zero dispersion wavelength
8
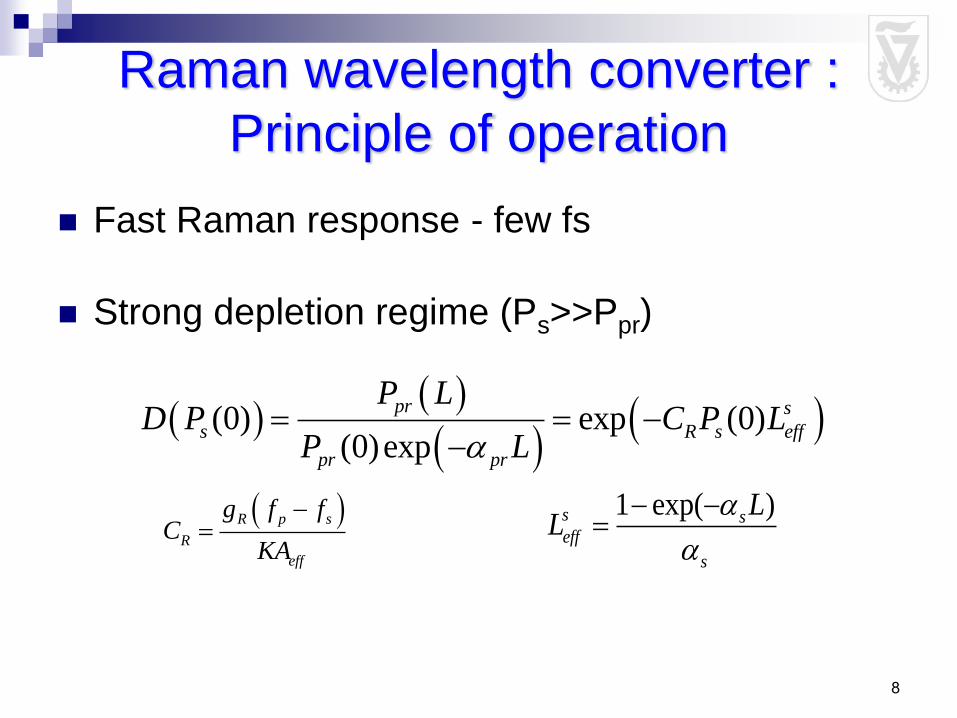
Raman wavelength converter :
Principle of operation
Fast Raman response - few fs
Strong depletion regime (Ps>>Ppr)
(0) exp (0)
(0)exp
pr s
s R s eff
pr pr
P LD P C P L
P L
1 exp( )s seff
s
LL
R p s
R
eff
g f fC
KA
9
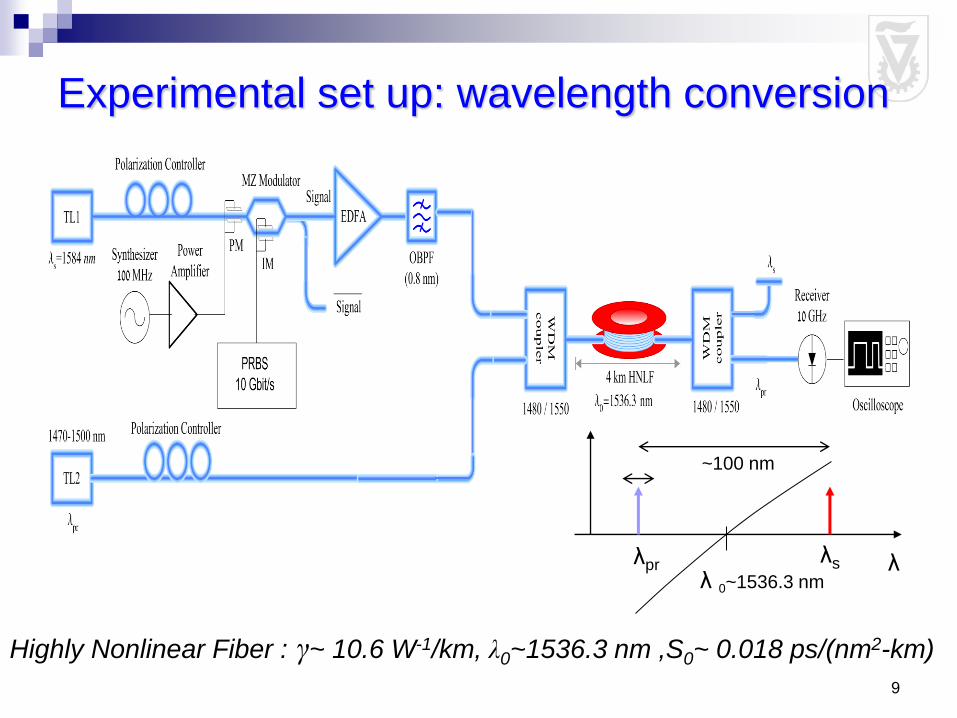
Experimental set up: wavelength conversion
λ λ 0~1536.3 nm
λs λpr
Highly Nonlinear Fiber : γ~ 10.6 W-1/km, λ0~1536.3 nm ,S0~ 0.018 ps/(nm2-km)
~100 nm
10
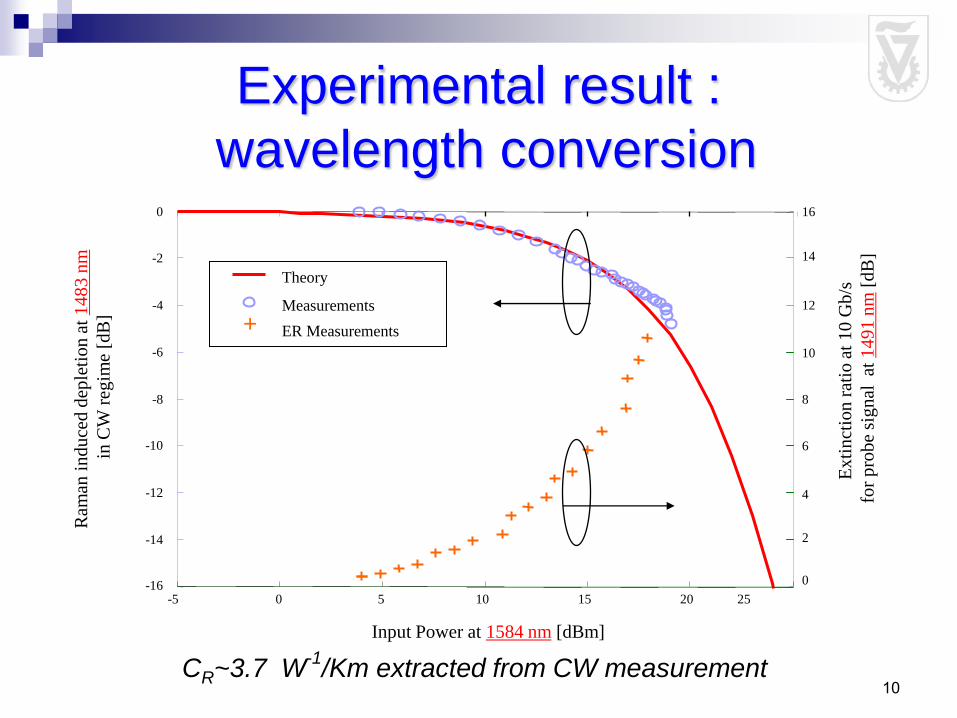
Experimental result :
wavelength conversion
Ram
an i
nd
uce
d d
eple
tion
at
14
83
nm
in
CW
reg
ime
[dB
]
-5 10 15 20 25 -16
0 5
-14
-12
-10
-8
-6
-4
-2
0
0
2
4
6
8
10
12
14
16
Theory
Measurements
Input Power at 1584 nm [dBm]
Ex
tin
ctio
n r
atio
at
10
Gb
/s
fo
r p
rob
e si
gn
al at
14
91
nm
[d
B]
ER Measurements +
CR~3.7 W-1
/Km extracted from CW measurement
11
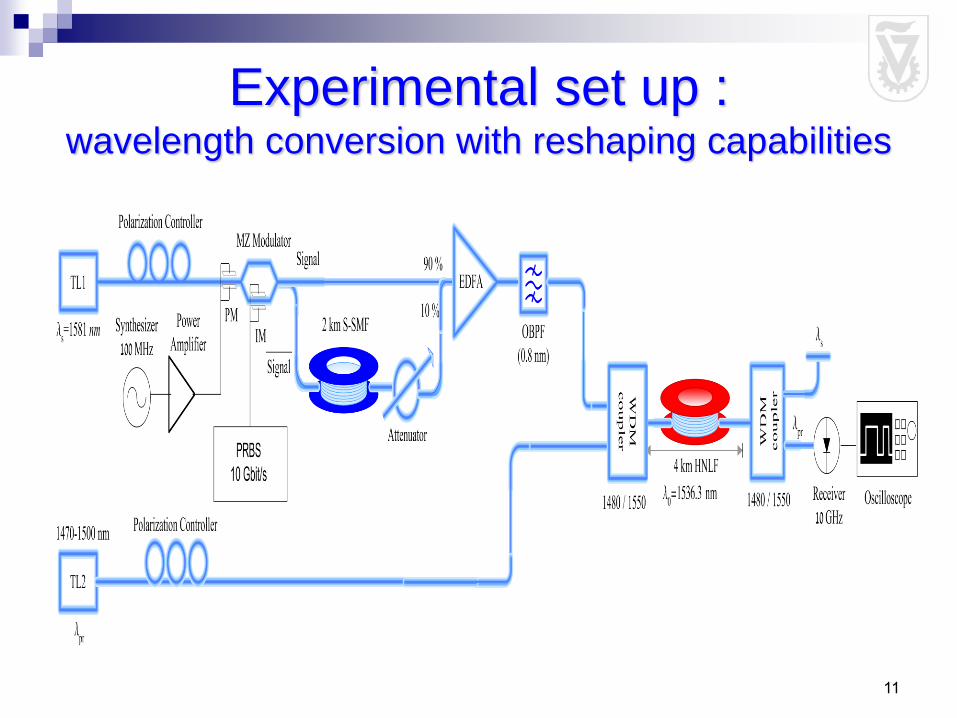
Experimental set up : wavelength conversion with reshaping capabilities

12
Converted Signal, p=1500 nm
Reshaping results @ 10 Gbit/s
Original Signal, s=1581 nm
13
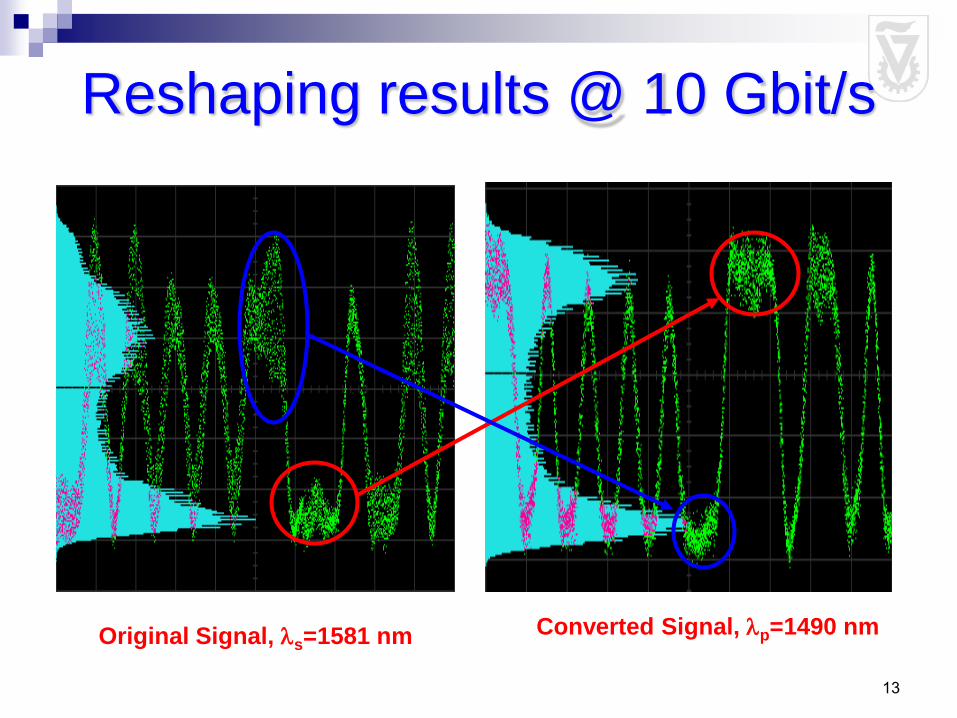
Reshaping results @ 10 Gbit/s
Original Signal, s=1581 nm Converted Signal, p=1490 nm
14
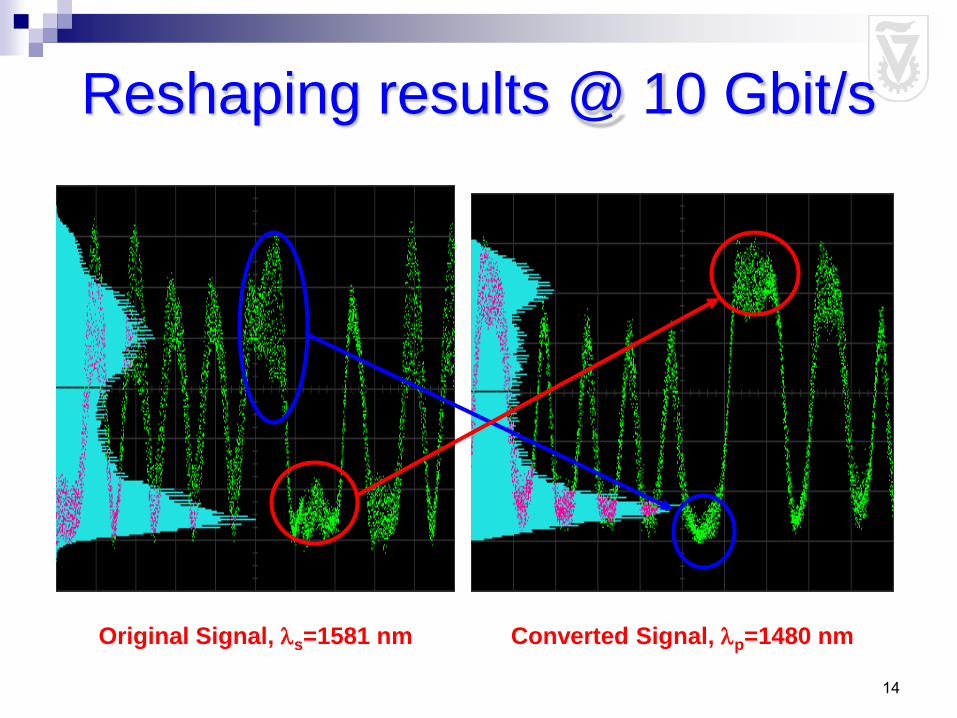
Reshaping results @ 10 Gbit/s
Original Signal, s=1581 nm Converted Signal, p=1480 nm
15
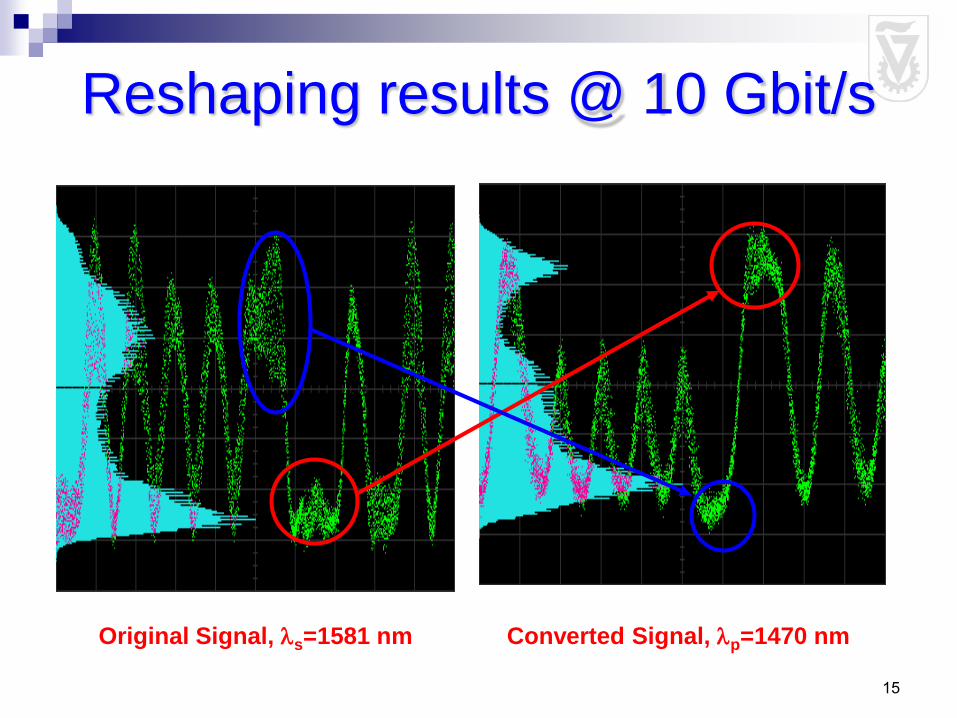
Reshaping results @ 10 Gbit/s
Original Signal, s=1581 nm Converted Signal, p=1470 nm
16
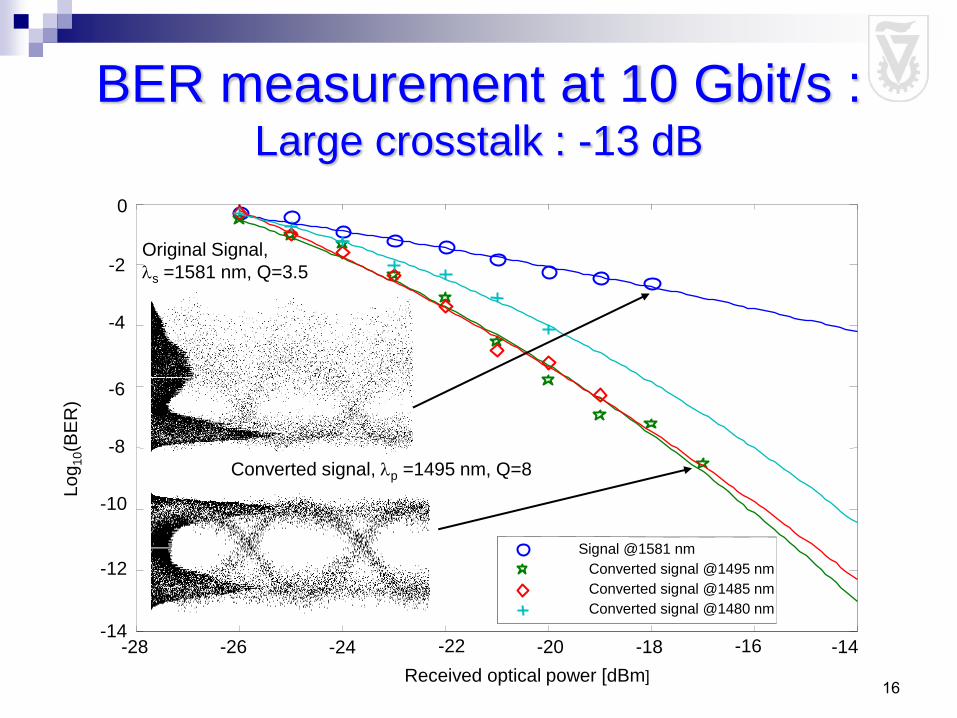
BER measurement at 10 Gbit/s : Large crosstalk : -13 dB
-28 -26 -24 -22 -20 -18 -16 -14 -14
-12
-10
-8
-6
-4
-2
0
Received optical power [dBm]
Signal @1581 nm
Converted signal @1495 nm
Converted signal @1485 nm
Converted signal @1480 nm
Converted signal, p =1495 nm, Q=8
Original Signal,
s =1581 nm, Q=3.5
Lo
g10(B
ER
)
17
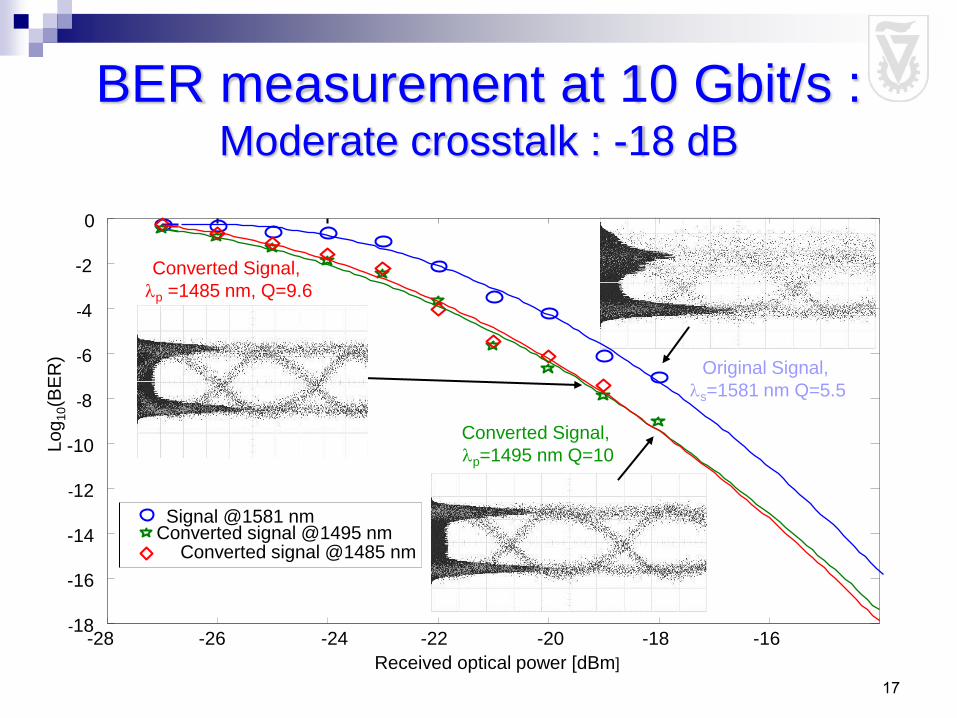
BER measurement at 10 Gbit/s : Moderate crosstalk : -18 dB
Converted signal @1495 nm Converted signal @1485 nm
-28 -26 -24 -22 -20 -18 -16 -18
-16
-14
-12
-10
-8
-6
-4
-2
0
Received optical power [dBm]
Converted Signal,
p=1495 nm Q=10
Signal @1581 nm
Original Signal,
s=1581 nm Q=5.5
Converted Signal,
p =1485 nm, Q=9.6
Log
10(B
ER
)
18
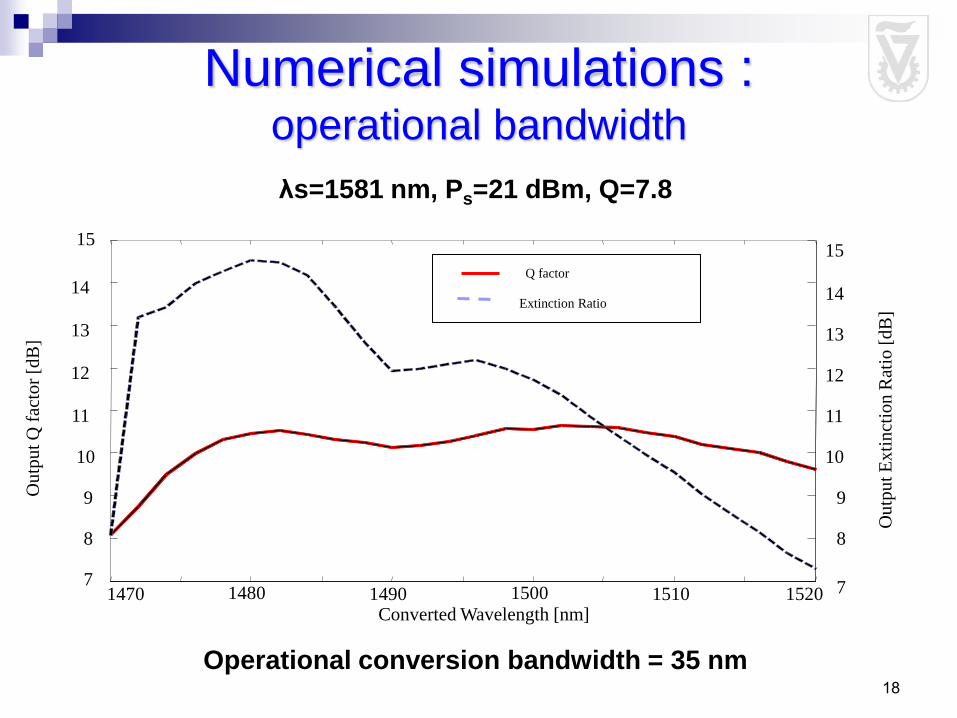
Numerical simulations : operational bandwidth
Converted Wavelength [nm]
Ou
tpu
t Q
fac
tor
[dB
]
1470 1480 1490 1500 1510 1520 7
8
9
10
11
12
13
14
15
Extinction Ratio
7
8
9
10
11
12
13
14
15 Q factor
Ou
tpu
t E
xti
nct
ion
Rat
io [
dB
]
λs=1581 nm, Ps=21 dBm, Q=7.8
Operational conversion bandwidth = 35 nm
19
Slow and fast light propagation via
narrow band optical parametric
amplifier : a route to optical
buffering
20
Motivations
Tunable optical pulse delays are of central importance to
numerous fields including optical coherence tomography,
ultra-fast pulse metrology, and optical communications.
Next Internet Router generation will be based on all
optical packet switching : Need to develop all optical
buffering devices.
Promising approach : controlling the velocity of optical
pulses through dispersive media, a concept termed as
slow and fast light
21
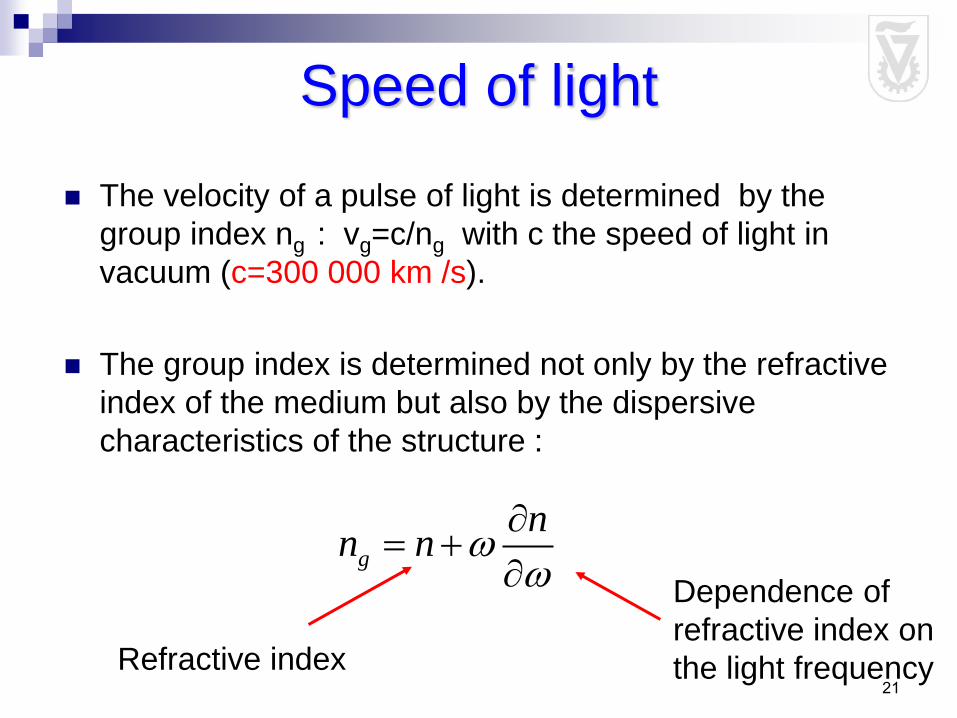
Speed of light
The velocity of a pulse of light is determined by the
group index ng : vg=c/ng with c the speed of light in
vacuum (c=300 000 km /s).
The group index is determined not only by the refractive
index of the medium but also by the dispersive
characteristics of the structure :
g
nn n
Refractive index
Dependence of
refractive index on
the light frequency
22
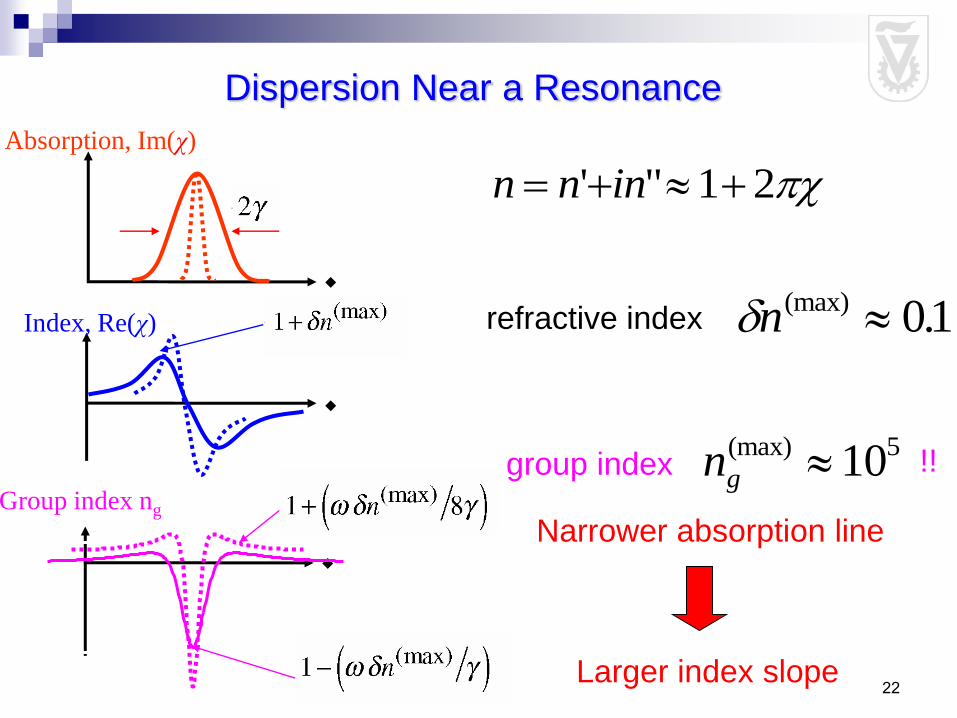
Dispersion Near a Resonance
refractive index
n n in ' " 1 2
group index ng
(max) 105
n(max) . 01
!!
Index, Re(χ)
Group index ng
Absorption, Im(χ)
Narrower absorption line
Larger index slope

23
Slow Light Observations of Hau et al.
The speed of light can be slowed down using the absorption rays in an
ultra cold atomic gas : this requires a complex experimental set up which
is not practical for commercial application
24
Other media SC Waveguide (Passive and active) – Limited by carrier
life time. Maximum delay one bit.
Ruby Crystal – large delay narrow bandwidth
Rubidium vapor – Large delays ultra narrow bandwidth
and large attenuation
Nonlinearities in optical fibers may, on the other hand,
offer optical gain in addition to other advantages such as
a broad range of operating wavelengths, operation at
room temperature and flexible length

25
Slow and Fast Light via Stimulated Brillouin Scattering
Positive and negative delays up to 30 ns have been obtained
for pulse with large width (20 ns) using Stimulated Brillouin
Scattering in fiber. (Boyd et. Al)
The Stimulated Brillouin scattering can be used only for wide
pulses (several ns). This is not practical for high bit rate
applications which require pulse width of 100 ps and lower.
Need to find another process to generate a narrow
band gain spectrum in the fiber but large enough to
amplified picosecond pulses
26
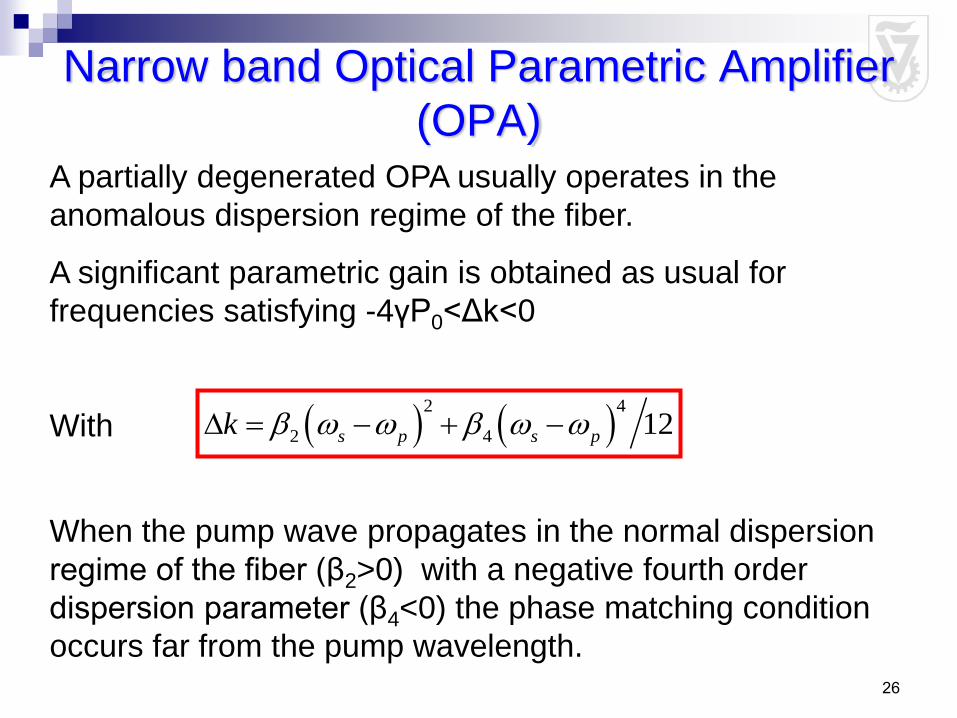
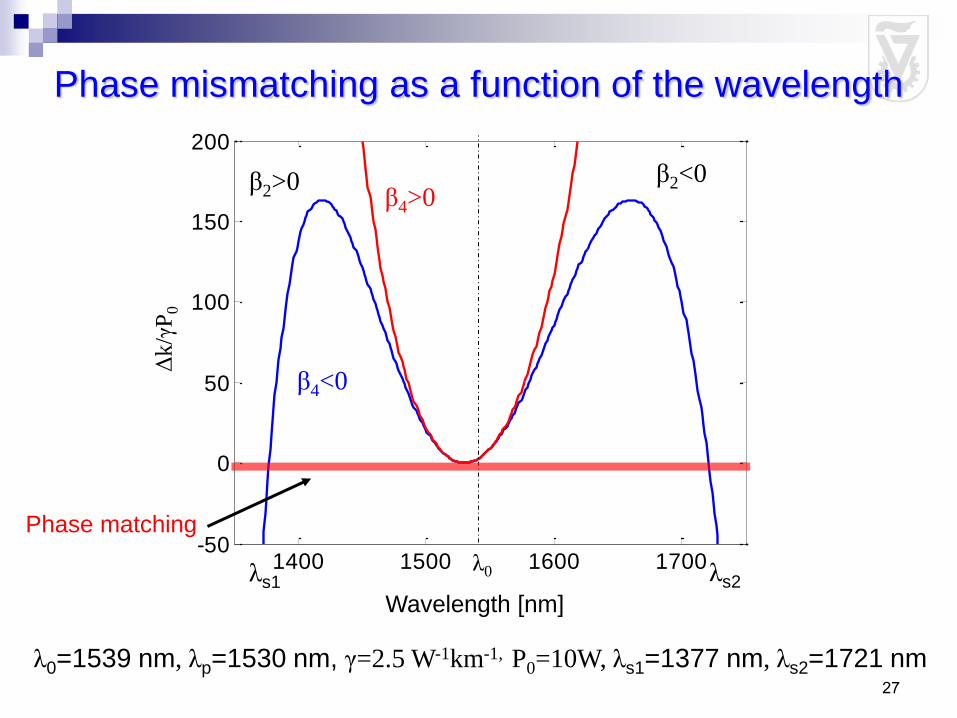
Narrow band Optical Parametric Amplifier
(OPA) A partially degenerated OPA usually operates in the
anomalous dispersion regime of the fiber.
A significant parametric gain is obtained as usual for
frequencies satisfying -4γP0<Δk<0
With
When the pump wave propagates in the normal dispersion
regime of the fiber (β2>0) with a negative fourth order
dispersion parameter (β4<0) the phase matching condition
occurs far from the pump wavelength.
2 4
2 4 12s p s pk
27
Phase mismatching as a function of the wavelength
λ0=1539 nm, λp=1530 nm, γ=2.5 W-1km-1, P0=10W, λs1=1377 nm, λs2=1721 nm
1400 1500 1600 1700-50
0
50
100
150
200
Wavelength [nm]
Δk/γ
P0
β4<0
β4>0
λ0
β2>0 β2<0
λs1 λs2
Phase matching
28
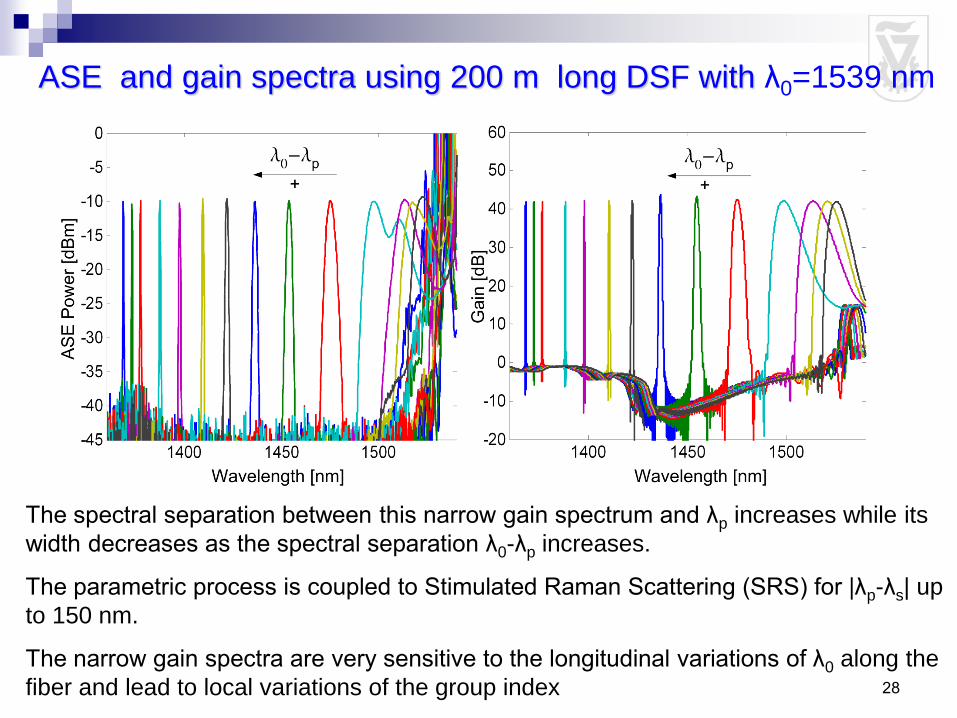
ASE and gain spectra using 200 m long DSF with λ0=1539 nm
The spectral separation between this narrow gain spectrum and λp increases while its
width decreases as the spectral separation λ0-λp increases.
The parametric process is coupled to Stimulated Raman Scattering (SRS) for |λp-λs| up
to 150 nm.
The narrow gain spectra are very sensitive to the longitudinal variations of λ0 along the
fiber and lead to local variations of the group index
29
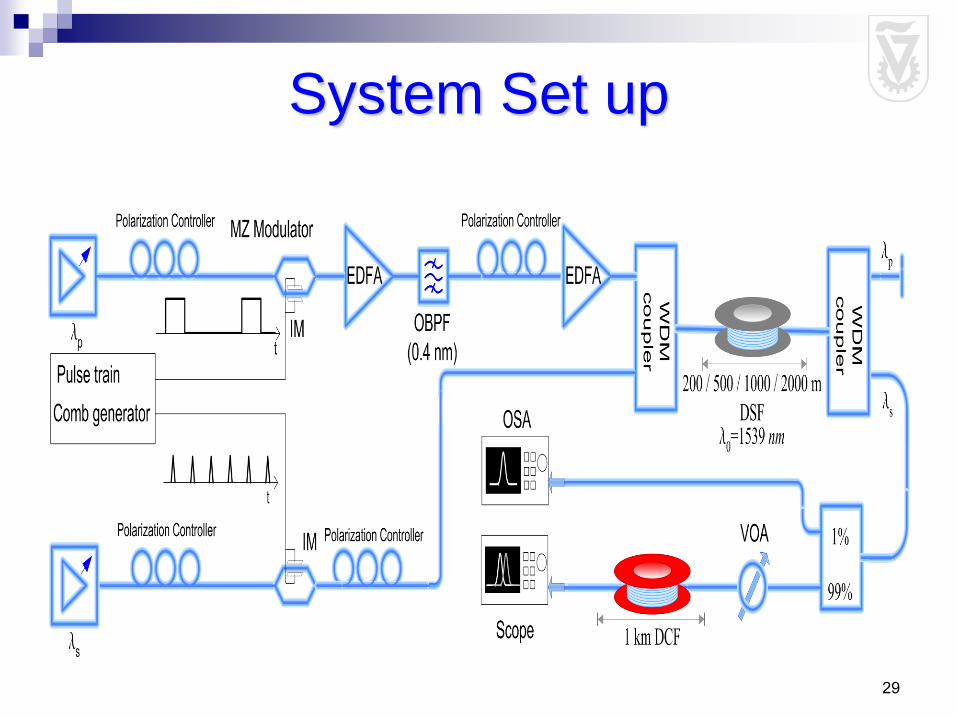
System Set up
30
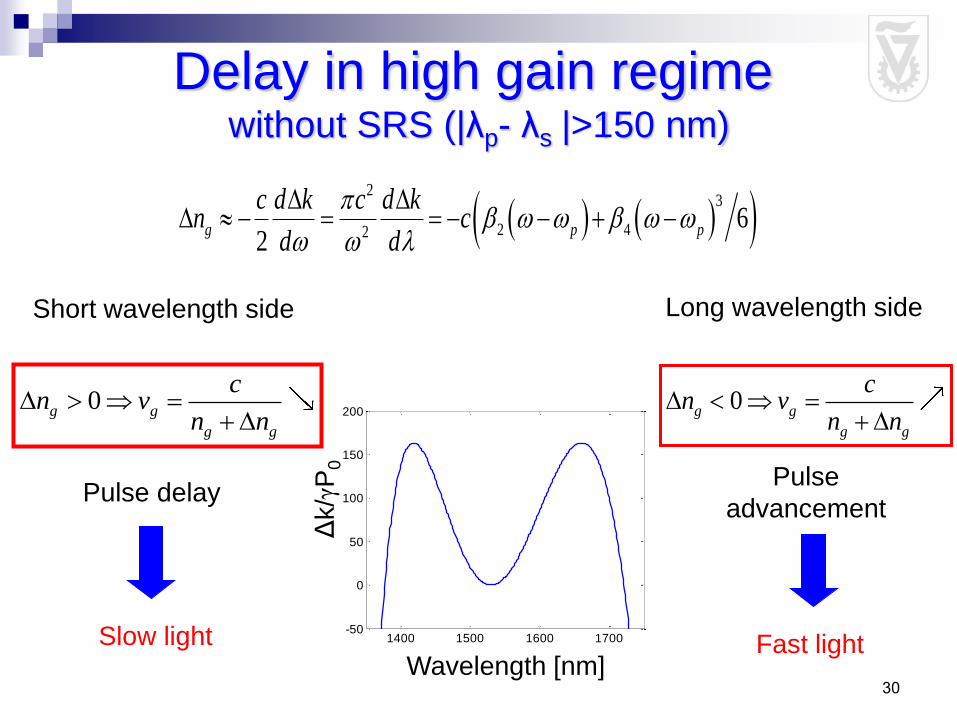
Delay in high gain regime without SRS (|λp- λs |>150 nm)
2
3
2 426
2g p p
c d k c d kn c
d d
Short wavelength side Long wavelength side
1400 1500 1600 1700-50
0
50
100
150
200
Wavelength [nm]
Δk/γ
P0
0g g
g g
cn v
n n
0g g
g g
cn v
n n
Pulse delay Pulse
advancement
Slow light Fast light

31
Theoretical gain and delay spectra
Wavelength [nm]
OP
A G
ain
[d
B]
Tim
e D
ela
y [p
s]
1376 1376.5 1377 1377.5 1378
-5
0
5
10
15
20
25
30
35
40
-15
-10
-5
0
5
10
15
20
25
30
(a)
Wavelength [nm]
Tim
e D
ela
y [p
s]
OP
A G
ain
[d
B]
(b)
1720 1720.5 1721 1721.5 1722 1722.5
-5
0
5
10
15
20
25
30
35
40
-15
-10
-5
0
5
10
15
20
25
30
(b)
λp=1530 nm, P0=10 W, 200 m long DSF
In both spectral regimes, the same maximum gain value of 34 dB and the
maximum absolute value of the induced timing delay is 19 ps.
Both delay spectra are large and quite flat over some 40 GHz where the gain
exceeds 25 dB.
32
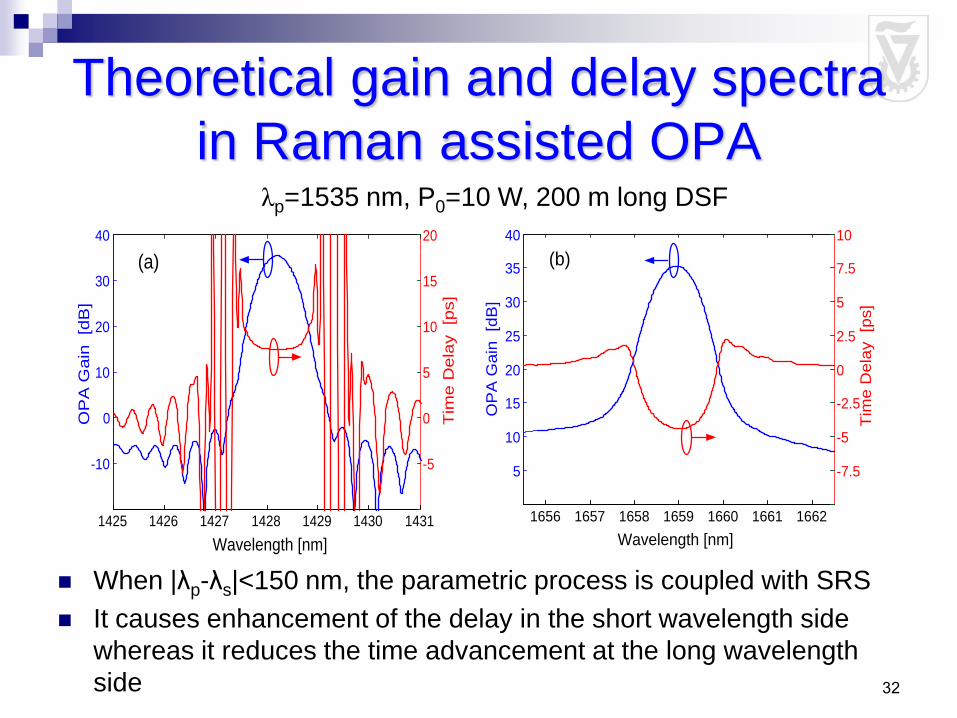
Theoretical gain and delay spectra
in Raman assisted OPA
Wavelength [nm]
OP
A G
ain
[d
B]
Tim
e D
ela
y [p
s]
1425 1426 1427 1428 1429 1430 1431
-10
0
10
20
30
40
-5
0
5
10
15
20
(a)
Wavelength [nm]
OP
A G
ain
[d
B]
Tim
e D
ela
y [p
s]
1656 1657 1658 1659 1660 1661 1662
5
10
15
20
25
30
35
40
-7.5
-5
-2.5
0
2.5
5
7.5
10
(b)
λp=1535 nm, P0=10 W, 200 m long DSF
When |λp-λs|<150 nm, the parametric process is coupled with SRS
It causes enhancement of the delay in the short wavelength side
whereas it reduces the time advancement at the long wavelength
side
33
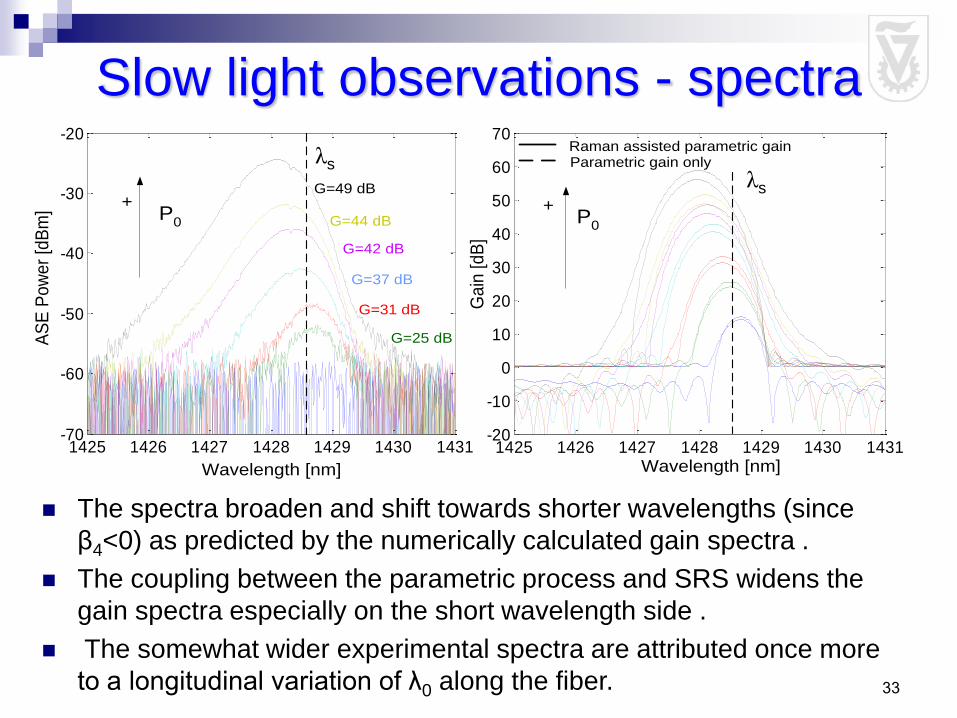
Slow light observations - spectra
The spectra broaden and shift towards shorter wavelengths (since
β4<0) as predicted by the numerically calculated gain spectra .
The coupling between the parametric process and SRS widens the
gain spectra especially on the short wavelength side .
The somewhat wider experimental spectra are attributed once more
to a longitudinal variation of λ0 along the fiber.
1425 1426 1427 1428 1429 1430 1431-20
-10
0
10
20
30
40
50
60
70
1425 1426 1427 1428 1429 1430 1431-70
-60
-50
-40
-30
-20
Wavelength [nm]
Raman assisted parametric gainParametric gain only
Wavelength [nm]
G=49 dB
G=44 dB
G=42 dB
G=37 dB
G=31 dB
G=25 dB
P0
+
AS
E P
ow
er
[dB
m]
Ga
in [d
B]
P0
+
λs λs
34
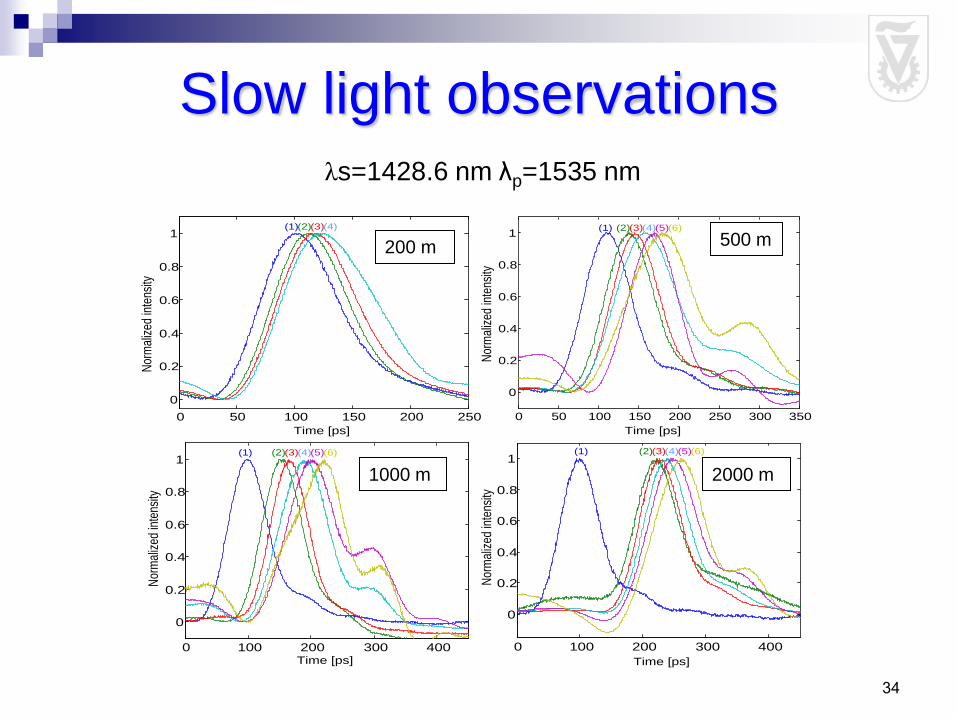
Slow light observations
Time [ps]
0 50 100 150 200 250
0
0.2
0.4
0.6
0.8
1
Nor
mal
ized
inte
nsity
(a)(1)(2)(3)(4)
0 100 200 300 400
0
0.2
0.4
0.6
0.8
1
0 100 200 300 400
0
0.2
0.4
0.6
0.8
1
Nor
mal
ized
inte
nsity
Nor
mal
ized
inte
nsity
Time [ps] Time [ps]
(c) (d)(1) (2)(3)(4)(5)(6) (1) (2)(3)(4)(5)(6)
Nor
mal
ized
inte
nsity
Time [ps]
0 50 100 150 200 250 300 350
0
0.2
0.4
0.6
0.8
1(1) (2)(3)(4)(5)(6)(b)
200 m 500 m
1000 m 2000 m
λs=1428.6 nm λp=1535 nm
35
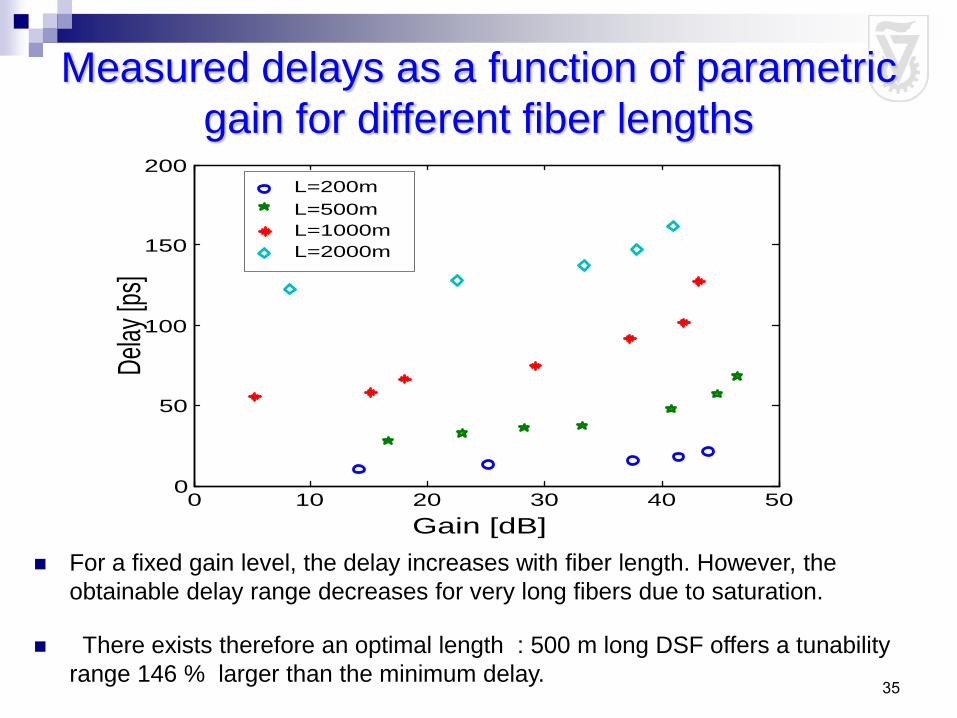
Measured delays as a function of parametric
gain for different fiber lengths
For a fixed gain level, the delay increases with fiber length. However, the
obtainable delay range decreases for very long fibers due to saturation.
There exists therefore an optimal length : 500 m long DSF offers a tunability
range 146 % larger than the minimum delay.
Del
ay [p
s]
0 10 20 30 40 500
50
100
150
200
Gain [dB]
L=200m
L=500m
L=1000m
L=2000m
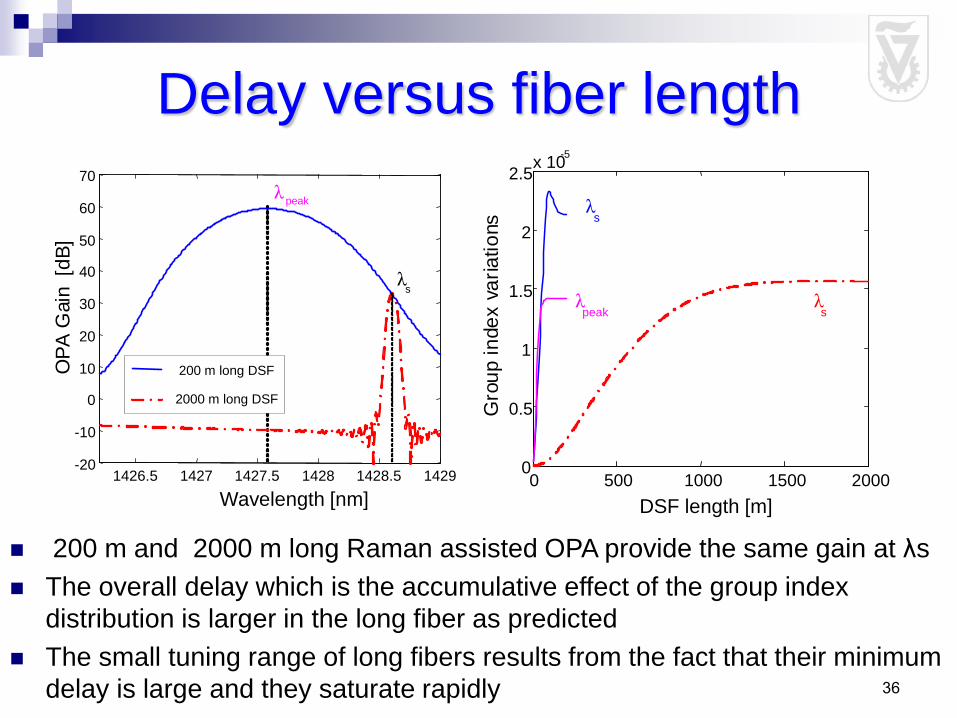
36
Delay versus fiber length
200 m and 2000 m long Raman assisted OPA provide the same gain at λs
The overall delay which is the accumulative effect of the group index
distribution is larger in the long fiber as predicted
The small tuning range of long fibers results from the fact that their minimum
delay is large and they saturate rapidly
0 500 1000 1500 2000 0
0.5
1
1.5
2
2.5 x 10
-5
DSF length [m] G
r o u p
i n
d e x v
a r i
a t i o
n s
λ s
λ s
λ peak
Wavelength [nm]
1426.5 1427 1427.5 1428 1428.5 1429 -20
-10
0
10
20
30
40
50
60
70
O P
A G
a i n
[ d
B ]
-5
2000 m long DSF
200 m long DSF
λ s
λ peak
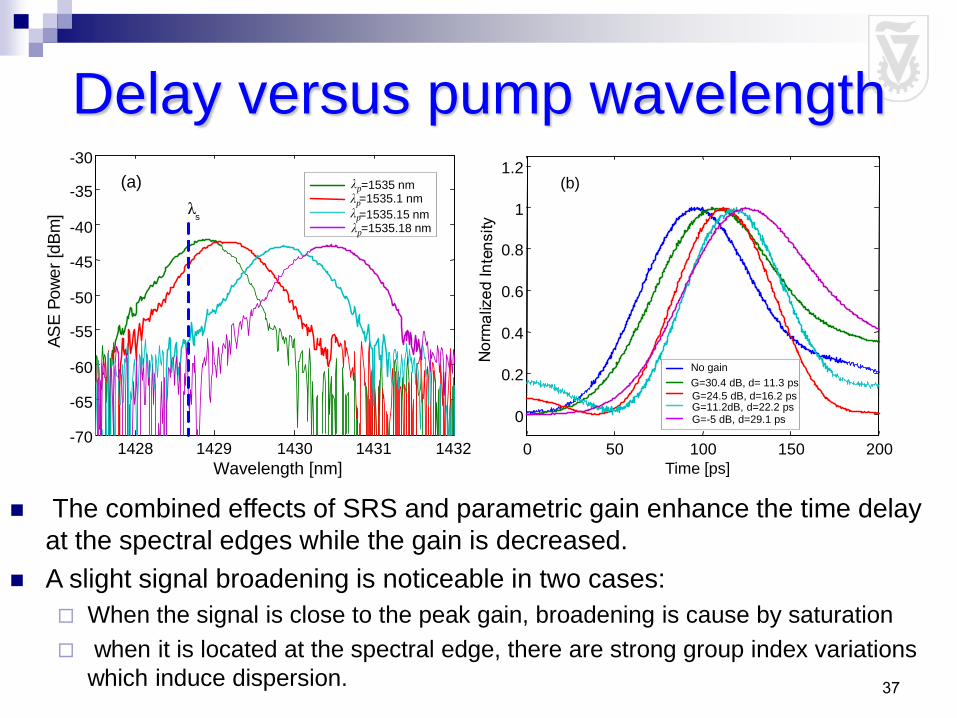
37
Delay versus pump wavelength
The combined effects of SRS and parametric gain enhance the time delay
at the spectral edges while the gain is decreased.
A slight signal broadening is noticeable in two cases:
When the signal is close to the peak gain, broadening is cause by saturation
when it is located at the spectral edge, there are strong group index variations
which induce dispersion.
1428 1429 1430 1431 1432 -70
-65
-60
-55
-50
-45
-40
-35
-30
Wavelength [nm]
λ s
A S
E P
o w
e r
[ d B
m ]
(a) λp =1535 nm λp =1535.1 nm
λp =1535.15 nm λp =1535.18 nm
0 50 100 150 200
0
0.2
0.4
0.6
0.8
1
1.2
Time [ps]
(b)
No gain
G=30.4 dB, d= 11.3 ps
G=24.5 dB, d=16.2 ps G=11.2dB, d=22.2 ps G=-5 dB, d=29.1 ps
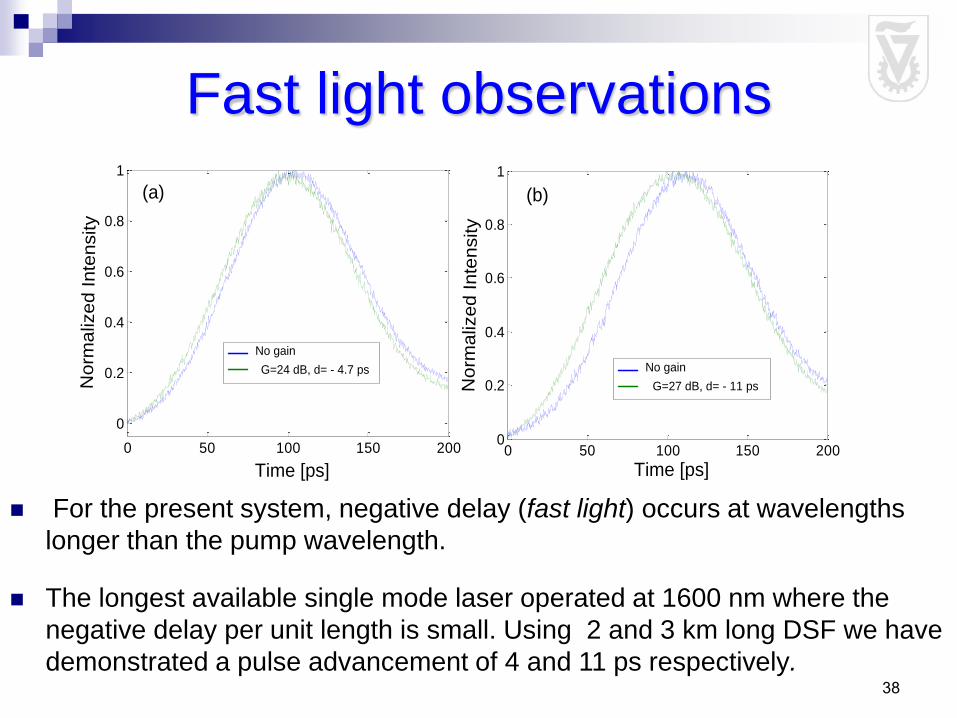
38
Fast light observations
0 50 100 150 200
0
0.2
0.4
0.6
0.8
1
Time [ps]
No
rma
lize
d In
ten
sity
No gain
G=24 dB, d= - 4.7 ps
(a)
0 50 100 150 2000
0.2
0.4
0.6
0.8
1
Time [ps]N
orm
aliz
ed
In
ten
sity
No gain
G=27 dB, d= - 11 ps
(b)
For the present system, negative delay (fast light) occurs at wavelengths
longer than the pump wavelength.
The longest available single mode laser operated at 1600 nm where the
negative delay per unit length is small. Using 2 and 3 km long DSF we have
demonstrated a pulse advancement of 4 and 11 ps respectively.
39
Parametric Processes in
fibers for optical pulse
source generation
40
A Self Starting Ultra Low Jitter
Pulse Source Using Coupled
Optoelectronic Oscillators with an
Intra Cavity Fiber Parametric
Amplifier

41
Background and motivation
Timing stability is a performance limiter
Known sources of highly stable pulse trains
Self-starting optoelectronic oscillators
Optoelectronic oscillator with an EO modulator
Interlocked microwave and mode locked diode
lasers based optoelectronic oscillators
Jitter level :
Several tens of fs at 10 GHz
repetition rate
Actively mode locked laser ( fiber or diode )
Jitter level is dictated by high quality external
drive microwave source Jitter level :
Below 10 fs at 10 GHz repetition rate
42
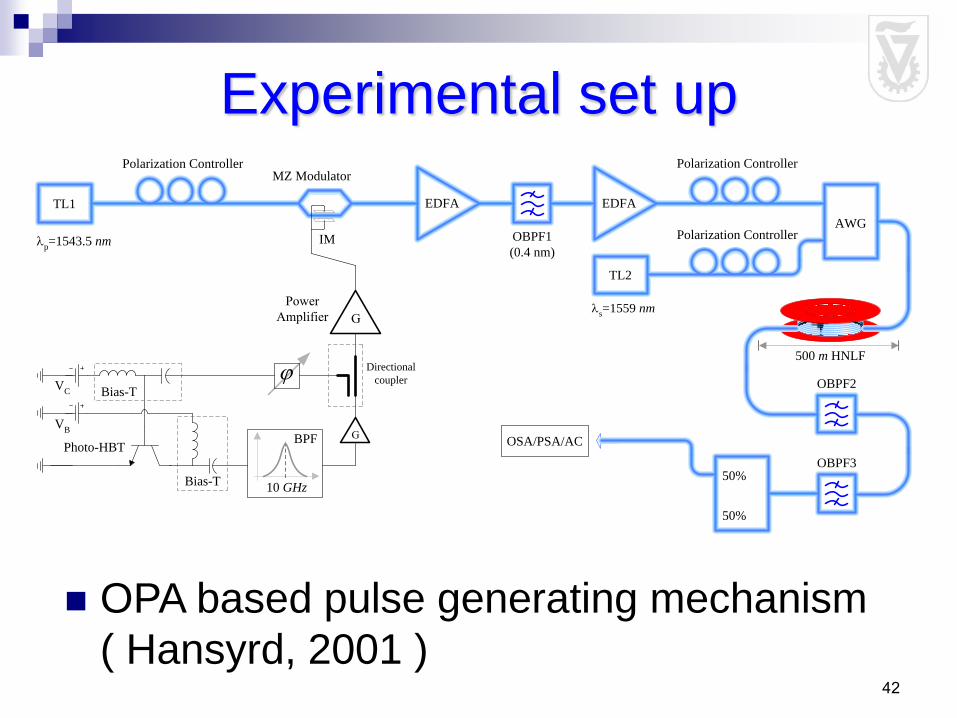
500 m HNLF
MZ ModulatorPolarization Controller
TL1 EDFA EDFA
AWG
TL2
50%
50%
OSA/PSA/AC
OBPF3
Polarization Controller
Polarization Controller
OBPF2
OBPF1
(0.4 nm)
p=1543.5 nm
PowerAmplifier G
IM
Bias-T
Photo-HBT
Bias-T
VB
VC
BPF
10 GHz
Directional
coupler
G
Experimental set up
OPA based pulse generating mechanism
( Hansyrd, 2001 )
s=1559 nm
43
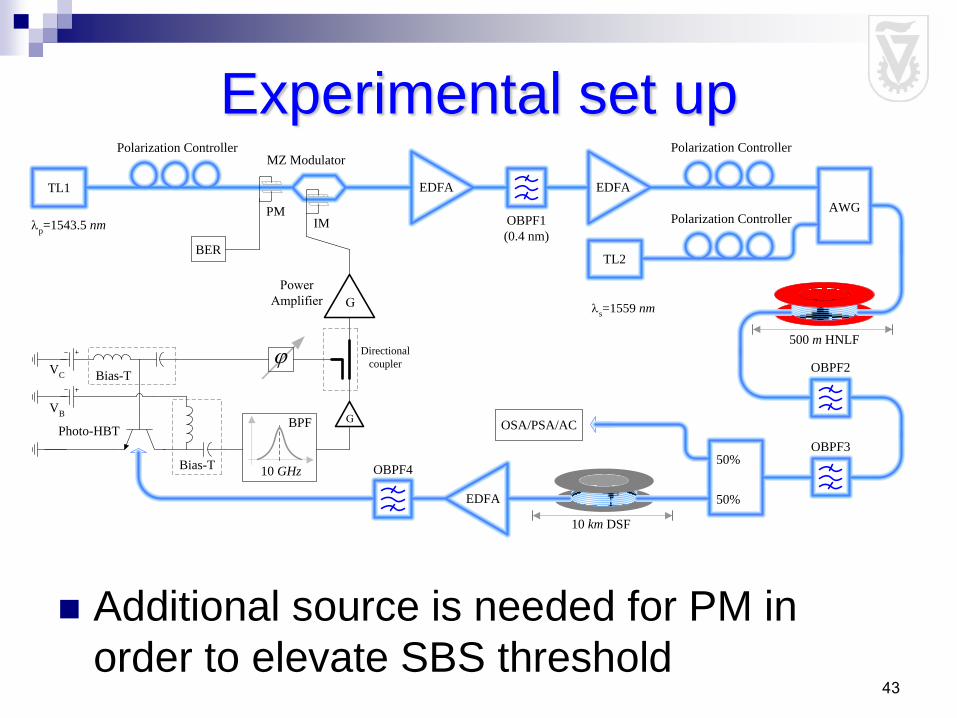
500 m HNLF
10 km DSF
MZ ModulatorPolarization Controller
TL1 EDFA EDFA
AWG
TL2
50%
50%
OSA/PSA/AC
EDFA
OBPF3
Polarization Controller
Polarization Controller
OBPF2
OBPF1
(0.4 nm)
p=1543.5 nm
OBPF4
PM
BER
PowerAmplifier G
IM
Bias-T
Photo-HBT
Bias-T
VB
VC
BPF
10 GHz
Directional
coupler
G
Experimental set up
Additional source is needed for PM in
order to elevate SBS threshold
s=1559 nm
44
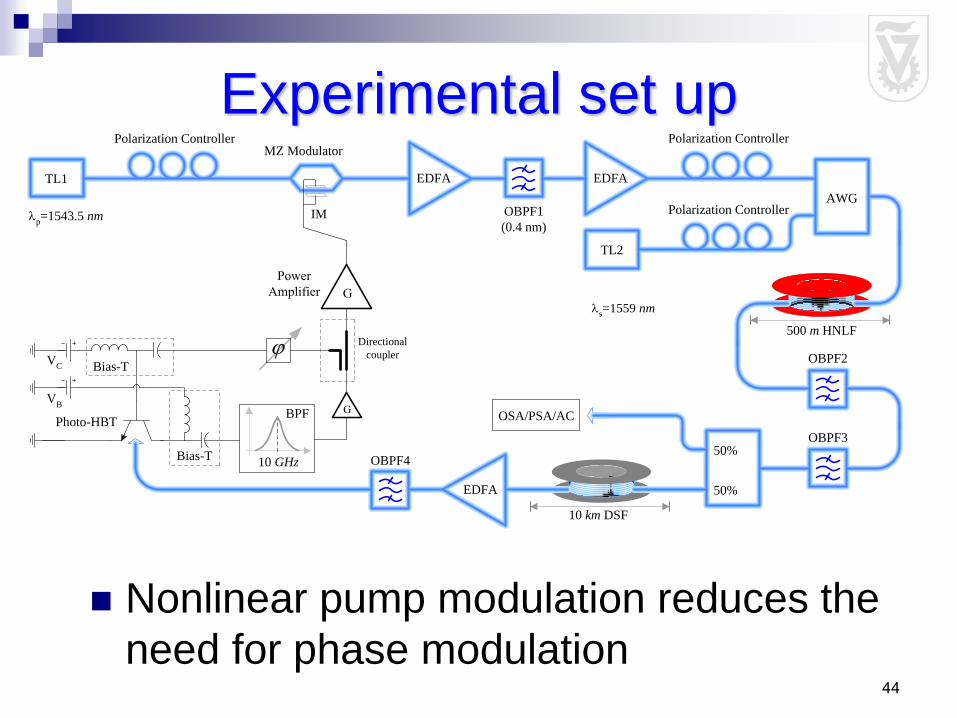
500 m HNLF
10 km DSF
MZ ModulatorPolarization Controller
TL1 EDFA EDFA
AWG
TL2
50%
50%
OSA/PSA/AC
EDFA
OBPF3
Polarization Controller
Polarization Controller
OBPF2
OBPF1
(0.4 nm)
p=1543.5 nm
OBPF4
PowerAmplifier G
IM
Bias-T
Photo-HBT
Bias-T
VB
VC
BPF
10 GHz
Directional
coupler
G
Nonlinear pump modulation reduces the
need for phase modulation
Experimental set up
s=1559 nm
45
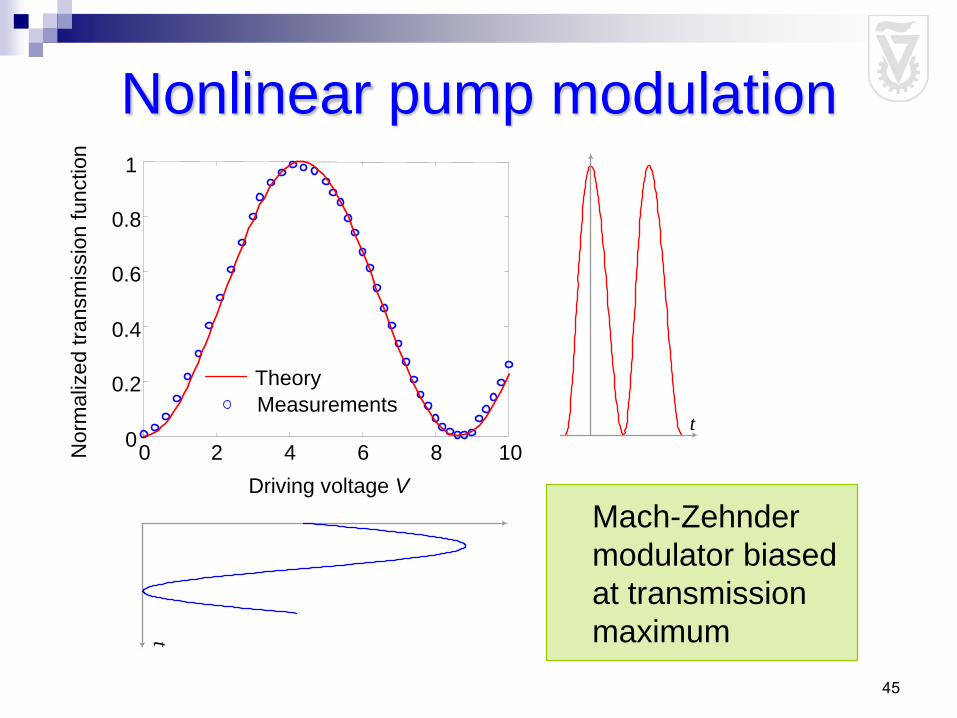
Nonlinear pump modulation
0 2 4 6 8 10 0
0.2
0.4
0.6
0.8
1
Theory
Measurements t
t
Norm
aliz
ed tra
nsm
issio
n function
Driving voltage V
Mach-Zehnder
modulator biased
at transmission
maximum
46
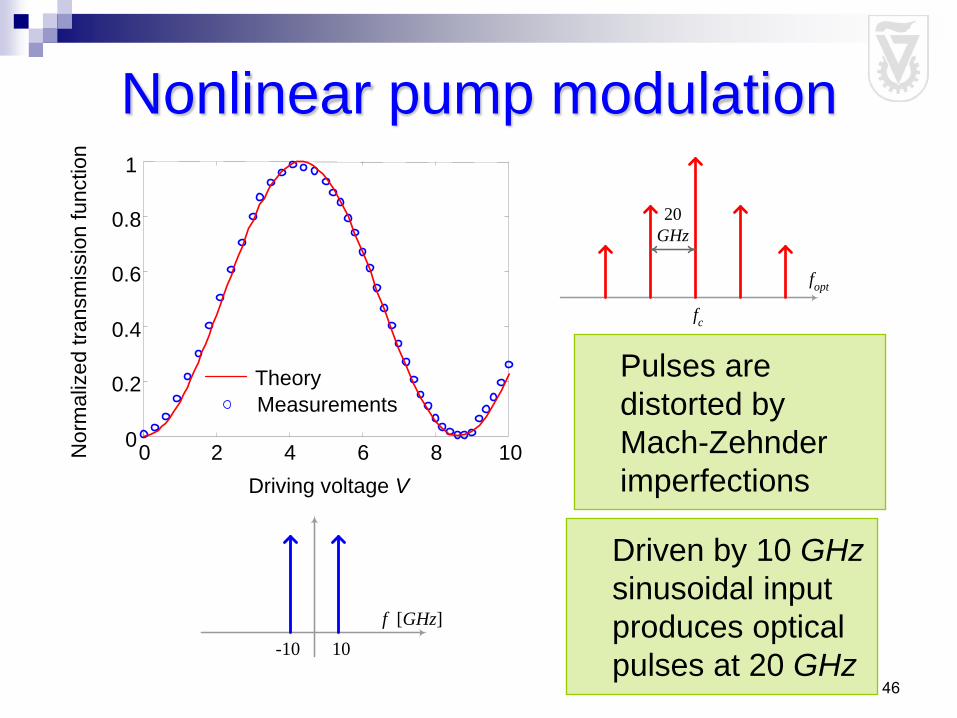
Nonlinear pump modulation
0 2 4 6 8 10 0
0.2
0.4
0.6
0.8
1
Theory
Measurements
f [GHz]
10-10
fopt
20
GHz
fc
Norm
aliz
ed tra
nsm
issio
n function
Driving voltage V
Driven by 10 GHz
sinusoidal input
produces optical
pulses at 20 GHz
Pulses are
distorted by
Mach-Zehnder
imperfections
47
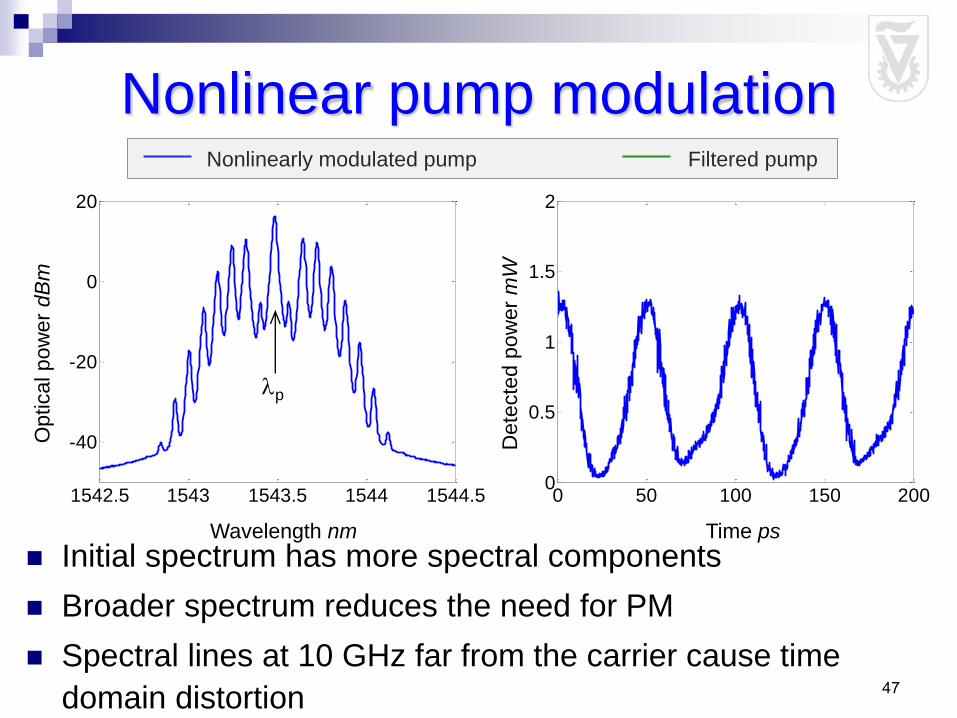
Initial spectrum has more spectral components
Broader spectrum reduces the need for PM
Spectral lines at 10 GHz far from the carrier cause time
domain distortion
0 50 100 150 2000
0.5
1
1.5
2
1542.5 1543 1543.5 1544 1544.5
-40
-20
0
20
Nonlinear pump modulation
Wavelength nm Time ps
Optical pow
er
dB
m
De
tecte
d p
ow
er
mW
p
Nonlinearly modulated pump Filtered pump

48
Spectral lines at 10 GHz far from the carrier cause time domain
distortion
Around 1the spectrum is of 10 GHz pulse train
Two missing lines cause the 20 GHz sub-pulses
0 50 100 150 2000
0.5
1
1.5
2
0 50 100 150 2000
0.5
1
1.5
2
1542.5 1543 1543.5 1544 1544.5
-40
-20
0
20
Nonlinear pump modulation
Wavelength nm Time ps
1542.5 1543 1543.5 1544 1544.5
-40
-20
0
20
Optical pow
er
dB
m
De
tecte
d p
ow
er
mW
p 1
Nonlinearly modulated pump Filtered pump
49
-60 -40 -20 0 20 40 600
0.2
0.4
0.6
0.8
1
-60 -40 -20 0 20 40 600
0.2
0.4
0.6
0.8
1
1510 1530 1550 1570 1590
-5
5
15
25
35
45
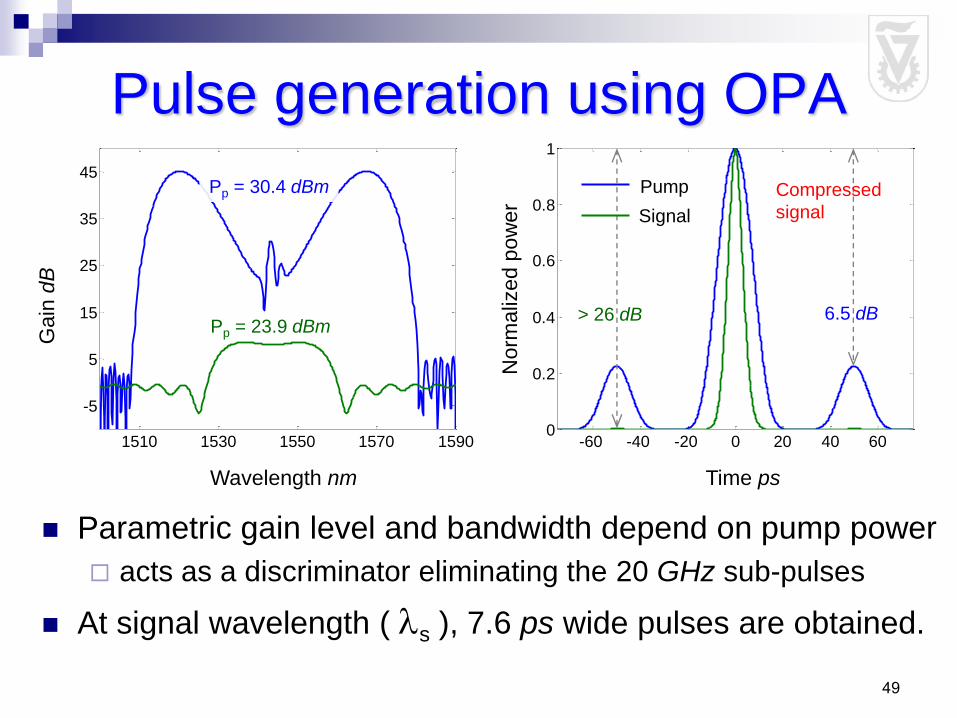
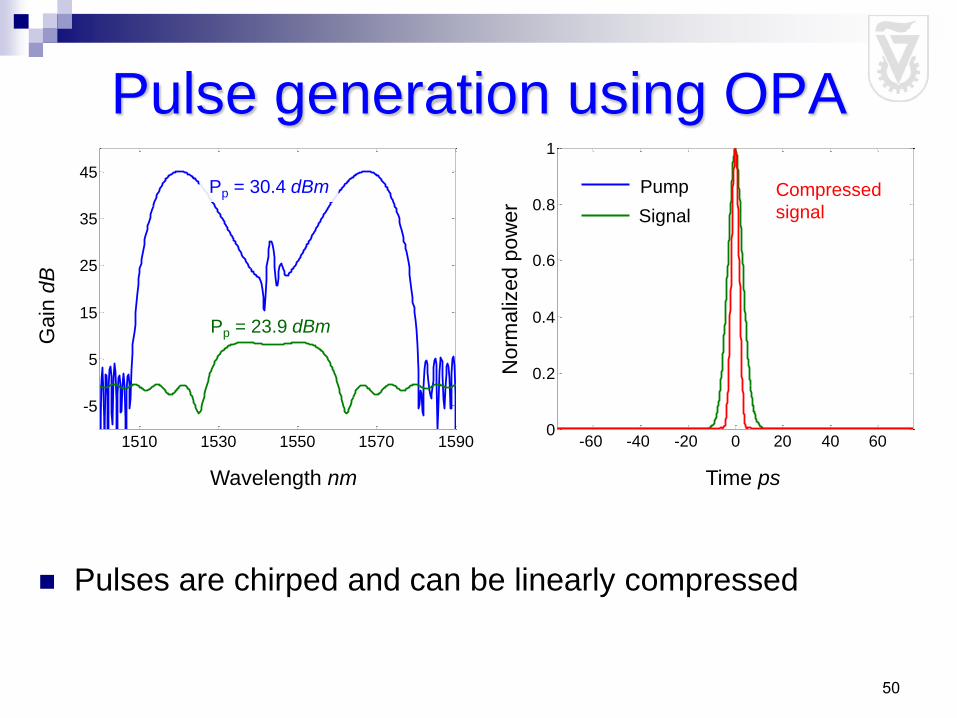
Pulse generation using OPA
Wavelength nm Time ps
Gain
dB
Norm
aliz
ed p
ow
er
Pp = 30.4 dBm
Pp = 23.9 dBm
Parametric gain level and bandwidth depend on pump power
acts as a discriminator eliminating the 20 GHz sub-pulses
At signal wavelength ( s ), 7.6 ps wide pulses are obtained.
> 26 dB 6.5 dB
Pump
Signal
Compressed
signal
50
-60 -40 -20 0 20 40 600
0.2
0.4
0.6
0.8
1
-60 -40 -20 0 20 40 600
0.2
0.4
0.6
0.8
1
-60 -40 -20 0 20 40 600
0.2
0.4
0.6
0.8
1
1510 1530 1550 1570 1590
-5
5
15
25
35
45
Pulse generation using OPA
Wavelength nm Time ps
Gain
dB
Norm
aliz
ed p
ow
er
Pp = 30.4 dBm
Pp = 23.9 dBm
Pulses are chirped and can be linearly compressed
Pump
Signal
Compressed
signal
51
1557 1558 1559 1560 1561
-60
-40
-20
0
1557 1558 1559 1560 1561
-60
-40
-20
0
1526 1527 1528 1529 1530
-60
-40
-20
0
0 50 100 150 2000
1
2
3
4
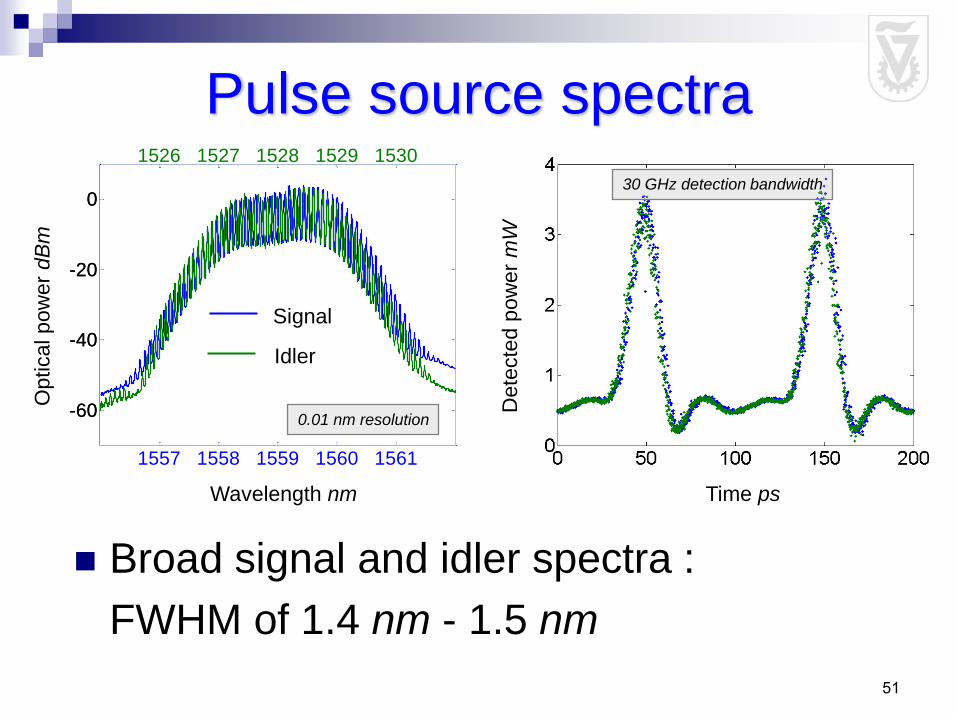
Pulse source spectra
Broad signal and idler spectra :
FWHM of 1.4 nm - 1.5 nm
Wavelength nm Time ps
Optical pow
er
dB
m
Dete
cte
d p
ow
er
mW
Signal
Idler
0.01 nm resolution
30 GHz detection bandwidth
52
-20 -10 0 10 20
0
0.2
0.4
0.6
0.8
1
-20 -10 0 10 20
0
0.2
0.4
0.6
0.8
1
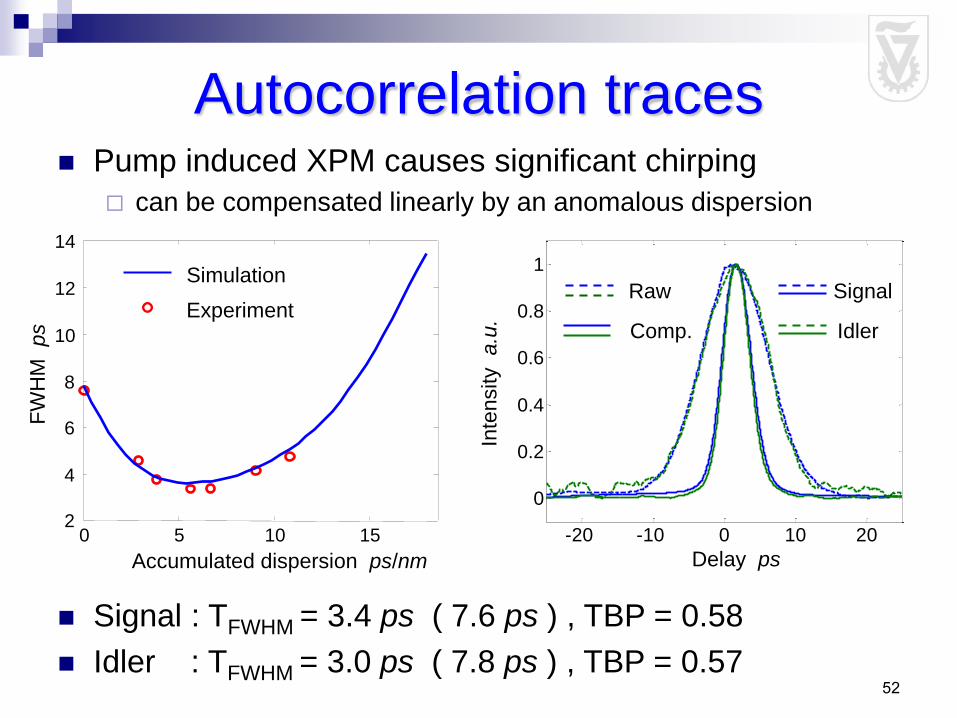
Autocorrelation traces
Experiment
Accumulated dispersion ps/nm
FW
HM
p
s
0 5 10 15 2
4
6
8
10
12
14
Simulation
Delay ps
Inte
nsity
a.u
.
Raw
Comp.
Signal
Idler
Signal : TFWHM = 3.4 ps ( 7.6 ps ) , TBP = 0.58
Idler : TFWHM = 3.0 ps ( 7.8 ps ) , TBP = 0.57
Pump induced XPM causes significant chirping
can be compensated linearly by an anomalous dispersion

53
Comparison with results using sinusoidal pump modulation
with phase modulation @ 500 Mbps
Wavelength [nm]
1542 1543 1544 -60
-40
-20
0
[dB
m]
1526 1527 1528 -70
-50
-30
-10
10
1557 1558 1559 1560 -70
-50
-30
-10
10
[dB
m]
[d
Bm
]
100 ps
Pum
p
Sig
nal
Idle
r
Δλs=0.41 nm
TFWHM=9.5 ps
(after compression)
TBP=0.45
Δλs=0.39 nm
TFWHM=9 ps
(after compression)
TBP=0.47
Δλs=0.16 nm
TFWHM=37 ps
54
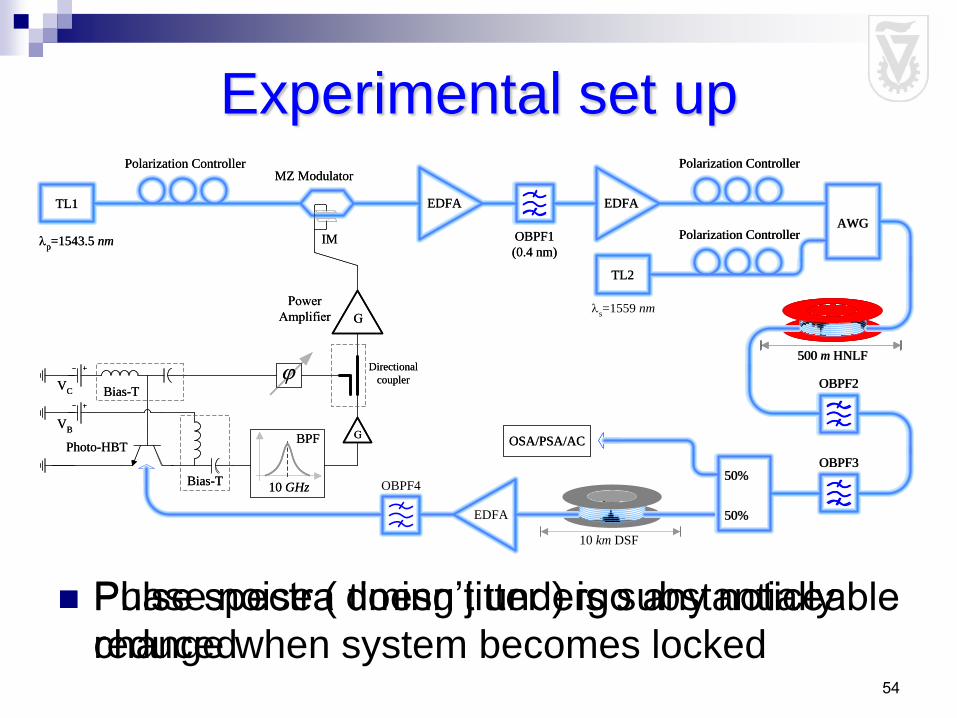
Phase noise ( timing jitter ) is substantially
reduced
500 m HNLF
10 km DSF
MZ ModulatorPolarization Controller
TL1 EDFA EDFA
AWG
TL2
50%
50%
OSA/PSA/AC
EDFA
OBPF3
Polarization Controller
Polarization Controller
OBPF2
OBPF1
(0.4 nm)
p=1543.5 nm
OBPF4
PowerAmplifier G
IM
Bias-T
Photo-HBT
Bias-T
VB
VC
BPF
10 GHz
Directional
coupler
G
Pulse spectra doesn’t undergo any noticeable
change when system becomes locked
500 m HNLF
MZ ModulatorPolarization Controller
TL1 EDFA EDFA
AWG
TL2
50%
50%
OSA/PSA/AC
OBPF3
Polarization Controller
Polarization Controller
OBPF2
OBPF1
(0.4 nm)
p=1543.5 nm
PowerAmplifier G
IM
Bias-T
Photo-HBT
Bias-T
VB
VC
BPF
10 GHz
Directional
coupler
G
Experimental set up
s=1559 nm
55
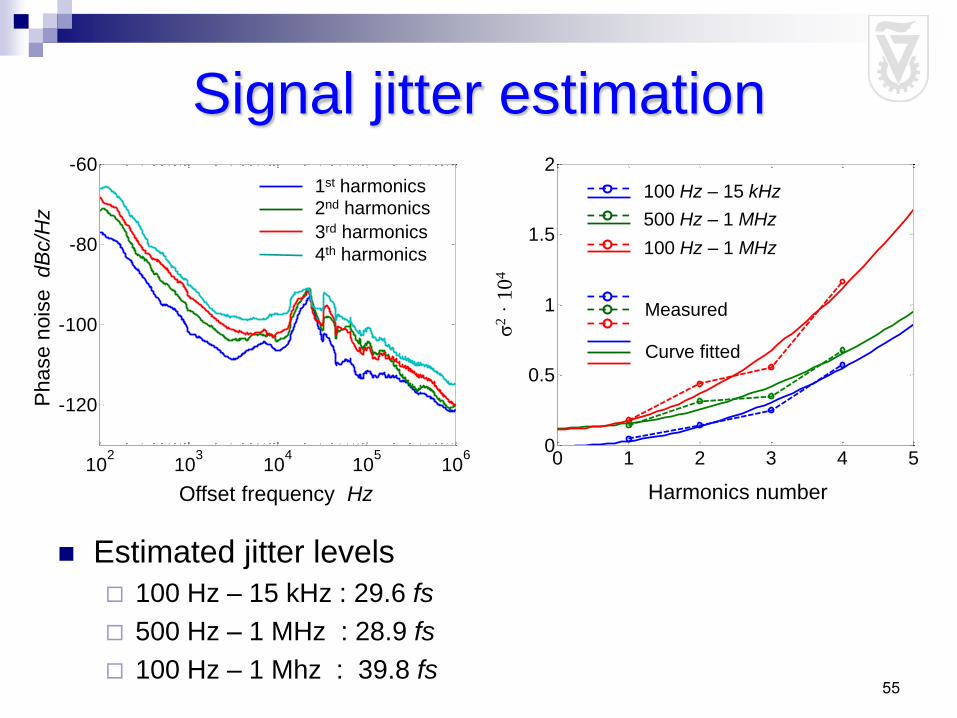
Signal jitter estimation
102
103
104
105
106
-120
-100
-80
-60
0 1 2 3 4 50
0.5
1
1.5
2
0 1 2 3 4 50
0.5
1
1.5
2
100 Hz – 15 kHz
500 Hz – 1 MHz
100 Hz – 1 MHz
Measured
Curve fitted
1st harmonics
2nd harmonics
3rd harmonics
4th harmonics
Offset frequency Hz
Phase n
ois
e dB
c/H
z
Harmonics number σ
2 ·
10
4
Estimated jitter levels
100 Hz – 15 kHz : 29.6 fs
500 Hz – 1 MHz : 28.9 fs
100 Hz – 1 Mhz : 39.8 fs

56
0 1 2 3 4 5-0.5
0
0.5
1
1.5
2
2.5
0 1 2 3 4 5-0.5
0
0.5
1
1.5
2
2.5
102
103
104
105
106
-120
-100
-80
-60
Idler jitter estimation
100 Hz – 15 kHz
500 Hz – 1 MHz
100 Hz – 1 MHz
Measured
Curve fitted
1st harmonics
2nd harmonics
3rd harmonics
4th harmonics
Offset frequency Hz
Phase n
ois
e dB
c/H
z
Harmonics number σ
2 ·
10
4
Estimated jitter levels
100 Hz – 15 kHz : 49.7 fs
500 Hz – 1 MHz : 34.3 fs
100 Hz – 1 Mhz : 58.8 fs
57
Multi wavelength pulse sources
based on saturated OPA without
spectral broadening
58
Motivations
For high bit rates and long transmission
distances RZ format is more robust than NRZ format
In RZ-WDM systems , it is necessary to develop laser pulsed sources at high bit rate for each channel
A cost effective way is to use CW sources and to create RZ pulses for all the channels simultaneously
59
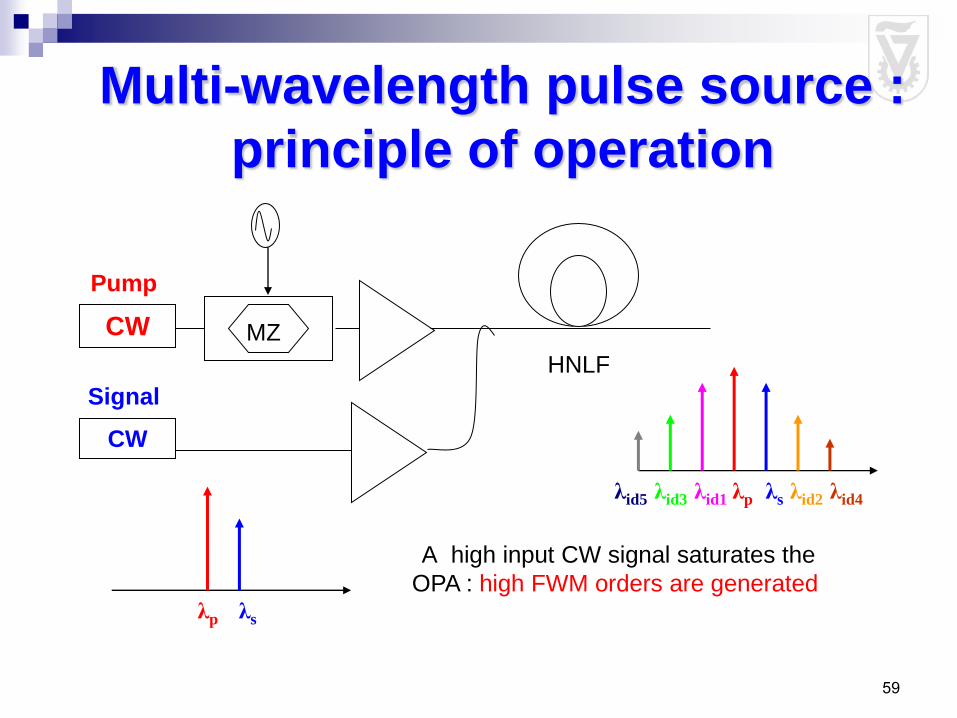
Multi-wavelength pulse source :
principle of operation
HNLF
CW
CW
MZ
Pump
λp λs
Signal
λp λs λid1 λid2 λid3 λid5 λid4
A high input CW signal saturates the
OPA : high FWM orders are generated
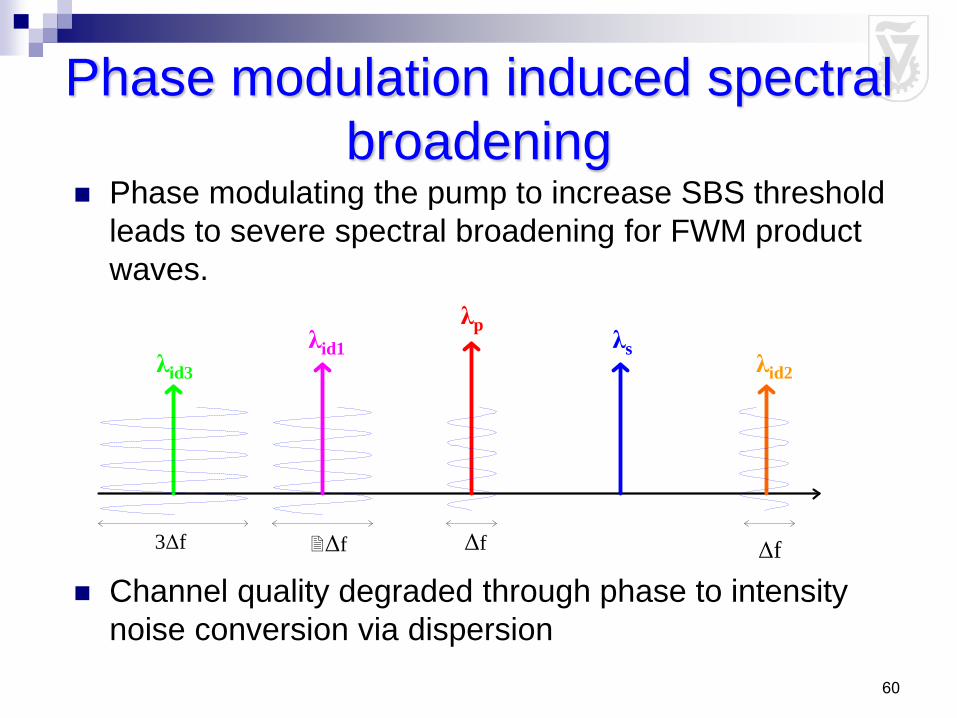
60
2Δf 3Δf
Phase modulation induced spectral
broadening Phase modulating the pump to increase SBS threshold
leads to severe spectral broadening for FWM product
waves.
Channel quality degraded through phase to intensity
noise conversion via dispersion
λp λs
λid2
λid1 λid3
Δf Δf
61
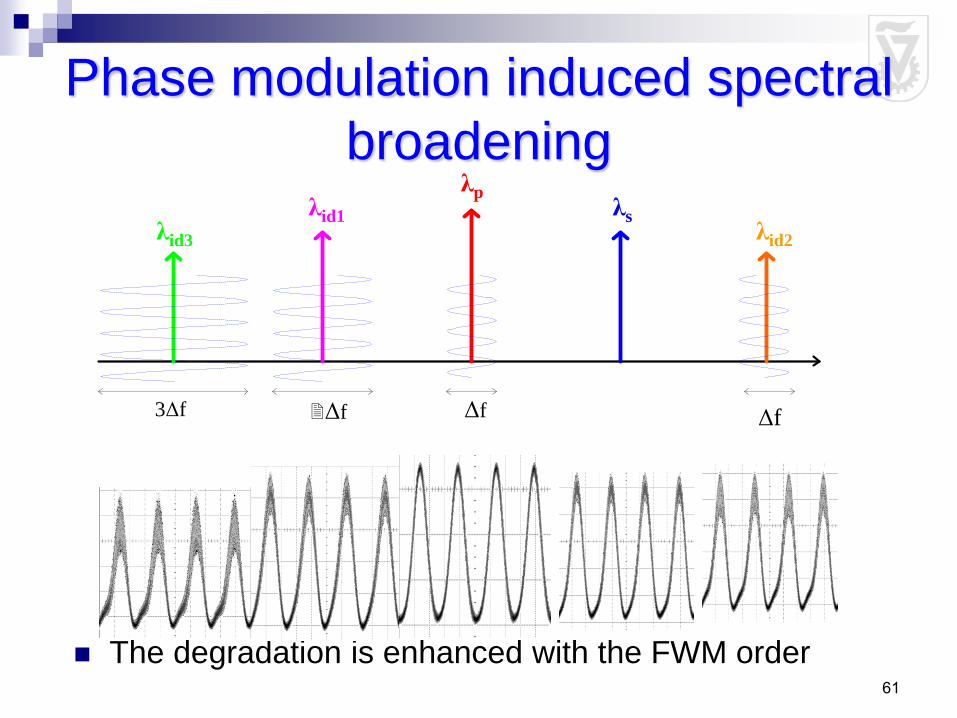
2Δf 3Δf
Phase modulation induced spectral
broadening
The degradation is enhanced with the FWM order
λp λs
λid2
λid1 λid3
Δf Δf
62
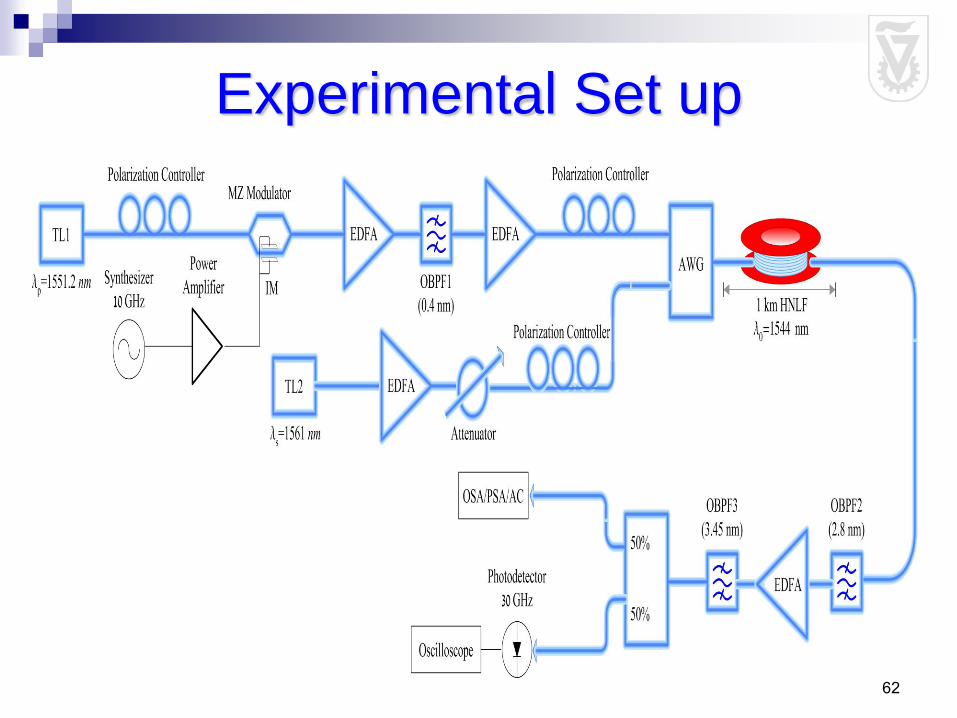
Experimental Set up
63
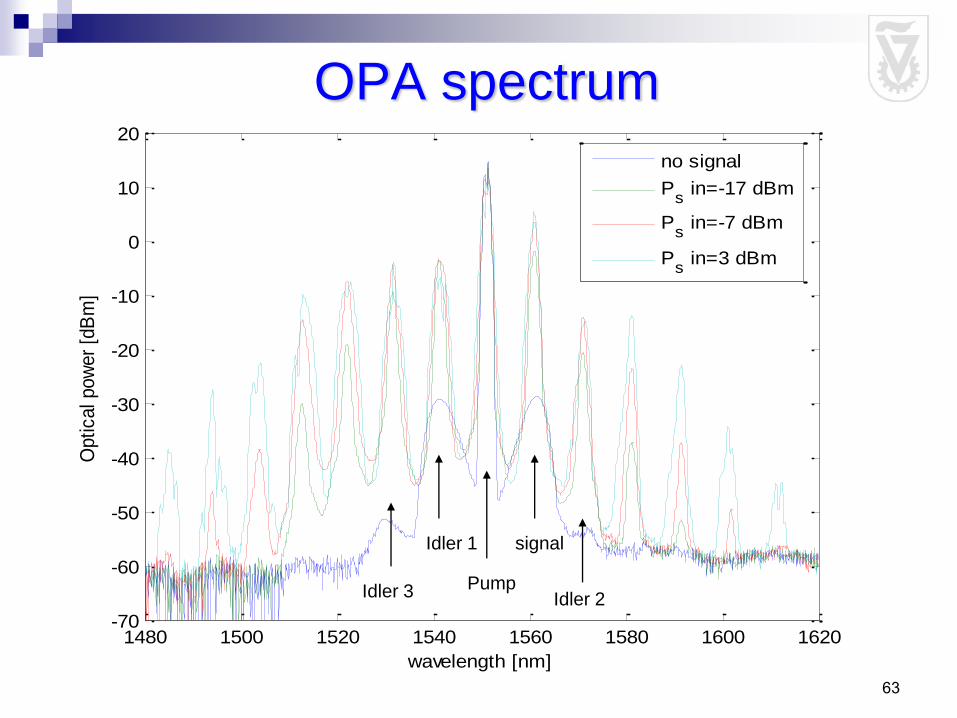
OPA spectrum
1480 1500 1520 1540 1560 1580 1600 1620-70
-60
-50
-40
-30
-20
-10
0
10
20
wavelength [nm]
Optical pow
er
[dB
m]
no signal
Ps in=-17 dBm
Ps in=-7 dBm
Ps in=3 dBm
signal Idler 1
Idler 2 Idler 3 Pump

64
Channel pulse sources at 10 GHz
Δ λ= 0.98 nm 1558 1560 1562 1564
-60
-40
-20
0
Optical pow
er
[dB
m]
1538 1540 1542 1544 1546
-60
-40
-20
0
Δ λ= 0.9 nm
1567 1569 1571 1573 1575 -60
-40
-20
0
Δλ=0.9 nm
1529 1531 1533 1535
-50
-30
-10
10
Wavelength [nm]
Δλ=0.9 nm
Sig
nal
λs=
15
61.n
m
Idle
r 1
λid
1=
154
2 n
m
Idle
r2
λid
2=
157
1 n
m
Idle
r 3
λid
3=
153
1.5
nm
ΔT=6ps
Δf ΔT=0.72
ΔT=5.6ps
Δf ΔT=0.64
ΔT=5.8ps
Δf ΔT=0.63
ΔT=6ps
Δf ΔT=0.69
65
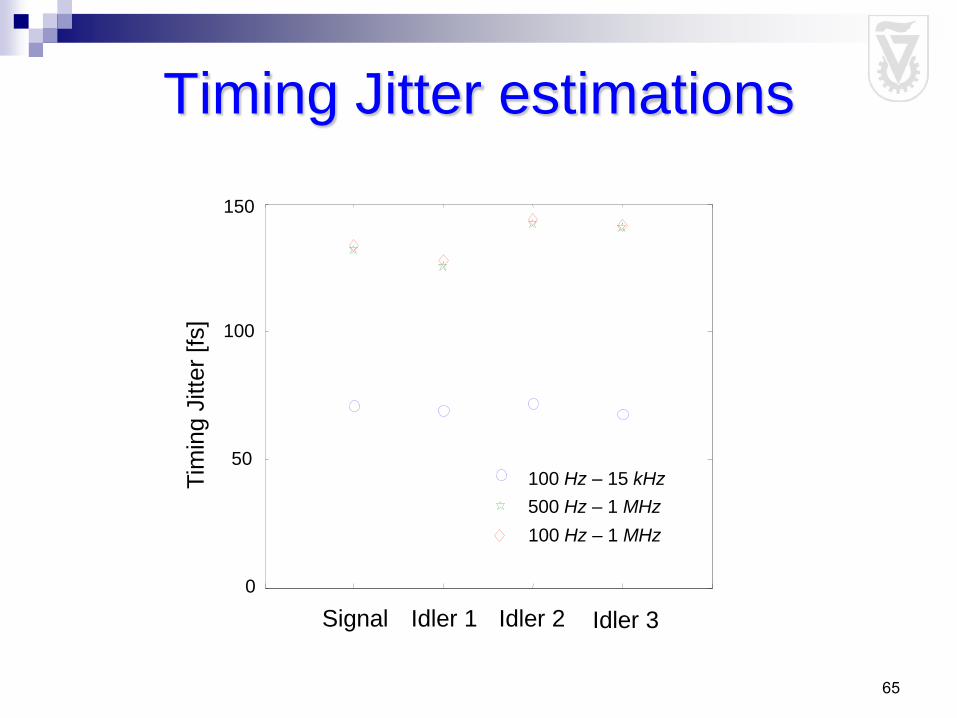
Timing Jitter estimations
0
50
100
150
100 Hz – 15 kHz
500 Hz – 1 MHz
100 Hz – 1 MHz
Tim
ing J
itte
r [f
s]
Signal Idler 1 Idler 2 Idler 3
66
Conclusion Various aspects of Raman and parametric mediated amplification
and all optical processing have been investigated.
Beside its use for Raman amplification, SRS can be used in absorption regime as inter band wavelength converter with reshaping capabilities.
Tunable all optical delay and advancement can be produced via narrow band gain spectra produced through Raman assisted optical parametric amplification
Parametric effects offer quantitative and qualitative methods for high bit rate and low jitter pulse sources.
All these all optical devices provide key tools toward the development of the next generation high bit rate optical fiber systems