Phased Array Radar Innovative Sensing Experiment … Array Radar Innovative Sensing Experiment...
17
Phased Array Radar Innovative Sensing Experiment (PARISE) A Guide for Forecasters Pam Heinselman and Sebastian Torres National Severe Storms Lab Radar Research & Development Division Adam Smith University of Oklahoma School of Meteorology ©Daphne LaDue © Mark Benner © James Murnan
Transcript of Phased Array Radar Innovative Sensing Experiment … Array Radar Innovative Sensing Experiment...

Phased Array Radar Innovative Sensing Experiment (PARISE) A Guide for Forecasters
Pam Heinselman and Sebastian Torres National Severe Storms Lab
Radar Research & Development Division
Adam Smith University of Oklahoma School of Meteorology
©Daphne LaDue
© Mark Benner © James Murnan

1. Introduction
The year 2008 marked the 20 th anniversary of the final design for the Weather Surveillance Radar1988 Doppler (WSR88D). This design milestone was preceded by a ~30year effort focused on the research and development of Doppler weather radars (Whiton et al. 1998). Continuous improvements to the WSR88D system hardware and products (Crum et al. 1998; Serafin and Wilson 2000) have resulted in significant service improvements, including increased mean warning lead time for tornadoes from 6 to 13 minutes, and reduced tornadorelated injuries (40%) and fatalities (45%; Simmons and Sutter 2005). However, the approach of this system toward its 20year design life cycle (Zrnić et al. 2007), advances in radar technology since the early 1980s, and the lead time involved in the research, development, acquisition, and deployment of new systems have motivated the consideration of a replacement system or family of systems (National Academies 2002, 2008).
As a leader in the development of new weather surveillance capabilities, the National Severe Storms Laboratory (NSSL), and its partners, has acquired and fielded an Sband Phased Array Radar (PAR), located on the north campus of the University of Oklahoma. This facility is known as the National Weather Radar Testbed (NWRT). This radar system is unique in that it provides targeted, hightemporal resolution, electronic scanning of storms within a 90° azimuthal sector. The PAR’s electronic scanning supports focused sampling of weather echoes without rotating the antenna. A detailed description of this and other PAR capabilities is given in section 2.
Since spring 2007, the NSSL has invited National Weather Service (NWS) forecasters to participate in experiments designed to demonstrate and provide user feedback on PAR weather surveillance capabilities (Heinselman 2008). The evaluations of PAR data given by previous participants have positively impacted PAR research and development, and we look forward to continuing this successful process during the 2009 Phased Array Radar Innovative Sensing Experiment (PARISE). To stay informed about this experiment and other activities related to the PAR, check the PARISE web site: http://www.nssl.noaa.gov/projects/pardemo.
During PARISE, you are invited to evaluate the operational utility of PAR technology during realtime operational warning situations as well as through playback of archived cases. The two key objectives of PARISE are to demonstrate and obtain your feedback on: 1) basic adaptive electronic scanning of weather echoes and 2) stormtype scanning strategies for surveillance of storm initiation and severe storms. In an ideal week, you will obtain training on PAR and gain handson experience with ADAPTS (Adaptive DSP Algorithm for PAR Timely Scans), prior to realtime operations. To help prepare you for these experiences, this document gives an overview of current PAR characteristics and capabilities, ADAPTS, the stormtype scanning strategies that will be run during operations, and examples of the types of feedback that we want from you.
2. PAR Characteristics and Capabilities
The NWRT PAR is an electronically steered, Sband radar (for a detailed description, see Zrnić et al. 2007) that was once mounted on a Navy ship. Its SPY1A antenna forms a beam electronically by controlling the phase of 4,352 transmit/receive elements. The steering of the beam is also accomplished electronically by fixing the beam in a set direction while data is collected along a radial, and then instantly switching the beam to another position.

Because the NWRT PAR was originally developed to track military missiles and airplanes, rather than to detect weather echoes, the radar system transmits vertically polarized electromagnetic waves (Fig. 1). Since a raindrop becomes flatter with increasing size, the magnitude of reflectivity returns may be less than those produced using a horizontally polarized beam.
A novel characteristic of PARs is variation of the beam width in azimuth (Fig 2). For the NWRT PAR, in the direction perpendicular
A novel characteristic of phased array radars is variation of the beam width in azimuth (Fig. 2). For the NWRT PAR, in the direction perpendicular to the antenna face, i.e., boresite, the beam width is 1.5°, which is similar to the effective beam width of the WSR88D without azimuthal oversampling (superresolution). Between boresite and a 45° angle from boresite, the beam width increases to 2.1°. During data collection, overlapped azimuthal sampling is used to provide finer resolution of the increasingly degraded data toward the edges of the sector scan. In an operational system, the beam width specifications would match or exceed that of the WSR88D.
Currently, the NWRT PAR is a singlefaced phased array system which can scan a 90° sector while stationary. As a result, the PAR can collect data with a VCP 12 scanning strategy, for example, within 58 s rather than 258 s (90° sector vs 360° sector, respectively). The reduction in time required for
1.5°
2.1° 2.1°
Fig. 1. Illustration of a vertically polarized electromagnetic wave.
Figure 2. Illustration of variations in beam width with respect to azimuth. Notice that the beam width is most narrow (1.5°) perpendicular to the array and widens to 2.1° when the beam is at an angle of ±45° to the array.

volumetric updates produces more realistic evolution of storm structures (Heinselman et al. 2008) and eliminates smearing of the beam due to rotation of the antenna during data collection. An operational PAR configuration, however, would have 4 independent faces capable of scanning a complete 360° sweep. In essence, a 4faced PAR would be like having 4 radars in one location, each scanning its own 90° sector. Because the NWRT PAR has only one face, it is mounted on a pedestal to facilitate data collection within the 90° sector of greatest meteorological interest.
Owing to its different antenna design, the NWRT PAR has some unique capabilities compared to the WSR88D. Most importantly, electronic steering of the beam supports targeted scanning of weather echoes. This spring, targeted scanning of storms will be accomplished using new adaptive scanning software developed by NSSL, called ADAPTS. The purpose of this software is to concentrate data collection on areas with significant weather echoes, in order to provide the user with more timely, needs driven data. As described in the next section, the key radar need afforded by ADAPTS is higher temporal resolution; an important radar capability reported in several recent studies (OFCM 2006; Steadham 2008; Newman et al. 2008).
3. ADAPTS: Adaptive Data Signal Processing Algorithm for PAR Timely Scans
ADAPTS is a proofofconcept implementation of adaptive scanning for the NWRT. As such, the algorithm is rather basic and limited to a certain type of scanning strategies. Still, preliminary evaluations of ADAPTS have shown that the performance improvement with adaptive scanning is quite significant compared to traditional scanning strategies. ADAPTS works by “turning on” or “turning off” individual beam positions within a scanning strategy based on three criteria. If one or more criteria are met, the beam position is declared active. Otherwise, the beam position is declared inactive. Active beam position settings are applied and become valid on the next execution of a given scanning strategy. Additionally, ADAPTS periodically completes a complete volumetric surveillance scan, which is used to redetermine where weather echoes are located. A userdefined parameter controls the time between full scans (by default this is set at 5 min). Following a surveillance scan, data collection continues only on the active beam positions.
3a. Determination of active beam positions
A beam position is said to be active if one or more of the following conditions are met:
1. The elevation angle is low, 2. A neighboring beam position is on, or 3. Reflectivities on gates along the beam meet continuity, coverage, and significance conditions.
The first criterion is used to ensure data collection at all beam positions for the lowest elevation angles. This is important from a meteorological point of view to constantly monitor lowlevel developments. A userdefined elevation threshold (2.5 deg by default) controls the lowest elevation angle where ADAPTS may begin to inactivate beam positions. However, note that due to the second criterion, there will always be an entire tilt above the specified threshold where ADAPTS will activate all beam positions.

The second criterion uses “neighboring” beam positions to expand the data collection footprint to allow for continuous adaptation in response to storm advection, growth, or decay. Nevertheless, new developments at midlevels may not be immediately sensed and therefore may not be timely added to the list of active beam positions. Neighboring beam positions are defined as those immediately above and below in elevation and two on either side in azimuth (i.e., there is a total of 6 neighbors for each beam position, unless the scanning domain boundaries are approached).
The third criterion uses continuity, coverage, and significance conditions to make a quantitative determination of the amount of significant weather returns at each beam position. In this context, a beam position is active if it contains:
1. a certain number of consecutive range gates (by default 4) with reflectivities exceeding a threshold (by default 10 dBZ), and
2. a total areal coverage (by default 1 km 2 ) with reflectivities exceeding the same threshold.
3b. Impact on scanning strategies
Being in its infancy, ADAPTS only works with scanning strategies that have a certain structure. That is, the ADAPTS assumes that:
• There’s only one scanning strategy that repeats continuously, • The scanning strategy runs in PPI mode, • All tilts in the scanning strategy have beam positions at the same azimuths, • Tilts are ordered in ascending elevation order, • The azimuthal sector size is between 1 and 90 deg, • The maximum azimuthal resolution is 0.5 deg (the max. number of beam positions in an
elevation is 180).
3c. Monitoring ADAPTS performance
Users at the Radar Control Interface (RCI) can monitor the performance of the ADAPTS algorithm by looking at a graphical display of active beam positions (see Fig. 1). Beam positions are colorcoded as follows: white beam positions are inactive, green and yellow beam positions are active. Green beam positions meet the third detection criterion, whereas yellow beam positions correspond to the “neighbor” footprint extension. The display updates every second and highlights in red the “current” beam position.
For more information on ADAPTS, please contact Sebastian Torres via email at: [email protected].

Fig. 3. Screen capture of the RCI graphical display of active beam positions with ADAPTS.
4. Stormtype Scanning Strategies
An important objective of PARISE is the development and testing of scanning strategies designed to provide enhanced sampling of storm initiation and processes key to the development of hazardous weather. This objective is a work in progress, which this spring includes scanning strategies created to sample thunderstorms, supercells, and hail storms. An overview of each scanning strategy follows.
4a. Scanning strategy for thunderstorms
This scanning strategy is designed to sampling convection initiation and nonsevere thunderstorms with rapid (~1.3 min), volumetric updates with two rangebased vertical sampling options (i.e., near and far). In the near scan, 14 elevation angles are spaced to provide improved sampling of mid–upper levels of storms located within 70 km of the PAR (Fig. 4a). In the far scan, the 14 elevation angles are spaced to provide sampling of storms located 70 km or farther from the PAR (Fig. 4b). Like superresolution sampling (Brown et al. 2005) implemented on the NEXRAD network, azimuthal sampling at 50% of the beam width across each 90° sector. Because the beam width varies across the sector, so does the width of the oversampling. According to Brown et al. (2005), these finer resolution azimuthal measurements provide the ability to detect stronger reflectivity and Doppler velocity signatures at greater ranges than measurements without azimuthal oversampling.
4b. Scanning strategy for supercells
The supercell scanning strategies are designed to provide highresolution azimuthal and vertical sampling of low and midaltitude circulations, with high accuracy. Like the thunderstorm scanning strategies, data are sampled at 50% of the beam width across the 90° sector (109 radials). The primary

Fig. 4. a) Near and b) far thunderstorm scanning strategies. Elevation angles are in degrees.
a) Near thunderstorm scanning strategy
b) Far thunderstorm scanning strategy
0.5 1.1
1.7
2.4
3.2
4.1
5.1
6.2 7.4 8.7 10. 11. 13. 15.
0.5
1.5
2.6
3.8
8.7
5.2
6.8 11. 13. 17. 21. 26. 32. 38.
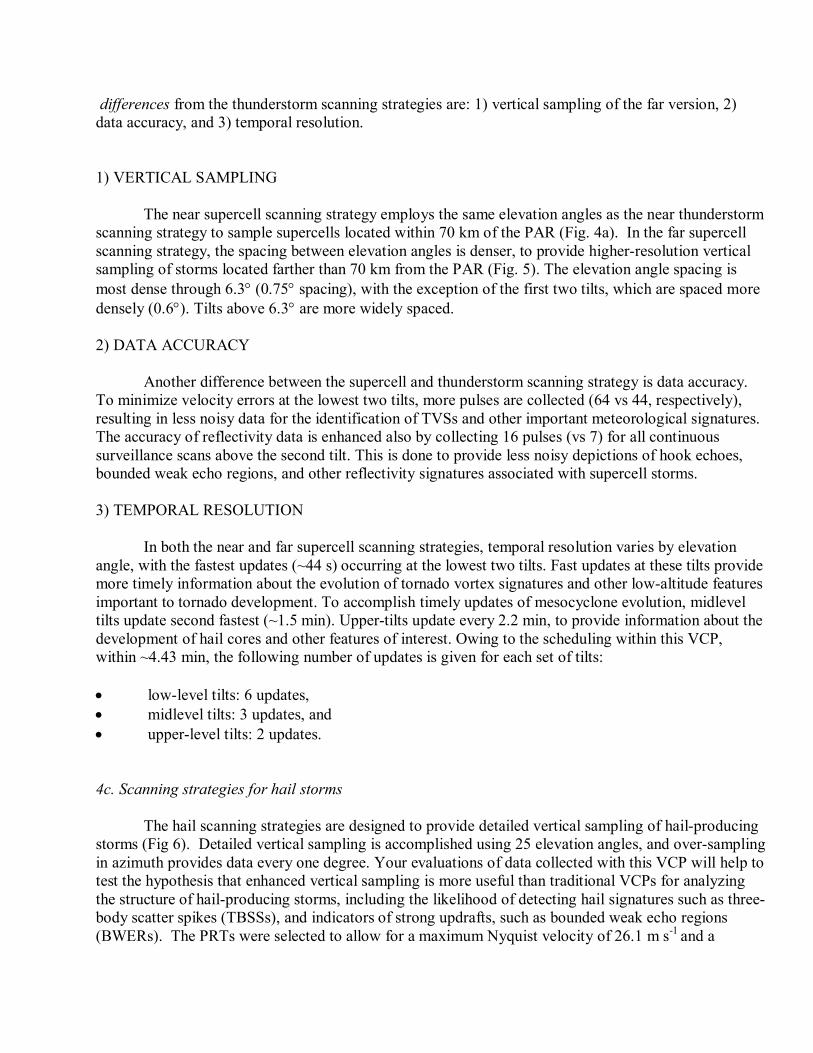
differences from the thunderstorm scanning strategies are: 1) vertical sampling of the far version, 2) data accuracy, and 3) temporal resolution.
1) VERTICAL SAMPLING
The near supercell scanning strategy employs the same elevation angles as the near thunderstorm scanning strategy to sample supercells located within 70 km of the PAR (Fig. 4a). In the far supercell scanning strategy, the spacing between elevation angles is denser, to provide higherresolution vertical sampling of storms located farther than 70 km from the PAR (Fig. 5). The elevation angle spacing is most dense through 6.3° (0.75° spacing), with the exception of the first two tilts, which are spaced more densely (0.6°). Tilts above 6.3° are more widely spaced.
2) DATA ACCURACY
Another difference between the supercell and thunderstorm scanning strategy is data accuracy. To minimize velocity errors at the lowest two tilts, more pulses are collected (64 vs 44, respectively), resulting in less noisy data for the identification of TVSs and other important meteorological signatures. The accuracy of reflectivity data is enhanced also by collecting 16 pulses (vs 7) for all continuous surveillance scans above the second tilt. This is done to provide less noisy depictions of hook echoes, bounded weak echo regions, and other reflectivity signatures associated with supercell storms.
3) TEMPORAL RESOLUTION
In both the near and far supercell scanning strategies, temporal resolution varies by elevation angle, with the fastest updates (~44 s) occurring at the lowest two tilts. Fast updates at these tilts provide more timely information about the evolution of tornado vortex signatures and other lowaltitude features important to tornado development. To accomplish timely updates of mesocyclone evolution, midlevel tilts update second fastest (~1.5 min). Uppertilts update every 2.2 min, to provide information about the development of hail cores and other features of interest. Owing to the scheduling within this VCP, within ~4.43 min, the following number of updates is given for each set of tilts:
• lowlevel tilts: 6 updates, • midlevel tilts: 3 updates, and • upperlevel tilts: 2 updates.
4c. Scanning strategies for hail storms
The hail scanning strategies are designed to provide detailed vertical sampling of hailproducing storms (Fig 6). Detailed vertical sampling is accomplished using 25 elevation angles, and oversampling in azimuth provides data every one degree. Your evaluations of data collected with this VCP will help to test the hypothesis that enhanced vertical sampling is more useful than traditional VCPs for analyzing the structure of hailproducing storms, including the likelihood of detecting hail signatures such as three body scatter spikes (TBSSs), and indicators of strong updrafts, such as bounded weak echo regions (BWERs). The PRTs were selected to allow for a maximum Nyquist velocity of 26.1 m s 1 and a

Fig. 5. Far supercell scanning strategy. Elevation angles are in degrees.
maximum range of 135 km. To mitigate secondtrip echoes, Continuous Surveillance (CS) and Continuous Doppler (CD) PRTs (split cuts) are used at all elevations below 7.0°.
The hail strategies are not designed for scanning supercells or any storms where rotation may be occurring. For these situations, it is necessary to use the supercell strategy, which is designed to obtain rapid updates especially at the lowest elevations where rotation may occur. Also, the hail strategies use a large number of elevations, so volume update rates will be slower than other scanning methods. If rapid updates (~60 s) are required, another scanning strategy may be more useful.
When sampling hail storms, two options are provided: to either scan targets near the radar (r < 80 km) or far from the radar (r > 80 km). There is also the possibility to choose between either a 90°or 60° azimuthal sector. Thus, there are a total of four possible hail strategies to choose from. The following provides more information on each individual scan type.
1) NEAR
As mentioned above, the near scan is primarily for sampling targets closer than 80 km from the PAR. Elevation tilts in this scan range from 0.5° to 28.5° (Fig 1a). At 80 km, the vertical beam spacing is 1 km or better, so high vertical detail is expected with this scan. Storms with tops up to 15 km can be sampled as close as 35 km from the radar, and tops up to 12 km may be sampled as close as 30 km from
0.5
1.1
1.8
2.6
3.3
4.1
5.6
6.3
4.8
8.0 10.0 12.5 15.6

Fig. 6. Beam paths for a) Spring 09 Hail Scan – Near (top) and b) Spring 09 Hail Scan –Far.
a)
b)

the radar. Due to the wide range of elevations, this scan is also wellsuited to cases where storms are occurring both near and far from the radar.
2) FAR
When targets are farther than 80 km from the radar, the “far” scan may be a better choice. Here, elevation tilts range from 0.5° to 16.10° (Fig. 2). The spacing of the tilts is designed to provide 1 km or better vertical beam spacing at a range of 150 km. Storm tops with a height of 15 km may be sampled at ranges of 60 km and beyond, while storm tops with a height of 12 km may be sampled at ranges of 45 km or beyond. It must be noted that the lowest tilts are very tightly spaced, so for ranges closer than 50 km, the vertical spacing becomes extremely small. Since the details of a storm may be difficult to analyze in this region, it may be best to avoid using the “far” scan when scanning targets very close to he radar.
3) 90° SECTOR
The 90° sector is best when storms are widespread. Thus, the 90° sector is preferred in cases involving a squall line, MCS, or any other case where an important feature may be missed by a smaller sector. Also, as targets move close to the radar, it will often be necessary to use this sector size, since a smaller sector might not to fully scan the storm in the horizontal. The 90° setting will require 116 seconds to complete one volume scan. Thus, in cases of rapidly evolving storms, it may not always be ideal to use this setting. Thus, it is necessary to closely monitor storm conditions, and switch to the 60° sector or another scanning strategy if needed.
4) 60° SECTOR
A 60° sector is ideal when the user wishes to scan an individual storm, or when storms are confined to a relatively small area. This sector size is also useful for cases when higher vertical resolution is desired, but a faster update rate is also required. Since fewer azimuths need to be sampled, a 60° sector may be obtained in approximately 77s, or 33% faster than the 90° sector. However, the antenna face will need to be moved more often when tracking storms not moving directly toward or away from the radar. To limit the loss of data, avoid rotating the antenna until absolutely necessary. If storms are moving too rapidly, consider using the 90° sector.
For more information on the hail scanning strategies, please contact Adam Smith via email at: adam.j.smith[email protected].
5. Forecaster Activities during PARISE
During the PARISE, you will be asked to evaluate the operational utility of ADAPTS and the stormtype scanning strategies described above. Beforehand, you will be given training on the PAR, ADAPTS, and the stormtype scanning strategies. You will also be given basic training on how to run the Wearning Decision Support System – Integrated Information display tool. Your evaluations will take place under two situations: 1) playback of previous weather events, and 2) during realtime weather events. The playback events will help you gain experience on how the PAR’s new adaptive scanning algorithm, ADAPTS, impacts the spatial and temporal sampling of weather echoes for a variety of

events. They will also give you the opportunity to give us feedback on the strengths and limitations of PAR data for storm interrogation and warning decisionmaking. The realtime events provide the opportunity to evaluate both ADAPTS and the stormtype scanning strategies you choose to run. Although you will choose the scanning strategy that best matches the weather situation, you will not be responsible for running the radar. During realtime events, a radar operator will position the PAR antenna on your 90° sector of interest, run the scanning strategy(s) you choose, and take care of any other radar issues that arise. For those of you unfamiliar with the WDSSII radar data display tool, the radar operator will also be available to assist you with any questions or issues about the system that arise. This person will also answer any questions you have about ADAPTS, the scanning strategies, or the PAR.
The questionnaire you will fill out following playback or realtime operations is in Appendix A.
Acknowledgments: There are many people behind the scenes who make PARISE possible. They include the NHWT directors, members of SWAT, and the radar engineers and software developers of the Radar Researchand Development Division. In particular, we’d like to thank Rodger Brown for his help with the development of the thunderstorm scanning strategy and Vicki Farmer for her assistance with the PARISE web page.
References
Brown, R.A., B.A. Flickinger, E. Forren, D.M. Schultz, D. Sirmans, P.L. Spencer, V.T. Wood, and C.L. Ziegler, 2005: Improved Detection of Severe Storms Using Experimental FineResolution WSR 88D Measurements. Wea. Forecasting, 20, 3–14.
Crum, T. D., R. E. Saffle, and J. W. Wilson, 1998: An update on the NEXRAD program and future WSR88D support to operations. Wea. Forecasting, 13, 253–262.
Heinselman, P. L., D. L. Priegnitz, K. L. Manross, T. M. Smith, and R. W. Adams, 2008: Rapid sampling of severe storms by the National Weather Radar Testbed Phased Array Radar. Wea. Forecasting, 23, 808–824.
_____, 2008: Spring 2008 Realtime Phased Array Radar Experiment. Preprints, 24th Conference on Severe Local Storms, Savannah, GA, Amer. Meteor. Soc., P13.2.
National Academies, 2002: Weather Radar Technology Beyond NEXRAD. Report prepared by the National Research Council, National Academy of Science, National Academy Press, 96 pp.
_____, 2008: Evaluation of the multifunction phased array radar planning process. Report prepared by the National Research Council, National Academy of Science, National Academy Press, 79 pp.
Newman, J., D. LaDue, and P. L. Heinselman, 2008: Identifying critical strengths and limitations of current radar systems. Preprints, 24th Conference on Severe Local Storms, Savannah, GA, Amer. Meteor. Soc., 7B.5.

OFCM 2006: Federal research and development needs and priorities for phased array radar, FMCR25 2006, Interdepartmental Committee for Meteorological Services and Supporting Research, Committee for Cooperative Research Joint Action Group for Phased Array Radar Project, 62 pp.
Serafin, R. J., and J. W. Wilson, 2000: Operational weather radar in the United States: Progress and opportunity. Bull. Amer. Meteor. Soc., 81, 501–518.
Simmons, K. M., and D. Sutter, 2008: Tornado warnings, lead times, and tornado casualties: An empirical Investigation. Wea. Forecasting, 23, 246–258.
Steadham, R., 2008: 2008 National Weather Service Field Study. Part 1: Volume verage Pattern Usage. Radar Operations Center, Norman, OK, 28 pp. [Available from WSR88D Radar Operations Center, 1200 Westheimer Dr., Norman, OK 73069]
Whiton, R. C., P. L. Smith, S. G. Bigler, K. E. Wilk, and A. C. Harbuck, 1998: History of operational use of weather radar by U.S. Weather Services. Part II: Development of operational Doppler weather radars. Wea. Forecasting, 13, 244–252.
Zrnić, D. S., J. F. Kimpel, D. E. Forsyth, A. Shapiro, G. Crain, R. Ferek, J. Heimmer, W.Benner, T.J. McNellis, R.J. Vogt, 2007: Agile beam phased array radar for weather observations. Bull. Amer. Meteor. Soc., 88, 1753–1766.

Appendix A
Phased Array Radar Innovative Sensing Experiment 2009 Questionnaire
Please complete questions 1–9 on the following pages for each playback case or realtime session.
Name: ____________________________ Organization: ________________________ Title: _____________________________ Years of Forecasting Experience: ___________ Date & Time Period of Event: ___________________________________________
1. For storms in which you analyzed any of the following features, please respond to the questions in the table. Note that TDWR data will only be available for realtime events in central Oklahoma.
Feature What were the strengths or weaknesses of PAR data
Did the PAR help to
identify this feature better than KTLX?
Did the PAR help to
identify this feature better than TDWR?
Supercell
RFD
WER/BWER
Shear
TVS
Hail and Precipitation

Feature What were the strengths or weaknesses of PAR data
Did the PAR help to
identify this feature better than KTLX?
Did the PAR help to
identify this feature better than TDWR?
Squall line
Bow Echo
Pulse Storm or Microburst
Updrafts/Downdrafts
Divergence/Convergence
2. Please check the scanning strategies used during this event and comment on their utility.
¨ Near Thunderstorm ¨ Far Thunderstorm ¨ Near Supercell ¨ Far Supercell ¨ Near Hail storm ¨ Far Hail storm
Comments on utility:
3. We want to develop scanning strategies that best suit your needs. For today’s event, what scanning characteristics would you have like to have seen that were not available?

4. If ADAPTS was run during today’s evaluation, please answer the following questions. Otherwise, skip to question X.
a. How did ADAPTS impact the spatial coverage and temporal resolution of the PAR data? Explain.
b. To what degree do you think that ADAPTS followed the evolution, i.e., growth/decay/advection, properly?
Don’t know Not at all Somewhat Mostly Completely
c. To what degree did faster update rates come at the expense of loss of useful information?
Don’t know Not at all Somewhat Mostly Completely
d. How did the performance of ADAPTS affect your capability to detect and analyze storm features?
e. What suggestions do you have to improve the operational utility of ADAPTS?
f. Are there situations not experienced here during which ADAPTS might be useful to operations?
g. Are there situations not experienced here during which ADAPTS might not be useful to operations?
h. What was your overall impression on the usefulness of ADAPTS?

5. If you issued a warning during operations, how did PAR data impact your warning decision making?
6. What challenges arose during your analysis of PAR data? How might these challenges be addressed?
7. What kinds of information would you like to see from weather radar that you don’t have now? How would that information make a difference?
8. What was your overall impression on the usefulness of phased array radar technology in the forecasting of severe weather phenomena (with the understanding that the NWRT is a research radar with limited capability relative to a complete, higher resolution phased array radar)?