Phase Transformations and Microstructural … Transformations and Microstructural Evolution of...
14
Phase Transformations and Microstructural Evolution of Mo-Bearing Stainless Steels T.D. ANDERSON, J.N. DUPONT, M.J. PERRICONE, and A.R. MARDER The good corrosion resistance of superaustenitic stainless steel (SASS) alloys has been shown to be a direct consequence of high concentrations of Mo, which can have a significant effect on the microstructural development of welds in these alloys. In this research, the microstructural development of welds in the Fe-Ni-Cr-Mo system was analyzed over a wide variety of Cr/Ni ratios and Mo contents. The system was first simulated by construction of multicomponent phase diagrams using the CALPHAD technique. Data from vertical sections of these diagrams are presented over a wide compositional range to produce diagrams that can be used as a guide to understand the influence of composition on microstructural development. A large number of experimental alloys were then prepared via arc-button melting for comparison with the dia- grams. Each alloy was characterized using various microscopy techniques. The expected d-ferrite and c-austenite phases were accompanied by martensite at low Cr/Ni ratios and by r phase at high Mo contents. A total of 20 possible phase transformation sequences are proposed, resulting in various amounts and morphologies of the c, d, r, and martensite phases. The results were used to construct a map of expected phase transformation sequence and resultant microstructure as a function of composition. The results of this work provide a working guideline for future base metal and filler metal development of this class of materials. DOI: 10.1007/s11661-006-9010-8 Ó The Minerals, Metals & Materials Society and ASM International 2007 I. INTRODUCTION SUPERAUSTENITIC stainless steel (SASS) alloys with high Mo concentrations are used in a wide variety of applications that require good toughness and corro- sion resistance. Unfortunately, the corrosion resistance of welds is never as good as the corresponding wrought base metal. [1] The microstructural development and resultant corrosion resistance of austenitic alloys in this compositional regime has been shown to be strongly controlled by the microsegregation of Mo to the intercellular regions. [2] The ensuing depletion of Mo in the cell core results in preferential corrosive attack. [3] Alloys that solidify as primary austenite are also susceptible to solidification cracking caused by the accumulation of tramp elements (such as P and S) and concomitant formation of low melting point liquid films in the intercellular regions. [4] Previous studies have also shown that the microsegregation of Mo will proceed over a wide range of welding conditions and composi- tions. [2,5,6] Although high Mo nickel-base filler metals can be used to help mitigate this problem, microsegre- gation is not eliminated, and careful control of welding variables must be exercised for close control over weld metal composition. In contrast, it is well known that stainless steels that solidify as ferrite exhibit significant backdiffusion that can minimize or eliminate residual microsegregation, and have good resistance to solidifi- cation cracking due to the high solubility of tramp elements. [4] Thus, identifying high Mo SASS alloys that solidify first as ferrite and subsequently transform to austenite via a solid-state reaction may help eliminate problems associated with solidification cracking and microsegregation-induced corrosion. The variety of stainless steel microstructures was previously outlined by Elmer et al. [7,8] for the Fe-Ni-Cr ternary system. Twelve different morphologies were identified as a function of composition (Cr/Ni ratio) and cooling rate. In this current research, 20 different microstructural development sequences are proposed for the case of Fe-Ni-Cr-Mo stainless steels under cooling rate conditions typical of casting and welding. The compositional variables have been extended to include variations in Fe and Mo content in addition to Cr/Ni ratio. The effect of cooling rate will be discussed in a future publication. [9] A wide range of microstructures are possible for near- eutectic Mo-bearing stainless steels, owing to a variety of solidification modes and possible solid-state phase transformations that occur from the ferrite to the austenite phase. Multicomponent phase diagrams pro- vide an efficient way for understanding microstructure formation and serve as a useful tool for alloy develop- ment. The presentation of multicomponent phase dia- grams is commonly accomplished through the use of two different perspectives: the liquidus projection and the pseudo-binary vertical isopleth. The liquidus pro- jection is capable of displaying the primary solidification mode and terminal solidification reactions over a wide T.D. ANDERSON, Graduate Research Assistant, J.N. DUPONT, Associate Professor, and A.R. MARDER, Professor, are with the Department of Materials Science and Engineering, Lehigh University, Bethlehem, PA 18015, USA. Contact e-mail: tda2@ lehigh.edu, M.J. PERRICONE, Senior Member of Technical Staff, is with the Joining and Coatings Department, Sandia National Laboratories, Albuquerque, NM, USA. Manuscript submitted: July 21, 2006. 86—VOLUME 38A, JANUARY 2007 U.S. GOVERNMENT WORK NOT PROTECTED BY U.S. COPYRIGHT METALLURGICAL AND MATERIALS TRANSACTIONS A
-
Upload
nguyenhuong -
Category
Documents
-
view
216 -
download
0
Transcript of Phase Transformations and Microstructural … Transformations and Microstructural Evolution of...
Phase Transformations and Microstructural Evolutionof Mo-Bearing Stainless Steels
T.D. ANDERSON, J.N. DUPONT, M.J. PERRICONE, and A.R. MARDER
The good corrosion resistance of superaustenitic stainless steel (SASS) alloys has been shown tobe a direct consequence of high concentrations of Mo, which can have a significant effect on themicrostructural development of welds in these alloys. In this research, the microstructuraldevelopment of welds in the Fe-Ni-Cr-Mo system was analyzed over a wide variety of Cr/Niratios and Mo contents. The system was first simulated by construction of multicomponentphase diagrams using the CALPHAD technique. Data from vertical sections of these diagramsare presented over a wide compositional range to produce diagrams that can be used as a guideto understand the influence of composition on microstructural development. A large number ofexperimental alloys were then prepared via arc-button melting for comparison with the dia-grams. Each alloy was characterized using various microscopy techniques. The expectedd-ferrite and c-austenite phases were accompanied by martensite at low Cr/Ni ratios and by rphase at high Mo contents. A total of 20 possible phase transformation sequences are proposed,resulting in various amounts and morphologies of the c, d, r, and martensite phases. The resultswere used to construct a map of expected phase transformation sequence and resultantmicrostructure as a function of composition. The results of this work provide a workingguideline for future base metal and filler metal development of this class of materials.
DOI: 10.1007/s11661-006-9010-8� The Minerals, Metals & Materials Society and ASM International 2007
I. INTRODUCTION
SUPERAUSTENITIC stainless steel (SASS) alloyswith high Mo concentrations are used in a wide varietyof applications that require good toughness and corro-sion resistance. Unfortunately, the corrosion resistanceof welds is never as good as the corresponding wroughtbase metal.[1] The microstructural development andresultant corrosion resistance of austenitic alloys in thiscompositional regime has been shown to be stronglycontrolled by the microsegregation of Mo to theintercellular regions.[2] The ensuing depletion of Mo inthe cell core results in preferential corrosive attack.[3]
Alloys that solidify as primary austenite are alsosusceptible to solidification cracking caused by theaccumulation of tramp elements (such as P and S) andconcomitant formation of low melting point liquid filmsin the intercellular regions.[4] Previous studies have alsoshown that the microsegregation of Mo will proceedover a wide range of welding conditions and composi-tions.[2,5,6] Although high Mo nickel-base filler metalscan be used to help mitigate this problem, microsegre-gation is not eliminated, and careful control of weldingvariables must be exercised for close control over weldmetal composition. In contrast, it is well known thatstainless steels that solidify as ferrite exhibit significant
backdiffusion that can minimize or eliminate residualmicrosegregation, and have good resistance to solidifi-cation cracking due to the high solubility of trampelements.[4] Thus, identifying high Mo SASS alloys thatsolidify first as ferrite and subsequently transform toaustenite via a solid-state reaction may help eliminateproblems associated with solidification cracking andmicrosegregation-induced corrosion.The variety of stainless steel microstructures was
previously outlined by Elmer et al.[7,8] for the Fe-Ni-Crternary system. Twelve different morphologies wereidentified as a function of composition (Cr/Ni ratio) andcooling rate. In this current research, 20 differentmicrostructural development sequences are proposedfor the case of Fe-Ni-Cr-Mo stainless steels undercooling rate conditions typical of casting and welding.The compositional variables have been extended toinclude variations in Fe and Mo content in addition toCr/Ni ratio. The effect of cooling rate will be discussedin a future publication.[9]
A wide range of microstructures are possible for near-eutectic Mo-bearing stainless steels, owing to a varietyof solidification modes and possible solid-state phasetransformations that occur from the ferrite to theaustenite phase. Multicomponent phase diagrams pro-vide an efficient way for understanding microstructureformation and serve as a useful tool for alloy develop-ment. The presentation of multicomponent phase dia-grams is commonly accomplished through the use oftwo different perspectives: the liquidus projection andthe pseudo-binary vertical isopleth. The liquidus pro-jection is capable of displaying the primary solidificationmode and terminal solidification reactions over a wide
T.D. ANDERSON, Graduate Research Assistant, J.N. DUPONT,Associate Professor, and A.R. MARDER, Professor, are withthe Department of Materials Science and Engineering, LehighUniversity, Bethlehem, PA 18015, USA. Contact e-mail: [email protected], M.J. PERRICONE, Senior Member of Technical Staff,is with the Joining and Coatings Department, Sandia NationalLaboratories, Albuquerque, NM, USA.Manuscript submitted: July 21, 2006.
86—VOLUME 38A, JANUARY 2007 U.S. GOVERNMENT WORK
NOT PROTECTED BY U.S. COPYRIGHT METALLURGICAL AND MATERIALS TRANSACTIONS A

range of compositions, but is unable to describesubsequent solid-state phase transformations that mayfurther influence the final microstructure. The verticalisopleth, while able to describe post-solidification behav-ior, is limited by a slim range of alloy compositions. Forthe quaternary Fe-Ni-Cr-Mo system being studied in thisresearch project, an attempt was made to form acomposite-type diagram that would communicate themicrostructural development behavior of a greaternumber of alloys concurrently. Efforts were concentratedon combining the strengths of both diagrams in order tobound the regions of different solidification modes andsubsequent solid-state transformations. Thus, the objec-tives of this research were to develop diagrams for phaseprediction in the Fe-Ni-Cr-Mo system and to use thediagrams to locate compositions that can experience asolid-state transformation to austenite after primaryferrite solidification. A matrix of alloys was constructedto validate the diagrams and to observe the possiblemicrostructures in Mo-bearing stainless steels.
II. EXPERIMENTAL PROCEDURE
A large matrix of vertical isopleths was constructed ofthe Fe-Ni-Cr-Mo system using the CALPHAD softwareThermo-Calc[10] in conjunction with the Fe-Data Data-base.[11] The only solid phases included in the calcula-tions were ferrite and austenite, because these two phasesare the only primary solidification modes present in thealloy system within the composition range of interest.The r phase was included in later calculations in order toascertain the development behavior of this phase, butwas not included in the generation of phase stabilitydiagrams in the following discussion. Vertical isoplethswith constant Mo additions of 0, 2, 4, 6, 8, and 10 wt pctwere constructed for several Ni + Cr contents. Specifictemperature and composition coordinates of four specialpoints of interest were acquired, including the peak of theeutectic triangle, the c-side vertex of the eutectic triangle,the d-side vertex of the eutectic triangle, and themaximum solid solubility of Cr in the austenite phase.
Figure 1 illustrates the locations of these points ofinterest on a sample isopleth. Further isopleths wereassembled in order to ascertain these same locations atthe terminating edges of the phase diagram, whereneither Cr nor Ni is present. The completed phasestability diagrams were then created by plotting the fourpoints of interest over a wide range of Ni and Crconcentrations for a fixed Mo content. Figure 2 shows atypical example for a 6 wt pct Mo alloy. The temper-ature axis is normal to the plane of the diagram.Equivalent points were then connected by curves inorder to highlight several significant features of theoverall phase diagram. The upper martensite boundary
from the Schaeffler diagram[12] was also incorporatedonto the diagrams. The function of these diagrams willbe discussed in more detail in Section III.
Experimental verification of the diagrams was con-ducted by preparing 16 alloys across both sides of theeutectic line for each of the six Mo contents (96 totalalloys). The alloys were produced from virgin elements
using the arc button melting (ABM) method. Carefullyweighed portions of each constituent element were placedunder vacuum, which was then backfilled with inertargon to serve as a shielding gas. A manually controlledgas tungsten arc torch running at 300 A and 10 V and awater-cooled Cu hearth were used to produce buttonsthat were approximately 50 g. Table I shows the com-positions of the alloys as determined using inductively
Fig. 1—Vertical isopleth of the Fe-Cr-Ni-Mo system. The shadedzone demarcates compositions that will experience primary ferritesolidification in addition to entering the single-phase austenite regionof the phase diagram. The points labeled represent (a) the eutecticline, (b) the c vertex of the eutectic triangle, (c) the d vertex of theeutectic triangle, and (d) the maximum solubility of chromium in theaustenite phase.
Fig. 2—Phase stability diagram of the Fe-Cr-Ni-6Mo alloy system.The shaded region denotes the predicted zone of compositions thatwill experience FA solidification.
METALLURGICAL AND MATERIALS TRANSACTIONS A VOLUME 38A, JANUARY 2007—87

coupled plasma spectrometry. An average deviation of<0.5 wt pct existed for each of the target Ni, Cr, andMoalloying elements. In addition, trace amounts of Cu thatwere picked up from the hearth were found to be less than0.02 wt pct. Laser welds were also deposited on thesurface of several alloy buttons in order to observe themicrostructure of the heat-affected zone (HAZ) as an aidto interpreting the nature of the observed phase trans-formations. ANd-YAG laser was operated at 500W (370W measured at the surface) for travel speeds of 4.2, 21,and 42 mm/s.
Metallographic preparation and subsequent micro-structural analysis were used to reveal and identify theparticular solidification mode and transformation mech-
anisms experienced by each alloy. Standard polishingtechniques were followed by electrolytic etching in amixture of 60 pct concentrated HNO3 and 40 pct H2O atvoltages ranging from 2 to 3 V in 3-second intervals. Therelative locations and shape of the ferrite and austenitephases were used as indications of the solidification modeand morphological type in a manner previously de-scribed by Elmer.[7] A magnetic ferrite detector was usedto determine the presence of and specific weight percent-age of ferrite within each alloy. Precision was maintainedthrough the use of calibrated standards of known ferritecontent. Phase identification was accomplished byanalyzing backscattered electron diffraction patterns.Samples in the as-polished condition were examined in a
Table I. Nominal Compositions of Experimental Alloys, as Measured by Wet-Chemical Analysis
Target Fe Ni Cr Mo Target Fe Ni Cr Mo
0Mo-10Cr-10Ni 79.86 10.26 9.74 0 6Mo-4Cr-16Ni 73.57 16.2 4.02 5.980Mo-12Cr-8Ni 80.16 8.12 11.56 0 6Mo-8Cr-12Ni 73.88 12.02 8.01 5.840Mo-14Cr-6Ni 80.37 6.01 13.45 0 6Mo-10Cr-10Ni 73.6 10.21 10.64 5.270Mo-16Cr-4Ni 80.23 3.97 15.59 0 6Mo-14Cr-6Ni 74.41 5.95 13.59 5.720Mo-13Cr-12Ni 75.07 12.16 12.6 0 6Mo-9Cr-16Ni 68.73 16.33 9.18 5.580Mo-15Cr-10Ni 75.27 10.13 14.4 0 6Mo-11Cr-14Ni 68.66 14.57 11.2 5.290Mo-17Cr-8Ni 75.71 7.97 16.1 0 6Mo-13Cr-12Ni 68.06 12.23 13.53 5.870Mo-19Cr-6Ni 75.64 6.01 18.09 0.01 6Mo-15Cr-10Ni 69.01 10.31 14.83 5.480Mo-16Cr-14Ni 70.61 13.85 15.34 0.01 6Mo-12Cr-18Ni 63.37 18.64 12.2 5.480Mo-18Cr-12Ni 70.86 11.45 17.43 0.02 6Mo-14Cr-16Ni 63.55 16.4 14.37 5.360Mo-20Cr-10Ni 70.14 10.02 19.59 0.02 6Mo-16Cr-14Ni 62.25 14.37 17.29 5.750Mo-22Cr-8Ni 70.77 7.89 21.06 0.01 6Mo-18Cr-12Ni 62.93 12.31 18.97 5.440Mo-18Cr-17Ni 65.69 17.01 16.98 0.01 6Mo-16Cr-19Ni 58.52 19.31 16.08 5.740Mo-20Cr-15Ni 65.1 15.3 19.32 0.01 6Mo-18Cr-17Ni 57.39 17.57 19.26 5.410Mo-22Cr-13Ni 66 12.55 21.18 0.01 6Mo-20Cr-15Ni 58.77 15.18 19.7 5.950Mo-24Cr-11Ni 65.87 10.87 22.94 0.01 6Mo-22Cr-13Ni 57.05 13.41 23.17 5.942Mo-8Cr-12Ni 78.36 11.77 7.96 1.78 8Mo-2Cr-18Ni 71.31 18.34 1.96 8.292Mo-10Cr-10Ni 77.39 10.33 10.27 1.86 8Mo-6Cr-14Ni 72.11 13.72 5.75 8.272Mo-12Cr-8Ni 73.52 9.7 14.55 2.05 8Mo-8Cr-12Ni 71.94 11.99 7.91 7.992Mo-16Cr-4Ni 78.96 3.85 15.31 1.66 8Mo-12Cr-8Ni — — — —2Mo-11Cr-14Ni 72.78 14.16 11.1 1.79 8Mo-7Cr-18Ni 66.76 18.02 6.91 8.152Mo-13Cr-12Ni 73.35 11.96 12.71 1.78 8Mo-9Cr-16Ni 67.03 15.75 8.82 8.222Mo-15Cr-10Ni 73.54 10.04 14.8 1.4 8Mo-13Cr-12Ni 68.7 11.49 12.24 7.122Mo-17Cr-8Ni 73.11 7.88 17.06 1.71 8Mo-15Cr-10Ni 69.12 9.3 13.71 7.612Mo-14Cr-16Ni 69.45 15.49 13.19 1.57 8Mo-11Cr-19Ni 62.57 18.66 10.39 8.182Mo-16Cr-14Ni 68.24 13.76 15.58 2.19 8Mo-13Cr-17Ni 63.86 16.86 12.06 6.992Mo-18Cr-12Ni 66.31 12.6 18.55 2.22 8Mo-15Cr-15Ni 60.53 14.58 16.11 8.242Mo-20Cr-10Ni 66.91 10.26 20.92 1.6 8Mo-17Cr-13Ni 61.3 13.01 17.38 7.832Mo-18Cr-17Ni 62.14 17.3 17.86 2.39 8Mo-14Cr-21Ni 58.1 20.3 13.21 8.142Mo-20Cr-15Ni 62.17 15.02 20.33 2.12 8Mo-17Cr-18Ni 57.71 17.88 17.03 7.082Mo-22Cr-13Ni 62.44 12.65 22.6 1.97 8Mo-20Cr-15Ni 58.1 14.32 19.4 7.852Mo-24Cr-11Ni 63.75 10.85 23.3 1.78 8Mo-22Cr-13Ni 58.94 12.22 20.97 7.524Mo-6Cr-14Ni 75.73 14.59 6.18 3.37 10Mo-2Cr-18Ni 69.44 18.24 1.92 10.294Mo-8Cr-12Ni 76.77 11.81 7.92 3.36 10Mo-4Cr-16Ni 70.48 16.59 4.06 8.734Mo-12Cr-8Ni 77.33 7.95 11.64 2.9 10Mo-8Cr-12Ni 70.36 11.69 7.71 10.064Mo-14Cr-6Ni 76.61 6.06 13.85 3.28 10Mo-12Cr-8Ni 69.79 7.78 11.83 10.374Mo-9Cr-16Ni 71.31 15.99 9.00 3.55 10Mo-5Cr-20Ni 64.88 20.08 4.93 9.964Mo-11Cr-14Ni 71.08 14.21 11.06 3.46 10Mo-9Cr-16Ni 65.3 16.14 8.98 9.394Mo-13Cr-12Ni 72.58 11.99 12.55 2.68 10Mo-13Cr-12Ni 65.69 11.76 12.56 9.424Mo-17Cr-8Ni 72.99 7.8 15.83 3.13 10Mo-15Cr-10Ni 66.14 10.05 14.55 8.944Mo-13Cr-17Ni 67.28 16.82 12.43 3.27 10Mo-10Cr-20Ni 62.92 20.02 9.63 7.224Mo-15Cr-15Ni 67.9 14.83 14.46 2.58 10Mo-12Cr-18Ni 62.21 17.92 12.1 7.714Mo-17Cr-13Ni 66.59 12.51 16.57 3.95 10Mo-14Cr-16Ni 61.1 14.82 13.59 9.864Mo-19Cr-11Ni 66.42 10.88 18.98 3.42 10Mo-16Cr-14Ni 61.29 14.1 16.57 8.554Mo-16Cr-19Ni 61.08 19.05 15.68 3.95 10Mo-14Cr-21Ni 55.73 20.9 13.37 9.744Mo-18Cr-17Ni 61.58 16.88 17.6 3.67 10Mo-16Cr-19Ni 54.8 18.88 15.84 10.184Mo-20Cr-15Ni 59.91 14.75 20.63 4.26 10Mo-18Cr-17Ni 53.08 16.84 18.44 10.954Mo-22Cr-13Ni 62.91 12.31 20.62 3.79 10Mo-20Cr-15Ni 56.66 14.69 19.72 8.51
88—VOLUME 38A, JANUARY 2007 METALLURGICAL AND MATERIALS TRANSACTIONS A

Supra 55 VP scanning electron microscope with an HKLTechnology Channel 5 electron backscattered diffraction(EBSD) system. The acquired patterns were indexedagainst published crystallographic data[13] to accuratelydistinguish between fcc (c-austenite) and bcc (d-ferrite).The tetragonal (r phase) structure was compared to a Fe-Cr r-phase prototype crystal structure.
III. RESULTS AND DISCUSSION
A. Phase Stability Diagrams
An example of a multicomponent phase stabilitydiagram is shown in Figure 2. The series of linesspanning from left to right across the center describesthe variation of the three vertices of the eutectic triangleas a function of composition. The dashed line thatintersects the band created by these vertices representsthe maximum solubility of Cr in austenite, which curvesbelow the eutectic triangle at high Cr and Ni concen-trations. A reduction in Fe content (i.e., increasing Niand Cr) can be seen to expand the width of the eutectictriangle. The set of diagrams given in Figure 3 shows theeffect of increasing the Mo content, as well as a set ofdata points denoting the compositions of the alloysprepared for experimental validation. Successively high-er additions of Mo cause the eutectic triangle not only towiden, but also to veer its location toward higher Nicontents. The latter effect is a result of the ferrite-stabilizing effect of Mo comparable to that of Cr. Inaddition, the continued addition of Mo widens the spacebetween the eutectic and the boundary representing themaximum solubility of Cr in austenite. Within thisrange, an alloy that solidifies as primary ferrite can coolinto a region of the phase diagram in which only single-phase austenite is stable and thus exhibits the thermo-dynamic potential for a complete ferrite to austenitesolid-state transformation.
The phase stability diagrams can be used to estimatethe solidification mode of a wide range of Fe-Ni-Cr-Moalloys that simulate the compositions of SASS alloys. Inthe absence of significant dendrite tip undercooling,alloys above and to the left of the eutectic line shouldexhibit primary austenite solidification, while composi-tions below and to the right of this line should exhibitprimary ferrite solidification. Kinetic shifts in thesolidification mode can occur at high solidificationvelocities typical of high energy density welding, butsuch growth rates and shifts are not considered here forthe arc-button case. Alloy compositions that solidify asprimary ferrite and exhibit the thermodynamic potentialto experience a solid-state transformation to the aus-tenite phase during cooling can also be identified in thediagrams. Compositions above and to the left of themaximum solubility of Cr in austenite should experiencesignificantly more solid-state transformation intoaustenite, as the composition may now enter thesingle-phase austenite region of the phase diagram.Compositions below and to the right may also experi-ence solid-state transformations by entering the d + ctwo-phase region. Because d-ferrite is still thermody-
namically stable in these alloys, the transformation willnot proceed to completion. However, because thediagrams take into account only thermodynamic con-siderations, they are not proficient at predicting themorphology or extent of transformation that will occur.This factor can only be found through an analysis of thekinetics of the system, which takes into account thecooling conditions present. Therefore, the diagramsrepresent a necessary, but not sufficient, condition forattaining an alloy with an austenitic matrix that isderived from ferritic solidification.The phase stability diagrams calculated here were
experimentally validated. The compositions of alloybuttons were plotted by their measured Cr and Nicontents on the phase stability diagram of the corre-sponding Mo content. The summarized results for allalloy compositions are plotted in Figure 3. The corre-sponding weight percentages of ferrite phase, as mea-sured via magnetic methods, are included with each datapoint.The calculated eutectic lines were fairly accurate in
separating alloys between the austenitic and ferriticprimary solidification modes, especially in the lowerMo diagrams. Nearly a third of the samples showedevidence of the martensite phase, most of which wereencompassed by the Schaeffler martensite boundaryincluded in the diagrams. Experimental observations ofthese alloys showed evidence of martensite beingcreated from each of the possible solidification modes.Of the 65 alloys that contained no martensite, onlyeight were found to disagree with the solidificationmodes predicted by the phase stability diagrams. Innearly all cases, their nominal compositions were veryclose to the calculated eutectic lines, meaning that theobserved deviations are minor. The errors may be theresult of a limited compositional domain of thethermodynamic calculation software. The largeamounts of Mo added to the alloys in this study mayhave required the software to perform certain extrap-olations to account for this element, resulting in anerroneous eutectic location.
B. Phase Transformation Sequences and MicrostructuralEvolution
A total of 20 distinct transformation sequences arepossible in the alloys of this study and are summarizedin Table II. The cooling rate of all 96 alloys was roughlyconstant at 30 �C/s, the calculations of which areincluded elsewhere.[14] The numerous resultant micro-structures are a result of four possible solidificationmodes (A, AF, FA, F) and three possible solid-statephase transformations (d fi c, d fi (c + r) and c fimartensite). The eutectic (E) solidification mode re-ported by other authors[7] was not observed in thesealloys. Some alloys exhibited more than one of the threepossible solid-state transformations. The proceedingsections describe each of the solidification modes indi-vidually, with discussion included in each sectiondetailing the requirements and characteristics of thesolid-state transformations that occur after the comple-tion of solidification.
METALLURGICAL AND MATERIALS TRANSACTIONS A VOLUME 38A, JANUARY 2007—89

C. Austenitic Solidification Modes
The photomicrographs displayed in Figure 4 showexamples of the austenitic (A) solidification modestructure. Table II gives the microstructural develop-ment sequence of this structure, referred to as type A.All alloys of this type solidified on the Ni-rich side of theeutectic line. The intercellular regions of the A mode
structure in these alloys etch away because of disparitiesin composition between the cores and the outer edges ofthe cells,[15] as shown in Figure 4(a). Such concentrationgradients have been previously confirmed via EPMAcomposition traces.[2] Alloys that solidified entirely asaustenite could also show another type of microstruc-ture due to the occurrence of the shear-type solid-state
Fig. 3—Phase stability diagram for all Mo contents. Each data point represents the nominal alloy compositions. The shape and color of eachdata point represent the solidification mode, while the adjacent values represent its wt pct ferrite.
90—VOLUME 38A, JANUARY 2007 METALLURGICAL AND MATERIALS TRANSACTIONS A

Table
II.
Twenty
MicrostructuralDevelopmentSequencesFoundto
Resultin
Fe-Cr-Ni-MoAlloysfrom
theArc-M
eltCondition.(L
=liquid,c=
austenitephase,d=
ferrite
phase,r=
sigmaphase,M
=martensite,p=
primary
solidificationproduct,e=
eutectic
solidificationproduct,tf=
product
oflong-rangediffusionaltransform
ation,eutec-
toid
=product
ofeutectoid
phase
transform
ation,gb=
grain-boundary
allotriomorph,andWid
=Widmanstatten
platelets)
Solidification
Solid-State
Transform
ations
SolidificationMode
SolidificationSequence
Primary
Secondary
FinalMicrostructure
Type
FinalPhases
AL
fiL+
c pfi
c p—
—c p
Ac
c pfi
Mc p
+M
Bc+
MAF
Lfi
L+
c pfi
L+
c p+
(d/c) e
fic p
+(d/c) e
d efi
c tf
—c p
+c e
+c tf
Cc
—c p
+c e
+d e
+c tf
Dc+
dc
fiM
c p+
c e+
c tf+M
Ec+
Mc
fiM
c p+
c e+
d e+
c tf+M
Fc+
d+
Md e
fi(c/r) eutectoid
c p+
c e+
c tf+
(c/r) eutectoid
Gc+
r
d efi
(c/r) eutectoid
c p+
c e+
d e+
c tf+
(c/r) eutectoid
Hc+
d+
r
both
c p+
c e+
c tf+
(c/r) eutectoid+M
Ic+
r+
M
both
c p+
c e+
d e+
c tf+
(c/r) eutectoid+
MJ
c+
d+
r+
M
FA
Lfi
L+
d pfi
L+
d p+
(d/c) e
fid p
+(d/c) e
d p,d e
fic tf
—d p
+c e
+c tf
Kc+
dc
fiM
d p+
c e+
c tf+
ML
c+
d+
Md p
fi(c/r) eutectoid
d p+
c e+
c tf+
(c/r) eutec-
toid
Mc+
d+
r
d pfi
(c/r) eutectoid
c e+
c tf+
(c/r) eutectoid
Nc+
rboth
d p+
c e+
c tf+
(c/r) eutectoid+
MO
c+
d+
r+
M
FL
fiL
+d p
fid p
d pfi
c gb+
c wid
—d p
+c g
b+
c wid
Pc+
dc
fiM
d p+
c gb+
c wid+
MQ
c+
d+
Md p
fi(c/r) eutectoid
d p+
c gb+
c wid+
(c/r) eutectoid
Rc+
d+
r
d pfi
(c/r) eutectoid
c gb+
c wid+
(c/r) eutectoid
Sc+
rboth
d p+
c gb+
c wid+
(c/r) eutectoid+
MT
c+
d+
r+
M
METALLURGICAL AND MATERIALS TRANSACTIONS A VOLUME 38A, JANUARY 2007—91

transformation of c fi martensite (Table II, type B).Because all of the alloys in this study were cooled underrelatively the same conditions, the composition of thealloy button was the major factor in the initiation ofsuch a transformation.
Nearly all alloys containing 20 wt pct Ni + Cr andalloys with 0 to 2 wt pct Mo and 25 wt pct Ni + Crshowed evidence of the martensite phase initiallythrough magnetic measurements. Alloys that wereexpected to have low ferrite contents were shown toexhibit a strong magnetic signature due to the presenceof martensite. Laths of martensite were then revealed viametallography and directly observed on these samples.Figure 4(b) shows an example of this type of micro-structure. The martensite generally does not form in theintercellular regions. This can be attributed to micro-segregation and the corresponding change in martensitestart (Ms) temperature across the cells. Both Cr and Moare known[2] to segregate to the cell boundaries duringaustenite solidification and are also known to suppressthe Ms temperature.[16] Thus, the Ms temperature is highin the cell cores (where Cr and Mo are low) relative tothe cell boundaries. This has the effect of stabilizing
austenite in the cell boundaries, while martensite isconfined to the cell cores. As shown in Figure 3, nearlyall compositions that exhibited martensite were encom-passed by the martensite line conceived by Schaeffler.The only martensitic alloys to escape this boundarycontained high (8 to 10 wt pct) additions of Mo, acompositional range that is relatively modern and thuswas not likely included in the creation of the Schaefflerdiagram.As discussed subsequently, the presence of martensite
phase was observed to be independent of the solidifica-tion mode of the weld button. The solid-state d fi ctransformation will render large amounts of austeniteeven in alloys that solidify as ferrite. Martensite lathswere observed in the austenite components of weldstructures experiencing each of the four solidificationmodes. As the compositional dependency and source ofthe martensite has been well established, a detaileddiscussion of the phase will be limited in the followingsections. In effect, martensite is able to form in each ofthe proposed microstructural development sequences,effectively doubling the number of such classifications inthis alloy system.
D. Austenitic-Ferritic Solidification Modes
Figures 5 and 6 show the various microstructures thatare possible through the austenitic-ferritic (AF) solidi-fication mode. The compositions of alloys belonging tothe AF solidification mode, while still being located onthe Ni-rich side of the eutectic, were close enough to theeutectic line so as to drive the primary solidification pathinto the two-fold line of saturation so that solidificationterminated by the L fi c + d eutectic-type reaction.Three possible solid-state transformations can occur
in these alloys. The solidified ferrite can transform toaustenite (d fi c) by a long-range diffusional transfor-mation. This is the primary type of solid-state transfor-mation observed. Two secondary-type solid-statetransformations can also occur: the austenite cantransform to martensite by a shear transformation(c fi M), and any remnant ferrite can transform toaustenite and sigma phases by a eutectoid-type[7] trans-formation (d fi (c + r)). Eight different microstruc-tures are possible for alloys that solidified in the AFmode. The final microstructure that forms depends onthe following: (1) the type of solid-state transformationthat occurs, (2) whether two of the solid-state transfor-mations occur in one alloy sequentially, and (3) whetherthe diffusional (c fi d) and (d fi (d + r)) transfor-mations go to completion.For example, type C microstructure forms when the
primary d fi c solid-state transformation goes tocompletion and no secondary solid-state transformationoccurs. The transformation product is known[7] to growepitaxially from existing c at the austenite/ferrite phaseboundary in the intercellular regions, so no nucleation isrequired. The final microstructure in this case is fullyaustenitic. It should be noted that this final microstruc-ture is indistinguishable from the type A microstructureshown in Figure 4(a). The inability to separate theseferrite-free structures as either type A or type C hindered
Fig. 4—Representative micrographs of the A mode: (a) type A,0Mo-18Cr-17Ni; and (b) type B, 2Mo-8Cr-12Ni.
92—VOLUME 38A, JANUARY 2007 METALLURGICAL AND MATERIALS TRANSACTIONS A

unequivocal determination of the development sequencefor such alloys. For the solidification mode tabulation inFigure 3, an alloy was only given the AF designation if(1) it clearly exhibited a primary austenite solidificationmode and remnant ferrite (as detected through metal-lographic examination and magnetic measurements) or
(2) it exhibited no magnetic signature (and thereforeno detectable remnant ferrite), but exhibited an inter-dendritic lamellar c/r constituent. As discussed in moredetail below, the interdendritic c/r constituent formsby decomposition of remnant ferrite by a eutectoid-type transformation. Thus, the presence of the inter-dendritic c/r constituent confirms that ferrite existedat the end of solidification. Such alloys are labeled inFigure 3 with the AF solidification mode and 0.0 wt pctferrite.TypeDmicrostructures formwhen the primary c fi d
transformation does not go to completion and remnantferrite remains in the intercellular regions, as observedmicrostructurally and detected magnetically. For thesealloys with low amounts of Mo in the nominal composi-tion, a lack of sufficientMo enrichment in the intercellularprevented the eutectoid d fi (r + c) transformationfrom occurring. An example of this microstructure isshown in Figure 5(a).Type E microstructures form when the d fi c trans-
formation goes to completion and austenite transformsto martensite by a shear-type transformation. Onceagain, the lack of detectable ferrite made distinguishingthese alloys from type B alloys impossible. The presenceof intercellular ferrite was not observed microstructur-ally in any of the 31 martensitic samples. In addition, themagnetic signature of martensite made ferrite detectionby magnetic means impossible. However, the presenceof intercellular ferrite would not hinder the sheartransformation in the cell core, where martensite wasobserved to be confined in several A mode samples.Minor variations in alloy composition and cooling ratebeyond those explored in this research may producealloys with such remnant ferrite. For this reason, thetype F development sequence is proposed even thoughno such microstructure was observed for the alloysprepared under the current set of conditions.The remainder of the AF mode sequences describes
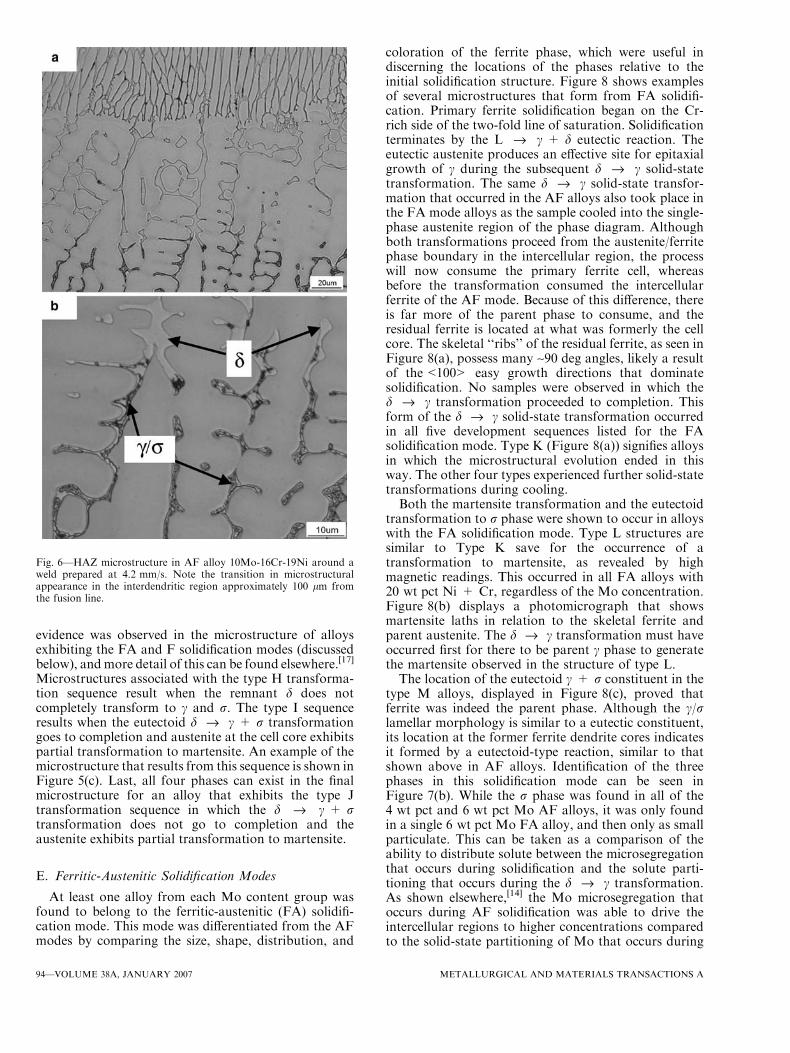
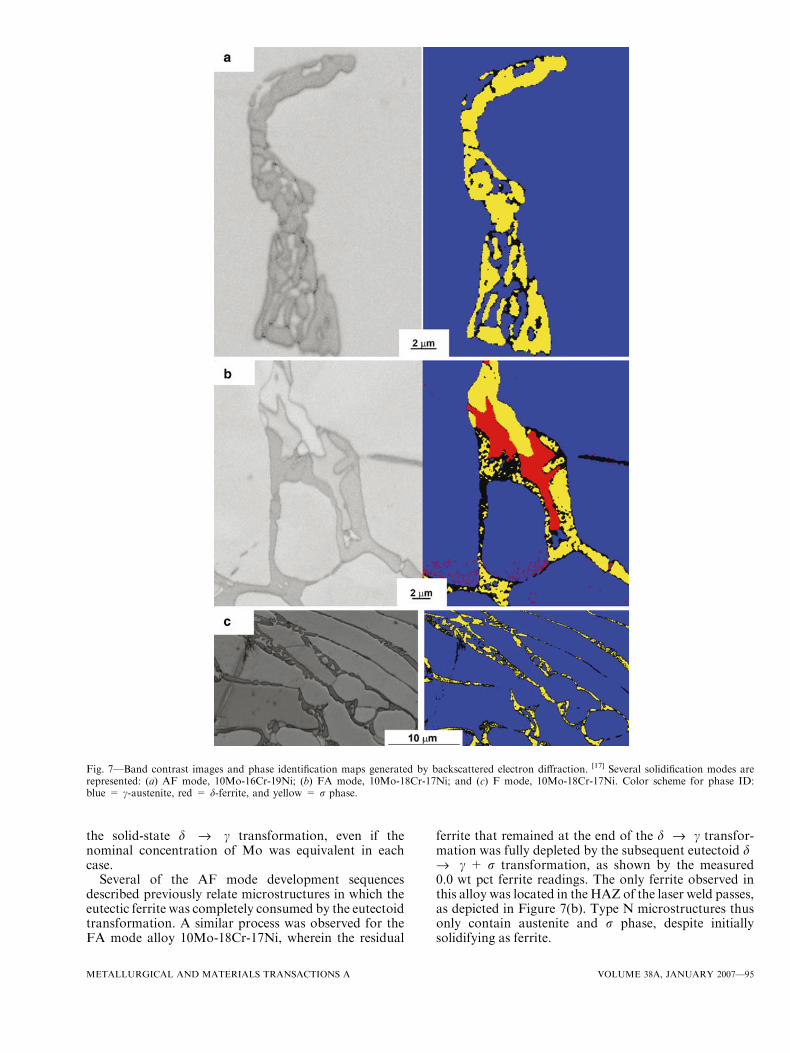
alloys in which the intercellular ferrite experienced atransformation to a lamellar c/r constituent. Recentresearch[17] has demonstrated that this lamellar c/rconstituent forms by a eutectoid-type d fi c + rsolid-state transformation. This will be briefly summa-rized here, and the details are discussed in a separatearticle.[17] Type G microstructures form when all theremnant d phase transforms to the c/r eutectoid product.An example microstructure is shown in Figure 5(b). (Ther phase was identified via backscattered electron Kikuchipattern analysis. Various examples of this are shown inFigure 7.) The morphology and location of the c and rphases in the intercellular regions are similar to theterminal c and r phases that have been observed to formby eutectic-type L fi c + r reaction alloys with higherNi and Cr contents.[18] However, as shown in Figures 6and 7(b), the c/r constituent in these alloys was con-verted back to ferrite in the HAZ of laser welds preparedon AF (and FA) mode alloys. The high cooling rateassociated with laser welding avoided the subsequenteutectoid-type transformation back to c and r. Theseresults demonstrate that the c/r constituent was pro-duced by a solid-state eutectoid reaction, and not aterminal eutectic-type L fi c + r reaction. Similar
Fig. 5—Representative micrographs of the AF mode: (a) type D,0M o-18Cr-12Ni; (b) type G, 8Mo-13Cr-17Ni; and (c) type I, 8Mo-8Cr-12Ni.
METALLURGICAL AND MATERIALS TRANSACTIONS A VOLUME 38A, JANUARY 2007—93
evidence was observed in the microstructure of alloysexhibiting the FA and F solidification modes (discussedbelow), andmore detail of this can be found elsewhere.[17]
Microstructures associated with the type H transforma-tion sequence result when the remnant d does notcompletely transform to c and r. The type I sequenceresults when the eutectoid d fi c + r transformationgoes to completion and austenite at the cell core exhibitspartial transformation to martensite. An example of themicrostructure that results from this sequence is shown inFigure 5(c). Last, all four phases can exist in the finalmicrostructure for an alloy that exhibits the type Jtransformation sequence in which the d fi c + rtransformation does not go to completion and theaustenite exhibits partial transformation to martensite.
E. Ferritic-Austenitic Solidification Modes
At least one alloy from each Mo content group wasfound to belong to the ferritic-austenitic (FA) solidifi-cation mode. This mode was differentiated from the AFmodes by comparing the size, shape, distribution, and
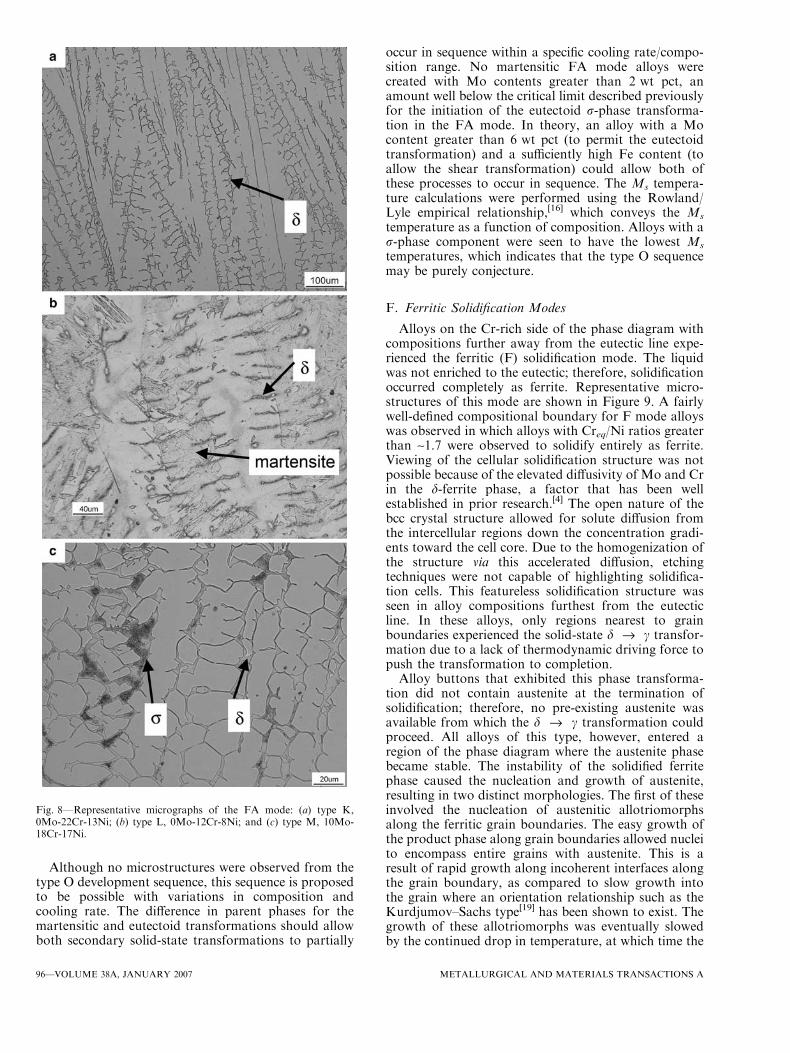
coloration of the ferrite phase, which were useful indiscerning the locations of the phases relative to theinitial solidification structure. Figure 8 shows examplesof several microstructures that form from FA solidifi-cation. Primary ferrite solidification began on the Cr-rich side of the two-fold line of saturation. Solidificationterminates by the L fi c + d eutectic reaction. Theeutectic austenite produces an effective site for epitaxialgrowth of c during the subsequent d fi c solid-statetransformation. The same d fi c solid-state transfor-mation that occurred in the AF alloys also took place inthe FA mode alloys as the sample cooled into the single-phase austenite region of the phase diagram. Althoughboth transformations proceed from the austenite/ferritephase boundary in the intercellular region, the processwill now consume the primary ferrite cell, whereasbefore the transformation consumed the intercellularferrite of the AF mode. Because of this difference, thereis far more of the parent phase to consume, and theresidual ferrite is located at what was formerly the cellcore. The skeletal ‘‘ribs’’ of the residual ferrite, as seen inFigure 8(a), possess many ~90 deg angles, likely a resultof the<100> easy growth directions that dominatesolidification. No samples were observed in which thed fi c transformation proceeded to completion. Thisform of the d fi c solid-state transformation occurredin all five development sequences listed for the FAsolidification mode. Type K (Figure 8(a)) signifies alloysin which the microstructural evolution ended in thisway. The other four types experienced further solid-statetransformations during cooling.Both the martensite transformation and the eutectoid
transformation to r phase were shown to occur in alloyswith the FA solidification mode. Type L structures aresimilar to Type K save for the occurrence of atransformation to martensite, as revealed by highmagnetic readings. This occurred in all FA alloys with20 wt pct Ni + Cr, regardless of the Mo concentration.Figure 8(b) displays a photomicrograph that showsmartensite laths in relation to the skeletal ferrite andparent austenite. The d fi c transformation must haveoccurred first for there to be parent c phase to generatethe martensite observed in the structure of type L.The location of the eutectoid c + r constituent in the
type M alloys, displayed in Figure 8(c), proved thatferrite was indeed the parent phase. Although the c/rlamellar morphology is similar to a eutectic constituent,its location at the former ferrite dendrite cores indicatesit formed by a eutectoid-type reaction, similar to thatshown above in AF alloys. Identification of the threephases in this solidification mode can be seen inFigure 7(b). While the r phase was found in all of the4 wt pct and 6 wt pct Mo AF alloys, it was only foundin a single 6 wt pct Mo FA alloy, and then only as smallparticulate. This can be taken as a comparison of theability to distribute solute between the microsegregationthat occurs during solidification and the solute parti-tioning that occurs during the d fi c transformation.As shown elsewhere,[14] the Mo microsegregation thatoccurs during AF solidification was able to drive theintercellular regions to higher concentrations comparedto the solid-state partitioning of Mo that occurs during
Fig. 6—HAZ microstructure in AF alloy 10Mo-16Cr-19Ni around aweld prepared at 4.2 mm/s. Note the transition in microstructuralappearance in the interdendritic region approximately 100 lm fromthe fusion line.
94—VOLUME 38A, JANUARY 2007 METALLURGICAL AND MATERIALS TRANSACTIONS A
the solid-state d fi c transformation, even if thenominal concentration of Mo was equivalent in eachcase.
Several of the AF mode development sequencesdescribed previously relate microstructures in which theeutectic ferrite was completely consumed by the eutectoidtransformation. A similar process was observed for theFA mode alloy 10Mo-18Cr-17Ni, wherein the residual
ferrite that remained at the end of the d fi c transfor-mation was fully depleted by the subsequent eutectoid dfi c + r transformation, as shown by the measured0.0 wt pct ferrite readings. The only ferrite observed inthis alloy was located in the HAZ of the laser weld passes,as depicted in Figure 7(b). Type N microstructures thusonly contain austenite and r phase, despite initiallysolidifying as ferrite.
Fig. 7—Band contrast images and phase identification maps generated by backscattered electron diffraction. [17] Several solidification modes arerepresented: (a) AF mode, 10Mo-16Cr-19Ni; (b) FA mode, 10Mo-18Cr-17Ni; and (c) F mode, 10Mo-18Cr-17Ni. Color scheme for phase ID:blue = c-austenite, red = d-ferrite, and yellow = r phase.
METALLURGICAL AND MATERIALS TRANSACTIONS A VOLUME 38A, JANUARY 2007—95
Although no microstructures were observed from thetype O development sequence, this sequence is proposedto be possible with variations in composition andcooling rate. The difference in parent phases for themartensitic and eutectoid transformations should allowboth secondary solid-state transformations to partially
occur in sequence within a specific cooling rate/compo-sition range. No martensitic FA mode alloys werecreated with Mo contents greater than 2 wt pct, anamount well below the critical limit described previouslyfor the initiation of the eutectoid r-phase transforma-tion in the FA mode. In theory, an alloy with a Mocontent greater than 6 wt pct (to permit the eutectoidtransformation) and a sufficiently high Fe content (toallow the shear transformation) could allow both ofthese processes to occur in sequence. The Ms tempera-ture calculations were performed using the Rowland/Lyle empirical relationship,[16] which conveys the Ms
temperature as a function of composition. Alloys with ar-phase component were seen to have the lowest Ms
temperatures, which indicates that the type O sequencemay be purely conjecture.
F. Ferritic Solidification Modes
Alloys on the Cr-rich side of the phase diagram withcompositions further away from the eutectic line expe-rienced the ferritic (F) solidification mode. The liquidwas not enriched to the eutectic; therefore, solidificationoccurred completely as ferrite. Representative micro-structures of this mode are shown in Figure 9. A fairlywell-defined compositional boundary for F mode alloyswas observed in which alloys with Creq/Ni ratios greaterthan ~1.7 were observed to solidify entirely as ferrite.Viewing of the cellular solidification structure was notpossible because of the elevated diffusivity of Mo and Crin the d-ferrite phase, a factor that has been wellestablished in prior research.[4] The open nature of thebcc crystal structure allowed for solute diffusion fromthe intercellular regions down the concentration gradi-ents toward the cell core. Due to the homogenization ofthe structure via this accelerated diffusion, etchingtechniques were not capable of highlighting solidifica-tion cells. This featureless solidification structure wasseen in alloy compositions furthest from the eutecticline. In these alloys, only regions nearest to grainboundaries experienced the solid-state d fi c transfor-mation due to a lack of thermodynamic driving force topush the transformation to completion.Alloy buttons that exhibited this phase transforma-
tion did not contain austenite at the termination ofsolidification; therefore, no pre-existing austenite wasavailable from which the d fi c transformation couldproceed. All alloys of this type, however, entered aregion of the phase diagram where the austenite phasebecame stable. The instability of the solidified ferritephase caused the nucleation and growth of austenite,resulting in two distinct morphologies. The first of theseinvolved the nucleation of austenitic allotriomorphsalong the ferritic grain boundaries. The easy growth ofthe product phase along grain boundaries allowed nucleito encompass entire grains with austenite. This is aresult of rapid growth along incoherent interfaces alongthe grain boundary, as compared to slow growth intothe grain where an orientation relationship such as theKurdjumov–Sachs type[19] has been shown to exist. Thegrowth of these allotriomorphs was eventually slowedby the continued drop in temperature, at which time the
Fig. 8—Representative micrographs of the FA mode: (a) type K,0Mo-22Cr-13Ni; (b) type L, 0Mo-12Cr-8Ni; and (c) type M, 10Mo-18Cr-17Ni.
96—VOLUME 38A, JANUARY 2007 METALLURGICAL AND MATERIALS TRANSACTIONS A

solid-state transformation proceeded into the ferritegrains via the Widmanstatten growth mechanism. Thistype of austenitic product appears as needles or platelets,a morphology caused by the K-S orientation relationshipbetween the parent d-ferrite and product c-austenite.These platelets extend from the allotriomorphic product
inward to the grain centers. Both forms of austenite arevisible in Figure 9(a). This micrograph typifies the type Pdevelopment sequence in Table II, which includes alloysof this solidification mode containing only ferrite andaustenite. Alloys closest to the eutectic line experiencedthe greatest degree of solid-state transformation, becausetheir relative location was closer to the c-austenite solvusin the two-phase c/d region. All alloys of the F mode,however, contained greater amounts of residual ferritethan in the other three solidification mode types, becausethey most often cooled into the d + c region of the phasediagram, where ferrite was still a stable phase. Becausealloys of the F mode still contained some of the austenitephase, the martensite transformation was still found totake place in many of these alloys. Evidence of martens-ite laths can be seen crossing a grain-boundary allot-riomorph in Figure 9(b). The type Q sequence is typifiedby the presence of martensite within either allotriomor-phic or Widmanstatten austenite.The type R microstructure was established upon the
discovery of r + c eutectoid constituent between theaustenitic Widmanstatten platelets of high-Mo F modealloys, as shown at low magnification in Figure 9(c) andthrough the phase identification results shown inFigure 7(c). The solute partitioning to d-ferrite thatarose in the type R alloys was once again responsible forthe elevated levels of Mo necessary for nucleation andgrowth of the r phase in this morphology. As discussedpreviously for the FA mode, it was observed that theeutectoid transformation could eradicate the interplat-elet ferrite to such a degree that magnetic measurementsdetected 0.0 wt pct of the ferrite phase. This was seen inthe 10Mo-18Cr-17Ni button, which contained a regionof F mode structure within an overall FA mode matrix.This category of microstructural development is desig-nated type S and contains no ferrite, despite havingsolidified entirely as such. The type T classification isproposed for cases in which the composition and coolingrate may be appropriate for all three solid-state trans-formations to occur in an F mode alloy, although nosuch alloys were located in this study. The Ms temper-ature calculations discussed previously may indicate thatthe compositional regimes for the eutectoid and sheartransformations are mutually exclusive for primaryferrite alloys. Further research is required before typeO and type T development sequences can be institutedwith confidence.
G. Microstructural Mapping
The microstructural characterization results wereused to construct a map to chart the solidificationmodes and r-phase transformation as functions ofcomposition. Figure 10 displays the 65 non-martensiticsamples as functions of their Creq/Ni ratio and Moconcentration. The solid boundaries separate solidifica-tion modes, while the dashed lines indicate compositionsthat experienced the eutectoid transformation to rphase. The boundary between austenitic and ferriticprimary solidification modes is found at 1.5(Creq/Ni), inagreement with previous results.[4]
Fig. 9—Representative micrographs of the F mode: (a) type O,0Mo-24Cr-11Ni; (b) type P, 6Mo-10Cr-10Ni; and (c) type Q, 10Mo-18Cr-17Ni.
METALLURGICAL AND MATERIALS TRANSACTIONS A VOLUME 38A, JANUARY 2007—97

The boundaries dividing single-phase solidificationmodes from their dual-phase counterparts are not aswell defined in the literature. The F/FA mode boundaryobserved at 1.7(Creq/Ni) showed that only a small rangeof Cr/Ni ratios will enable the FA solidification mode.On the other side of the map, the slope in the A/AFmode boundary could be either a development-basedphenomenon or a result of the classification schemeused. The latter explanation comes about due to theability of the d fi c transformation to completelyconsume the parent phase. Interdendritic ferrite presentin AF alloys was transformed only to austenite in thelow-Mo alloys, while the high-Mo alloys also experiencethe eutectoid r-phase transformation. The presence of rphase made identifying the AF solidification mucheasier in these alloys. In the low-Mo alloys, no distinc-tion could be made between A mode alloys and AFmode alloys in which the d fi c transformation hadgone to completion. Only alloys with magnetic signa-tures or those that contained r phase were classified asAF mode, which would cause the diagonal slope in theA/AF boundary. However, the prominence of the AFmode at high Mo contents may be the result of the lowdistribution coefficient of Mo in the solidifying primaryaustenite phase,[2] which causes the segregation of Mosolute to the interdendritic liquid. The resulting highconcentrations of solute in these locations can thusenable the switch to eutectic solidification at lower Cr/Ni ratios.
The locations of the r-phase boundaries also highlighta finding discussed previously concerning the composi-tional requirements for the eutectoid transformation.On the austenitic side of the map, the r phase can befound in alloys with as little as 2.5 wt pct Mo. For the rphase to form in the ferritic mode alloys, at least 6 wtpct Mo was required. The microsegregation of Moduring austenite solidification leads to more severeconcentration gradients than the solute partitioningthat occurs during the d fi c solid-state transformation.This has been verified and is reported on elsewhere.[14]
IV. CONCLUSIONS
The phase transformations and resultant microstruc-tures that form in the Fe-Ni-Cr-Mo system undercooling rate conditions typical of arc welding andcasting have been observed using a variety of micros-copy techniques. Alloys within the composition spaceconsidered (Ni + Cr = 20 to 35 wt pct and Mo = 0 to10 wt pct) exhibited four possible solidification modes:A, AF, FA, and F. These solidification modes areconsistent with those observed in previous work on theFe-Ni-Cr system. Three possible solid-state transforma-tions were also observed. The long-range c fi ddiffusional transformation was observed in variousmorphologies in addition to eutectoid-type d fi(c + r) and shear c fi M transformations. A totalof 20 distinct possible phase transformation sequencesare proposed to occur in this system. Additions of Moup to 10 wt pct did not significantly affect the transitionfrom the austenitic to ferritic primary solidificationmode occurring at 1.5 Creq/Ni. The shift from FA to Fsolidification mode occurs at 1.7Creq/Ni and is alsoinsensitive to Mo content in the range studied here. TheFA mode alloys were shown to dissolve a greaterconcentration of Mo (6 wt pct Mo) without inducing theeutectoid transformation to r phase, and this is attrib-uted to a more even distribution of Mo in alloys thatexhibited ferritic solidification. The physical character-istics of each development sequence were described indetail, and a microstructure map is proposed as an aidfor microstructural control in these alloys.
ACKNOWLEDGMENTS
The authors gratefully acknowledge financial supportof this work by the Office of Naval Research, underContract No. N00014-00-1-0448. The authors alsoacknowledge the American Welding Society’s support ofthis work through a Graduate Research Fellowshipsponsored by the Navy Joining Center. Don Scott,Santoku America, graciously assisted in the creation ofthe FeCr master alloy from which the experimentalalloys were melted. Joe Michael, Sandia National Lab-oratories, was instrumental in performing the EBSDanalysis. Sandia is a multiprogram laboratory operatedby Sandia Corporation, a Lockheed Martin Company,for the United States Department of Energy’s NationalNuclear Security Administration under Contract No.DE-AC04-94AL85000.
REFERENCES1. A. Garner: Corrosion, 1979, vol. 35, pp. 108–14.2. S.W. Banovic, J.N. DuPont, and A.R. Marder: Sci. Technol.
Welding Joining (UK), 2002, vol. 7, pp. 374–83.3. J.N. DuPont, L.E. Friedersdorf, A.R. Marder, and S.W. Banovic:
Lehigh University ATLSS Report No. 01-03, Lehigh University,Bethlehem, PA, 2001.
Fig. 10—Effect of Creq/Ni ratio and Mo content on alloy micro-structure. Zones are divided by solidification mode (thick lines) andthe incidence of r phase (dashed lines).
98—VOLUME 38A, JANUARY 2007 METALLURGICAL AND MATERIALS TRANSACTIONS A

4. J.A. Brooks and A.W. Thompson: Int. Mater. Rev., 1991, vol. 36,pp. 16–44.
5. S.W. Banovic, J.N. DuPont, and A.R. Marder: Metall. Mater.Trans. B, 2001, vol. 32B, pp. 1171–76.
6. S.W. Banovic, J.N. DuPont, and A.R. Marder: Welding J., 2003,vol. 82, pp. 125–35.
7. J.W. Elmer, S.M. Allen, and T.W. Eagar: Metall. Trans. A, 1989,vol. 20A, pp. 2117–31.
8. J.W. Elmer, S.M. Allen, and T.W. Eagar: Recent Trends inWelding Science and Technology, Gatlinburg, TN, May 14–18,1989, ASM INTERNATIONAL, Materials Park, OH, 1990,pp. 165-70.
9. M.J. Perricone, T.D. Anderson, J.N. DuPont, and C.V. Robino:MS and T, Cincinnati, OH, 2006.
10. B. Sundman: Thermo-Calc (S-100 44[[N]]KTH, Stockholm, 2001).11. N. Saunders: Fe-Data Thermodynamic Database ([[3.0]]Thermo-
tech, Ltd, Guildford, United Kingdom, 2001).
12. A.L. Schaeffler: Met. Progr., 1949, vol. 56, p. 680.13. T. Hahn: International Tables for Crystallography4th ed (Springer
US, Berlin, 1996).14. T.D. Anderson, M.J. Perricone, J.N. DuPont, and A.R. Marder:
unpublished research, 2006.15. J.A. Brooks, and M.I. Baskes: Recent Trends in Welding Science
and Technology, Gatlinburg, TN, May 14–18, 1989, pp. 153-58.16. E.S. Rowland and S.R. Lyle: Trans. ASM, 1946, pp. 27-47.17. M.J. Perricone, C.V. Robino, T.D. Anderson, and J.N. DuPont:
Sandia National Laboratories, Albuquerque, NM, unpublishedresearch, 2006.
18. M.J. Perricone and J.N. DuPont: Metall. Mater. Trans. A, 2006,vol. 37A, pp. 1267–80.
19. G.V. Kurdjumov and G. Sachs: Z. Phys., 1930, vol. 64, pp.325–43.
METALLURGICAL AND MATERIALS TRANSACTIONS A VOLUME 38A, JANUARY 2007—99