Phase Transformation Kinetics and Mechanisms in Titanium
11
HAL Id: jpa-00254142 https://hal.archives-ouvertes.fr/jpa-00254142 Submitted on 1 Jan 1996 HAL is a multi-disciplinary open access archive for the deposit and dissemination of sci- entific research documents, whether they are pub- lished or not. The documents may come from teaching and research institutions in France or abroad, or from public or private research centers. L’archive ouverte pluridisciplinaire HAL, est destinée au dépôt et à la diffusion de documents scientifiques de niveau recherche, publiés ou non, émanant des établissements d’enseignement et de recherche français ou étrangers, des laboratoires publics ou privés. Phase Transformation Kinetics and Mechanisms in Titanium Alloys Ti-6.2.4.6,ß-CEZ and Ti-10.2.3 S. Bein, J. Béchet To cite this version: S. Bein, J. Béchet. Phase Transformation Kinetics and Mechanisms in Titanium Alloys Ti- 6.2.4.6,ß-CEZ and Ti-10.2.3. Journal de Physique IV Colloque, 1996, 06 (C1), pp.C1-99-C1-108. <10.1051/jp4:1996110>. <jpa-00254142>
Transcript of Phase Transformation Kinetics and Mechanisms in Titanium

HAL Id: jpa-00254142https://hal.archives-ouvertes.fr/jpa-00254142
Submitted on 1 Jan 1996
HAL is a multi-disciplinary open accessarchive for the deposit and dissemination of sci-entific research documents, whether they are pub-lished or not. The documents may come fromteaching and research institutions in France orabroad, or from public or private research centers.
L’archive ouverte pluridisciplinaire HAL, estdestinée au dépôt et à la diffusion de documentsscientifiques de niveau recherche, publiés ou non,émanant des établissements d’enseignement et derecherche français ou étrangers, des laboratoirespublics ou privés.
Phase Transformation Kinetics and Mechanisms inTitanium Alloys Ti-6.2.4.6,ß-CEZ and Ti-10.2.3
S. Bein, J. Béchet
To cite this version:S. Bein, J. Béchet. Phase Transformation Kinetics and Mechanisms in Titanium Alloys Ti-6.2.4.6,ß-CEZ and Ti-10.2.3. Journal de Physique IV Colloque, 1996, 06 (C1), pp.C1-99-C1-108.<10.1051/jp4:1996110>. <jpa-00254142>
JOURNAL DE PHYSIQUE IV Colloque C1, supplCment au Journal de Physique 111, Volume 6, janvier 1996
Phase Transformation Kinetics and Mechanisms in Titanium Alloys Ti-6.2.4.6,P-CEZ and Ti-10.2.3
S. Bein and J. BCchet
Laboratoire de Mdtallurgie, Consewatoire National des Arts et Mdtiers, 292 rue St. Martin, 75141 Paris cedex 03, France
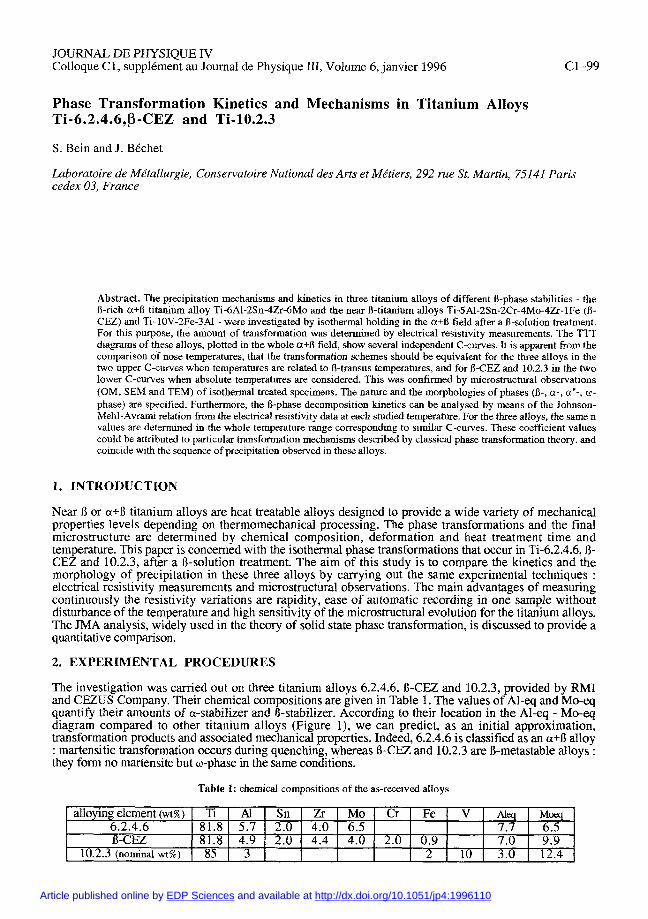
Abstract. The precipitation mechanisms and kinetics in three titanium alloys of different R-phase stabilities - the B-rich a+B titanium alloy Ti-6A1-2Sn-4ZrdMo and the near R-titanium alloys Ti-5AI-2Sn-2Cr-4Mo-4Zr-1Fe (R- CEZ) and Ti-IOV-2Fe-3AI - were investigated by isothermal holding in the a+R field after a B-solution treatment. For this purpose, the amount of transformation was determined by electrical resistivity measurements. The TIT diagrams of these alloys, plotted in the whole a+R field, show several independent C-curves. It is apparent from the comparison of nose temperatures, that the transformation schemes should be equivalent for the three alloys in the two upper C-curves when temperatures are related to R-transus temperatures, and for R-CEZ and 10.2.3 in the two lower C-curves when absolute temperatures are considered. This was confirmed by microstructuual observations (OM, SEM and TEM) of isothermal treated specimens. The nature and the morphologies of phases (8-, a-, a"-, w- phase) are specified. Furthermore, the R-phase decomposition kinetics can be analysed by means of the Johnson- Mehl-Avrami relation from the electrical resistivity data at each studied temperature. For the three alloys, the same n values are determined in the whole temperature range corresponding to similar C-curves. These coefficient values could be attributed to particular transformation mechanisms described by classical phase transformation theory. and coincide with the sequence of precipitation observed in these alloys.
Near B or a+B titanium alloys are heat treatable alloys designed to provide a wide variety of mechanical properties levels depending on thermomechanical processing. The phase transformations and the final microstructure are determined by chemical composition, deformation and heat treatment time and temperature. This paper is concerned with the isothermal phase transformations that occur in Ti-6.2.4.6,8- CEZ and 10.2.3, after a B-solution treatment. The aim of this study is to compare the kinetics and the morphology of precipitation in these three alloys by carrying out the same experimental techniques : electrical resistivity measurements and microstructural observations. The main advantages of measuring continuously the resistivity variations are rapidity, ease of automatic recording in one sample without disturbance of the temperature and high sensitivity of the microstructural evolution for the titanium alloys. The JMA analysis, widely used in the theory of solid state phase transformation, is discussed to provide a quantitative comparison.
2. EXPERIMENTAL PROCEDURES
The investigation was canied out on three titanium alloys 6.2.4.6, B-CEZ and 10.2.3, provided by RMI and CEZUS Company. Their chemical compositions are given in Table 1. The values of Al-eq and Mo-eq quantify their amounts of a-stabilizer and B-stabilizer. According to their location in the Al-eq - Mo-eq diagram compared to other titanium alloys (Figure I), we can predict, as an initial approximation, transformation products and associated mechanical properties. Indeed, 6.2.4.6 is classified as an a+8 alloy : martensitic transformation occurs during quenching, whereas B-CEZ and 10.2.3 are 8-metastable alloys : they form no martensite but w-phase in the same conditions.
Table 1: chemicaI compositions of the as-received alloys
alloying element (wt%) 6.2.4.6
10.2.3 (nomnd wt%)
Sn 2.0
Ti 81.8
85
A1 5.7
3
Zr 4.0
-81.84792.04.44.02.00.9-7.09.9
Mo 6.5
Cr Fe
2
V
10
Aleq 7.7
3.0
Moeq - 6.5
12.4
Article published online by EDP Sciences and available at http://dx.doi.org/10.1051/jp4:1996110
JOURNAL DE PHYSIQUE IV
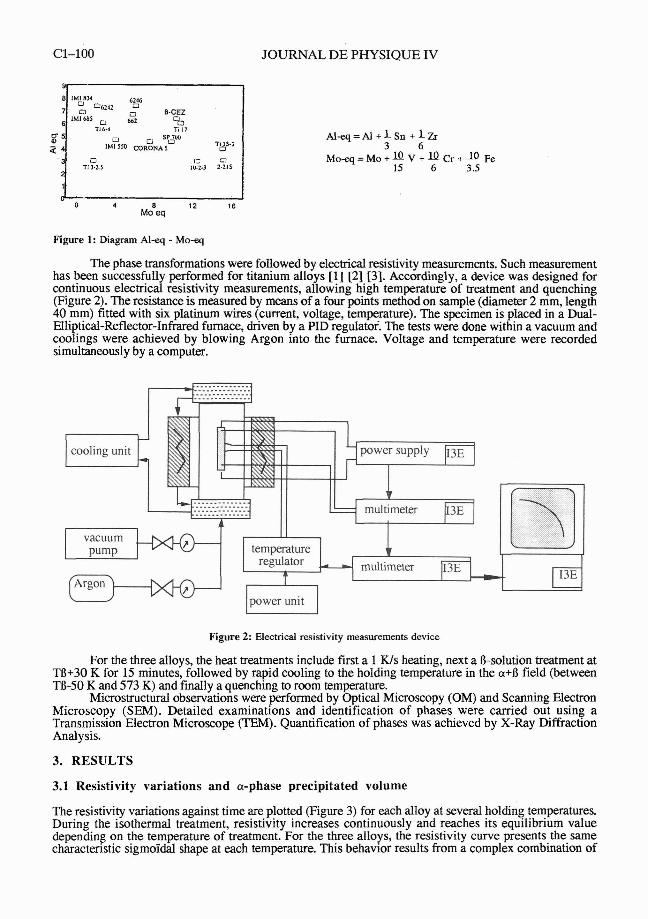
Figure 1: Diagram Al-q - Mo-eq
The phase transformations were followed by electrical resistivity measurements. Such measurement has been successfully performed for titanium alloys [l] [2] 131. Accordingly, a device was designed for continuous electrical resistivity measurements, allowing high temperature of treatment and quenching (Figure 2). The resistance is measured by means of a four points method on sample (diameter 2 mm, length 40 mm) fitted with six platinum wires (current, voltage, temperature). The specimen is placed in a Dual- Elliptical-Reflector-Infrared furnace, driven by a PID regulator. The tests were done within a vacuum and coolings were achieved by blowing Argon into the furnace. Voltage and temperature were recorded simultaneously by a computer.
Figure 2: Electrical resistivity measurements device
For the three alloys, the heat treatments include first a 1 K/s heating, next a R-solution treatment at TB+30 K for 15 minutes, followed by rapid cooling to the holding temperature in the a+B field (between TR-50 K and 573 K) and finally a quenching to room temperature.
Microstructural observations were performed by Optical Microscopy (OM) and Scanning Electron Microscopy (SEM). Detailed examinations and identification of phases were carried out using a Transmission Electron Microscope (TEM). Quantification of phases was achieved by X-Ray Diffraction Analysis.
3. RESULTS
3.1 Resistivity variations and a-phase precipitated volume
The resistivity variations against time are plotted (Figure 3) for each alloy at several holding temperatures. During the isothermal treatment, resistivity increases continuously and reaches its equilibrium value depending on the temperature of treatment. For the three alloys, the resistivity curve presents the same characteristic sigmoi'dal shape at each temperature. This behavior results fi-om a complex combination of
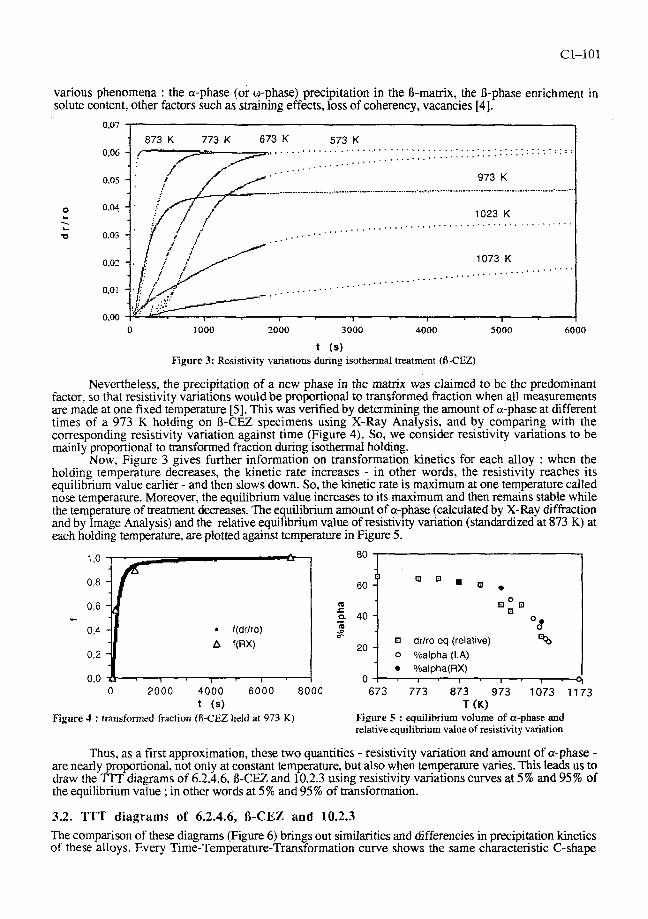
various phenomena : the a-phase (or w-phase) precipitation in the D-mamx, the &phase enrichment in solute content, other factors such as straining effects, loss of coherency, vacancies [4].
0.07
0.00 0 1000 7000 3000 4000 5000 6000
t (S)
Figure 3: Res~stivity variations during isothermal treatment (RCEZ)
Nevertheless, the precipitation of a new phase in the matrix was claimed to be the predominant factor, so that resistivity variations would be proportional to transformed fraction when all measurements are made at one fixed temperature 151. This was verified by determining the amount of a-phase at different times of a 973 K holding on 8-CEZ specimens using X-Ray Analysis, and by comparing with the corresponding resistivity variation against time (Figure 4). So, we consider resistivity variations to be mainly proportional to transformed fraction during isothermal holding.
Now, Figure 3 gives further information on transformation kinetics for each alloy : when the holding temperature decreases, the kinetic rate increases - in other words, the resistivity reaches its equilibrium value earlier - and then slows down. So, the kinetic rate is maximum at one temperature called nose temperature. Moreover, the equilibrium value increases to its maximum and then remains stable while the temperature of treatment decreases. The equilibrium amount of a-phase (calculated by X-Ray diffraction and by Image Analysis) and the relative equilibrium value of resistivity variation (standardized at 873 K) at each holding temperature, are plotted against temperature in Figure 5.
0 8 I3 a n .
60 - m e
0,6 m I:
D o n n 40 - 0
"- - 0 9
m s O d
q drlro eq (relative) % 0 2 20 - 0 %alpha (LA)
%alpha(RX) 0,o 0 1 ' 1 ' 1 . 1 . 0
0 2000 4000 6000 800C 673 773 873 973 1073 1173 t (s) T (K)
Figlire 4 : transformed fraction (R-CEZ held at 973 K) Figure 5 : equilibrium volume of a-phase and relative equilibrium value of resistivity variation
Thus, as a first approximation, these two quantities - resistivity variation and amount of a-phase - are nearly proportional, not only at constant temperature, but also when temperature varies. This leads us to draw the TTT diagrams of 6.2.4.6, D-CEZ and 10.2.3 using resistivity variations curves at 5% and 95% of the equilibrium value ; in other words at 5% and 95% of transformation.
3.2. TTT diagrams of 6.2.4.6, B-CEZ and 10.2.3 The comparison of these diagrams (Figure 6) brings out similarities and differencies in precipitation kinetics of these alloys. Every Time-Temperature-Transformation curve shows the same characteristic C-shape

C1-102 JOURNAL DE PHYSIQUE IV
which results from a competition between nucleation and growth rates at reaction temperature. Moreover, we observe several C-shaped transformation curves associated with various reaction products.
0
Figure 6: TTT diagrams of 6.2.4.6, A-CEZ and 10.2.3 from electrical resistivity data
Table?: A-transus and nose tenlperaturrs ( K)
For the three alloys. the nose of the curve appearing at higher temperature, namely the first C-curve, is located at about TB-170 K (Table 2). The second nose, which corresponds for each alloy to the minimum time required to form a-phase is at almost TO-260 K. Apparently, for these two C-curves, alloying elements have no noticeable effect upon relative nose temperature, but they do upon B-transus temperature. As might be expected, increasing 0-stabilizers contents decreases in the same way the transus temperature and the upper noses of the ?TT curves. In addition, the two C-curves do not completely show the same relative position against time and the C-shapes are more or less sharp depending on the chemical composition. Thus, each isothermal decomposition product of B corresponds to a separate C-curve in the TIT diagrams. The two nose times increase successively for 6.2.4.6, B-CEZ and 10.2.3, indicating 10.2.3 is the most B-stabilized alloy, according to the relative amounts of Mo-eq (Table 1).
At low temperature, different kinds of B transformation schemes occur according to alloy composition : for B-CEZ, two C-curves can be distinctly observed on the TTT diagram (their nose temperatures are located approximatively at 723 K and 623 K, respectively TO-440 K and TO-540 K) whereas for 10.2.3 a single C-curve appears (nose temperature around the absolute temperature 723 K or TO-350 K). However, there's also evidence from kinetics data (see $4.1) that two separate C-curves can be found. Their nose temperatures would also be situated near 723 K (TB-350 K) and 623 K (TO-450 K). These curves are respectively called the third and the fourth C-curve. For 6.2.4.6, the Ms temperature has been determined at around 823 K by X-Ray Diffraction.
Thus, in this temperature range (between 573 and 773 K), nose temperatures and C-shapes are similar for B-CEZ and 10.2.3, when absolute temperatures are considered ; at higher temperature, they are equivalent when relative temperature are taken into account. Indeed, at high temperature, the limiting factor of the transformation rate is the nucleation and it has been assumed that the nucleation rate depends directly on the degree of undercooling (TB-T). On the contrary, at low temperature, the kinetics of precipitation is mainly governed by the growth rate which varies with absolute temperature 151.
alloys 6.2.4.6 B-CEZ 10.2.3
TB 1213 1163 1073
Tnose2 953 873 813
Tnosel 1053 993 893
TO-Tnose2 260 290 260
TO-Tnosel 1 60 170 1 80

3.3 Microstructural observations
The morphologies of B-decomposition products were observed on 6.2.4.6, B-CEZ and 10.2.3 at the end of isothermal transformation (every 50 K), when resistivity variations reach their equilibrium values.
Moreover, the sequence of a-phase precipitation was followed in more details for B-CEZ; these observations at the very early stage of transformation are particularly interesting as they show the preferential nucleation sites for each C-curve.
Figure 7a shows the beginning of a-phase precipitation at 1073 K, for B-CEIZ alloy. The nucleation sites are limited to grain boundary surfaces. The a-phase precipitation occurs along the boundaries, in continuous layers, or allotriomorph shapes (61, depending on the orientation relationships between the boundaries and the adjoining grains. After nucleation site saturation, a-phase grows in lath-shape. This results in large colonies of a-plates.
Figure 7a: A-CEZ (1073 K 1 12min), BSE Figure 7h: A-CEZ (1073 K I 5h), BSE
At the end of transformation (figure 7b), these colonies have reached the center of the grain and meet each other, so the grain is entirely filled with large a-plates. The morphology of a-phase at the end of transformation is very similar for the three alloys. So, we suppose the transformation scheme and the first C-curves are similar.
3.3.2 In the second C-curve tmnsfomzutionjield
When temperature decreases, the number of nucleation sites increases. Thus, in the second C-curve, a- phase nucleates not only on grain boundaries but also in many intragranular sites (figure 8a). These nucleation sites seem to be homogeneously distributed within the R-grain. Consequently, the number of plate orientations in a grain is not limited by the boundary orientations, and can reach twelve according to the Burgers relationships. The thinness of a-plates gives them a black appearence in Optical Microscopy, so they were called "black platesV[7]. During the precipitation, a-plates grow and cover the B-grain. The final morphology in Scanning Electron Microscopy is shown Figure 8b.
Figure 8a: 8-CEZ (873 K I Imin), OM Figure 86: A-CEZ (873 K / 2h), SE

C1-104 JOURNAL DE PHYSIQUE IV
Depending on their orientation, we can observe either very thin or quite large plates. These must be the same plates with a "sheet " morphology appearing large when cut widthwise. In this temperahwe range, the final structures of 6.2.4.6, R-CEZ and 10.2.3 are strictly the same, indicating that alloying composition doesn't play an important part. Thus, the first and the second C-curves are equivalent for the three alloys insofar as the transformation products are similar. At lower temperature, the comparison between the alloys is more complex.
3.3.3 The martensitic transfornation in 6.2.4.6 alloy
For 6.2.4.6, the water-quenched specimen shows a martensitic structure. This is not the case for 8-CEZ and 10.2.3 where a stabilized metastable R-phase is observed. 6.2.4.6 martensite has a lath-morphology, as it can be seen in Optical Microscopy (Figure 9a). At greater magnification (TEM), it appears that the mar- tensite lath is twinned (Figure 9b). Furthermore, X-Ray diffraction analysis shows that 6.2.4.6 martensite has an orthorhombic a" structure with the following parameters in the water quenched conditions:
a = 3.00& b = 4.94A, c = 4.67A.
Figure 9a: 6.2.4.6 (1217 K/lh+WQ), OM
The <001> a" electron diffraction pattern is presented in Figure 9b. Indeed, this zone axis is parallel to <110> R with a 7% contraction along [loo] B /I [loo] a", and a 7% dilatation along [Oil] B I/ [010] a" [a]. Thus, the ratio of the subsequent distances on the diffraction pattern is around 1,6 for a"-phase whereas it's equal to 42 for R-phase. Moreover, the Ms temperature was determined near 823 K from X-ray diffraction data on isothermally treated specimens--
low temperature, isothermal phase Figure 9b: 6.2.4.6 (1243 K130min+120 Kls), TEM
transformation can be observed in 8 - C E and 10.2.3, Brightfield md Dihction Pattern
corresponding to the third and fourth C-curves described above.
3.3.4 In the third C-curve transfonnation$eld
In this transformation field, the diffusion rate is very low so the growth occurs preferentially along the dislocation networks and the grain boundaries (Figure 10a). This results in an heterogeneous distribution of precipitates at the early stage of the reaction. Very fine needles, hardly visible in Optical Microscopy, grow from these nucleation sites and fill the R-grain. However, some larger plates are discernable within the grain (Figure lob). Figure 10c shows also two sizes of dates observed in 10.2.3. The larger ones are more iumerous than for 8-CEZ. In both cases, larger plates have a light appearance in Figure 10a: R-CEZ (723 K l9min), OM Backscattered Electron Microscopy.
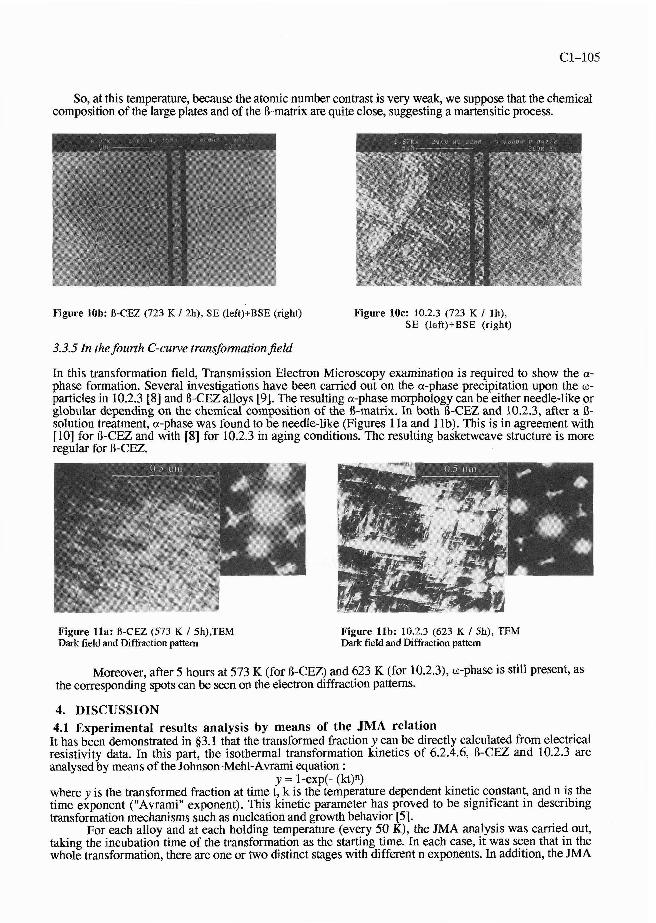
So, at this temperature, because the atomic number contrast is very weak, we suppose that the chemical composition of the large plates and of the R-matrix are quite close, suggesting a martensitic process.
Figure lob: 8-CEZ (723 K I 2h), SE (left)+BSE (right) Figure 10c: 10.2.3 (723 K I lh), SE (left)+BSE (right)
3.3.5 In the fourth C-curve trunsfomzutionjield
In this transformation field, Transmission Electron Microscopy examination is required to show the a- phase formation. Several investigations have been carried out on the a-phase precipitation upon the w- particles in 10.2.3 [8] and D-CEZ alloys [9]. The resulting a-phase morphology can be either needle-like or globular depending on the chemical composition of the R-matrix. In both R-CEZ and 10.2.3, after a R- solution treatment, a-phase was found to be needle-like (Figures 1 la and 1 Ib). This is in agreement with [lo] for D-CEZ and with [8] for 10.2.3 in aging conditions. The resulting basketweave structure is more regular for R-CEZ.
Figure llr: R-CEZ (573 K 1 Sh),TEM Dark field and Diffraction pattern
Figure l lb : 10.2.3 (623 K /5h), TEM Dark field and Diffraction pattern
Moreover, after 5 hours at 573 K (for B-CEZ) and 623 K (for 10.2.3), w-phase is still present, as the corresponding spots can be seen on the electron diffraction patterns.
4. 1)ISCUSSION 4.1 Experimental results analysis by means of the JMA relation
It has been demonstrated in $3.1 that the transformed fraction y can be directly calculated from electrical resistivity data. In this part, the isothermal transformation kinetics of 6.2.4.6, R-CEZ and 10.2.3 are analvsed bv means of the Johnson-Mehl-Avrami euuation :
y = 1-exp(- (kt)") where y is the transformed fraction at time t, k is the temperature dependent kinetic constant, and n is the time exponent ("Avrami" exponent). This kinetic parameter has proved to be significant in describing transformation mechanisms such as nucleation and growth behavior [5].
For each alloy and at each holding temperature (every 50 K), the JMA analysis was carried out, taking the incubation time of the transformation as the starting time. In each case, it was seen that in the whole transformation, there are one or two distinct stages with different n exponents. In addition, the JMA

C1-106 JOURNAL DE PHYSIQUE IV
plots exhibit the same specific pattern (very similar values of n exponent, identical deviation from the slope or not) for every holding temperature corresponding to the same C-curve. Therefore, Figure 12 shows the JMA plots for only one holding temperature in each Ccurve temperature field for each alloy.
4.5 5.0 5,5 6,O 6.5 5 6 7 8 9 X X
Figure 12: Typical graphs of tnln [ l I (I-y )] agrunst In t
4.1. I In theJirsr C-curve temperature$eM (Figure 12a)
For 6.2.4.6 and O-CEZ, the rate curve strictly conforms to the JMA equation for the whole transformation with n = 1. For 10.2.3, the correlation is not as good and n = 1.3. At high temperature, it is known that the precipitation is governed by the nucleation. Furthermore, the value of n = 1 could signify that the controlling process is the nucleation on grain boundaries [ll] which constitute nuclei preexisting at the beginning of the transformation. This formal description verifies our microstructural observations ( 5 3.3) : for the three alloys, a-phase nucleates on grain boundaries and grows towards the inside of the 8-matrix.
4.1.2 In t k second C-curve temperature Jield (Figure 12b)
For the three alloys, the plot consists of two straight lines of slopes 1 to 1.5 until transformed fraction reaches approximatively 80%. The value of n decreases to 0.5 at the end of the transformation. Besides, the microstructures show that nucleation occurs very rapidly not only on grain boundaries but also on intragranular sites. So we can assume that nucleation is quite instantaneous and homogeneous. Thus, the limiting factor is the diffusion controlled growth of a fixed number of a-plates. According to the classical theory of kinetics, at the beginning of the transformation, when the solid solution is slightly supersaturated and the interaction between precipitates is quite low, the parabolic growth law applies : the rate of growth in each dimension is proportionnal to tIR. Moreover, Ham [I21 showed that if the particle shape does not change during growth, the volume increases proportionnally to t3". Thus, in this transformation field, the experimentally obtained slope of 1.5 corresponds to the diffusion controlled growth of a fixed number of precipitates process, the shape of a-plates remaining constant during growth. In the presence of precipitation impingement, the theory predicts that the rate curve decreases : it is experimentally observed for y > 0.8.
4.1.3 In the third C-curve ternperaturepeld (Figure 12c)
For R-CEZ and 10.2.3, the n value is around 1.5 during the whole transformation. So, the Avrami exponent is the same in the second and in the third C-curves, but here no saturation is revealed in the plots, although a high percentage of a-phase is reached at the end of the transformation. In this field, we suggest the temperature is low enough so that the formation of a-plates on matrix defects generates important stresses. These stresses orland the subsequent phase transformations (sympathetic or martensite nucleation) should induce an anomalous resistivity increase, insofar as they constitute lattice pertubations.
4.1.4 In t k fourth C-curve temperature field (Figure 12d)
The straight line deviates from n = 3 at the beginning of the transformation, to n less than 1 at the end. According to theory of kinetics, if nucleation sites are small enough, the controlling mechanism must be the interface reaction because of the limited area of the interface, and because the distance over which the diffusion is necessary tends to zero [5]. When particles grow sufficiently, diffusion becomes the limiting factor. The interface controlled growth model, in steady-state conditions, gives an Avrami exponent equal to 3. Thus, we suppose that wla-phase growth is controlled by the crossing of the Rlw interface at the beginning of the transformation. Then a-particles become so large that the predominant mechanism changes into the diffusion controlled growth process and the Avrami exponent diminishes to 1 or 0.5.
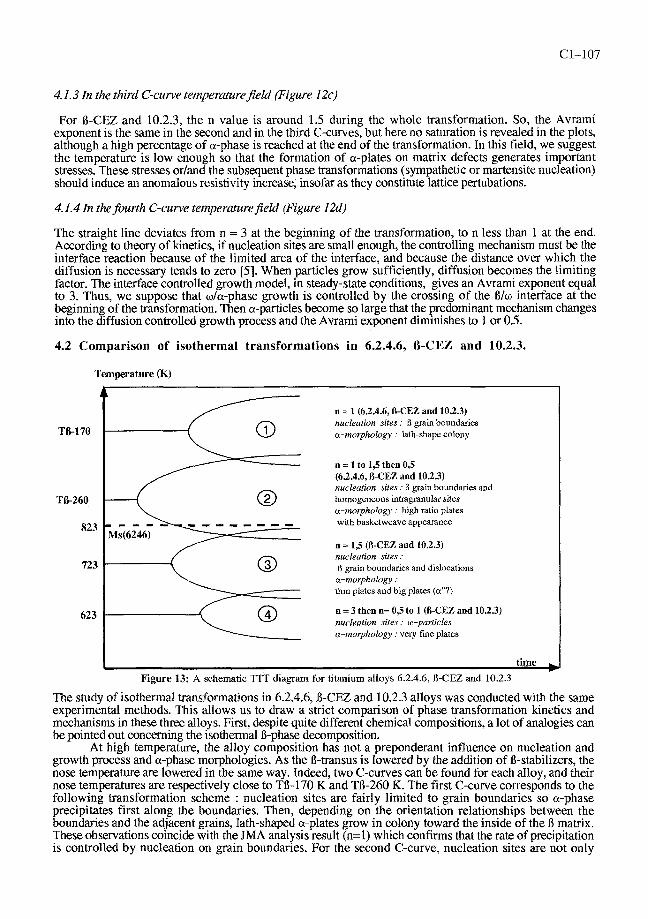
4.2 Comparison of isothermal transformations in 6.2.4.6, B-CEZ and 10.2.3.
Temperature (K)
n = 1 (62.4.6, R-CEZ and 102.3) nucleation sites : R grain boundaries a-morphology : lath-shape colony
n = I to 1,s then 0,s (63.4.6, I$-CEZ and 102.3) nuclealion sites : R p i n boundaries and hornogcnwus intragmnular sites a-morphology : high ratio plates with hasketweave appearance
n = 1,s (B-CEZ and 10.2.3) nucleution sites : I3 grain boundaries and dislocations a-morphology : thin plates and big plates (a"?)
n = 3 then n= 0,s to 1 (R-CEZ and 10.2.3) nucleation sites : w-panticles a-morphology .' vey fine plates
I time Figure 13: A schematic TIT diagram for titanium alloys 6.2.4.6, 13-CEZ and 10.2.3
The study of isothermal transformations in 6.2.4.6, R-CEZ and 10.2.3 alloys was conducted with the same experimental methods. This allows us to draw a strict comparison of phase transformation kinetics and mechanisms in these three alloys. First, despite quite different chemical compositions, a lot of analogies can be pointed out concerning the isothermal B-phase decomposition.
At high temperature, the alloy composition has not a preponderant influence on nucleation and growth process and a-phase morphologies. As the R-transus is lowered by the addition of B-stabilizers, the nose temperature are lowered in the same way. Indeed, two C-curves can be found for each alloy, and their nose temperatures are respectively close to TR-170 K and TB-260 K. The first C-curve corresponds to the following transformation scheme : nucleation sites are fairly limited to grain boundaries so a-phase precipitates first along the boundaries. Then, depending on the orientation relationships between the boundaries and the adjacent grains, lath-shaped a-plates grow in colony toward the inside of the B matrix. These observations coincide with the JMA analysis result (n=l) which confirms that the rate of precipitation is controlled by nucleation on grain boundaries. For the second C-curve, nucleation sites are not only
C1-108 JOURNAL DE PHYSIQUE IV
located on grain boundaries but are also homogeneously distributed in the matrix. Moreover. the shape of the growing a-particles is modified : the ratio length / width has increased and one width has become much smaller than the other. The Avrarni exponent being around 1.5 for the three alloys, the diffusion controlled growth is the effective process, assuming that the plate shape is invariant during growth. At the final stage of the transformation, n decreases because of the impingement effect. In this field, the resulting morphology is a basketweave feature.
On the contrary, at low temperatures, depending on alloying composition, significant differences can be noticed. The major difference lies in the fact that the martensite transformation occurs for 6.2.4.6 and not for the other alloys. The 6.2.4.6 martensite, namely a", is orthorhombic. The a"-plates are large and twinned compared to the a-plates in this temperature range. For both 6-CEZ and 10.2.3, similar isothermal transformation sequences are observed, corresponding to the third and fourth C-curves, although final microstructures are slightly different. In the third C-curve temperature field, nucleation occurs on crystal defects (grain boundaries, dislocations in the matrix, ...) and very fine a-plates result. Besides, some large plates, in greater number for 10.2.3 than for B-CEZ, are also observed. Their light appearance in BSE would mean that their chemical composition is close to the B-matrix one, but no evidence of martensitic transformation has been found yet. Nevertheless, internal stresses are likely to play an important part in phase transformation in this temperature range by induced martensitic transformation or sympathetic nucleation 1131. Indeed, the kinetic rate 1.5 is not lowered at the end of the transformation on the JMA plots. The fourth C-curve, obtained from electrical resistivity measurements, includes both B + a a t h -> B + and subsequent I3 + also -> B + a transformations : both make the resistivity simulta- neously increase and finally, the resulting equilibrium phase is only a-phase. In this transformation field, the Avrarni exponent equal to 3 is very different from those obtained at higher temperature; this coefficient, which corresponds to an interface controlled growth process, agrees with microstructural observations insofar as a-phase and a-phase are known to nucleate at the B/a interface on the extent cc-particles.
5. CONCLUSION
The isothermal phase transformations after a B-solution treatment were studied in the same way on three titanium alloys : 6.2.4.6, O-CEZ and 10.2.3. Continuous electrical resistivity measurements were proved to be very efficient to determine the phase transformations. The JMA analysis of the elecmcal resistivity data revealed unambiguously a number of modes of O-decomposition corresponding to particular types of a- phase precipitation, with own C-curves. According to the classical phase transformation theory, the resulting n values indicate different dominating processes. Finally, the morphologies of transformation products were directly observed in each transformation field and for each alloy. These results allow us to establish a synthetic TIT diagram for titanium alloys in this range of chemical composition.
This work was carried out within the framework of the Research Group "Relations Structures PropriCtCs des Alliages de Titane transformes a partir du domaine B" supported by CNRS, MRES, DRET-DGA, AEROSPATIALE, AIRFORGE, AUBERT et DUVAL, CEZUS, SEP, SNECMA and 'TTURBOMECA
References
[ l ] Gueret G. et al, J. Less-Common merals, 38 (1974) pp.3 1-5 1 [2] Sanguinetti R.& Gautier E., Beta titanium alloys, Paris, Ed. la Revue de MCtallurgie, 1994, pp.93-100 [3] Mekideche.A ,Debuigne J., Beta titanium alloys, Paris, Ed. la Revue de MCtallurgie, 1994, pp.lO1-107 [4] Newkirk J.B., Precipitation from solid solution (ASM, 1959) pp.104-107 [5] Burke J., The kinetics of phase transformation in metals (Pergamon Press, 1965) (61 Bechet J. et al, Titanium92 Science and Technology, San Diego, TMS.1993,1, pp. 643-650 [7] Menon E.S.K and Aaronson H.I. , Actu Met., 34 (1986), pp.1963-1973 [8] Campagnac M.H., Structure et proprittks mkaniques d'alliages de titane a bas transus (Technical note, ONERA, 1989) [9] Henri A., Relations microstructures-propriCtCs d'emploi dans l'alliage de titane B-CEZ (Thesis, ONERA, 1993) [lo] Lhermitte M., Contribution 2 I'Ctude des transformations structurales pendant le revenu de l'alliage de titane 8-CEZ (Technical note, CNAM, 1990) [1 1] Christian J.W., Transformations in Metals and alloys, Part 1 (Pergamon Press, 1975), pp. 528-531 [12] Ham F.S., J. Chem. Phys. of Solids, 6, (1958) p. 335 [13] Bechet J. and Bein S., Beta titanium alloys, Paris, Ed. la Revue de MCtallurgie, 1994, pp.83-91