Phase Noise Measurement Methods and Techniques · PDF filevariations in oscillators and other...
48
© 2012 Agilent Technologies Aerospace & Defense Symposium Phase Noise Measurement Methods and Techniques Presented by: Kay Gheen, Agilent Technologies
Transcript of Phase Noise Measurement Methods and Techniques · PDF filevariations in oscillators and other...

© 2012 Agilent Technologies
Aerospace & Defense Symposium
Phase Noise Measurement Methods and Techniques
Presented by: Kay Gheen, Agilent Technologies
© 2012 Agilent Technologies
Aerospace & Defense Symposium
2 © 2012 Agilent Technologies
Aerospace & Defense Symposium
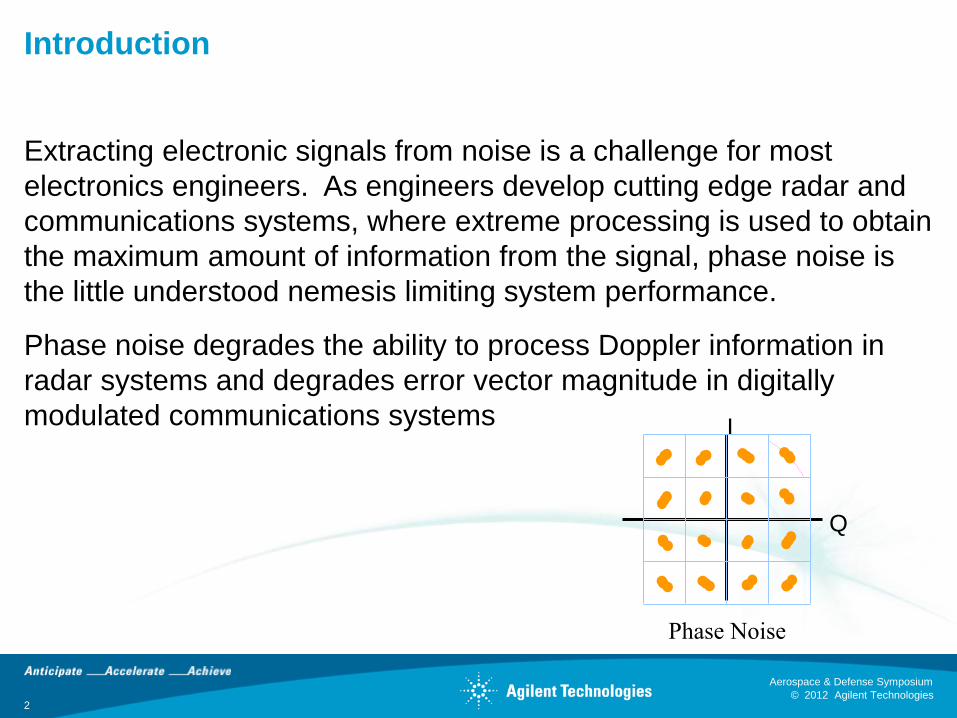
Introduction
Extracting electronic signals from noise is a challenge for most
electronics engineers. As engineers develop cutting edge radar and
communications systems, where extreme processing is used to obtain
the maximum amount of information from the signal, phase noise is
the little understood nemesis limiting system performance.
Phase noise degrades the ability to process Doppler information in
radar systems and degrades error vector magnitude in digitally
modulated communications systems
Q
I
Phase Noise

© 2012 Agilent Technologies
Aerospace & Defense Symposium
3 © 2012 Agilent Technologies
Aerospace & Defense Symposium
Phase Noise Measurements
Device
Characteristics
Information
Required
Noise
Fundamentals
Ease
of
Use

© 2012 Agilent Technologies
Aerospace & Defense Symposium
4 © 2012 Agilent Technologies
Aerospace & Defense Symposium
Phase Noise Measurements
Information
Required
Noise
Fundamentals
Ease
of
Use
Measurement Solution
"A"
Measurement
Solution
"B" M
easu
rem
ent
Solu
tion
"C"

© 2012 Agilent Technologies
Aerospace & Defense Symposium
5 © 2012 Agilent Technologies
Aerospace & Defense Symposium
Agenda
• What is phase noise?
• Phase noise measurement techniques
– Direct phase noise measurement (with a spectrum
analyzer)
– Phase detector techniques
– Two-channel cross correlation method
• Agilent E5500 Phase Noise Measurement System
• Comparison of Agilent Phase Noise Measurement Solutions
• Summary
• Bibliography
© 2012 Agilent Technologies
Aerospace & Defense Symposium
6 © 2012 Agilent Technologies
Aerospace & Defense Symposium
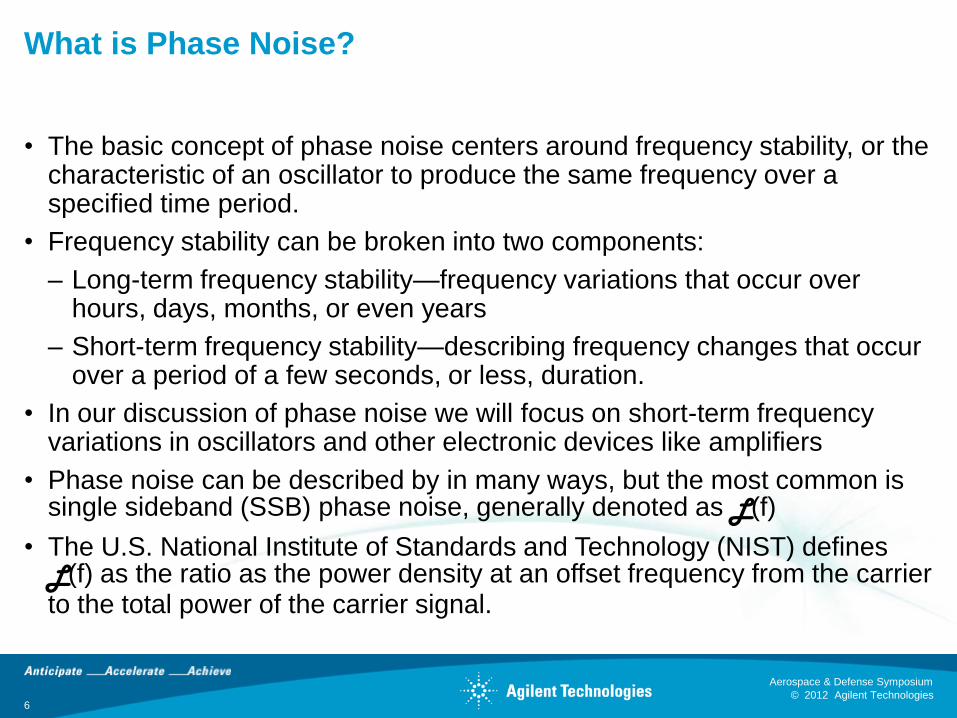
What is Phase Noise?
• The basic concept of phase noise centers around frequency stability, or the characteristic of an oscillator to produce the same frequency over a specified time period.
• Frequency stability can be broken into two components:
– Long-term frequency stability—frequency variations that occur over hours, days, months, or even years
– Short-term frequency stability—describing frequency changes that occur over a period of a few seconds, or less, duration.
• In our discussion of phase noise we will focus on short-term frequency variations in oscillators and other electronic devices like amplifiers
• Phase noise can be described by in many ways, but the most common is single sideband (SSB) phase noise, generally denoted as L(f)
• The U.S. National Institute of Standards and Technology (NIST) defines L(f) as the ratio as the power density at an offset frequency from the carrier to the total power of the carrier signal.

© 2012 Agilent Technologies
Aerospace & Defense Symposium
Ideal Signal Real-World Signal
What is Phase Noise?
)()( tSinAtV oo
Where:
A o = nominal amplitude
ωo = nominal frequency
4
2
4
V (t)
)()()()( ttSintEAtV oo
Where:
E(t) = random amplitude changes
Φ(t) = random phase changes
4
2
4
V (t)
E(t)
(t)
© 2012 Agilent Technologies
Aerospace & Defense Symposium
8 © 2012 Agilent Technologies
Aerospace & Defense Symposium
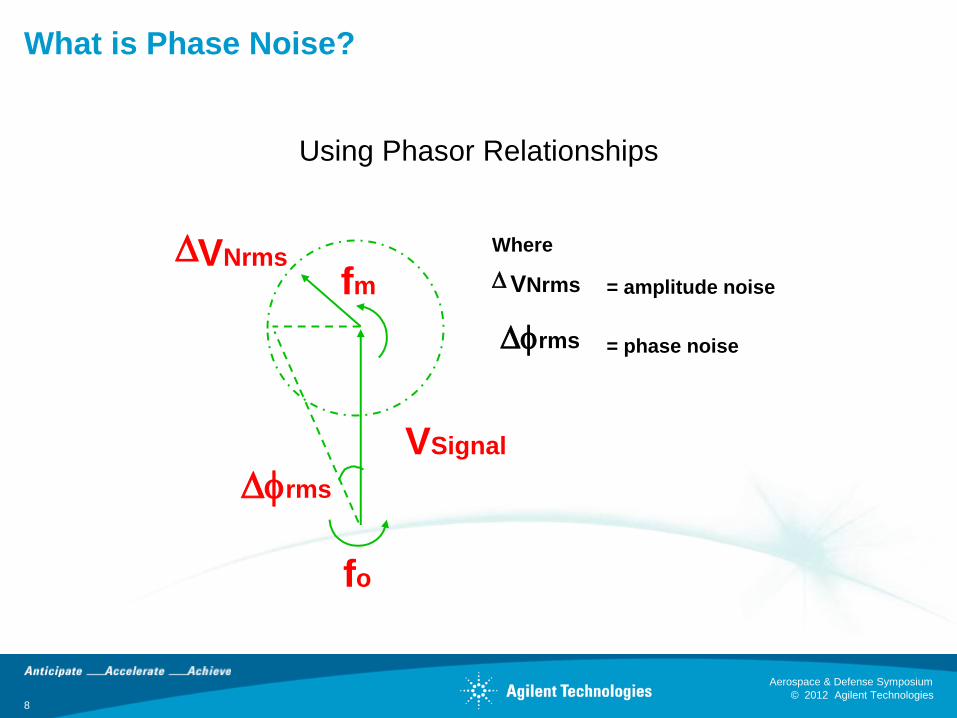
What is Phase Noise?
Using Phasor Relationships
fm
fo
rms
VSignal
VNrms Where
= amplitude noise
= phase noise rms
VNrms

© 2012 Agilent Technologies
Aerospace & Defense Symposium
9 © 2012 Agilent Technologies
Aerospace & Defense Symposium
What is Phase Noise?
Unit of measure
• Usually single sideband phase noise is denoted as L(f)
• L(f) —defined as single sideband power due to phase fluctuations
referenced to total power
– In a 1 Hz bandwidth at a frequency f Hz from the carrier
– Divided by the signal’s total power
– L(f) has units of dBc/Hz
– L(f) is plotted using log frequency
FREQUENCY
AMPLITUDE
1 Hz
f 0 f 0 + fm
LOG A
LOG f
L(f)
curve under the area Total
bandwidth Hz 1 of Area L(f)

© 2012 Agilent Technologies
Aerospace & Defense Symposium
10 © 2012 Agilent Technologies
Aerospace & Defense Symposium
Direct Phase Noise with a Spectrum Analyzer
Noise power in a 1 Hz bandwidth
Total signal power
Ps (dBm)
Pn (dBm/Hz)
1 Hz bandwidth,
generally normalized
to 1 Hz
L(f) = Pn (dBm/Hz) - Ps (dBm)
L(f) =

© 2012 Agilent Technologies
Aerospace & Defense Symposium
11 © 2012 Agilent Technologies
Aerospace & Defense Symposium
Thermal Noise or Johnson Noise
Np = KTB
K = Boltzman’s constant T = Temperature (K) B = Bandwidth (Hz)
For T = 290K Hz
dBm
Hz
WattsdBNp 174
)(204
© 2012 Agilent Technologies
Aerospace & Defense Symposium
12 © 2012 Agilent Technologies
Aerospace & Defense Symposium
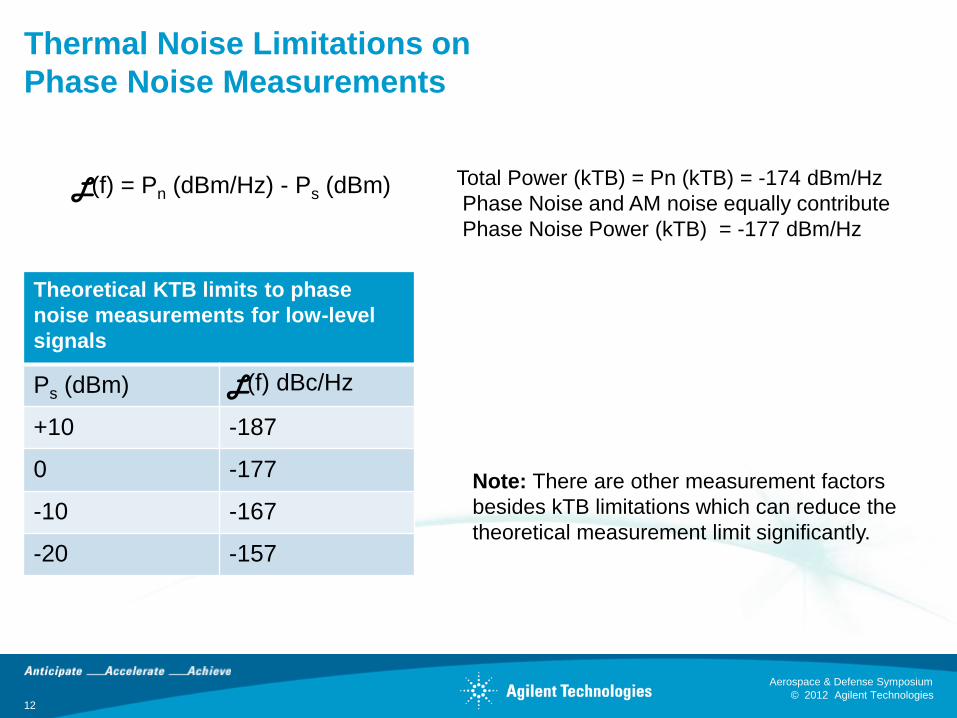
Thermal Noise Limitations on
Phase Noise Measurements
L(f) = Pn (dBm/Hz) - Ps (dBm) Total Power (kTB) = Pn (kTB) = -174 dBm/Hz
Phase Noise and AM noise equally contribute
Phase Noise Power (kTB) = -177 dBm/Hz
Note: There are other measurement factors
besides kTB limitations which can reduce the
theoretical measurement limit significantly.
Theoretical KTB limits to phase
noise measurements for low-level
signals
Ps (dBm) L(f) dBc/Hz
+10 -187
0 -177
-10 -167
-20 -157
© 2012 Agilent Technologies
Aerospace & Defense Symposium
13 © 2012 Agilent Technologies
Aerospace & Defense Symposium
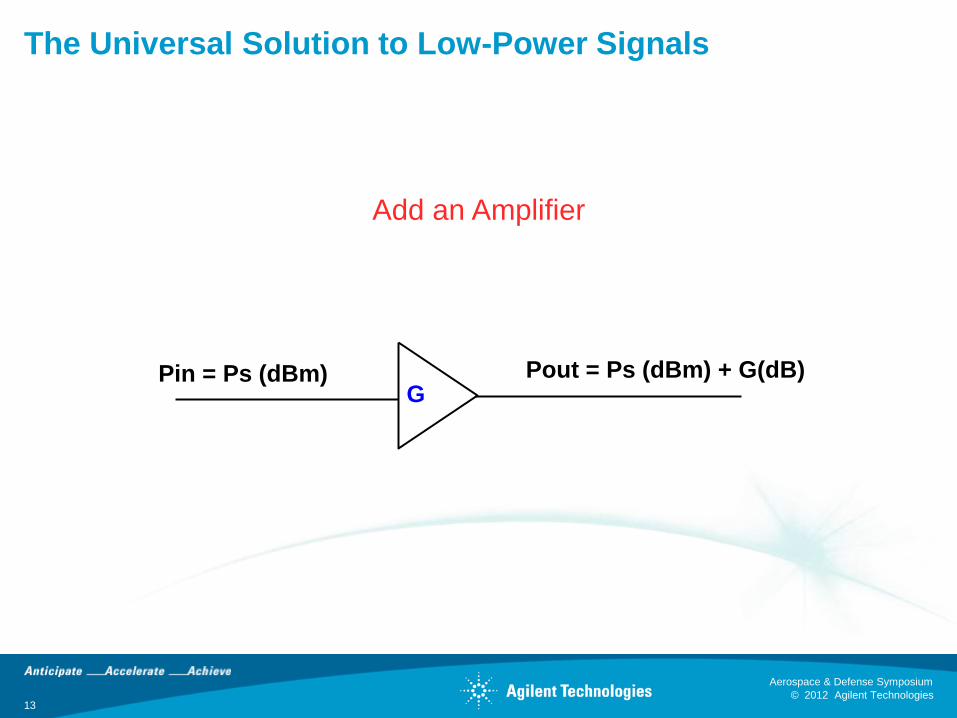
The Universal Solution to Low-Power Signals
Add an Amplifier
G Pin = Ps (dBm) Pout = Ps (dBm) + G(dB)

© 2012 Agilent Technologies
Aerospace & Defense Symposium
14 © 2012 Agilent Technologies
Aerospace & Defense Symposium
The Universal Solution to Low-Power Signals
Add an Amplifier
G Pin = Ps (dBm) Pout = Ps (dBm) + G(dB) + Na(dB)

© 2012 Agilent Technologies
Aerospace & Defense Symposium
15 © 2012 Agilent Technologies
Aerospace & Defense Symposium
Amplifier Noise Figure
S
N
S
N in out
KTout
in
NS
NSF
290)/(
)/(
What does noise figure
have to do with phase noise?

© 2012 Agilent Technologies
Aerospace & Defense Symposium
16 © 2012 Agilent Technologies
Aerospace & Defense Symposium
Amplifier Noise
KTB Nout F,G
Vnrms = RFGKTB
+
FKTB
Ps Nout = FGKTB G
B B f0-fm
ΔΦrms1
F0+fm
ΔΦrms2
f0
GRPV srmss )(
© 2012 Agilent Technologies
Aerospace & Defense Symposium
17 © 2012 Agilent Technologies
Aerospace & Defense Symposium
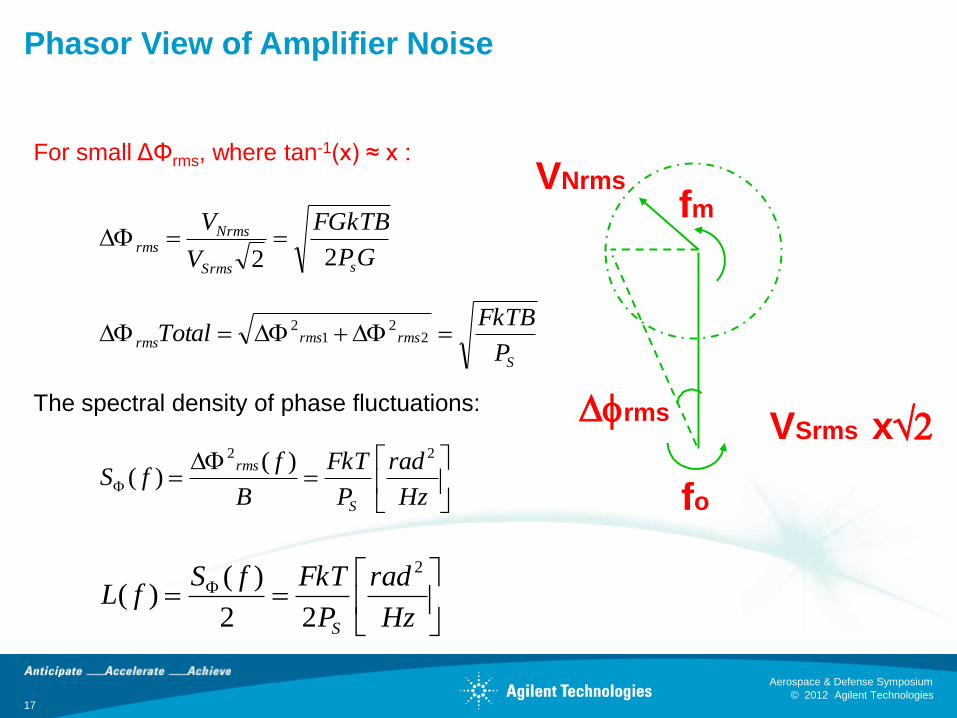
Phasor View of Amplifier Noise
VNrms fm
fo
rms VSrms x
For small ΔΦrms, where tan-1(x) ≈ x :
GP
FGkTB
V
V
sSrms
Nrmsrms
22
S
rmsrmsrmsP
FkTBTotal 2
21
2
The spectral density of phase fluctuations:
Hz
rad
P
FkT
B
ffS
S
rms22 )(
)(
Hz
rad
P
FkTfSfL
S
2
22
)()(

© 2012 Agilent Technologies
Aerospace & Defense Symposium
18 © 2012 Agilent Technologies
Aerospace & Defense Symposium
Quantifying Phase Noise
Quantifying Phase Noise in Terms of Power Spectral Density
spectral
energy
frequency offset from carrier (Hz)
SΦ(f), Spectral density of phase fluctuations L(f), Single sideband phase noise relative to total signal power
Sν(f), Spectral density of frequency fluctuations
Sy(f), Spectral density of fractional frequency fluctuations

© 2012 Agilent Technologies
Aerospace & Defense Symposium
19 © 2012 Agilent Technologies
Aerospace & Defense Symposium
Quantifying Phase Noise
SΦ(f) or Spectral Density of Phase Fluctuations
frequency offset from carrier (Hz)
)( fS
Hz
rad 2
Demodulate phase modulated signal
with a phase detector (convert phase
fluctuations to voltage fluctuations)
Δvout = KΦΔΦin Where: KΦ = V/radian
Measure the voltage fluctuations on
a spectrum analyzer:
ΔVrms(f) = KΦΔΦrms(f)
Svrms(f) = the power spectral density of the
voltage fluctuations out of the phase
detector
Hz
rad
K
frmsS
BK
ffS vrms
2
22
2 )()()(
SΦ(f) can be expressed in dB relative to 1 radian
© 2012 Agilent Technologies
Aerospace & Defense Symposium
20 © 2012 Agilent Technologies
Aerospace & Defense Symposium
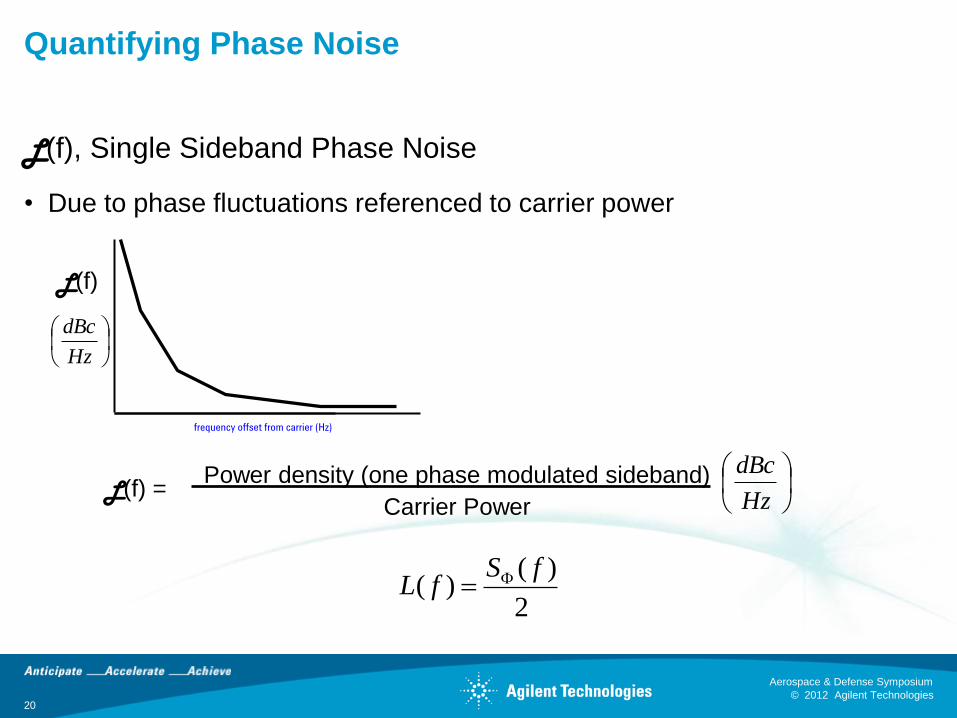
Quantifying Phase Noise
L(f), Single Sideband Phase Noise
• Due to phase fluctuations referenced to carrier power
frequency offset from carrier (Hz)
L(f)
Hz
dBc
L(f) = Power density (one phase modulated sideband)
Carrier Power
Hz
dBc
2
)()(
fSfL
© 2012 Agilent Technologies
Aerospace & Defense Symposium
21 © 2012 Agilent Technologies
Aerospace & Defense Symposium
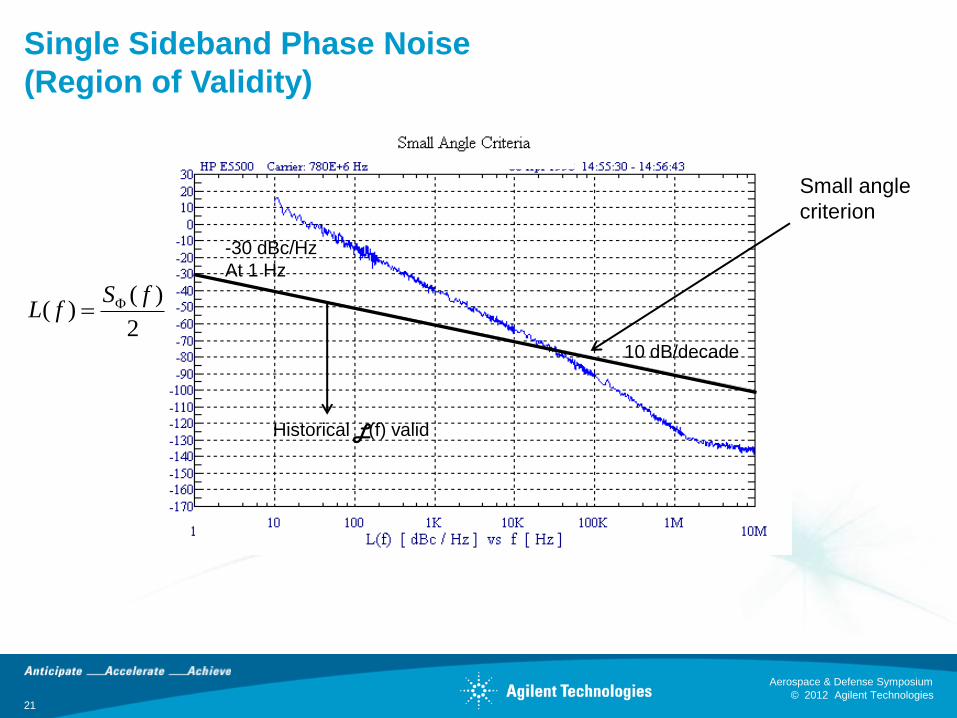
Single Sideband Phase Noise
(Region of Validity)
2
)()(
fSfL
-30 dBc/Hz
At 1 Hz
Historical L(f) valid
Small angle
criterion
10 dB/decade
© 2012 Agilent Technologies
Aerospace & Defense Symposium
22 © 2012 Agilent Technologies
Aerospace & Defense Symposium
Agenda
• What is phase noise?
• Phase noise measurement techniques
– Direct phase noise measurement (with a spectrum
analyzer)
– Phase detector techniques
– Two-channel cross correlation method
• Agilent E5500 Phase Noise Measurement System
• Comparison of Agilent Phase Noise Measurement Solutions
• Summary
• Bibliography
© 2012 Agilent Technologies
Aerospace & Defense Symposium
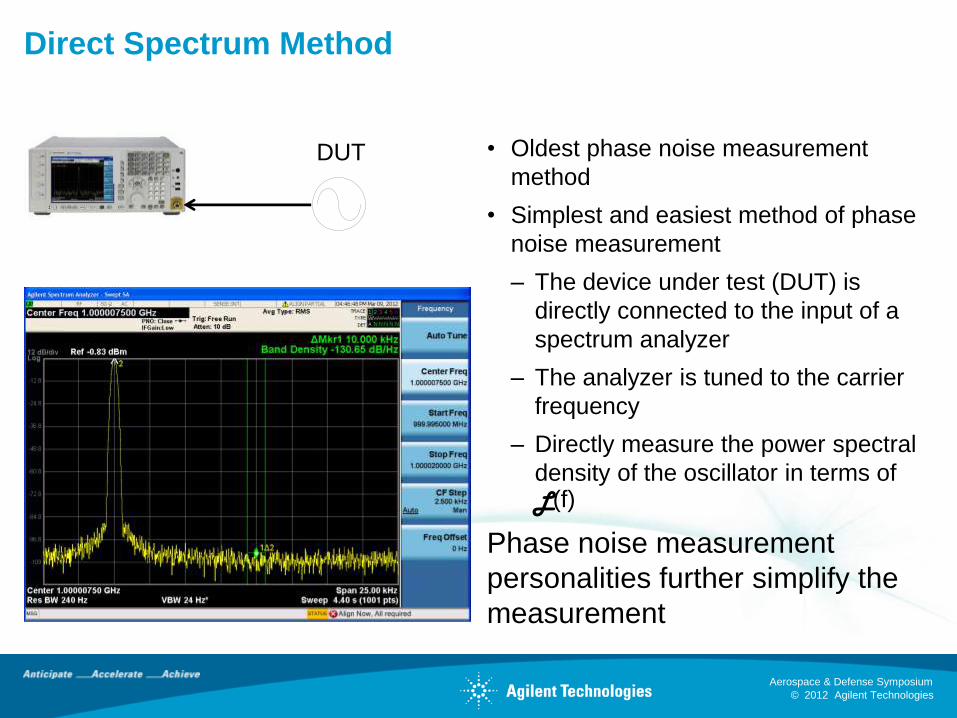
• Oldest phase noise measurement
method
• Simplest and easiest method of phase
noise measurement
– The device under test (DUT) is
directly connected to the input of a
spectrum analyzer
– The analyzer is tuned to the carrier
frequency
– Directly measure the power spectral
density of the oscillator in terms of L(f)
Phase noise measurement
personalities further simplify the
measurement
Direct Spectrum Method
DUT

© 2012 Agilent Technologies
Aerospace & Defense Symposium
24 © 2012 Agilent Technologies
Aerospace & Defense Symposium
Limitations of the Direct Spectrum Method
The following factors limit the accuracy of direct spectrum phase
noise measurements:
• IF (RBW) filter bandwidth, verses noise bandwidth
• IF filter type and shape factor
• Local oscillator stability—residual FM
• Local oscillator stability—noise sidebands
• Analyzer’s detector response to noise—peak detector introduces error
• Analyzer’s log amplifiers response to noise
• Noise floor of the analyzer

© 2012 Agilent Technologies
Aerospace & Defense Symposium
25 © 2012 Agilent Technologies
Aerospace & Defense Symposium
Agilent N9068A Phase Noise Measurement
Application for PXA, MXA, and EXA
• N9068A provides
a simple one-
button PN
measurement
• Can:
– Monitor a
spectrum
– Spot
measurement
verses time at
a single
frequency
– Log plot, as
shown here

© 2012 Agilent Technologies
Aerospace & Defense Symposium
26 © 2012 Agilent Technologies
Aerospace & Defense Symposium
N9068A Marker Functions
• Spurious Search:
– Next spur, next spur right, and next spur left
• Band Marker Functions:
– RMS integrated phase deviation in degrees
– RMS integrated phase deviation in radians
– RMS integrated jitter in seconds
– RMS integrated phase noise in dBc per marker bandwidth Hz
– Residual FM (frequency weighted integrated) in Hz
– RMS averaged phase noise density in dBc/Hz
• Delta Marker Scales:
– Absolute (+ x Hz)
– Octave slope (x 2x Hz)
– Decade slope (x 10x Hz)

© 2012 Agilent Technologies
Aerospace & Defense Symposium
Marker Function
N9068A Band Marker Functions
RMS integrated phase deviation in degree
Averaged Noise Density
Integrated (RMS) Noise
Degree
Marker Function
Residual FM (Weighted Integ)
More 1 of 2
Select Marker 1
Marker Function Off
Band Adjust
Estimated
to DSB

© 2012 Agilent Technologies
Aerospace & Defense Symposium
• Set up an Agilent PSG signal generator
for FM modulation, by selecting:
– FM path 1
– FM on
– FM deviation, as specified on next slide
– FM waveform to noise, uniform
• Ensure that noise of the PSG in FM off is
at least 10 dB less than the desired
calibrated noise at a desired offset
frequency, to ensure accuracy.
Calibrated Phase Noise
(Note: can be used with any test method)
Occasionally, it is desirable to have a calibrated phase noise signal that
can be used to verify the performance of a measurement setup. Here a
calibrated phase noise is generated with a constant slope of -20
dB/decade, by creating an FM signal modulated with uniform noise.
© 2012 Agilent Technologies
Aerospace & Defense Symposium
29 © 2012 Agilent Technologies
Aerospace & Defense Symposium
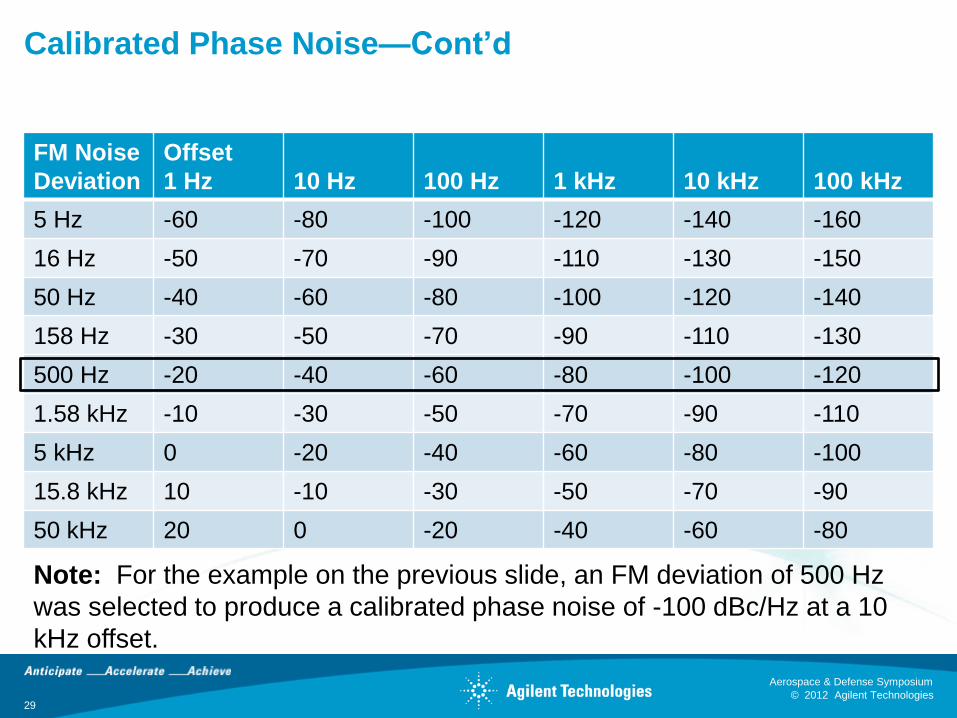
Calibrated Phase Noise—Cont’d
FM Noise
Deviation
Offset
1 Hz
10 Hz
100 Hz
1 kHz
10 kHz
100 kHz
5 Hz -60 -80 -100 -120 -140 -160
16 Hz -50 -70 -90 -110 -130 -150
50 Hz -40 -60 -80 -100 -120 -140
158 Hz -30 -50 -70 -90 -110 -130
500 Hz -20 -40 -60 -80 -100 -120
1.58 kHz -10 -30 -50 -70 -90 -110
5 kHz 0 -20 -40 -60 -80 -100
15.8 kHz 10 -10 -30 -50 -70 -90
50 kHz 20 0 -20 -40 -60 -80
Note: For the example on the previous slide, an FM deviation of 500 Hz
was selected to produce a calibrated phase noise of -100 dBc/Hz at a 10
kHz offset.

© 2012 Agilent Technologies
Aerospace & Defense Symposium
30 © 2012 Agilent Technologies
Aerospace & Defense Symposium
Agenda
• What is phase noise?
• Phase noise measurement techniques
– Direct phase noise measurement (with a spectrum
analyzer)
– Phase detector techniques
– Two-channel cross correlation method
• Agilent E5500 Phase Noise Measurement System
• Comparison of Agilent Phase Noise Measurement Solutions
• Summary
• Bibliography
© 2012 Agilent Technologies
Aerospace & Defense Symposium
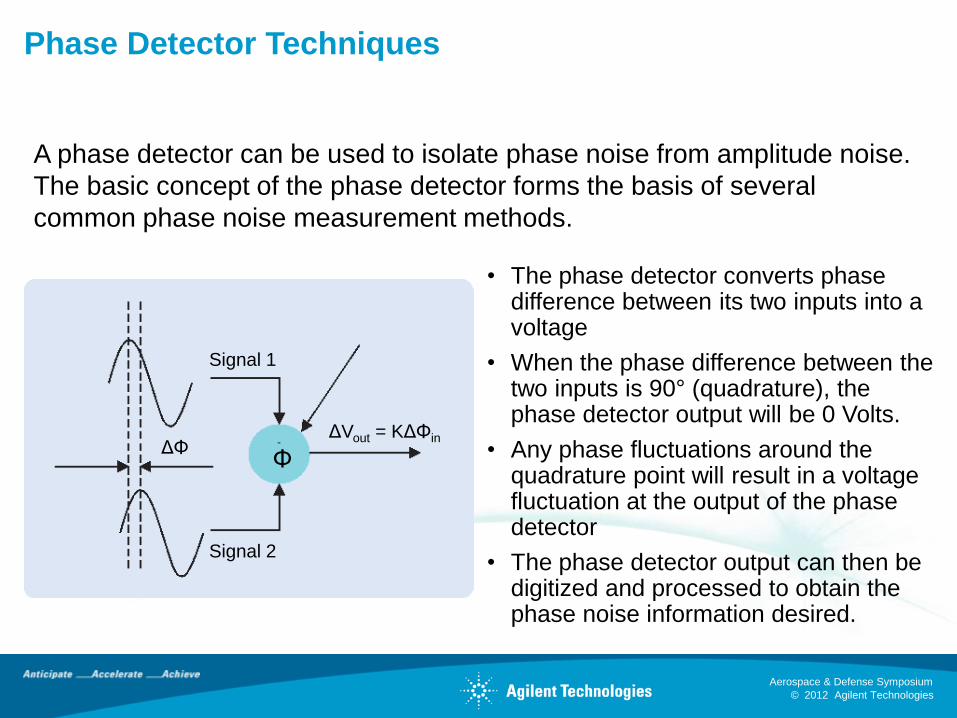
• The phase detector converts phase difference between its two inputs into a voltage
• When the phase difference between the two inputs is 90° (quadrature), the phase detector output will be 0 Volts.
• Any phase fluctuations around the quadrature point will result in a voltage fluctuation at the output of the phase detector
• The phase detector output can then be digitized and processed to obtain the phase noise information desired.
Phase Detector Techniques
Signal 1
Signal 2
ΔΦ Φ
ΔVout = KΔΦin
A phase detector can be used to isolate phase noise from amplitude noise.
The basic concept of the phase detector forms the basis of several
common phase noise measurement methods.
© 2012 Agilent Technologies
Aerospace & Defense Symposium
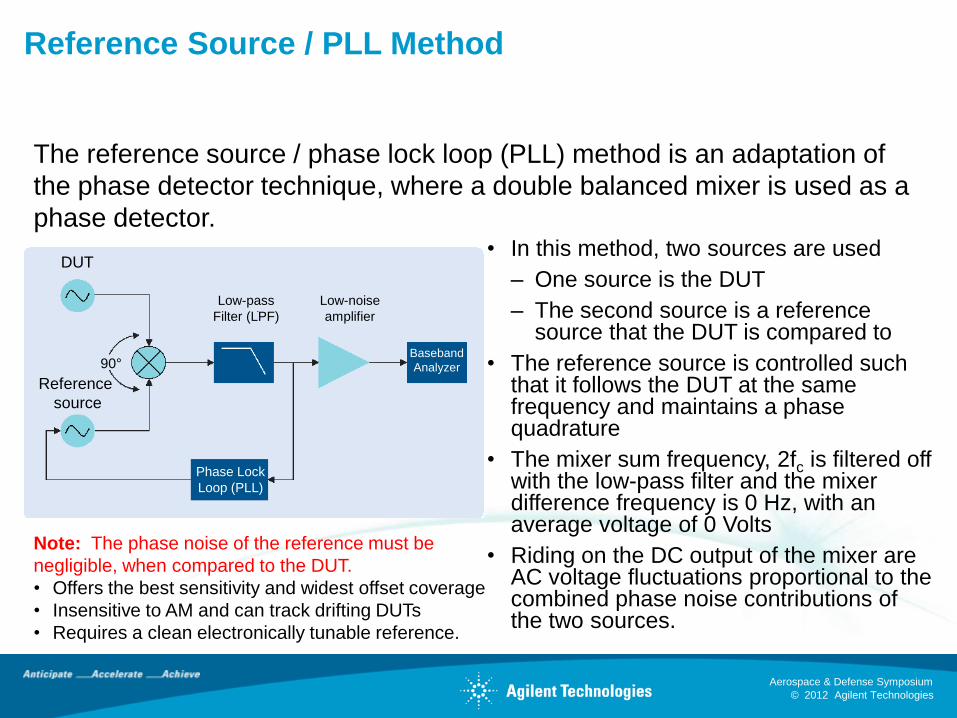
• In this method, two sources are used
– One source is the DUT
– The second source is a reference source that the DUT is compared to
• The reference source is controlled such that it follows the DUT at the same frequency and maintains a phase quadrature
• The mixer sum frequency, 2fc is filtered off with the low-pass filter and the mixer difference frequency is 0 Hz, with an average voltage of 0 Volts
• Riding on the DC output of the mixer are AC voltage fluctuations proportional to the combined phase noise contributions of the two sources.
Reference Source / PLL Method
DUT
Reference
source
90°
Phase Lock
Loop (PLL)
Low-pass
Filter (LPF)
Low-noise
amplifier
Baseband
Analyzer
The reference source / phase lock loop (PLL) method is an adaptation of
the phase detector technique, where a double balanced mixer is used as a
phase detector.
Note: The phase noise of the reference must be
negligible, when compared to the DUT.
• Offers the best sensitivity and widest offset coverage
• Insensitive to AM and can track drifting DUTs
• Requires a clean electronically tunable reference.

© 2012 Agilent Technologies
Aerospace & Defense Symposium
• Signal from the DUT is split into two paths
– The signal in one path is delayed relative to the other path
– The delay line converts frequency fluctuations into phase fluctuations
– The delay line or phase shifter is adjusted to put the inputs to the mixer in quadrature
– The phase detector converts phase fluctuations into voltage fluctuations which are analyzed on the baseband analyzer
Frequency Discriminator Method
The frequency discriminator method is another adaptation of the phase
detector technique, where the reference source has been eliminated and
the DUT signal is compared with a time delayed version of itself.
DUT
Low Pass Filter (LPF)
90 o
Low Noise
Amplifier (LNA)
Baseband Analyzer
Phase
detector (Mixer)
Phase shifter
Splitter
Delay line

© 2012 Agilent Technologies
Aerospace & Defense Symposium
34 © 2012 Agilent Technologies
Aerospace & Defense Symposium
Frequency Discriminator Method
• The analog delay-line discriminator degrades measurement sensitivity, at
close-in offset frequencies
• Is a very useful method when the DUT is a noisy source that has high-level
low-rate phase noise or high close-in spurious sideband conditions which
can limit performance of the phase detector PLL technique.
• Longer delay lines can improve sensitivity, the added insertion loss of the
longer delay can degrade signal to noise ratio and measurement sensitivity
• Longer delay lines also limit the maximum offset frequency that can be
measured.
• This is the best method for free-running sources, such as LC and cavity
oscillators.
© 2012 Agilent Technologies
Aerospace & Defense Symposium
35 © 2012 Agilent Technologies
Aerospace & Defense Symposium
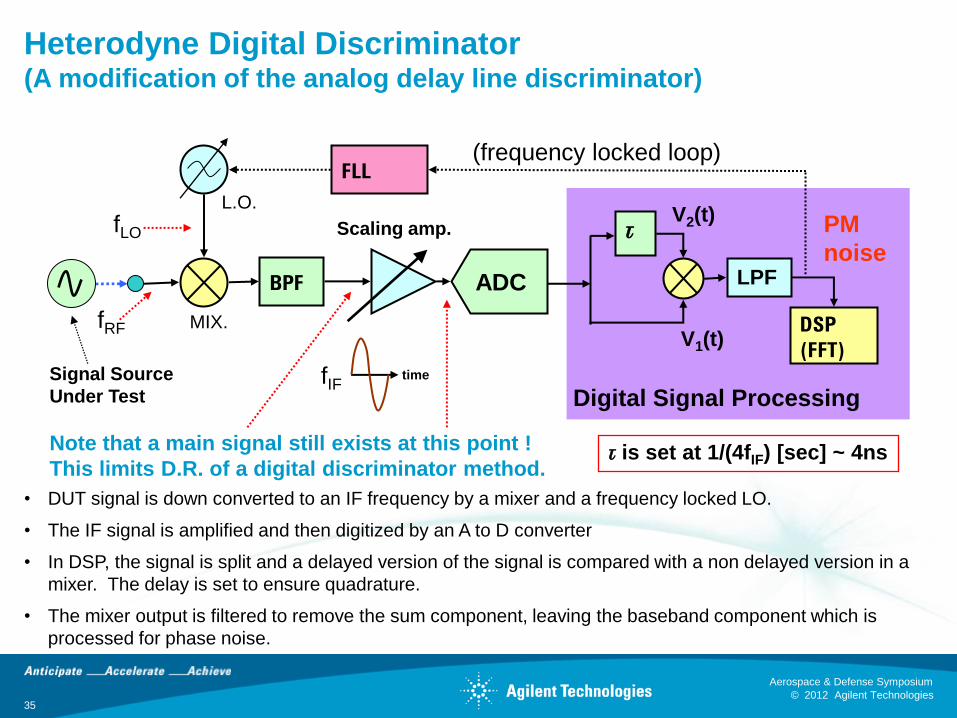
Heterodyne Digital Discriminator (A modification of the analog delay line discriminator)
• DUT signal is down converted to an IF frequency by a mixer and a frequency locked LO.
• The IF signal is amplified and then digitized by an A to D converter
• In DSP, the signal is split and a delayed version of the signal is compared with a non delayed version in a
mixer. The delay is set to ensure quadrature.
• The mixer output is filtered to remove the sum component, leaving the baseband component which is
processed for phase noise.
BPF
MIX.
FLL
L.O.
fRF
fLO
fIF Signal Source
Under Test
Scaling amp.
Note that a main signal still exists at this point !
This limits D.R. of a digital discriminator method.
(Frequency Locked Loop)
DSP
(FFT)
t
LPF
PM
noise
Digital Signal Processing
ADC
time
t is set at 1/(4fIF) [sec] ~ 4ns
V1(t)
V2(t)
(frequency locked loop)
© 2012 Agilent Technologies
Aerospace & Defense Symposium
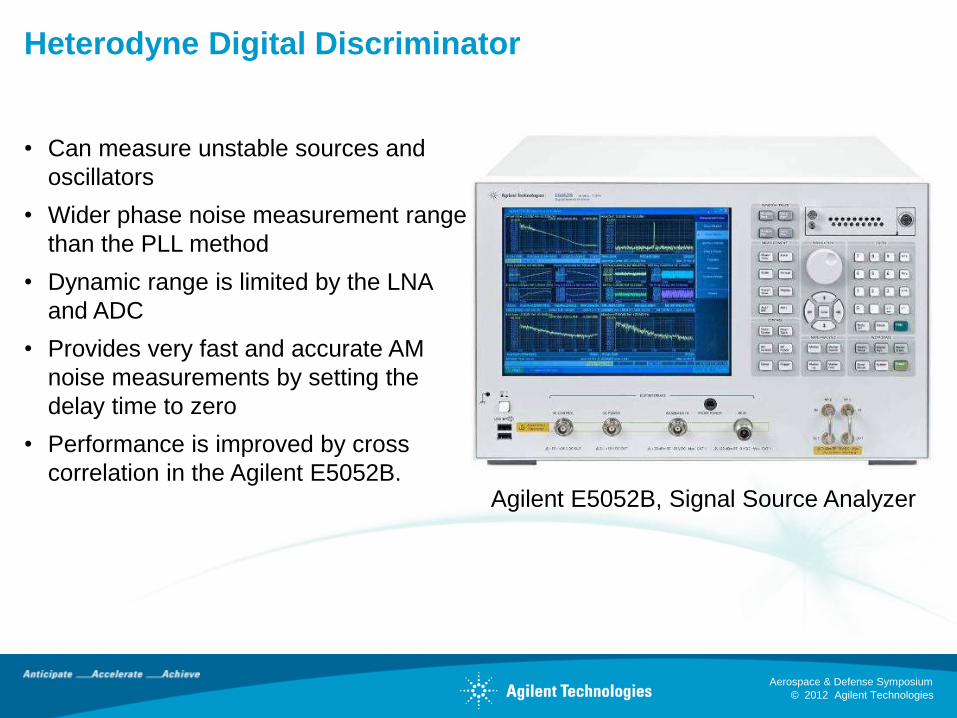
• Can measure unstable sources and
oscillators
• Wider phase noise measurement range
than the PLL method
• Dynamic range is limited by the LNA
and ADC
• Provides very fast and accurate AM
noise measurements by setting the
delay time to zero
• Performance is improved by cross
correlation in the Agilent E5052B.
Heterodyne Digital Discriminator
Agilent E5052B, Signal Source Analyzer

© 2012 Agilent Technologies
Aerospace & Defense Symposium
37 © 2012 Agilent Technologies
Aerospace & Defense Symposium
Agenda
• What is phase noise?
• Phase noise measurement techniques
– Direct phase noise measurement (with a spectrum
analyzer)
– Phase detector techniques
– Two-channel cross correlation method
• Agilent E5500 Phase Noise Measurement System
• Comparison of Agilent Phase Noise Measurement Solutions
• Summary
• Bibliography
© 2012 Agilent Technologies
Aerospace & Defense Symposium
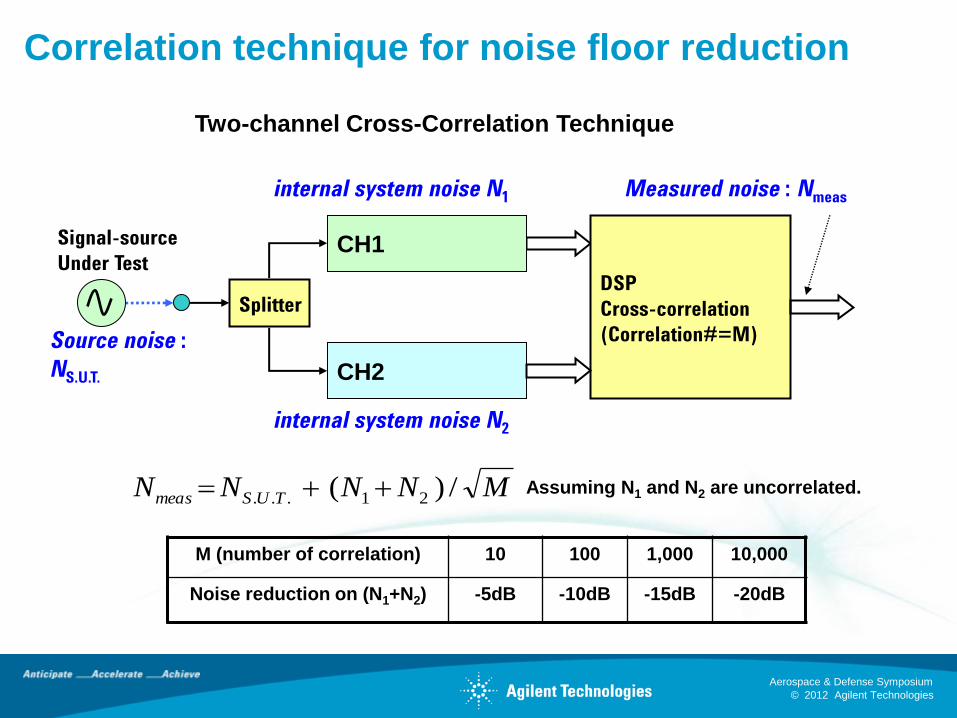
Correlation technique for noise floor reduction
MNNNN TUSmeas /)( 21...
M (number of correlation) 10 100 1,000 10,000
Noise reduction on (N1+N2) -5dB -10dB -15dB -20dB
Signal-source
Under Test DSP
Cross-correlation
(Correlation#=M)
Splitter
Measured noise : Nmeas
Two-channel Cross-Correlation Technique
CH1
CH2
internal system noise N1
internal system noise N2
Source noise :
NS.U.T.
Assuming N1 and N2 are uncorrelated.

© 2012 Agilent Technologies
Aerospace & Defense Symposium
39 © 2012 Agilent Technologies
Aerospace & Defense Symposium
Agilent E5052B Cross Correlation
• The Agilent E5052B incorporates
– A two-channel cross-correlation measurement system to reduce
measurement noise
– Can be configured as:
• Two-channel normal phase noise PLL system
• Two-channel Heterodyne Digital Discriminator system
• Provides excellent phase noise measurement performance for many
classes of sources and oscillators
• Is particularly well suited for free running oscillators
• Measurement speed suffers when the number of correlations becomes
large, limiting close-in phase noise measurement performance.
© 2012 Agilent Technologies
Aerospace & Defense Symposium
40 © 2012 Agilent Technologies
Aerospace & Defense Symposium
Agenda
• What is phase noise?
• Phase noise measurement techniques
– Direct phase noise measurement (with a spectrum
analyzer)
– Phase detector techniques
– Two-channel cross correlation method
• Agilent E5500 Phase Noise Measurement System
• Comparison of Agilent Phase Noise Measurement Solutions
• Summary
• Bibliography
© 2012 Agilent Technologies
Aerospace & Defense Symposium
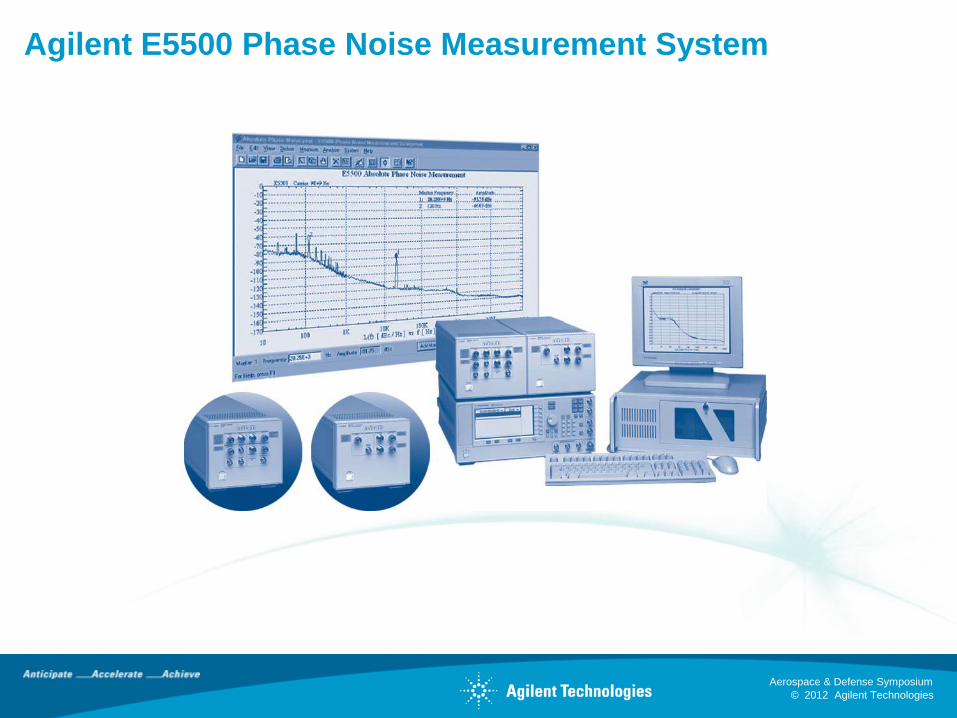
Agilent E5500 Phase Noise Measurement System
© 2012 Agilent Technologies
Aerospace & Defense Symposium
42 © 2012 Agilent Technologies
Aerospace & Defense Symposium
Agilent E5500 Phase Noise Measurement
System
• The E5500 system can be configured as:
– A phase detector system
– A reference source/PLL system
– A frequency discriminator system
– For residual phase noise measurements
– For pulsed phase noise measurements
• System is complex, but allows the most measurement flexibility and best
overall system performance

© 2012 Agilent Technologies
Aerospace & Defense Symposium
Agilent E5500 Phase Detector Sensitivity

© 2012 Agilent Technologies
Aerospace & Defense Symposium
44 © 2012 Agilent Technologies
Aerospace & Defense Symposium
Agenda
• What is phase noise?
• Phase noise measurement techniques
– Direct phase noise measurement (with a spectrum
analyzer)
– Phase detector techniques
– Two-channel cross correlation method
• Agilent E5500 Phase Noise Measurement System
• Comparison of Agilent Phase Noise Measurement Solutions
• Summary
• Bibliography
© 2012 Agilent Technologies
Aerospace & Defense Symposium
45 © 2012 Agilent Technologies
Aerospace & Defense Symposium
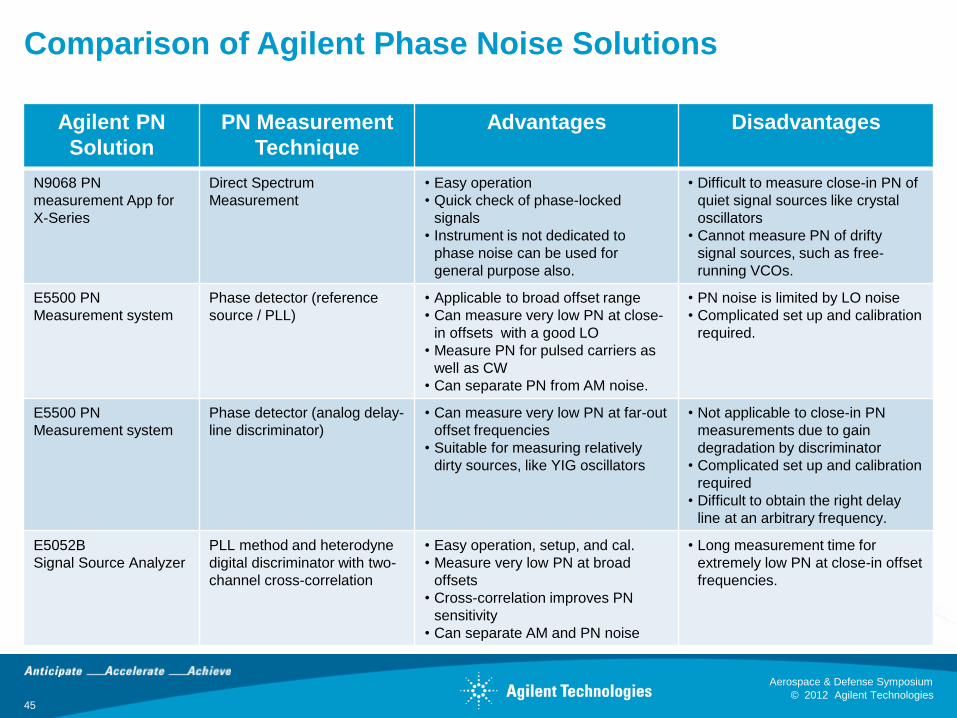
Comparison of Agilent Phase Noise Solutions
Agilent PN
Solution
PN Measurement
Technique
Advantages Disadvantages
N9068 PN
measurement App for
X-Series
Direct Spectrum
Measurement
• Easy operation
• Quick check of phase-locked
signals
• Instrument is not dedicated to
phase noise can be used for
general purpose also.
• Difficult to measure close-in PN of
quiet signal sources like crystal
oscillators
• Cannot measure PN of drifty
signal sources, such as free-
running VCOs.
E5500 PN
Measurement system
Phase detector (reference
source / PLL)
• Applicable to broad offset range
• Can measure very low PN at close-
in offsets with a good LO
• Measure PN for pulsed carriers as
well as CW
• Can separate PN from AM noise.
• PN noise is limited by LO noise
• Complicated set up and calibration
required.
E5500 PN
Measurement system
Phase detector (analog delay-
line discriminator)
• Can measure very low PN at far-out
offset frequencies
• Suitable for measuring relatively
dirty sources, like YIG oscillators
• Not applicable to close-in PN
measurements due to gain
degradation by discriminator
• Complicated set up and calibration
required
• Difficult to obtain the right delay
line at an arbitrary frequency.
E5052B
Signal Source Analyzer
PLL method and heterodyne
digital discriminator with two-
channel cross-correlation
• Easy operation, setup, and cal.
• Measure very low PN at broad
offsets
• Cross-correlation improves PN
sensitivity
• Can separate AM and PN noise
• Long measurement time for
extremely low PN at close-in offset
frequencies.

© 2012 Agilent Technologies
Aerospace & Defense Symposium
46 © 2012 Agilent Technologies
Aerospace & Defense Symposium
Phase Noise Comparison of Agilent Solutions
© 2012 Agilent Technologies
Aerospace & Defense Symposium
47 © 2012 Agilent Technologies
Aerospace & Defense Symposium
Summary
• With increased data requirements of today’s digital radios and improved
processing techniques of modern radar systems phase noise has taken on
added importance to RF and systems engineers
• Understanding phase noise and its sources can be complicated and a full-
time profession for some engineers
• Determining the best method of phase noise measurement can be
bewildering, but all common test solutions are well documented and Agilent
applications experts are available to assist and answer your questions
• In general, one solution does not fit all applications or all users
• Agilent provides a great breadth of phase noise measurement equipment
that is tailored to today’s demanding measurement requirements.
© 2012 Agilent Technologies
Aerospace & Defense Symposium
48 © 2012 Agilent Technologies
Aerospace & Defense Symposium
Bibliography – N9030A X-Series Signal Analyzer, data sheet, Lit. No. 5990-3952EN*
– Agilent Phase Noise Measurement Solutions, Lit. No. 5990-5729EN*
– Agilent N9068A/W9068A Phase Noise Measurement Application, Technical Overview, Lit. No. 5989-5354EN*
– Agilent E5500 Series Phase Noise Measurement Solutions, Configuration Guide, Lit. No. 5988-9889EN*
– Agilent E5500 Series Phase Noise Measurement Solutions, Product Overview, Lit. No. 5989-0851EN*
– Agilent PN E5500-1, Pulsed Carrier Phase Noise Measurements Using Agilent E5500 Series Solutions, Product Note, Lit. No. 5968-5662E*
– Agilent AN 1309, Pulsed Carrier Phase Noise Measurements, Application Note, Lit. No. 5968-2081E*
– Agilent E5052B Signal Source Analyzer; 10 MHz to 7 GHz, 26.5 GHz, or 110 GHz; Data Sheet; Lit. No. 5989-6388EN*
– Fast, Easy, and Accurate Microwave Phase Noise Measurements Using the Agilent E5052B and E5053A, Application Note, Lit. No. 5989-8373EN*
*To find online, simply add the lit number in the agilent.com search box