Phase diagram of Au Al Pd at 500 °C - Springer · ORIGINAL PAPER Phase diagram of Au–Al–Pd at...
7
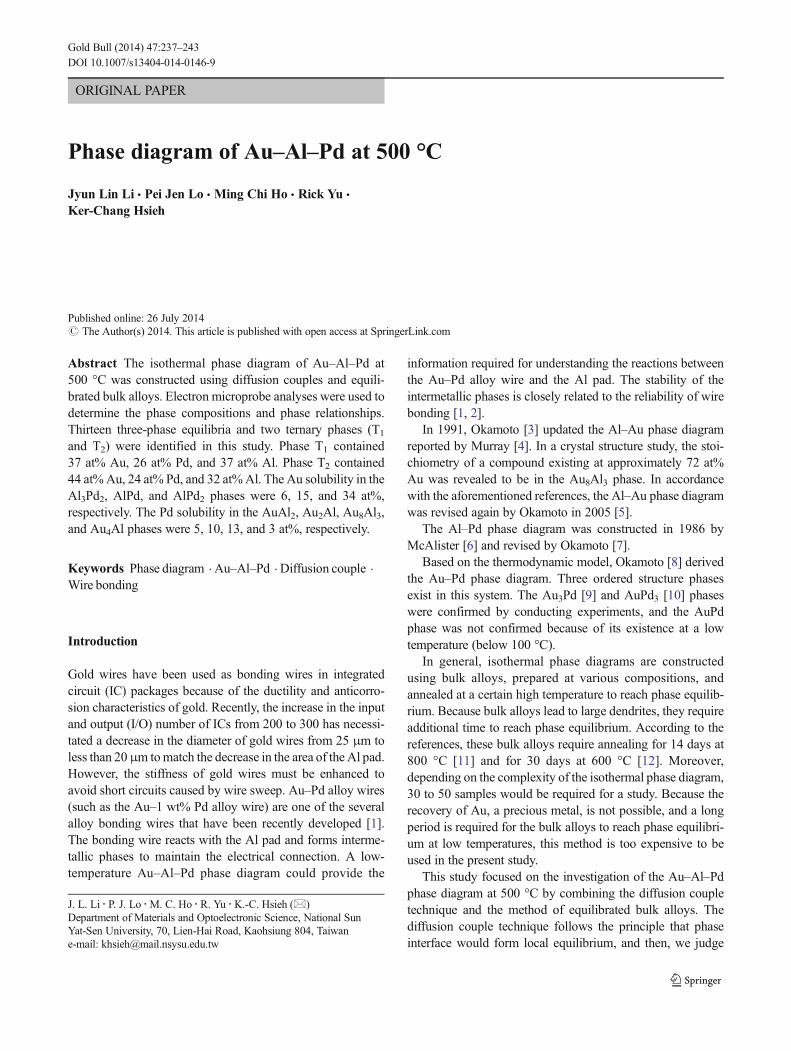
ORIGINAL PAPER Phase diagram of Au–Al–Pd at 500 °C Jyun Lin Li & Pei Jen Lo & Ming Chi Ho & Rick Yu & Ker-Chang Hsieh Published online: 26 July 2014 # The Author(s) 2014. This article is published with open access at SpringerLink.com Abstract The isothermal phase diagram of Au–Al–Pd at 500 °C was constructed using diffusion couples and equili- brated bulk alloys. Electron microprobe analyses were used to determine the phase compositions and phase relationships. Thirteen three-phase equilibria and two ternary phases (T 1 and T 2 ) were identified in this study. Phase T 1 contained 37 at% Au, 26 at% Pd, and 37 at% Al. Phase T 2 contained 44 at% Au, 24 at% Pd, and 32 at% Al. The Au solubility in the Al 3 Pd 2 , AlPd, and AlPd 2 phases were 6, 15, and 34 at%, respectively. The Pd solubility in the AuAl 2 , Au 2 Al, Au 8 Al 3 , and Au 4 Al phases were 5, 10, 13, and 3 at%, respectively. Keywords Phase diagram . Au–Al–Pd . Diffusion couple . Wire bonding Introduction Gold wires have been used as bonding wires in integrated circuit (IC) packages because of the ductility and anticorro- sion characteristics of gold. Recently, the increase in the input and output (I/O) number of ICs from 200 to 300 has necessi- tated a decrease in the diameter of gold wires from 25 μm to less than 20 μm to match the decrease in the area of the Al pad. However, the stiffness of gold wires must be enhanced to avoid short circuits caused by wire sweep. Au–Pd alloy wires (such as the Au–1 wt% Pd alloy wire) are one of the several alloy bonding wires that have been recently developed [1]. The bonding wire reacts with the Al pad and forms interme- tallic phases to maintain the electrical connection. A low- temperature Au–Al–Pd phase diagram could provide the information required for understanding the reactions between the Au–Pd alloy wire and the Al pad. The stability of the intermetallic phases is closely related to the reliability of wire bonding [1, 2]. In 1991, Okamoto [3] updated the Al–Au phase diagram reported by Murray [4]. In a crystal structure study, the stoi- chiometry of a compound existing at approximately 72 at% Au was revealed to be in the Au 8 Al 3 phase. In accordance with the aforementioned references, the Al–Au phase diagram was revised again by Okamoto in 2005 [5]. The Al–Pd phase diagram was constructed in 1986 by McAlister [6] and revised by Okamoto [7]. Based on the thermodynamic model, Okamoto [8] derived the Au–Pd phase diagram. Three ordered structure phases exist in this system. The Au 3 Pd [9] and AuPd 3 [10] phases were confirmed by conducting experiments, and the AuPd phase was not confirmed because of its existence at a low temperature (below 100 °C). In general, isothermal phase diagrams are constructed using bulk alloys, prepared at various compositions, and annealed at a certain high temperature to reach phase equilib- rium. Because bulk alloys lead to large dendrites, they require additional time to reach phase equilibrium. According to the references, these bulk alloys require annealing for 14 days at 800 °C [11] and for 30 days at 600 °C [12]. Moreover, depending on the complexity of the isothermal phase diagram, 30 to 50 samples would be required for a study. Because the recovery of Au, a precious metal, is not possible, and a long period is required for the bulk alloys to reach phase equilibri- um at low temperatures, this method is too expensive to be used in the present study. This study focused on the investigation of the Au–Al–Pd phase diagram at 500 °C by combining the diffusion couple technique and the method of equilibrated bulk alloys. The diffusion couple technique follows the principle that phase interface would form local equilibrium, and then, we judge J. L. Li : P. J. Lo : M. C. Ho : R. Yu : K.<C. Hsieh (*) Department of Materials and Optoelectronic Science, National Sun Yat-Sen University, 70, Lien-Hai Road, Kaohsiung 804, Taiwan e-mail: [email protected] Gold Bull (2014) 47:237–243 DOI 10.1007/s13404-014-0146-9
Transcript of Phase diagram of Au Al Pd at 500 °C - Springer · ORIGINAL PAPER Phase diagram of Au–Al–Pd at...
ORIGINAL PAPER
Phase diagram of Au–Al–Pd at 500 °C
Jyun Lin Li & Pei Jen Lo & Ming Chi Ho & Rick Yu &
Ker-Chang Hsieh
Published online: 26 July 2014# The Author(s) 2014. This article is published with open access at SpringerLink.com
Abstract The isothermal phase diagram of Au–Al–Pd at500 °C was constructed using diffusion couples and equili-brated bulk alloys. Electron microprobe analyses were used todetermine the phase compositions and phase relationships.Thirteen three-phase equilibria and two ternary phases (T1and T2) were identified in this study. Phase T1 contained37 at% Au, 26 at% Pd, and 37 at% Al. Phase T2 contained44 at%Au, 24 at% Pd, and 32 at%Al. The Au solubility in theAl3Pd2, AlPd, and AlPd2 phases were 6, 15, and 34 at%,respectively. The Pd solubility in the AuAl2, Au2Al, Au8Al3,and Au4Al phases were 5, 10, 13, and 3 at%, respectively.
Keywords Phase diagram . Au–Al–Pd . Diffusion couple .
Wire bonding
Introduction
Gold wires have been used as bonding wires in integratedcircuit (IC) packages because of the ductility and anticorro-sion characteristics of gold. Recently, the increase in the inputand output (I/O) number of ICs from 200 to 300 has necessi-tated a decrease in the diameter of gold wires from 25 μm toless than 20μm tomatch the decrease in the area of the Al pad.However, the stiffness of gold wires must be enhanced toavoid short circuits caused by wire sweep. Au–Pd alloy wires(such as the Au–1 wt% Pd alloy wire) are one of the severalalloy bonding wires that have been recently developed [1].The bonding wire reacts with the Al pad and forms interme-tallic phases to maintain the electrical connection. A low-temperature Au–Al–Pd phase diagram could provide the
information required for understanding the reactions betweenthe Au–Pd alloy wire and the Al pad. The stability of theintermetallic phases is closely related to the reliability of wirebonding [1, 2].
In 1991, Okamoto [3] updated the Al–Au phase diagramreported by Murray [4]. In a crystal structure study, the stoi-chiometry of a compound existing at approximately 72 at%Au was revealed to be in the Au8Al3 phase. In accordancewith the aforementioned references, the Al–Au phase diagramwas revised again by Okamoto in 2005 [5].
The Al–Pd phase diagram was constructed in 1986 byMcAlister [6] and revised by Okamoto [7].
Based on the thermodynamic model, Okamoto [8] derivedthe Au–Pd phase diagram. Three ordered structure phasesexist in this system. The Au3Pd [9] and AuPd3 [10] phaseswere confirmed by conducting experiments, and the AuPdphase was not confirmed because of its existence at a lowtemperature (below 100 °C).
In general, isothermal phase diagrams are constructedusing bulk alloys, prepared at various compositions, andannealed at a certain high temperature to reach phase equilib-rium. Because bulk alloys lead to large dendrites, they requireadditional time to reach phase equilibrium. According to thereferences, these bulk alloys require annealing for 14 days at800 °C [11] and for 30 days at 600 °C [12]. Moreover,depending on the complexity of the isothermal phase diagram,30 to 50 samples would be required for a study. Because therecovery of Au, a precious metal, is not possible, and a longperiod is required for the bulk alloys to reach phase equilibri-um at low temperatures, this method is too expensive to beused in the present study.
This study focused on the investigation of the Au–Al–Pdphase diagram at 500 °C by combining the diffusion coupletechnique and the method of equilibrated bulk alloys. Thediffusion couple technique follows the principle that phaseinterface would form local equilibrium, and then, we judge
J. L. Li : P. J. Lo :M. C. Ho :R. Yu :K.<C. Hsieh (*)Department of Materials and Optoelectronic Science, National SunYat-Sen University, 70, Lien-Hai Road, Kaohsiung 804, Taiwane-mail: [email protected]
Gold Bull (2014) 47:237–243DOI 10.1007/s13404-014-0146-9
these phases existing in each other when at the same temper-ature. This study also referenced the theoretical details of theresearch conducted by Kodentsov et al. [13].
Experimental procedures
The AuxPd100−x (x=10 to 80) and AuxPdyAl100−x−y alloyswere prepared by mini-arc melting pure Au, Pd, and Al in apure Ar atmosphere. The Au–Pd alloys were arc-melt underAr atmosphere and turned upside down for seven times andthen sucked into 2-mm-diameter copper mold. The ingotlength is between 15 and 20 mm. Au–Pd alloy forms a solidsolution, and the homogeneity was checked under the electronprobe microanalyzer (EPMA). Eight Au–Pd binary alloys(D1–D8) and seven Au–Al–Pd ternary alloys (A1–A7) wereprepared for this phase diagram study. The alloy compositionsare listed in Tables 1 and 2.
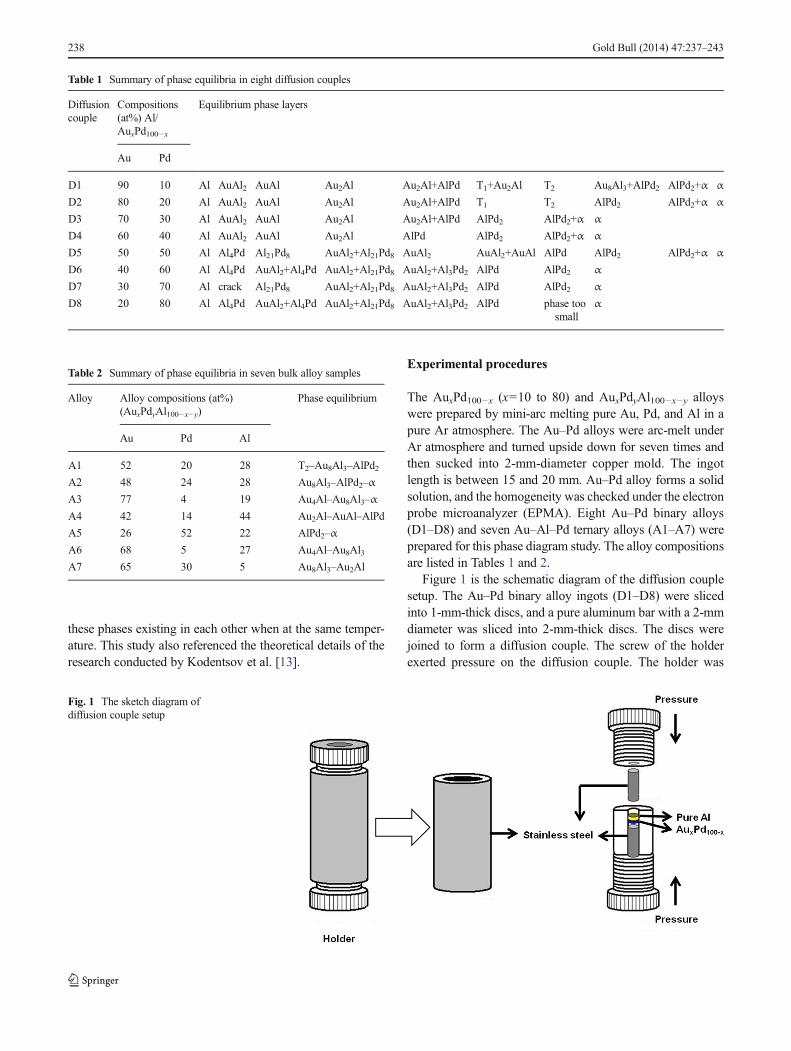
Figure 1 is the schematic diagram of the diffusion couplesetup. The Au–Pd binary alloy ingots (D1–D8) were slicedinto 1-mm-thick discs, and a pure aluminum bar with a 2-mmdiameter was sliced into 2-mm-thick discs. The discs werejoined to form a diffusion couple. The screw of the holderexerted pressure on the diffusion couple. The holder was
Table 1 Summary of phase equilibria in eight diffusion couples
Diffusioncouple
Compositions(at%) Al/AuxPd100−x
Equilibrium phase layers
Au Pd
D1 90 10 Al AuAl2 AuAl Au2Al Au2Al+AlPd T1+Au2Al T2 Au8Al3+AlPd2 AlPd2+α α
D2 80 20 Al AuAl2 AuAl Au2Al Au2Al+AlPd T1 T2 AlPd2 AlPd2+α α
D3 70 30 Al AuAl2 AuAl Au2Al Au2Al+AlPd AlPd2 AlPd2+α α
D4 60 40 Al AuAl2 AuAl Au2Al AlPd AlPd2 AlPd2+α α
D5 50 50 Al Al4Pd Al21Pd8 AuAl2+Al21Pd8 AuAl2 AuAl2+AuAl AlPd AlPd2 AlPd2+α α
D6 40 60 Al Al4Pd AuAl2+Al4Pd AuAl2+Al21Pd8 AuAl2+Al3Pd2 AlPd AlPd2 α
D7 30 70 Al crack Al21Pd8 AuAl2+Al21Pd8 AuAl2+Al3Pd2 AlPd AlPd2 α
D8 20 80 Al Al4Pd AuAl2+Al4Pd AuAl2+Al21Pd8 AuAl2+Al3Pd2 AlPd phase toosmall
α
Table 2 Summary of phase equilibria in seven bulk alloy samples
Alloy Alloy compositions (at%)(AuxPdyAl100−x−y)
Phase equilibrium
Au Pd Al
A1 52 20 28 T2–Au8Al3–AlPd2A2 48 24 28 Au8Al3–AlPd2–α
A3 77 4 19 Au4Al–Au8Al3–α
A4 42 14 44 Au2Al–AuAl–AlPd
A5 26 52 22 AlPd2–α
A6 68 5 27 Au4Al–Au8Al3A7 65 30 5 Au8Al3–Au2Al
Fig. 1 The sketch diagram ofdiffusion couple setup
238 Gold Bull (2014) 47:237–243

sealed in a quartz tube in which a vacuum was created andmaintained at 500 °C for 24 h; the quartz tube was thenquenched in ice water. The ternary alloys (A1–A7) weresealed in the quartz tube vacuum. These alloy samples weremaintained at 500 °C for 34 days.
An electron probe microanalyzer (EPMA) was used todetermine the equilibrium phase compositions of the diffusioncouple samples and ternary alloy samples. The isothermalphase diagram of the Au–Al–Pd alloy annealed at 500 °Cwas constructed based on these results.
Results
Isothermal section at 500 °C
The phase equilibria of the diffusion couples are summarizedin Table 1. As shown in Fig. 2a–c, the D1 diffusion coupleformed the equilibrium phase layers Al/AuAl2/AuAl/Au2Al/Au2Al+AlPd/T1+Au2Al/T2/Au8Al3+AlPd2/AlPd2+α(Au,Pd)/α(Au,Pd). The phase layer thickness of AuAl2,AuAl, and Au2Al was approximately 10, 5, and 130 μm,respectively, and the Pd solubility was approximately 10 at%
in the Au2Al phase. The T2–Au8Al3–AlPd2 three-phase equi-librium was generated on the interface between the T2 one-phase layer and Au8Al3+AlPd2 two-phase layer. These three-phase equilibria T2-Au8Al3-AlPd2 were confirmed throughthe bulk alloy (A1) as shown in Fig. 3. The interface betweenthe Au8Al3+AlPd2 and AlPd2+α two-phase layers was alsoexamined. The existence of Au8Al3–AlPd2–α three-phaseequilibrium was confirmed by analyzing the bulk alloy (A2),as shown in Fig. 4. Four three-phase equilibria were observedin the D1 diffusion layers: Au2Al–AlPd–T1, T1–Au2Al–T2,AlPd2–T2–Au8Al3, and α–Au8Al3–AlPd2. The phase equilib-ria of the alloy equilibrium samples are summarized in Table 2.The phase diagram constructed according to the results inTables 1 and 2 is shown in Fig. 5. In the diffusion-coupleexperiment, 11 three-phase equilibria, resembling the T2–Au8Al3–AlPd2 or Au8Al3–AlPd2–α three-phase equilibria,were determined from the phase relationships. The remainingthree-phase equilibria, Au4A1–α–Au8Al3 and Au2Al–AuAl–AlPd, were determined by applying alloy equilibriummethods to the alloy samples A3 and A4 (Table 2). These 13sets of three-phase equilibria are shown as solid lines in Fig. 5.In addition, the AlPd2–T2–AlPd three-phase equilibria wereestimated to meet the phase relationships shown as dashed
Fig. 2 a The whole view of D1 sample microstructure. b The detail phase layers of the A region in a. c The detail phase layers of the B region in a
Fig. 3 The microstructure of A1 alloy sample including Au8Al3, T2 andAlPd2 phases
Fig. 4 The microstructure of A2 alloy sample including Au8Al3,α(Au,Pd) and AlPd2 phases
Gold Bull (2014) 47:237–243 239

lines in Fig. 5. This experiment revealed that most binaryphases conform to the Al–Au [5] and Al–Pd [7] binary phasediagrams. The Au–Pd [8] system exists in the α phase only at500 °C. In this study, Al solubility in the α phase was alsodetermined. In the experiment, 13 three-phase equilibria wereobserved in the Au–Al–Pd ternary system: T2–Au2Al–Au8Al3, T1–Au2Al–T2, T1–Au2Al–AlPd, AuAl–AlPd–Au2Al, AuAl2–AlPd–AuAl, Al21Pd8–AuAl2–Al3Pd2, AlPd–AuAl2–Al3Pd2, Al4Pd–AuAl2–Al21Pd8, Al–AuAl2–Al4Pd,T1–AlPd–T2, T2–AlPd2–Au8Al3, AlPd2–Au8Al3–α, andAu4Al–Au8Al3–α. The three-phase equilibrium AlPd–T2–AlPd2 was estimated to demonstrate the phase relationship.T1 and T2 are newly discovered ternary phases.
Solubility range of binary intermetallic phases
The Au solubility in the Al3Pd2, AlPd, and AlPd2 phases was6, 15, and 34, respectively. The Pd solubility in AuAl2, Au2Al,and Au8Al3 phases was 5, 10, and 13 at%, respectively. In theAu4Al phase, Al atoms were exchanged with Pd atoms, andthe Pd solubility in the Au4Al phase was 3 at%. The maximal
solubility of the AlPd2 and Au8Al3 phases was determinedbased on the bulk alloys (A2) shown in Fig. 4. The Al4Pd,Al21Pd8, and AuAl phases exhibited extremely low solubility.
T1 and T2 ternary phases
The T1 and T2 phases were observed in the D1 and D2diffusion couple. The compositions of the T1 and T2 ternaryphases were determined by conducting EPMA analysis on theD1 and D2 diffusion samples, as shown in Fig. 6. The T1
phase contained 37 at%Au, 26 at% Pd, and 37 at%Al. The T2
phase contained 44 at% Au, 24 at% Pd, and 32 at% Al.
Discussion
In this study, a classical semiinfinite diffusion couple wasapplied, meaning that the end couples maintained their origi-nal compositions after the diffusion couple was annealed. Ifvolume diffusion in a semiinfinite couple is observed to be arate-limiting step, a local equilibrium is assumed to exist;therefore, the rules described previously can be applied torelate the reaction zonemorphology developed during isother-mal diffusion to the phase diagram. The phase composition ofthe reaction zone is independent of time, whereas that of thediffusion path is fixed. The effectiveness of this technique inconstructing isothermal cross-sections of ternary systems hasbeen documented extensively [13].
The bulk alloy compositions and D2 and D6 diffusionpaths are marked in Fig. 7. The microstructure of the D2diffusion couple is shown in Fig. 8a, b. The D2 diffusioncouple formed the equilibrium phase layers Al/AuAl2/AuAl/Au2Al/Au2Al+AlPd/T1/T2/AlPd2/AlPd2+α(Au,Pd)/α(Au,Pd). A two-phase layer (Au2Al+AlPd) was in contactwith the T1 phase layer; therefore, the Au2Al–AlPd–T1 three-phase equilibrium was generated. The D2 diffusion path isplotted in Fig. 8c, and its corresponding microstructure isshown in Fig. 8a, b. The solid a–b line crosses the α(Au,Pd) single-phase field, b–c is in the AlPd2-α(Au, Pd) two-
Fig. 5 The isotherm of Au-Al-Pd at 500 °C determined by this study
Fig. 6 The compositions of T1
and T2 ternary phases determinedfrom D2 diffusion couple sample
240 Gold Bull (2014) 47:237–243

phase region, c–d is in the AlPd2 phase region, e–f is in the T2
phase region, g–h is in the T1 phase region, and the dashed h–iline crosses the Au2Al–AlPd–T1 three-phase region, indicat-ing the presence of an interface in the diffusion couple, withequilibrium between the single-phase T1 and Au2Al–AlPdtwo-phase region. The j–k–l–m–n–o–p line in Fig. 8c showsthat the diffusion path crosses four single-phase layers, theAu2Al, AuAl, and AuAl2 phases and the Al end phase. Thephase layer thickness of AuAl2, AuAl, and Au2Al was ap-proximately 24, 35, and 50 μm, respectively. There are voids
formedwithin the phase layer such as AuAl phase in Fig. 8a orKirkendall voids build up at interface. If the diffusion coupleswere held for longer time, crack may form between certainphase layers.
The D6 diffusion path crossed three three-phase regions(AuAl2–AlPd–Al3Pd2, AuAl2–Al3Pd2–Al21Pd8, and AuAl2–Al21Pd8–Al4Pd) with AuAl2 as the common matrix phase.Figure 9a shows the diffusion path near the Al–Pd binaryregion, and Fig. 9b shows the plot displaying the equilibriumof these three phases and their related two-phase regions.According to Fig. 9b, f–g is the AuAl2–AlPd–Al3Pd2 three-phase equilibrium, g–h is the AuAl2–Al3Pd2 two-phase re-gion, h–i is the AuAl2–Al3Pd2–Al21Pd8 three-phase equilibri-um, i–j is the AuAl2–Al21Pd8 two-phase region, j–k is theAuAl2–Al21Pd8–Al4Pd three-phase equilibrium, k–l is theAuAl2–Al4Pd two-phase region, and l–m is the Al4Pdsingle-phase region, and then in equilibrium with the Al edgephase. The microstructure and corresponding sketch areshown in Fig. 9c and are labeled from f to m, as describedpreviously.
For the wire bonding process, Fig. 10 shows the micro-structure of the Au–0.9Pd wire sample under 165 °C and3,000-h aging [1]. The (Au, Pd)4Al and Au5Al2 (as Au8Al3)phases tangled with the Pd-rich layer as α(Au, Pd). Becausethese three phases will maintain three-phase equilibrium asthis study and this stable interface can hold for long timemeans better wire bond reliability.
For the intermetallic phases, AuAl2 is purple and used forjewellery applications. The solubility of Pd in the purpleAuAl2 phase is limited in Fig. 8a and has 5 at% in D5
Fig. 7 The bulk alloy samples and the diffusion paths of D2 and D6samples
Fig. 8 a The whole view of D2sample microstructure. b Thedetail phase layers of the A regionin a. c The diffusion path of D2diffusion couple and sketch figure
Gold Bull (2014) 47:237–243 241

diffusion couple. And both AuAl2 phase still maintain purplecolor.
Conclusion
This study is the first to investigate a Au–Al–Pd system. Theisothermal section of a Au–Al–Pd system annealed at 500 °Cwas presented in this study. The entire composition rangeincluded two ternary phases (T1 and T2) and 14 three-phaseequilibria: T2–Au2Al–Au8Al3, T1–Au2Al–T2, T1–Au2Al–AlPd, AuAl–AlPd–Au2Al, AuAl2–AlPd–AuAl, Al21Pd8–AuAl2–Al3Pd2, AlPd–AuAl2–Al3Pd2, Al4Pd–AuAl2–Al21Pd8, Al–AuAl2–Al4Pd, T1–AlPd–T2, T2–AlPd2–Au8Al3,AlPd2–Au8Al3–α, and Au4Al–Au8Al3–α. The three-phaseequilibrium AlPd–T2–AlPd2 was estimated to exhibit thephase relationship. T1 and T2 are newly discovered ternaryphases. The T1 phase contained 37 at% Au, 26 at% Pd, and37 at%Al. The T2 phase contained 44 at%Au, 24 at% Pd, and32 at% Al.
The Au solubility in the Al3Pd2, AlPd, and AlPd2 phaseswas 6, 15, and 34 at%, respectively, by exchanging Pd atoms.The Pd solubility in the AuAl2, Au2Al, and Au8Al3 phaseswas 5, 10, and 13 at%, respectively, by exchanging Au atoms.
Fig. 10 The microstructure of the Au–0.9Pd wire sample under 165 °Cand 3,000-h aging [1]
Fig. 9 a The diffusion path of D6diffusion couple near the Al–Pdbinary region. b The sketch figureof D6 diffusion path. c Themicrostructure of D6 diffusioncouple with the label (f to m) andsketch figure
242 Gold Bull (2014) 47:237–243

The Pd solubility in Au4Al phase was 3 at% by exchanging Alatoms.
Acknowledgments We acknowledge the financial support provided bythe National Science Council, Grant No. NSC 98-2221-E-110-034-MY3,for this research.
Open Access This article is distributed under the terms of the CreativeCommons Attribution License which permits any use, distribution, andreproduction in any medium, provided the original author(s) and thesource are credited.
References
1. ChangHS, Hsieh KC,Martens T, YangA (2003) The effect of Pd andCu in the intermetallic growth of alloy Au wire. J Electron Mater 32:1182–1187
2. Gam SA, Kim HJ, Cho JS, Park YJ, Moon JT, Paik KW (2006)Effects of Cu and Pd addition on Au bonding wire/Al pad interfacialreactions and bond reliability. J Electron Mater 35:2048–2055
3. Okamoto H (1991) Al-Au (Aluminum-Gold). J Phase Equilib 12:114–115
4. Murray JL, Okamoto H, Massalski TB (1987) The Al-Au(Aluminum-Gold) system. Bull Alloy Phase Diagr 8:20–29
5. Okamoto H (2005) Al-Au (Aluminum-Gold). J Phase Equilib Diffus26:391–393
6. McAlister AJ (1986) The Al-Pd (Aluminum-Palladium) system. BullAlloy Phase Diagr 7:368–374
7. Okamoto H (2008) Al-Pd (Aluminum-Palladium). J Phase EquilibDiffus 29:199
8. Okamoto H, Massalski TB (1985) The Au-Pd (Gold-Palladium)system. Bull Alloy Phase Diagr 6:229–235
9. Nagasawa A, Matsuo Y, Kakinoki J (1965) Ordered alloys of gold-palladium system. I. Electron diffraction study of evaporated Au3Pdfilms. J Phys Soc Jpn 20:1881–1885
10. Matsuo Y, Nagasawa A, Kakinoki J (1966) Ordered alloys of thegold-palladium system. II. Electron diffraction study on evaporatedAuPd3 films. J Phys Soc Jpn 21:2633–2637
11. Liu CH, Chiang WR, Hsieh KC, Austin Chang Y (2006) Phaseequilibrium in the Cu-Ni-Zr system at 800 °C. Intermetallics 14:1011–1013
12. Seropegin YD, Gribanov AV, Kubarev OL, Tursinaa AI, Bodakb OI(2001) Isothermal cross-section of the Ce-Pd-Si phase diagram at600 °C. J Alloys Compd 317:320–323
13. Kodentsov AA, Bastin GF, Van Loo FJJ (2001) The diffusion coupletechnique in phase diagram determination. J Alloys Compd 320:207–217
Gold Bull (2014) 47:237–243 243