
Phase Behavior & Core Flooding of Low Acid Number Crude ...
73
i Phase Behavior & Core Flooding of Low Acid Number Crude Oil for Application in Alkaline EOR by THIVYASHINI A/P THAMILYANAN Dissertation submitted in partial fulfillment of the requirements for the Bachelor of Engineering (Hons) (Petroleum Engineering) Universiti Teknologi PETRONAS Bandar Seri Iskandar 31750 Tronoh Perak Darul Ridzuan
Transcript of Phase Behavior & Core Flooding of Low Acid Number Crude ...

i
Phase Behavior & Core Flooding of Low Acid Number Crude Oil for
Application in Alkaline EOR
by
THIVYASHINI A/P THAMILYANAN
Dissertation submitted in partial fulfillment of
the requirements for the
Bachelor of Engineering (Hons)
(Petroleum Engineering)
Universiti Teknologi PETRONAS
Bandar Seri Iskandar
31750 Tronoh
Perak Darul Ridzuan
i
CERTIFICATION OF APPROVAL
Phase Behavior & Core Flooding of Low Acid Number Crude Oil for
Application in Alkaline EOR
By
Thivyashini a/p Thamilyanan
A project dissertation submitted to the
Petroleum Engineering Programme
Universiti Teknologi PETRONAS
in partial fulfillment of the requirement for the
BACHELOR OF ENGINEERING (Hons)
(PETROLEUM ENGINEERING)
Approved by,
(Mr. Iskandar Dzulkarnain)
UNIVERSITI TEKNOLOGI PETRONAS
TRONOH, PERAK
May 2013

ii
CERTIFICATION OF ORIGINALITY
This is to certify that I am responsible for the work submitted in this project, that the
original work is my own except as specified in the references and acknowledgements,
and that the original work contained herein have not been undertaken or done by
unspecified sources or persons.
___________________________________________
(THIVYASHINI A/P THAMILYANAN)

iii
Contents Abstract .......................................................................................................................................... v
Acknowledgement ........................................................................................................................ vi
CHAPTER 1 .................................................................................................................................. 1
1.0 Introduction .............................................................................................................................. 1
1.1 Background of study ............................................................................................................ 1
1.2 Problem Statement ............................................................................................................... 2
1.3 Objectives ............................................................................................................................ 2
1.4 Scope of Study ..................................................................................................................... 2
1.5 Significance of Project ......................................................................................................... 3
1.6 Relevance of Study and Time Frame ................................................................................... 3
CHAPTER 2 .................................................................................................................................. 4
2.0 Literature review ...................................................................................................................... 4
2.1 Theory .................................................................................................................................. 4
2.2 Principles of Oil Recovery ................................................................................................... 5
2.2.1 Mobility Ratio ............................................................................................................... 5
2.2.2 Capillary Number .......................................................................................................... 5
2.3 Mechanisms in Alkaline Flooding ....................................................................................... 6
2.3.1 Oil-Alkali Interaction .................................................................................................... 6
2.3.2 Alkali-Rock Interaction................................................................................................. 7
2.3.3 Alkali-Water Interaction ............................................................................................... 8
2.4 Potential Reservoirs for Alkaline Flooding ......................................................................... 9
2.5 Phase behavior ..................................................................................................................... 9
2.5.1 Total Acid Number (TAN) ........................................................................................... 9
2.5.2 Viscous Oil .................................................................................................................. 10
2.5.3 Brine Sanity ................................................................................................................ 10
2.5.4 Interfacial Tension (IFT) ............................................................................................. 10
2.5.5 Core Flooding ............................................................................................................. 11
2.6 Chemicals ........................................................................................................................... 11
2.7 Challenges in Alkaline Flooding........................................................................................ 13
2.7.1 Hard Brine ................................................................................................................... 13
2.7.2 Micellae formation ...................................................................................................... 13

iv
2.7.3 Heavy Oil Reservoir.................................................................................................... 13
2.7.4 Loss of Alkali .............................................................................................................. 14
CHAPTER 3 ................................................................................................................................ 15
3.0 Methodology / Project Activities ........................................................................................... 15
3.1 Acid Number Determination .............................................................................................. 15
3.2 Compatibility Test ............................................................................................................. 17
3.3 Emulsion Retention Test .................................................................................................... 19
3.4 IFT Measurement Test ....................................................................................................... 21
3.5 Core Flooding .................................................................................................................... 22
3.7 Project Activities ................................................................................................................ 25
3.8 Gantt chart .......................................................................................................................... 26
3.9 Key Milestones .................................................................................................................. 27
3.9.1 FYP 1 .............................................................................................................................. 27
3.9.2 FYP 2 .............................................................................................................................. 27
CHAPTER 4 ................................................................................................................................ 28
4.0 Results and Discussion .......................................................................................................... 28
4.1 Acid Number Determination .............................................................................................. 28
4.2 Compatibility Test ............................................................................................................. 30
4.3 Emulsion Retention Test .............................................................................................. 40
4.4 Spinning Drop .................................................................................................................... 40
4.5 IFT-Chun Huh Equation .................................................................................................... 46
4.6 Porosity of Core- Core saturating ...................................................................................... 47
4.7 Core Flooding .................................................................................................................... 48
CHAPTER 5 ................................................................................................................................ 52
5.0 Conclusion & Recommendation ............................................................................................ 52
5.1 Conclusion ......................................................................................................................... 52
5.2 Recommendation ............................................................................................................... 53
References .................................................................................................................................... 54
Appendix ...................................................................................................................................... 56

v
Abstract
Alkaline flooding is one of the most promising methods to be applied in
recovering residual oil in the reservoir. The process behind this method is, when the
alkali being injected in the reservoir, it reacts with the naturally occurring acids in the
crude oil and produce soaps or in-situ surfactants. The produced surfactants will help in
removing oil from the rock surface and escapes from the pore easily. A proper study in
the characteristic of the crude oil and reservoir before injecting the alkali can also
change the wettability of the rock to the favorable condition. The oil components that
react with alkali are not specifically known, although acid number is cited as one.
However, the current application of alkaline flooding in the industry is limited to the
reservoirs with high acid number crude oil although many there are no proven
correlation which shows that acid number is related to the surfactant produced. In this
study, two different types of crude oils from Dulang field, high acid number crude oil
and low acid number crude are tested with two different alkali, namely Sodium
Hydroxide (NaOH) and Sodium Carbonate (Na2CO3). Both crude oils and alkalis are
tested for compatibility with various salinity and alkaline concentration. Then, the
interfacial tension was measured between the alkaline solution and crude oil to observe
the IFT reduction. Finally, core flooding is done with optimum concentration of alkaline
with both high acid number crude oil and low acid number crude oil with the best
selected alkaline, Na2CO3. The results shows the possibility of alkaline flooding in low
acid number crude oil and increase in the application of alkaline flooding in potential
reservoirs.

vi
Acknowledgement
First and foremost I would like to express my thanks to Almighty God on
successful completion of this project and report. This dissertation is a milestone in my
academic career. I have been fortunate to learn theories, concepts and apply the
engineering knowledge that I have learnt through this project.
I hereby, express my sincere and profound gratitute to my Final Year Project
supervisor, Mr.iskandar Dzulkarnain for his continuous assistance, support, guidance
and understanding throughout the successful completion of my FYP. His trust,
patience, guidance and leadership had been a good inspiration and motivation for me
and lead to a successful completion of my FYP.
I would also like to thank the Graduated Assistances, Mr. Sandeep Kumar and
Mr. Shuaib, and lab technicians in UTP, Mr. Shahrul, Mr. Saiful and Ms. Siti Fatimah
for their guidance and support in my FYP. Their assistance and friendly treatment not
only facilitated the work, but also made it pleasant.I am also grateful to FYP
coordinators and Petroleum Engineering Department of UTP for the support and
guidelines provided in going through a structured and coordinated internship.
I would like to be thankful to my friends and coursemates in UTP for their care
and encouragement through the hard times that we went through together. Finally none
of this would hav ebeen posible without the love and patience from my family. I would
like to express my heart-felt-gratitute to my family members for the support throughout
my graduate study in UTP.

1
CHAPTER 1
1.0 Introduction
1.1 Background of study
As a reservoir continues to produce, along time the reservoir pressure will decrease and much oil
will remain in the reserve as residual oil(Cooke Jr., Williams, & Kolodzie, 1974). Numerous
Enhanced Oil Recovery (EOR) techniques are being applied in the industry to recover residual
oil in the reservoirs. One of the effective recovery methods is alkaline flooding. This method
appeal to be more attractive due to its very low cost compared to other methods. Cheap alkalis
such as Sodium Hydroxide (NaOH) and Sodium Carbonate (NaCO3) will be injected into the
reservoir to react with naturally present acid in the crude oil to produce in-situ surfactants which
lowers the Interfacial Tension between the crude oil and rock surface and oil escapes easily.
This project focuses on the cause for recovery in low acid number crude oil using strong and
weak alkali. Therefore, all the parameters and factors contributing to the alkaline flooding such
as acid number in crude oil, alkaline concentration and type, brine salinity and reservoir
condition are tested and determined earlier by compatibility test(Mayer, Berg, Carmichael, &
Weinbrandt, 1983). Furthermore, at the end of this study, a comparison study of mechanisms like
wettability alteration and emulsification involved in achieving a high oil recovery in low acid
number crude is also determined. Lastly, the scope of work and objective of this project has been
narrow down for it to be feasible to be conducted within the given time frame.
Although many works have been done earlier in this topic, improvements and a more detailed
study has to be conducted in order to get accurate results and correlations. Firstly, the previous
work did not focus on the type of emulsion formed when alkaline solution is injected into the
reservoir. Therefore, a test will be conducted in this project to identify the nature of the emulsion
formed, whether it is oil-in-water emulsion or water-in-oil emulsion. Secondly, the wettability
alteration done in the work earlier only used the indirect method which is core flooding but this
project will test using the direct method which is using slide glass to test the effect when it is oil-
wet or water-wet. Finally, study on displacement efficiency and mobility ratio in alkaline
flooding are also will be covered in this project.

2
1.2 Problem Statement
A minimum acid number in the range of 0.5 to 1.5 mg KOH per gram of oil has been suggested
as a pre-requisite for a successful oil recovery of oil through alkaline waterflooding11.
Application of alkaline flooding has been limited in many cases due to a low content of naturally
occurring acid in the crude oil. Crude with low number of acid is said to interact less with the
alkali injected, leading to less in-situ surfactant formation. Thus, the recovery of residual oil is
less compared to high acid number crude oil as Interfacial Tension (IFT) cannot be
reduced(Labrid, 1979). However, there is no proven correlation which states that acid number in
the crude is directly related to in-situ surfactant production. Magnitude of enhanced oil recovery
and increased production did not correlate neither with acid number nor Interfacial Tension
beyond the threshold values(Ehrlich & Wygal Jr., 1977). This project is to investigate the
possibilities of alkaline flooding in low acid number crude oil by testing various mechanisms
involved in recovering residual oil and determining the adequate condition to apply alkaline
flooding in recovering the residual oil.
1.3 Objectives
1. To determine the optimum concentration of aqueous solution for alkaline flooding.
2. To characterize the nature of the emulsion formed, whether it Type I, Type II or Type III
emulsion.
3. To examine the emulsion retention using high and low acid number crude.
4. To observe the reduction in interfacial tension.
5. To investigate the recovery of residual oil through alkaline flooding in low acid number
crude oil reservoir (core flooding).
1.4 Scope of Study
1. Optimum concentration of aqueous solution
2. Characterization of emulsion
3. Emulsion retention of microemulsion

3
4. Interfacial tension
5. Core Flooding
1.5 Significance of Project
Low acid number in crude oil limits the application of alkaline flooding in recovering residual oil
in the reservoir(Chlwetelu, Neale, Hornof, & George, 1992). But no correlation till date has
shown that acid number in crude oil is directly related to reduction in Interfacial Tension. Since
alkaline flooding is very cost efficient compared to other methods in enhanced oil recovery
(EOR), it is very important to prove that alkaline flooding can also be successful in the reservoir
with low acid number crude oil. The research and experiments conducted in this project is to
contribute to the study of alkaline flooding in Dulang crude oil.
1.6 Relevance of Study and Time Frame
Enhanced Oil Recovery is an important aspect in the process of recovering residual oil where
various tertiary recovery methods are applied in the reservoir. One of the favorable EOR method,
alkaline flooding is being studied in this project(Cooke Jr., et al., 1974). This project requires and
applies engineering knowledge and oil field familiarization which is vital to a successful
petroleum engineer. This project is relevant to the scope of my study which is Petroleum
Engineering. The time frame to complete this project is very feasible as I have two semesters to
complete it.
4
CHAPTER 2
2.0 Literature review
2.1 Theory
Enhanced Oil Recovery (EOR) is an artificial method used to recover additional oil after the
primary and secondary production. EOR is usually applied to reservoirs which have enough
potential for the economical production after cost limitations have been carefully assessed
(Bortolotti, Macini, & Srisuriyachai, 2009). There are three main types of EOR, namely,
chemical flooding (alkaline flooding, or micellar-polymer flooding), miscible displacement
carbon dioxide or hydrocarbon injection) and thermal recovery (steam flood or in-situ
combustion). The application of each type depends on the temperature, depth, net pay,
permeability, residual oil and water saturations, porosity and fluid properties such as oil API ad
viscosity (Bortolotti, Macini, et al., 2009).
Alkaline flooding also known as caustic flooding is simple in process and low in cost but its
mechanism is very complicated. Alkaline solutions are injected into the reservoir to recover
residual oil trapped in the pores. Injected alkali will react with organic acids present in the crude
oil and form in-situ surfactants, known as soaps, which help in releasing oil from rock. Alkaline
flooding is more attractive compared to various non-thermal processes because alkaline reagents
are abundant and quite cheap compared with conventional surfactants (Chlwetelu, et al., 1992).
The history of alkaline flooding dated back to the early 1920’s, as a combination of reservoir
engineering and chemistry. Interaction of the injected alkali with crude oil, water, brine and rock
in the reservoir is a chemistry scope while using interactions to recover oil is reservoir
engineering scope (Mayer, et al., 1983).
Till date, no less than eight mechanisms have been suggested (Tong, Liu, Zhang, & Zhu, 1986).
All the mechanisms recognize that surface active substances or soaps, formed by certain
compounds found in crude oil reacts with alkali, are adsorbed at the oil/water or solid/liquid
interfaces as to change the properties of the interface. The adsorption of the soap substance at the
interface lowers the interfacial tension (IFT) significantly (Tong, et al., 1986).
5
Even though the oil components that react with alkali area not specifically known, acidic
components have been cited as candidates (Smith, 1993) . While the presence of some naturally
occurring acids is a must, no direct correlation has been made to relate acid number and
enhanced oil recovery through alkaline flooding (Mayer, et al., 1983). When good alkaline
formulations with good mobility control are used, more than 90% oil recovery can be achieved in
outcrop and reservoir cores(Yang et al., 2010). Before any alkaline flooding is done, one of the
most important task to be done is phase behavior experiments to determine the optimal
formulation(Tong, et al., 1986). Therefore, a great deal of screen work should be always carried
out.
2.2 Principles of Oil Recovery
Hydrocarbon recovery can be defined as the overall efficiency with which oil is displaced by
some other fluid(Okasha & Alshiwaish, 2009). The two important concepts in oil recovery are
Mobility Ratio, M, and the Capillary Number, N (Thomas, Scoular, Verkoczy, & Ali, 1999).
2.2.1 Mobility Ratio
Mobility ratio is the ratio of the mobility of displacing fluid(oil in his theory) divided by mobility
of displaced fluid. Mobility is defined as permeability divided by viscosity (k/μ). When M>1, the
displacement is inefficient, because the displacing fluid will flow past much of the displaced
fluid. When M>1, the displacing fluid will channel past oil ganglia, called “viscous fingering”.
For a maximum displacement efficiency, mobility ratios should be less than one, M<1, denoted
as “favorable mobility ratio”.
M can be made smaller by making the displacing fluid more viscous, usually done by adding
polymer to water, or by heating the displaced fluid to make it less viscous (Thomas, et al.,
1999).Mobility ratio is also directly proportional to areal or vertical sweep efficiency.
2.2.2 Capillary Number
Capillary Number, NC can be defined as μv/σ, where μ is the displaced fluid viscosity, v is Darcy
velocity, σ is IFT between the displaced and displacing fluids (Thomas, et al., 1999). Capillary
6
number is inversely proportional to residual oil saturation. Capillary number can be increased
and residual oil saturation will decrease when oil viscosity is reduced, or increasing pressure
gradient, the most significant one will be reducing IFT. A good solvent will lower oil viscosity
but the cost will be prohibitive (Thomas, et al., 1999).
2.3 Mechanisms in Alkaline Flooding
2.3.1 Oil-Alkali Interaction
When the injected alkali interacts with and acids present in crude oil precipitation occurs. The
interaction between alkali and components in the crude produce surface active agents, known as
surfactants. The surfactants can help to release the oil from rock surface. This process is also
known as emulsification (Mayer, et al., 1983). Studies (Bortolotti, Macini, et al., 2009) involving
the effect of sodium ion on the activity of in situ formed surfactant have shown that activity
decreases as sodium concentration increases. Emulsion can be defined as colloidal system in
which one phase is dispersed as fine droplets in the other phase where both are equally miscible.
There are four types of emulsions, oil-in-water(emulsification and entrainment), water-in-
oil(emulsification and entrapment), bi-continuous and isotropic micellar solution. Oil-in-water
and water-in-oil are two phase systems, bi-continuous is a three phase system and isotropic
micellar solution is a single phase system. The first three types are the most common emulsions.
2.3.1.1 Oil-in-water (O/W)
O/W emulsion involves the mechanism of emulsification and entrainment where
oil droplets are dispersed into the water phase. Water exists as the flowing
medium. According to Lorrondo, et. al., higher alkali and/or sodium chloride
concentration tend to the favor the formation of o/w type.
2.3.1.2 Water-in-Oil (W/O)
W/O emulsion involves the mechanism of emulsification and entrapment. It is
also known as oil emulsion because oil exists as the dispersion medium and water

7
as the dispersed phase. W/O emulsion is temporarily mobile and improves the rate
of recovery(alters the WOR) but does not decrease the residual oil saturation
(Mayer, et al., 1983). Water-in-oil emulsion can improve oil recovery but the
disadvantage will be the need for large pressure gradient for normal flow rates
because it is usually more viscous than oil, thus it is better to avoid W/O
emulsions (Kumar, Dao, & Mohanty, 2012).
2.3.1.3 Winsor Type III
Winsor type III emulsion is a condition where the oil and water are separated into
3 layers. Oil will be on top, microemulsion will be in middle and water at bottom.
This type of emulsion is most favorable reservoir as it can carry the oil easily in
the form of microemulsion to the surface and the stability is higher.
Emulsions can be broken into two different phases by many ways such as heating, centrifugation,
freezing and de-emulsifier application. A stable emulsion is favorable in the reservoir during
alkaline flooding. Emulsion stability, as defined by the coalescence rate of oil droplets in water-
external emulsions, is determined as a function of salinity and alkaline type (Chang & Wasan,
1980). The emulsion is expected not to break until it reaches the surface or transportation system.
Emulsion type and formation depend on the salinity, hydrophilicity of surfactants and WOR,
while the transport of emulsion depends on the formations’ wettability and pore structure
(Kumar, et al., 2012). The application of dilute emulsions and polymers in alkaline flooding is
continuously being studied (Mayer, et al., 1983).
2.3.2 Alkali-Rock Interaction
Alkali-rock interaction during alkaline flooding causes wettability alteration (Mayer, et al.,
1983). Wettability is the tendency of one fluid to adhere onto solid surfaces in presence of other
immiscible fluids (Bortolotti, Macini, et al., 2009). The wettability of a rock varies from strongly
water-wet to strongly oil-wet, depending on the interactions between oil, water and reservoir
8
rock(Bortolotti, Gottardi, Macini, & Srisuriyachai, 2009). Some porous mediums that do not
show preferential wettability to any one of the two fluids are referred as “neutral wettability” or
“intermediate wettability”. Most reservoirs are water-wet because they originated in aqueous
environments. Oil wettability is an unfavorable condition because oil tends to be captured onto
the rock and matrix surfaces rather than being produced along with the flowing streamline
resulting in very poor oil recovery. Wettability is the most important yet least quantified aspect
of alkaline flooding.
Many properties of injected water has been proven to affect the amount of oil recovered through
wettability impacts (McGuire, Chatham, Paskvan, Sommer, & Carini, 2005). E.F. deZabala, et.
al., found that alkali adsorption on the rock surface decreases the amount of alkali available to
the oil/water interface, which results in higher tension levels that may be ineffective for the
mobilization of residual oil. Therefore a significant alkali adsorption on the rock surface can
abrogate in alkaline flooding process.
Reservoir rock interaction with the alkali by far has been the largest contributor for alkaline
consumption. High consumption occurs when the clay content is high but slow when quarts,
dolomite and calcite exist (Mayer, et al., 1983). This reaction is both reversible and irreversible.
Under ideal condition of pH value, salinity and temperature, it is possible to change the
wettability of some porous media from oil-wet to water-wet.
2.3.3 Alkali-Water Interaction
Mixing of in the injected alkaline solution with the hardness ions in the reservoir water causes
chemical precipitation (Mayer, et al., 1983). According to Mayer, et al., once the alkali contacts
the ions, precipitates of calcium and magnesium hydroxide, carbonate or silicate may form
depending on the pH, ion concentration and temperature. A careful concentration of alkali should
be calculated before injecting as it can cause scale precipitation which is an unfavorable
condition.

9
Any or all the mechanisms stated above can operate in one application.
2.4 Potential Reservoirs for Alkaline Flooding
Identifying reservoirs with potential to recover residual oil economically by alkaline flooding is
very important before alkaline flooding is done. In a research done by J.E.Smith (1993) using
239 crude oils for a period of 10 years, chemical properties of crude oil are found to be much
stronger indicators of alkaline reactivity than physical properties. J.E.Smith has added : physical
properties that generally indicate a heavy, nonvolatile oil correlate weakly with alkaline
reactivity; oil form a given formation may have different reactivity tendencies than average due
to the characteristics typical to the formation. High molecular weight ring components such as
aromatics, naphthenes and asphalts tend to favor reactivity while paraffinic compounds tend to
discourage reactivity. Oils from carbonate rocks are found to be more reactive compared to
sandstone. A reservoir should contain little or no gypsum, the divalent ion exchange capacity
should be less than 5 meq/kg, and the in situ pH should be greater than 6.5 for it to be a
candidate for alkaline flooding (French & Burchfield, 1990). All these properties should be
studied carefully in determining the feasibility of alkaline flooding in a reservoir.
2.5 Phase behavior
Phase behavior experiments are done to determine the behavior of crude oil, chemicals and
aqueous solutions in the reservoir condition. Phase behavior tests requires a careful observation
of the compatibility of aqueous solutions and chemical mixtures with crude oil and brine over a
period of time for it to reach equilibrium or to be rejected if it fails (Yang, et al., 2010). Yang et.
al. also mentioned that ideally low viscosity micro-emulsions will form within a few days and
ultra-low IFT will exhibit between the crude oil and water phases.
2.5.1 Total Acid Number (TAN)
Total Acid Number (TAN) is widely used as an indicator of the activity of crude oil by
determining the quantity of naphthenic acid in crude oil. TAN reflects the free carboxylic groups

10
in the crude oil (Yang, et al., 2010). The measurement is done by determining the amount of
milligram of potassium chloride needed to neutralize 1gram of crude oil. Accurate measurements
of TAN are reproducible and correlate with IFT properties of crude oils (Fan & Buckley, 2007).
2.5.2 Viscous Oil
A high viscosity oil is more difficult to displace in a reservoir compared to a low viscosity oil but
a more viscous oil has many advantages as targets for chemical EOR and the upper limit of oil
viscosity to what is considered feasible is much greater than it was 30 years ago (Yang, et al.,
2010).
Much larger EOR target is found in high viscous oil reservoir as the water flood residual oil
saturation is typically higher in these reservoirs, high porosity and high permeability, so the
characteristics take as more attractive compared to light oil reservoirs where they have been
water flooded to very low residual oil saturations over many decades (Yang, et al., 2010).
2.5.3 Brine Sanity
In a study done by Okasha & Alshiwaish (2009) to investigate the effect of brine dilution,
temperature and pressure on IFT of dead and recombined oil in Arab-D carbonate reservoir, it
was found that the dilution of brine reduces the FT between oil and brine which may help in
improving oil recovery in case of injecting low salinity brine. The reduction of IFT with brine
dilution reflects the potential implication of low salinity flooding in improving oil recovery
(Okasha & Alshiwaish, 2009).
2.5.4 Interfacial Tension (IFT)
Interfacial measurements between a crude oil and an alkaline solution have generally been
accepted as a screening factor to evaluate the EOR potential of the crude by the alkali (Burk,
1987). IFT behavior exists at any alkali concentrations. During alkaline flooding, the IFT may be
reduced to a level that permits the mobilization of residual oil (deZabala & Radke, 1986).
The reduction in IFT between acidic oil and alkaline water is influenced by the pH of the water,
the concentration and type of salts in the solution, and the concentration and type of organic

11
acids in the oil (Cooke Jr., et al., 1974). Relatively low IFTs (less than 1dyne/cm) are usually
measured by spinning drop method. This method is also applied in this project. The spinning
drop apparatus basically consists of a cylindrical glass tube that rotates about its horizontal axis.
Inside the tube, oil is dispersed in the denser aqueous phase (alkaline solution). The oil drop
stays at the horizontal axis when the interfacial force is counterbalanced by the rotational force.
Therefore, the IFT is a function of drop radius, rotational speed and density difference between
two phases (Li, Wang, & Gu, 2003; Mayer, et al., 1983).
2.5.5 Core Flooding
Once the suitable surfactant formulations are selected based on their phase behavior, they should
be evaluated by testing the formulations through core flooding (Yang, et al., 2010). If the final
oil saturation is almost zero, the micro-emulsion screening test is considered a success and the oil
recovery performance is good.
2.6 Chemicals
There are five possible alkalis to be used for alkaline flooding(sodium hydroxide, sodium
orthosilocate, sodium metasilicate, ammonia and sodium carbonate) but the most widely used
alkali will be Sodium Hydroxide(NaOH) (Mayer, et al., 1983). A comparison of alkali was made
by Mayer, et.al. and the result is tabulated in Table 1.
12
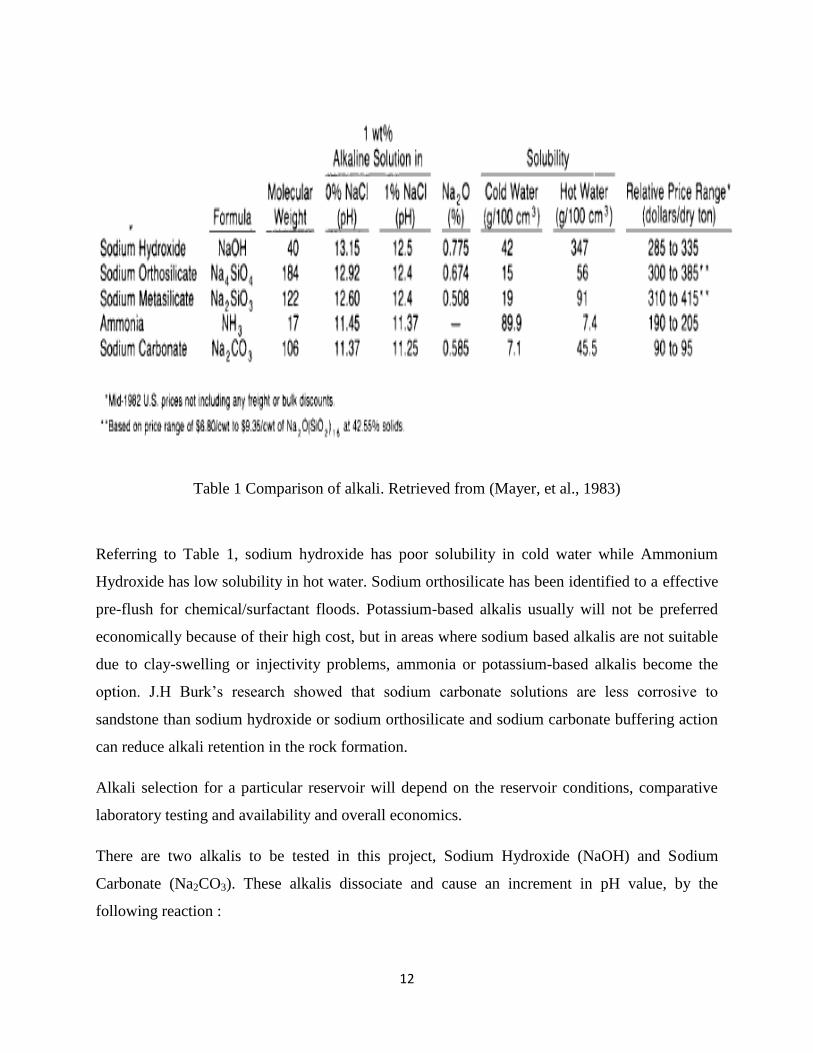
Table 1 Comparison of alkali. Retrieved from (Mayer, et al., 1983)
Referring to Table 1, sodium hydroxide has poor solubility in cold water while Ammonium
Hydroxide has low solubility in hot water. Sodium orthosilicate has been identified to a effective
pre-flush for chemical/surfactant floods. Potassium-based alkalis usually will not be preferred
economically because of their high cost, but in areas where sodium based alkalis are not suitable
due to clay-swelling or injectivity problems, ammonia or potassium-based alkalis become the
option. J.H Burk’s research showed that sodium carbonate solutions are less corrosive to
sandstone than sodium hydroxide or sodium orthosilicate and sodium carbonate buffering action
can reduce alkali retention in the rock formation.
Alkali selection for a particular reservoir will depend on the reservoir conditions, comparative
laboratory testing and availability and overall economics.
There are two alkalis to be tested in this project, Sodium Hydroxide (NaOH) and Sodium
Carbonate (Na2CO3). These alkalis dissociate and cause an increment in pH value, by the
following reaction :
13
1. Sodium Hydroxide : NaOH Na+ + OH
-
2. Sodium Carbonate : NaCO3 2Na+
+ CO32-
Crude oil samples to be used in laboratory screening should be free from chemical additives,
such as emulsion breakers and corrosion inhibitors (JENNING JR., 1975). The crude oil sample
to be used in this project will be from Dulang field.
2.7 Challenges in Alkaline Flooding
Conditions such as extremely high temperature, high salinity and hard brine pose a great
challenge in applying chemical EOR process (Yang, et al., 2010).
2.7.1 Hard Brine
Each petroleum reservoir has some hardness (divalent cations) in the water and poses a great
threat during the injection of chemicals in the reservoir. Divalent cations can cause precipitations
when they meet and react with alkali, polymer and surfactant and plugs the reservoir (Yang, et
al., 2010). There, careful measurements should be taken to test the compatibility of these
chemicals with brine.
2.7.2 Micellae formation
When the acids in oil phase combines with caustic soda, it produces water-water soluble sodium
salts, known as micellae. Critical micellae concentration depends mainly on the concentrations of
caustic soda and salt in equilibrated aqueous phase, thus the formation of micellae in aqueous
phase should not be ignored (Tong, et al., 1986).
2.7.3 Heavy Oil Reservoir
Density of heavy oil usually ranges from 11 ° to 20° API (Chlwetelu, et al., 1992). Heavy oil has
low mobility because of its high viscosity, therefore the mobility ratio would be unfavorable in
any fluid displacement process (Thomas, et al., 1999). Use of an alkali would promote the

14
formation of emulsion which in turn will make the effective mobility ratio less unfavorable. The
emulsion, usually micro-emulsion, will lower the mobility of the displacing fluid through
entrainment and entrapment. Flow rates and sweep efficiency are also key problems in heavy oil
recovery. Micro-emulsions are a mixture of water, a naturally occurring solvent, an alcohol co-
solvent and a surfactant blend of linear and branched ethoxylates (Paktinat, Pinkhouse, Williams,
& Penny, 2005).
2.7.4 Loss of Alkali
Loss of alkali happens as a result of adsorption and reaction with minerals in the reservoir. The
loss will be more if the clay content in the reservoir is high (Thomas, et al., 1999). When
designing the alkaline formulation for alkaline flooding in reservoir, alkaline consumption by the
rock and the fluids saturating the rock should be taken into account (Bortolotti, Macini, et al.,
2009). Presence of clay in a reservoir contributes to alkali loss and is affecting by the amount and
type of clay minerals present, connate water composition, caustic concentration, temperature and
time of contact (Ehrlich & Wygal Jr., 1977). In the research done by Bortolotti, et al., addition of
sodium chloride to the alkaline solution appeared to help decrease the amount of alkali
consumed, although did not contribute to additional oil recovery. Alkaline consumption by
reservoir rock is predictable from X-Ray diffraction analysis of mineral composition.
Insufficient attention to any of the above mentioned factors could seriously impair the efficacy
of the alkaline system (Chlwetelu, et al., 1992).
15
CHAPTER 3
3.0 Methodology / Project Activities
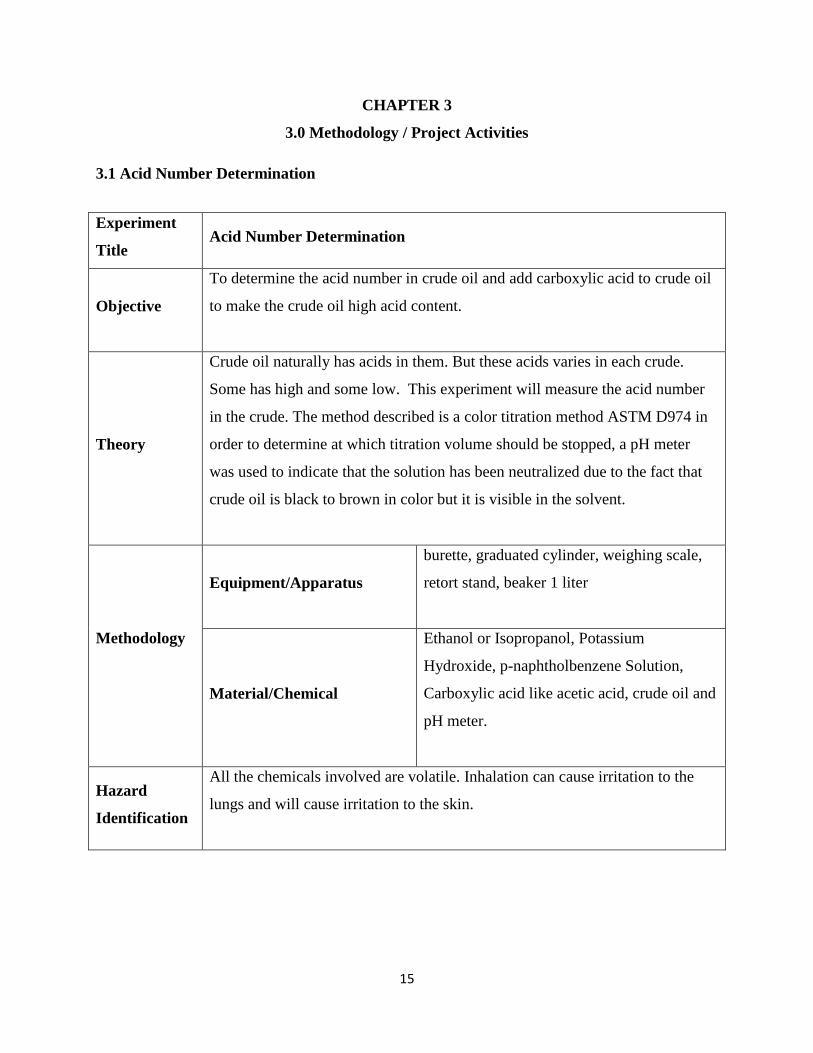
3.1 Acid Number Determination
Experiment
Title Acid Number Determination
Objective
To determine the acid number in crude oil and add carboxylic acid to crude oil
to make the crude oil high acid content.
Theory
Crude oil naturally has acids in them. But these acids varies in each crude.
Some has high and some low. This experiment will measure the acid number
in the crude. The method described is a color titration method ASTM D974 in
order to determine at which titration volume should be stopped, a pH meter
was used to indicate that the solution has been neutralized due to the fact that
crude oil is black to brown in color but it is visible in the solvent.
Methodology
Equipment/Apparatus
burette, graduated cylinder, weighing scale,
retort stand, beaker 1 liter
Material/Chemical
Ethanol or Isopropanol, Potassium
Hydroxide, p-naphtholbenzene Solution,
Carboxylic acid like acetic acid, crude oil and
pH meter.
Hazard
Identification
All the chemicals involved are volatile. Inhalation can cause irritation to the
lungs and will cause irritation to the skin.
16
Experiment
procedure
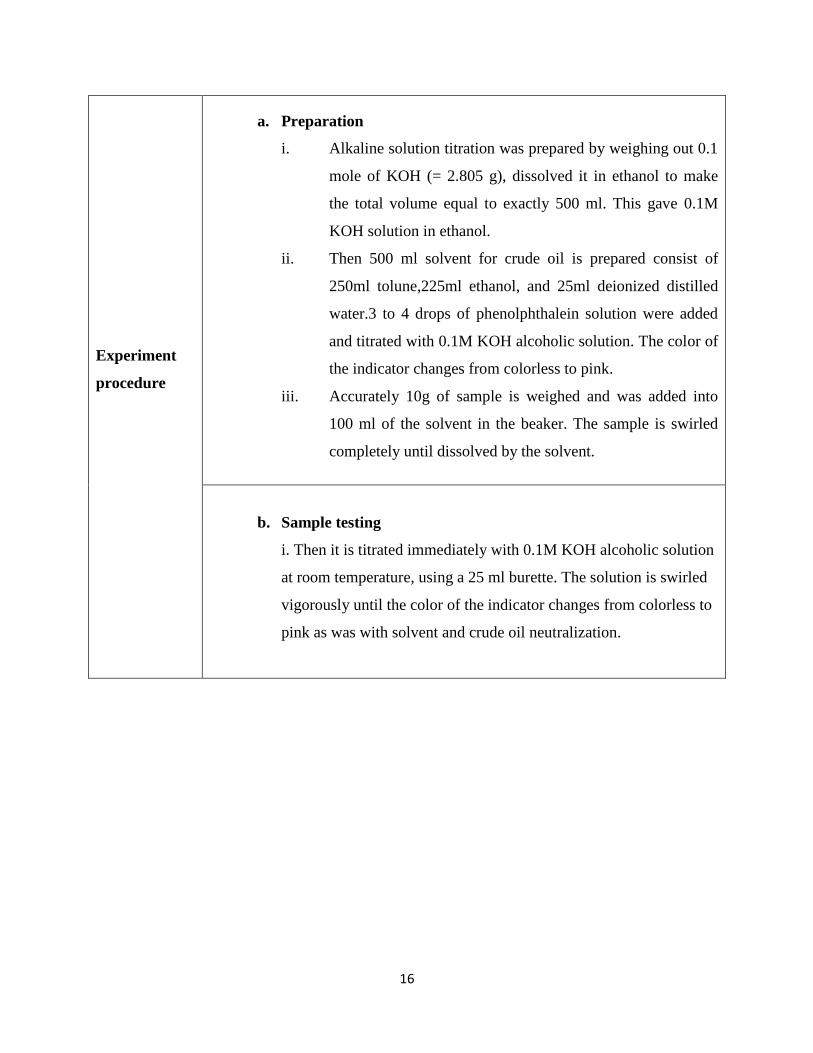
a. Preparation
i. Alkaline solution titration was prepared by weighing out 0.1
mole of KOH (= 2.805 g), dissolved it in ethanol to make
the total volume equal to exactly 500 ml. This gave 0.1M
KOH solution in ethanol.
ii. Then 500 ml solvent for crude oil is prepared consist of
250ml tolune,225ml ethanol, and 25ml deionized distilled
water.3 to 4 drops of phenolphthalein solution were added
and titrated with 0.1M KOH alcoholic solution. The color of
the indicator changes from colorless to pink.
iii. Accurately 10g of sample is weighed and was added into
100 ml of the solvent in the beaker. The sample is swirled
completely until dissolved by the solvent.
b. Sample testing
i. Then it is titrated immediately with 0.1M KOH alcoholic solution
at room temperature, using a 25 ml burette. The solution is swirled
vigorously until the color of the indicator changes from colorless to
pink as was with solvent and crude oil neutralization.

17
3.2 Compatibility Test
Experiment Title Compatibility Test of Alkali Solution
Objective
To find the optimum concentration and salinity aqueous solution using
NaOH, NaCO3 with crude oil and brine water(NaCl) or distilled water to
avoid precipitation of micro white particle
Theory
Crude oil naturally has acids in them. But these acids varies in each crude.
Some has high and some low. This experiment will test the compatibility of
alkali solution with the acidic and de-acidified crude. solutions are made
with mass percentage according to major papers rather than molarity of the
solution.
Methodology
Equipment/Apparatus Test tube, graduated cylinder, weighing
scale
Material/Chemical Sodium Hydroxide, Sodium Carbonate,
Sodium Chloride, Distilled water, crude oil
Hazard
Identification
All the chemicals involved are volatile. Inhalation can cause irritation to the
lungs and will cause irritation to the skin.
Experiment
procedure
a. Preparation
i. The mass of sodium hydroxide needed is calculated using
the following formula:
Mass = (volume x mass percentage) / (100 - mass percentage)
*For example, to make a 1 percent solution using 60 mL of distilled water,
this equation used to determine the amount of sodium hydroxide to be used:
Mass = 60 x 1 / (100 - 1) = 0.6 g
ii. The calculated amount of sodium hydroxide is weighed
on the scale. Distilled water of 60 mL is poured into the
test tube, and add sodium hydroxide. The solution is
mixed with the spoon or gently swirl the test tube until
the salt dissolves completely.
iii. Then, the mass of sodium chloride is calculated using
18
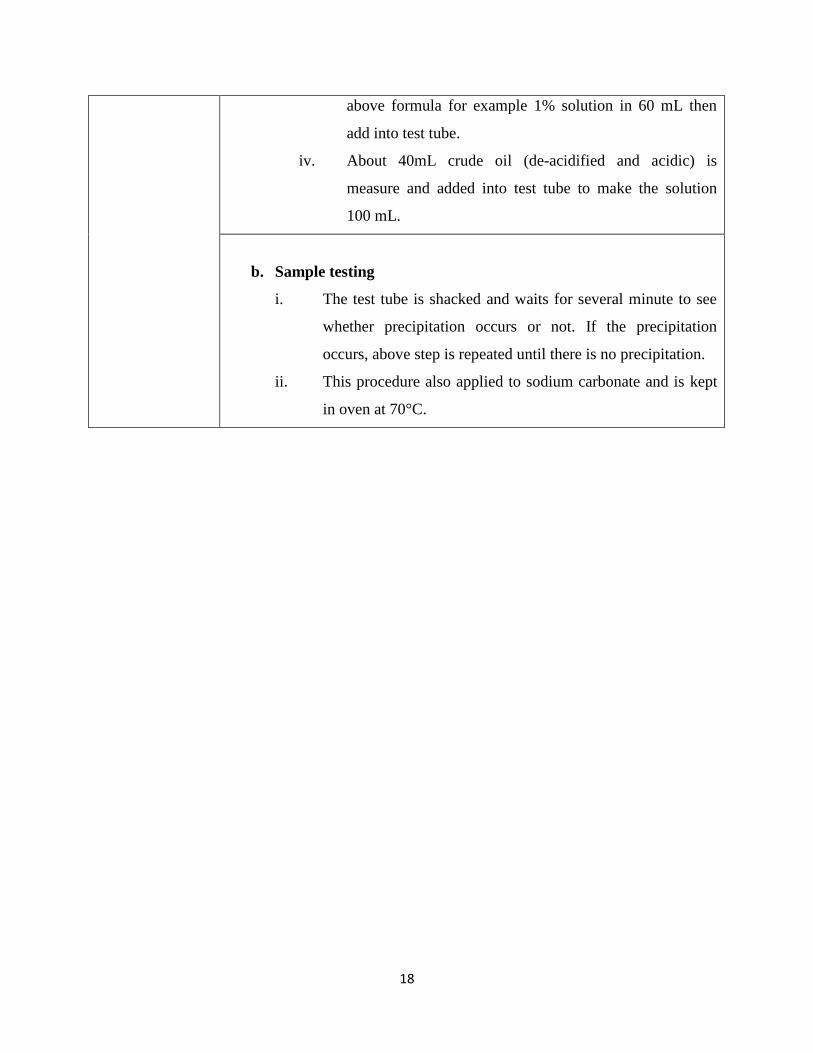
above formula for example 1% solution in 60 mL then
add into test tube.
iv. About 40mL crude oil (de-acidified and acidic) is
measure and added into test tube to make the solution
100 mL.
b. Sample testing
i. The test tube is shacked and waits for several minute to see
whether precipitation occurs or not. If the precipitation
occurs, above step is repeated until there is no precipitation.
ii. This procedure also applied to sodium carbonate and is kept
in oven at 70°C.

19
3.3 Emulsion Retention Test
Experiment Title Emulsion retention test of oil-in-water emulsion with alkaline
solution by measuring separation of oil layer as function of time.
Objective
To examine emulsion retention of oil-in-water emulsion for low and
high acid number crude oil and relation with dynamic interfacial
tension.
Theory
Once alkali is injected into the real reservoir, they will be left for
months and even years to react and form emulsions. Therefore, in
laboratory scale testing it should be left at least 3 days minimum to react
and stabilize.
Methodology
Equipment/Apparatus Test tube, graduated cylinder
Material/Chemical
Brine water(Sodium Chloride), crude oil,
alkaline solution (Sodium Hydroxide and
Sodium Carbonate),
Hazard
Identification
Alkali should be tightly closed upon usage as they can melt in room
temperature and any contact with skin should be rinsed immediately.
Experiment
procedure
a. Preparation
i. The mass of sodium hydroxide needed is calculated using
the following formula:
Mass = (volume x mass percentage) / (100 - mass percentage).
*For example, to make a 1 percent solution using 60 mL of distilled
water, this equation used to determine the amount of sodium hydroxide
to be used:
Mass = 60 x 1 / (100 - 1) = 0.6 g
ii. The calculated amount of sodium hydroxide is weighed
on the scale. Distilled water of 60 mL is poured into the
test tube, and adds sodium hydroxide. The solution is
mixed with the spoon or gently swirl the test tube until

20
the salt dissolves completely.
iii. Then, the mass of sodium chloride is calculated using
above formula for example 1% solution in 60 mL then
add into test tube.
iv. About 40mL crude oil (de-acidified and acidic) is
measure and added into test tube to make the solution
100 mL.
v. The test tube is shacked 50 times at room temperature
then, it is put in oven at reservoir temperature which is
70oC and waits for several minute.
vi. The emulsion is determined visually by measuring the oil
separated from the emulsion at 70°C immediately and
after 5 days.

21
3.4 IFT Measurement Test
Title IFT measurement test using spinning drop method for given
duration period to make correlation between static IFT and
retention of emulsion.
Material Crude oil, alkaline containing brine solution (Sodium Hydroxide
and Sodium Carbonate)
Apparatus Test tube, syringes
Machine Spinning Drop Machine
Procedure Static IFT between aqueous solution contain brine and alkaline
with oil sample is measured at 70°C with Reactivity index for
aqueous solution containing brine and alkaline solution should
be determined earlier. The method used is spinning drop and run
to get the static IFT.

22
3.5 Core Flooding
Title Core Flooding
Objective To run the alkaline flooding and see the recovery
Material Crude oil, alkaline containing brine solution (Sodium Hydroxide
and Sodium Carbonate), brine, distilled water
Apparatus Core
Machine Core Flooding Machine, suction pump, oven
Preparation
Core cleaning is done before the experiments are conducted.
Brine is prepared by dissolving reagent grade salts in distilled
water in pre-determined salinity. Connate brine of 10000pp
consisting of NaCl is prepared.
Porosity Measurement
using Saturating Method
Porosity is the percentage of pore volume over bulk volume of
the core sample.
1. The core sample is dried in the oven.
2. Length and diameter of the core sample is measured
using Vernier calipers.
Bulk Volume = πr2L
3. Core is weighed to get the dry weight.
4. Core is placed in a beaker with 500ml distilled water and
the air is sucked using suction pump for 20 minutes.
5. The core is left to be saturated for a minimum of 6 hours.
6. After saturation, the wet weight of the core is measured
instantly.
Pore volume = (Wet weight – Dry weight) / Bulk volume

23
7. Pore volume is calculated by :
Porosity = Pore volume / Bulk volume X 100%
Oil flood to determine
residual water saturation
1. The core sample is saturated with 10000ppm brine. Then
the sample is again injected with more brine to make sure
100% brine saturation is achieved, also known as steady
state condition.
2. Next, Dulang crude oil is injected into the brine saturated
core at the rate of 0.3cc/min until no more water is
recovered. (Confining pressure : 2500psi, Injection
pressure : 1900psi, Temperature : 70°C).
3. Injection is continued until no more water is produced.
This indicates irreducible water saturation.
4. The volume of oil produced, volume of brine produced
and pressure drop is recorded as a function of time.
Material balance will be used to calculated connate water
saturation (Swc).
Secondary brine flood to
determine residual oil
saturation
Currently the core is at connate water saturation and initial oil
saturation.
1. The core will be flooded with 10000ppm brine after the
oil flood at an injection rate of 0.3-0.5cc. (Confining
pressure : 2500psi, Injection pressure : 1900psi,
Temperature : 70°C)
2. The volumes of oil and brine produced and pressure drop
is measured as a function of time.
3. Flooding is done until no more oil is produced.
4. Residual oil saturation is determined through material
balance.

24
Tertiary recovery using
alkaline flooding
1. Currently the core is left with residual oil saturation.
2. Injection rate is set to be 0.3-0.5cc and injection pressure
at 1900psi.
3. Alkaline flooding is done by injection of alkaline
solution of determined concentration.
4. Inlet and outlet pressure is recorded along with produced
water and oil.
Collected oil and water will be used to measure the recovery
factor.
Cores will be saturated previously with 10000ppm brine before the core flooding process begins.
Two runs of core flooding will be done with the following combinations:
a. Low acid number crude oil with best selected alkaline solution
b. High acid number crude oil with best selected alkaline solution

25
3.7 Project Activities
Report Writing
Compile the research findings, literature review, experimental result and final report
Discussion
Discuss the resuts & findings and conclude the study
Result Analysis
Correlating oil recovery with experimental result
Core Flooding
Run core flooding with the decided alkaine solution concentration
IFT Measurement Test
Measuring IFT using spinning drop method
Emulsion Characterization Test
Experiment to identify the nature of emulsion (water-in-oil or oil-in-water)
Compatibility Test
To test alkali with crude oil & brine water or distilled water to avoid precipitation of micro white particles
Measuring Acid Number
Measuring acid number in crude oil as per ASTM D974
Acid Extraction Experiment
Experiment to extract naphthenic acid in crude oil & make it low acid content
Literature Review
Review on researches done previously, determine scope of study and objectives of project
Preliminary Study
Understanding fundamental concepts and mechanisms lying behind alkaline flooding
Title Selection
Selection of appropriate Final Year Project title
26
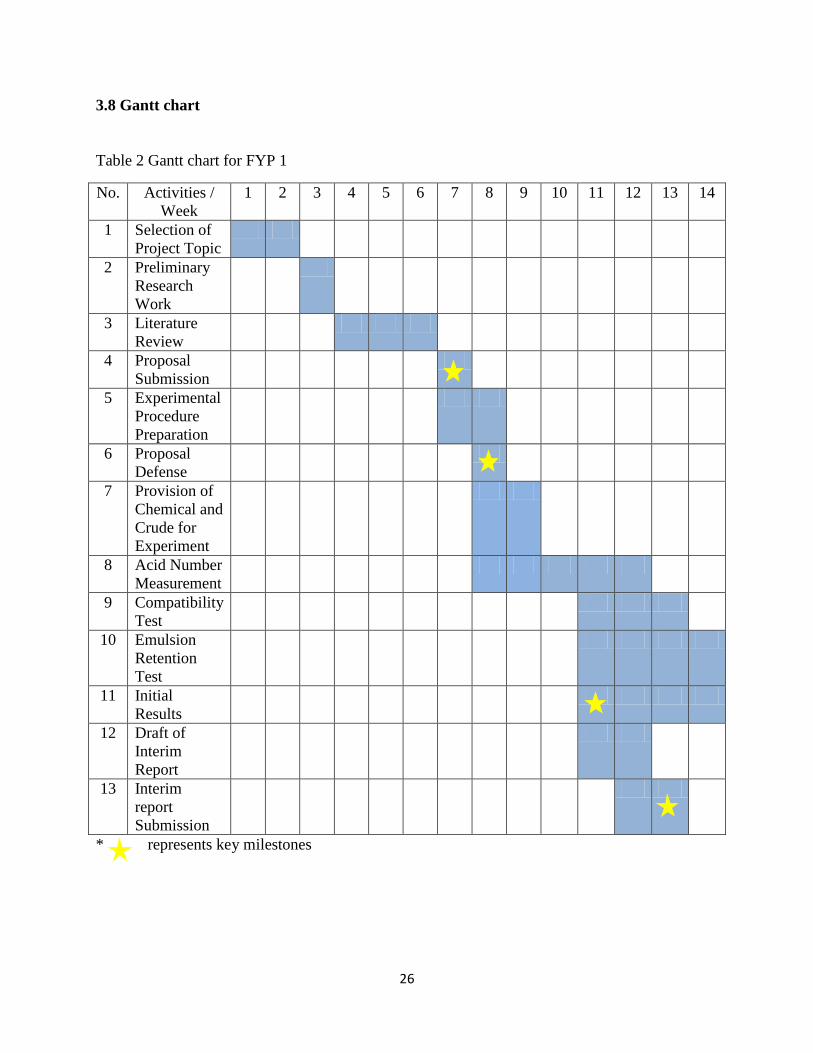
3.8 Gantt chart
Table 2 Gantt chart for FYP 1
No. Activities /
Week
1 2 3 4 5 6 7 8 9 10 11 12 13 14
1 Selection of
Project Topic
2 Preliminary
Research
Work
3 Literature
Review
4 Proposal
Submission
5 Experimental
Procedure
Preparation
6 Proposal
Defense
7 Provision of
Chemical and
Crude for
Experiment
8 Acid Number
Measurement
9 Compatibility
Test
10 Emulsion
Retention
Test
11 Initial
Results
12 Draft of
Interim
Report
13 Interim
report
Submission
* represents key milestones

27
Table 3 Gantt chart for FYP 2
No. Activities /
Week
1 2 3 4 5 6 7 8 9 10 11 12 13 14
1 IFT
Measurement
Test
2 Core
Flooding
3 Results &
Discussion
4 Progress
Report
5 Draft Report
6 Dissertation
(Soft Copy)
7 Technical
Paper
8 Oral
Presentation
9 Project
Dissertation
(Hard bound)
3.9 Key Milestones
3.9.1 FYP 1
1. Submission of extended proposal
2. Proposal defense
3. Complete literature review
4. Complete methodology
5. Completion of phase behavior experiments
3.9.2 FYP 2
1. Core flooding experiment
2. Progress report submission
3. Technical paper submission
4. Oral presentation
5. Dissertation submission
28
CHAPTER 4
4.0 Results and Discussion
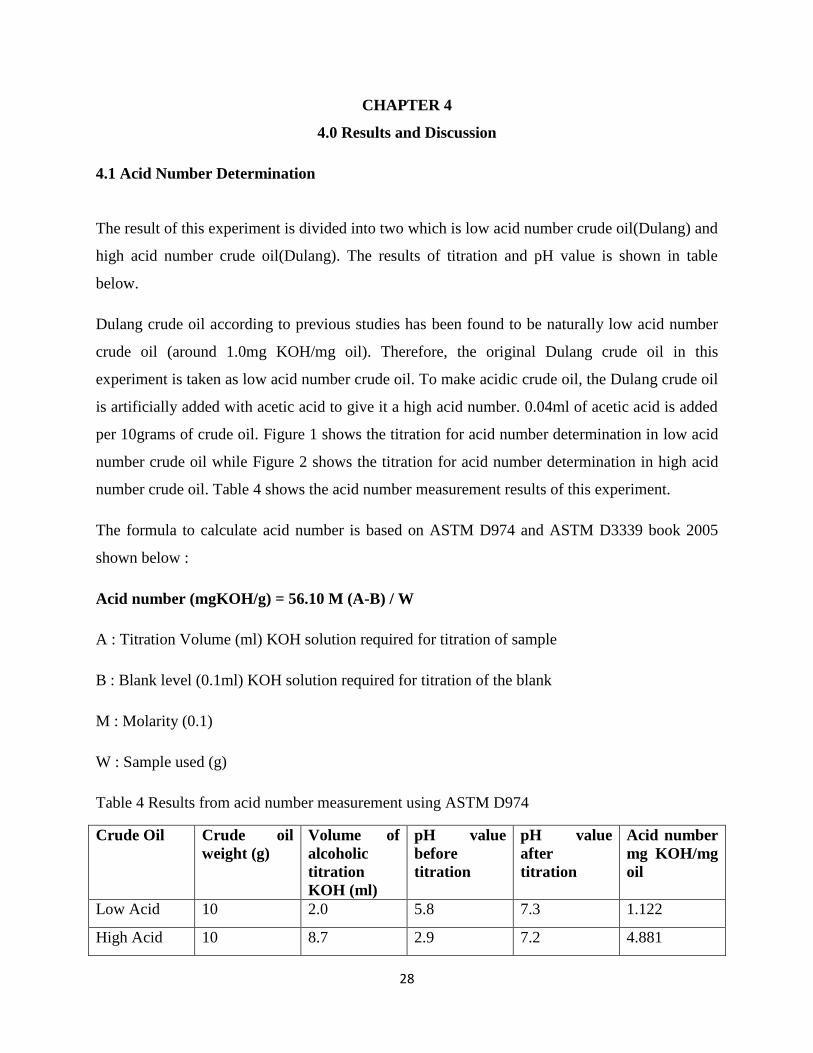
4.1 Acid Number Determination
The result of this experiment is divided into two which is low acid number crude oil(Dulang) and
high acid number crude oil(Dulang). The results of titration and pH value is shown in table
below.
Dulang crude oil according to previous studies has been found to be naturally low acid number
crude oil (around 1.0mg KOH/mg oil). Therefore, the original Dulang crude oil in this
experiment is taken as low acid number crude oil. To make acidic crude oil, the Dulang crude oil
is artificially added with acetic acid to give it a high acid number. 0.04ml of acetic acid is added
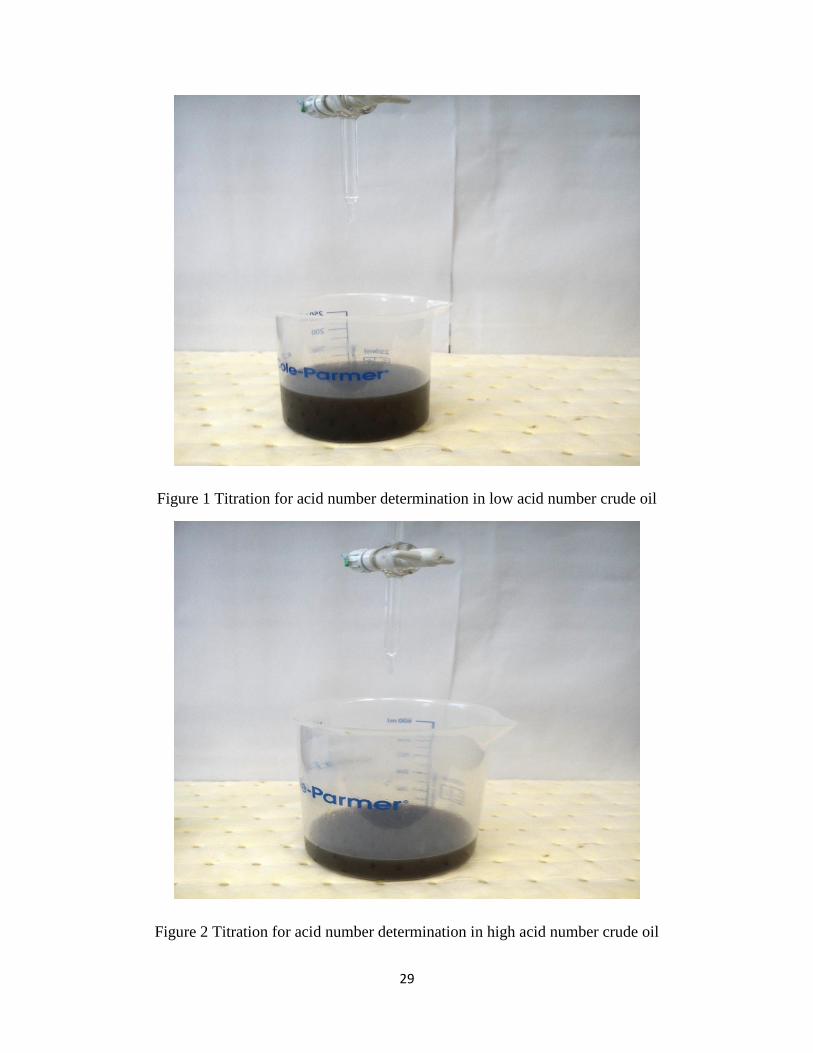
per 10grams of crude oil. Figure 1 shows the titration for acid number determination in low acid
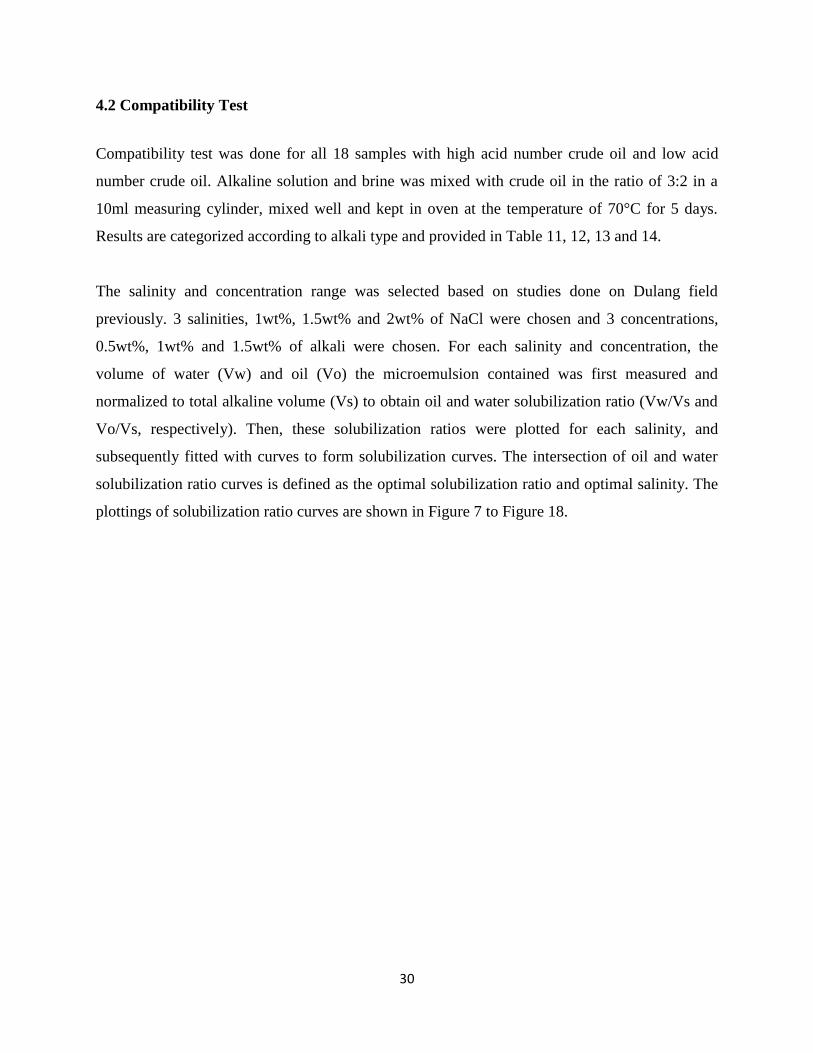
number crude oil while Figure 2 shows the titration for acid number determination in high acid
number crude oil. Table 4 shows the acid number measurement results of this experiment.
The formula to calculate acid number is based on ASTM D974 and ASTM D3339 book 2005
shown below :
Acid number (mgKOH/g) = 56.10 M (A-B) / W
A : Titration Volume (ml) KOH solution required for titration of sample
B : Blank level (0.1ml) KOH solution required for titration of the blank
M : Molarity (0.1)
W : Sample used (g)
Table 4 Results from acid number measurement using ASTM D974
Crude Oil Crude oil
weight (g)
Volume of
alcoholic
titration
KOH (ml)
pH value
before
titration
pH value
after
titration
Acid number
mg KOH/mg
oil
Low Acid 10 2.0 5.8 7.3 1.122
High Acid 10 8.7 2.9 7.2 4.881
29
Figure 1 Titration for acid number determination in low acid number crude oil
Figure 2 Titration for acid number determination in high acid number crude oil
30
4.2 Compatibility Test
Compatibility test was done for all 18 samples with high acid number crude oil and low acid
number crude oil. Alkaline solution and brine was mixed with crude oil in the ratio of 3:2 in a
10ml measuring cylinder, mixed well and kept in oven at the temperature of 70°C for 5 days.
Results are categorized according to alkali type and provided in Table 11, 12, 13 and 14.
The salinity and concentration range was selected based on studies done on Dulang field
previously. 3 salinities, 1wt%, 1.5wt% and 2wt% of NaCl were chosen and 3 concentrations,
0.5wt%, 1wt% and 1.5wt% of alkali were chosen. For each salinity and concentration, the
volume of water (Vw) and oil (Vo) the microemulsion contained was first measured and
normalized to total alkaline volume (Vs) to obtain oil and water solubilization ratio (Vw/Vs and
Vo/Vs, respectively). Then, these solubilization ratios were plotted for each salinity, and
subsequently fitted with curves to form solubilization curves. The intersection of oil and water
solubilization ratio curves is defined as the optimal solubilization ratio and optimal salinity. The
plottings of solubilization ratio curves are shown in Figure 7 to Figure 18.

31
Table 11 NaOH and brine with low acid number crude oil
NaCl
(wt%) NaOH(wt%) Oil(ml) Emulsion(ml) Water(ml) Vo/Vs Vw/Vs
1 0.5 3.8 4.2 1.8 0.633333 0.3
1 1 4 5 1 0.666667 0.166667
1 1.5 3.8 4.4 1.8 0.633333 0.3
1.5 0.5 3.7 4.4 1.6 0.616667 0.266667
1.5 1 4 4.6 1.5 0.666667 0.25
1.5 1.5 3.6 4.6 1.4 0.6 0.233333
2 0.5 3.6 4.7 1.3 0.6 0.216667
2 1 3.6 5 1 0.6 0.166667
2 1.5 3.7 4.4 1.7 0.616667 0.283333
Figure 7 0.5wt%NaOH solubilization ratio with low acid number crude oil
0
0.1
0.2
0.3
0.4
0.5
0.6
0.7
0 0.5 1 1.5 2 2.5
SR
Salinity
Low Acid Number , NaOH 0.5wt%
Vo/Vs
Vw/Vs
Poly. (Vo/Vs)
Poly. (Vw/Vs)

32
Figure 8 1wt%NaOH solubilization ratio with low acid number crude oil
Figure 9 1.5wt%NaOH solubilization ratio with low acid number crude oil
0
0.1
0.2
0.3
0.4
0.5
0.6
0.7
0.8
0 0.5 1 1.5 2 2.5
SR
Salinity
Low Acid Number, NaOH 1.0wt%
Vo/Vs
Vw/Vs
Poly. (Vo/Vs)
Poly. (Vw/Vs)
0
0.1
0.2
0.3
0.4
0.5
0.6
0.7
0 0.5 1 1.5 2 2.5
SR
Salinity
Low Acid Number, NaOH 1.5wt%
Vo/Vs
Vw/Vs
Poly. (Vo/Vs)
Poly. (Vw/Vs)
33
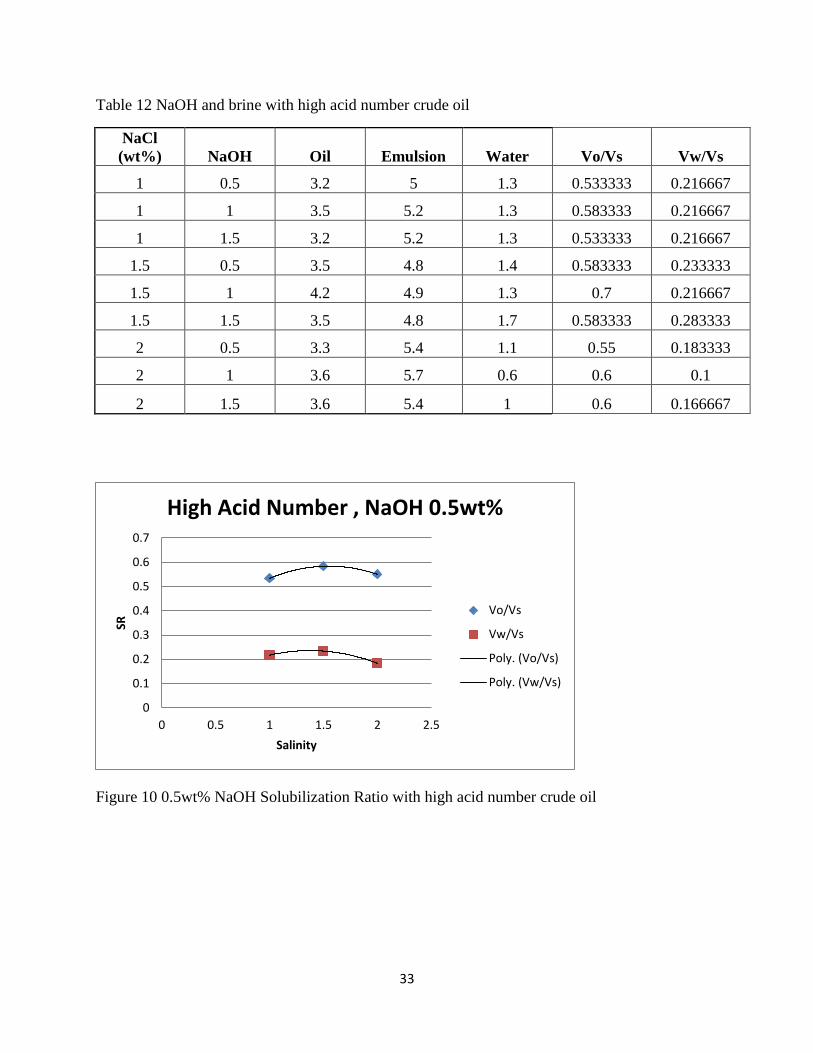
Table 12 NaOH and brine with high acid number crude oil
NaCl
(wt%) NaOH Oil Emulsion Water Vo/Vs Vw/Vs
1 0.5 3.2 5 1.3 0.533333 0.216667
1 1 3.5 5.2 1.3 0.583333 0.216667
1 1.5 3.2 5.2 1.3 0.533333 0.216667
1.5 0.5 3.5 4.8 1.4 0.583333 0.233333
1.5 1 4.2 4.9 1.3 0.7 0.216667
1.5 1.5 3.5 4.8 1.7 0.583333 0.283333
2 0.5 3.3 5.4 1.1 0.55 0.183333
2 1 3.6 5.7 0.6 0.6 0.1
2 1.5 3.6 5.4 1 0.6 0.166667
Figure 10 0.5wt% NaOH Solubilization Ratio with high acid number crude oil
0
0.1
0.2
0.3
0.4
0.5
0.6
0.7
0 0.5 1 1.5 2 2.5
SR
Salinity
High Acid Number , NaOH 0.5wt%
Vo/Vs
Vw/Vs
Poly. (Vo/Vs)
Poly. (Vw/Vs)

34
Figure 11 1wt% NaOH Solubilization Ratio with high acid number crude oil
Figure 12 1.5wt% NaOH Solubilization Ratio with high acid number crude
0
0.1
0.2
0.3
0.4
0.5
0.6
0.7
0.8
0 0.5 1 1.5 2 2.5
SR
Salinity
High Acid number , NaOH 1wt%
Vw/Vs
Vo/Vs
Poly. (Vw/Vs)
Poly. (Vo/Vs)
0
0.1
0.2
0.3
0.4
0.5
0.6
0.7
0 0.5 1 1.5 2 2.5
SR
Salinity
High Acid number , NaOH 1.5wt%
Vw/Vs
Vo/Vs
Poly. (Vw/Vs)
Poly. (Vo/Vs)
35
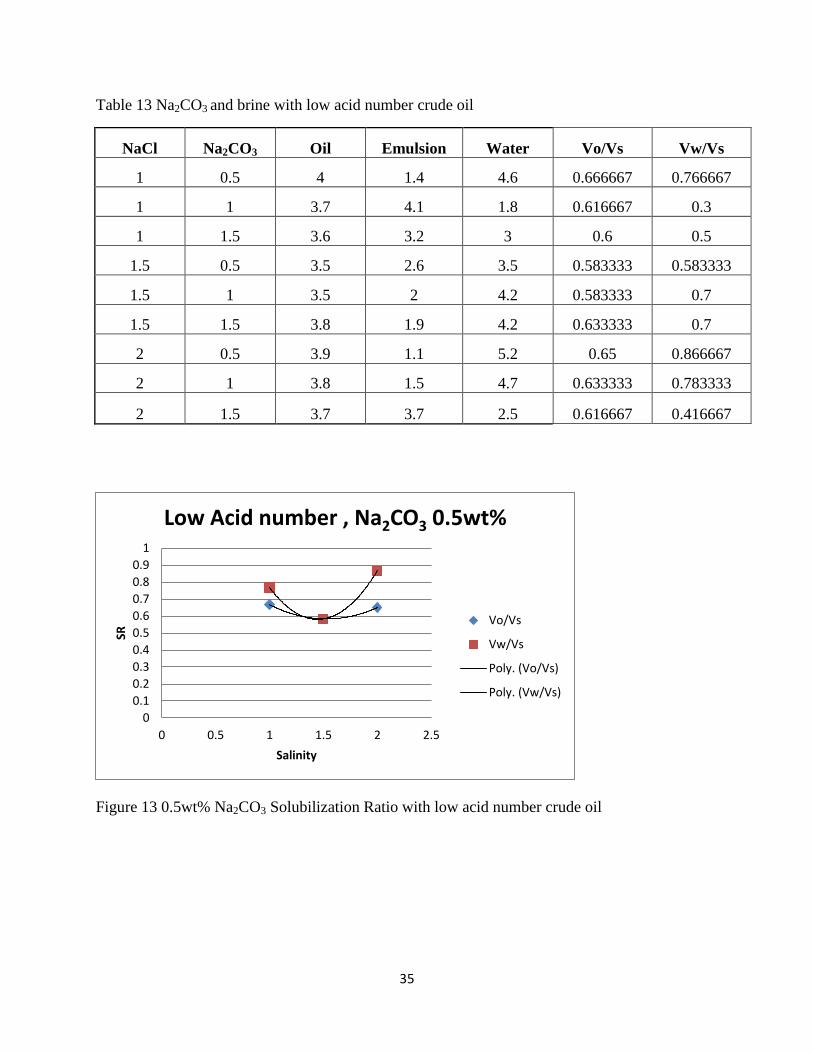
Table 13 Na2CO3 and brine with low acid number crude oil
NaCl Na2CO3 Oil Emulsion Water Vo/Vs Vw/Vs
1 0.5 4 1.4 4.6 0.666667 0.766667
1 1 3.7 4.1 1.8 0.616667 0.3
1 1.5 3.6 3.2 3 0.6 0.5
1.5 0.5 3.5 2.6 3.5 0.583333 0.583333
1.5 1 3.5 2 4.2 0.583333 0.7
1.5 1.5 3.8 1.9 4.2 0.633333 0.7
2 0.5 3.9 1.1 5.2 0.65 0.866667
2 1 3.8 1.5 4.7 0.633333 0.783333
2 1.5 3.7 3.7 2.5 0.616667 0.416667
Figure 13 0.5wt% Na2CO3 Solubilization Ratio with low acid number crude oil
0
0.1
0.2
0.3
0.4
0.5
0.6
0.7
0.8
0.9
1
0 0.5 1 1.5 2 2.5
SR
Salinity
Low Acid number , Na2CO3 0.5wt%
Vo/Vs
Vw/Vs
Poly. (Vo/Vs)
Poly. (Vw/Vs)
36
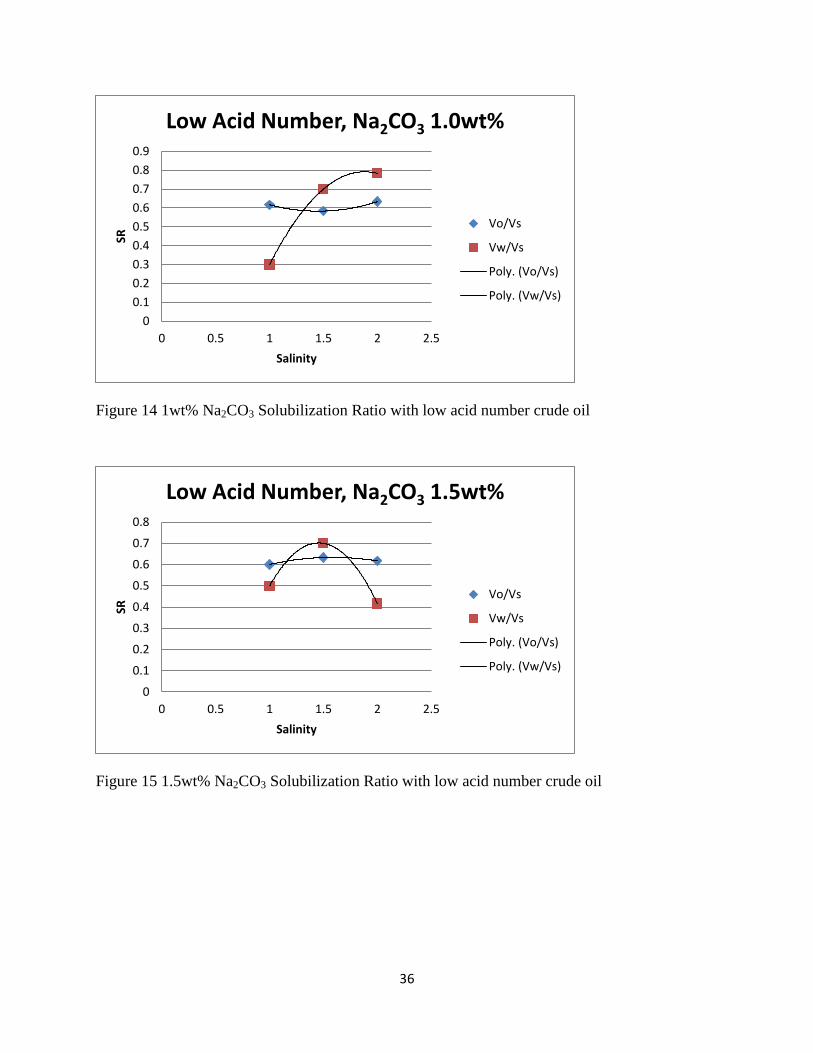
Figure 14 1wt% Na2CO3 Solubilization Ratio with low acid number crude oil
Figure 15 1.5wt% Na2CO3 Solubilization Ratio with low acid number crude oil
0
0.1
0.2
0.3
0.4
0.5
0.6
0.7
0.8
0.9
0 0.5 1 1.5 2 2.5
SR
Salinity
Low Acid Number, Na2CO3 1.0wt%
Vo/Vs
Vw/Vs
Poly. (Vo/Vs)
Poly. (Vw/Vs)
0
0.1
0.2
0.3
0.4
0.5
0.6
0.7
0.8
0 0.5 1 1.5 2 2.5
SR
Salinity
Low Acid Number, Na2CO3 1.5wt%
Vo/Vs
Vw/Vs
Poly. (Vo/Vs)
Poly. (Vw/Vs)
37
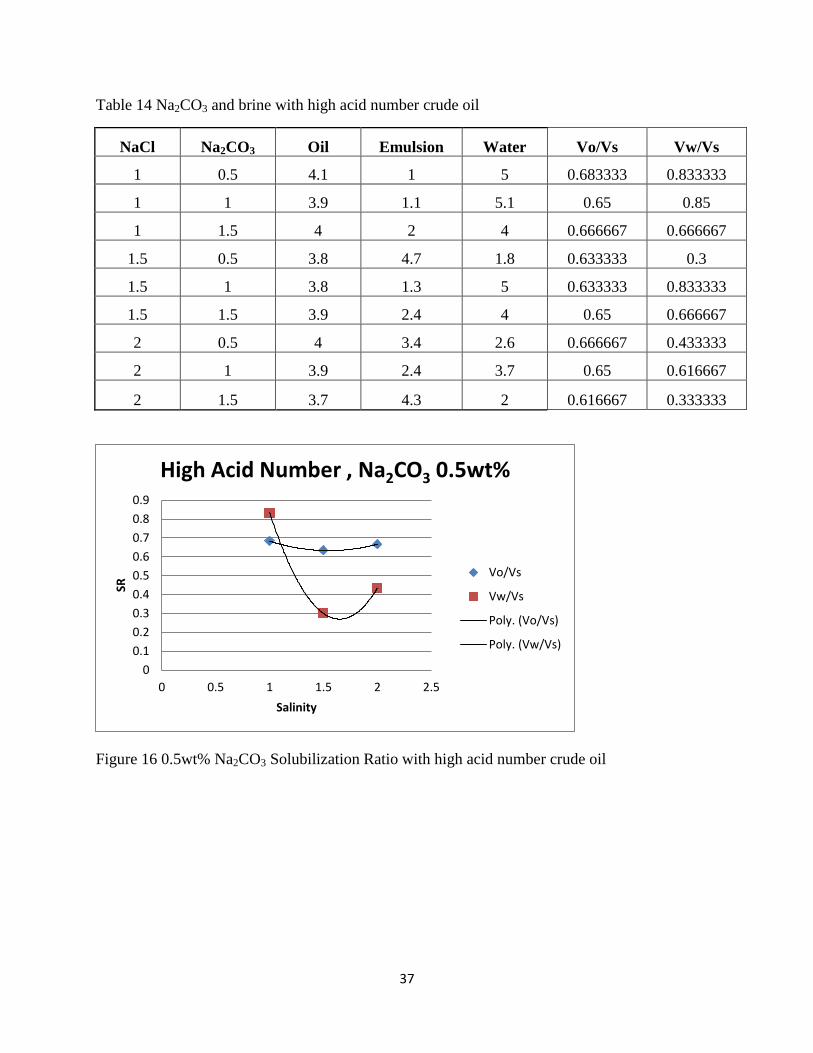
Table 14 Na2CO3 and brine with high acid number crude oil
NaCl Na2CO3 Oil Emulsion Water Vo/Vs Vw/Vs
1 0.5 4.1 1 5 0.683333 0.833333
1 1 3.9 1.1 5.1 0.65 0.85
1 1.5 4 2 4 0.666667 0.666667
1.5 0.5 3.8 4.7 1.8 0.633333 0.3
1.5 1 3.8 1.3 5 0.633333 0.833333
1.5 1.5 3.9 2.4 4 0.65 0.666667
2 0.5 4 3.4 2.6 0.666667 0.433333
2 1 3.9 2.4 3.7 0.65 0.616667
2 1.5 3.7 4.3 2 0.616667 0.333333
Figure 16 0.5wt% Na2CO3 Solubilization Ratio with high acid number crude oil
0
0.1
0.2
0.3
0.4
0.5
0.6
0.7
0.8
0.9
0 0.5 1 1.5 2 2.5
SR
Salinity
High Acid Number , Na2CO3 0.5wt%
Vo/Vs
Vw/Vs
Poly. (Vo/Vs)
Poly. (Vw/Vs)

38
Figure 17 1wt% Na2CO3 Solubilization Ratio with high acid number crude oil
Figure 18 1.5wt% Na2CO3 Solubilization Ratio with high acid number crude oil
0
0.1
0.2
0.3
0.4
0.5
0.6
0.7
0.8
0.9
1
0 1 2 3 4
SR
Salinity
High Acid number , Na2CO3 1wt%
Vw/Vs
Vo/Vs
Poly. (Vw/Vs)
Poly. (Vo/Vs)
0
0.1
0.2
0.3
0.4
0.5
0.6
0.7
0.8
0 0.5 1 1.5 2 2.5
SR
Salinity
High Acid number , Na2CO3 1.5wt%
Vw/Vs
Vo/Vs
Poly. (Vw/Vs)
Poly. (Vo/Vs)
39
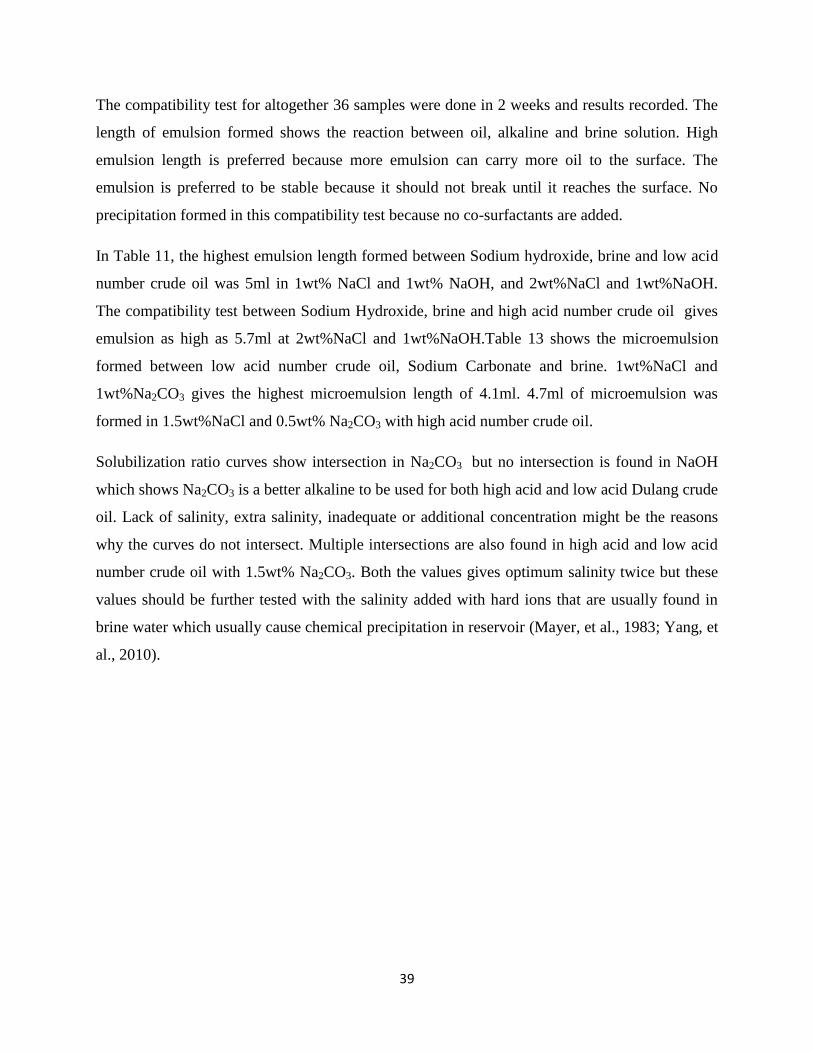
The compatibility test for altogether 36 samples were done in 2 weeks and results recorded. The
length of emulsion formed shows the reaction between oil, alkaline and brine solution. High
emulsion length is preferred because more emulsion can carry more oil to the surface. The
emulsion is preferred to be stable because it should not break until it reaches the surface. No
precipitation formed in this compatibility test because no co-surfactants are added.
In Table 11, the highest emulsion length formed between Sodium hydroxide, brine and low acid
number crude oil was 5ml in 1wt% NaCl and 1wt% NaOH, and 2wt%NaCl and 1wt%NaOH.
The compatibility test between Sodium Hydroxide, brine and high acid number crude oil gives
emulsion as high as 5.7ml at 2wt%NaCl and 1wt%NaOH.Table 13 shows the microemulsion
formed between low acid number crude oil, Sodium Carbonate and brine. 1wt%NaCl and
1wt%Na2CO3 gives the highest microemulsion length of 4.1ml. 4.7ml of microemulsion was
formed in 1.5wt%NaCl and 0.5wt% Na2CO3 with high acid number crude oil.
Solubilization ratio curves show intersection in Na2CO3 but no intersection is found in NaOH
which shows Na2CO3 is a better alkaline to be used for both high acid and low acid Dulang crude
oil. Lack of salinity, extra salinity, inadequate or additional concentration might be the reasons
why the curves do not intersect. Multiple intersections are also found in high acid and low acid
number crude oil with 1.5wt% Na2CO3. Both the values gives optimum salinity twice but these
values should be further tested with the salinity added with hard ions that are usually found in
brine water which usually cause chemical precipitation in reservoir (Mayer, et al., 1983; Yang, et
al., 2010).
40
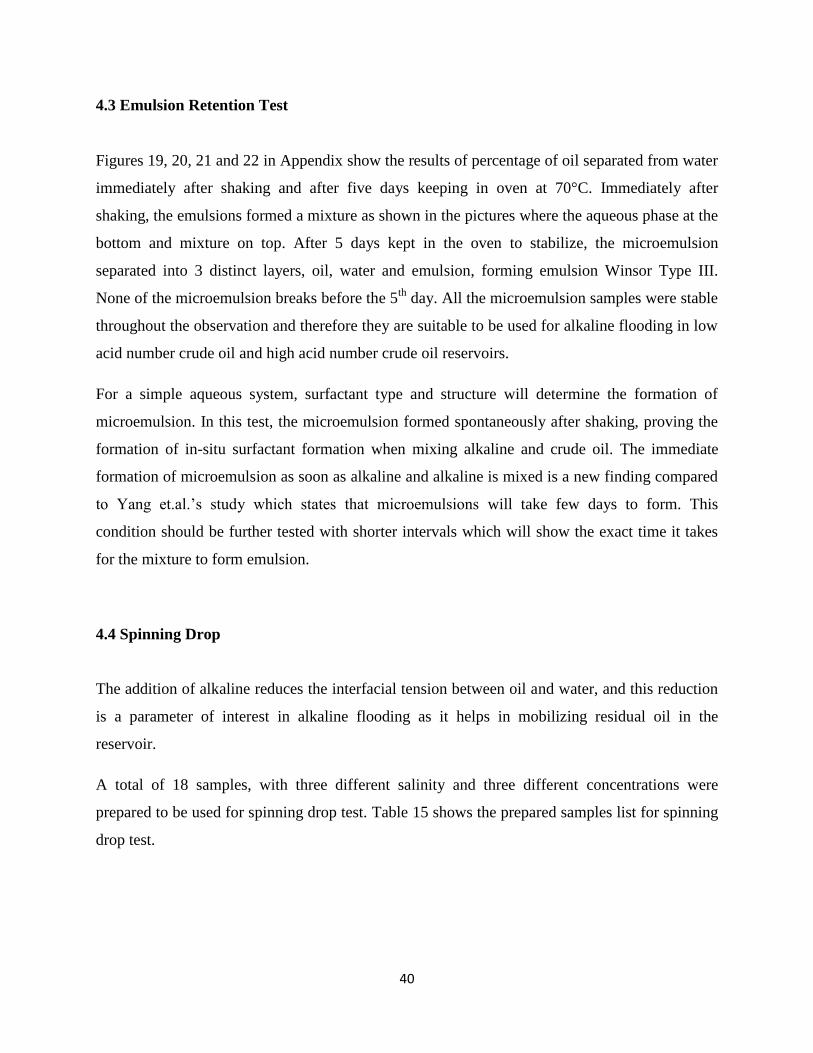
4.3 Emulsion Retention Test
Figures 19, 20, 21 and 22 in Appendix show the results of percentage of oil separated from water
immediately after shaking and after five days keeping in oven at 70°C. Immediately after
shaking, the emulsions formed a mixture as shown in the pictures where the aqueous phase at the
bottom and mixture on top. After 5 days kept in the oven to stabilize, the microemulsion
separated into 3 distinct layers, oil, water and emulsion, forming emulsion Winsor Type III.
None of the microemulsion breaks before the 5th
day. All the microemulsion samples were stable
throughout the observation and therefore they are suitable to be used for alkaline flooding in low
acid number crude oil and high acid number crude oil reservoirs.
For a simple aqueous system, surfactant type and structure will determine the formation of
microemulsion. In this test, the microemulsion formed spontaneously after shaking, proving the
formation of in-situ surfactant formation when mixing alkaline and crude oil. The immediate
formation of microemulsion as soon as alkaline and alkaline is mixed is a new finding compared
to Yang et.al.’s study which states that microemulsions will take few days to form. This
condition should be further tested with shorter intervals which will show the exact time it takes
for the mixture to form emulsion.
4.4 Spinning Drop
The addition of alkaline reduces the interfacial tension between oil and water, and this reduction
is a parameter of interest in alkaline flooding as it helps in mobilizing residual oil in the
reservoir.
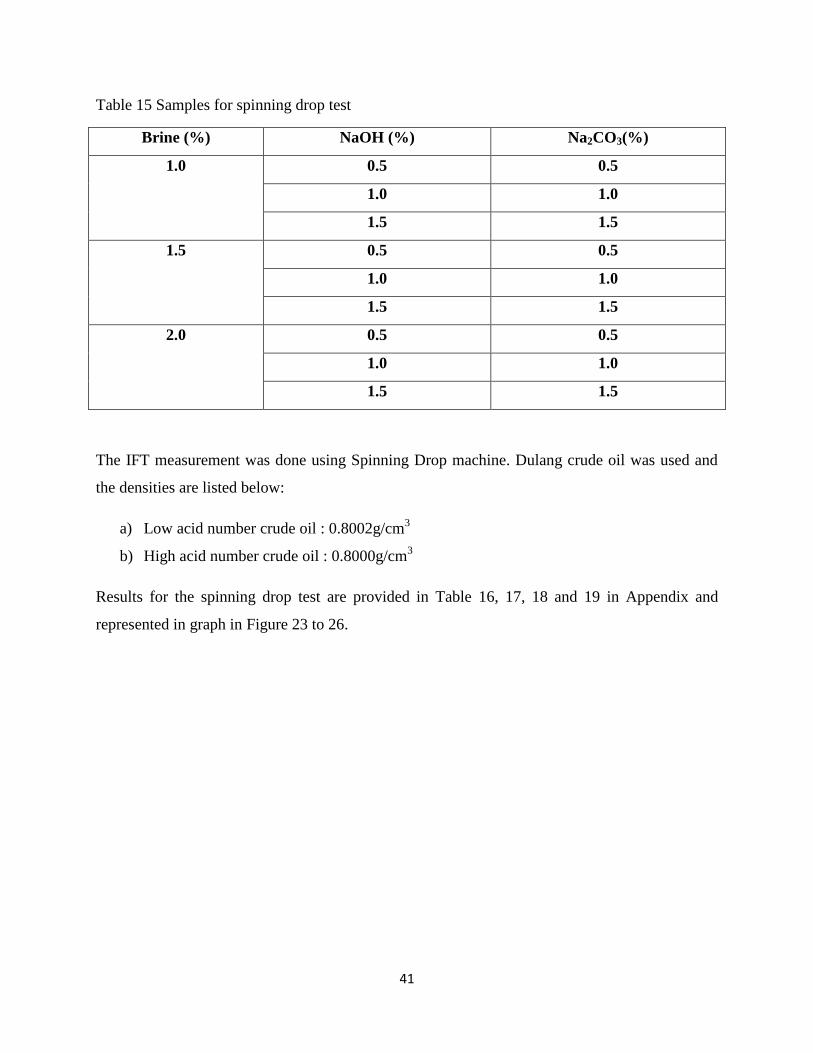
A total of 18 samples, with three different salinity and three different concentrations were
prepared to be used for spinning drop test. Table 15 shows the prepared samples list for spinning
drop test.
41
Table 15 Samples for spinning drop test
Brine (%) NaOH (%) Na2CO3(%)
1.0 0.5 0.5
1.0 1.0
1.5 1.5
1.5 0.5 0.5
1.0 1.0
1.5 1.5
2.0 0.5 0.5
1.0 1.0
1.5 1.5
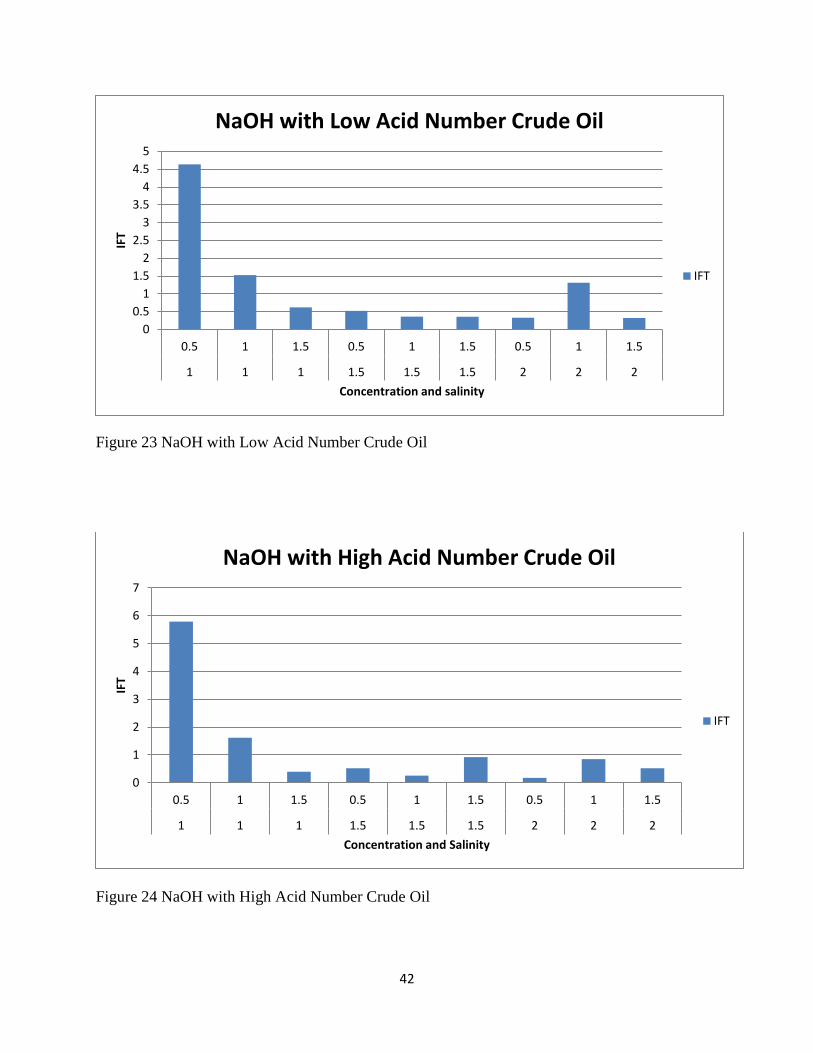
The IFT measurement was done using Spinning Drop machine. Dulang crude oil was used and
the densities are listed below:
a) Low acid number crude oil : 0.8002g/cm3
b) High acid number crude oil : 0.8000g/cm3
Results for the spinning drop test are provided in Table 16, 17, 18 and 19 in Appendix and
represented in graph in Figure 23 to 26.
42
Figure 23 NaOH with Low Acid Number Crude Oil
Figure 24 NaOH with High Acid Number Crude Oil
0
0.5
1
1.5
2
2.5
3
3.5
4
4.5
5
0.5 1 1.5 0.5 1 1.5 0.5 1 1.5
1 1 1 1.5 1.5 1.5 2 2 2
IFT
Concentration and salinity
NaOH with Low Acid Number Crude Oil
IFT
0
1
2
3
4
5
6
7
0.5 1 1.5 0.5 1 1.5 0.5 1 1.5
1 1 1 1.5 1.5 1.5 2 2 2
IFT
Concentration and Salinity
NaOH with High Acid Number Crude Oil
IFT

43
Figure 25 Na2CO3 with Low Acid Number Crude Oil
Figure 26 Na2CO3 with High Acid Number Crude Oil
0
0.5
1
1.5
2
2.5
3
0.5 1 1.5 0.5 1 1.5 0.5 1 1.5
1 1 1 1.5 1.5 1.5 2 2 2
IFT
Concentration and Salinity
Na2CO3 with Low Acid Number Crude Oil
IFT
0
0.5
1
1.5
2
2.5
0.5 1 1.5 0.5 1 1.5 0.5 1 1.5
1 1 1 1.5 1.5 1.5 2 2 2
IFT
Concentration and salinity
Na2CO3 with High Acid Number Crude Oil
IFT
44
Figure 23 shows the bar chart representation of interfacial tension (IFT) results between alkaline
solutions with brine and different crude oils. The IFT between low acid number crude oil and
Sodium Hydroxide solution with brine has the lowest reading at 2wt%NaCl and 1.5wt%NaOH.
Solutions with concentrations of 1.5wt%NaCl and 1wt%NaOH, 1.5wt%NaCl and 1.5wt%NaOH,
and 2wt%NaCl and 0.5wt% NaOH gives low IFT readings which falls between 0.2mN/m and
0.5mN/m.
The IFT between high acid number crude oil and Sodium Hydroxide with brine observed at
Figure 24 the lowest reading at 2wt%NaCl and 0.5wt%NaOH. Low readings are observed at the
concentrations of 1wt%NaCl and 1.5wt%NaOH, and 1.5wt%NaCl and 1wt%NaOH.
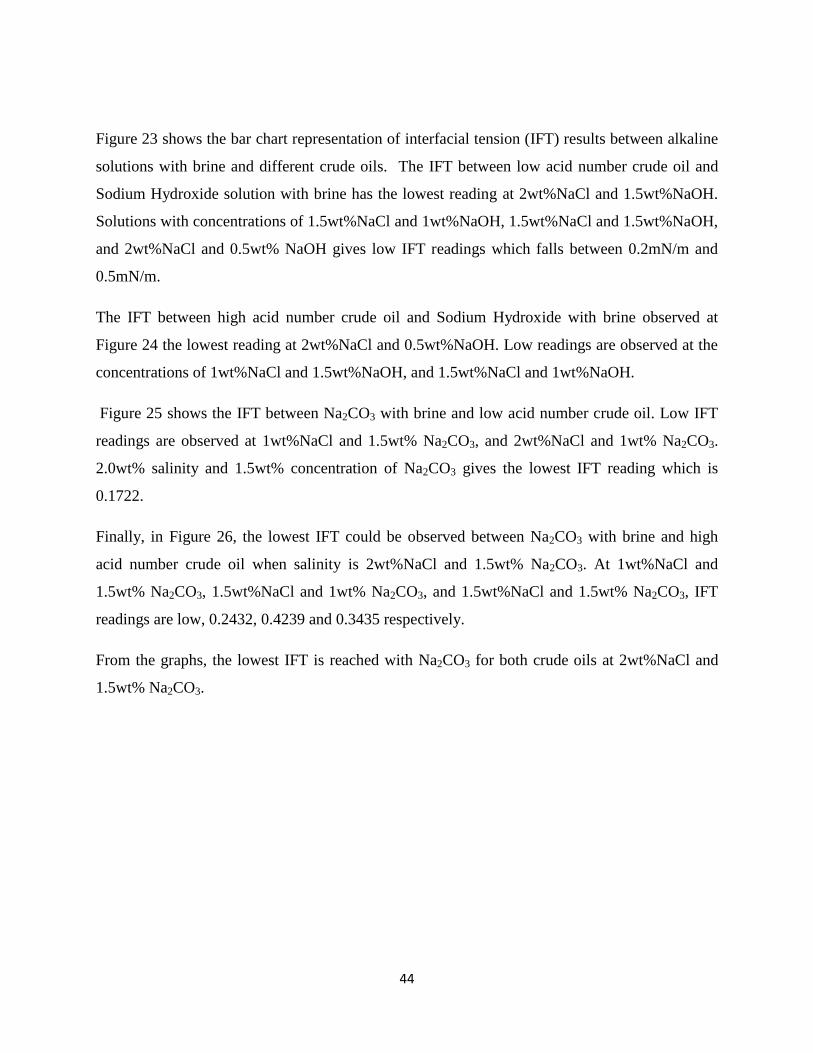
Figure 25 shows the IFT between Na2CO3 with brine and low acid number crude oil. Low IFT
readings are observed at 1wt%NaCl and 1.5wt% Na2CO3, and 2wt%NaCl and 1wt% Na2CO3.
2.0wt% salinity and 1.5wt% concentration of Na2CO3 gives the lowest IFT reading which is
0.1722.
Finally, in Figure 26, the lowest IFT could be observed between Na2CO3 with brine and high
acid number crude oil when salinity is 2wt%NaCl and 1.5wt% Na2CO3. At 1wt%NaCl and
1.5wt% Na2CO3, 1.5wt%NaCl and 1wt% Na2CO3, and 1.5wt%NaCl and 1.5wt% Na2CO3, IFT
readings are low, 0.2432, 0.4239 and 0.3435 respectively.
From the graphs, the lowest IFT is reached with Na2CO3 for both crude oils at 2wt%NaCl and
1.5wt% Na2CO3.

45
IFT is calculated based on the following formula:
r3Δ 3
γ= IFT
r= radius of drop (oil droplet)
ρ= density of fluid
ω= rotational velocities
Before running the spinning drop test, refractive index (RI) and density of the fluids at 70°C are
measured earlier. Spinning drop test is done by injecting a denser fluid (alkaline solution in this
case) into the capillary tube and set to rotate. Following that, a drop of crude oil will be injected
into the spinning capillary tube. At low rotational velocity, the oil drop will take ellipsoidal
shape, but when the velocity is large enough, it will become cylindrical. The radius of the oil
droplet is a function of IFT, Δ and rotational velocities. 70°C is used as reservoir temperature to
control the velocity. Shape of the oil droplet is set as the constant variable for all the samples for
accurate results.
The mechanism behind spinning drop test is emulsification. When a drop of crude oil in injected
into the capillary tube, it undergoes emulsification with the alkali and the machine read the
interfacial tension between these two fluids based on parameters input. The mechanism is
visualized in Figure 27.
Figure 27 Schematic of spinning drop method
46
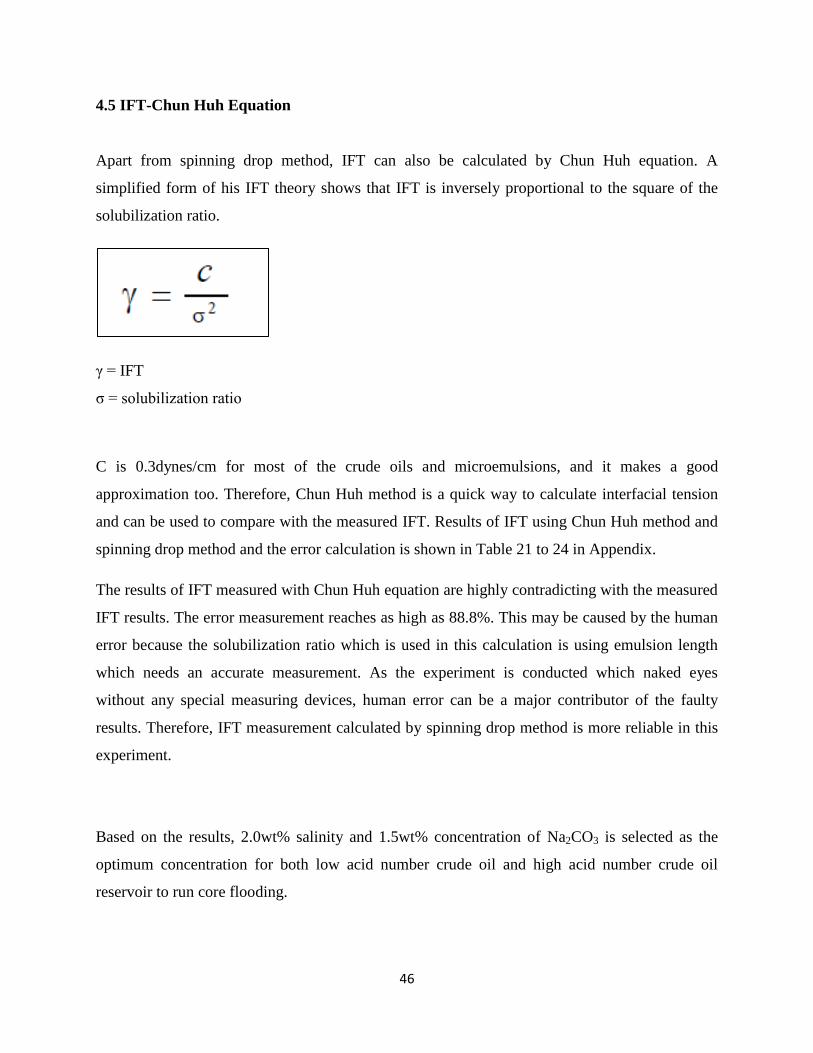
4.5 IFT-Chun Huh Equation
Apart from spinning drop method, IFT can also be calculated by Chun Huh equation. A
simplified form of his IFT theory shows that IFT is inversely proportional to the square of the
solubilization ratio.
γ = IFT
σ = solubilization ratio
C is 0.3dynes/cm for most of the crude oils and microemulsions, and it makes a good
approximation too. Therefore, Chun Huh method is a quick way to calculate interfacial tension
and can be used to compare with the measured IFT. Results of IFT using Chun Huh method and
spinning drop method and the error calculation is shown in Table 21 to 24 in Appendix.
The results of IFT measured with Chun Huh equation are highly contradicting with the measured
IFT results. The error measurement reaches as high as 88.8%. This may be caused by the human
error because the solubilization ratio which is used in this calculation is using emulsion length
which needs an accurate measurement. As the experiment is conducted which naked eyes
without any special measuring devices, human error can be a major contributor of the faulty
results. Therefore, IFT measurement calculated by spinning drop method is more reliable in this
experiment.
Based on the results, 2.0wt% salinity and 1.5wt% concentration of Na2CO3 is selected as the
optimum concentration for both low acid number crude oil and high acid number crude oil
reservoir to run core flooding.

47
4.6 Porosity of Core- Core saturating
Two Berea sandstone cores were used in this core flooding and the property data used to
characterize them are shown in Table 25. The property data include: core diameter, core length,
dry weight, wet weight, bulk volume, pore volume, porosity and area. The crude oil used in this
experiment is produced from Dulang field, which is a sandstone reservoir, therefore it is suitable
to be represented by Berea sandstone cores throughout the experiment.
Porosity of the core is calculated by saturation method. Dry weight of core is measured before
saturating it in 500ml distilled water. It is then kept in dessicator attached to a vacuum pump and
left for saturation overnight. Once the core is fully saturated, the wet weight of core is measured
and used to calculate the pore volume and porosity.
Table 25 Property data of cores
Core A1 A2
Diameter(cm) 3.692 3.690
Length(cm) 6.878 7.266
Dry weight(g) 161.0356 168.9223
Wet weight(g) 182.172 173.728
Bulk Volume (cc) 73.63 77.70
Pore volume(cc) 21.14 4.8057
Porosity(%) 28.71 6.18
Area 10.71 10.69
48
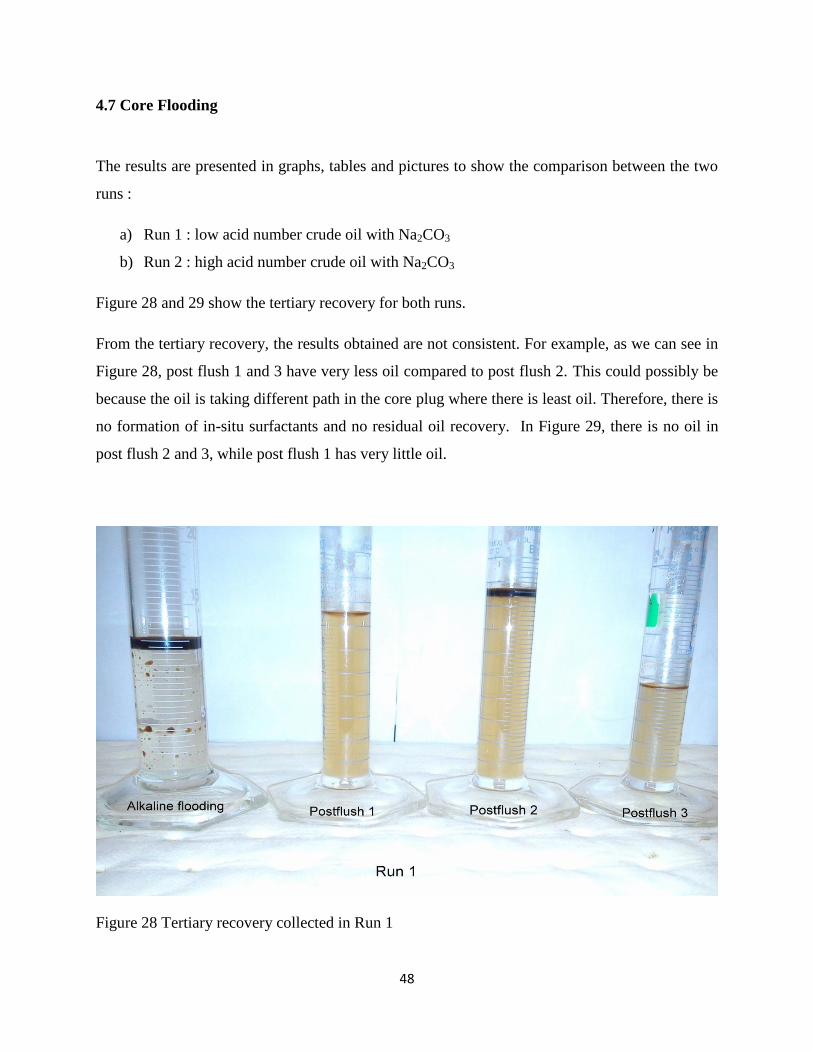
4.7 Core Flooding
The results are presented in graphs, tables and pictures to show the comparison between the two
runs :
a) Run 1 : low acid number crude oil with Na2CO3
b) Run 2 : high acid number crude oil with Na2CO3
Figure 28 and 29 show the tertiary recovery for both runs.
From the tertiary recovery, the results obtained are not consistent. For example, as we can see in
Figure 28, post flush 1 and 3 have very less oil compared to post flush 2. This could possibly be
because the oil is taking different path in the core plug where there is least oil. Therefore, there is
no formation of in-situ surfactants and no residual oil recovery. In Figure 29, there is no oil in
post flush 2 and 3, while post flush 1 has very little oil.
Figure 28 Tertiary recovery collected in Run 1

49
Figure 29 Tertiary recovery collected in Run 2
As shown in Table 26, the oil recovered after alkaline flooding in Run 1 is 2ml at pore volume of
0.5. Alkaline flooding in Run 2 recovered 1 ml at pore volume of 0.5. The results indicate that
alkaline flooding is possible in any reservoirs regardless of acid number as there are recoveries in
both the runs corresponding to Mayer. et al. which states that there is no proven theory of acid
number affecting the recovery in oilfield.
Table 26 Volume of oil and water displaced and recovery factor for Run 1 and Run 2
Run 1 2
Original water in place (ml) 16 13
Connate water (ml) 5 5
Connate water saturation (Swc) 0.3125 0.3846
Original oil in place (ml) 11 8
Volume of oil displaced after water flooding
(ml)
6 5
Volume of oil displaced after alkaline flooding
(ml)
2 1
Recovery factor of water flooding (%) 54.54 62.50
Recovery factor of alkaline flooding (%) 72.72 75
Incremental recovery (%) 18.18 12.50
50
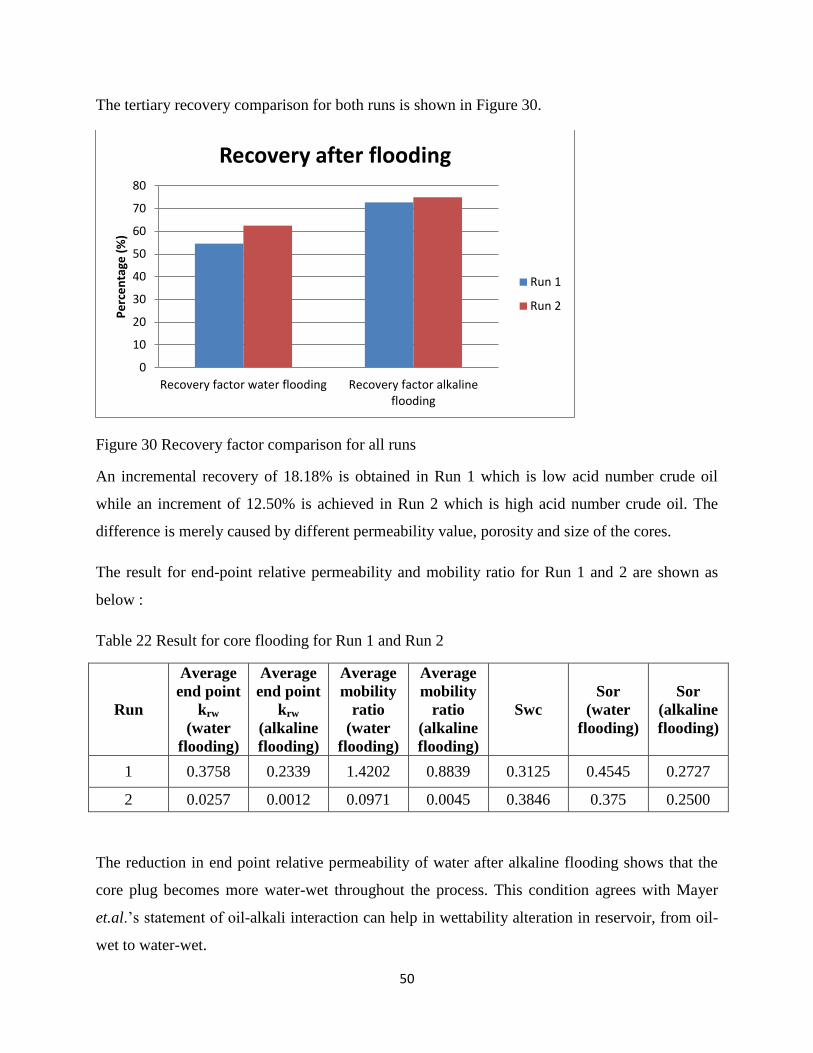
The tertiary recovery comparison for both runs is shown in Figure 30.
Figure 30 Recovery factor comparison for all runs
An incremental recovery of 18.18% is obtained in Run 1 which is low acid number crude oil
while an increment of 12.50% is achieved in Run 2 which is high acid number crude oil. The
difference is merely caused by different permeability value, porosity and size of the cores.
The result for end-point relative permeability and mobility ratio for Run 1 and 2 are shown as
below :
Table 22 Result for core flooding for Run 1 and Run 2
Run
Average
end point
krw
(water
flooding)
Average
end point
krw
(alkaline
flooding)
Average
mobility
ratio
(water
flooding)
Average
mobility
ratio
(alkaline
flooding)
Swc
Sor
(water
flooding)
Sor
(alkaline
flooding)
1 0.3758 0.2339 1.4202 0.8839 0.3125 0.4545 0.2727
2 0.0257 0.0012 0.0971 0.0045 0.3846 0.375 0.2500
The reduction in end point relative permeability of water after alkaline flooding shows that the
core plug becomes more water-wet throughout the process. This condition agrees with Mayer
et.al.’s statement of oil-alkali interaction can help in wettability alteration in reservoir, from oil-
wet to water-wet.
0
10
20
30
40
50
60
70
80
Recovery factor water flooding Recovery factor alkalineflooding
Pe
rce
nta
ge (
%)
Recovery after flooding
Run 1
Run 2

51
Reduction in mobility ratio shows that the displacement is stable, without any viscous-fingering
condition. M<1 obtained in this result is a favorable mobility ratio in the reservoir. This result
also shows that the formation of microemulsion inside the core might have aided in the
mobilization and production of oil. Pressure difference is found to be stable for both the runs
shows that the production was stable and good sweep efficiency throughout core flooding.
As a conclusion it can be said that the indirect mechanism calculated in this experiment is
wettability alteration as stated by Bortolotti, Gottardi, et al. Reduction in end point relative
permeability after alkaline flooding shows that the core plug became more water-wet. Further
studies should be conducted on this mechanism to prove its validity by testing it on various crude
oils and setting Dulang crude oil as controlled variable. They should also be further tested along
IFT measurement and emulsification.
The calculation method for end point relative permeability and mobility ratio is shown in
appendix together with related data and pictures.

52
CHAPTER 5
5.0 Conclusion & Recommendation
5.1 Conclusion
In conclusion, alkaline flooding is successful even in low acid number crude oil where the
recovery of residual oil in Run 1 is 72.72% which also gives the increment of 18.18%. In
comparison to low acid number crude oil, Run 2 which is high acid number crude oil also has the
residual oil recovery of 75% and increment of 12.5%. Sodium Carbonate has been chosen and
used as the preferable alkali for Dulang crude oil as it is found to be the most compatible and
effective alkali through phase behavior experiments.
The objectives of this project are achieved because the optimum salinity and concentration of
alkaline solution is identified as 2wt% NaCl, 1.5wt% Na2CO3 through compatibility test. The
emulsion formed immediately after mixing alkaline solution and crude oil for both high and low
acid number crudes and became Type 3 after 5 days of stabilisation. The emulsion formed
between both crudes and alkaline are stable for 5 days without breaking and IFT between the
aqueous solution and crude is obtained as low as 0.1722mN/m.
A new theory that can be driven through this project is high acid number crude oil is not a
requirement for alkaline flooding, but instead the presence of a minimal amount of acid in the
crude oil is sufficient for it to be successful. Reduction in relative permeability and mobility ratio
indicates that wettability alteration has taken place in the core plug to be more water-wet and
stable sweeping throughout the recovery process.
Lastly, the most important mechanisms that aids in alkaline flooding are identified as wettability
alteration and emulsification because these two mechanisms are very obvious through core
flooding. However, IFT, which was used as one of the important characterization in selecting
the alkaline type and concentration, is also a key mechanism in alkaline flooding.

53
5.2 Recommendation
After conducting the experiments, there are some results which are found to be different from the
studies and journals previously. First is the emulsification. Journal stated that it will take a few
days to form microemulsion between crude oil and alkaline solution, but during this project, the
mixture formed microemulsion immediately after shaking. This finding need to be further tested
in terms of time to find out the exact time it takes to form the microemulsion and should be
observed in shorter intervals for a long observation period. Through this, a more accurate and
detailed result on microemulsion formation can be identified.
Secondly, the core flooding should be done with both Sodium Hydroxide and Sodium Carbonate
solution for low and high acid number crude oils. More runs will show a good comparison of the
alkaline solution on its effectiveness for both types of crude oils. Thirdly, the core flooding
should be conducted on cores cut from the same type of core with same size and properties. A
better result could be obtained if the original wettability of the core is restored while doing the
experiment at its initial conditions. Fourthly, alkaline consumption throughout the core flooding
should also be measured in order to find out the adsorption rate of alkali on the rock surfaces.
This finding can prevent excessive alkaline injection into the core.
Finally, this project should be conducted with a wide range of crude oils with different properties
and concentration of alkali apart from Dulang in measuring the IFT, wettability alteration,
compatibility and recovery through core flooding so that the result could also be applicable to
various types of crude oils.

54
References
[1] Bortolotti, V., Gottardi, G., Macini, P., & Srisuriyachai, F. (2009). Intermittent Alkali Flooding in Vertical Carbonate Reservoirs. Paper presented at the EUROPEC/EAGE Conference and Exhibition, Amsterdam, The Netherlands. http://www.onepetro.org/mslib/app/Preview.do?paperNumber=SPE-121832-MS&societyCode=SPE
[2] Bortolotti, V., Macini, P., & Srisuriyachai, F. (2009). Laboratory Evaluation of Alkali and Alkali-Surfactant-Polymer Flooding Combined With Intermittent Flow in Carbonatic Rocks. Paper presented at the Asia Pacific Oil and Gas Conference & Exhibition, Jakarta, Indonesia. http://www.onepetro.org/mslib/app/Preview.do?paperNumber=SPE-122499-MS&societyCode=SPE
[3] Burk, J. H. (1987). Comparison of Sodium Carbonate, Sodium Hydroxide, and Sodium Orthosilicate for EOR. SPE Reservoir Engineering, 2(1), 9-16. doi: 10.2118/12039-pa
[4] Chang, M.-S. M., & Wasan, D. T. (1980). EMULSION CHARACTERISTICS ASSOCIATED WITH AN ALKALINE WATER FLOODING PROCESS. Paper presented at the SPE Oilfield and Geothermal Chemistry Symposium, Stanford, California. http://www.onepetro.org/mslib/app/Preview.do?paperNumber=00009001&societyCode=SPE
[5] Chlwetelu, C. I., Neale, G. H., Hornof, V., & George, A. E. (1992). Alkaline Waterflooding Of Saskatchewan Heavy Oil Reservoirs- Part I: Screening Of Caustic Reagents. Paper presented at the Technical Meeting / Petroleum Conference Of The South Saskatchewan Section, Regina. http://www.onepetro.org/mslib/app/Preview.do?paperNumber=PETSOC-SS-92-19&societyCode=PETSOC
[6] Cooke Jr., C. E., Williams, R. E., & Kolodzie, P. A. (1974). Oil Recovery by Alkaline Waterflooding. Journal of Petroleum Technology, 26(12), 1365-1374. doi: 10.2118/4739-pa
[7] deZabala, E. F., & Radke, C. J. (1986). A Nonequilibrium Description of Alkaline Waterflooding. SPE Reservoir Engineering, 1(1), 29-43. doi: 10.2118/11213-pa
[8] Ehrlich, R., & Wygal Jr., R. J. (1977). Interrelation of Crude Oil and Rock Properties With the Recovery of Oil by Caustic Waterflooding. Society of Petroleum Engineers Journal, 17(4), 263-270. doi: 10.2118/5830-pa
[9] Fan, T., & Buckley, J. S. (2007). Acid Number Measurements Revisited. SPE Journal, 12(4), pp. 496-500. doi: 10.2118/99884-pa
[10] French, T. R., & Burchfield, T. E. (1990). Design and Optimization of Alkaline Flooding Formulations. Paper presented at the SPE/DOE Enhanced Oil Recovery Symposium, Tulsa, Oklahoma. http://www.onepetro.org/mslib/app/Preview.do?paperNumber=00020238&societyCode=SPE
[11] JENNING JR., H. Y. (1975). A Study of Caustic Solution-Crude Oil Interfacial Tensions. Society of Petroleum Engineers Journal, 15(3), 197-202. doi: 10.2118/5049-pa
[12] Kumar, R., Dao, E., & Mohanty, K. (2012). Heavy-Oil Recovery by In-Situ Emulsion Formation. SPE Journal, 17(2), pp. 326-334. doi: 10.2118/129914-pa
[13] Labrid, J. C. (1979). OIL DISPLACEMENT MECHANISMS BY WINSOR'S TYPE I MICELLAR SYSTEMS. Paper presented at the SPE Annual Technical Conference and Exhibition, Las Vegas, Nevada. http://www.onepetro.org/mslib/app/Preview.do?paperNumber=00008325&societyCode=SPE
[14] Li, J., Wang, W., & Gu, Y. (2003). Dynamic Interfacial Tension and Oil Shrinking Effect of Crude Oil in Alkaline Solutions. Paper presented at the Canadian International Petroleum Conference,
55
Calgary, Alberta. http://www.onepetro.org/mslib/app/Preview.do?paperNumber=PETSOC-2003-139&societyCode=PETSOC
[15] Mayer, E. H., Berg, R. L., Carmichael, J. D., & Weinbrandt, R. M. (1983). Alkaline Injection for Enhanced Oil Recovery - A Status Report. Journal of Petroleum Technology, 35(1), 209-221. doi: 10.2118/8848-pa
[16] McGuire, P. L., Chatham, J. R., Paskvan, F. K., Sommer, D. M., & Carini, F. H. (2005). Low Salinity Oil Recovery: An Exciting New EOR Opportunity for Alaska’s North Slope. Paper presented at the SPE Western Regional Meeting, Irvine, California. http://www.onepetro.org/mslib/app/Preview.do?paperNumber=SPE-93903-MS&societyCode=SPE
[17] Okasha, T. M., & Alshiwaish, A. (2009). Effect of Brine Salinity on Interfacial Tension in Arab-D Carbonate Reservoir, Saudi Arabia. Paper presented at the SPE Middle East Oil and Gas Show and Conference, Bahrain, Bahrain. http://www.onepetro.org/mslib/app/Preview.do?paperNumber=SPE-119600-MS&societyCode=SPE
[18] Paktinat, J., Pinkhouse, J., Williams, C., & Penny, G. S. (2005). Microemulsion Reduces Adsorption and Emulsion Tendencies in Bradford and Speechley Sandstone Formations. Paper presented at the SPE International Symposium on Oilfield Chemistry, The Woodlands, Texas. http://www.onepetro.org/mslib/app/Preview.do?paperNumber=00093270&societyCode=SPE
[19] Smith, J. E. (1993). How To Rate Crude Oils for Alkaline Flooding Potential: A Study Based on 239 Crude Oils. Paper presented at the SPE International Symposium on Oilfield Chemistry, New Orleans, Louisiana. http://www.onepetro.org/mslib/app/Preview.do?paperNumber=00025171&societyCode=SPE
[20] Thomas, S., Scoular, J. R., Verkoczy, B., & Ali, S. M. F. (1999). Chemical Methods For Heavy Oil Recovery. Paper presented at the Technical Meeting / Petroleum Conference Of The South Saskatchewan Section, Regina. http://www.onepetro.org/mslib/app/Preview.do?paperNumber=PETSOC-99-103&societyCode=PETSOC
[21] Tong, M., Liu, P., Zhang, L., & Zhu, Y. (1986). AN IMPROVED MODEL FOR INTERFACIAL ACTIVITY OF ACIDIC OIL/CAUSTIC SYSTEM FOR ALKALINE FLOODING. Paper presented at the International Meeting on Petroleum Engineering, Beijing, China. http://www.onepetro.org/mslib/app/Preview.do?paperNumber=00014855&societyCode=SPE
[22] Yang, H. T., Britton, C., Liyanage, P. J., Solairaj, S., Kim, D. H., Nguyen, Q. P., . . . Pope, G. A. (2010). Low-Cost, High-Performance Chemicals for Enhanced Oil Recovery. Paper presented at the SPE Improved Oil Recovery Symposium, Tulsa, Oklahoma, USA. http://www.onepetro.org/mslib/app/Preview.do?paperNumber=SPE-129978-MS&societyCode=SPE

56
Appendix
Emulsion Retention Test
Figure 19 Observation after 5days showing the microemulsion formed between NaOH, brine
and low acid number crude oil
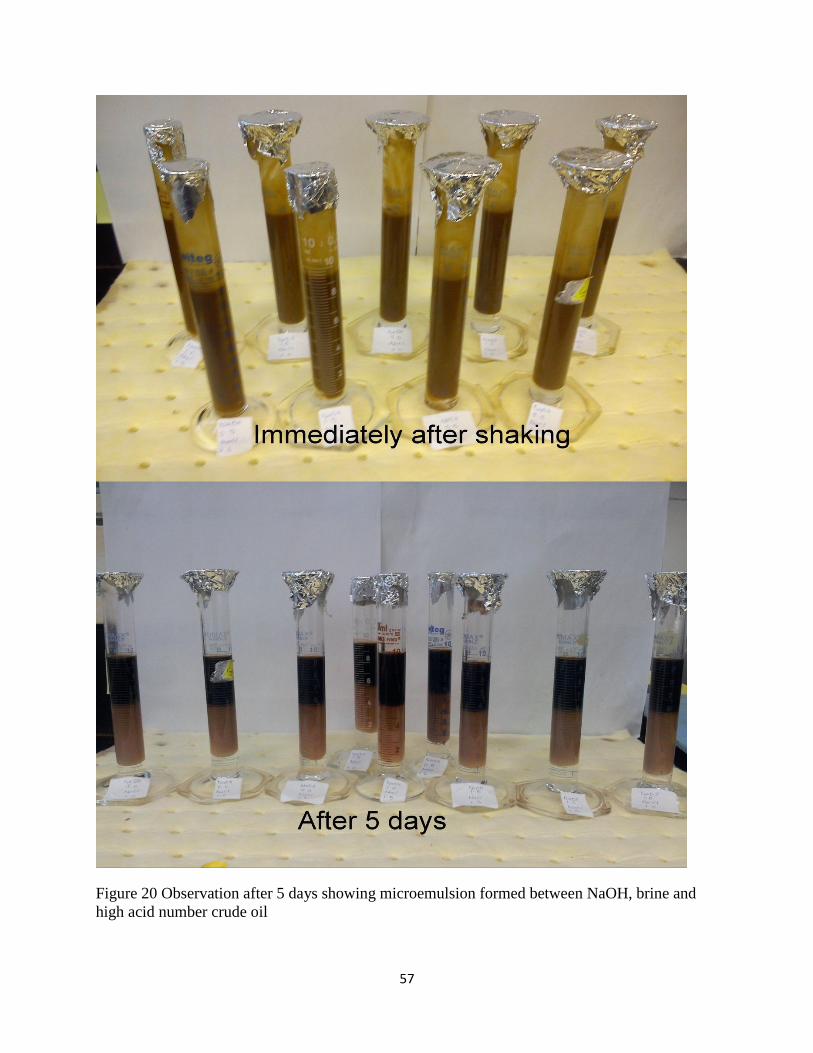
57
Figure 20 Observation after 5 days showing microemulsion formed between NaOH, brine and
high acid number crude oil

58
Figure 21 Observation after 5 days showing microemulsion formed between Na2CO3 , brine and
low acid number crude oil
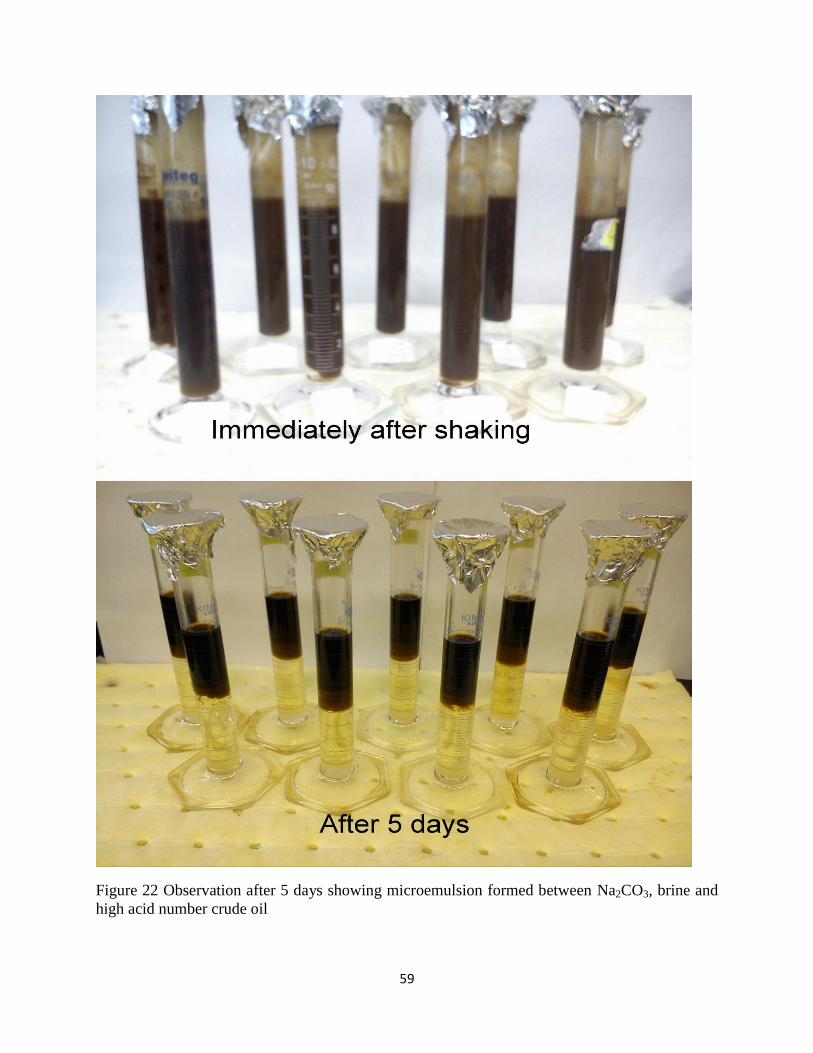
59
Figure 22 Observation after 5 days showing microemulsion formed between Na2CO3, brine and
high acid number crude oil

60
Spinning Drop
Table 16 Spinning drop results for NaOH with brine with low acid number crude oil
*Color codes are defined in Table 10.
Table 17 Spinning drop results for NaOH and brine with high acid number crude oil
NaCl (wt%)
NaOH
(wt%)
Density
(g/cm3) RI RPM IFT(mN/m)
1 0.5 0.9916 1.3281 4206 5.789
1 1 0.997 1.3292 4378 1.6137
1 1.5 1.0019 1.3304 2918 0.3932
1.5 0.5 0.9954 1.329 2532 0.5195
1.5 1 1.0001 1.3301 1545 0.2581
1.5 1.5 1.0055 1.3318 2089 0.9232
2 0.5 0.9995 1.3303 1803 0.1755
2 1 1.0036 1.3311 3776 0.8449
2 1.5 1.0093 1.3322 2802 0.5186
NaCl(wt%) NaOH(wt%) Density(g/cm3) RI RPM IFT (mN/m)
1 0.5 0.9916 1.3281 4764 4.6351
1 1 0.997 1.3292 4206 1.525
1 1.5 1.0019 1.3304 2675 0.6189
1.5 0.5 0.9954 1.329 3004 0.5195
1.5 1 1.0001 1.3301 2074 0.3576
1.5 1.5 1.0055 1.3318 2417 0.356
2 0.5 0.9995 1.3303 2103 0.3278
2 1 1.0036 1.3311 2417 1.3117
2 1.5 1.0093 1.3322 2846 0.32

61
Table 18 Spinning drop results for Na2CO3 and brine with low acid number crude oil
NaCl(wt%) Na2CO3 (wt%) Density(g/cm3) RI RPM IFT(mN/m)
1 0.5 0.9911 1.3278 4278 2.3691
1 1 0.996 1.3289 2573 0.9232
1 1.5 0.9963 1.3299 1675 0.2935
1.5 0.5 0.9966 1.3289 2702 2.3903
1.5 1 0.9997 1.3295 2847 1.6619
1.5 1.5 1.0044 1.3306 2803 1.4953
2 0.5 0.9979 1.3294 2661 1.7106
2 1 1.003 1.3304 2661 0.4681
2 1.5 1.0092 1.3319 1659 0.1722
Table 19 Spinning drop results for Na2CO3 and brine with high acid number crude oil
NaCl(wt%) Na2CO3 (wt%) Density(g/cm3) RI RPM IFT(mN/m)
1 0.5 0.9911 1.3278 4890 1.789
1 1 0.996 1.3289 2045 0.5221
1 1.5 0.9963 1.3299 1415 0.2432
1.5 0.5 0.9966 1.3289 2517 1.4579
1.5 1 0.9997 1.3295 2318 0.4239
1.5 1.5 1.0044 1.3306 1674 0.3435
2 0.5 0.9979 1.3294 3219 2.0202
2 1 1.003 1.3304 1760 0.5925
2 1.5 1.0092 1.3319 2961 0.1722
The color codes in the tables refer to the classification as provided in Table 20.

62
Table 20 Classification of IFT readings
Low IFT
(0.2-0.5)
Lowest IFT
<0.2
IFT-Chun Huh Equation
Table 21 IFT results for NaOH with low acid number crude oil
NaCl NaOH
Spinning Drop
IFT
Chun Huh
IFT Error
1 0.5 4.6351 0.7479 83.8639
1 1 1.525 0.6750 55.7377
1 1.5 0.6189 0.7479 20.8471
1.5 0.5 0.5195 0.7889 51.8570
1.5 1 0.3576 0.6750 88.7584
1.5 1.5 0.356 0.8333 57.2800
2 0.5 0.3278 0.8333 60.6640
2 1 1.3117 0.8333 36.4692
2 1.5 0.32 0.7889 59.4370

63
Table 22 IFT results for NaOH with high acid number crude oil
NaCl NaOH
Spinning Drop
IFT Chun Huh IFT Error
1 0.5 5.789 1.054688 81.7812
1 1 1.6137 0.881633 45.3658
1 1.5 0.3932 1.054688 62.7188
1.5 0.5 0.5195 0.881633 69.7079
1.5 1 0.2581 0.612245 57.8437
1.5 1.5 0.9232 0.881633 4.5025
2 0.5 0.1755 0.991736 82.3038
2 1 0.8449 0.833333 1.3690
2 1.5 0.5186 0.833333 60.6890
Table 23 IFT results for Na2CO3 with low acid number crude oil
NaCl Na2CO3
Spinning Drop
IFT Chun Huh IFT Error
1 0.5 2.3691 0.675 71.5082
1 1 0.9232 0.788897 14.5476
1 1.5 0.2935 0.833333 64.7800
1.5 0.5 2.3903 0.881633 63.1162
1.5 1 1.6619 0.881633 46.9503
1.5 1.5 1.4953 0.747922 49.9818
2 0.5 1.7106 0.710059 58.4906
2 1 0.4681 0.747922 59.7783
2 1.5 0.1722 0.788897 78.1721

64
Table 24 IFT results for Na2CO3 with high acid number crude oil
NaCl Na2CO3
Spinning Drop
IFT Chun Huh IFT Error
1 0.5 1.789 0.642475 64.0875
1 1 0.5221 0.710059 36.0006
1 1.5 0.2432 0.675 63.9704
1.5 0.5 1.4579 0.747922 48.6986
1.5 1 0.4239 0.747922 76.4384
1.5 1.5 0.3435 0.710059 51.6238
2 0.5 2.0202 0.675 66.5875
2 1 0.5925 0.710059 19.8412
2 1.5 0.1722 0.788897 78.1721
Core Flooding
Properties of fluid at 70°C
Density of crude oil (acidic), g/cc 0.8000
Density of crude oil (low acid), g/cc 0.8002
Density of 1wt% NaCl, g/cc 1.01
Density of alkaline, 1.5wt%Na2CO3, 2wt% NaCl , g/cc 1.0092
Viscosity of crude oil (acidic), cp 3.817
Viscosity of crude oil (low acid), cp 3.817
Refractive index of alkaline 1.3319
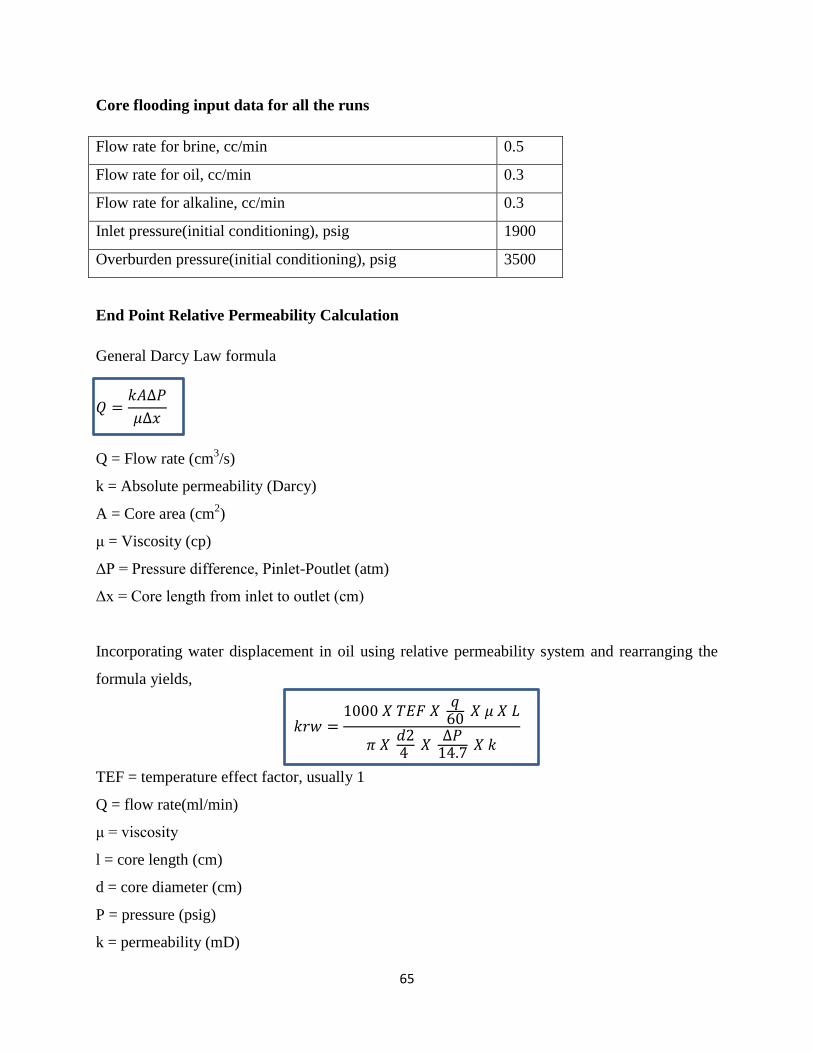
65
Core flooding input data for all the runs
Flow rate for brine, cc/min 0.5
Flow rate for oil, cc/min 0.3
Flow rate for alkaline, cc/min 0.3
Inlet pressure(initial conditioning), psig 1900
Overburden pressure(initial conditioning), psig 3500
End Point Relative Permeability Calculation
General Darcy Law formula
Q = Flow rate (cm3/s)
k = Absolute permeability (Darcy)
A = Core area (cm2)
μ = Viscosity (cp)
ΔP = Pressure difference, Pinlet-Poutlet (atm)
Δx = Core length from inlet to outlet (cm)
Incorporating water displacement in oil using relative permeability system and rearranging the
formula yields,
TEF = temperature effect factor, usually 1
Q = flow rate(ml/min)
μ = viscosity
l = core length (cm)
d = core diameter (cm)
P = pressure (psig)
k = permeability (mD)

66
In the core flooding, once residual oil is produced either by alkaline flooding or water flooding,
inlet and outlet pressure is measured to ensure a near steady state condition is achieved, where
the ΔP/Δt is stable.
This can be obtained when,
Qinjectedfluid@inlet = Qproducedfluid@outlet
This is important in ensuring the relative permeability derived from Darcy law is valid because
Darcy law requires a steady state, isothermal, incompressible and laminar flow.
Mobility ratio calculation using end points
Krw = relative permeability of water
Kro = relative permeability of oil
μw = viscosity of water
μo = viscosity of oil
This method is applied in all the mobility ratio and end point relative permeability calculation for
all the runs.