Phase-Based Adaptive Estimation of Magnitude … Magnitude-Squared Coherence Between Turbofan...
18
Phase-Based Adaptive Estimation of Magnitude-Squared Coherence Between Turbofan Internal Sensors and Far-Field Microphone Signals JEFFREY HILTON MILES •t NASA John H. Glenn Research Center at Lewis Field, Cleveland, OH 44135 t A cross- power spectrum phase based adaptive technique is discussed which iteratively determines the time delay between two digitized signals that are coherent. The adaptive delay algorithm belongs to a class of algorithms that identifies a minimum of a pattern matching function. The algorithm uses a gradient technique to find the value of the adaptive delay that minimizes a cost function based in part on the slope of a linear function that fits the measured cross power spectrum phase and in part on the standard error of the curve fit. This procedure is applied to data from a Honeywell TECH977 static-engine test. Data was obtained using a combustor probe, two turbine exit probes, and far-field microphones. Signals from this instrumentation are used estimate the post-combustion residence time in the combustor . Comparison with previous studies of the post-combustion residence time validates this approach . In addition, the procedure removes the bias due to misalignment of signals in the calculation of coherence which is a first step in applying array processing methods to the magnitude squared coherence data. The procedure also provides an estimate of the cross-spectrum phase-offset. Nomenclature a Zero intercept of two parameter phase function m (f) Be Bandwid th resolution, Be = l:,.f = 1/Td = r 8 /N, 16 Hz bk m Slope of cross-spectrum phase curve Co, Cmax, Cmin' C Cost functions De m Propagation time from turbine exit to far-field microphone Dk e Post combustion residence time in the combustor, Dk l = Dk m -De m Dk m Propagation from combustor to far-field microphone E [ ] Effective Value of E [ J f Frequency, Hz fu Upper frequency limit, fu = 1j2l:,.t = 1' 8 / 2, Hz (32 768 Hz) F 2 Weight function Gt t U) Estimated output signal one-sided auto spectral density function Gk k(f) Estimated input signal one-sided auto spectral density function Gk mU) , Gt mU) Estimated one-sided cross-spectral density function J Cost function N Segment length, number of samples per segment, N = l's Td , (4 096) • Aerospace Engineer, Acoustics Branch,21000 Brookpark Road, Cleveland, Ohio, 44135 t AIAA Associate Fellow tNovember 22, 2014 H:\mml40529-sigalign\ mm140529 .tex 1 of 19 American Institute of Aeronautics and Astronautics https://ntrs.nasa.gov/search.jsp?R=20150022388 2018-06-05T12:53:19+00:00Z
Transcript of Phase-Based Adaptive Estimation of Magnitude … Magnitude-Squared Coherence Between Turbofan...

Phase-Based Adaptive Estimation of Magnitude-Squared Coherence
Between Turbofan Internal Sensors and Far-Field Microphone Signals
JEFFREY HILTON MILES •t
NASA John H. Glenn Research Center at Lewis Field, Cleveland, OH 44135 t
A cross-power spectrum phase based adaptive technique is discussed which iteratively determines the time delay between two digitized signals that are coherent. The adaptive delay algorithm belongs to a class of algorithms that identifies a minimum of a pattern matching function. The algorithm uses a gradient technique to find the value of the adaptive delay that minimizes a cost function based in part on the slope of a linear function that fits the measured cross power spectrum phase and in part on the standard error of the curve fit. This procedure is applied to data from a Honeywell TECH977 static-engine test. Data was obtained using a combustor probe, two turbine exit probes, and far-field microphones. Signals from this instrumentation are used estimate the post-combustion residence time in the combustor. Comparison with previous studies of the post-combustion residence time validates this approach. In addition, the procedure removes the bias due to misalignment of signals in the calculation of coherence which is a first step in applying array processing methods to the magnitude squared coherence data. The procedure also provides an estimate of the cross-spectrum phase-offset.
Nomenclature
a Zero intercept of two parameter phase function ¢~ m (f) Be Bandwidth resolution, Be = l:,.f = 1/Td = r 8 /N, 16 Hz bk m Slope of cross-spectrum phase curve Co, Cmax, Cmin' C Cost functions De m Propagation time from turbine exit to far-field microphone Dk e Post combustion residence time in the combustor, Dk l = Dk m -De m
Dk m Propagation from combustor to far-field microphone E [ ] Effective Value of E [ J f Frequency, Hz fu Upper frequency limit, fu = 1j2l:,.t = 1'8 / 2, Hz (32 768 Hz) F2 Weight function Gt t U) Estimated output signal one-sided auto spectral density function Gk k(f) Estimated input signal one-sided auto spectral density function Gk mU) , Gt mU) Estimated one-sided cross-spectral density function J Cost function N Segment length, number of samples per segment, N = l's Td , (4 096)
• Aerospace Engineer, Acoustics Branch,21000 Brookpark Road, Cleveland, Ohio, 44135 t AIAA Associate Fellow tNovember 22 , 2014 H:\mml40529-sigalign\ mm140529 .tex
1 of 19
American Institute of Aeronautics and Astronautics
https://ntrs.nasa.gov/search.jsp?R=20150022388 2018-06-05T12:53:19+00:00Z

n Signal noise nke Number of points used in two parameter curve fit no Number of segments/blocks with 50 percent overlap, n 0 = 2 B eTtotal ~ 2240 ns Number of disjoint (independent) segments used in spectra estimates, ns = B c Ttotal ~ 1120 r(t) Acoustic signal Rk m ( T) Cross-correlation function r5 Sample rate, samples/s (65536) S Cost function sums s(t) Acoustic signal S1 J Summation function over [ t Time variable Ttotal Total record length, Ttotal = ns Td, s (~70s) Td Record length of segment, Td = N /r5 , 0.0625 s Wk Weight factor Xj Frequency fj Yj 11easured cross-spectrum phase ¢'k m
Subscripts
1 Combustion location 2 Thrbine exit location 3 microphone location £ Location is turbine k Location is combustor m Location is far-field microphone x Input signal y Output signal
Symbols
[-] l\1ean value of n. < > Angular brackets denote long time aYerages. Pk m Slope of two parameter phase function ¢~ m (f) b.t Sampling interval,b.t = 1/rs s t Residual i;,y(f) Estimated magnitude-squared coherence (MSC) function ..y;n,Yn (ns) 11SC threshold function [' ] Estimate of [ ] ~ Imaginary part v weight value w Angular frequency, w = 2 1r f ¢ Angle variable ¢~ m (f) Two parameter linear curYe fit function ¢o Zero intercept of two parameter phase function ¢~ m (f) ¢k m (f) Cross-spectrum phase funct ion 'If; Weight factor !R Real part a~ m Residual variance ak m Standard error T Time displacement I nt Integer part
m Measured
I. Introduction
The technique introduced in this paper is an adaptive estimation process which synchronizes two signals correlated over a frequency range using a time domain iterative algorithm. This procedure will enable
2 of 19
American Institute of Aeronautics and Astronautics

removal of the bias due to misalignment of signals in the calculation of coherence and will estimate more accurately the cross-power spectrum phase-offset.
The algorithm uses a cost function and a gradient approximation to continually update the time delay estimate until the process has minimized the cost function. The cost function is based on a linear cur\·e fit to the unwrapped phase of the cross-spectrum between the two signals over the frequency range of interest. The linear curve fit assumes the existence of a cross-spectrum phase-offset and does not assume the linear fit has a zero intercept at zero frequency. The iterati,·e technique used is a steepest-descent gradient technique and thus requires that the cost function is unimodal.
A. Relevance
Low frequency noise generated in the turbofan engine core can make a significant contribution to the overall noise signature in the aft direction at the low power settings which are used on an airport flight approach trajectory. This type of low frequency noise may become even more of a problem for future aircraft. Two possible low frequency noise sources are direct and indirect combustion noise. The source of combustion noise attributed to the unsteady pressures produced by the unsteady combustion process that propagate through the turbine to the far field is called the direct combustion noise source. The other source of turbofan engine combustion noise is known as the indirect mechanism in which the noise is generated in the turbine by the interaction of entropy fluctuations, which also originate from the unsteady combustion process, as they propagate through regions characterized by mean flow velocity or pressure gradients in the turbine stages. This indirect noise source was studied using analvtical models by Ffowcs Williams and Howe,1 Pickett,2
Marble and Candel,3 Curnpstv and Marble,4 •5 Cumpsty,6 Gliebe et al.,7 l\lani,8 Bodony9 and Leyko10 .
The net travel time of the indirect combustion noise signal from the combustor to the turbine exit and the far field is longer than the direct one since the travel velocity of the entropv fluctuations to the turbine is the flow velocity in the combustor. This flow velocity is a small fraction of the speed of sound . Miles et al. 11• 12 has shown the pressure and entropy should be in phase in the combustor. Consequently, one might expect that the pressure signal from an indirect combustion noise source would be delayed relative to a pressure signal from a direct combustion noise source since au indirect combustion noise signal does not travel with the speed of an acoustic wave until it interacts with the turbine. Miles13- 15 with data from the Honeywell TECH977 engine test prograrn16 shows that the cross-spectra and correlation function between a combustor sensor and far-field microphones are tools that provides a way to separate low frequency direct and indirect coherent combustion noise due to this travel delay time.
B. Adaptive Estimation
Etter and Stearns17 describe an autocorrelation function based adaptive estimation process for time delays for possible use with sonar or radar signals. A similar procedure is outlined by Carter18 for passive sonar signal processing which uses a cross-correlation function. The generalized correlation method for estimation of time delay that uses a pair of prefilters before a cross-correlation process has been discussed by Knapp and Carter19 and Azaria and Hertz.20
These methods are early versions of modern signal-processing algorithms now widely used in medical ultrasound, speech processing and other applications that can be more general!) described as the identification of a minimum {or maximum, depending on the particular algorithm used) of a pattern ·matching function. 21- 23 A great many pattern matching algorithms are used. Many are reviewed by Jacovitti and Scarano21 and Viola and Walker.23 '¥hile some cost functions use cross correlation, in many applications other signal matching measures have been developed for applications requiring intensive or real-time processing.
C. Present Technique
The adaptive estimation process used herein estimates the time delay with a cost function that is based on the unwrapped cross-spectrum phase between two sensors over a preselected frequency range. The cost function is based on the slope of the regression line and the standard deviation of the linear curve fit to the phase. It is assumed that the time series overlap for a time delay that minimizes this cost function. The procedure at each iterative step determines the value of the cost function and continually realigns the time series by varying the time lag until the cost function has been minimized and thereby effectively has reduced
3 of 19
American Institute of Aeronautics and Astronautics

the slope to zero. The frequency interval is preselected so that the magnitude-squared coherence between signals is not too small in the selected range. A non-adaptive time delay estimation method that uses a linear fit with a zero intercept at zero frequency to unwrap cross-spectrum phase is described by Piersol.24
In contrast, the method used herein does not require the measured phase shift sequence to pass through the origin which is an assumption used by Piersol24 and other in,·estigators.25- 27 Since the method uses only a selected portion of the calculated phase, it is called a generalized unwrapped phase method. The same results could be achieYed at more computational expense by using a pair of pre-filters to select the frequency range of interest as is done by Knapp and Carter. 19 Other non-adapth·e methods that estimate a time delay using the cross-spectrum phase are available.25- 27
This adaptive estimation method of calculating the time delay is applied to time series measurements in the combustor, at the turbine exit , and at select far-field microphones from the Honeywell TECH977 test program. 16 In order to calculate the post-combustion residence time in the combustor i.e. the time delay of the indirect combustion noise in the combustor, the propagation time from the combustor probe and the turbine exit probe to a far-field microphone are directly estimated by the procedure and subtracted. This is the first application of time delay estimation using a phase based adaptive pattern matching function to measure the post-combustion (post-fiame) residence time in a turbofan engine combustor using signals measured at the turbine exit with signals from a combustor sensor probe and far field microphones.
II. Engine test data
The NASA/Honeywell static engine test program was conducted at Honeywell's San Tan outdoor acoustic test facility using a Honeywell TECH977 engine (Fig. 1) and the results are described in a report by Weir.16 The dual-spool, turbofan engine has a direct drive, wide chord fan connected by a long shaft to the low-pressure turbine spool and a high-pressure compressor connected by a concentric short shaft to the turbine high-pressure spool. The fan diameter is about 0.87 m. The combustor design is a straight-throughflow annular geometry with 16 fuel nozzles and 2 igniters. Data obtained for one configuration in the test program is analyzed in this paper. The engine-internal instrumentation in this configuration included hightemperature pressure sensors with air cooling in a combustor igniter port identified herein as CIPl and at the turbine exit sensors identified as T551 and T552. Pressure time histories from these internal sensors and far-field microphonE's are used herein.
The data acquisition system had a sampling rate of 65 536 Hz and a sampling duration of roughly 70 s . The spectra were calculated using a 50 percent overlap. This permitted data reduction using ~ 1120 non-overlapped ensemble averages or with a 50 percent overlap ~ 2240 overlapped ensemble averages at a bandwidth resolution of 16 Hz. Further signal estimation parameters are shown in Table 1.
The engine condition power settings discussed are 48 and 54 percent of the Jvlax Power setting. Microphone locations used are at 90°, 110° , 130°, and 160° measured from the inlet. The test was conducted when the air temperature was about go C ( 48.2° F) and the microphone radius was 30.48 m. The engine was at a height of 3.049 m.
As discussed, 13• 28 the size of the magnitude-squared coherence between the combustor sensor and a far-field microphone identifies the spectral region of importance for indirect combustion noise as being in the 0-200 Hz frequency range. Consequently, herein the cross-spectral phase measurements between engineinternal sensors and a far-field microphone only over the frequency range 16-208 Hz is used to estimate the propagation time to a far field microphone.
III. Theory
A. Procedure
The far-field microphones receives noise from the turbofan, jet, and core. The procedure characterizes the core noise as indirect combustor noise and turbine-exit coherent broadband noise. Furthermore, the method estimates the propagation time from source to far-field microphone. A simple mathematical model for the propagation time measurements is
SI(t- Dk m) + nl(t) Combustor Sensor
s2(t - Dt m) + n2(t) Turbine Sensor
4 of 19
American Institute of Aeronautics and Astronautics
(1)
(2)

rm(t) = s3(t) + n3(t) :tllicrophone (3)
where the signal at station k from the combustion pressure sensor is delayed by the propagation time delay, Dk m, the turbine pressure sensor signal at location e is delayed by the propagation time delay, Dt m> the signal at station m is from the far-field microphone.
The signal at station k is from the combustor and the acoustic pressure signal s 1 ( t) is assumed to be related to an entropy or temperature disturbance. This disturbance moves at the combustor flow Yelocity to the turbine where it interacts with the pressure field creating indirect combustion noise which reaches a microphone after a total travel t ime, Dk m· The signal at station C is from the turbine. The acoustic pressure signal s2(t) is from the turbine exit coherent broadband noise which reaches a microphone after a total travel time, Dtm · In either case the procedure to finding the time delay is identical and is described in the algorithm section. The signals at station k, e and m are contaminated by independent, Gaussian, and stationan· noise terms, n 1(t), n2(t), and 113(t), which are uncorrelated with s1(t), s2(t), and s3 (t) and each other.
The cross-correlation funct ion between the combustor signal and a far-field microphone is given by
Rk m(r) = Efrk(t)rm(t + r)] = Rs, s3 (r- Dk m)
where Rs, 83 ( r - Dk m) is the autocorrelation function with a peak at r = Dk m. In the frequency domain, the Fourier transform of equation (4) is
(4)
(5)
where G8 , 83 is the one-sided cross-spectrum and the time delay Dk m appears in the cross spectrum as a phase function
¢k mU) = 2 7r f Dk m = W Dk m
where w = 2 1r f. The magnitude-squared coherence (MSC) is defined by
(6)
(7)
The cross-correlation function between the turbine probe signal and a far-field microphone is given by
Rt m(r) = E[rt(t)rm(t + r)J = R,283(r- Dt m)
where R 8283 (r - Dt m) is the autocorrelation function with a peak at r = Dt m· In the frequency domain, the Fourier transform of equation (8) is
Gt mU) = c.,.3(f) exp (- i 2 7r f Dt m)
(8)
(9)
where G8 , 83 is the one-sided cross-spectrum and the time delay Dt m appears in the cross spectrum as a phase function.
<Pt m(f) = 2 7r f Dt m = W Dt m
The magnitude-squared coherence (MSC) is defined by
2 (/) ICe mUW 'Yt m = IGu(/)I IGm m(/)1
(10)
(11)
Then Dk t = Dk m - De m· With a small error since the acoustic propagation speed are high and the distances involved are small, the indirect combustion noise is dealt with as if it all begins propagating acoustically at the turbine exit and then it propagates to a microphone in the same manner as the direct combustion noise.
5 of 19
American Institute of Aeronautics and Astronautics

B. Signal Processing Method .
All the spectra and cross-spectra are estimated using Welch's nonparametric method which is based on averaging multiple windowed periodograms using overlapping time sequences.29- 33 Using these spectra and cross spectra, the magnitude-squared coherence (MSC) is calculated to measure the similarity of the amplitude variations at particular frequencies.33 In some sections, the· accent will be used to denote the statistical basis of a variable and that it is based on a finite time series.
C. Accuracy of Estimates
We consider the cross spectrum magnitude estimate, Gk mU), and phase estimate, ¢k m(/), computed from Fourier transforms of signals r 1(t) and rz(t) calculated for a sample length Ttotal divided into n8 independent samples using a periodogram procedure. The estimated cross-spectrum Gk m is a complex number. The estimated cross-spectrum phase ¢k m is given by
- [C:SGk m] ¢k m = arctan -.-~ ~Gkm
(12)
The spectral estimates are statistically independent of one another and have a standard deviation discussed by Piersol24 , derived by Bendat,34 and also presented in a book by Bendat and Piersol35 approximately given by
(13)
(14)
For small phase errors when sin a = a
• [1-"Y~m(fi)]1/2 a [¢k m(/i)] ~ 2 ns ~~ mU;) (15)
It can be seen from Eqs (14)-(15) that the error in the estimated phase angle becomes infinitely large as the l\ISC tends to zero. This is the reason why only a limited frequency interval is used in the generalized adaptive phase method.
D. 'frue MSC based on the Adaptive Estimation Procedure
To a first order approximation the computed/estimated unaligned and aligned l\1SC based on the far-field microphones and probes in the combustor and at the turbine exit are related by
i~ mUllunaligned ~ ( 1 - D;dm) 2 "Y~ m (!)I aligned
~i mUll unaligned~ ( 1- D;dm r "Yi mUll aligned
if Dk m and De m are less than Td (Bendat34 and Bedat and Piersol35).
(16)
(17)
To increase the number of blocks of data sampled to get better statistics the bandwidth resolution, Be , used is 16Hz and the segment length, Td, of the signal is then 62.5 ms. However, the time delay from the engine probes to the far field-microphone, Dk m and De m is between 70 m s and 90 ms. Consequently, the alignment procedure must be used since using non-aligned measurements one would only measure the MSC threshold which is small. An order of magnitude estimate of the threshold for a 95 percent confidence interval and n 8 = 1120 independent blocks of data is (Miles36•
37)
i;n,Yn (ns) = 1- (1- 0.95)1/ (n , - 1) = 2.67 X 10- 3 . (18)
6 of 19
American Institute of Aeronautics and Astronautics

By aligning the measurements and removing any time delay the true 1\ISC can be measured. The generalized unwrapped phase adaptive estimation procedure does need an initial condition for Dk m and Dt m. An estimated Yalue of 70 m s to 90 ms based on the acoustic speed of sound and the 100 fL microphone radius is sufficient for this purpose.
E. Algorithm
The current algorithm identifies the dominant noise source at the turbine exit as either direct or indirect combustion noise over a certain frequency range. It does this by calculating the difference in delay time, Dk e, for a signal from the combustor to reach a far-field microphone and a signal from the turbine exit to reach the same far-field microphone. If both time delays are about the same, the dominant noise source is direct combustion noise. If the time delay difference is in the region of 3 to 4 ms the dominant noise source is indirect combustion noise.
The general idea is that the noise from the turbine is acoustic while the noise in the combustor has a spectrum related to the noise created by entropy waves interacting with the pressure field in the turbine. This interaction produces noise after a t ime delay, Dk e, related to the convection velocity in the combustor and the distance from the flame zone to the turbine. This post-combustion (post-flame) time delay, Dk e, shows up in the phase of the cross-spectra of the combustion noise signal and a far-field microphone signal.
The procedure used is to first evaluate the time delay from the combustor and far-field microphone cross spectrum, Dk m· This is done by iteratively and optimally resetting the origin of the time history of the far-field microphone signal and at each step calculating the pressure cross-spectrum phase between the combustor probe signal and the far field microphone signal until the slope of the phase plot curve is zero. This time detav is the acoustic travel time, De m• plus t he post-combustion (post-flame) time delay, Dk l· Next the same method is used to evaluate the time delay from the turbine exit probe signal and the same far-field microphone, Dt m· Again this is done by iteratively and optimally resetting t he origin of the time history of the far-field microphone signal and at each step calculating the pressure cross-spectrum phase between the turbine exit probe signal and the far field microphone signal until the slope of the phase plot curve is zero. This provides an estimate of the acoustic travel time from the turbine exit to the same microphone, Dt m Consequently, the difference in these actual time delays is the post-combustion (post-flame) time delay, Dkt· The indirect combustion noise is treated as if it all begins propagating acoustically at the turbine exit and then it propagates to each microphone in the same manner as the direct combustion noise. The resolution is limited bv the sampling rate. For this test program the sampling rate is 65,536 samples/s. Consequently, the value is known within O.Ql5 ms (~ 1000/65, 536 ms).
In order to estimate either time delay, Dk e, a pattern matching function based on a regression line fit to the measured cross-spectrum phase /fik t will be used. However, the regression line fit is not forced to have a zero intercept because 1) the pressure sensors are not the same; 2) the pressure sensors are not phase matched; 3) the phase measured at f = 0 will not be used in the time delay calculations; and 4) while a large number of independent samples are used and the MSC is greater than 0.01, the phase is calculated with uncertainty fluctuations. In addition, the 1\ISC plots show the phase related to the indirect combustion noise is in the frequency range from 16-208Hz.13• 28 Consequently, only phase funct ion points in that frequency range are used.
1. Estimation of slope of cross-spectra phase and cost function
Instead of using a simple linear regression model with a zero intercept at f = 0, a simple two parameter linear regression model is used. The procedure will be described using the combustor microphone and the far-field microphone.
(19)
The parameters are estimated using the least square method that minimizes the sum of squares of the vertical distances (S = Z:::; ( ¢'k mUi) - a - f3k m I; )2
) ).38
-41 Let Xj = /i and Yj = ¢'k mUi) where the time delay is
Dk m = Pk m/(2 rr), a= 1/>o and c; is an error due to uncertainty fluctuations. Then
7 of 19
American Institute of Aeronautics and Astronautics
j}
fJk t
a
The residual variance is
LYi j
LXj Yj j
Sx nkt
~ nkt
L(Xj - £)2 j
L(Yj - Yl 2
j
(Sxy - nkt X y) Sx2
l:i (Yi - y)(xi - x) Sx2
y - fJktX
The standard error of the measurement is simply Uk m .
(20)
(21)
(22)
(23)
(24)
(25)
(26)
(27)
(28)
(29)
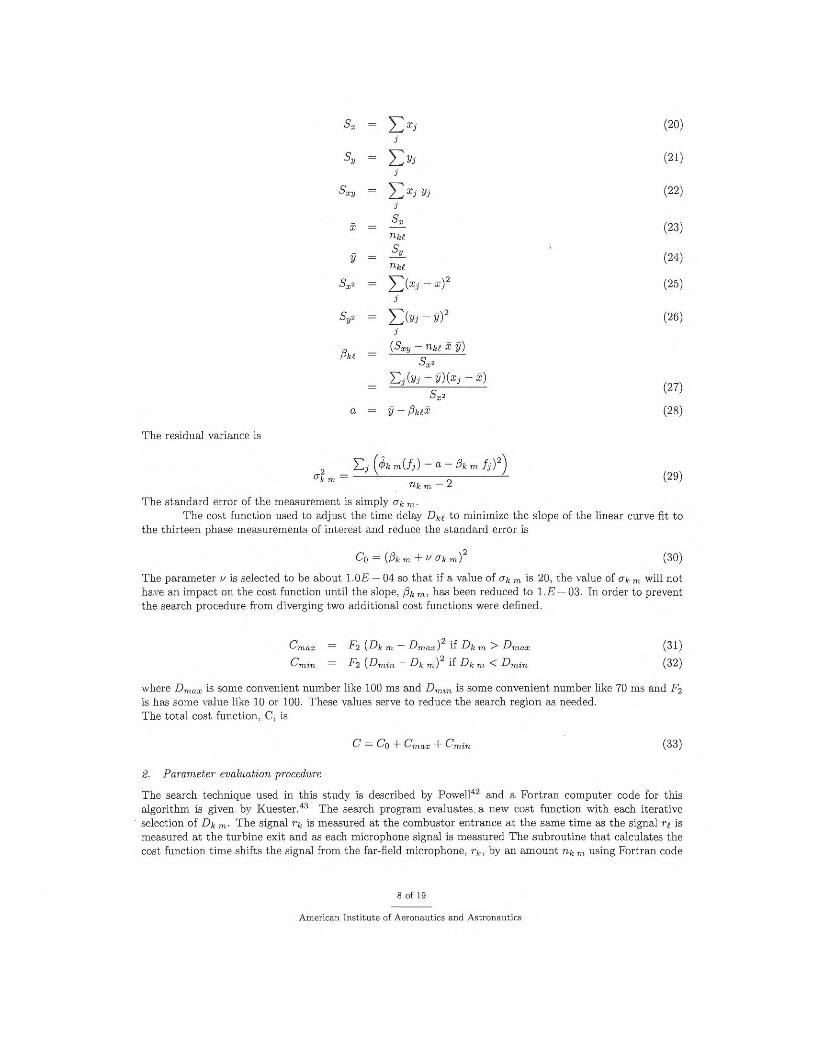
The cost function used to adjust the time delay Dkf to minimize the slope of the linear curve fit to the thirteen phase measurements of interest and reduce the standard error is
(30)
The parameter v is selected to be about l.OE - 04 so that if a value of Uk m is 20, the value of Uk m will not have an impact on the cost function until the slope, fJk m , has been reduced to l.E- 03. In order to prevent the search procedure from diverging two additional cost functions were defined.
F2 (Dk m - Dmax) 2 if Dk m > Dmax
F2 (Dmin - D k m)2 if Dk m < Dmin
(31)
(32)
where Dmax is some convenient number like 100 ms and D min is some convenient number like 70 ms and F2
is has some value like 10 or 100. These values serve to reduce the search region as needed. The total cost function, C, is
C = Co + Cmax + Cmin (33)
2. Parameter evaluation procedure
The search technique used in this study is described by Powell42 and a Fortran computer code for this algorithm is given by Kuester. 43 The search program evaluates. a new cost function with each iterative selection of Dk m· The signal1·k is measured at the combustor entrance at the same time as the signal1·l is measured at the turbine exit and as each microphone signal is measured The subroutine that calculates the cost function time shifts the signal from the far-field microphone, r k , by an amount nk m using Fortran code
8 of 19
American Inst itute of Aeronautics and Ast ronautics

Ln993: do j;O,Lx
rk(j) = rk(j + nk m)
enddo Ln993
where if the dominant low frequency noise source is indirect combustion noise, we let nk m = lnt (rs x Dk 111)
for the combustor signal case and ntm = lnt(rs x xDtm) for the turbine signal case. The actual value of Dt m depends on the acoustic propagation velocity and distance along the paths from t he turbine to the nozzle and from the nozzle through the jet at the nozzle exit and then to a microphone on the ground. The actual '-alue of Dk m depends on Dt m and the velocity of the gas flow in the combustor and the distance in the combustor from the flame zone to the turbine. The cross-spectrum between the signals rk and r 111
is calculated. Next, a new cost function is calculated and the iterative procedure continues until it has converged.
The resulting phase plot of ¢k m lzero slope over the frequency range from 16Hz to 208 Hz where the MSC is 2:: 0.1 after convergence will show a a set of points moving aboYe and below a horizontal line in a random fashion due to uncertainties caused by noise where
[~(Gs,dzero slope(/) exp (- i ¢s,dzero slope(/)))] ¢k m lzero slope ~ arctan <n(G 1 (/) ( · 1 (/))) '" s,s3 zero slope exp - ~ <Ps,s3 zero slope
(34)
IV. Results
A. Post-combustion residence time in the combustor
The post-combustion (post-flame) residence times in the combustor, Dk t. as determined for the 48 and 54 per cent of maximum power operating condition cases is shown in Tables 2 and 3. These tables shows the propagation time for the turbine exit sensors is in the range of 86 to 94 ms and the indirect combustion noise signal takes 3.6 to 4.03 ms longer. Each table shows the actual number of counts and time in ms required to shift the far-field pressure signal to make it align with the combustion sensor signal.
B. Analysis of distribution of post-combustion residence times in the combustor
The distribution of the estimated post-combustion residence times in the combustor were analyzed using histogram density plots using the methods described by Fox44 and by Fox and Weisberg.45 The histogram is constructed so that the areas of the histogram bars sum to unity. Kernel density estimates are shown for the normal bandwidth (the line is of double thickness) and half the normal bandwidth (the line is of normal thickness). Also shown at the bottom of the plot are the location of the actual estimates as a scatterplot (or "rugplot") using a vertical bar I as the plotting symbol. A histogram of the post combustion residence times in the combustor at the 48 percent maximum power case is shown in Fig 2. Also shown is the mean value of the post-combustion time delay in the combustor at r111ean = 3.960 ms. Using an alternative procedure with signals from only the combustor probe and turbine exit probes Miles46 calculated a time delay of rc1 PI ,Tss1 = 3.937 ms and a time delay of rc1 P1,Tss2 = 4.028 ms. These are also shown as vertical lines and are in close agreement with the values calculated using far-field microphones.
A histogram of the post combustion residence t imes in the combustor at the 54 percent maximum power case is shown in Fig 3. Also shown is the mean value of the post-combustion time delay in the combustor at Tmean = 3.791 ms. Using the alternative procedure with signals from only the combustor probe and the turbine exit probes I\Iiles46 calculated a time delay of rei Pl ,T55l = 3. 753 ms and a time delay of TCJPl,TSS2 = 3.921 ms. These are also shown as vertical lines and are in close agreement with the values calculated using far-field microphones. The values obtained by .Miles13- 15•28•47 using other methods are comparable to these.
C. Phase and MSC measurements at 48 percent maximum power
Aligned MSC and cross-spectrum phase measurements between the combustor pressure sensor (CIPl ) and various far-field microphones are shown in figures 4 and 5. Aligned MSC and cross-spectra phase measurements between turbine exit pressure sensor (T551) and various far-field microphones are shown in figures
9 of 19
American Institute of Aeronautics and Astronautics
6 and 7. Aligned l\ISC and cross-spectra phase measurements between turbine exit pressure sensor (T552) and various far-field microphones are shown in figures 8 and 9.
The magnitude-squared coherence function (MSC) plots will be discussed using logarithmic scales. Using logarithmic scales makes it easier to show that the analysis is based on l\ISC values above the threshold for unaligned signals. In addition to the MSC, also shown in Figs. 5, 7, 9, and 10 are MSC thresholds calculated from Eq (18).
The 95 percent threshold confidence interval based on ns = 1120 independent samples is 2.67 x 10- 3 .
However, the spectra are calculated using a 50 percent overlap to reduce the variance and the 95 percent threshold confidence interval based on n 8 = 2240 samples is 1.337 x 10- a These thre>.sholds are shown in Figs. 4, 7, 9, and 10. These indicators show the .MSC function is reliable up to about 400Hz even though the pattern matching method used only cross-spectrum phase information from 16 to 208 Hz. However, MSC function is above 0.1 in a region from 16 - 208 Hz. The slope change in Fig. 4 above 200 Hz indicates that indirect combustion noise is important below 200 Hz and direct combustion noise is important above 200 Hz.
D. Core noise source
In order to evaluate the relative strength of indirect combustion noise and the turbine exit coherent broadband noise which contains both indirect and direct combustion noise a comparison of aligned MSC between combustor pressure sensor (CIP1) and far-field microphone at 130 degrees with aligned MSC between turbine pressure sensors (T551) and (T552) and far-field microphones at 48 percent maximum power is shown in Fig 10 using both linear and logarithmic scales. Fig 10 b also shows l\ISC threshold plots for n8 = 1120 and n 8 = 2240 samples. Figure 10 shows both indirect and direct combustion noise are important below 400 Hz.
V. Concluding remarks
A phase-based adaptive estimation pattern matching approach has been developed to estimate the post combustion (post-flame) time delay in the combustor from cross-spectral phase measurements made using a combustor pressure sensor, two turbine exit pressure sensors , and far-field microphones by estimating the propagation time to the far field for the indirect combustion noise and the turbine exit coherent broadband noise and taking the difference. The procedure accurately estimates the post-combustion/ post-flame residence time in the combustor. It is the presence of indirect combustion noise that makes the procedure feasible. While the method has general application, the method discussed works well in this particular case due to the nature of the data set. The number of independent aYerages is chosen to be large (ns ~l120)
and the magnitude-squared coherence (MSC) is over 0.1 up to 208 Hz making the standard deviation of the cross-spectra phase small below 200 Hz. An accurate algorithm for calculating the post-combustion (post-flame) residence time in the combustor might be important in understanding the formation of thermal NOx in the combustor and verifying new and innovative combustor designs based on computational tools. Calculating the aligned MSC is a necessary step in applying array processing methods to the l\lSC data set. In general, the adaptive estimation technique developed herein is an effective tool to determine time delays between broadband coherent signals in noisy environments such as exist in real aircraft engines.
VI. Acknowledgments
This work was carried out under the NASA Fundamental Aeronautics Program, Fixed ~Wing Project, Quiet Performance Subproject.
10 of 19
American Institute of Aeronautics and Astronautics

References
'Williams, J. E. F. and Howe, M.S., "The generation of sound by density inhomogeneities in low 1\ lach number nozzle flows, J. Fluid Mech., Vol. 70 Part 3 , 1970, pp. 605-622.
2 Pickett, G. F., "Core Engine Noise Due to Temperature Fluctuating Through Thrbine Blade Rows," Tech. Rep. AIAA-75-528, AIAA, 1975.
31\!arble, F. E . and Candel, S. M., "Acoustic disturbance from gas non-uniformities convected through a nozzle, Journal of Sound and Vibration, Vol. 55 No. 2, 1977, pp. 225- 243.
4 Cumpsty, N. A. and lllarble, F . E., The Interaction of Entropy Fluctuations With Thrbine Blade Rows; A Mechanism of Thrbojet Noise. " Proc. R. Soc. Lond. A ., Vol. 357, 1977, pp. 323-344.
5 Cumpsty, N. A. and Marble, F., "Core Noise from Gas Thrbine Exhausts: Journal of Sound and Vibration, Vol. 54 No. 2, 1977, pp. 297- 309.
6Cumpsty, N. A., · Jet Engine Combustion Noise: Pressure, Entropy and ''orticity Perturbations Produced by Unsteady Combustion or Heat Addition," Journal of Sound and Vibration, Vol. 66 No. 4, 1979, pp. 527-544.
7 Gliebe, P.,lllani , R., Shin, H ., l\ii tchell, B., Ashford, G., Salamab, S., and Connell, S., "Acoustic Prediction Codes," Tech. Rep. NASA CR-2000-210244, R99AEB169, General Electric Aircraft Engines, August 2000.
8 1\lani, R. , "Issues in Combustion Noise," Annual Research Briefs 2007, Center for Thrbulence Research, Department of l\lechanical Engineering Stanford University Stanford, Ca, 94305,USA, 2007, http://ctr.stanford.edu/ResBriefs07/22_mani_pp255_264.pdf
9 Bodony, D. J ., "Scattering of an entropy disturbance into sound by a symmetric thin body," Physics of Fluids , Vol. 21 , 2009, pp. 096101- 1- 10.
10 Leyko, l\1., Nicoud, F., and Poinsot, T ., "Comparison of Direct and Indirect Combustion Noise lllechanisms in a Model Combustor,"' AIAA Journal , Vol. No., November 2009, pp. 2709-2716.
11 l\liles, J. H., Wasserbauer. C . A., and Krejsa, E . A., "Cross Spectra Between Temperature and Pressure in a Constant Area Duct Downstream of a Combustor," AJAA-83-0762, NASA Tl\1-83351, 1983.
121\.Hles, J. H., \1\!asserbauer, C . A., and Krejsa, E., "Cross spectra between pressure and temperature in a constantarea duct downstream of a hydrogen-fueled combustor," Tech. Rep. NASA-Tlll-83463, NASA Glenn Research Center, 1983.
131\liles, J. H., · Time Delay Analysis of Thrbofan Engine Direct and Indirect Combustion Noise Source-;; Journal of Propulsion and Power, Vol. 25 No. 1, January-February 2009, pp. 218-227.
14 l\liles, J . H. , •Core Noise Diagnostics of Thrbofan Engine Noise Using Correlation and Coherence Functions," Jouma.L of Propulsion and Power, \'ol. 26 No. 2, 1\larch/ April 2010, pp. 303- 316.
15111iles, J . H., "Separating Direct and Indirect Thrbofan Engine Combustion Noise Using the Correlation Function," Journal of Propulsion and Power, Vol. 26 No. 5, September-october 2010, pp. 1144-1152.
16Weir(editor), D. S., "Engine VaHdation of Noise & Emission Reduction Technology Phase 1," Tech. Rep. NASA/CR-2008-215225, Honeywell, l\lay 2008.
17 Etter, D . l\1. and Stearns, S. D., "Adaptive Estimation of Time Delays in Sampled Data Systems," IEEE Transactions on Acoustics, Speech, and Signal Processing, Vol. ASSP-29 3, June 1981, pp. 582- 587.
18Carter, G. C., "Time Delay Estimation for Passive Sonar Signal Processing," IEEE 1hmsactions on Acoustics, Speech, and Signal Processing, Vol. ASSP-29 3 , June 1981, pp. 463-470.
19 Knapp, C. H. and Carter, G. C., ·The generalized correlaton method for estimation of time delay,'' IEEE TI-ans. Acoust, Speech, Signal Processing, Vol. ASSP-24 No. 4, 1976, pp. 320-327.
20 Azaria, 1\L and Hertz, D ., "Time Delay Estimation by Generalized C ross Correlation 1\.lethods,'' IEEE Transactions on Acoustics, Speech, and Signal Processing, Vol. 32 2, April1984, pp. 280--285.
21 Jacovitti, G. and Scarano, G. , "Discrete T ime Techniques for Time Dealy Estimation;' IEEE TI-ansactions on signal processing, Vol. 41 No.2, February 1993, pp. 525-533.
22 Viola, F. and Walker, W . F., "A Comparison of the Performance of Time-Delay Estimators in Medical Ultrasound,/EEE TI-ansactions on Ultrasonics, Ferroelctrics, and Frequency Control, Vol. 50 4, April 2003, pp. 392-401.
23 Viola, F . and Walker, W. F ., "A Spline-Based Algorithm for Continuous Time-Delay Estimation Using Sampled Data,'' IEEE TI-ansactions on Ultrasonics, Ferroelctrics, and Frequency Control, Yo!. 52 1, January 2005, pp. 80- 93.
24 Piersol, A., "Time Delay Estimation Using Phase Data,' IEEE Transactions on Acoustics, Speech, and Signal Processing, Vol. ASSP-29 No. 3, June 1981, pp. 471-477.
25 Chan, Y. T ., Hattin, R., and J .B.Plant, 'The least squares estimation of time delay and its use in signal detection," IEEE Trans. Acoust. Speech, Signal Processing, Vol. ASSP-26 No.3, June 1978, pp. 217-222.
26 Zhen, Z. and Zi-qiang, H., "The Geneaalized Phase Spectrtm Method for Time Delay Estimation," Prloc. ICASSP'84,vol. 3,pp46.2/1-4,March, 1984.
27 Daneti, l\'1., "On using phase data information for pipeline leak location," Electrical and Electronics Engineers in Israel, f?-008. IEEE! 2008. IEEE 25th Convention of, IEEE, 2008, pp. 494-498.
28 t.1iles, J. H., "Spectral Separation of the Thrbofan Engine Coherent Combustion Noise Component,'' AIAA-2008-50, January 2008, NASA TM- 2008-215157-0,2008.
29Welch, P. D. , "The Use of Fast Fourier Transform for the Estimation of Power Spectra: A Method Based on Time Averaging Over Short, fllodified Periodogre.ms,'' IEEE Transactions on audio and electroacoustics, Vol. AU-15 No.2, June 1967, pp. 70- 73.
30Stearns, S.D. and David, R. A., SignaL Processing Algorithms Using Fortran and C, Prentice-Hall, Inc., 1993. 31 Porat, B., Digital Proces•ing of Random Signals, Dover Publications, NY, 1994,2008. 32 Hayes, M. H. , Statistical Digital Signal Processing and Modeling, John Wiley & Sons, 1996.
11 of 19
American Institute of Aeronautics and Astronautics

33 1\!anolakis, D. G., Ingle, V. K., and Kogon, S.M., Statistical and Adaptive Signal Processing, Artech House, Boston, Massachusetts and London, United Kingdom, 2005.
34Bendat, J. S., "Statistical errors in measurement of coherence functions and input/ output quantities," Journal of Sound and Vi bration, Vol. 59 No. 3, 1978, pp. 405-421.
35 Bendat, J. S. and Piersol, A. G., Engineering Applications of Correlation and Spectral Analysis, John Wiley & Sons, 1980, pages 175, 167- 172,215.
36Miles, J. H., "Aligned and Unaligned Coherence: A New Diagnostic Tool," Tech. Rep. AIAA-2006-0010, AIAA, 2006, Presented at the 44th AIAA Aerospace Science Meeting, 9-12 Jan 2006 Reno Hilton Reno, Nevada, also NASA/ TIII-2006-214112.
371!iles, J. H., "Estimation of signal coherence threshold and concealed spectral lines applied to detection of turbofan engine combustion noise," The Journal of the Acoustics Soci ety of America, Vol. 129 No. 5, ll!ay 2011 , pp. 3068-3081.
38Gibra, I. N., Probability and Statistical Inference for Scientists and Engineers, Prencice-Hall, Inc., 1973, page 412-415.
39 Edwards, A. L., An Introduction to Linear Regression and Correlation, V\1. H. Freeman and Company, 1976, pages 24-31.
40 Wackerly, D. D. and III , W. 111., Mathematical Statistics with Applicatioins , Duxbury Pacific Grove, CA, 2002, pages 53 7-540.
41 Chatterjee, S. and Hadi, A. S., Regressiion Analysis by Example (Fourth Edition), John Wiley & Sons, 2006, pages 29-30.
42 Powell, M. J. D., "An Efficient Method of Finding the Minimum of a Function of Several Variables without Calculating Derivatives," Computer Journal , Vol. 7 No. 2, July 1964, pp. 155- 162.
43Kuester, J . L. and Mize, J. H., Optimization Techniques with Fortran , McGraw-Hill, 1973. 44Fox, J. , An RandS-Pius Campanian to Applied Regression, Sage Publications, 2002 , page 86--89. 45Fox, J. and Weisberg, S. , An R Campanion to Applied Regression, Sage Publications, 2011, page 107-111. 46MiJes, J. H., unpublished. 47Miles, J. H. , "Separating Direct and Indirect Turbofan Engine Combustion Noise While Estimating the Post
Combustion (Post-Flame) Residence Time Using the Correlation Function," Tech. Rep. NASA-TM-2011-216248, NASA, 2011.
12 of 19
American Institute of Aeronautics and Astronautics

Table 1. Spectral estimate parameters.
Parameter
Segment length, (data points per segment), N Sample rate, r 8 , samples/s Segment length, Td = N/r., s Sampling interval, fl.t = 1/r8 , s Bandwidth resolution, Be= tl.f = 1/Td = r8 /N, Hz Upper frequency limit, fu = 1/2f1t = r 8 /2, Hz Number of frequencies, Ly = fc/ tl.f = N / 2 Number of independent samples, ns Overlap Sample length, T totab s
Value
4 096
65 536
0.062500
1/65 536
16.0
32 768
2 048
~ 1120
0.50
~ 70
Table 2. Post-combustion (post-flame) residence time in the combustor calculated from difference of propagation time to far-field microphones of indirect combustor noise signal and acoustic signal at 48 percent maximum power.
Far-field CIPl T551 T552 t,.GIP I T551
;::,.CIPI T552
DT55 l k t
DT552 k(
l\licrophone x1000/216 x 1000/216
at 100 ft counts counts counts counts counts ms ms goo 6349 6099 6091 250 258 3.814697 3.936768 ll0° 6098 5842 5836 256 262 3.906250 3.997803 130° 5878 5619 5611 259 267 3.952026 4.074097 160° 5609 5349 5345 260 264 3.967285 4.028320 mean (r) 3.960 ms standard deviation ( r) 0.079 ms
13 of 19
American Institute of Aeronautics and Astronautics

Table 3. Post-combustion (post-flame) residence time in the combustor calculated from difference of propagation time to far-field microphones of indirect combustor noise signal and acoustic signal at 54 percent maximum power .
Far-field CIP1 T551
Microphone
at 100 ft counts counts
goo 6367 110° 6112
130° 5891
160° 5620
mean (r) 3.792 ms
standard deviation ( T) 0.103 ms
Sensors in aft fan bypass access panels
6131
5868 5640
5366
T552 t:>.~~tl !1~£fl DT551 k e DT552
k t x1000/216
X 1000/216
counts counts counts ms ms
6124 236 243 3.601074 3.707886
5859 244 253 3. 723145 3.860474
5636 251 255 3.829956 3.890991
5368 254 252 3.875732 3.845215
High-temperature sensors with air cooling at turbine exit
-temperature sensor with air cooling in
combustor igniter port
Figure 1. Honeywell TECH977 engine.
14 of 19
American Institute of Aeronautics and Astronautics

0
time delay, ms
Figure 2 . Histogram of post-combustion residence tim es in combustor in m s at 48 p ercent maximum power. Shown at the bottom of the plot are the location of the actual estimates as a scatter plot using a vertical bar I as the plotting symbol.Also shown are Tmean (blue dashed) , TCJP1 ,T551 (red dashed) , and TCJP1 ,T 552 (red dashed).
3.4 3.6 38 4.0
time delay, ms
Figure 3. Histogram of post-combustion residence times in combustor in m s at 54 p ercent maximum power. Shown at t he bottom of the p lot are the location of the actual estimates as a scatter plot u sing a vertical bar I as the p lotting symbol.Also shown are Tmean (blue dashed), TC JP1 ,T 5S1 (red d ashed) , a nd TC JP1 ,T SS2 (red dashed ).
15 of 19
American Inst itute of Aeronautics and Astronautics


0.1
0.01
0.0001
0.00001
0.000001
0.000000 I c___,_,___.__.J.._._....__._...L....__._._...L.._._L.....J.._,.L-'-'---'-' 0 200 400 600 800 1000
Frequency, Hz
Figure 7. Aligned coherence between turbine pressure sensor (T551} and far-field microphones at 48 percent maximum power.
1000.-----------------------------,
Frequency, Hz
Figure 8. Aligned cross-spectra phase angle b etween turbine pressure sensor (T552} a nd far-field microphones at 48 percent maximum powe r.
0.1
0.01
u 0.001
"' -+-90° ::;: 0.0001 -.- 110°
0.00001 - -130 ° _ ..... 160°
0.000001 --y=2.674E·03 --y=l .337E·03
0.0000001 0 200 400 600 800 1000
Frequency, Hz
Figure 9. Aligned coherence between combustor pressure sensor (T552} and far-field microphones at 48 percent maximum power.
17 of 19
American Institute of Aeronautics and Astronautics

1.0
--+-130° CIPI 0.8 -+- 130° T551
···• - 130° T552
u 0.6 C/)
:::2
~ 0.4 r ~ 0.2 \~ ' ' 0.0
0 200 400 600 800
Frequency, Hz
(a) Linear scale.
0.1
0.01 u Ul
::E 0.001
0.0001 -+-130° CIP1
0.00001 - - 130° T55 1 ....... 130° T552
0.000001 - 2.674E-03 - 1.337E-03
0.0000001 0 200 400 600 800 1000
Frequency, Hz
(b) Logarithmic scale
Figure 10. Comparison of aligned coherence between combustor pressure sensor (9) and far-field microphone at 130 degrees with aligned coherence between turbine pressure sensors (10) and (11) and far-field microphones at 48 percent maximum p ower.
18 of 19
American Institute of Aeronautics and Astronautics