Pharmacy Benefit Management in Oncology - …bhcgwi.org/wp-content/uploads/2009/11/Pharmacy... ·...
34
Pharmacy Benefit Management in Oncology October 28 th , 2015 Business Health Care Group Protecting the Future of Oncology Care: A Community Conversation Brent Eberle RPh MBA Chief Pharmacy Officer, Navitus Health Solutions General Manager, Lumicera Health Services
Transcript of Pharmacy Benefit Management in Oncology - …bhcgwi.org/wp-content/uploads/2009/11/Pharmacy... ·...

Pharmacy Benefit Management in Oncology
October 28th, 2015
Business Health Care Group
Protecting the Future of Oncology Care:
A Community Conversation
Brent Eberle RPh MBA
Chief Pharmacy Officer, Navitus Health Solutions
General Manager, Lumicera Health Services

AGENDA
• Setting the Stage
• Formulary and Utilization Management Strategies
• Plan and Benefit Design
1
• Role of the Specialty Pharmacy

NAVITUS HEALTH SOLUTIONS
Navitus is a national, full-service pharmacy benefit manager (PBM) committed to providing superior customer service, ensuring regulatory compliance, improving member health and lowering drug costs in a manner that instills trust and confidence.
• Founded in 2003
• Owned by SSM Health
• Commitment to service excellence and
2
• Commitment to service excellence and evidence-based care
• Over 4.5 million members and growing
• 100% Pass-Through, Transparent Model
• Lowest-Net-Cost Strategy
• Managed Care Roots
• Madison & Appleton, WI; Austin, TX; Phoenix, AZ

NAVITUS PBM PASS-THROUGH BUSINESS MODEL
3

LUMICERA HEALTH SERVICES
• Fully-owned subsidiary of Navitus located in Madison, WI
• Offers innovative specialty pharmacy solutions
• Functions as a stand-alone specialty pharmacy
4
• Adheres to Navitus’ core principals of transparency and stewardship
• Employs the same high-touch, high-quality patient care currently experienced with Navitus
• Cost-Plus Business Model

LUMICERA LICENSING MAP5
License Obtained Application Submitted
No License Needed

DEFINING SPECIALTY6
Method of Administration
Biological / Biotechnology
Injectable or oral, self-administered or
administered by a health care provider
Complex to manufacture, requiring special handling and
administration; limited distribution channels
Drug Cost
Nature of the Disease
Significantly higher cost than traditional
medicationsTaken by a relatively small share of the population who have complex
conditions
Requires ongoing clinical support

SMALL MOLECULE VS. BIOLOGIC
7
N Eng J Med 365;5 NEJM.ORG August 4, 2011

NAVITUS SPECIALTY TRENDS
Current state – specialty products represent1:
8
• Significant shift from traditional brand to specialty products
• Utilization and costs have continued to increase
1Navitus Internal Data

INDUSTRY PERSPECTIVE ON SPECIALTY DRUG SPEND
9
Adapted from 2014 PricewaterhouseCoopers LLP. http://www.pwc.com/us/en/health-industries/behind-the-numbers/

FDA NEW DRUG APPROVALS
20
25
30
35
40
45
10
0
5
10
15
20
Traditional Specialty
U.S. Food and Drug Administration

THEN AND NOWThe Rising Cost of Specialty Drugs
11
$8,000.00
$10,000.00
$12,000.00
$14,000.00
AW
P C
ost
Gleevec 400mg Tablets(Average AWP per #30 pills)
Navitus Internal Data: 2015.
$-
$2,000.00
$4,000.00
$6,000.00
$8,000.00
1/6/2009 1/6/2010 1/6/2011 1/6/2012 1/6/2013 1/6/2014 1/6/2015
AW
P C
ost
• Price increased 2.7 times over last 7 years• Average Annual price increase of 24%• Generic expected 1Q 2016

Formulary and Utilization Management

Formulary and Rebate
Management
Clinical Utilization
Management e.g., Step
Therapy & Prior Authorization
Reporting
UTILIZATION MANAGEMENT TOOLKIT13
Authorization
Pharmacy Network Management
Plan Design Modeling and
Support
Drug Therapy
Management

UM TOOLS
• Formulary and Rebate Management- Identification of products that provide the best value
- Manufacturer rebates used to offset costs
- Tiering of products based value and plan / benefit design
• Prior Authorization / Step Therapy / Quantity Limits
14
- Used to ensure use is consistent with FDA approved labeling and recognized national treatment guidelines
- Encourages the use of lower cost agents when appropriate
- Limits quantities to optimize dosing regimen
• Reports- First Fill Trigger Reports
- Outlier claims
- Fraud / Waste and Abuse

UM TOOLS CONT.
• Drug Therapy Management- Use of Clinical Pathways (PA Process / Specialty Pharmacy)
o Patient Education
o Side Effect Management
- Partial Fill Programs
- Retrospective Drug Utilization Review
- Adherence Reporting
15
- Adherence Reporting
• Pharmacy Network Management- Preferred Specialty Pharmacies
• Plan / Benefit Design- Copays / Max Out of Pocket / Deductibles / etc.
- Closed / Limited Pharmacy Networks
- ACA and other regulatory limitations

CLINICAL PROGRAM OVERVIEW
16

ONCOLOGY DRUG A
Criteria Y N
Were study results published? x
Were study results peer reviewed? x
Was comparison to placebo when other treatments are possible? x
Was it compared to active comparator? x
If yes, was the comparator appropriate (i.e. standard of care)? x
17
Was QOL assessed? x
Was an appropriate tool used to assess QOL? x
Were OS available? x
Were PFS data available? x
If OS data were not available did PFS correlate with an improvement in OS?
NA
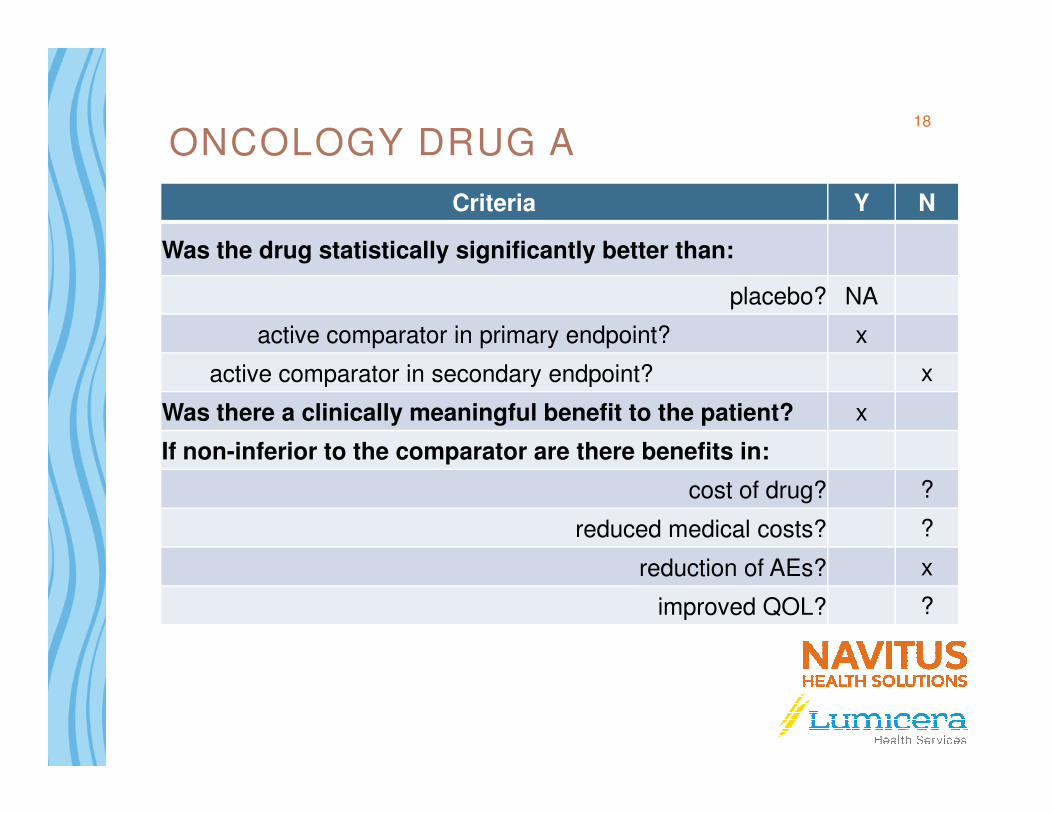
ONCOLOGY DRUG A
Criteria Y N
Was the drug statistically significantly better than:
placebo? NA
active comparator in primary endpoint? x
active comparator in secondary endpoint? x
Was there a clinically meaningful benefit to the patient? x
18
Was there a clinically meaningful benefit to the patient? x
If non-inferior to the comparator are there benefits in:
cost of drug? ?
reduced medical costs? ?
reduction of AEs? x
improved QOL? ?
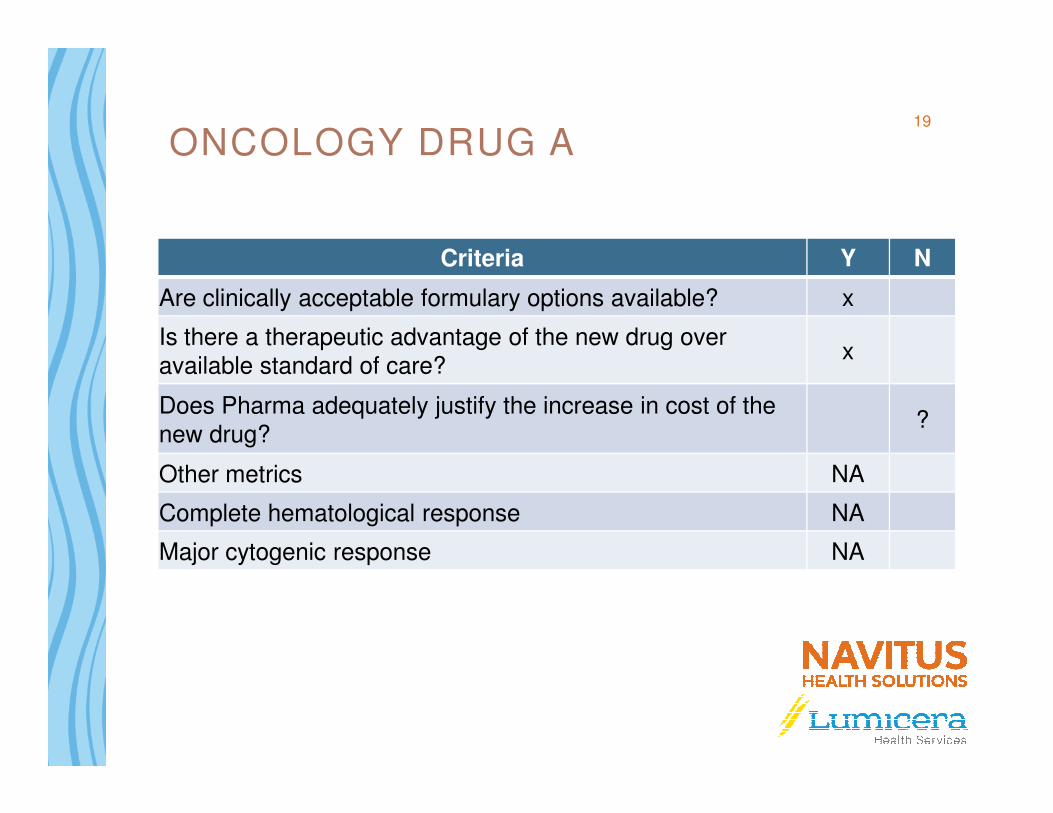
ONCOLOGY DRUG A
Criteria Y N
Are clinically acceptable formulary options available? x
Is there a therapeutic advantage of the new drug over available standard of care?
x
Does Pharma adequately justify the increase in cost of the ?
19
Does Pharma adequately justify the increase in cost of the new drug?
?
Other metrics NA
Complete hematological response NA
Major cytogenic response NA

Benefit and Plan Design

Drug Util ization ReviewAverage Script Cost vs. Script Volume
21
Observations:
• In 2015-Q1/Q2, 67.1% of the claims volume had a Plain Paid amount of <$25.
• Only 1.3% of claims (15,144 claims) have a Plan Paid amount of >$1000, which accounted for 40.7% of Total Plan Paid.

PLAN DESIGN TRENDS
• Increasing Member Out-of-Pocket costs- Multiple Formulary Tiers
- Specialty Tiers
- Co-insurance and Max-Out-of-Pocket
- Growth in High Deductible Health Plans
- WI Oral Chemotherapy Parity Legislation
• Narrow or Limited Specialty Pharmacy Networks
22
• Narrow or Limited Specialty Pharmacy Networks- Mandating use of a preferred specialty pharmacy
- Limited Distribution Drugs (LDD)
• Key Statistics from EMD Serono Specialty Digest- 84% of surveyed plans have high-deductible benefits
- 59% of surveyed plans have dedicated tiers for specialty products
- Dollar Copay for Specialty Ranged from $45-$250 (mean $102)
EMD Serono Specialty Digest, 11th Edition 2015

MANUFACTURER COPAY ASSISTANCE
23

EXAMPLE24
Pharmacy Sends Claim to Patients PBM
Pharmacy Sends Claim to Patients PBM
Pharmacy Sends Claim to Manufacturer Program
Pharmacy Sends Claim to Manufacturer Program
Oncology Drug ACost: $5,000 / monthBenefit: HDHP - $5,000
$100 per Rx after deductible
1st Claim
Patient Pay: $5,000
Plan Pay: $0
1st Claim
Patient Pay: $5,000
Plan Pay: $0
2nd Claim
Patient Pay: $100
Plan Pay: $4,900
2nd Claim
Patient Pay: $100
Plan Pay: $4,900
3rd Claim
Patient Pay: $100
Plan Pay: $4,900
3rd Claim
Patient Pay: $100
Plan Pay: $4,900
1st Claim
Patient Pay: $25
Manf. Pay: $4,975
1st Claim
Patient Pay: $25
Manf. Pay: $4,975
2nd Claim
Patient Pay: $25
Manf. Pay: $75
2nd Claim
Patient Pay: $25
Manf. Pay: $75
3rd Claim
Patient Pay: $25
Plan Pay: $75
3rd Claim
Patient Pay: $25
Plan Pay: $75
Summary (3 Claims)PBM Patient Pay: $5,200
Actual Patient Pay: $75Manf. Pay: $5,125Plan Pay: $9,800

DIFFERENT TYPES OF MANUFACTURER PROGRAMS
• Direct Manufacturer Program- Eligibility Varies
- Copays Varies
- Maximum Benefit Varies
25
• Other Copay Programs- Non-Profit Foundations
• Pre-paid debt cards

Specialty Pharmacy Management

RETAIL VS. SPECIALTY27
RETAIL SPECIALTY
Access to Product Trend is moving specialty products AWAY from Retail to a more controlled environment with better services, patient care, and ROI
Must have “SP” service capabilities before access to product is granted
Clinical Program Benefits
Standard Adjudication , modest medical billing
Full Benefits Review including, pharmacy, medical, nursing, mail, specialty
Clinical Reporting Rx dispensing systems typically do not allow electronic data capture in a reportable fashion
Rx Dispensing systems designed to capture data by product, by Payor, by Physician, by national guideline
CoPay Assistance Utilizes copay cards Uses cards, but often is connected electronically to 501c3 organizations/ foundations and manufacturer programs
Geographic Footprint Usually Local/Regional National: Licensure in all States Required
National Delivery Local pick up, occasional courier 95%+ are via mail/FedEx/Courier to all Licensed States
Manufacturer Service Fees / Rebates / Discounts
Limited, if any availability These fees are approaching 60% of gross margin for Specialty Pharmacies

WHAT IS A SPECIALTY PHARMACY?
• Any pharmacy can claim to be a specialty pharmacy
• URAC accreditation- Payers are increasing demand for accredited specialty pharmacies
28
180 164Companies
Companies & Locations with URAC Specialty Pharmacy Accreditation, 2008-2014
0
20
40
60
80
100
120
140
160
180
2008 2009 2010 2011 2012 2013 2014E
2 6 1016
31
59
110
615
29
50
78
114
164Companies
Specialty Pharmacy Locations
*for 2014, total companies includes all companies classified as “In Process.” Pembroke Consulting estimate for total locations in 2014.
Source: Pembroke Consulting analysis of URAC Directory of Accredited Companies, December 2013.
Note: This chart data appears as Exhibit 92 in the 2013-14 Economic Report on Retail, Mail and Specialty Pharmacies, Drug Channels Institute, January 2014.
(http://drugchannelsinstitute.com/products/industry_report/pharmacy/)

SPECIALTY FULFILLMENT PROCESS
Rx arrives @ Specialty Pharmacy
Pharmacist performs PV1
Tech packages
Pharmacist performs PV2
29
Tech reviews & enters Rx into system; benefits
team conducts investigation
Team member calls patient to confirm
shipping information & need-by date and
discusses any specific clinical and financial issues or concerns
and ships

CUSTOMIZABLE CLINICAL PATHWAY PROCESS
Set up at category and drug
level
Pathway can be set up by fill date, number of fills, at
enrollment, etc.
30
enrollment, etc.
With program triggers, team member contacts patient with specified
questionsPatient information is stored in system for
future communications

SPECIALTY CLINICAL MANAGEMENT
• Increase adherence to therapy, monitor adverse events and side effects, and improve outcomes
• Examples: Oral Oncology
• Ensure medications are being used in accordance with
P&T recommendations
• Facilitate formulary changes and use of biogenerics/biosimilars as available
Clinical Pathways
ProductSelection
31
• P&T determines PA criteria and formulary placement
• PBM makes PA determinations
Oncology biosimilars as available
• Support split-fill and dose optimization programs
• Identify and discontinue therapy that is duplicative or non-effective
Pathways
Prior Authorization
and Formulary Decisions
Waste Management
Selection
Data Integration

Share a Clear View
High-Touch ServiceHigh-Touch Service
Lowest Net Drug Costs
Improved Member Health
This document is to be considered confidential and proprietary. Navitus Health Solutions, LLC © 2015