Pharmacokinetic parameters: Half- life (t1/2
23
Pharmacokinetic parameters: Half- life (t 1/2 ) 1. By definition t 1/2 is the time required for the concentration to fall by one half. For drugs with first order kinetics this is a constant. 2. Half-life allows the calculation of the time required for plasma concentrations to reach steady-state after starting (or changing) a dosing regimen. 3. It also allows us to estimate the time required for a high dose to fall back within the therapeutic range after an overdose. Hence it allows us to determine when to re-start therapy after such an event. 4. Dosing intervals can also be determined using half-life. i.e. If the half-life is longer than expected (as shown by drug accumulation) the dosing interval can be extended, rather than decreasing the dose (see aminoglycosides later).
Transcript of Pharmacokinetic parameters: Half- life (t1/2

Pharmacokinetic parameters: Half-
life (t1/2)
1. By definition t1/2 is the time required for the concentration to fall by one half. For drugs with first order kinetics this is a constant.
2. Half-life allows the calculation of the time required for plasma concentrations to reach steady-state after starting (or changing) a dosing regimen.
3. It also allows us to estimate the time required for a high dose to fall back within the therapeutic range after an overdose. Hence it allows us to determine when to re-start therapy after such an event.
4. Dosing intervals can also be determined using half-life. i.e. If the half-life is longer than expected (as shown by drug accumulation) the dosing interval can be extended, rather than decreasing the dose (see aminoglycosides later).

PK Parameters - Bioavailability (F).
Absolute bioavailability is the fraction of the dose that reaches the systemic circulation and is usually determined by comparing the AUC of an oral dose (F<1) with that of an IV dose (F = 1).
Oral doses of drugs that are cleared by the liver have an absolute bioavailability of less than one as the portal circulation from the gut passes through the liver before going to the systemic circulation. This is known as the first-pass effect.
Drugs absorbed through the buccal cavity pass directly into the systemic circulation. This route of administration therefore has a higher bioavailability than the oral route for many drugs.
Comparative Bioavailability is the ratio of the area under the curves (AUC’s) of two formulations of the same drug.

Example - Aminoglycoside Therapy
(Gentamicin & Tobramycin)
Therapeutic Aim: To maximise efficacy with
minimum toxicity. This is achieved by;
1. Achieving a high peak concentration (i.e.
10 x MIC) to maximise the concentration
dependent killing and post-antibiotic effect (post antibiotic effect is proportional to the peak
concentration and is the period of time that bacterial
growth is suppressed after the plasma concentration has
fallen below the MIC).
2. To achieve a low concentration or “drug
free” period at the end of the dosing
interval to assist in the reversal of adaptive
resistance, and to minimise drug accumulation and
toxicity.

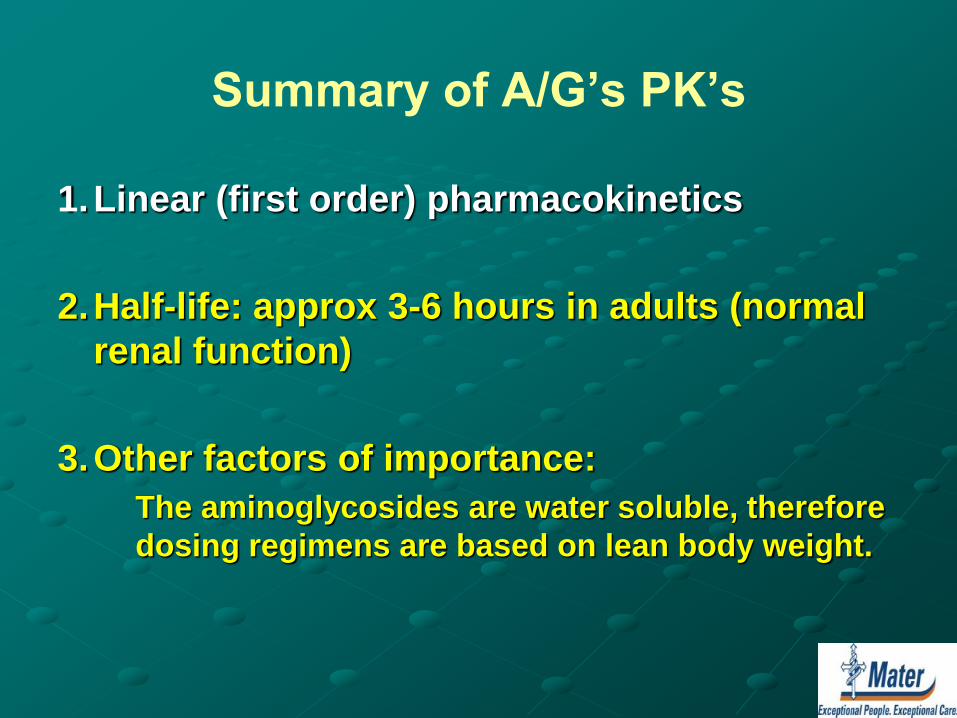
Summary of A/G’s PK’s
1. Linear (first order) pharmacokinetics
2. Half-life: approx 3-6 hours in adults (normal
renal function)
3. Other factors of importance:
The aminoglycosides are water soluble, therefore
dosing regimens are based on lean body weight.
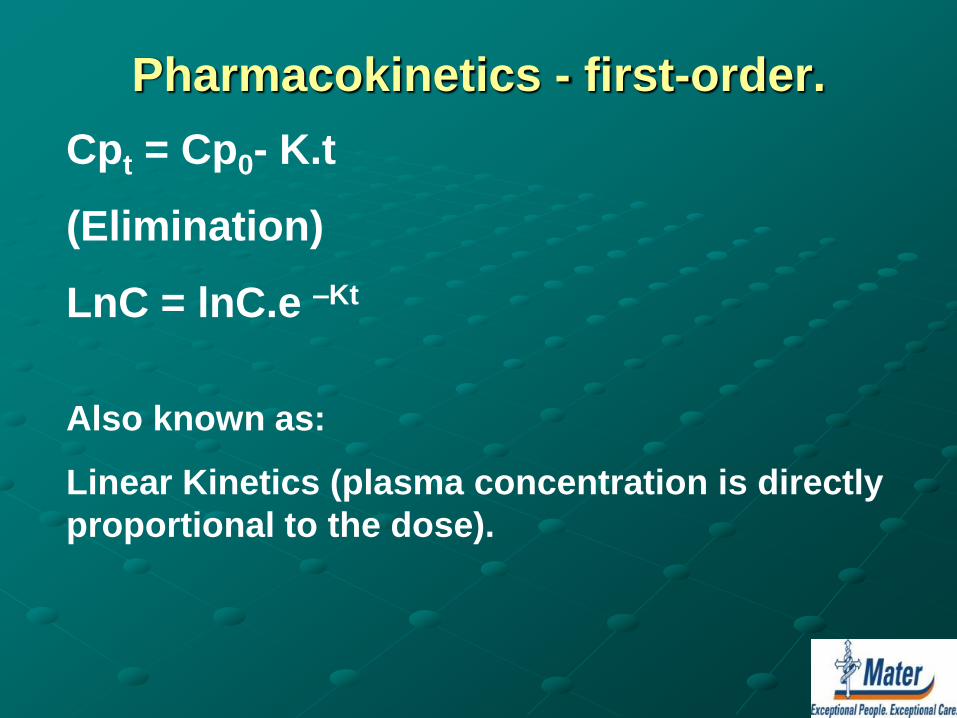
Pharmacokinetics - first-order.
Cpt = Cp0- K.t
(Elimination)
LnC = lnC.e –Kt
Also known as:
Linear Kinetics (plasma concentration is directly
proportional to the dose).
Summary of A/G’s PK’s
1. Linear (first order) pharmacokinetics
2. Half-life: approx 3-6 hours in adults (normal
renal function)
3. Other factors of importance:
The aminoglycosides are water soluble, therefore
dosing regimens are based on lean body weight.

TDM of Phenytoin - Zero order (Michaelis
–Menten) Pharmacokinetics.
Most drugs are cleared predominantly by the liver.
The liver enzyme systems usually have excess capacity to metabolise drug presented to them.
This results in first order kinetics where increases in dose result in proportional increases in circulating concentration.
If the concentration of drug approaches (or exceeds) the ability of the liver enzyme system to metabolise it, we have zero order (MM) pharmacokinetics. Under these conditions any increase in dose will result in a disproportionately high increase in concentration. If the capacity to metabolise the drug is exceeded, the concentration will continue to rise until the therapy is ceased. – potentially dangerous situation!

TDM of phenytoin - PK’s.
Non-Linear (Zero order) pharmacokinetics.
1. (Apparent) half-life is approximately 40 hours and
is variable both within and between patients.
2. Primarily cleared by hepatic metabolism.
3. Volume of distribution is approximately 0.65 L/kg
4. Induction of liver enzymes influences metabolism.
5. Vm is variable but within the range 100-1000
mg/day.
6. Km is variable within the range of 1-15 mg/L.
7. Initial doses usually established from protocols/
guidelines.

TDM of phenytoin - protein binding
and free drug concentrations. 1. Many drugs are reversibly bound to proteins in the plasma.
2. Basic drugs such as amitriptyline bind predominantly to alpha one acid glycoprotein (AAG) and acidic drugs such as phenytoin bind to albumin. AAG is an acute phase reactant and its production is increased in relation to stresses such as surgery or disease, hence the concentration of free drug compared to the total drug concentration can vary substantially when the protein concentration varies. This is true for variation in albumin concentrations also.
3. In vitro studies demonstrated the ability of drugs to displace each other from the binding sites. It was thought that drug-drug displacement interactions would therefore have a significant impact on PK’s
4. In most cases however clearance and volume of distribution mechanisms rapidly adjust for binding alterations and they have little, if any, impact on PK’s, with a couple of notable exceptions. Phenytoin is one such exception.
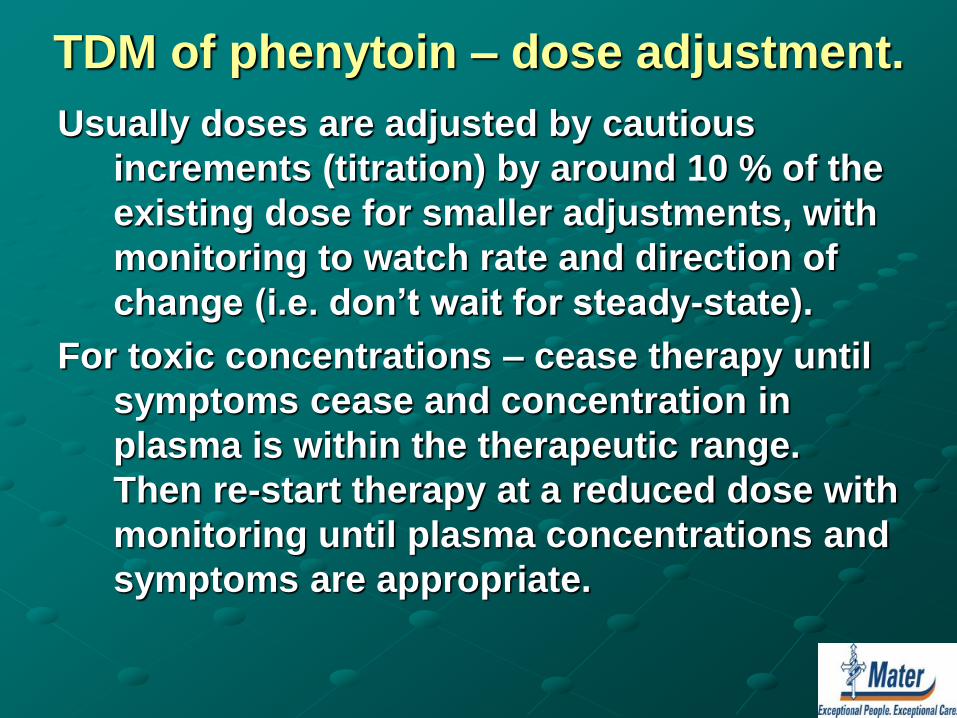
TDM of phenytoin – dose adjustment.
Usually doses are adjusted by cautious
increments (titration) by around 10 % of the
existing dose for smaller adjustments, with
monitoring to watch rate and direction of
change (i.e. don’t wait for steady-state).
For toxic concentrations – cease therapy until
symptoms cease and concentration in
plasma is within the therapeutic range.
Then re-start therapy at a reduced dose with
monitoring until plasma concentrations and
symptoms are appropriate.
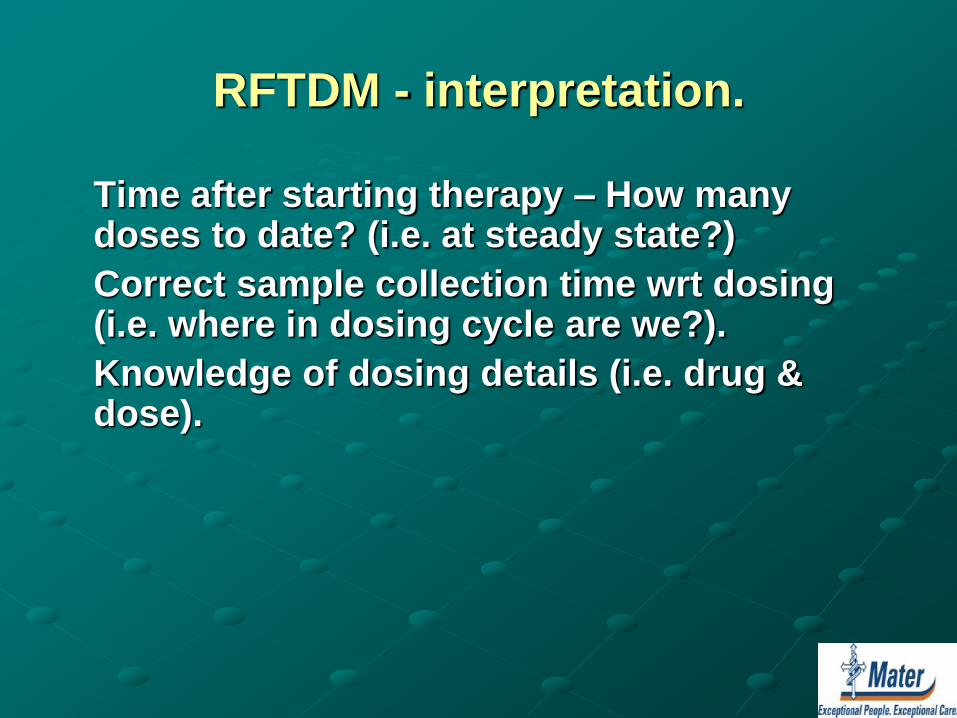
RFTDM - interpretation.
Time after starting therapy – How many doses to date? (i.e. at steady state?)
Correct sample collection time wrt dosing (i.e. where in dosing cycle are we?).
Knowledge of dosing details (i.e. drug & dose).

RFTDM – Timing of collection of
samples Steady state required (4-5 half-lives) for
monitoring (in most cases).
Trough levels used in most cases as:
Equilibrium with tissue concentrations.
More accurate as change with time is less.
(Collection time not as critical).
Data wrt efficacy and/or toxicity usually related to
trough (predose) concentrations because of first
two points.

RFTDM - Importance of correct
information. (eg Tobramycin AUC’s).
5 yo female. CF. 320 mg tobra iv daily.
Time (h) AUC (0.5 hr inf) AUC (1.0 hr inf)
1.0 79 68
1.5 87 74
2.0 99 83
2.5 115 95
AUC range = 80-100, Target AUC = 95.

Importance of correct information
(Adult patient on tobramycin).
Date Dose
(mg)
AUC
(mg.L/hr)
Se Creat
(µmol/L)
31/3 280 63 62
03/4 320 70 71
07/5 320 59 67
13/5 400 53 59
15/6 320 90 61

Where can things go wrong?
Blood collection – contamination from central lines/skin. - Special protocols. Cyclosporin (central lines)
Tobramycin (central line &/or inhalers)
Other?
Times – details of time dose given and time sample taken.
Doses - need correct dosing details.
Complete and correct information needed in patients’ charts.

Dose Individualisation - Bayesian PK
Modelling (eg. TCIWorks ®)
New patient – predicts Concentration/Time curve (i.e. PK
profile) based on population PK model and patient
demographics.
Estimating initial dose from demographics and proposed
dose.
Add dosing/concentration data
Establishing individual model
Predicting a new dose.
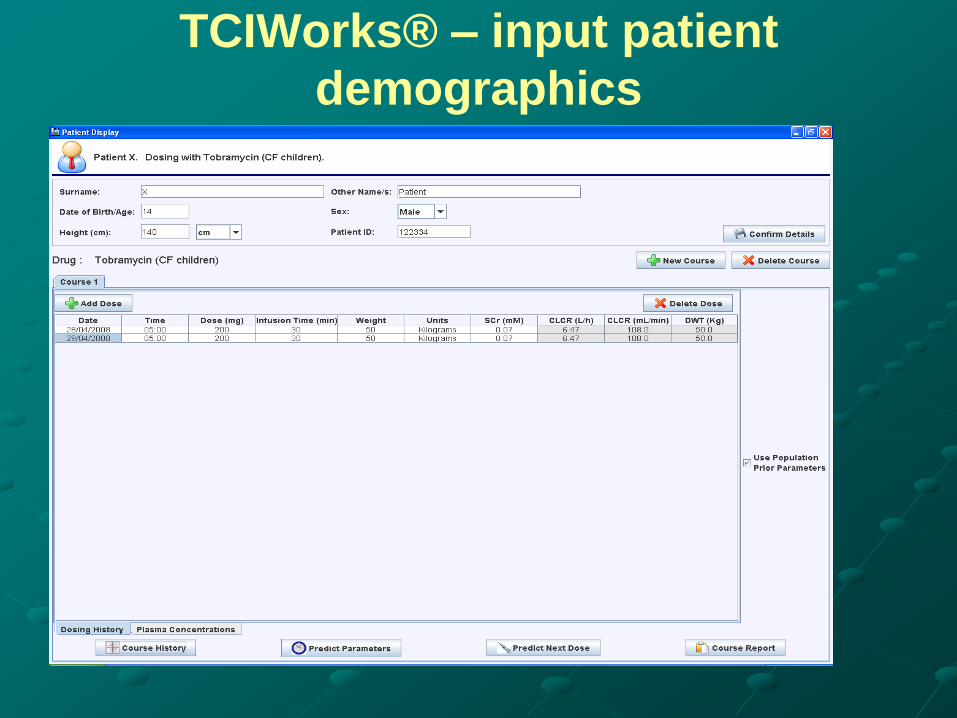
TCIWorks® – input patient
demographics

TCIWorks® – population estimation
TCIWorks® – individual model
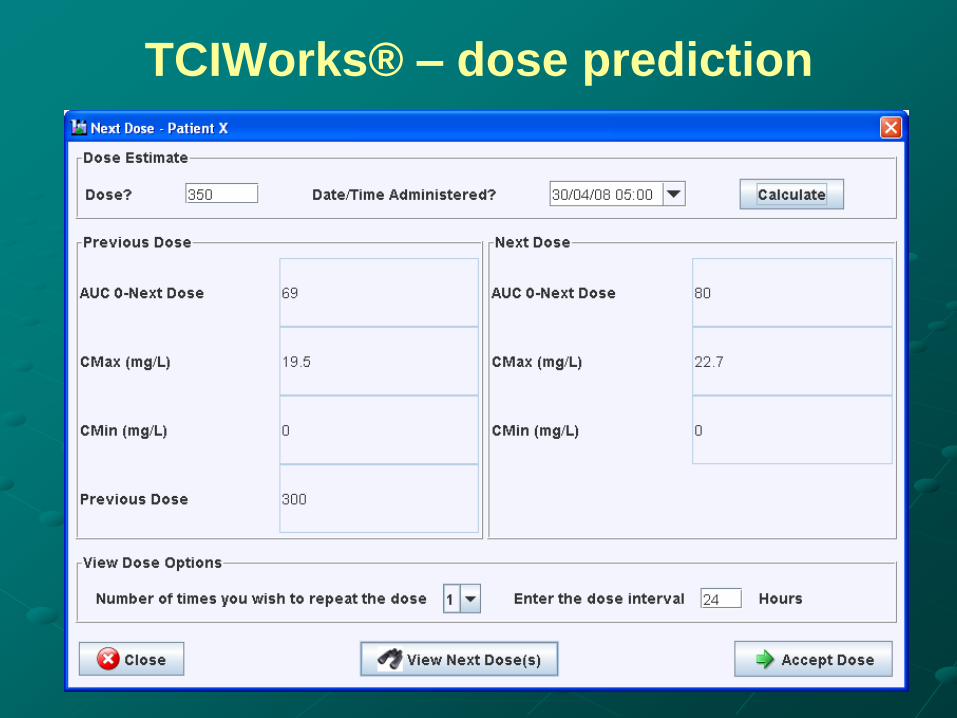
TCIWorks® – dose prediction

TCIWorks® – PK prediction based on
proposed dose

TCIWorks® - report

Therapeutic Drug Monitoring fundamentals
and emerging trends - Focus on Antimicrobials.
Thursday 6th December 2012.
University of Sydney.
This meeting will bring together all healthcare professionals involved in Therapeutic
Drug Monitoring, especially those involved in the use of antimicrobial agents. The
meeting is aimed at Medical Scientists, Chemical Pathologists, Pharmacists, Clinical
Pharmacologists and Infectious Diseases Physicians. The principles of therapeutic
drug monitoring will be introduced and discussed, illustrated with antimicrobial
drugs. Current practices and issues of analysis, interpretation and delivery will be
covered. Emerging trends in target concentration interventions will be presented
using antimicrobial examples. Speakers include prominent national speakers and our
international speaker is Dr Michael Neely from the Keck School of Medicine,
University of Southern California and the Laboratory of Applied Pharmacokinetics,
Los Angeles. Dr Neely is an infectious diseases physician and will be presenting from
his substantial clinical application of computer based pharmacokinetic modelling in
clinical practice.