Pharmacists against Smoking
116
Pharmacists against Smoking Research Report 2001
Transcript of Pharmacists against Smoking
Pharmacistsagainst Smoking
Research Report2001
ABSTRACT
During the last ten years, non-smoking activities have become an important part of health promotion in community pharmacies. Moreover, the broader use of nicotine replacement therapy (NRT) and the availability of NRT products over the counter have emphasized the pharmacists’ duty to provide their clients with information and guidance concerning NRT and tobacco issues in general.
No accurate information was available on how such changes to their role are perceived by pharmacists. To gain more knowledge, therefore, a research project was developed by the EuroPharm Forum Smoking Cessation Task Force and a survey entitled “Pharmacists against smoking” was carried out in 12 European countries. The research project is part of a cooperative project between the Tobacco or Health programme at the Regional Office and the three fora of health professionals, aiming to reduce the level of smoking among health service users and health professionals.
The overall aim of the survey was to collect information about the attitudes of community pharmacists towards tobacco dependence and their actual activities in this field. A second aim was to gather information about their smoking habits, in order to see whether that had an impact on their attitudes and activities. Such knowledge would make it possible to find more effective methods to reduce smoking among Europeans and to further develop non-smoking activities in community pharmacies.
The survey showed that the situation regarding non-smoking work in community pharmacies in Europe is favourable. Community pharmacists are less frequent smokers than the general population of the country in question, and they know the health risks of tobacco use and are aware of the risks of passive smoking. Pharmacists have a positive attitude towards non-smoking work and their knowledge of tobacco dependence in general facilitates their activities, although more education is required. The results also showed that pharmacists who smoke are usually not so active in their non-smoking activities and their attitudes are more negative.
NRT is widely promoted in community pharmacies. As these products are in most cases sold without prescription, it is of utmost importance that pharmacists can support clients who want to quit smoking with the help of NRT. The survey showed that the situation seems to be quite good, but more knowledge and written information are needed.
The results can be used in national work in the development of national guidelines on smoking cessation or where legislative action should be taken. The project team will continue work on documenting and informing on pharmacists’ activities, as well as providing models for non-smoking work. National pharmaceutical associations have an important role in ensuring the implementation of the models and encouraging their members to continue with their non-smoking activities.
Keywords
SMOKING – prevention and control PHARMACISTS SMOKING CESSATION COMMUNITY PHARMACY SERVICES HEALTH PROMOTION EUROPE
© World Health Organization – 2001All rights in this document are reserved by the WHO Regional Office for Europe. The document may nevertheless be freely reviewed,abstracted, reproduced or translated into any other language (but not for sale or for use in conjunction with commercial purposes)provided that full acknowledgement is given to the source. For the use of the WHO emblem, permission must be sought from the WHORegional Office. Any translation should include the words: The translator of this document is responsible for the accuracy of thetranslation. The Regional Office would appreciate receiving three copies of any translation. Any views expressed by named authors aresolely the responsibility of those authors.
WHO Regional Office for Europe, Copenhagen
CONTENTS
Page
1. Introduction.........................................................................................................................................1
2. Technical description of the project; materials and methods..............................................................3
3. Results.................................................................................................................................................6
3.1 Response rate ............................................................................................................................63.2 Distribution by age and gender .................................................................................................63.3 Smoking status of pharmacists .................................................................................................73.4 Results of questions on tobacco consumption and intentions to stop smoking ........................9 3.5 Reasons for not smoking.........................................................................................................103.6 Smoking in pharmacies...........................................................................................................123.7 Non-smoking activities of pharmacists...................................................................................12 3.8 Attitudes of pharmacists .........................................................................................................15
4. Analysis.............................................................................................................................................19
4.1 Validity of data .......................................................................................................................194.2 Tobacco use among community pharmacists .........................................................................19 4.3 Reasons for not smoking.........................................................................................................204.4 Non-smoking activities ...........................................................................................................214.5 The attitudes of pharmacists ...................................................................................................22
5. Conclusions.......................................................................................................................................23
6. Appendices........................................................................................................................................27
Teräsalmi, Eeva,1 Gustafsen, Ida,2 Juncher, Visti and Djerf, Kari
Smoking habits of community pharmacists in 12 European countries and their attitudes towards non-smoking work
Research report
Pharmacists against smoking EuroPharm Forum 2001
This survey has been financially supported by the European Commission via the European Network for Smoking Prevention.
Neither the European Commission nor any person acting on its behalf is liable for any use made of the information contained in this report.
1 To whom all correspondence should be sent: Virkby Äppelapotek, Virkbyvägen 8, 08700 Virkby, Finland, [email protected]. 2 The Forum of European Pharmaceutical Associations and the World Health Organization Regional Office for Europe, Scherfigsvej 8, DK-2100 Copenhagen, Denmark, [email protected].
EUR/01/5025372 page 1
1. Introduction
During the last ten years, the role of the pharmacist has widened to cover various areas of health promotion and health education. A change from simply dispensing medicines to a more holistic view of patients and their wellbeing has occurred in several countries and in various projects (1).The new concept has been called clinical pharmacy, and has subsequently developed further to what is known as pharmaceutical care (2).
Along with that development, non-smoking activities have also become an important part of health promotion in community pharmacies. In many European countries, models suitable for pharmacy use have been developed and piloted (3–12). The results of these projects have shown that such activities by pharmacists are both effective and cost-effective (13–16). Based on these experiences, the European pharmaceutical organizations have accepted non-smoking programmes for community pharmacy use (17–19). Pharmacists have also become active partners in the non-smoking programmes run by the World Health Organization (WHO), such as the WHO Action Plan for a Tobacco-free Europe, the WHO European Partnership Project and the WHO Framework for Tobacco Control. The recommendations on evidence-based treatment of tobacco dependence produced for the WHO Partnership Project state, “Although the evidence base is stronger for some health professionals than others, the involvement of health professionals in offering smokers help should be based on factors such as their access to smokers and level of training and skill, rather than professional discipline. Thus the recommendations for health professionals are relevant for all health professionals and not only those based in primary care” (20).
Nicotine replacement therapy (NRT) appeared on the pharmaceutical market in the mid-1980s. Today, these products are usually available from pharmacies without prescription. In a review article from the Cochrane Library, Lancaster et al. (21) wrote “The Cochrane review of over 90 trials found that nicotine replacement therapy helps people to stop smoking. It increased the chances of quitting about one and a half to two times. Since all the trials of nicotine replacement have included at least brief advice, this is the minimum that should be offered. A decision which product to use should be guided on individual preferences because there is little evidence that one nicotine product is more effective than another”.
This means that community pharmacists have a duty to provide their clients with information and guidance concerning nicotine replacement therapy and smoking issues in general.
The changes in the work of community pharmacists in relation to smoking have been profound and rapid. Pharmacists in Europe have never sold tobacco, but in the United States this practice has been common. Today, pharmacists should be seen to promote non-smoking through their own example, provide good information to clients and give support to those willing to quit smoking.
Since the situation had changed so much and no accurate information was available on how this new role had been accepted and implemented in everyday practice in community pharmacies, it was decided to study the subject. A research project entitled “Pharmacists against smoking” was therefore set up to gain more knowledge about the current situation among European pharmacists. The results of the study would be used to further develop non-smoking activities in community pharmacies.
EUR/01/5025372 page 2
The first aim of the project was to gain information about the attitudes of community pharmacists towards smoking issues and about their actual activities in this field. The second aim was to collect information about the smoking habits of community pharmacists and to determine whether these had any effect on their attitudes and activities. Since Sir Richard Doll’s study in the 1950s, and later research among medical doctors carried out by the Tobacco Control Resource Centre, it has been known that health care providers who do not smoke make better advocates for non-smoking (22).
The project was financially supported by the European Commission through the European Network for Smoking Prevention, EuroPharm Forum and the Association of Finnish Pharmacies.
EUR/01/5025372 page 3
2. Technical description of the project; materials and methods
Planning for the survey was begun by EuroPharm Forum in 1998 in cooperation with the European Forum of Medical Associations and WHO and the European Forum of Nursing and Midwifery Associations and WHO. The common goal of these three forums was to reduce the prevalence of smoking among health care professionals and to give more effectiveness to their cooperation on non-smoking activities.
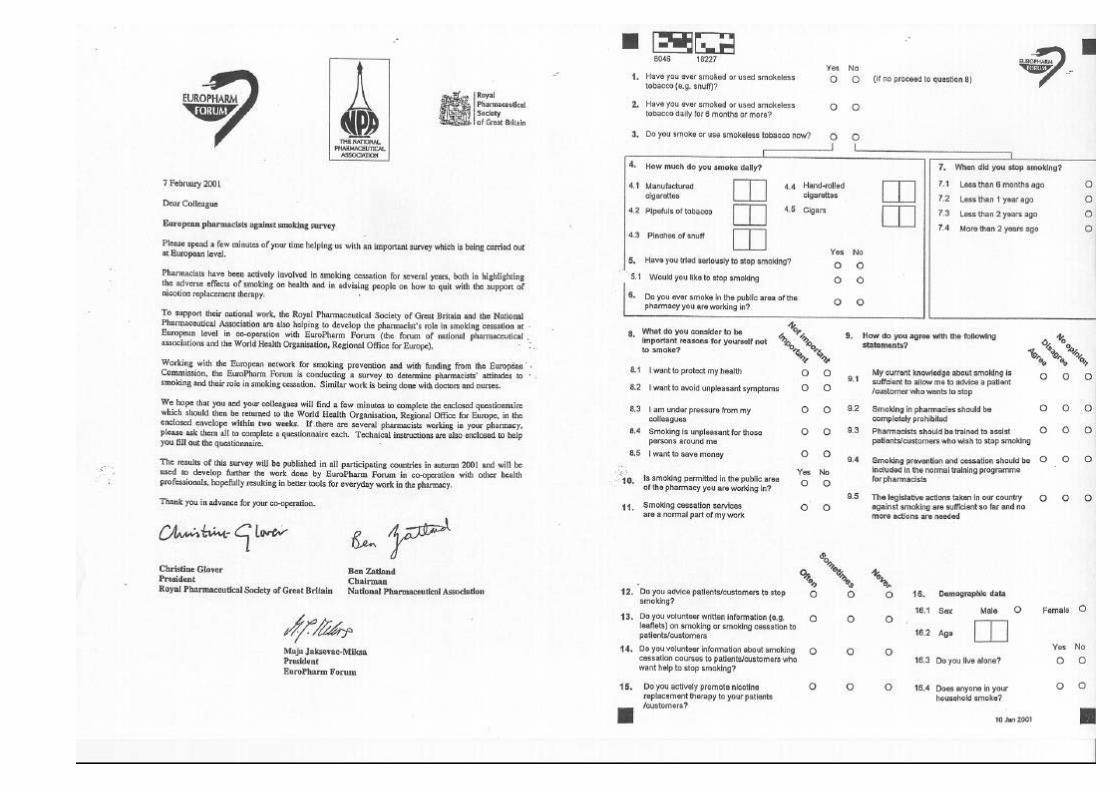
The survey was based on models developed by WHO (23,24). These models have been used in several studies among health care professionals, and have been validated and shown to be reliable. The use of the standard questionnaire makes it possible to compare different populations’ smoking habits, e.g. those of health care providers. For our purposes, the model questionnaire for health care providers was slightly modified to include questions on the attitudes of pharmacists.
From November 1998, the project was promoted to potential partners through direct mailing and published articles. It was also presented at several pharmaceutical congresses and discussed with relevant international partners in order to coordinate initiatives.
A first meeting between the project leader, Eeva Teräsalmi, and representatives from countries interested in carrying out the survey was held in Barcelona in September 1999, during the annual congress of the International Pharmaceutical Federation (FIP).
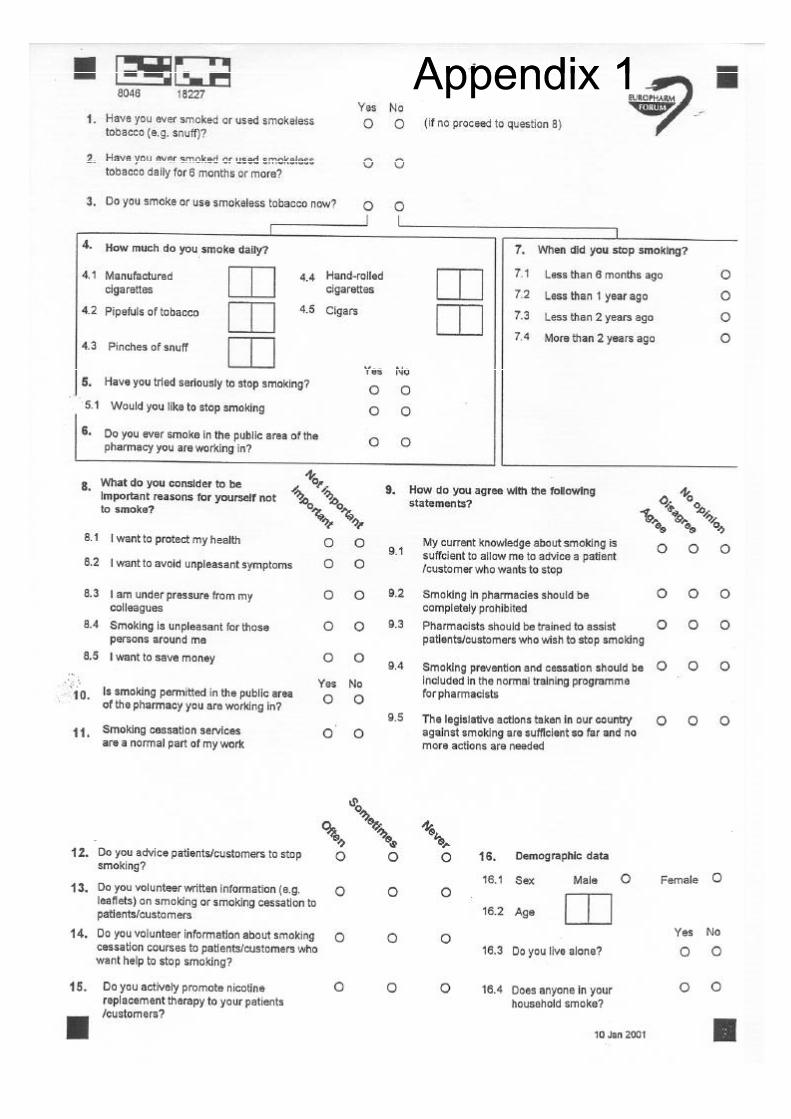
The methodology, sampling, data processing and questionnaire were elaborated in collaboration with the unit of Quality of Care and Technologies (QCT) at the WHO Regional Office for Europe during 1999, and the questionnaire was subsequently tested, revised and finalized (see Appendix 1).
Those national pharmaceutical associations that signed the contract with the project are listed in Appendix 2. For financial reasons and some legal limitations, it was possible to carry out the survey in only 12 European Union (EU) countries, although the research group disseminated the methodology and other materials to all EU countries and to the countries that are members of EuroPharm Forum.
The target population for the survey comprised community pharmacists (including both pharmacy owners or directors and qualified employees). That concept is fairly well established in all participating countries. In Finland and Sweden it was decided that prescriptionists (those with a Bachelor degree in pharmacy) should also be included.
To provide a representative sample of community pharmacists from every participating country, it was decided that national pharmaceutical organizations should draw up a sample based either on a register of pharmacists (if available) or on the register of community pharmacies. It is generally known that the element type of sampling (i.e. pharmacists in person) is statistically more effective than a cluster sample of pharmacies. Owing to a dearth of registers of pharmacists, however, the latter became the most important source of information. A cluster sample can nevertheless provide researchers with important information on possible smoking within pharmacies.
The sampling procedure comprised either a simple random sample or a systematic sample based on postal address or some other variable to ensure full coverage of the target population. Address samples guarantee that all geographical regions are included. In most cases only the addresses of pharmacies were available. The target sample size was 1000 pharmacies, which would yield
EUR/01/5025372 page 4
about 2000 pharmacists on average for countries with 5000 or more community pharmacists, and 1000 pharmacists for countries with fewer than 5000 pharmacists.
The Netherlands provided addresses for every pharmacist, while Denmark and Luxembourg provided the addresses of every pharmacy. In Finland and Sweden variation in the size of pharmacies was much larger than in other participating countries, and it was therefore decided to use stratified two-stage cluster sampling according to the number of pharmacists (including prescriptionists) in each pharmacy. If the number was five or under all should be included, whereas for those pharmacies with six or more pharmacists five should be selected according their date of birth in the calendar year. The sample sizes for Finland and Sweden were nearly equal (about 540 for each) but owing to a misunderstanding all the Swedish pharmacies were included (i.e. 772). That small mistake yielded about 300 extra responses; this did not harm the results but did slightly increase mailing costs.
In the other countries, three questionnaires were sent to every pharmacy in an attempt to ensure that every pharmacist in each pharmacy would receive the questionnaire. Nevertheless, 40 pharmacies returned questionnaires from more than three respondents; all were accepted.
The optical reading technology used in the QCT unit enabled the questionnaires to be coded by country and pharmacy and the replies to be directly scanned. It also allowed some checking of the validity of answers during the scanning process and the sending of reminders to pharmacies that had not responded.
A printing mistake led to one line being missing from the questionnaires sent to Germany. The mistake was pointed out when reminders were sent out.
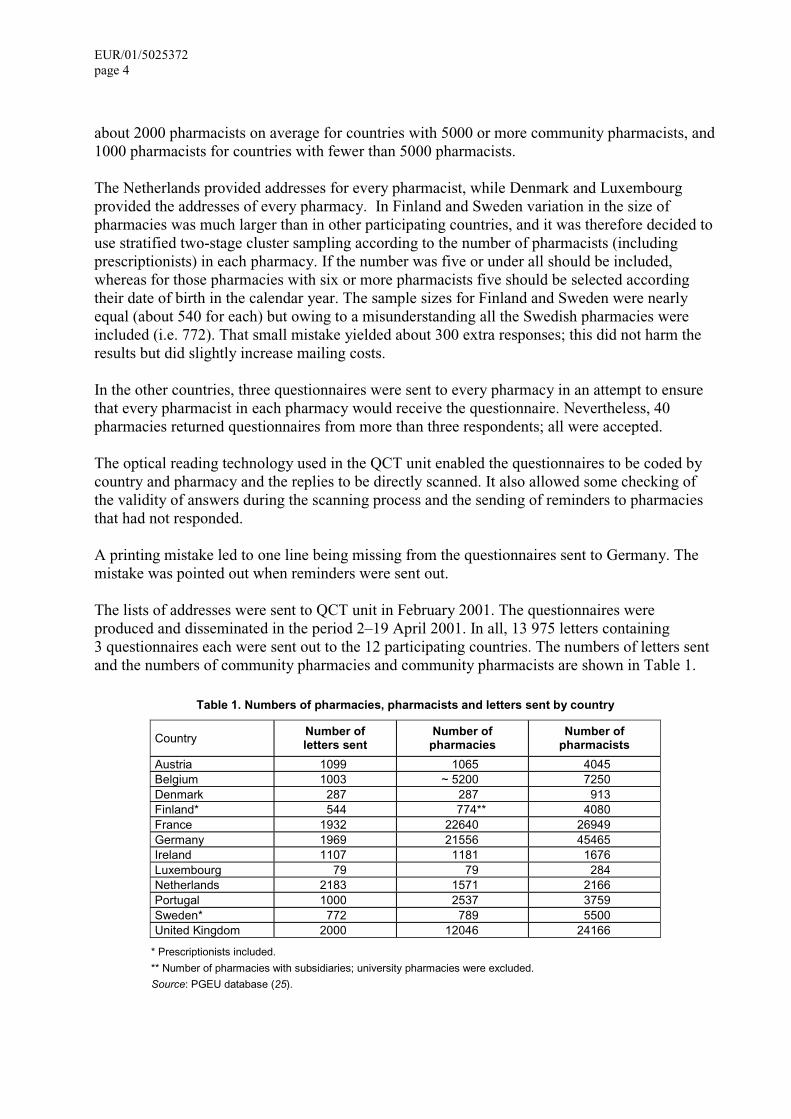
The lists of addresses were sent to QCT unit in February 2001. The questionnaires were produced and disseminated in the period 2–19 April 2001. In all, 13 975 letters containing 3 questionnaires each were sent out to the 12 participating countries. The numbers of letters sent and the numbers of community pharmacies and community pharmacists are shown in Table 1.
Table 1. Numbers of pharmacies, pharmacists and letters sent by country
Country Number of letters sent
Number of pharmacies
Number of pharmacists
Austria 1099 1065 4045 Belgium 1003 ~ 5200 7250 Denmark 287 287 913 Finland* 544 774** 4080 France 1932 22640 26949 Germany 1969 21556 45465 Ireland 1107 1181 1676 Luxembourg 79 79 284 Netherlands 2183 1571 2166 Portugal 1000 2537 3759 Sweden* 772 789 5500 United Kingdom 2000 12046 24166
* Prescriptionists included.
** Number of pharmacies with subsidiaries; university pharmacies were excluded.
Source: PGEU database (25).
EUR/01/5025372 page 5
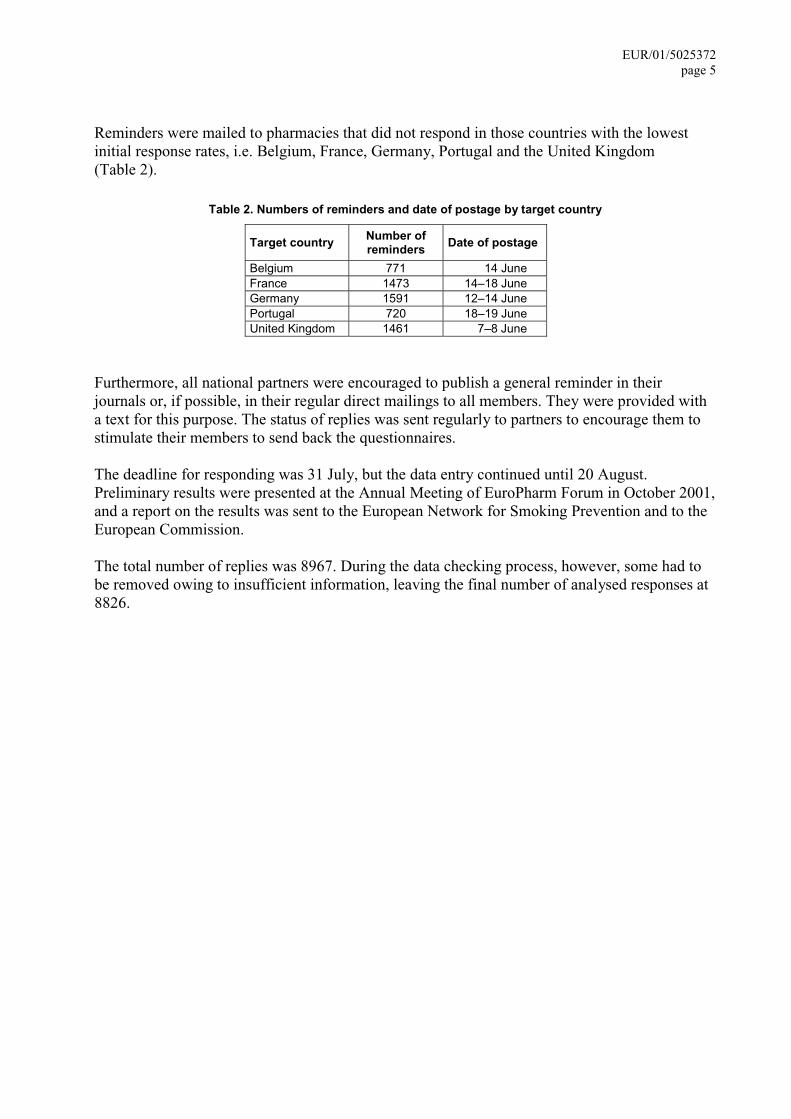
Reminders were mailed to pharmacies that did not respond in those countries with the lowest initial response rates, i.e. Belgium, France, Germany, Portugal and the United Kingdom (Table 2).
Table 2. Numbers of reminders and date of postage by target country
Target country Number of reminders Date of postage
Belgium 771 14 June France 1473 14–18 June Germany 1591 12–14 June Portugal 720 18–19 June United Kingdom 1461 7–8 June
Furthermore, all national partners were encouraged to publish a general reminder in their journals or, if possible, in their regular direct mailings to all members. They were provided with a text for this purpose. The status of replies was sent regularly to partners to encourage them to stimulate their members to send back the questionnaires.
The deadline for responding was 31 July, but the data entry continued until 20 August. Preliminary results were presented at the Annual Meeting of EuroPharm Forum in October 2001, and a report on the results was sent to the European Network for Smoking Prevention and to the European Commission.
The total number of replies was 8967. During the data checking process, however, some had to be removed owing to insufficient information, leaving the final number of analysed responses at 8826.
EUR/01/5025372 page 6
3. Results
3.1 Response rate
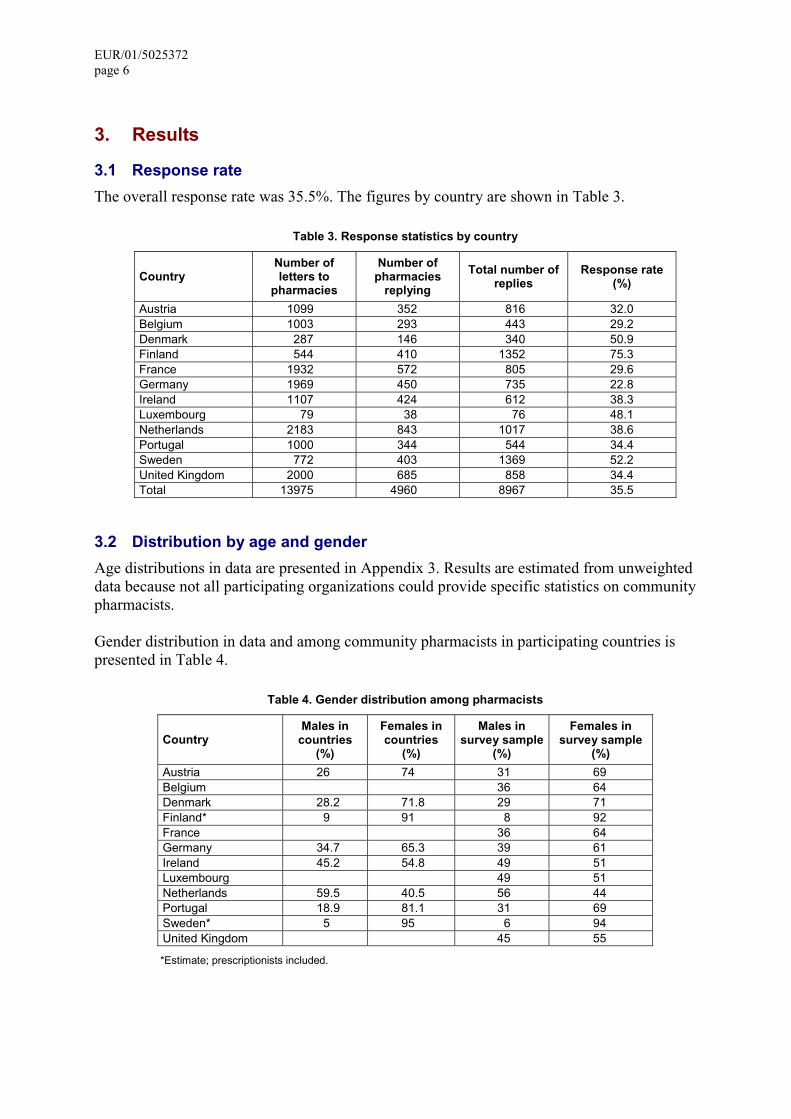
The overall response rate was 35.5%. The figures by country are shown in Table 3.
Table 3. Response statistics by country
Country Number of letters to
pharmacies
Number of pharmacies
replying
Total number of replies
Response rate (%)
Austria 1099 352 816 32.0 Belgium 1003 293 443 29.2 Denmark 287 146 340 50.9 Finland 544 410 1352 75.3 France 1932 572 805 29.6 Germany 1969 450 735 22.8 Ireland 1107 424 612 38.3 Luxembourg 79 38 76 48.1 Netherlands 2183 843 1017 38.6 Portugal 1000 344 544 34.4 Sweden 772 403 1369 52.2 United Kingdom 2000 685 858 34.4 Total 13975 4960 8967 35.5
3.2 Distribution by age and gender
Age distributions in data are presented in Appendix 3. Results are estimated from unweighted data because not all participating organizations could provide specific statistics on community pharmacists.
Gender distribution in data and among community pharmacists in participating countries is presented in Table 4.
Table 4. Gender distribution among pharmacists
Country Males in
countries (%)
Females in countries
(%)
Males in survey sample
(%)
Females in survey sample
(%)
Austria 26 74 31 69 Belgium 36 64 Denmark 28.2 71.8 29 71 Finland* 9 91 8 92 France 36 64 Germany 34.7 65.3 39 61 Ireland 45.2 54.8 49 51 Luxembourg 49 51 Netherlands 59.5 40.5 56 44 Portugal 18.9 81.1 31 69 Sweden* 5 95 6 94 United Kingdom 45 55
*Estimate; prescriptionists included.
EUR/01/5025372 page 7
3.3 Smoking status of pharmacists
The decision as to whether a person is a smoker, an ex-smoker or a non-smoker was based on replies to questions 1, 2, 3, 4.1–4.5 and 7.1–7.4. The process of deduction was based on instructions provided by WHO, but since not all the questions from the model questionnaire were included in the questionnaire used in this study, the rules could be followed only partially. There were some problems concerning people who used tobacco only occasionally and provided contradictory answers. All occasional smokers were classified as smokers.
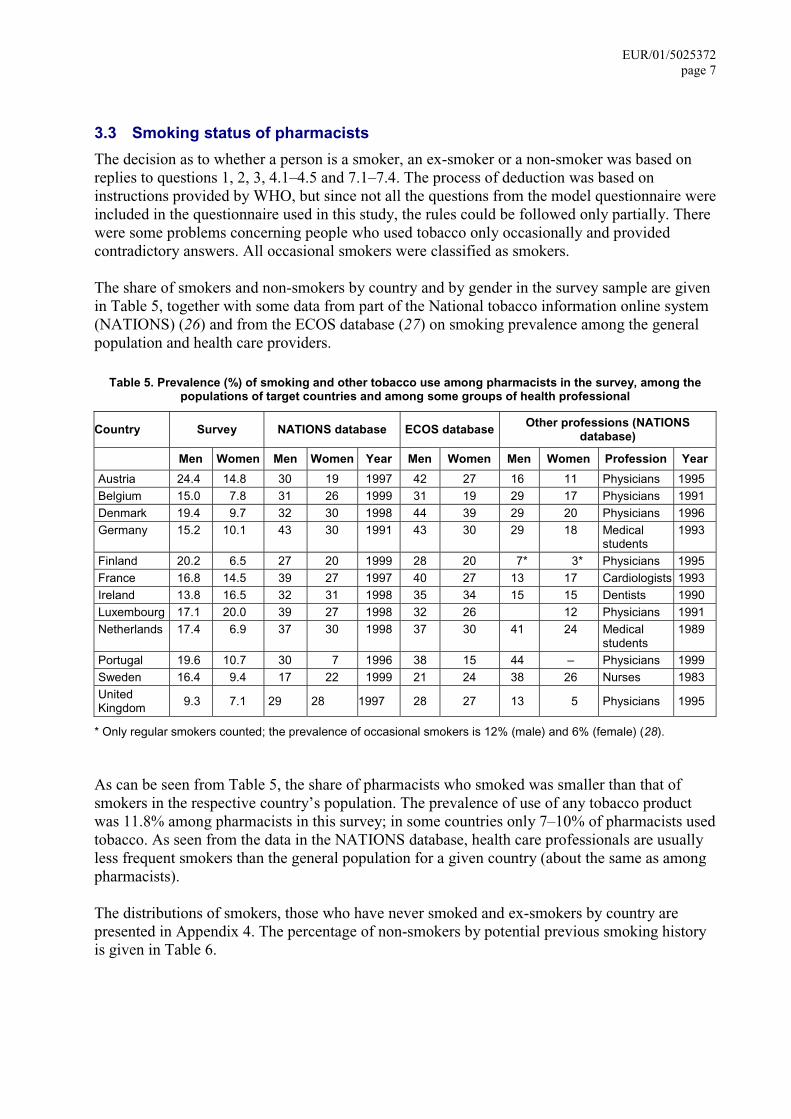
The share of smokers and non-smokers by country and by gender in the survey sample are given in Table 5, together with some data from part of the National tobacco information online system (NATIONS) (26) and from the ECOS database (27) on smoking prevalence among the general population and health care providers.
Table 5. Prevalence (%) of smoking and other tobacco use among pharmacists in the survey, among the populations of target countries and among some groups of health professional
Country Survey NATIONS database ECOS database Other professions (NATIONS database)
Men Women Men Women Year Men Women Men Women Profession Year
Austria 24.4 14.8 30 19 1997 42 27 16 11 Physicians 1995 Belgium 15.0 7.8 31 26 1999 31 19 29 17 Physicians 1991 Denmark 19.4 9.7 32 30 1998 44 39 29 20 Physicians 1996 Germany 15.2 10.1 43 30 1991 43 30 29 18 Medical
students 1993
Finland 20.2 6.5 27 20 1999 28 20 7* 3* Physicians 1995 France 16.8 14.5 39 27 1997 40 27 13 17 Cardiologists 1993 Ireland 13.8 16.5 32 31 1998 35 34 15 15 Dentists 1990 Luxembourg 17.1 20.0 39 27 1998 32 26 12 Physicians 1991 Netherlands 17.4 6.9 37 30 1998 37 30 41 24 Medical
students 1989
Portugal 19.6 10.7 30 7 1996 38 15 44 – Physicians 1999 Sweden 16.4 9.4 17 22 1999 21 24 38 26 Nurses 1983 United Kingdom 9.3 7.1 29 28 1997 28 27 13 5 Physicians 1995
* Only regular smokers counted; the prevalence of occasional smokers is 12% (male) and 6% (female) (28).
As can be seen from Table 5, the share of pharmacists who smoked was smaller than that of smokers in the respective country’s population. The prevalence of use of any tobacco product was 11.8% among pharmacists in this survey; in some countries only 7–10% of pharmacists used tobacco. As seen from the data in the NATIONS database, health care professionals are usually less frequent smokers than the general population for a given country (about the same as among pharmacists).
The distributions of smokers, those who have never smoked and ex-smokers by country are presented in Appendix 4. The percentage of non-smokers by potential previous smoking history is given in Table 6.

EUR/01/5025372 page 8
Table 6. Non-smokers by potential previous smoking history by country ƒƒƒƒƒƒƒƒ…ƒƒƒƒƒƒƒƒ…ƒƒƒƒƒƒƒƒ…ƒƒƒƒƒƒƒƒ…ƒƒƒƒƒƒƒƒ…ƒƒƒƒƒƒƒƒ‰ ‚ ‚ No ‚Stopped ‚ ‚ ‚Stopped ‚ ‚ ‚informa-‚ less ‚Stopped ‚Stopped ‚ more ‚ ‚ ‚tion on ‚ than 6 ‚ 6-12 ‚ 12-24 ‚than 24 ‚ ‚ Never ‚previous‚ months ‚ months ‚ months ‚ months ‚ ‚ smoked ‚smoking ‚ ago ‚ ago ‚ ago ‚ ago ‚ ‡ƒƒƒƒƒƒƒƒ…ƒƒƒƒƒƒƒƒƒˆƒƒƒƒƒƒƒƒˆƒƒƒƒƒƒƒƒˆƒƒƒƒƒƒƒƒˆƒƒƒƒƒƒƒƒˆƒƒƒƒƒƒƒƒˆƒƒƒƒƒƒƒƒ‰ ‚Country ‚ ‚ ‚ ‚ ‚ ‚ ‚ ‚ ‡ƒƒƒƒƒƒƒƒˆƒƒƒƒƒƒƒƒƒ‰ ‚ ‚ ‚ ‚ ‚ ‚ ‚AUT ‚N ‚ 325‚ 111‚ 15‚ 9‚ 18‚ 186‚ ‚ ‡ƒƒƒƒƒƒƒƒƒˆƒƒƒƒƒƒƒƒˆƒƒƒƒƒƒƒƒˆƒƒƒƒƒƒƒƒˆƒƒƒƒƒƒƒƒˆƒƒƒƒƒƒƒƒˆƒƒƒƒƒƒƒƒ‰ ‚ ‚RowPctN ‚ 48.9‚ 16.7‚ 2.3‚ 1.4‚ 2.7‚ 28.0‚ ‡ƒƒƒƒƒƒƒƒˆƒƒƒƒƒƒƒƒƒˆƒƒƒƒƒƒƒƒˆƒƒƒƒƒƒƒƒˆƒƒƒƒƒƒƒƒˆƒƒƒƒƒƒƒƒˆƒƒƒƒƒƒƒƒˆƒƒƒƒƒƒƒƒ‰ ‚BEL ‚N ‚ 225‚ 37‚ 6‚ 2‚ 7‚ 115‚ ‚ ‡ƒƒƒƒƒƒƒƒƒˆƒƒƒƒƒƒƒƒˆƒƒƒƒƒƒƒƒˆƒƒƒƒƒƒƒƒˆƒƒƒƒƒƒƒƒˆƒƒƒƒƒƒƒƒˆƒƒƒƒƒƒƒƒ‰ ‚ ‚RowPctN ‚ 57.4‚ 9.4‚ 1.5‚ 0.5‚ 1.8‚ 29.3‚ ‡ƒƒƒƒƒƒƒƒˆƒƒƒƒƒƒƒƒƒˆƒƒƒƒƒƒƒƒˆƒƒƒƒƒƒƒƒˆƒƒƒƒƒƒƒƒˆƒƒƒƒƒƒƒƒˆƒƒƒƒƒƒƒƒˆƒƒƒƒƒƒƒƒ‰ ‚DEN ‚N ‚ 157‚ 25‚ 4‚ 4‚ 7‚ 102‚ ‚ ‡ƒƒƒƒƒƒƒƒƒˆƒƒƒƒƒƒƒƒˆƒƒƒƒƒƒƒƒˆƒƒƒƒƒƒƒƒˆƒƒƒƒƒƒƒƒˆƒƒƒƒƒƒƒƒˆƒƒƒƒƒƒƒƒ‰ ‚ ‚RowPctN ‚ 52.5‚ 8.4‚ 1.3‚ 1.3‚ 2.3‚ 34.1‚ ‡ƒƒƒƒƒƒƒƒˆƒƒƒƒƒƒƒƒƒˆƒƒƒƒƒƒƒƒˆƒƒƒƒƒƒƒƒˆƒƒƒƒƒƒƒƒˆƒƒƒƒƒƒƒƒˆƒƒƒƒƒƒƒƒˆƒƒƒƒƒƒƒƒ‰ ‚DEU ‚N ‚ 288‚ 99‚ 16‚ 10‚ 16‚ 211‚ ‚ ‡ƒƒƒƒƒƒƒƒƒˆƒƒƒƒƒƒƒƒˆƒƒƒƒƒƒƒƒˆƒƒƒƒƒƒƒƒˆƒƒƒƒƒƒƒƒˆƒƒƒƒƒƒƒƒˆƒƒƒƒƒƒƒƒ‰ ‚ ‚RowPctN ‚ 45.0‚ 15.5‚ 2.5‚ 1.6‚ 2.5‚ 33.0‚ ‡ƒƒƒƒƒƒƒƒˆƒƒƒƒƒƒƒƒƒˆƒƒƒƒƒƒƒƒˆƒƒƒƒƒƒƒƒˆƒƒƒƒƒƒƒƒˆƒƒƒƒƒƒƒƒˆƒƒƒƒƒƒƒƒˆƒƒƒƒƒƒƒƒ‰ ‚FIN ‚N ‚ 710‚ 145‚ 19‚ 17‚ 9‚ 313‚ ‚ ‡ƒƒƒƒƒƒƒƒƒˆƒƒƒƒƒƒƒƒˆƒƒƒƒƒƒƒƒˆƒƒƒƒƒƒƒƒˆƒƒƒƒƒƒƒƒˆƒƒƒƒƒƒƒƒˆƒƒƒƒƒƒƒƒ‰ ‚ ‚RowPctN ‚ 58.5‚ 12.0‚ 1.6‚ 1.4‚ 0.7‚ 25.8‚ ‡ƒƒƒƒƒƒƒƒˆƒƒƒƒƒƒƒƒƒˆƒƒƒƒƒƒƒƒˆƒƒƒƒƒƒƒƒˆƒƒƒƒƒƒƒƒˆƒƒƒƒƒƒƒƒˆƒƒƒƒƒƒƒƒˆƒƒƒƒƒƒƒƒ‰ ‚FRA ‚N ‚ 342‚ 68‚ 18‚ 13‚ 18‚ 199‚ ‚ ‡ƒƒƒƒƒƒƒƒƒˆƒƒƒƒƒƒƒƒˆƒƒƒƒƒƒƒƒˆƒƒƒƒƒƒƒƒˆƒƒƒƒƒƒƒƒˆƒƒƒƒƒƒƒƒˆƒƒƒƒƒƒƒƒ‰ ‚ ‚RowPctN ‚ 52.0‚ 10.3‚ 2.7‚ 2.0‚ 2.7‚ 30.2‚ ‡ƒƒƒƒƒƒƒƒˆƒƒƒƒƒƒƒƒƒˆƒƒƒƒƒƒƒƒˆƒƒƒƒƒƒƒƒˆƒƒƒƒƒƒƒƒˆƒƒƒƒƒƒƒƒˆƒƒƒƒƒƒƒƒˆƒƒƒƒƒƒƒƒ‰ ‚IRE ‚N ‚ 253‚ 52‚ 32‚ 14‚ 14‚ 145‚ ‚ ‡ƒƒƒƒƒƒƒƒƒˆƒƒƒƒƒƒƒƒˆƒƒƒƒƒƒƒƒˆƒƒƒƒƒƒƒƒˆƒƒƒƒƒƒƒƒˆƒƒƒƒƒƒƒƒˆƒƒƒƒƒƒƒƒ‰ ‚ ‚RowPctN ‚ 49.6‚ 10.2‚ 6.3‚ 2.7‚ 2.7‚ 28.4‚ ‡ƒƒƒƒƒƒƒƒˆƒƒƒƒƒƒƒƒƒˆƒƒƒƒƒƒƒƒˆƒƒƒƒƒƒƒƒˆƒƒƒƒƒƒƒƒˆƒƒƒƒƒƒƒƒˆƒƒƒƒƒƒƒƒˆƒƒƒƒƒƒƒƒ‰ ‚LUX ‚N ‚ 37‚ 6‚ .‚ 1‚ 2‚ 15‚ ‚ ‡ƒƒƒƒƒƒƒƒƒˆƒƒƒƒƒƒƒƒˆƒƒƒƒƒƒƒƒˆƒƒƒƒƒƒƒƒˆƒƒƒƒƒƒƒƒˆƒƒƒƒƒƒƒƒˆƒƒƒƒƒƒƒƒ‰ ‚ ‚RowPctN ‚ 60.7‚ 9.8‚ .‚ 1.6‚ 3.3‚ 24.6‚ ‡ƒƒƒƒƒƒƒƒˆƒƒƒƒƒƒƒƒƒˆƒƒƒƒƒƒƒƒˆƒƒƒƒƒƒƒƒˆƒƒƒƒƒƒƒƒˆƒƒƒƒƒƒƒƒˆƒƒƒƒƒƒƒƒˆƒƒƒƒƒƒƒƒ‰ ‚NET ‚N ‚ 503‚ 66‚ 10‚ 10‚ 16‚ 276‚ ‚ ‡ƒƒƒƒƒƒƒƒƒˆƒƒƒƒƒƒƒƒˆƒƒƒƒƒƒƒƒˆƒƒƒƒƒƒƒƒˆƒƒƒƒƒƒƒƒˆƒƒƒƒƒƒƒƒˆƒƒƒƒƒƒƒƒ‰ ‚ ‚RowPctN ‚ 57.1‚ 7.5‚ 1.1‚ 1.1‚ 1.8‚ 31.3‚ ‡ƒƒƒƒƒƒƒƒˆƒƒƒƒƒƒƒƒƒˆƒƒƒƒƒƒƒƒˆƒƒƒƒƒƒƒƒˆƒƒƒƒƒƒƒƒˆƒƒƒƒƒƒƒƒˆƒƒƒƒƒƒƒƒˆƒƒƒƒƒƒƒƒ‰ ‚POR ‚N ‚ 267‚ 62‚ 9‚ 3‚ 13‚ 104‚ ‚ ‡ƒƒƒƒƒƒƒƒƒˆƒƒƒƒƒƒƒƒˆƒƒƒƒƒƒƒƒˆƒƒƒƒƒƒƒƒˆƒƒƒƒƒƒƒƒˆƒƒƒƒƒƒƒƒˆƒƒƒƒƒƒƒƒ‰ ‚ ‚RowPctN ‚ 58.3‚ 13.5‚ 2.0‚ 0.7‚ 2.8‚ 22.7‚ ‡ƒƒƒƒƒƒƒƒˆƒƒƒƒƒƒƒƒƒˆƒƒƒƒƒƒƒƒˆƒƒƒƒƒƒƒƒˆƒƒƒƒƒƒƒƒˆƒƒƒƒƒƒƒƒˆƒƒƒƒƒƒƒƒˆƒƒƒƒƒƒƒƒ‰ ‚SWE ‚N ‚ 531‚ 182‚ 16‚ 8‚ 13‚ 481‚ ‚ ‡ƒƒƒƒƒƒƒƒƒˆƒƒƒƒƒƒƒƒˆƒƒƒƒƒƒƒƒˆƒƒƒƒƒƒƒƒˆƒƒƒƒƒƒƒƒˆƒƒƒƒƒƒƒƒˆƒƒƒƒƒƒƒƒ‰ ‚ ‚RowPctN ‚ 43.1‚ 14.8‚ 1.3‚ 0.6‚ 1.1‚ 39.1‚ ‡ƒƒƒƒƒƒƒƒˆƒƒƒƒƒƒƒƒƒˆƒƒƒƒƒƒƒƒˆƒƒƒƒƒƒƒƒˆƒƒƒƒƒƒƒƒˆƒƒƒƒƒƒƒƒˆƒƒƒƒƒƒƒƒˆƒƒƒƒƒƒƒƒ‰ ‚UNK ‚N ‚ 484‚ 94‚ 21‚ 7‚ 12‚ 157‚ ‚ ‡ƒƒƒƒƒƒƒƒƒˆƒƒƒƒƒƒƒƒˆƒƒƒƒƒƒƒƒˆƒƒƒƒƒƒƒƒˆƒƒƒƒƒƒƒƒˆƒƒƒƒƒƒƒƒˆƒƒƒƒƒƒƒƒ‰ ‚ ‚RowPctN ‚ 62.5‚ 12.1‚ 2.7‚ 0.9‚ 1.5‚ 20.3‚ ‡ƒƒƒƒƒƒƒƒˆƒƒƒƒƒƒƒƒƒˆƒƒƒƒƒƒƒƒˆƒƒƒƒƒƒƒƒˆƒƒƒƒƒƒƒƒˆƒƒƒƒƒƒƒƒˆƒƒƒƒƒƒƒƒˆƒƒƒƒƒƒƒƒ‰ ‚All ‚N ‚ 4122‚ 947‚ 166‚ 98‚ 145‚ 2304‚ ‚ ‡ƒƒƒƒƒƒƒƒƒˆƒƒƒƒƒƒƒƒˆƒƒƒƒƒƒƒƒˆƒƒƒƒƒƒƒƒˆƒƒƒƒƒƒƒƒˆƒƒƒƒƒƒƒƒˆƒƒƒƒƒƒƒƒ‰ ‚ ‚RowPctN ‚ 53.0‚ 12.2‚ 2.1‚ 1.3‚ 1.9‚ 29.6‚ Šƒƒƒƒƒƒƒƒ‹ƒƒƒƒƒƒƒƒƒ‹ƒƒƒƒƒƒƒƒ‹ƒƒƒƒƒƒƒƒ‹ƒƒƒƒƒƒƒƒ‹ƒƒƒƒƒƒƒƒ‹ƒƒƒƒƒƒƒƒ‹ƒƒƒƒƒƒƒƒŒ
EUR/01/5025372 page 9
The share of those who had stopped using tobacco was 34.9% in the survey sample.
Those who had stopped smoking were regarded as “real non-smokers” when no tobacco had been used for more than two years. (In quit-smoking studies a person is usually considered to have been successful after one year of abstinence.) (29).
In the present survey, most of those who had quit had done so more than two years previously. The prevalence of those who had quit less than one year previously was 9% in Ireland and 4.7% in France, while in the other countries it was between 1.6% and 3.6%.
3.4 Results of questions on tobacco consumption and intentions to stop smoking
Smokers used mainly manufactured cigarettes. Cigars, hand-rolled cigarettes, pipes and snuff were also used to varying degrees in some countries (questions 4.1–4.5). The use of tobacco products by country is presented in Appendix 5 and the use of manufactured cigarettes in Appendix 6.
In 11 of the 12 participating countries, over 50% of those who used manufactured cigarettes smoked more than 10 cigarettes per day. The prevalence of those users who smoked fewer than 5 cigarettes per day varied between 15% and 40%.
Some 52% of smokers said that they would like to stop smoking (question 5.1). There was wide variation, from 75% in Ireland to 30% in the Netherlands. The results by country are presented in Appendix 7.
Some 42% of all smokers had seriously tried to stop, the range being from 56% in Sweden and the United Kingdom to 21% in Luxembourg (question 5, Appendix 8). Of those who answered that they would like to stop smoking, 62.5% had also tried seriously to do so (Appendix 8, Table 8.2).
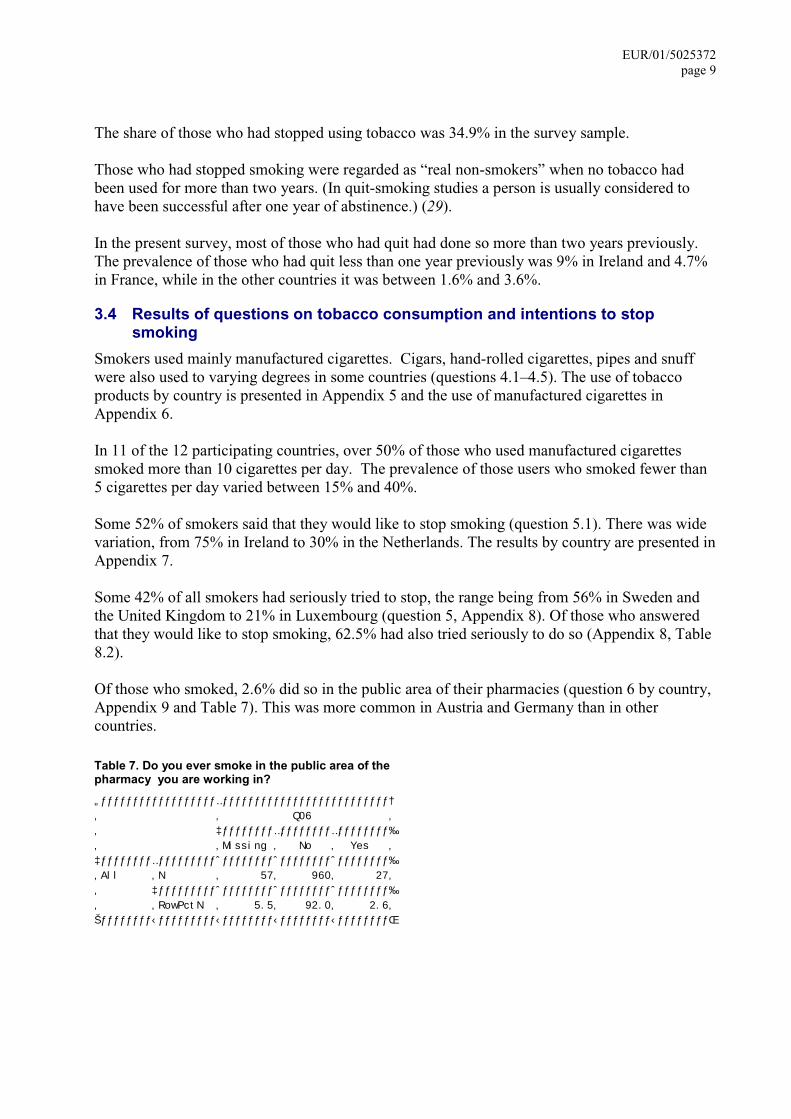
Of those who smoked, 2.6% did so in the public area of their pharmacies (question 6 by country, Appendix 9 and Table 7). This was more common in Austria and Germany than in other countries.
Table 7. Do you ever smoke in the public area of the pharmacy you are working in?
„ƒƒƒƒƒƒƒƒƒƒƒƒƒƒƒƒƒƒ…ƒƒƒƒƒƒƒƒƒƒƒƒƒƒƒƒƒƒƒƒƒƒƒƒƒƒ† ‚ ‚ Q06 ‚ ‚ ‡ƒƒƒƒƒƒƒƒ…ƒƒƒƒƒƒƒƒ…ƒƒƒƒƒƒƒƒ‰ ‚ ‚Missing ‚ No ‚ Yes ‚ ‡ƒƒƒƒƒƒƒƒ…ƒƒƒƒƒƒƒƒƒˆƒƒƒƒƒƒƒƒˆƒƒƒƒƒƒƒƒˆƒƒƒƒƒƒƒƒ‰ ‚All ‚N ‚ 57‚ 960‚ 27‚ ‚ ‡ƒƒƒƒƒƒƒƒƒˆƒƒƒƒƒƒƒƒˆƒƒƒƒƒƒƒƒˆƒƒƒƒƒƒƒƒ‰ ‚ ‚RowPctN ‚ 5.5‚ 92.0‚ 2.6‚ Šƒƒƒƒƒƒƒƒ‹ƒƒƒƒƒƒƒƒƒ‹ƒƒƒƒƒƒƒƒ‹ƒƒƒƒƒƒƒƒ‹ƒƒƒƒƒƒƒƒŒ
EUR/01/5025372 page 10
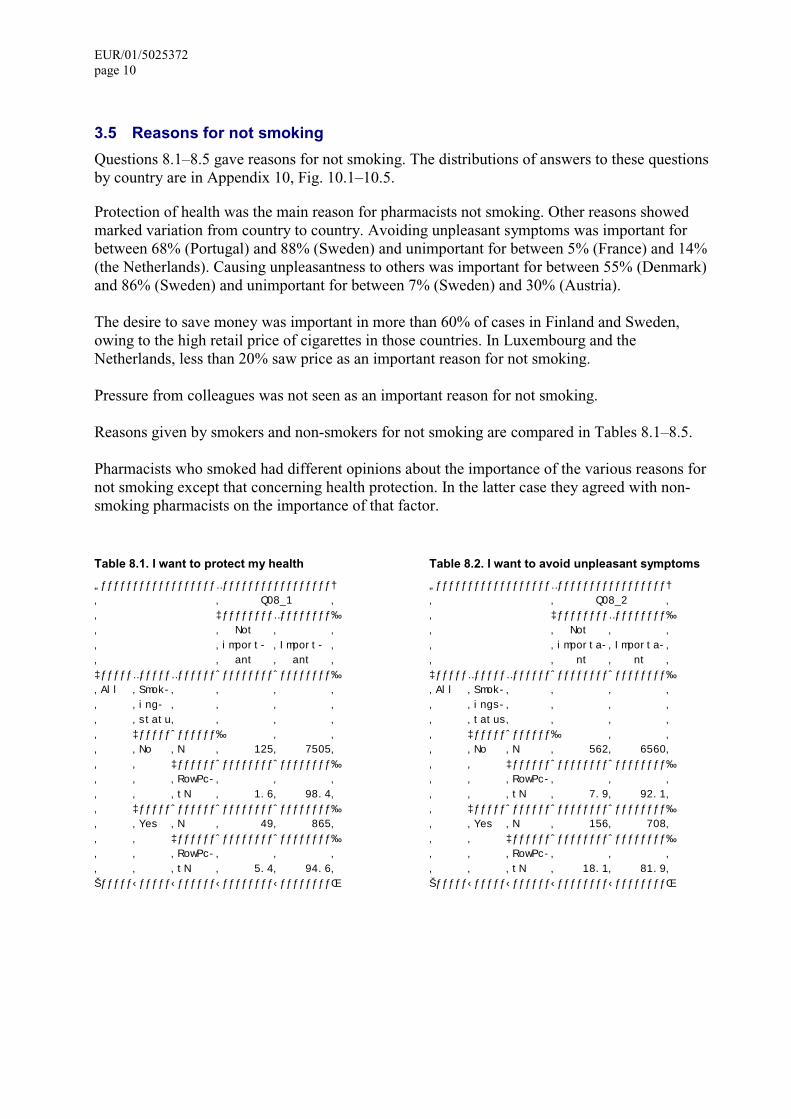
3.5 Reasons for not smoking
Questions 8.1–8.5 gave reasons for not smoking. The distributions of answers to these questions by country are in Appendix 10, Fig. 10.1–10.5.
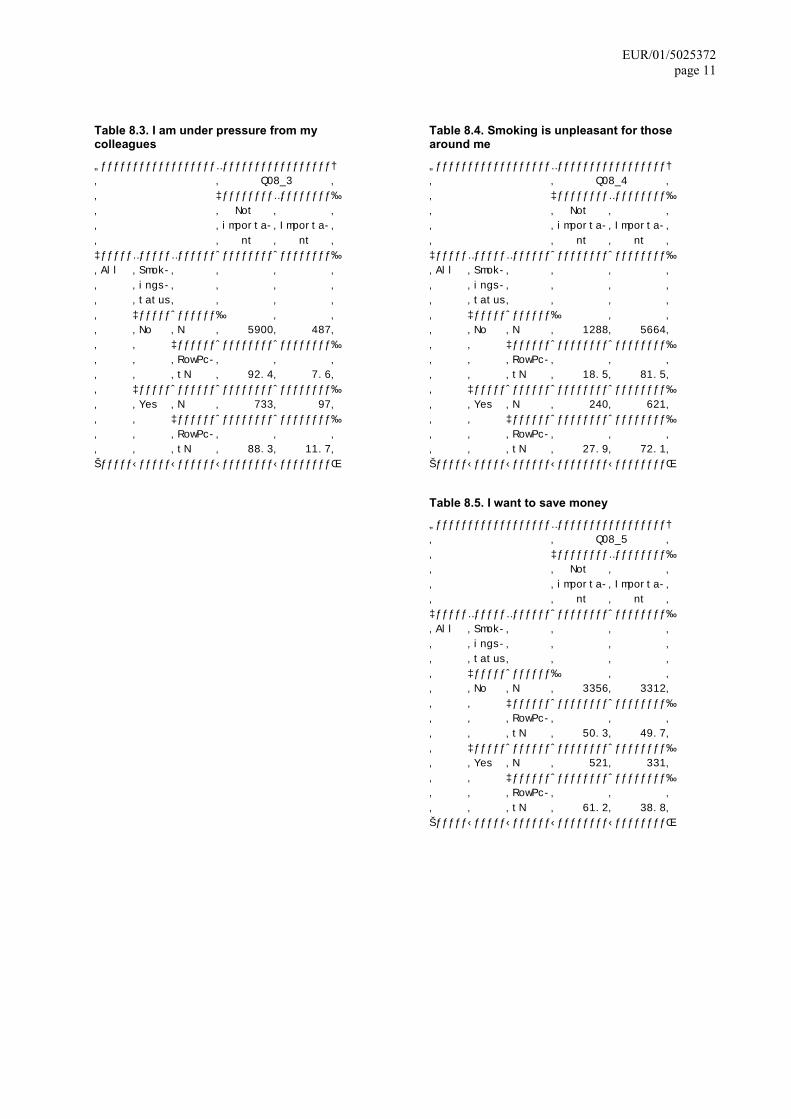
Protection of health was the main reason for pharmacists not smoking. Other reasons showed marked variation from country to country. Avoiding unpleasant symptoms was important for between 68% (Portugal) and 88% (Sweden) and unimportant for between 5% (France) and 14% (the Netherlands). Causing unpleasantness to others was important for between 55% (Denmark) and 86% (Sweden) and unimportant for between 7% (Sweden) and 30% (Austria).
The desire to save money was important in more than 60% of cases in Finland and Sweden, owing to the high retail price of cigarettes in those countries. In Luxembourg and the Netherlands, less than 20% saw price as an important reason for not smoking.
Pressure from colleagues was not seen as an important reason for not smoking.
Reasons given by smokers and non-smokers for not smoking are compared in Tables 8.1–8.5.
Pharmacists who smoked had different opinions about the importance of the various reasons for not smoking except that concerning health protection. In the latter case they agreed with non-smoking pharmacists on the importance of that factor.
Table 8.1. I want to protect my health
„ƒƒƒƒƒƒƒƒƒƒƒƒƒƒƒƒƒƒ…ƒƒƒƒƒƒƒƒƒƒƒƒƒƒƒƒƒ† ‚ ‚ Q08_1 ‚ ‚ ‡ƒƒƒƒƒƒƒƒ…ƒƒƒƒƒƒƒƒ‰ ‚ ‚ Not ‚ ‚ ‚ ‚import- ‚Import- ‚ ‚ ‚ ant ‚ ant ‚ ‡ƒƒƒƒƒ…ƒƒƒƒƒ…ƒƒƒƒƒƒˆƒƒƒƒƒƒƒƒˆƒƒƒƒƒƒƒƒ‰ ‚All ‚Smok-‚ ‚ ‚ ‚ ‚ ‚ing- ‚ ‚ ‚ ‚ ‚ ‚statu‚ ‚ ‚ ‚ ‚ ‡ƒƒƒƒƒˆƒƒƒƒƒƒ‰ ‚ ‚ ‚ ‚No ‚N ‚ 125‚ 7505‚ ‚ ‚ ‡ƒƒƒƒƒƒˆƒƒƒƒƒƒƒƒˆƒƒƒƒƒƒƒƒ‰ ‚ ‚ ‚RowPc-‚ ‚ ‚ ‚ ‚ ‚tN ‚ 1.6‚ 98.4‚ ‚ ‡ƒƒƒƒƒˆƒƒƒƒƒƒˆƒƒƒƒƒƒƒƒˆƒƒƒƒƒƒƒƒ‰ ‚ ‚Yes ‚N ‚ 49‚ 865‚ ‚ ‚ ‡ƒƒƒƒƒƒˆƒƒƒƒƒƒƒƒˆƒƒƒƒƒƒƒƒ‰ ‚ ‚ ‚RowPc-‚ ‚ ‚ ‚ ‚ ‚tN ‚ 5.4‚ 94.6‚ Šƒƒƒƒƒ‹ƒƒƒƒƒ‹ƒƒƒƒƒƒ‹ƒƒƒƒƒƒƒƒ‹ƒƒƒƒƒƒƒƒŒ
Table 8.2. I want to avoid unpleasant symptoms
„ƒƒƒƒƒƒƒƒƒƒƒƒƒƒƒƒƒƒ…ƒƒƒƒƒƒƒƒƒƒƒƒƒƒƒƒƒ† ‚ ‚ Q08_2 ‚ ‚ ‡ƒƒƒƒƒƒƒƒ…ƒƒƒƒƒƒƒƒ‰ ‚ ‚ Not ‚ ‚ ‚ ‚importa-‚Importa-‚ ‚ ‚ nt ‚ nt ‚ ‡ƒƒƒƒƒ…ƒƒƒƒƒ…ƒƒƒƒƒƒˆƒƒƒƒƒƒƒƒˆƒƒƒƒƒƒƒƒ‰ ‚All ‚Smok-‚ ‚ ‚ ‚ ‚ ‚ings-‚ ‚ ‚ ‚ ‚ ‚tatus‚ ‚ ‚ ‚ ‚ ‡ƒƒƒƒƒˆƒƒƒƒƒƒ‰ ‚ ‚ ‚ ‚No ‚N ‚ 562‚ 6560‚ ‚ ‚ ‡ƒƒƒƒƒƒˆƒƒƒƒƒƒƒƒˆƒƒƒƒƒƒƒƒ‰ ‚ ‚ ‚RowPc-‚ ‚ ‚ ‚ ‚ ‚tN ‚ 7.9‚ 92.1‚ ‚ ‡ƒƒƒƒƒˆƒƒƒƒƒƒˆƒƒƒƒƒƒƒƒˆƒƒƒƒƒƒƒƒ‰ ‚ ‚Yes ‚N ‚ 156‚ 708‚ ‚ ‚ ‡ƒƒƒƒƒƒˆƒƒƒƒƒƒƒƒˆƒƒƒƒƒƒƒƒ‰ ‚ ‚ ‚RowPc-‚ ‚ ‚ ‚ ‚ ‚tN ‚ 18.1‚ 81.9‚ Šƒƒƒƒƒ‹ƒƒƒƒƒ‹ƒƒƒƒƒƒ‹ƒƒƒƒƒƒƒƒ‹ƒƒƒƒƒƒƒƒŒ
EUR/01/5025372 page 11
Table 8.3. I am under pressure from my colleagues
„ƒƒƒƒƒƒƒƒƒƒƒƒƒƒƒƒƒƒ…ƒƒƒƒƒƒƒƒƒƒƒƒƒƒƒƒƒ† ‚ ‚ Q08_3 ‚ ‚ ‡ƒƒƒƒƒƒƒƒ…ƒƒƒƒƒƒƒƒ‰ ‚ ‚ Not ‚ ‚ ‚ ‚importa-‚Importa-‚ ‚ ‚ nt ‚ nt ‚ ‡ƒƒƒƒƒ…ƒƒƒƒƒ…ƒƒƒƒƒƒˆƒƒƒƒƒƒƒƒˆƒƒƒƒƒƒƒƒ‰ ‚All ‚Smok-‚ ‚ ‚ ‚ ‚ ‚ings-‚ ‚ ‚ ‚ ‚ ‚tatus‚ ‚ ‚ ‚ ‚ ‡ƒƒƒƒƒˆƒƒƒƒƒƒ‰ ‚ ‚ ‚ ‚No ‚N ‚ 5900‚ 487‚ ‚ ‚ ‡ƒƒƒƒƒƒˆƒƒƒƒƒƒƒƒˆƒƒƒƒƒƒƒƒ‰ ‚ ‚ ‚RowPc-‚ ‚ ‚ ‚ ‚ ‚tN ‚ 92.4‚ 7.6‚ ‚ ‡ƒƒƒƒƒˆƒƒƒƒƒƒˆƒƒƒƒƒƒƒƒˆƒƒƒƒƒƒƒƒ‰ ‚ ‚Yes ‚N ‚ 733‚ 97‚ ‚ ‚ ‡ƒƒƒƒƒƒˆƒƒƒƒƒƒƒƒˆƒƒƒƒƒƒƒƒ‰ ‚ ‚ ‚RowPc-‚ ‚ ‚ ‚ ‚ ‚tN ‚ 88.3‚ 11.7‚ Šƒƒƒƒƒ‹ƒƒƒƒƒ‹ƒƒƒƒƒƒ‹ƒƒƒƒƒƒƒƒ‹ƒƒƒƒƒƒƒƒŒ
Table 8.4. Smoking is unpleasant for those around me
„ƒƒƒƒƒƒƒƒƒƒƒƒƒƒƒƒƒƒ…ƒƒƒƒƒƒƒƒƒƒƒƒƒƒƒƒƒ† ‚ ‚ Q08_4 ‚ ‚ ‡ƒƒƒƒƒƒƒƒ…ƒƒƒƒƒƒƒƒ‰ ‚ ‚ Not ‚ ‚ ‚ ‚importa-‚Importa-‚ ‚ ‚ nt ‚ nt ‚ ‡ƒƒƒƒƒ…ƒƒƒƒƒ…ƒƒƒƒƒƒˆƒƒƒƒƒƒƒƒˆƒƒƒƒƒƒƒƒ‰ ‚All ‚Smok-‚ ‚ ‚ ‚ ‚ ‚ings-‚ ‚ ‚ ‚ ‚ ‚tatus‚ ‚ ‚ ‚ ‚ ‡ƒƒƒƒƒˆƒƒƒƒƒƒ‰ ‚ ‚ ‚ ‚No ‚N ‚ 1288‚ 5664‚ ‚ ‚ ‡ƒƒƒƒƒƒˆƒƒƒƒƒƒƒƒˆƒƒƒƒƒƒƒƒ‰ ‚ ‚ ‚RowPc-‚ ‚ ‚ ‚ ‚ ‚tN ‚ 18.5‚ 81.5‚ ‚ ‡ƒƒƒƒƒˆƒƒƒƒƒƒˆƒƒƒƒƒƒƒƒˆƒƒƒƒƒƒƒƒ‰ ‚ ‚Yes ‚N ‚ 240‚ 621‚ ‚ ‚ ‡ƒƒƒƒƒƒˆƒƒƒƒƒƒƒƒˆƒƒƒƒƒƒƒƒ‰ ‚ ‚ ‚RowPc-‚ ‚ ‚ ‚ ‚ ‚tN ‚ 27.9‚ 72.1‚ Šƒƒƒƒƒ‹ƒƒƒƒƒ‹ƒƒƒƒƒƒ‹ƒƒƒƒƒƒƒƒ‹ƒƒƒƒƒƒƒƒŒ
Table 8.5. I want to save money
„ƒƒƒƒƒƒƒƒƒƒƒƒƒƒƒƒƒƒ…ƒƒƒƒƒƒƒƒƒƒƒƒƒƒƒƒƒ† ‚ ‚ Q08_5 ‚ ‚ ‡ƒƒƒƒƒƒƒƒ…ƒƒƒƒƒƒƒƒ‰ ‚ ‚ Not ‚ ‚ ‚ ‚importa-‚Importa-‚ ‚ ‚ nt ‚ nt ‚ ‡ƒƒƒƒƒ…ƒƒƒƒƒ…ƒƒƒƒƒƒˆƒƒƒƒƒƒƒƒˆƒƒƒƒƒƒƒƒ‰ ‚All ‚Smok-‚ ‚ ‚ ‚ ‚ ‚ings-‚ ‚ ‚ ‚ ‚ ‚tatus‚ ‚ ‚ ‚ ‚ ‡ƒƒƒƒƒˆƒƒƒƒƒƒ‰ ‚ ‚ ‚ ‚No ‚N ‚ 3356‚ 3312‚ ‚ ‚ ‡ƒƒƒƒƒƒˆƒƒƒƒƒƒƒƒˆƒƒƒƒƒƒƒƒ‰ ‚ ‚ ‚RowPc-‚ ‚ ‚ ‚ ‚ ‚tN ‚ 50.3‚ 49.7‚ ‚ ‡ƒƒƒƒƒˆƒƒƒƒƒƒˆƒƒƒƒƒƒƒƒˆƒƒƒƒƒƒƒƒ‰ ‚ ‚Yes ‚N ‚ 521‚ 331‚ ‚ ‚ ‡ƒƒƒƒƒƒˆƒƒƒƒƒƒƒƒˆƒƒƒƒƒƒƒƒ‰ ‚ ‚ ‚RowPc-‚ ‚ ‚ ‚ ‚ ‚tN ‚ 61.2‚ 38.8‚ Šƒƒƒƒƒ‹ƒƒƒƒƒ‹ƒƒƒƒƒƒ‹ƒƒƒƒƒƒƒƒ‹ƒƒƒƒƒƒƒƒŒ
EUR/01/5025372 page 12
3.6 Smoking in pharmacies
It was found that smoking was seldom permitted in the public area of pharmacies (question 10, Appendix 11). In Finland, however, the question was not translated quite correctly and thus the results were not acceptable. According to tobacco legislation, smoking is not permitted in the public areas of Finnish and Swedish pharmacies.
3.7 Non-smoking activities of pharmacists
Questions 11–15 in the questionnaire covered information about the non-smoking activities of pharmacists. The results by country are presented in Appendix 12.
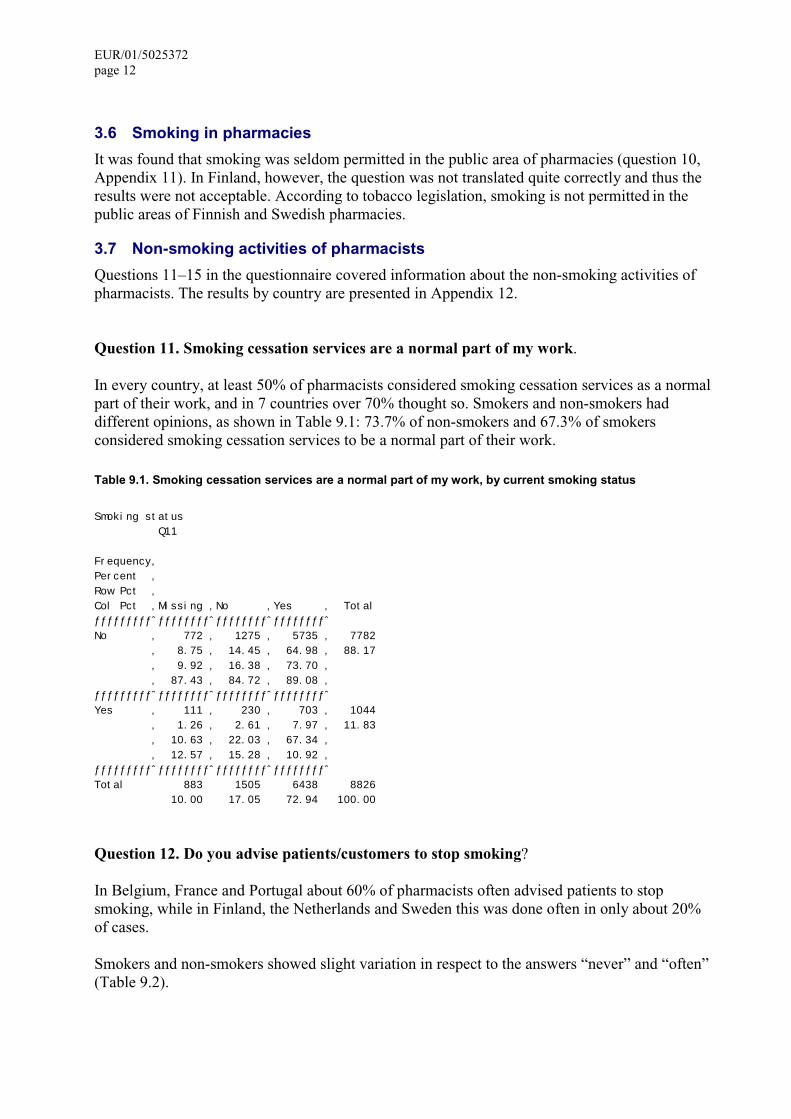
Question 11. Smoking cessation services are a normal part of my work.
In every country, at least 50% of pharmacists considered smoking cessation services as a normal part of their work, and in 7 countries over 70% thought so. Smokers and non-smokers had different opinions, as shown in Table 9.1: 73.7% of non-smokers and 67.3% of smokers considered smoking cessation services to be a normal part of their work.
Table 9.1. Smoking cessation services are a normal part of my work, by current smoking status
Smoking status Q11
Frequency‚Percent ‚ Row Pct ‚ Col Pct ‚Missing ‚No ‚Yes ‚ Total ƒƒƒƒƒƒƒƒƒˆƒƒƒƒƒƒƒƒˆƒƒƒƒƒƒƒƒˆƒƒƒƒƒƒƒƒˆ No ‚ 772 ‚ 1275 ‚ 5735 ‚ 7782 ‚ 8.75 ‚ 14.45 ‚ 64.98 ‚ 88.17 ‚ 9.92 ‚ 16.38 ‚ 73.70 ‚ ‚ 87.43 ‚ 84.72 ‚ 89.08 ‚ ƒƒƒƒƒƒƒƒƒˆƒƒƒƒƒƒƒƒˆƒƒƒƒƒƒƒƒˆƒƒƒƒƒƒƒƒˆ Yes ‚ 111 ‚ 230 ‚ 703 ‚ 1044 ‚ 1.26 ‚ 2.61 ‚ 7.97 ‚ 11.83 ‚ 10.63 ‚ 22.03 ‚ 67.34 ‚ ‚ 12.57 ‚ 15.28 ‚ 10.92 ‚ ƒƒƒƒƒƒƒƒƒˆƒƒƒƒƒƒƒƒˆƒƒƒƒƒƒƒƒˆƒƒƒƒƒƒƒƒˆ Total 883 1505 6438 8826 10.00 17.05 72.94 100.00
Question 12. Do you advise patients/customers to stop smoking?
In Belgium, France and Portugal about 60% of pharmacists often advised patients to stop smoking, while in Finland, the Netherlands and Sweden this was done often in only about 20% of cases.
Smokers and non-smokers showed slight variation in respect to the answers “never” and “often” (Table 9.2).

EUR/01/5025372 page 13
Table 9.2. Do you advise patients/customers to stop smoking, by current smoking status
Smoking status Q12
Frequency‚Percent ‚ Row Pct ‚ Col Pct ‚Missing ‚Never ‚Sometimes‚Often ‚ Total ‚ ‚ ‚or sel- ‚ ‚ ‚ ‚ ‚dom ‚ ‚ ƒƒƒƒƒƒƒƒƒˆƒƒƒƒƒƒƒƒˆƒƒƒƒƒƒƒƒˆƒƒƒƒƒƒƒƒˆƒƒƒƒƒƒƒƒˆ No ‚ 88 ‚ 331 ‚ 4505 ‚ 2858 ‚ 7782 ‚ 1.00 ‚ 3.75 ‚ 51.04 ‚ 32.38 ‚ 88.17 ‚ 1.13 ‚ 4.25 ‚ 57.89 ‚ 36.73 ‚ ‚ 87.13 ‚ 80.54 ‚ 88.21 ‚ 89.12 ‚ ƒƒƒƒƒƒƒƒƒˆƒƒƒƒƒƒƒƒˆƒƒƒƒƒƒƒƒˆƒƒƒƒƒƒƒƒˆƒƒƒƒƒƒƒƒˆ Yes ‚ 13 ‚ 80 ‚ 602 ‚ 349 ‚ 1044 ‚ 0.15 ‚ 0.91 ‚ 6.82 ‚ 3.95 ‚ 11.83 ‚ 1.25 ‚ 7.66 ‚ 57.66 ‚ 33.43 ‚ ‚ 12.87 ‚ 19.46 ‚ 11.79 ‚ 10.88 ‚ ƒƒƒƒƒƒƒƒƒˆƒƒƒƒƒƒƒƒˆƒƒƒƒƒƒƒƒˆƒƒƒƒƒƒƒƒˆƒƒƒƒƒƒƒƒˆ Total 101 411 5107 3207 8826 1.14 4.66 57.86 36.34 100.00
Question 13. Do you volunteer written information (e.g. leaflets) on smoking or smoking cessation to patients/customers who want to stop smoking?
Written information was widely used: over 80% of respondents in Austria, Belgium, Finland, France, Germany, Ireland, Luxembourg, Portugal, Sweden and the United Kingdom used it sometimes or often. The corresponding figures for Denmark and the Netherlands were >70% and >60%, respectively.
The same slight variation that occurred in question 12 between smokers and non-smokers in respect to the answers “never” and “often” also occurred here (Table 9.3).
Table 9.3. Do you volunteer written information on smoking or smoking cessation, by current smoking status
Smoking status Q13 Frequency‚Percent ‚ Row Pct ‚ Col Pct ‚Missing ‚Never ‚Sometim-‚Often ‚ Total ‚ ‚ ‚es or ‚ ‚ ‚ ‚ ‚seldom ‚ ‚ ƒƒƒƒƒƒƒƒƒˆƒƒƒƒƒƒƒƒˆƒƒƒƒƒƒƒƒˆƒƒƒƒƒƒƒƒˆƒƒƒƒƒƒƒƒˆ No ‚ 102 ‚ 815 ‚ 4491 ‚ 2374 ‚ 7782 ‚ 1.16 ‚ 9.23 ‚ 50.88 ‚ 26.90 ‚ 88.17 ‚ 1.31 ‚ 10.47 ‚ 57.71 ‚ 30.51 ‚ ‚ 85.71 ‚ 85.25 ‚ 88.25 ‚ 89.18 ‚ ƒƒƒƒƒƒƒƒƒˆƒƒƒƒƒƒƒƒˆƒƒƒƒƒƒƒƒˆƒƒƒƒƒƒƒƒˆƒƒƒƒƒƒƒƒˆ Yes ‚ 17 ‚ 141 ‚ 598 ‚ 288 ‚ 1044 ‚ 0.19 ‚ 1.60 ‚ 6.78 ‚ 3.26 ‚ 11.83 ‚ 1.63 ‚ 13.51 ‚ 57.28 ‚ 27.59 ‚ ‚ 14.29 ‚ 14.75 ‚ 11.75 ‚ 10.82 ‚ ƒƒƒƒƒƒƒƒƒˆƒƒƒƒƒƒƒƒˆƒƒƒƒƒƒƒƒˆƒƒƒƒƒƒƒƒˆƒƒƒƒƒƒƒƒˆ Total 119 956 5089 2662 8826 1.35 10.83 57.66 30.16 100.00
EUR/01/5025372 page 14
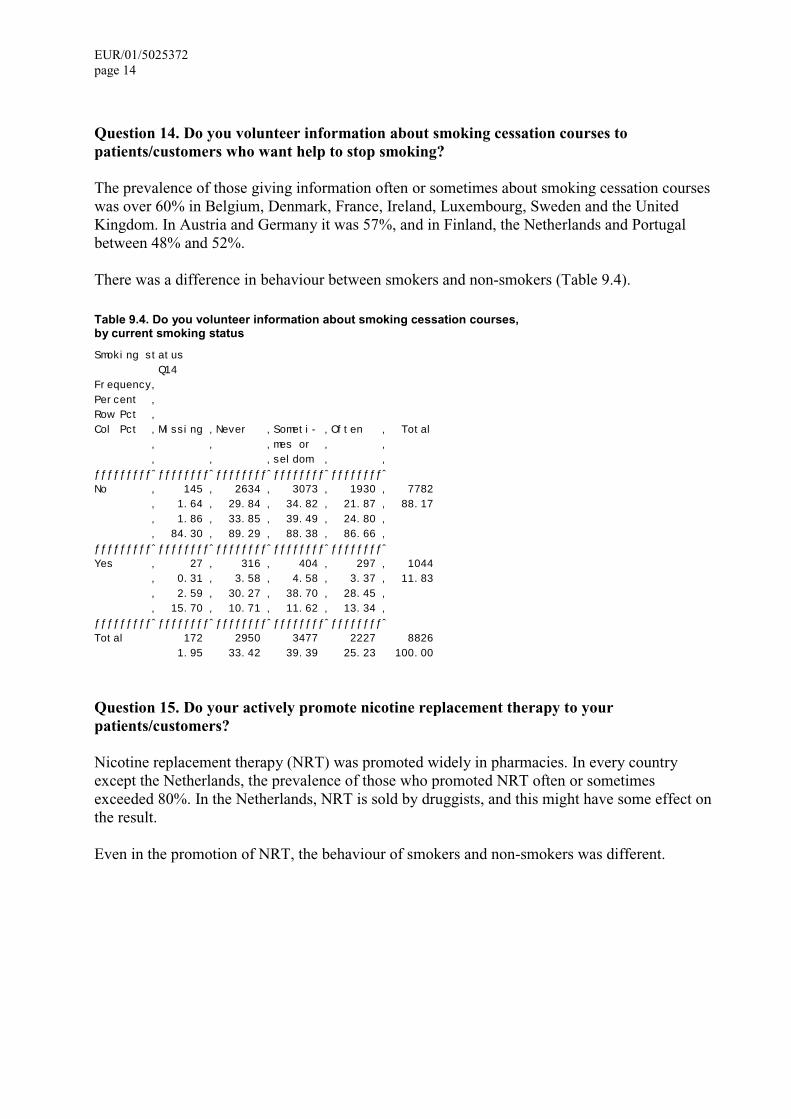
Question 14. Do you volunteer information about smoking cessation courses to patients/customers who want help to stop smoking?
The prevalence of those giving information often or sometimes about smoking cessation courses was over 60% in Belgium, Denmark, France, Ireland, Luxembourg, Sweden and the United Kingdom. In Austria and Germany it was 57%, and in Finland, the Netherlands and Portugal between 48% and 52%.
There was a difference in behaviour between smokers and non-smokers (Table 9.4).
Table 9.4. Do you volunteer information about smoking cessation courses, by current smoking status
Smoking status Q14 Frequency‚Percent ‚ Row Pct ‚ Col Pct ‚Missing ‚Never ‚Someti- ‚Often ‚ Total ‚ ‚ ‚mes or ‚ ‚ ‚ ‚ ‚seldom ‚ ‚ ƒƒƒƒƒƒƒƒƒˆƒƒƒƒƒƒƒƒˆƒƒƒƒƒƒƒƒˆƒƒƒƒƒƒƒƒˆƒƒƒƒƒƒƒƒˆ No ‚ 145 ‚ 2634 ‚ 3073 ‚ 1930 ‚ 7782 ‚ 1.64 ‚ 29.84 ‚ 34.82 ‚ 21.87 ‚ 88.17 ‚ 1.86 ‚ 33.85 ‚ 39.49 ‚ 24.80 ‚ ‚ 84.30 ‚ 89.29 ‚ 88.38 ‚ 86.66 ‚ ƒƒƒƒƒƒƒƒƒˆƒƒƒƒƒƒƒƒˆƒƒƒƒƒƒƒƒˆƒƒƒƒƒƒƒƒˆƒƒƒƒƒƒƒƒˆ Yes ‚ 27 ‚ 316 ‚ 404 ‚ 297 ‚ 1044 ‚ 0.31 ‚ 3.58 ‚ 4.58 ‚ 3.37 ‚ 11.83 ‚ 2.59 ‚ 30.27 ‚ 38.70 ‚ 28.45 ‚ ‚ 15.70 ‚ 10.71 ‚ 11.62 ‚ 13.34 ‚ ƒƒƒƒƒƒƒƒƒˆƒƒƒƒƒƒƒƒˆƒƒƒƒƒƒƒƒˆƒƒƒƒƒƒƒƒˆƒƒƒƒƒƒƒƒˆ Total 172 2950 3477 2227 8826 1.95 33.42 39.39 25.23 100.00
Question 15. Do your actively promote nicotine replacement therapy to your patients/customers?
Nicotine replacement therapy (NRT) was promoted widely in pharmacies. In every country except the Netherlands, the prevalence of those who promoted NRT often or sometimes exceeded 80%. In the Netherlands, NRT is sold by druggists, and this might have some effect on the result.
Even in the promotion of NRT, the behaviour of smokers and non-smokers was different.

EUR/01/5025372 page 15
Table 9.5. Do you actively promote nicotine replacement therapy, by current smoking status
Smoking status Q15
Frequency‚Percent ‚ Row Pct ‚ Col Pct ‚Missing ‚Never ‚Someti- ‚Often ‚ Total ‚ ‚ ‚mes or ‚ ‚ ‚ ‚ ‚seldom ‚ ‚ ƒƒƒƒƒƒƒƒƒˆƒƒƒƒƒƒƒƒˆƒƒƒƒƒƒƒƒˆƒƒƒƒƒƒƒƒˆƒƒƒƒƒƒƒƒˆ No ‚ 150 ‚ 717 ‚ 3840 ‚ 3075 ‚ 7782 ‚ 1.70 ‚ 8.12 ‚ 43.51 ‚ 34.84 ‚ 88.17 ‚ 1.93 ‚ 9.21 ‚ 49.34 ‚ 39.51 ‚ ‚ 83.33 ‚ 85.77 ‚ 88.81 ‚ 88.21 ‚ ƒƒƒƒƒƒƒƒƒˆƒƒƒƒƒƒƒƒˆƒƒƒƒƒƒƒƒˆƒƒƒƒƒƒƒƒˆƒƒƒƒƒƒƒƒˆ Yes ‚ 30 ‚ 119 ‚ 484 ‚ 411 ‚ 1044 ‚ 0.34 ‚ 1.35 ‚ 5.48 ‚ 4.66 ‚ 11.83 ‚ 2.87 ‚ 11.40 ‚ 46.36 ‚ 39.37 ‚ ‚ 16.67 ‚ 14.23 ‚ 11.19 ‚ 11.79 ‚ ƒƒƒƒƒƒƒƒƒˆƒƒƒƒƒƒƒƒˆƒƒƒƒƒƒƒƒˆƒƒƒƒƒƒƒƒˆƒƒƒƒƒƒƒƒˆ Total 180 836 4324 3486 8826 2.04 9.47 48.99 39.50 100.00
3.8 Attitudes of pharmacists
Statements 9.1–9.5 measured the attitudes of pharmacists on their knowledge of tobacco issues, their need for continuing and basic education, and their opinions on legislative action against smoking in their respective countries. The distribution of answers is presented in Appendix 13.
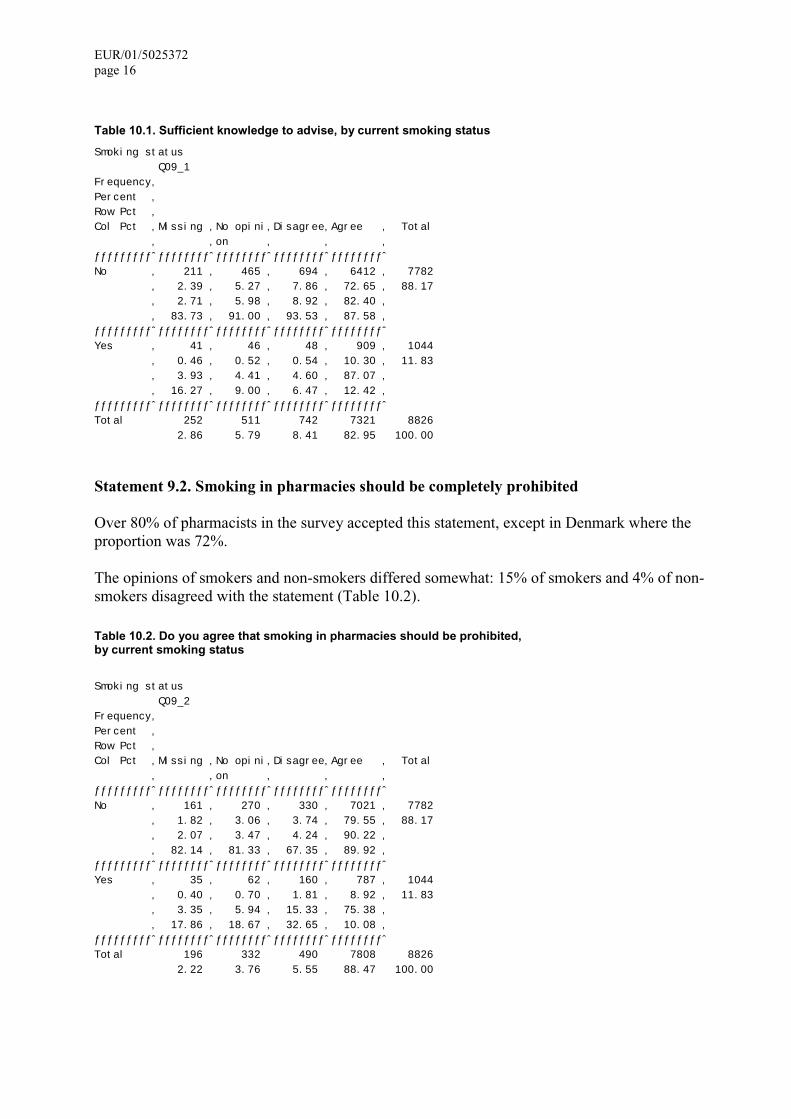
Statement 9.1. My current knowledge about smoking is sufficient to allow me to advise a patient/customer who wants to stop
Pharmacists were quite satisfied with their knowledge. In Austria, Denmark, Germany, Ireland and the United Kingdom, over 80% of respondents agreed with the statement, and in Belgium, France, Luxembourg and Netherlands about 80%. In Finland, Portugal and Sweden trust in one’s own knowledge was not so high.
On this question the opinions of smokers and non-smokers differed: 82% of non-smokers and 87% of smokers agreed with the statement, while 9% of non-smokers and 5% of smokers disagreed (Table 10.1).
EUR/01/5025372 page 16
Table 10.1. Sufficient knowledge to advise, by current smoking status
Smoking status Q09_1 Frequency‚Percent ‚ Row Pct ‚ Col Pct ‚Missing ‚No opini‚Disagree‚Agree ‚ Total ‚ ‚on ‚ ‚ ‚ ƒƒƒƒƒƒƒƒƒˆƒƒƒƒƒƒƒƒˆƒƒƒƒƒƒƒƒˆƒƒƒƒƒƒƒƒˆƒƒƒƒƒƒƒƒˆ No ‚ 211 ‚ 465 ‚ 694 ‚ 6412 ‚ 7782 ‚ 2.39 ‚ 5.27 ‚ 7.86 ‚ 72.65 ‚ 88.17 ‚ 2.71 ‚ 5.98 ‚ 8.92 ‚ 82.40 ‚ ‚ 83.73 ‚ 91.00 ‚ 93.53 ‚ 87.58 ‚ ƒƒƒƒƒƒƒƒƒˆƒƒƒƒƒƒƒƒˆƒƒƒƒƒƒƒƒˆƒƒƒƒƒƒƒƒˆƒƒƒƒƒƒƒƒˆ Yes ‚ 41 ‚ 46 ‚ 48 ‚ 909 ‚ 1044 ‚ 0.46 ‚ 0.52 ‚ 0.54 ‚ 10.30 ‚ 11.83 ‚ 3.93 ‚ 4.41 ‚ 4.60 ‚ 87.07 ‚ ‚ 16.27 ‚ 9.00 ‚ 6.47 ‚ 12.42 ‚ ƒƒƒƒƒƒƒƒƒˆƒƒƒƒƒƒƒƒˆƒƒƒƒƒƒƒƒˆƒƒƒƒƒƒƒƒˆƒƒƒƒƒƒƒƒˆ Total 252 511 742 7321 8826 2.86 5.79 8.41 82.95 100.00
Statement 9.2. Smoking in pharmacies should be completely prohibited
Over 80% of pharmacists in the survey accepted this statement, except in Denmark where the proportion was 72%.
The opinions of smokers and non-smokers differed somewhat: 15% of smokers and 4% of non-smokers disagreed with the statement (Table 10.2).
Table 10.2. Do you agree that smoking in pharmacies should be prohibited, by current smoking status
Smoking status Q09_2 Frequency‚Percent ‚ Row Pct ‚ Col Pct ‚Missing ‚No opini‚Disagree‚Agree ‚ Total ‚ ‚on ‚ ‚ ‚ ƒƒƒƒƒƒƒƒƒˆƒƒƒƒƒƒƒƒˆƒƒƒƒƒƒƒƒˆƒƒƒƒƒƒƒƒˆƒƒƒƒƒƒƒƒˆ No ‚ 161 ‚ 270 ‚ 330 ‚ 7021 ‚ 7782 ‚ 1.82 ‚ 3.06 ‚ 3.74 ‚ 79.55 ‚ 88.17 ‚ 2.07 ‚ 3.47 ‚ 4.24 ‚ 90.22 ‚ ‚ 82.14 ‚ 81.33 ‚ 67.35 ‚ 89.92 ‚ ƒƒƒƒƒƒƒƒƒˆƒƒƒƒƒƒƒƒˆƒƒƒƒƒƒƒƒˆƒƒƒƒƒƒƒƒˆƒƒƒƒƒƒƒƒˆ Yes ‚ 35 ‚ 62 ‚ 160 ‚ 787 ‚ 1044 ‚ 0.40 ‚ 0.70 ‚ 1.81 ‚ 8.92 ‚ 11.83 ‚ 3.35 ‚ 5.94 ‚ 15.33 ‚ 75.38 ‚ ‚ 17.86 ‚ 18.67 ‚ 32.65 ‚ 10.08 ‚ ƒƒƒƒƒƒƒƒƒˆƒƒƒƒƒƒƒƒˆƒƒƒƒƒƒƒƒˆƒƒƒƒƒƒƒƒˆƒƒƒƒƒƒƒƒˆ Total 196 332 490 7808 8826 2.22 3.76 5.55 88.47 100.00
EUR/01/5025372 page 17
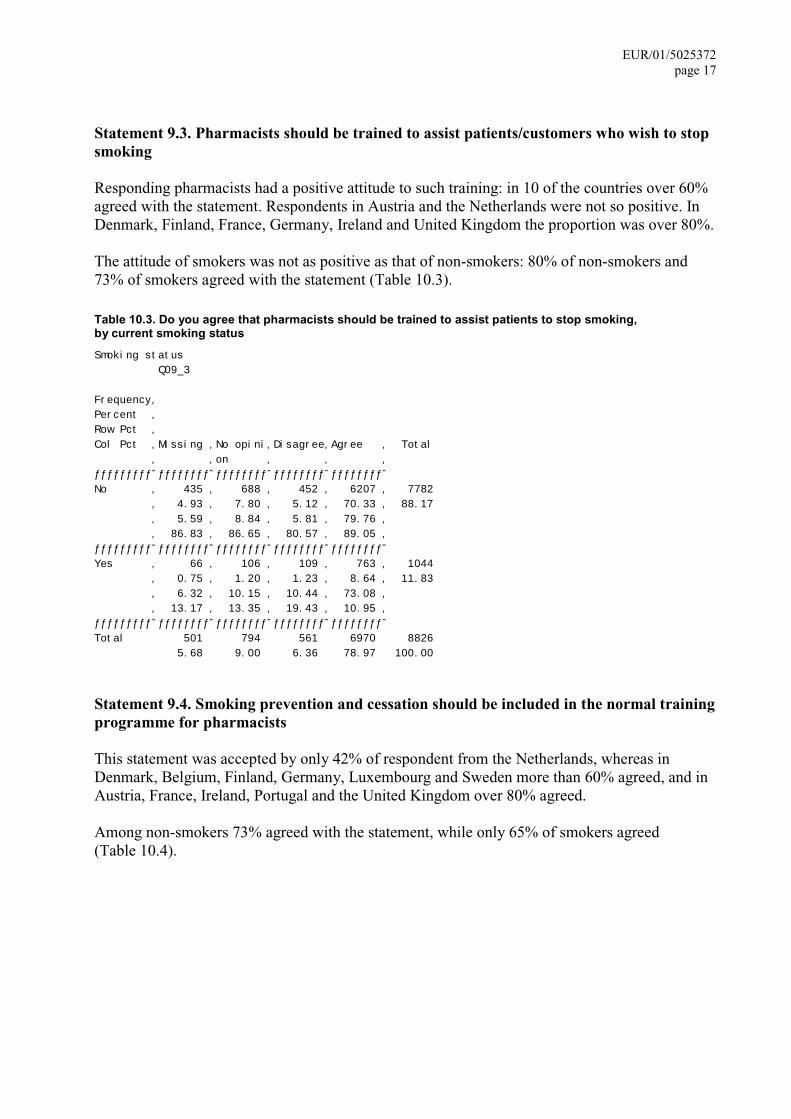
Statement 9.3. Pharmacists should be trained to assist patients/customers who wish to stop smoking
Responding pharmacists had a positive attitude to such training: in 10 of the countries over 60% agreed with the statement. Respondents in Austria and the Netherlands were not so positive. In Denmark, Finland, France, Germany, Ireland and United Kingdom the proportion was over 80%.
The attitude of smokers was not as positive as that of non-smokers: 80% of non-smokers and 73% of smokers agreed with the statement (Table 10.3).
Table 10.3. Do you agree that pharmacists should be trained to assist patients to stop smoking, by current smoking status
Smoking status Q09_3
Frequency‚Percent ‚ Row Pct ‚ Col Pct ‚Missing ‚No opini‚Disagree‚Agree ‚ Total ‚ ‚on ‚ ‚ ‚ ƒƒƒƒƒƒƒƒƒˆƒƒƒƒƒƒƒƒˆƒƒƒƒƒƒƒƒˆƒƒƒƒƒƒƒƒˆƒƒƒƒƒƒƒƒˆ No ‚ 435 ‚ 688 ‚ 452 ‚ 6207 ‚ 7782 ‚ 4.93 ‚ 7.80 ‚ 5.12 ‚ 70.33 ‚ 88.17 ‚ 5.59 ‚ 8.84 ‚ 5.81 ‚ 79.76 ‚ ‚ 86.83 ‚ 86.65 ‚ 80.57 ‚ 89.05 ‚ ƒƒƒƒƒƒƒƒƒˆƒƒƒƒƒƒƒƒˆƒƒƒƒƒƒƒƒˆƒƒƒƒƒƒƒƒˆƒƒƒƒƒƒƒƒˆ Yes ‚ 66 ‚ 106 ‚ 109 ‚ 763 ‚ 1044 ‚ 0.75 ‚ 1.20 ‚ 1.23 ‚ 8.64 ‚ 11.83 ‚ 6.32 ‚ 10.15 ‚ 10.44 ‚ 73.08 ‚ ‚ 13.17 ‚ 13.35 ‚ 19.43 ‚ 10.95 ‚ ƒƒƒƒƒƒƒƒƒˆƒƒƒƒƒƒƒƒˆƒƒƒƒƒƒƒƒˆƒƒƒƒƒƒƒƒˆƒƒƒƒƒƒƒƒˆ Total 501 794 561 6970 8826 5.68 9.00 6.36 78.97 100.00
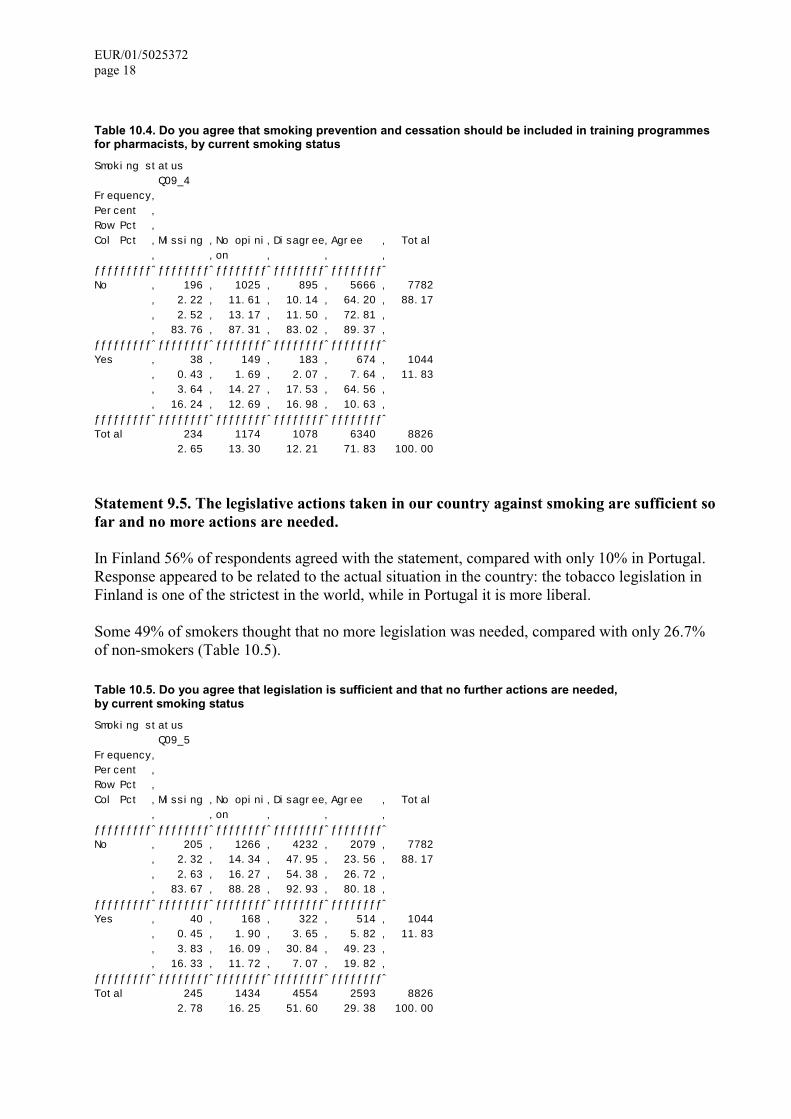
Statement 9.4. Smoking prevention and cessation should be included in the normal training programme for pharmacists
This statement was accepted by only 42% of respondent from the Netherlands, whereas in Denmark, Belgium, Finland, Germany, Luxembourg and Sweden more than 60% agreed, and in Austria, France, Ireland, Portugal and the United Kingdom over 80% agreed.
Among non-smokers 73% agreed with the statement, while only 65% of smokers agreed (Table 10.4).
EUR/01/5025372 page 18
Table 10.4. Do you agree that smoking prevention and cessation should be included in training programmes for pharmacists, by current smoking status
Smoking status Q09_4 Frequency‚Percent ‚ Row Pct ‚ Col Pct ‚Missing ‚No opini‚Disagree‚Agree ‚ Total ‚ ‚on ‚ ‚ ‚ ƒƒƒƒƒƒƒƒƒˆƒƒƒƒƒƒƒƒˆƒƒƒƒƒƒƒƒˆƒƒƒƒƒƒƒƒˆƒƒƒƒƒƒƒƒˆ No ‚ 196 ‚ 1025 ‚ 895 ‚ 5666 ‚ 7782 ‚ 2.22 ‚ 11.61 ‚ 10.14 ‚ 64.20 ‚ 88.17 ‚ 2.52 ‚ 13.17 ‚ 11.50 ‚ 72.81 ‚ ‚ 83.76 ‚ 87.31 ‚ 83.02 ‚ 89.37 ‚ ƒƒƒƒƒƒƒƒƒˆƒƒƒƒƒƒƒƒˆƒƒƒƒƒƒƒƒˆƒƒƒƒƒƒƒƒˆƒƒƒƒƒƒƒƒˆ Yes ‚ 38 ‚ 149 ‚ 183 ‚ 674 ‚ 1044 ‚ 0.43 ‚ 1.69 ‚ 2.07 ‚ 7.64 ‚ 11.83 ‚ 3.64 ‚ 14.27 ‚ 17.53 ‚ 64.56 ‚ ‚ 16.24 ‚ 12.69 ‚ 16.98 ‚ 10.63 ‚ ƒƒƒƒƒƒƒƒƒˆƒƒƒƒƒƒƒƒˆƒƒƒƒƒƒƒƒˆƒƒƒƒƒƒƒƒˆƒƒƒƒƒƒƒƒˆ Total 234 1174 1078 6340 8826 2.65 13.30 12.21 71.83 100.00
Statement 9.5. The legislative actions taken in our country against smoking are sufficient so far and no more actions are needed.
In Finland 56% of respondents agreed with the statement, compared with only 10% in Portugal. Response appeared to be related to the actual situation in the country: the tobacco legislation in Finland is one of the strictest in the world, while in Portugal it is more liberal.
Some 49% of smokers thought that no more legislation was needed, compared with only 26.7% of non-smokers (Table 10.5).
Table 10.5. Do you agree that legislation is sufficient and that no further actions are needed, by current smoking status
Smoking status Q09_5 Frequency‚Percent ‚ Row Pct ‚ Col Pct ‚Missing ‚No opini‚Disagree‚Agree ‚ Total ‚ ‚on ‚ ‚ ‚ ƒƒƒƒƒƒƒƒƒˆƒƒƒƒƒƒƒƒˆƒƒƒƒƒƒƒƒˆƒƒƒƒƒƒƒƒˆƒƒƒƒƒƒƒƒˆ No ‚ 205 ‚ 1266 ‚ 4232 ‚ 2079 ‚ 7782 ‚ 2.32 ‚ 14.34 ‚ 47.95 ‚ 23.56 ‚ 88.17 ‚ 2.63 ‚ 16.27 ‚ 54.38 ‚ 26.72 ‚ ‚ 83.67 ‚ 88.28 ‚ 92.93 ‚ 80.18 ‚ ƒƒƒƒƒƒƒƒƒˆƒƒƒƒƒƒƒƒˆƒƒƒƒƒƒƒƒˆƒƒƒƒƒƒƒƒˆƒƒƒƒƒƒƒƒˆ Yes ‚ 40 ‚ 168 ‚ 322 ‚ 514 ‚ 1044 ‚ 0.45 ‚ 1.90 ‚ 3.65 ‚ 5.82 ‚ 11.83 ‚ 3.83 ‚ 16.09 ‚ 30.84 ‚ 49.23 ‚ ‚ 16.33 ‚ 11.72 ‚ 7.07 ‚ 19.82 ‚ ƒƒƒƒƒƒƒƒƒˆƒƒƒƒƒƒƒƒˆƒƒƒƒƒƒƒƒˆƒƒƒƒƒƒƒƒˆƒƒƒƒƒƒƒƒˆ Total 245 1434 4554 2593 8826 2.78 16.25 51.60 29.38 100.00
EUR/01/5025372 page 19
4. Analysis
4.1 Validity of data
The response rate was 35.5%, varying from 23% in Germany to 75.3% in Finland. Owing to the low response rate in Germany, these results should be regarded as tentative. In Luxembourg the response rate was almost 50% but there was nevertheless a low number of responses owing to the small number of pharmacies in the country.
Age distribution was similarly in the sample and in target groups in those countries that were able to provide such information.
The proportion of men among the respondents was larger than that in the target group, especially in Portugal where men were over-represented. Since women usually smoke less than men, this bias could influence the results to suggest that the proportion of non-smokers in the sample was smaller than that in the target population.
4.2 Tobacco use among community pharmacists
In this survey, pharmacists smoked less than the general population of the country in question. Under-reporting in smoking studies is a problem, but that effect was a factor both in the present survey and in studies the results were compared with. Smoking prevalence among pharmacists was only 11.8%, varying from 6.5% (women in Finland) to 24% (men in Austria). This provides a good foundation for non-smoking work in community pharmacies.
According to the summary report of the 1992 surveys in six European countries (Austria, Denmark, Italy, Malta, Portugal and Spain) (30), the proportion of smokers among pharmacists was 22%. Any comparison must be seen as tentative, however, because in the 1992 study the final report was based on national reports and not on the raw data.
The proportion of pharmacists who did not smoke was the same as that among health care professionals (dentists and physicians) in the respective countries. Here a more intensive analysis should be carried out on a national basis, because the results from national surveys on the smoking habits of health care professionals have usually not been published internationally and have thus not been available for analysis in this report. Moreover, those results that have been published tend not to use a consistent and therefore comparable terminology in defining, for example, tobacco consumption, smoking, smoker and non-smoker.
The proportion of pharmacists who had quit smoking was 35%. This increased as pharmacists became more aware of the health hazards of tobacco use. These results are in line with the results of the 1992 survey mentioned above.
Half of the smokers in the survey reported that they would like to stop smoking, and 63% said they have tried to do so. This proportion is smaller than that reported in other surveys concerning smokers in general, where the willingness to quit is about two thirds (31). Because the proportion of current smokers among pharmacists was low in this study, we can assume that those still smoking regularly were more ingrained smokers than smokers in general. In testing willingness to stop among smokers and non-smokers with the �2 test, the difference was statistically significant (P < 0.001, design-based test).
EUR/01/5025372 page 20
It would be interesting to study at what age pharmacists begin smoking and when they quit. In many European countries young people do smoke more than adults, and the process of change begins later in adulthood. This might also be the case with health care professionals.
In Ireland pharmacists are relatively young (as is the population in general). In the Irish data the proportions of those who had recently quit and who were willing to quit were much higher than in other countries, which gives support to the change process described above.
Of those pharmacists who smoked cigarettes, 10% smoked only 1–2 cigarettes per day or even fewer. In this study all occasional smokers were those in this group or for whom no information was available (Appendix 5, Table 5.2) where the proportion was 7%. This was about the same proportion as reported for Finnish medical doctors.
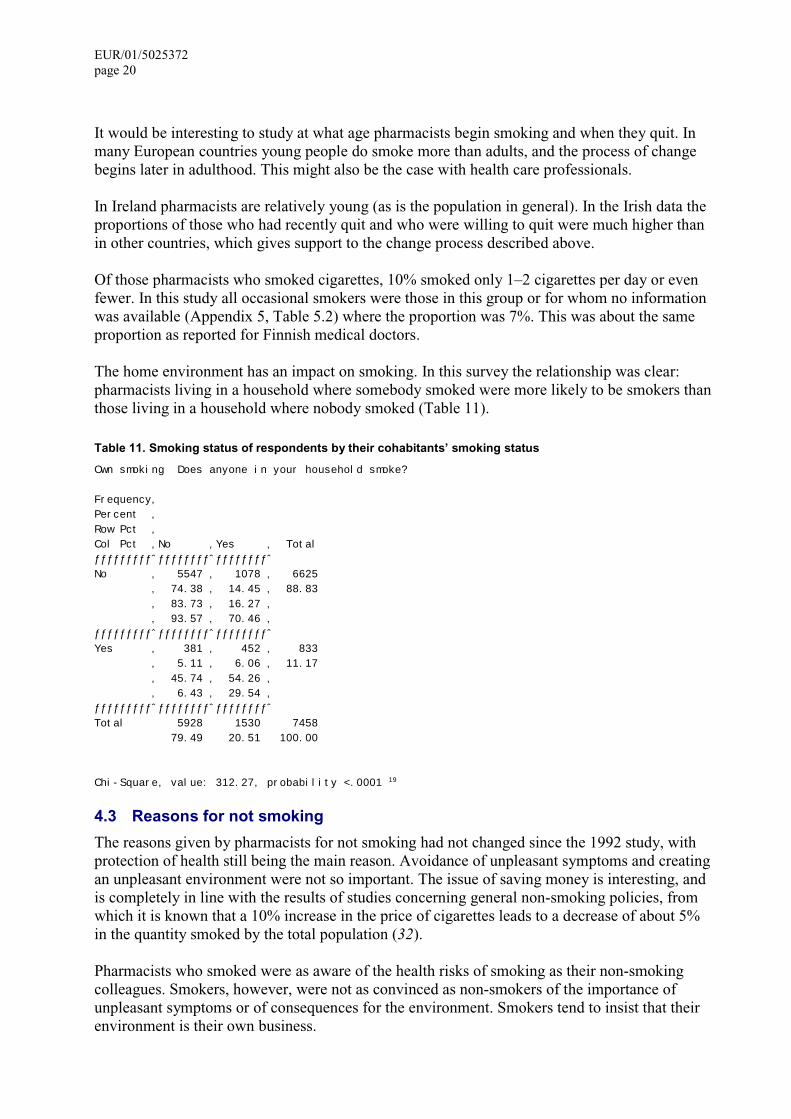
The home environment has an impact on smoking. In this survey the relationship was clear: pharmacists living in a household where somebody smoked were more likely to be smokers than those living in a household where nobody smoked (Table 11).
Table 11. Smoking status of respondents by their cohabitants’ smoking status
Own smoking Does anyone in your household smoke?
Frequency‚Percent ‚ Row Pct ‚ Col Pct ‚No ‚Yes ‚ Total ƒƒƒƒƒƒƒƒƒˆƒƒƒƒƒƒƒƒˆƒƒƒƒƒƒƒƒˆ No ‚ 5547 ‚ 1078 ‚ 6625 ‚ 74.38 ‚ 14.45 ‚ 88.83 ‚ 83.73 ‚ 16.27 ‚ ‚ 93.57 ‚ 70.46 ‚ ƒƒƒƒƒƒƒƒƒˆƒƒƒƒƒƒƒƒˆƒƒƒƒƒƒƒƒˆ Yes ‚ 381 ‚ 452 ‚ 833 ‚ 5.11 ‚ 6.06 ‚ 11.17 ‚ 45.74 ‚ 54.26 ‚ ‚ 6.43 ‚ 29.54 ‚ ƒƒƒƒƒƒƒƒƒˆƒƒƒƒƒƒƒƒˆƒƒƒƒƒƒƒƒˆ Total 5928 1530 7458 79.49 20.51 100.00
Chi-Square, value: 312.27, probability <.0001 19
4.3 Reasons for not smoking
The reasons given by pharmacists for not smoking had not changed since the 1992 study, with protection of health still being the main reason. Avoidance of unpleasant symptoms and creating an unpleasant environment were not so important. The issue of saving money is interesting, and is completely in line with the results of studies concerning general non-smoking policies, from which it is known that a 10% increase in the price of cigarettes leads to a decrease of about 5% in the quantity smoked by the total population (32).
Pharmacists who smoked were as aware of the health risks of smoking as their non-smoking colleagues. Smokers, however, were not as convinced as non-smokers of the importance of unpleasant symptoms or of consequences for the environment. Smokers tend to insist that their environment is their own business.
EUR/01/5025372 page 21
As expected, smokers felt more pressure from their colleagues than those who did not smoke. In the same way, smokers did not see economic reasons for not smoking as important as those who were non-smokers.
4.4 Non-smoking activities
Smoking cessation services had became a part of everyday work for the majority (73%) of community pharmacists, although there were still countries (Denmark, Germany, Luxembourg, the Netherlands and Portugal) where almost 40% of respondents did not see these services as a normal part of their work or did not answer the question. Non-smoking work has been the subject of much discussion in Denmark, Germany and Portugal, and especially in Denmark community pharmacists have been pioneers in this field. These results should be taken into consideration in studies into what might be the reason for these findings in different countries.
More education and suitable materials for pharmacy use should be provided by national organizations. It has been shown that continuing education has a positive impact on willingness and ability to organize services and get better results (33–37).
The results concerning advice to stop smoking given in pharmacies in different countries are interesting, and can be seen as cultural differences in community pharmacy tradition. In Finland, we know from other studies that pharmacists do not usually ask customers about health behaviour, which can be seen as a private matter, but do advise patients when they themselves have taken the behavioural decision (38). Information and health education activities are only gradually becoming more proactive. The tradition in pharmacies in southern Europe differs from that in northern Europe, as can also be seen from the results. In Belgium, France and Portugal, the proportion of cases in which clients were often advised to stop smoking was 60%. It is interesting that in Portugal respondents did not offer much in the way of smoking cessation services but they advised patients to stop smoking.
An article by Goldstein et al. (39), on the smoking cessation counselling practices of physicians, showed that in interventions based on the National Cancer Institute 4-A model (40) and on the Transtheoretical Model of Change (41) the criteria for “thorough” counselling were met by only 27% of physicians. The majority reported that they Ask (67%) and Advise (74%) their patients about smoking, while few went beyond to Assist (35%) or Arrange follow-up (8%) with patients who smoke.
Based on these results, we could develop a model for the treatment of nicotine dependence whereby the responsibility to ask and advise would be that of physicians and nurses working in primary and secondary health care, and the responsibility to assist and arrange follow-up would be the task of community pharmacists. The follow-up could be quite easily organized when people came to buy their nicotine replacement therapy.
Written information is widely used in pharmacies. Thus it is important that suitable material is available. If possible, the material should be such that it could be individualized or that it could be different for persons at different stages of the change process (42,43).
Information on smoking cessation courses was not offered as widely as written information on smoking cessation, probably because there were not so many courses available. The pharmacy programmes have consisted of smoking cessation courses organized by pharmacists and of the
EUR/01/5025372 page 22
individual cessation programmes. It seems that individual counselling is easier to implement in pharmacy practice than are courses.
In France, a large quit-smoking campaign started in community pharmacies at the beginning of 2001. The campaign consisted of continuing education for pharmacists, materials suitable for use in pharmacies and in window displays, a national TV spot and other press information. This campaign could have had an effect on the French results in this survey, in that community pharmacists were more active in organizing smoking cessation groups. Information on smoking cessation courses in France was twice that in other countries.
NRT is actively promoted in community pharmacies because it is available without a prescription in most European countries. For this reason, product information from the manufacturer is sent to pharmacists rather than physicians. Thus the responsibility for providing information on the correct use of such products has shifted to pharmacists.
The wider availability of these products has been discussed in the WHO Partnership Project. It has been suggested that because cigarettes are available without any restriction NRT should be similarly available. The problem is that if NRT were to be sold completely outside the health care system the information needed to guarantee its success with therapy would be missing. The interest of pharmacists in promoting NRT depends on their ability to sell it and have the necessary knowledge of the products. Such problems with general sales were seen in the results from the Netherlands in this study.
4.5 The attitudes of pharmacists
In this study, pharmacists trusted their knowledge on smoking cessation. Nevertheless, they recognized that both basic and continuing education are needed on these issues. There were differences between countries and between smokers and non-smokers, but the overall attitude towards education was positive. This is a good sign, because it is known from other studies that trained health professionals obtain better results in non-smoking work and are better motivated.
Predictably, smokers and non-smokers differ in their opinions, which supports the hypothesis that health care providers who do not smoke make better advocates for non-smoking. Smokers do not see so much reason to change tobacco legislation or to prohibit smoking in pharmacies, and they are not so positive towards continuing and basic education on non-smoking issues.
EUR/01/5025372 page 23
5. Conclusions
Based on the results of the survey, we can say that the situation for non-smoking work in European community pharmacies is favourable.
�� Community pharmacists are less frequently smokers than the general population of the country in question.
�� Pharmacists know the health risks of tobacco use and are aware of the risks of passive smoking.
�� Smoking is not normally allowed in pharmacies.
�� Community pharmacists have a positive attitude towards non-smoking work and, although more education is required, their knowledge on smoking issues allows them to carry out these activities effectively.
�� Non-smoking activities differ in European countries. For southern European countries it is more natural to discuss the smoking situation of a client who is at the pre-contemplation stage, while in northern Europe advice is more often given when the client is contemplating quitting or has decided to quit.
As seen from the results, pharmacists who smoke are usually not so active in their non-smoking activities and their attitudes are more negative. Thus they are not such good advocates for non-smoking. It is important that those pharmacists who still smoke are able to get more information on the hazards of smoking and support in their efforts to stop. Here the national partner organizations clearly have a role.
There is a need for further training of pharmacists on tobacco issues, and this subject should be included in their basic education as well. Good models already exist for both continuing education (44) and for basic education (45) and, based on the present results, knowledge of these models should be disseminated throughout Europe.
NRT is widely promoted in community pharmacies. As these products are in most cases sold without prescription, it is of the utmost importance that pharmacists can support clients wanting to stop with the help of NRT. According to the present results the situation seems to be quite good, but more knowledge and written information are needed.
The work done in pharmacies is not well documented and is usually not well known among other health care providers. The results of this survey can be used in drafting national guidelines on smoking cessation or legislative action.
To work in an effective way, the health care team needs common goals and common ways of working. Non-smoking work is one area where results might improve if cooperation among all actors could be better organized. Based on the results of the survey as well as those from studies among physicians and nurses, it is possible to consider a model whereby the 5 As: Ask, Advise,Assess, Assist and Arrange were divided among health care providers. In this model, asking should be done when the patient visits a physician or a public health nurse. Smoking status should be discussed and the status of change analysed, and suitable advice should be given. In this system the tasks for the pharmacy should be to provide general advice and advice on the
EUR/01/5025372 page 24
proper use of nicotine replacement therapy or other medicinal therapies, and to arrange support in the form of short check-ups at the pharmacy for those trying to stop smoking.
General information about the health hazards of smoking and about the positive effects of quitting could be provided by pharmacies in window displays. This kind of information is needed for “pre-contemplators”.
The project team established for this survey will continue its work in various task forces informing on and documenting pharmacists’ activities, and providing models for non-smoking work and for education. National pharmaceutical associations have an important role in implementing the models for community pharmacies, to encourage their members to continue their non-smoking activities and to support them in quitting smoking.

EUR/01/5025372 page 25
References
1. KRAJIC, K. ET AL. Health promotion in primary health care: general practice and community pharmacy; a European project. Vienna, Remaprint, 2001.
2. VAN MIL, J.W.F. Pharmaceutical care, the future of pharmacy. Theory, research and practice (dissertation). Groningen, De Volharding, 1999.
3. MÖLLER, L. Pharmacists helping smokers to quit: the role of the pharmacist in smoking cessation. International journal of smoking cessation, 3: 15–17 (1994).
4. MCCREEDY, C. Pharmacists action on smoking. Pharmaceutical journal, 254: 256 (1995). 5. MORGALL, J.M. Pharmacists helping smokers to quit: evaluation report. Copenhagen, WHO
Regional Office for Europe, 1997 (document EUR/ICP/LVGN030304). 6. GILLESPIE, B. Manchester pharmacy smoking cessation project. Final report. Manchester,
Mancunian Community Health NHS Trust, 1996. 7. ISACSSON, D. ET AL. Quit smoking at the pharmacy – an evaluation of a smoking cessation
programme in Sweden. Journal of social and administrative pharmacy, 15: 164–173 (1998). 8. PIETILÄ, K. Apteekki apuna tupakoinnin lopettamisessa [The pharmacy helps in quitting]. Suomen
apteekkarilehti, 3: 6–7 (1998). 9. GSCHWEND, P. ET AL. Raucherentvöhnung in Apotheken – Evaluation der
Rauchentvöhnungskampagne “Tabak Abieu” der Apotheker/-innen bei der Basel. Sozial- und Präventivmedizin, 44: 14–21 (1999).
10. WICK, M. ET AL. Evaluation der Kampagne “Kunstige Nichtraucher” des Schweizerischen Apothekerverbands. Sozial- und Präventivmedizin, 45: 73–84 (2000).
11. WILLIAMS, D.M. ET AL. An evaluation of smoking cessation-related activities by pharmacists. Journal of the American Pharmaceutical Association, 40: 366–370 (2000).
12. VITALE, F. Professional intervention for smoking cessation: the contribution of the pharmacists. European journal of public health, 10(3): Suppl. (2000).
13. CREALEY, G.P. ET AL. Costs and effects associated with a community pharmacy-based smoking cessation programme. Pharmacoeconomics, 14: 323–330 (1998).
14. MAGUIRE, T.A. ET AL. A randomised controlled trial of a smoking cessation intervention based in community pharmacies. Addiction, 96: 325–331 (2001).
15. SMITH, M.D. ET AL. Pharmacists counseling and outcomes in smoking cessation. American pharmacy, NS35(8): 20–29, 32 (1995).
16. MCGHAN, W.F. & SMITH, M.D. Pharmacoeconomic analysis of smoking-cessation interventions. American journal of health-system pharmacy, 53(1): 45–52 (1996).
17. International guide: pharmacies and smoking cessation. Copenhagen, WHO Regional Office for Europe, 1993 (document EUR/ICP/DSE 167).
18. Pharmacists and action on tobacco. Copenhagen, WHO Regional Office for Europe and EuroPharm Forum, 1998 (Smoke-free Europe 12; document EUR/ICP/LVNG 02 07 12).
19. Pharmacists, can you do more to help smokers to stop? London, Pharmacy HealthCare Scheme, Health Promotion England, 1999.
20. WHO EUROPEAN PARTNERSHIP PROJECT TO REDUCE TOBACCO DEPENDENCE. WHO evidence-based recommendations on the treatment of tobacco dependence. Copenhagen, WHO Regional Office for Europe, 2001.
21. LANCASTER, T. ET AL. Effectiveness of interventions to help people stop smoking: findings from the Cochrane Library. BMJ, 321: 355–358 (2000).
22. DOLL, R. Foreword. In: Simpson, D. Doctors and tobacco: medicine’s big challenge. London, Tobacco Control Resource Centre at the British Medical Association, 2000.
23. Guidelines for controlling and monitoring the tobacco epidemic. Geneva, World Health Organization, 1998.
24. VILAIN, C. The evaluation and monitoring of public action on tobacco. Copenhagen, WHO Regional Office for Europe, 1988 (Smoke-free Europe 3).
25. Database of the Pharmaceutical Group of the European Union(http://www.pgeu.org/fr/00.826F%20Pharamcovigilance%20EXTERNAL%20USE%20open%20part.pdf).
EUR/01/5025372 page 26
26. National tobacco information online system (NATIONS). World Health Organization, American Cancer Society, World Bank and Center for Disease Control and Prevention (http://apps.nccd.cdc.gov/nations) (accessed 24 November 2001).
27. WHO European Partnership Project to Reduce Tobacco Dependence. The economic consequences of smoking (ECOS) database. Copenhagen, WHO Regional Office for Europe (http://www.who.dk/adt/tobacco/tobacco.htm) (accessed 22 November 2001)
28. MYLLYKANGAS, M. ET AL. Terveydenhuoltohenkilöstön tupakointi Suomessa 1995 [Smoking among health care personnel in Finland 1995]. Suomen lääkarilehti, 53: 3001–3003 (1998).
29. WALLER, M. ET AL. International Quit and Win. Helsinki, Finnish Centre for Health Promotion, 1999.
30. ADRIAANSE, H.P. & SCHIJVEN, M.P. Pharmacists’ new role in tobacco cessation. Summary report of the 1992 surveys in six European countries on pharmacists’ tobacco consumption, opinions and attitudes regarding tobacco policies. Copenhagen, EuroPharm Forum Secretariat, WHO Regional Office for Europe, 1996.
31. Third Action Plan for a Tobacco-free Europe 1997–2001. Copenhagen, WHO Regional Office for Europe, 1997.
32. LEHTONEN, R. & PAHKINEN, E.J. Practical methods for design and analysis of complex surveys.Chichester, Wiley, 1996.
33. ANDERSON, C. A controlled study of the effect of a health promotion training scheme on pharmacists’ advice about smoking cessation. Journal of social and administrative pharmacy, 12:115–123 (1995).
34. ANDERSON, C. Simple advice is good advice. Pharmaceutical journal, 260: 710 (1998). 35. SINCLAIR, H. ET AL. An evaluation of a training workshop for pharmacists based on the stages of
change model of smoking cessation. Health education journal, 56: 296–312 (1997). 36. SINCLAIR, H. & LENNOX, A. Support from pharmacies can help people to stop smoking. BMJ, 322:
52 (2001). 37. PANTON, R. ET AL. Effect of training support on community pharmacists’ antismoking advice.
Pharmaceutical journal, 242: 381–383 (1989). 38. AIRAKSINEN, M. & HAKKARAINEN, T. Kuuri loppuun – opas lääkeneuvontaan [Take to the end –
a guide to drug information]. Kuopio, Fortis, 2001. 39. GOLDSTEIN, M.G. ET AL. A population-based survey of physician smoking cessation counseling
practices. Preventive medicine, 27: 720–729 (1998). 40. FIORE, M.C. ET AL. Treating tobacco use and dependence. Clinical practice guideline. Rockville,
MD, US Department of Health and Human Services, 2000. 41. PROCHASKA, J.O. ET AL. Changing for good. The revolutionary program that explains the six
stages of change and teaches you how to free yourself from bad habits. New York, William Morrow & Co., 1994.
42. HUDMON, K. & BERGER, B. Pharmacy applications of the transtheoretical model in smoking cessation, American journal of health-system pharmacy, 52: 282–287 (1995).
43. STRECHER, V. Computer-tailored smoking cessation materials: a review and discussion. Patient education and counselling, 36: 107–117 (1999).
44. MASON, P. Helping smokers change: a resource pack for training health professionals.Copenhagen, WHO Regional Office for Europe, 2001.
45. PIETILÄ, K. ET AL. Educational training for pharmacists in smoking cessation. Abstracts, Pharmacy World Congress, Singapore, 2001.

EUR/01/5025372 page 27
6. Appendices
1. Questionnaire
2. Country material 2.1. List of national partners and their tasks 2.2. National supporting letters and questionnaires
3.3.1. Table, respondents by age and gender 3.2. Table, respondents by age, gender and country
3.2.1. Austria AUT 3.2.2. Belgium BEL 3.2.3. Denmark DEN 3.2.4. Germany DEU 3.2.5. Finland FIN 3.2.6. France FRA 3.2.7. Ireland IRE 3.2.8. Luxembourg LUX 3.2.9. The Netherlands NET 3.2.10. Portugal POR 3.2.11. Sweden SWE 3.2.12. United Kingdom UNK
3.3. Figure, age distribution among respondents 3.3.1. Austria AUT 3.3.2. Belgium BEL 3.3.3. Denmark DEN 3.3.4. Germany DEU 3.3.5. Finland FIN 3.3.6. France FRA 3.3.7. Ireland IRE 3.3.8. Luxembourg LUX 3.3.9. The Netherlands NET 3.3.10. Portugal POR 3.3.11. Sweden SWE 3.3.12. United Kingdom UNK
4. Figure, distribution of smoking status by country
5. Tobacco use 5.1. Figure, tobacco use by country 5.2. Table, tobacco consumption among smokers by country
6. Consumption of manufactured cigarettes 6.1. Figure, consumption of manufactured cigarettes by country 6.2. Table, average daily cigarette consumption among detected cigarette smokers by
country 6.3. Table, cigarette consumption among detected cigarette smokers by country
EUR/01/5025372 page 28
7. Question 5.1, would you like to stop smoking? 7.1. Figure, willingness to stop smoking by country 7.2. Table, willingness to stop smoking by country
8. Question 5, have you tried seriously to stop smoking? 8.1. Figure, have you tried seriously to stop smoking by country 8.2. Table, have you tried seriously to stop smoking by country 8.3. Number of smokers who have seriously tried to stop
9. Smoking in the pharmacy among smokers 9.1. Table, do you ever smoke in the public area of the pharmacy you are working in?
10. Reasons for not smoking by country 10.1. Figure, I want to protect my health 10.2. Figure, I want to avoid unpleasant symptoms 10.3. Figure, I am under pressure from my colleagues 10.4. Smoking is unpleasant for persons around me 10.5. I want to save money
11. Smoking in public areas of pharmacies 11.1. Figure, is smoking permitted in the public area of pharmacy you are working in by
country and by smoking status 11.2. Table, is smoking permitted in the public area of pharmacy you are working in by
country
12. Activities of pharmacists 12.1. Figure, smoking cessation services are a normal part of my work by country 12.2. Figure, do you advise patients/customers to stop smoking by country 12.3. Figure, do you volunteer written information (e.g. leaflets) on smoking or smoking
cessation to patients/customers 12.4. Figure, do you volunteer information about smoking cessation courses to
patients/customers who want help to stop smoking 12.5. Do you actively promote NRT to your patients/customers
13. Attitudes of pharmacists 13.1. Figure, my current knowledge about smoking is sufficient to allow me to advise a
patient/customer who wants to stop 13.2. Figure, smoking in pharmacies should be completely prohibited 13.3. Figure, pharmacists should be trained to assist patients/customers who wish to stop
smoking 13.4. Figure, smoking prevention and cessation should be included in the normal training
programme for pharmacists 13.5. Figure, the legislative actions taken in our country against smoking are sufficient so
far and no more actions are needed.
Appendix 1Appendix 1
Appendix 2 Country material
2.1 List of national partners
Austria:Oesterreichische Apothekerkammer
Belgium:Association Pharmaceutique Belge
Denmark:Danish Pharmaceutical Association Association of Danish Pharmacists
Finland:The Association of Finnish Pharmacies Finnish Pharmacists’ Association
France:Conseil national de l’Ordre des PharmaciensFederation des syndicats pharmaceutiques de France
Germany:Federal Union of German Associations of Pharmacists (ABDA)
Ireland:Irish Pharmaceutical Union
Luxembourg:Union Nationale des Pharmaciens Luxembourgeois asbl
The Netherlands Koninklijke Nederlandse Maatschappij ter bevordering der Pharmacie (KNMP)
Portugal:Associaçao Nacionaldas FarmaciasOrdem dos Farmaceuticos
Sweden:Swedish Pharmaceutical SocietySwedish Pharmaceutical Association
United Kingdom: The National Pharmaceutical AssociationRoyal Pharmaceutical Society of Great Britain
2.1 Tasks of partners
The activities during the project have been the same for all partners. Those activities include promotion of the project to community pharmacies at national level, preparation of the mailing by translating the questionnaire and filling instructions to own language, writing a supporting letter, and providing the research group with a sample of addresses of community pharmacies. The partners were also responsible for contact to the community pharmacies in their own countries including answering questions and encouraging pharmacists to complete and return the questionnaires.

Appendix 2 Country material
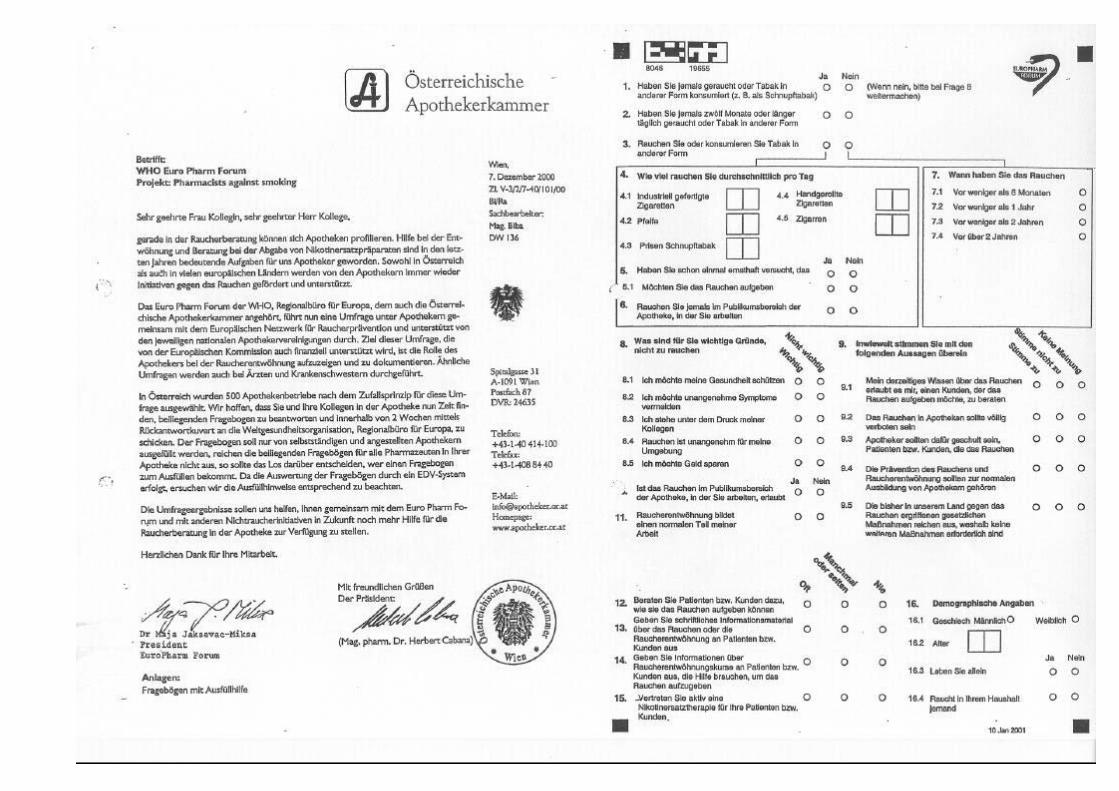
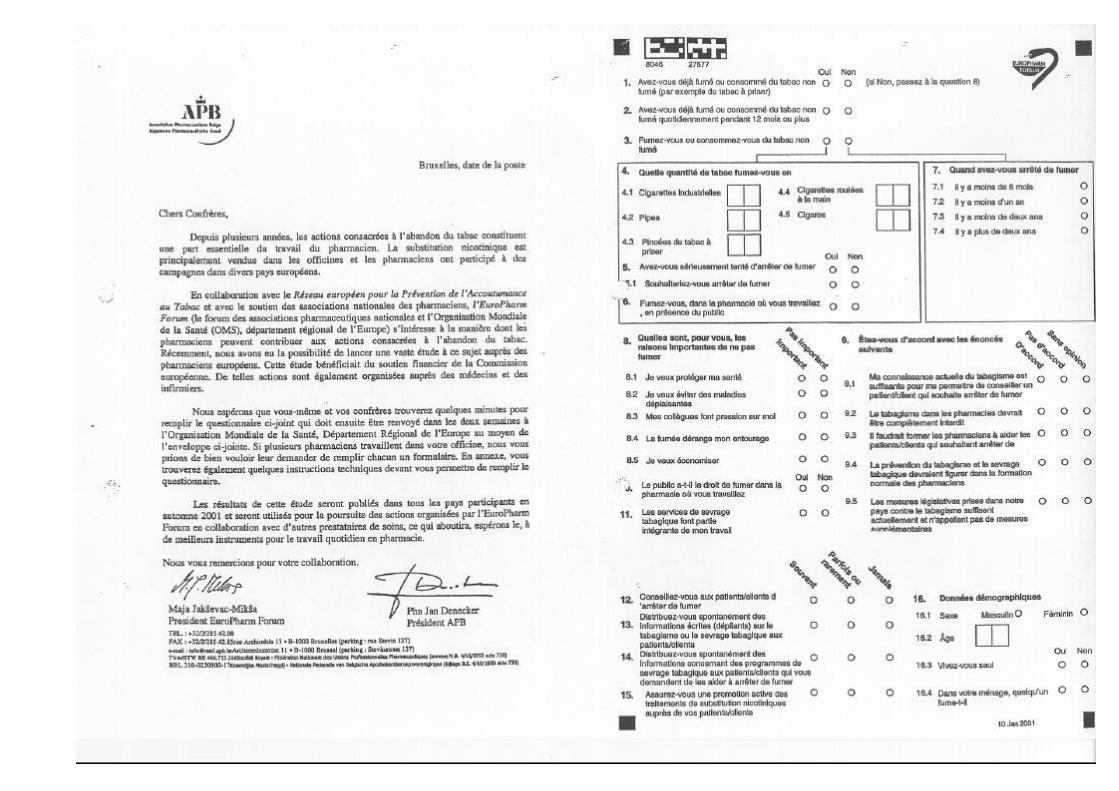
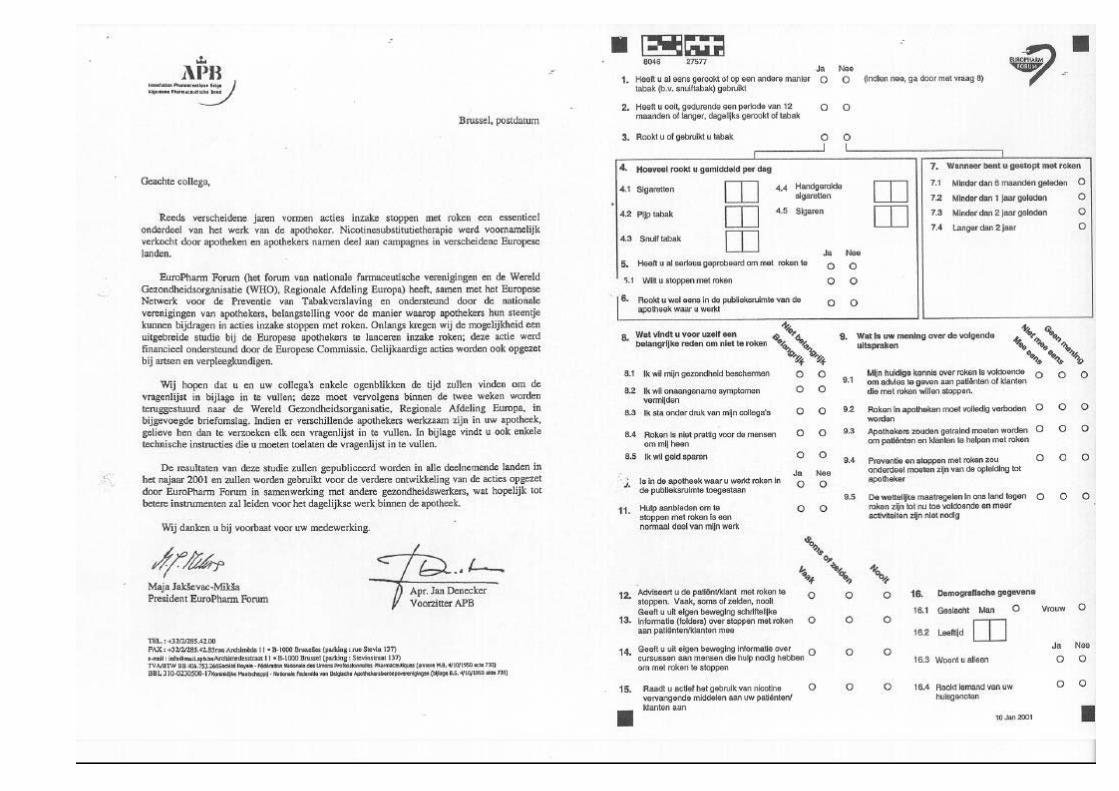
2.2 National supporting letters and questionnaires


Appendix 33.3.1 Figure
Age distribution (AUT)N=814, Age 0: No info
0%
1%
2%
3%
4%
5%
0 3 6 9 12 15 18 21 24 27 30 33 36 39 42 45 48 51 54 57 60 63 66 69 72 75 78 81 84 87 90 93 96 99
Female
Male
No info
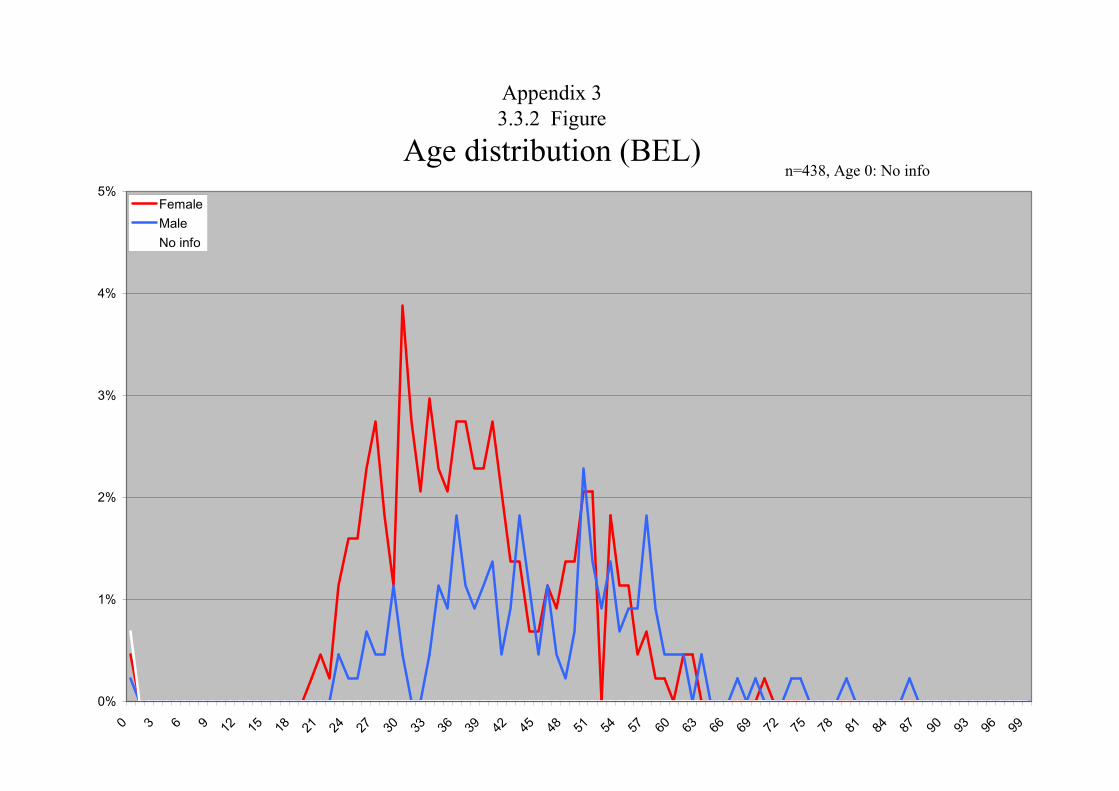
Appendix 33.3.2 Figure
Age distribution (BEL)n=438, Age 0: No info
0%
1%
2%
3%
4%
5%
0 3 6 9 12 15 18 21 24 27 30 33 36 39 42 45 48 51 54 57 60 63 66 69 72 75 78 81 84 87 90 93 96 99
Female
Male
No info

Appendix 33.3.3 Figure
Age distribution (DEN)n=342, Age 0: No info
0%
1%
2%
3%
4%
5%
0 3 6 9 12 15 18 21 24 27 30 33 36 39 42 45 48 51 54 57 60 63 66 69 72 75 78 81 84 87 90 93 96 99
Female
Male
No info
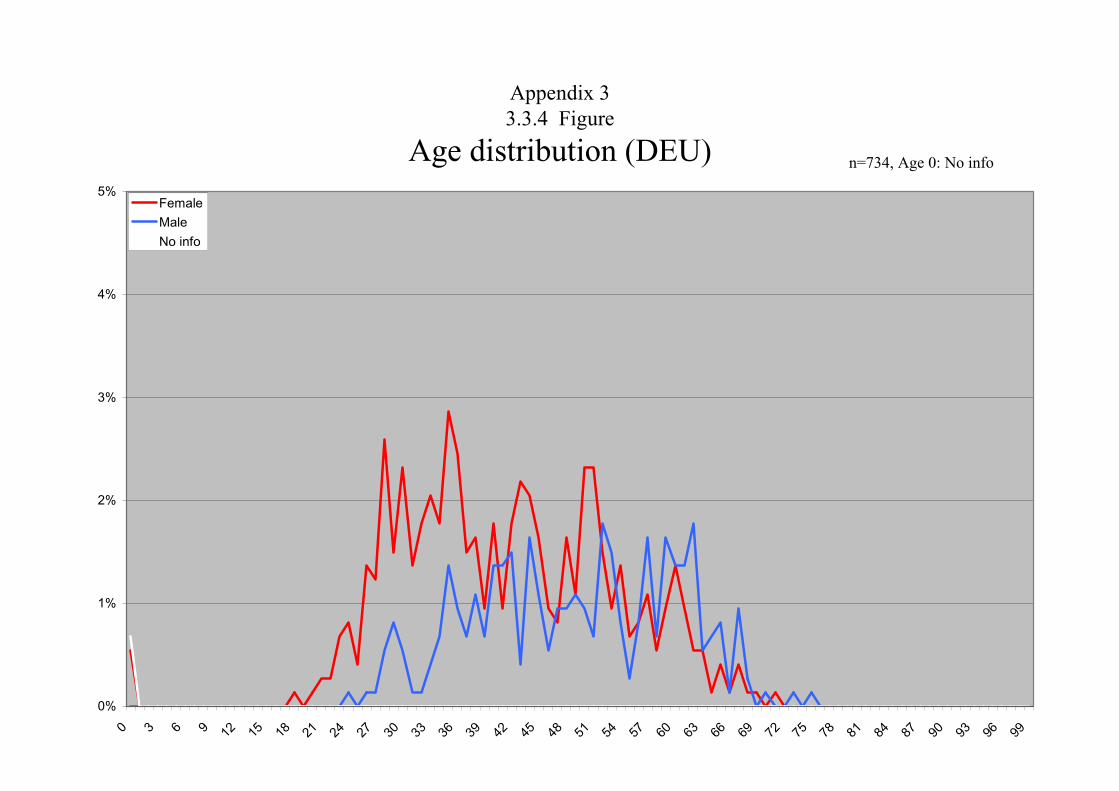
Appendix 33.3.4 Figure
Age distribution (DEU) n=734, Age 0: No info
0%
1%
2%
3%
4%
5%
0 3 6 9 12 15 18 21 24 27 30 33 36 39 42 45 48 51 54 57 60 63 66 69 72 75 78 81 84 87 90 93 96 99
Female
Male
No info

Appendix 33.3.5 Figure
Age distribution (FIN) n=1350, Age 0: No info
0%
1%
2%
3%
4%
5%
0 3 6 9 12 15 18 21 24 27 30 33 36 39 42 45 48 51 54 57 60 63 66 69 72 75 78 81 84 87 90 93 96 99
Female
Male
No info
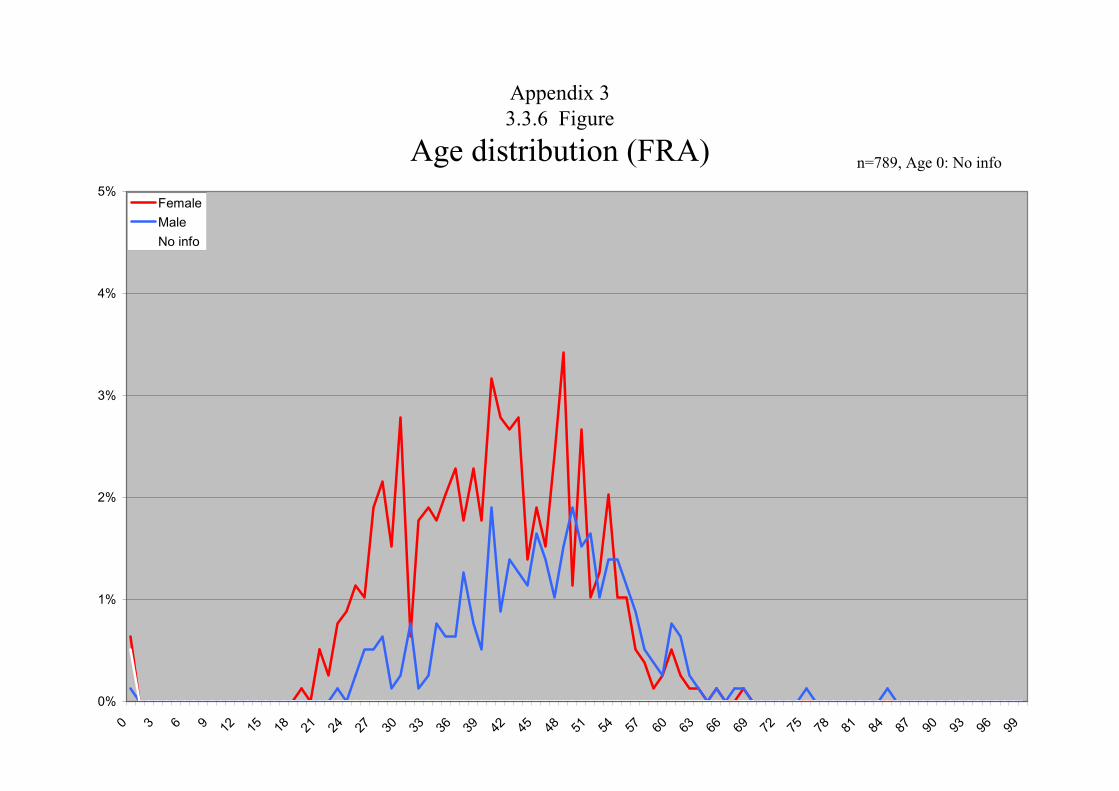
Appendix 33.3.6 Figure
Age distribution (FRA) n=789, Age 0: No info
0%
1%
2%
3%
4%
5%
0 3 6 9 12 15 18 21 24 27 30 33 36 39 42 45 48 51 54 57 60 63 66 69 72 75 78 81 84 87 90 93 96 99
Female
Male
No info

Appendix 33.3.7 Figure
Age distribution (IRE) n=609, Age 0: No info
0%
1%
2%
3%
4%
5%
0 3 6 9 12 15 18 21 24 27 30 33 36 39 42 45 48 51 54 57 60 63 66 69 72 75 78 81 84 87 90 93 96 99
Female
Male
No info

Appendix 33.3.8 Figure
Age distribution (LUX) n=76, Age 0: No info
0%
1%
2%
3%
4%
5%
0 3 6 9 12 15 18 21 24 27 30 33 36 39 42 45 48 51 54 57 60 63 66 69 72 75 78 81 84 87 90 93 96 99
Female
Male
No info
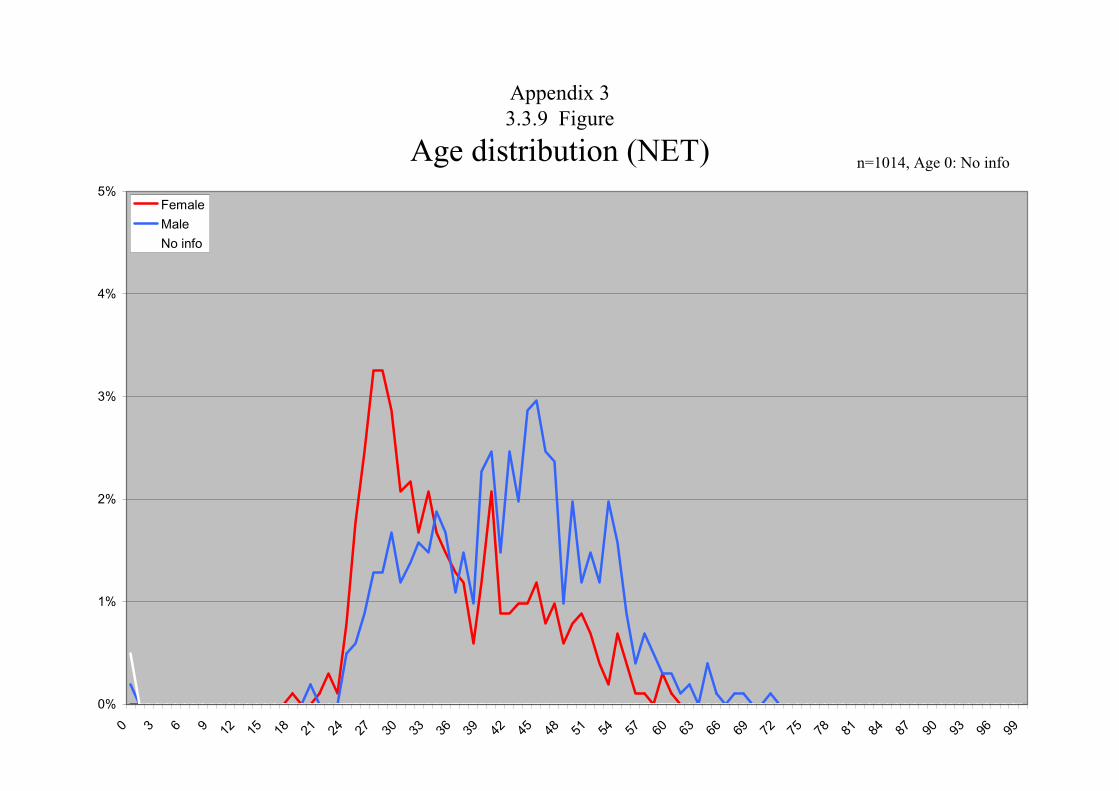
Appendix 33.3.9 Figure
Age distribution (NET) n=1014, Age 0: No info
0%
1%
2%
3%
4%
5%
0 3 6 9 12 15 18 21 24 27 30 33 36 39 42 45 48 51 54 57 60 63 66 69 72 75 78 81 84 87 90 93 96 99
Female
Male
No info

Appendix 33.3.10 Figure
Age distribution (POR) n=540, Age 0: No info
0%
1%
2%
3%
4%
5%
0 3 6 9 12 15 18 21 24 27 30 33 36 39 42 45 48 51 54 57 60 63 66 69 72 75 78 81 84 87 90 93 96 99
Female
Male
No info
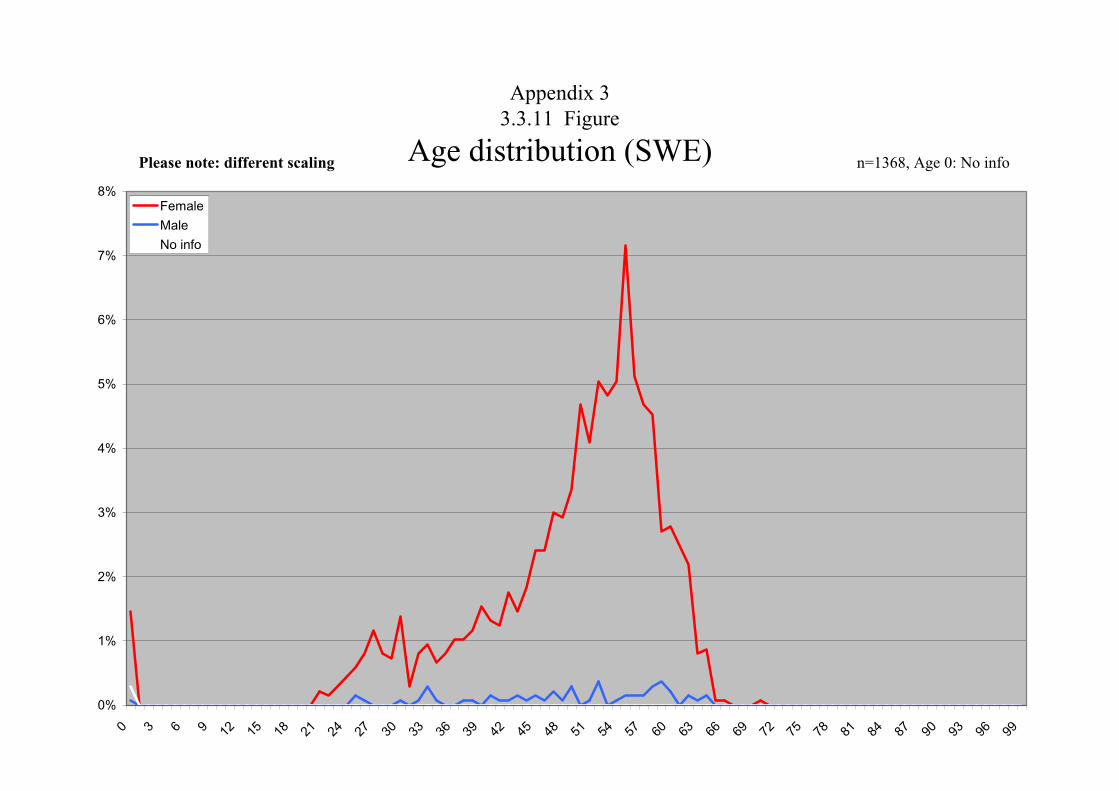
Appendix 33.3.11 Figure
Age distribution (SWE) n=1368, Age 0: No info
0%
1%
2%
3%
4%
5%
6%
7%
8%
0 3 6 9 12 15 18 21 24 27 30 33 36 39 42 45 48 51 54 57 60 63 66 69 72 75 78 81 84 87 90 93 96 99
Female
Male
No info
Please note: different scaling
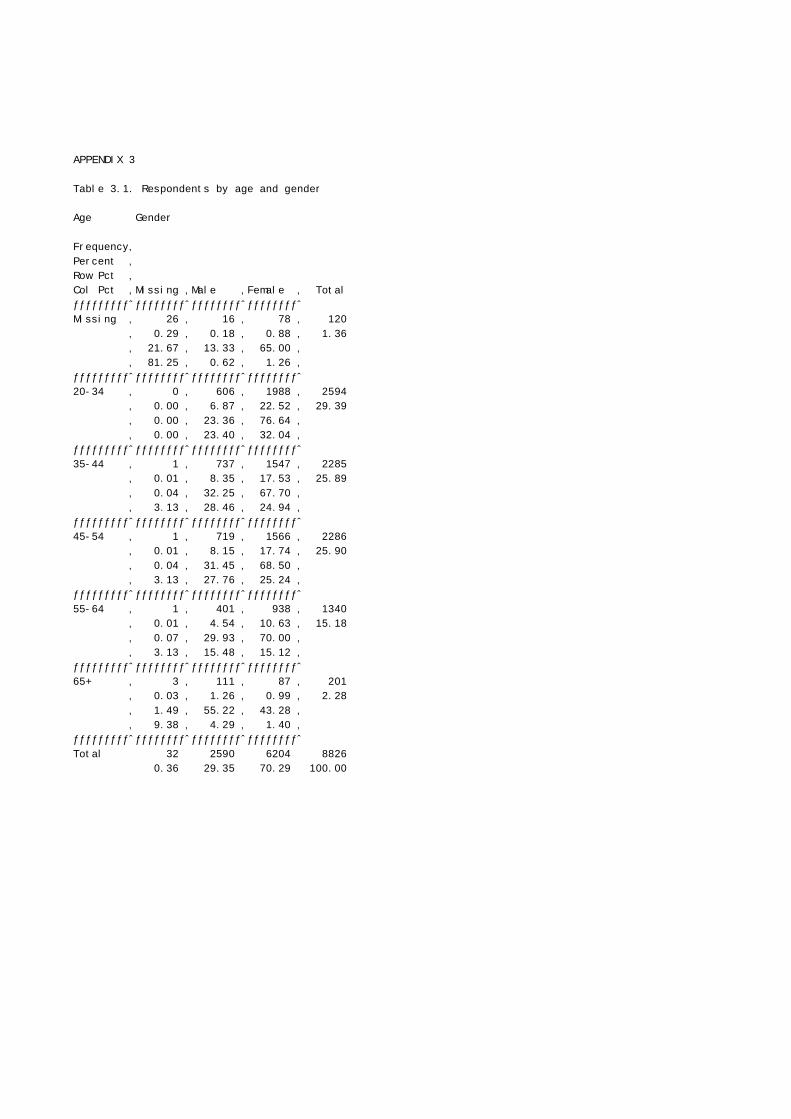
APPENDIX 3
Table 3.1. Respondents by age and gender
Age Gender
Frequency‚Percent ‚ Row Pct ‚ Col Pct ‚Missing ‚Male ‚Female ‚ Total ƒƒƒƒƒƒƒƒƒˆƒƒƒƒƒƒƒƒˆƒƒƒƒƒƒƒƒˆƒƒƒƒƒƒƒƒˆ Missing ‚ 26 ‚ 16 ‚ 78 ‚ 120 ‚ 0.29 ‚ 0.18 ‚ 0.88 ‚ 1.36 ‚ 21.67 ‚ 13.33 ‚ 65.00 ‚ ‚ 81.25 ‚ 0.62 ‚ 1.26 ‚ ƒƒƒƒƒƒƒƒƒˆƒƒƒƒƒƒƒƒˆƒƒƒƒƒƒƒƒˆƒƒƒƒƒƒƒƒˆ 20-34 ‚ 0 ‚ 606 ‚ 1988 ‚ 2594 ‚ 0.00 ‚ 6.87 ‚ 22.52 ‚ 29.39 ‚ 0.00 ‚ 23.36 ‚ 76.64 ‚ ‚ 0.00 ‚ 23.40 ‚ 32.04 ‚ ƒƒƒƒƒƒƒƒƒˆƒƒƒƒƒƒƒƒˆƒƒƒƒƒƒƒƒˆƒƒƒƒƒƒƒƒˆ 35-44 ‚ 1 ‚ 737 ‚ 1547 ‚ 2285 ‚ 0.01 ‚ 8.35 ‚ 17.53 ‚ 25.89 ‚ 0.04 ‚ 32.25 ‚ 67.70 ‚ ‚ 3.13 ‚ 28.46 ‚ 24.94 ‚ ƒƒƒƒƒƒƒƒƒˆƒƒƒƒƒƒƒƒˆƒƒƒƒƒƒƒƒˆƒƒƒƒƒƒƒƒˆ 45-54 ‚ 1 ‚ 719 ‚ 1566 ‚ 2286 ‚ 0.01 ‚ 8.15 ‚ 17.74 ‚ 25.90 ‚ 0.04 ‚ 31.45 ‚ 68.50 ‚ ‚ 3.13 ‚ 27.76 ‚ 25.24 ‚ ƒƒƒƒƒƒƒƒƒˆƒƒƒƒƒƒƒƒˆƒƒƒƒƒƒƒƒˆƒƒƒƒƒƒƒƒˆ 55-64 ‚ 1 ‚ 401 ‚ 938 ‚ 1340 ‚ 0.01 ‚ 4.54 ‚ 10.63 ‚ 15.18 ‚ 0.07 ‚ 29.93 ‚ 70.00 ‚ ‚ 3.13 ‚ 15.48 ‚ 15.12 ‚ ƒƒƒƒƒƒƒƒƒˆƒƒƒƒƒƒƒƒˆƒƒƒƒƒƒƒƒˆƒƒƒƒƒƒƒƒˆ 65+ ‚ 3 ‚ 111 ‚ 87 ‚ 201 ‚ 0.03 ‚ 1.26 ‚ 0.99 ‚ 2.28 ‚ 1.49 ‚ 55.22 ‚ 43.28 ‚ ‚ 9.38 ‚ 4.29 ‚ 1.40 ‚ ƒƒƒƒƒƒƒƒƒˆƒƒƒƒƒƒƒƒˆƒƒƒƒƒƒƒƒˆƒƒƒƒƒƒƒƒˆ Total 32 2590 6204 8826 0.36 29.35 70.29 100.00

APPENDIX 3
Table 3.2.1 Respondents by age, gender and country Austria
Age Gender
Frequency‚Percent ‚ Row Pct ‚ Col Pct ‚Missing ‚Male ‚Female ‚ Total ƒƒƒƒƒƒƒƒƒˆƒƒƒƒƒƒƒƒˆƒƒƒƒƒƒƒƒˆƒƒƒƒƒƒƒƒˆ Missing ‚ 2 ‚ 0 ‚ 5 ‚ 7 ‚ 0.25 ‚ 0.00 ‚ 0.62 ‚ 0.87 ‚ 28.57 ‚ 0.00 ‚ 71.43 ‚ ‚ 50.00 ‚ 0.00 ‚ 0.89 ‚ ƒƒƒƒƒƒƒƒƒˆƒƒƒƒƒƒƒƒˆƒƒƒƒƒƒƒƒˆƒƒƒƒƒƒƒƒˆ 20-34 ‚ 0 ‚ 44 ‚ 182 ‚ 226 ‚ 0.00 ‚ 5.45 ‚ 22.55 ‚ 28.00 ‚ 0.00 ‚ 19.47 ‚ 80.53 ‚ ‚ 0.00 ‚ 18.18 ‚ 32.44 ‚ ƒƒƒƒƒƒƒƒƒˆƒƒƒƒƒƒƒƒˆƒƒƒƒƒƒƒƒˆƒƒƒƒƒƒƒƒˆ 35-44 ‚ 0 ‚ 68 ‚ 200 ‚ 268 ‚ 0.00 ‚ 8.43 ‚ 24.78 ‚ 33.21 ‚ 0.00 ‚ 25.37 ‚ 74.63 ‚ ‚ 0.00 ‚ 28.10 ‚ 35.65 ‚ ƒƒƒƒƒƒƒƒƒˆƒƒƒƒƒƒƒƒˆƒƒƒƒƒƒƒƒˆƒƒƒƒƒƒƒƒˆ 45-54 ‚ 1 ‚ 77 ‚ 129 ‚ 207 ‚ 0.12 ‚ 9.54 ‚ 15.99 ‚ 25.65 ‚ 0.48 ‚ 37.20 ‚ 62.32 ‚ ‚ 25.00 ‚ 31.82 ‚ 22.99 ‚ ƒƒƒƒƒƒƒƒƒˆƒƒƒƒƒƒƒƒˆƒƒƒƒƒƒƒƒˆƒƒƒƒƒƒƒƒˆ 55-64 ‚ 0 ‚ 40 ‚ 38 ‚ 78 ‚ 0.00 ‚ 4.96 ‚ 4.71 ‚ 9.67 ‚ 0.00 ‚ 51.28 ‚ 48.72 ‚ ‚ 0.00 ‚ 16.53 ‚ 6.77 ‚ ƒƒƒƒƒƒƒƒƒˆƒƒƒƒƒƒƒƒˆƒƒƒƒƒƒƒƒˆƒƒƒƒƒƒƒƒˆ 65+ ‚ 1 ‚ 13 ‚ 7 ‚ 21 ‚ 0.12 ‚ 1.61 ‚ 0.87 ‚ 2.60 ‚ 4.76 ‚ 61.90 ‚ 33.33 ‚ ‚ 25.00 ‚ 5.37 ‚ 1.25 ‚ ƒƒƒƒƒƒƒƒƒˆƒƒƒƒƒƒƒƒˆƒƒƒƒƒƒƒƒˆƒƒƒƒƒƒƒƒˆ Total 4 242 561 807 0.50 29.99 69.52 100.00
APPENDIX 3
Table 3.2.2. Respondents by age, gender and country Belgium
Age Gender
Frequency‚Percent ‚ Row Pct ‚ Col Pct ‚Missing ‚Male ‚Female ‚ Total ƒƒƒƒƒƒƒƒƒˆƒƒƒƒƒƒƒƒˆƒƒƒƒƒƒƒƒˆƒƒƒƒƒƒƒƒˆ Missing ‚ 3 ‚ 1 ‚ 2 ‚ 6 ‚ 0.68 ‚ 0.23 ‚ 0.46 ‚ 1.37 ‚ 50.00 ‚ 16.67 ‚ 33.33 ‚ ‚ 100.00 ‚ 0.65 ‚ 0.71 ‚ ƒƒƒƒƒƒƒƒƒˆƒƒƒƒƒƒƒƒˆƒƒƒƒƒƒƒƒˆƒƒƒƒƒƒƒƒˆ 20-34 ‚ 0 ‚ 25 ‚ 119 ‚ 144 ‚ 0.00 ‚ 5.71 ‚ 27.17 ‚ 32.88 ‚ 0.00 ‚ 17.36 ‚ 82.64 ‚ ‚ 0.00 ‚ 16.34 ‚ 42.20 ‚ ƒƒƒƒƒƒƒƒƒˆƒƒƒƒƒƒƒƒˆƒƒƒƒƒƒƒƒˆƒƒƒƒƒƒƒƒˆ 35-44 ‚ 0 ‚ 51 ‚ 89 ‚ 140 ‚ 0.00 ‚ 11.64 ‚ 20.32 ‚ 31.96 ‚ 0.00 ‚ 36.43 ‚ 63.57 ‚ ‚ 0.00 ‚ 33.33 ‚ 31.56 ‚ ƒƒƒƒƒƒƒƒƒˆƒƒƒƒƒƒƒƒˆƒƒƒƒƒƒƒƒˆƒƒƒƒƒƒƒƒˆ 45-54 ‚ 0 ‚ 42 ‚ 55 ‚ 97 ‚ 0.00 ‚ 9.59 ‚ 12.56 ‚ 22.15 ‚ 0.00 ‚ 43.30 ‚ 56.70 ‚ ‚ 0.00 ‚ 27.45 ‚ 19.50 ‚ ƒƒƒƒƒƒƒƒƒˆƒƒƒƒƒƒƒƒˆƒƒƒƒƒƒƒƒˆƒƒƒƒƒƒƒƒˆ 55-64 ‚ 0 ‚ 28 ‚ 16 ‚ 44 ‚ 0.00 ‚ 6.39 ‚ 3.65 ‚ 10.05 ‚ 0.00 ‚ 63.64 ‚ 36.36 ‚ ‚ 0.00 ‚ 18.30 ‚ 5.67 ‚ ƒƒƒƒƒƒƒƒƒˆƒƒƒƒƒƒƒƒˆƒƒƒƒƒƒƒƒˆƒƒƒƒƒƒƒƒˆ 65+ ‚ 0 ‚ 6 ‚ 1 ‚ 7 ‚ 0.00 ‚ 1.37 ‚ 0.23 ‚ 1.60 ‚ 0.00 ‚ 85.71 ‚ 14.29 ‚ ‚ 0.00 ‚ 3.92 ‚ 0.35 ‚ ƒƒƒƒƒƒƒƒƒˆƒƒƒƒƒƒƒƒˆƒƒƒƒƒƒƒƒˆƒƒƒƒƒƒƒƒˆ Total 3 153 282 438 0.68 34.93 64.38 100.00
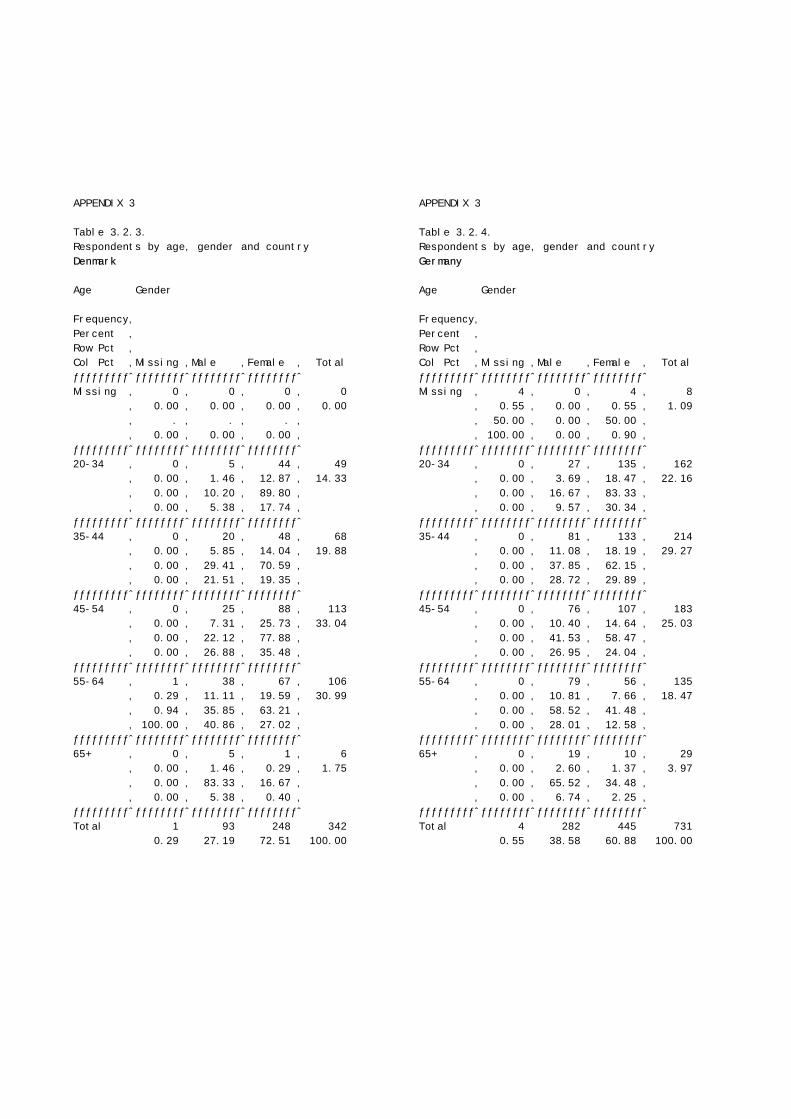
APPENDIX 3
Table 3.2.3. Respondents by age, gender and country Denmark
Age Gender
Frequency‚Percent ‚ Row Pct ‚ Col Pct ‚Missing ‚Male ‚Female ‚ Total ƒƒƒƒƒƒƒƒƒˆƒƒƒƒƒƒƒƒˆƒƒƒƒƒƒƒƒˆƒƒƒƒƒƒƒƒˆ Missing ‚ 0 ‚ 0 ‚ 0 ‚ 0 ‚ 0.00 ‚ 0.00 ‚ 0.00 ‚ 0.00 ‚ . ‚ . ‚ . ‚ ‚ 0.00 ‚ 0.00 ‚ 0.00 ‚ ƒƒƒƒƒƒƒƒƒˆƒƒƒƒƒƒƒƒˆƒƒƒƒƒƒƒƒˆƒƒƒƒƒƒƒƒˆ 20-34 ‚ 0 ‚ 5 ‚ 44 ‚ 49 ‚ 0.00 ‚ 1.46 ‚ 12.87 ‚ 14.33 ‚ 0.00 ‚ 10.20 ‚ 89.80 ‚ ‚ 0.00 ‚ 5.38 ‚ 17.74 ‚ ƒƒƒƒƒƒƒƒƒˆƒƒƒƒƒƒƒƒˆƒƒƒƒƒƒƒƒˆƒƒƒƒƒƒƒƒˆ 35-44 ‚ 0 ‚ 20 ‚ 48 ‚ 68 ‚ 0.00 ‚ 5.85 ‚ 14.04 ‚ 19.88 ‚ 0.00 ‚ 29.41 ‚ 70.59 ‚ ‚ 0.00 ‚ 21.51 ‚ 19.35 ‚ ƒƒƒƒƒƒƒƒƒˆƒƒƒƒƒƒƒƒˆƒƒƒƒƒƒƒƒˆƒƒƒƒƒƒƒƒˆ 45-54 ‚ 0 ‚ 25 ‚ 88 ‚ 113 ‚ 0.00 ‚ 7.31 ‚ 25.73 ‚ 33.04 ‚ 0.00 ‚ 22.12 ‚ 77.88 ‚ ‚ 0.00 ‚ 26.88 ‚ 35.48 ‚ ƒƒƒƒƒƒƒƒƒˆƒƒƒƒƒƒƒƒˆƒƒƒƒƒƒƒƒˆƒƒƒƒƒƒƒƒˆ 55-64 ‚ 1 ‚ 38 ‚ 67 ‚ 106 ‚ 0.29 ‚ 11.11 ‚ 19.59 ‚ 30.99 ‚ 0.94 ‚ 35.85 ‚ 63.21 ‚ ‚ 100.00 ‚ 40.86 ‚ 27.02 ‚ ƒƒƒƒƒƒƒƒƒˆƒƒƒƒƒƒƒƒˆƒƒƒƒƒƒƒƒˆƒƒƒƒƒƒƒƒˆ 65+ ‚ 0 ‚ 5 ‚ 1 ‚ 6 ‚ 0.00 ‚ 1.46 ‚ 0.29 ‚ 1.75 ‚ 0.00 ‚ 83.33 ‚ 16.67 ‚ ‚ 0.00 ‚ 5.38 ‚ 0.40 ‚ ƒƒƒƒƒƒƒƒƒˆƒƒƒƒƒƒƒƒˆƒƒƒƒƒƒƒƒˆƒƒƒƒƒƒƒƒˆ Total 1 93 248 342 0.29 27.19 72.51 100.00
APPENDIX 3
Table 3.2.4. Respondents by age, gender and country Germany
Age Gender
Frequency‚Percent ‚ Row Pct ‚ Col Pct ‚Missing ‚Male ‚Female ‚ Total ƒƒƒƒƒƒƒƒƒˆƒƒƒƒƒƒƒƒˆƒƒƒƒƒƒƒƒˆƒƒƒƒƒƒƒƒˆ Missing ‚ 4 ‚ 0 ‚ 4 ‚ 8 ‚ 0.55 ‚ 0.00 ‚ 0.55 ‚ 1.09 ‚ 50.00 ‚ 0.00 ‚ 50.00 ‚ ‚ 100.00 ‚ 0.00 ‚ 0.90 ‚ ƒƒƒƒƒƒƒƒƒˆƒƒƒƒƒƒƒƒˆƒƒƒƒƒƒƒƒˆƒƒƒƒƒƒƒƒˆ 20-34 ‚ 0 ‚ 27 ‚ 135 ‚ 162 ‚ 0.00 ‚ 3.69 ‚ 18.47 ‚ 22.16 ‚ 0.00 ‚ 16.67 ‚ 83.33 ‚ ‚ 0.00 ‚ 9.57 ‚ 30.34 ‚ ƒƒƒƒƒƒƒƒƒˆƒƒƒƒƒƒƒƒˆƒƒƒƒƒƒƒƒˆƒƒƒƒƒƒƒƒˆ 35-44 ‚ 0 ‚ 81 ‚ 133 ‚ 214 ‚ 0.00 ‚ 11.08 ‚ 18.19 ‚ 29.27 ‚ 0.00 ‚ 37.85 ‚ 62.15 ‚ ‚ 0.00 ‚ 28.72 ‚ 29.89 ‚ ƒƒƒƒƒƒƒƒƒˆƒƒƒƒƒƒƒƒˆƒƒƒƒƒƒƒƒˆƒƒƒƒƒƒƒƒˆ 45-54 ‚ 0 ‚ 76 ‚ 107 ‚ 183 ‚ 0.00 ‚ 10.40 ‚ 14.64 ‚ 25.03 ‚ 0.00 ‚ 41.53 ‚ 58.47 ‚ ‚ 0.00 ‚ 26.95 ‚ 24.04 ‚ ƒƒƒƒƒƒƒƒƒˆƒƒƒƒƒƒƒƒˆƒƒƒƒƒƒƒƒˆƒƒƒƒƒƒƒƒˆ 55-64 ‚ 0 ‚ 79 ‚ 56 ‚ 135 ‚ 0.00 ‚ 10.81 ‚ 7.66 ‚ 18.47 ‚ 0.00 ‚ 58.52 ‚ 41.48 ‚ ‚ 0.00 ‚ 28.01 ‚ 12.58 ‚ ƒƒƒƒƒƒƒƒƒˆƒƒƒƒƒƒƒƒˆƒƒƒƒƒƒƒƒˆƒƒƒƒƒƒƒƒˆ 65+ ‚ 0 ‚ 19 ‚ 10 ‚ 29 ‚ 0.00 ‚ 2.60 ‚ 1.37 ‚ 3.97 ‚ 0.00 ‚ 65.52 ‚ 34.48 ‚ ‚ 0.00 ‚ 6.74 ‚ 2.25 ‚ ƒƒƒƒƒƒƒƒƒˆƒƒƒƒƒƒƒƒˆƒƒƒƒƒƒƒƒˆƒƒƒƒƒƒƒƒˆ Total 4 282 445 731 0.55 38.58 60.88 100.00
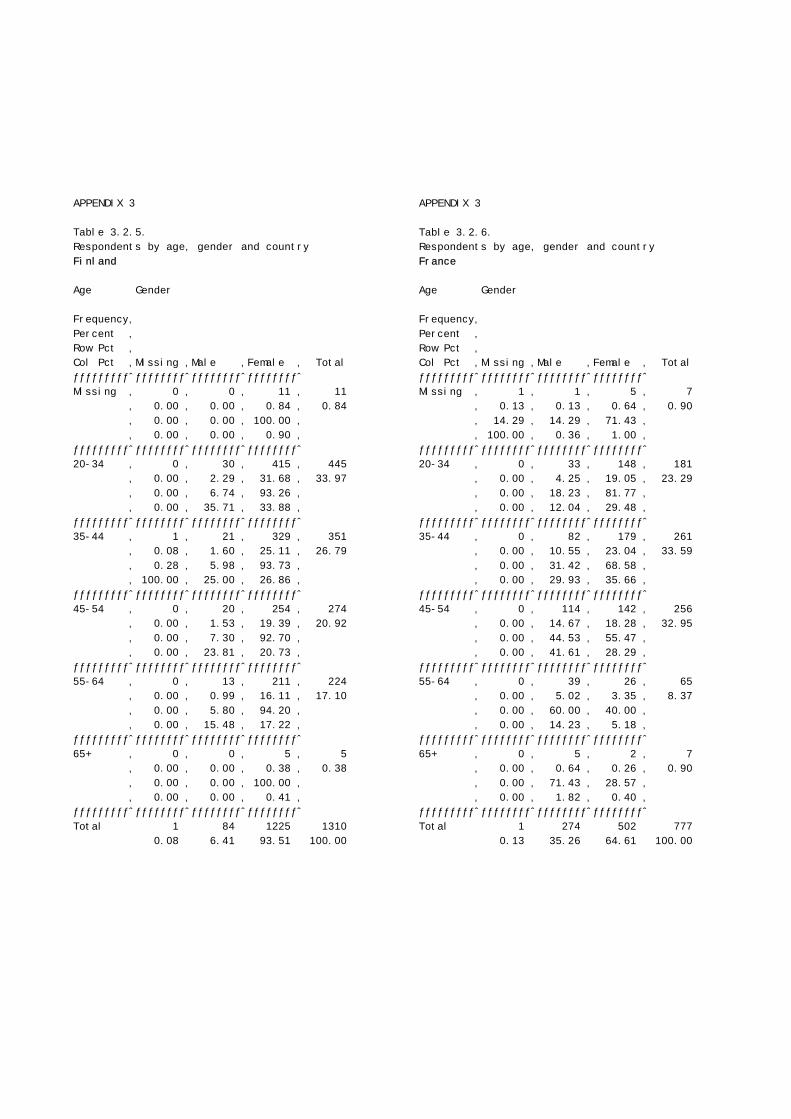
APPENDIX 3
Table 3.2.5. Respondents by age, gender and country Finland
Age Gender
Frequency‚Percent ‚ Row Pct ‚ Col Pct ‚Missing ‚Male ‚Female ‚ Total ƒƒƒƒƒƒƒƒƒˆƒƒƒƒƒƒƒƒˆƒƒƒƒƒƒƒƒˆƒƒƒƒƒƒƒƒˆ Missing ‚ 0 ‚ 0 ‚ 11 ‚ 11 ‚ 0.00 ‚ 0.00 ‚ 0.84 ‚ 0.84 ‚ 0.00 ‚ 0.00 ‚ 100.00 ‚ ‚ 0.00 ‚ 0.00 ‚ 0.90 ‚ ƒƒƒƒƒƒƒƒƒˆƒƒƒƒƒƒƒƒˆƒƒƒƒƒƒƒƒˆƒƒƒƒƒƒƒƒˆ 20-34 ‚ 0 ‚ 30 ‚ 415 ‚ 445 ‚ 0.00 ‚ 2.29 ‚ 31.68 ‚ 33.97 ‚ 0.00 ‚ 6.74 ‚ 93.26 ‚ ‚ 0.00 ‚ 35.71 ‚ 33.88 ‚ ƒƒƒƒƒƒƒƒƒˆƒƒƒƒƒƒƒƒˆƒƒƒƒƒƒƒƒˆƒƒƒƒƒƒƒƒˆ 35-44 ‚ 1 ‚ 21 ‚ 329 ‚ 351 ‚ 0.08 ‚ 1.60 ‚ 25.11 ‚ 26.79 ‚ 0.28 ‚ 5.98 ‚ 93.73 ‚ ‚ 100.00 ‚ 25.00 ‚ 26.86 ‚ ƒƒƒƒƒƒƒƒƒˆƒƒƒƒƒƒƒƒˆƒƒƒƒƒƒƒƒˆƒƒƒƒƒƒƒƒˆ 45-54 ‚ 0 ‚ 20 ‚ 254 ‚ 274 ‚ 0.00 ‚ 1.53 ‚ 19.39 ‚ 20.92 ‚ 0.00 ‚ 7.30 ‚ 92.70 ‚ ‚ 0.00 ‚ 23.81 ‚ 20.73 ‚ ƒƒƒƒƒƒƒƒƒˆƒƒƒƒƒƒƒƒˆƒƒƒƒƒƒƒƒˆƒƒƒƒƒƒƒƒˆ 55-64 ‚ 0 ‚ 13 ‚ 211 ‚ 224 ‚ 0.00 ‚ 0.99 ‚ 16.11 ‚ 17.10 ‚ 0.00 ‚ 5.80 ‚ 94.20 ‚ ‚ 0.00 ‚ 15.48 ‚ 17.22 ‚ ƒƒƒƒƒƒƒƒƒˆƒƒƒƒƒƒƒƒˆƒƒƒƒƒƒƒƒˆƒƒƒƒƒƒƒƒˆ 65+ ‚ 0 ‚ 0 ‚ 5 ‚ 5 ‚ 0.00 ‚ 0.00 ‚ 0.38 ‚ 0.38 ‚ 0.00 ‚ 0.00 ‚ 100.00 ‚ ‚ 0.00 ‚ 0.00 ‚ 0.41 ‚ ƒƒƒƒƒƒƒƒƒˆƒƒƒƒƒƒƒƒˆƒƒƒƒƒƒƒƒˆƒƒƒƒƒƒƒƒˆ Total 1 84 1225 1310 0.08 6.41 93.51 100.00
APPENDIX 3
Table 3.2.6. Respondents by age, gender and country France
Age Gender
Frequency‚Percent ‚ Row Pct ‚ Col Pct ‚Missing ‚Male ‚Female ‚ Total ƒƒƒƒƒƒƒƒƒˆƒƒƒƒƒƒƒƒˆƒƒƒƒƒƒƒƒˆƒƒƒƒƒƒƒƒˆ Missing ‚ 1 ‚ 1 ‚ 5 ‚ 7 ‚ 0.13 ‚ 0.13 ‚ 0.64 ‚ 0.90 ‚ 14.29 ‚ 14.29 ‚ 71.43 ‚ ‚ 100.00 ‚ 0.36 ‚ 1.00 ‚ ƒƒƒƒƒƒƒƒƒˆƒƒƒƒƒƒƒƒˆƒƒƒƒƒƒƒƒˆƒƒƒƒƒƒƒƒˆ 20-34 ‚ 0 ‚ 33 ‚ 148 ‚ 181 ‚ 0.00 ‚ 4.25 ‚ 19.05 ‚ 23.29 ‚ 0.00 ‚ 18.23 ‚ 81.77 ‚ ‚ 0.00 ‚ 12.04 ‚ 29.48 ‚ ƒƒƒƒƒƒƒƒƒˆƒƒƒƒƒƒƒƒˆƒƒƒƒƒƒƒƒˆƒƒƒƒƒƒƒƒˆ 35-44 ‚ 0 ‚ 82 ‚ 179 ‚ 261 ‚ 0.00 ‚ 10.55 ‚ 23.04 ‚ 33.59 ‚ 0.00 ‚ 31.42 ‚ 68.58 ‚ ‚ 0.00 ‚ 29.93 ‚ 35.66 ‚ ƒƒƒƒƒƒƒƒƒˆƒƒƒƒƒƒƒƒˆƒƒƒƒƒƒƒƒˆƒƒƒƒƒƒƒƒˆ 45-54 ‚ 0 ‚ 114 ‚ 142 ‚ 256 ‚ 0.00 ‚ 14.67 ‚ 18.28 ‚ 32.95 ‚ 0.00 ‚ 44.53 ‚ 55.47 ‚ ‚ 0.00 ‚ 41.61 ‚ 28.29 ‚ ƒƒƒƒƒƒƒƒƒˆƒƒƒƒƒƒƒƒˆƒƒƒƒƒƒƒƒˆƒƒƒƒƒƒƒƒˆ 55-64 ‚ 0 ‚ 39 ‚ 26 ‚ 65 ‚ 0.00 ‚ 5.02 ‚ 3.35 ‚ 8.37 ‚ 0.00 ‚ 60.00 ‚ 40.00 ‚ ‚ 0.00 ‚ 14.23 ‚ 5.18 ‚ ƒƒƒƒƒƒƒƒƒˆƒƒƒƒƒƒƒƒˆƒƒƒƒƒƒƒƒˆƒƒƒƒƒƒƒƒˆ 65+ ‚ 0 ‚ 5 ‚ 2 ‚ 7 ‚ 0.00 ‚ 0.64 ‚ 0.26 ‚ 0.90 ‚ 0.00 ‚ 71.43 ‚ 28.57 ‚ ‚ 0.00 ‚ 1.82 ‚ 0.40 ‚ ƒƒƒƒƒƒƒƒƒˆƒƒƒƒƒƒƒƒˆƒƒƒƒƒƒƒƒˆƒƒƒƒƒƒƒƒˆ Total 1 274 502 777 0.13 35.26 64.61 100.00
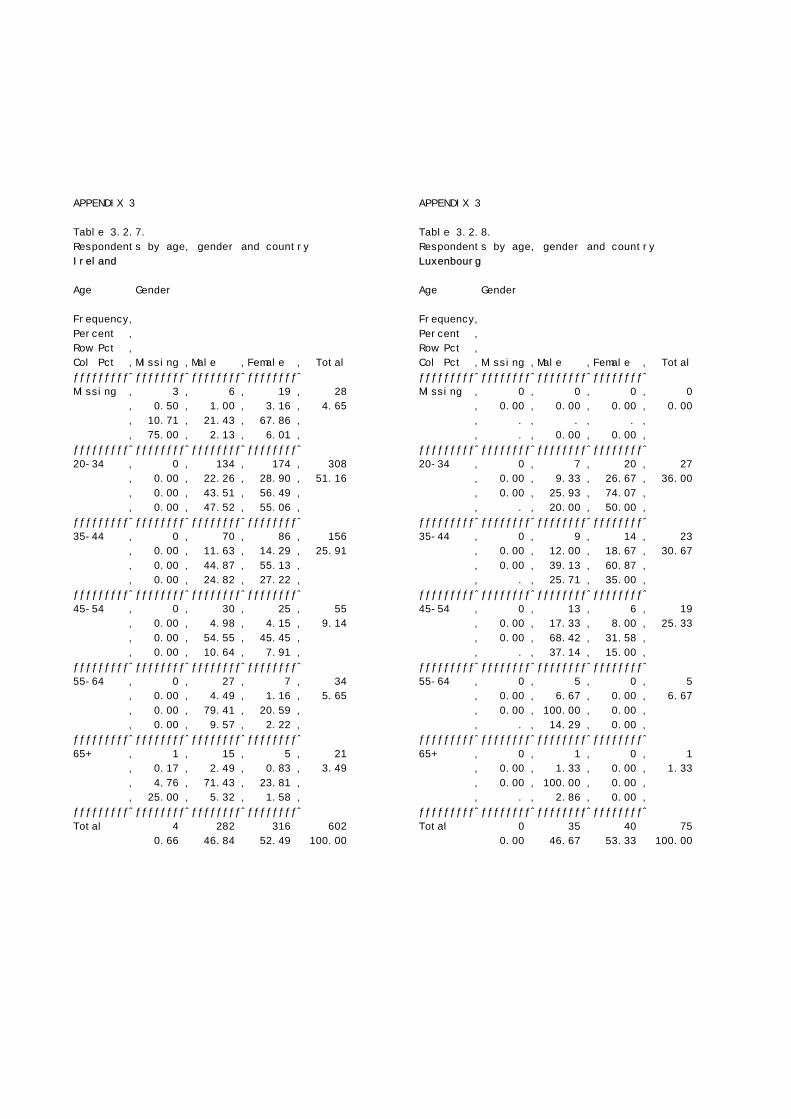
APPENDIX 3
Table 3.2.7. Respondents by age, gender and country Ireland
Age Gender
Frequency‚Percent ‚ Row Pct ‚ Col Pct ‚Missing ‚Male ‚Female ‚ Total ƒƒƒƒƒƒƒƒƒˆƒƒƒƒƒƒƒƒˆƒƒƒƒƒƒƒƒˆƒƒƒƒƒƒƒƒˆ Missing ‚ 3 ‚ 6 ‚ 19 ‚ 28 ‚ 0.50 ‚ 1.00 ‚ 3.16 ‚ 4.65 ‚ 10.71 ‚ 21.43 ‚ 67.86 ‚ ‚ 75.00 ‚ 2.13 ‚ 6.01 ‚ ƒƒƒƒƒƒƒƒƒˆƒƒƒƒƒƒƒƒˆƒƒƒƒƒƒƒƒˆƒƒƒƒƒƒƒƒˆ 20-34 ‚ 0 ‚ 134 ‚ 174 ‚ 308 ‚ 0.00 ‚ 22.26 ‚ 28.90 ‚ 51.16 ‚ 0.00 ‚ 43.51 ‚ 56.49 ‚ ‚ 0.00 ‚ 47.52 ‚ 55.06 ‚ ƒƒƒƒƒƒƒƒƒˆƒƒƒƒƒƒƒƒˆƒƒƒƒƒƒƒƒˆƒƒƒƒƒƒƒƒˆ 35-44 ‚ 0 ‚ 70 ‚ 86 ‚ 156 ‚ 0.00 ‚ 11.63 ‚ 14.29 ‚ 25.91 ‚ 0.00 ‚ 44.87 ‚ 55.13 ‚ ‚ 0.00 ‚ 24.82 ‚ 27.22 ‚ ƒƒƒƒƒƒƒƒƒˆƒƒƒƒƒƒƒƒˆƒƒƒƒƒƒƒƒˆƒƒƒƒƒƒƒƒˆ 45-54 ‚ 0 ‚ 30 ‚ 25 ‚ 55 ‚ 0.00 ‚ 4.98 ‚ 4.15 ‚ 9.14 ‚ 0.00 ‚ 54.55 ‚ 45.45 ‚ ‚ 0.00 ‚ 10.64 ‚ 7.91 ‚ ƒƒƒƒƒƒƒƒƒˆƒƒƒƒƒƒƒƒˆƒƒƒƒƒƒƒƒˆƒƒƒƒƒƒƒƒˆ 55-64 ‚ 0 ‚ 27 ‚ 7 ‚ 34 ‚ 0.00 ‚ 4.49 ‚ 1.16 ‚ 5.65 ‚ 0.00 ‚ 79.41 ‚ 20.59 ‚ ‚ 0.00 ‚ 9.57 ‚ 2.22 ‚ ƒƒƒƒƒƒƒƒƒˆƒƒƒƒƒƒƒƒˆƒƒƒƒƒƒƒƒˆƒƒƒƒƒƒƒƒˆ 65+ ‚ 1 ‚ 15 ‚ 5 ‚ 21 ‚ 0.17 ‚ 2.49 ‚ 0.83 ‚ 3.49 ‚ 4.76 ‚ 71.43 ‚ 23.81 ‚ ‚ 25.00 ‚ 5.32 ‚ 1.58 ‚ ƒƒƒƒƒƒƒƒƒˆƒƒƒƒƒƒƒƒˆƒƒƒƒƒƒƒƒˆƒƒƒƒƒƒƒƒˆ Total 4 282 316 602 0.66 46.84 52.49 100.00
APPENDIX 3
Table 3.2.8. Respondents by age, gender and country Luxenbourg
Age Gender
Frequency‚Percent ‚ Row Pct ‚ Col Pct ‚Missing ‚Male ‚Female ‚ Total ƒƒƒƒƒƒƒƒƒˆƒƒƒƒƒƒƒƒˆƒƒƒƒƒƒƒƒˆƒƒƒƒƒƒƒƒˆ Missing ‚ 0 ‚ 0 ‚ 0 ‚ 0 ‚ 0.00 ‚ 0.00 ‚ 0.00 ‚ 0.00 ‚ . ‚ . ‚ . ‚ ‚ . ‚ 0.00 ‚ 0.00 ‚ ƒƒƒƒƒƒƒƒƒˆƒƒƒƒƒƒƒƒˆƒƒƒƒƒƒƒƒˆƒƒƒƒƒƒƒƒˆ 20-34 ‚ 0 ‚ 7 ‚ 20 ‚ 27 ‚ 0.00 ‚ 9.33 ‚ 26.67 ‚ 36.00 ‚ 0.00 ‚ 25.93 ‚ 74.07 ‚ ‚ . ‚ 20.00 ‚ 50.00 ‚ ƒƒƒƒƒƒƒƒƒˆƒƒƒƒƒƒƒƒˆƒƒƒƒƒƒƒƒˆƒƒƒƒƒƒƒƒˆ 35-44 ‚ 0 ‚ 9 ‚ 14 ‚ 23 ‚ 0.00 ‚ 12.00 ‚ 18.67 ‚ 30.67 ‚ 0.00 ‚ 39.13 ‚ 60.87 ‚ ‚ . ‚ 25.71 ‚ 35.00 ‚ ƒƒƒƒƒƒƒƒƒˆƒƒƒƒƒƒƒƒˆƒƒƒƒƒƒƒƒˆƒƒƒƒƒƒƒƒˆ 45-54 ‚ 0 ‚ 13 ‚ 6 ‚ 19 ‚ 0.00 ‚ 17.33 ‚ 8.00 ‚ 25.33 ‚ 0.00 ‚ 68.42 ‚ 31.58 ‚ ‚ . ‚ 37.14 ‚ 15.00 ‚ ƒƒƒƒƒƒƒƒƒˆƒƒƒƒƒƒƒƒˆƒƒƒƒƒƒƒƒˆƒƒƒƒƒƒƒƒˆ 55-64 ‚ 0 ‚ 5 ‚ 0 ‚ 5 ‚ 0.00 ‚ 6.67 ‚ 0.00 ‚ 6.67 ‚ 0.00 ‚ 100.00 ‚ 0.00 ‚ ‚ . ‚ 14.29 ‚ 0.00 ‚ ƒƒƒƒƒƒƒƒƒˆƒƒƒƒƒƒƒƒˆƒƒƒƒƒƒƒƒˆƒƒƒƒƒƒƒƒˆ 65+ ‚ 0 ‚ 1 ‚ 0 ‚ 1 ‚ 0.00 ‚ 1.33 ‚ 0.00 ‚ 1.33 ‚ 0.00 ‚ 100.00 ‚ 0.00 ‚ ‚ . ‚ 2.86 ‚ 0.00 ‚ ƒƒƒƒƒƒƒƒƒˆƒƒƒƒƒƒƒƒˆƒƒƒƒƒƒƒƒˆƒƒƒƒƒƒƒƒˆ Total 0 35 40 75 0.00 46.67 53.33 100.00
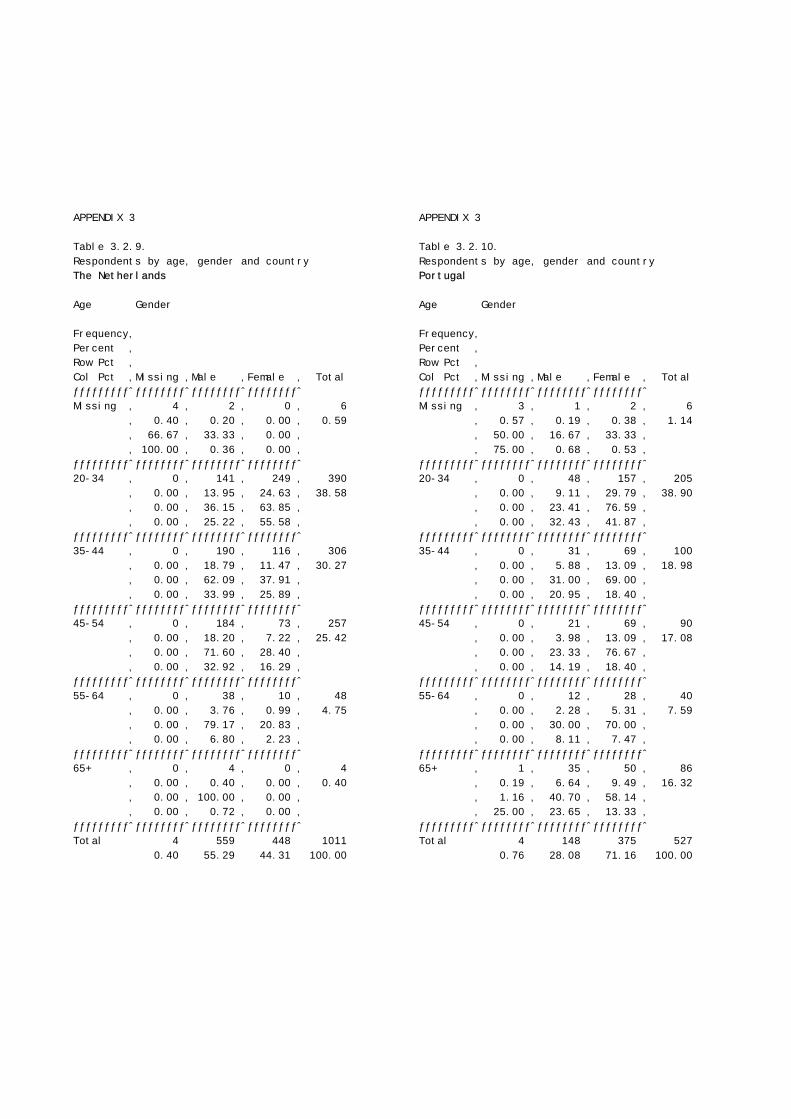
APPENDIX 3
Table 3.2.9. Respondents by age, gender and country The Netherlands
Age Gender
Frequency‚Percent ‚ Row Pct ‚ Col Pct ‚Missing ‚Male ‚Female ‚ Total ƒƒƒƒƒƒƒƒƒˆƒƒƒƒƒƒƒƒˆƒƒƒƒƒƒƒƒˆƒƒƒƒƒƒƒƒˆ Missing ‚ 4 ‚ 2 ‚ 0 ‚ 6 ‚ 0.40 ‚ 0.20 ‚ 0.00 ‚ 0.59 ‚ 66.67 ‚ 33.33 ‚ 0.00 ‚ ‚ 100.00 ‚ 0.36 ‚ 0.00 ‚ ƒƒƒƒƒƒƒƒƒˆƒƒƒƒƒƒƒƒˆƒƒƒƒƒƒƒƒˆƒƒƒƒƒƒƒƒˆ 20-34 ‚ 0 ‚ 141 ‚ 249 ‚ 390 ‚ 0.00 ‚ 13.95 ‚ 24.63 ‚ 38.58 ‚ 0.00 ‚ 36.15 ‚ 63.85 ‚ ‚ 0.00 ‚ 25.22 ‚ 55.58 ‚ ƒƒƒƒƒƒƒƒƒˆƒƒƒƒƒƒƒƒˆƒƒƒƒƒƒƒƒˆƒƒƒƒƒƒƒƒˆ 35-44 ‚ 0 ‚ 190 ‚ 116 ‚ 306 ‚ 0.00 ‚ 18.79 ‚ 11.47 ‚ 30.27 ‚ 0.00 ‚ 62.09 ‚ 37.91 ‚ ‚ 0.00 ‚ 33.99 ‚ 25.89 ‚ ƒƒƒƒƒƒƒƒƒˆƒƒƒƒƒƒƒƒˆƒƒƒƒƒƒƒƒˆƒƒƒƒƒƒƒƒˆ 45-54 ‚ 0 ‚ 184 ‚ 73 ‚ 257 ‚ 0.00 ‚ 18.20 ‚ 7.22 ‚ 25.42 ‚ 0.00 ‚ 71.60 ‚ 28.40 ‚ ‚ 0.00 ‚ 32.92 ‚ 16.29 ‚ ƒƒƒƒƒƒƒƒƒˆƒƒƒƒƒƒƒƒˆƒƒƒƒƒƒƒƒˆƒƒƒƒƒƒƒƒˆ 55-64 ‚ 0 ‚ 38 ‚ 10 ‚ 48 ‚ 0.00 ‚ 3.76 ‚ 0.99 ‚ 4.75 ‚ 0.00 ‚ 79.17 ‚ 20.83 ‚ ‚ 0.00 ‚ 6.80 ‚ 2.23 ‚ ƒƒƒƒƒƒƒƒƒˆƒƒƒƒƒƒƒƒˆƒƒƒƒƒƒƒƒˆƒƒƒƒƒƒƒƒˆ 65+ ‚ 0 ‚ 4 ‚ 0 ‚ 4 ‚ 0.00 ‚ 0.40 ‚ 0.00 ‚ 0.40 ‚ 0.00 ‚ 100.00 ‚ 0.00 ‚ ‚ 0.00 ‚ 0.72 ‚ 0.00 ‚ ƒƒƒƒƒƒƒƒƒˆƒƒƒƒƒƒƒƒˆƒƒƒƒƒƒƒƒˆƒƒƒƒƒƒƒƒˆ Total 4 559 448 1011 0.40 55.29 44.31 100.00
APPENDIX 3
Table 3.2.10. Respondents by age, gender and country Portugal
Age Gender
Frequency‚Percent ‚ Row Pct ‚ Col Pct ‚Missing ‚Male ‚Female ‚ Total ƒƒƒƒƒƒƒƒƒˆƒƒƒƒƒƒƒƒˆƒƒƒƒƒƒƒƒˆƒƒƒƒƒƒƒƒˆ Missing ‚ 3 ‚ 1 ‚ 2 ‚ 6 ‚ 0.57 ‚ 0.19 ‚ 0.38 ‚ 1.14 ‚ 50.00 ‚ 16.67 ‚ 33.33 ‚ ‚ 75.00 ‚ 0.68 ‚ 0.53 ‚ ƒƒƒƒƒƒƒƒƒˆƒƒƒƒƒƒƒƒˆƒƒƒƒƒƒƒƒˆƒƒƒƒƒƒƒƒˆ 20-34 ‚ 0 ‚ 48 ‚ 157 ‚ 205 ‚ 0.00 ‚ 9.11 ‚ 29.79 ‚ 38.90 ‚ 0.00 ‚ 23.41 ‚ 76.59 ‚ ‚ 0.00 ‚ 32.43 ‚ 41.87 ‚ ƒƒƒƒƒƒƒƒƒˆƒƒƒƒƒƒƒƒˆƒƒƒƒƒƒƒƒˆƒƒƒƒƒƒƒƒˆ 35-44 ‚ 0 ‚ 31 ‚ 69 ‚ 100 ‚ 0.00 ‚ 5.88 ‚ 13.09 ‚ 18.98 ‚ 0.00 ‚ 31.00 ‚ 69.00 ‚ ‚ 0.00 ‚ 20.95 ‚ 18.40 ‚ ƒƒƒƒƒƒƒƒƒˆƒƒƒƒƒƒƒƒˆƒƒƒƒƒƒƒƒˆƒƒƒƒƒƒƒƒˆ 45-54 ‚ 0 ‚ 21 ‚ 69 ‚ 90 ‚ 0.00 ‚ 3.98 ‚ 13.09 ‚ 17.08 ‚ 0.00 ‚ 23.33 ‚ 76.67 ‚ ‚ 0.00 ‚ 14.19 ‚ 18.40 ‚ ƒƒƒƒƒƒƒƒƒˆƒƒƒƒƒƒƒƒˆƒƒƒƒƒƒƒƒˆƒƒƒƒƒƒƒƒˆ 55-64 ‚ 0 ‚ 12 ‚ 28 ‚ 40 ‚ 0.00 ‚ 2.28 ‚ 5.31 ‚ 7.59 ‚ 0.00 ‚ 30.00 ‚ 70.00 ‚ ‚ 0.00 ‚ 8.11 ‚ 7.47 ‚ ƒƒƒƒƒƒƒƒƒˆƒƒƒƒƒƒƒƒˆƒƒƒƒƒƒƒƒˆƒƒƒƒƒƒƒƒˆ 65+ ‚ 1 ‚ 35 ‚ 50 ‚ 86 ‚ 0.19 ‚ 6.64 ‚ 9.49 ‚ 16.32 ‚ 1.16 ‚ 40.70 ‚ 58.14 ‚ ‚ 25.00 ‚ 23.65 ‚ 13.33 ‚ ƒƒƒƒƒƒƒƒƒˆƒƒƒƒƒƒƒƒˆƒƒƒƒƒƒƒƒˆƒƒƒƒƒƒƒƒˆ Total 4 148 375 527 0.76 28.08 71.16 100.00
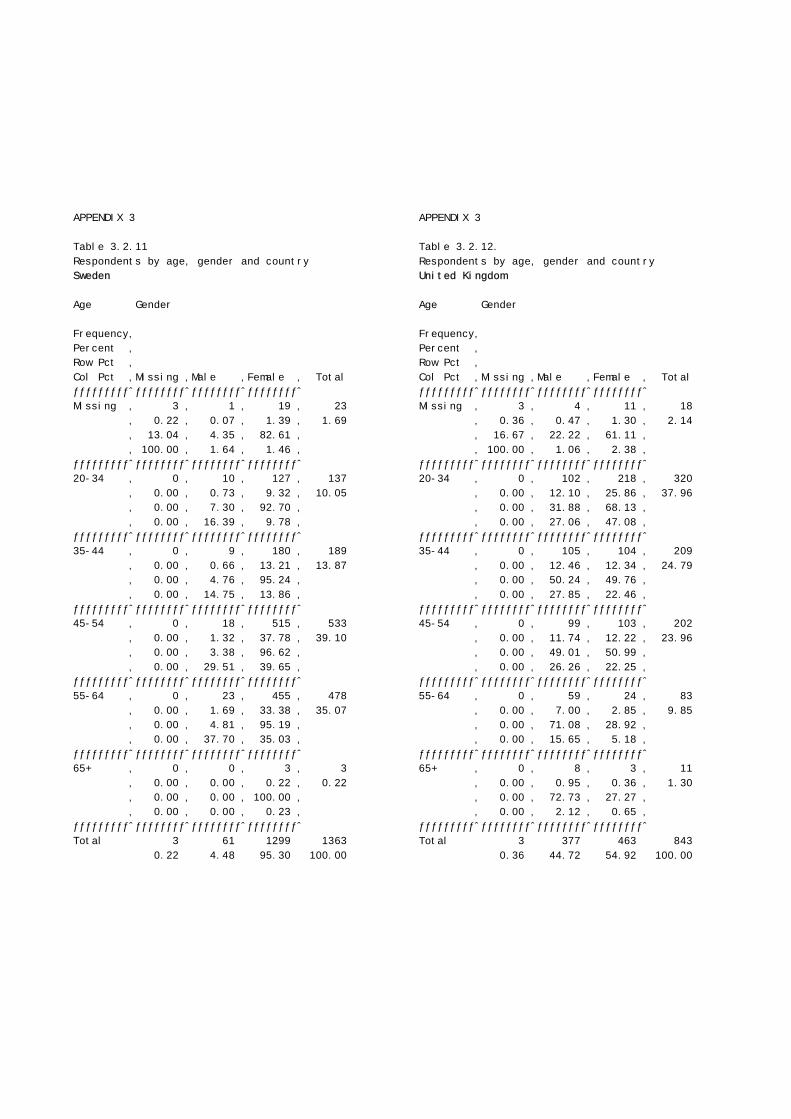
APPENDIX 3
Table 3.2.11 Respondents by age, gender and country Sweden
Age Gender
Frequency‚Percent ‚ Row Pct ‚ Col Pct ‚Missing ‚Male ‚Female ‚ Total ƒƒƒƒƒƒƒƒƒˆƒƒƒƒƒƒƒƒˆƒƒƒƒƒƒƒƒˆƒƒƒƒƒƒƒƒˆ Missing ‚ 3 ‚ 1 ‚ 19 ‚ 23 ‚ 0.22 ‚ 0.07 ‚ 1.39 ‚ 1.69 ‚ 13.04 ‚ 4.35 ‚ 82.61 ‚ ‚ 100.00 ‚ 1.64 ‚ 1.46 ‚ ƒƒƒƒƒƒƒƒƒˆƒƒƒƒƒƒƒƒˆƒƒƒƒƒƒƒƒˆƒƒƒƒƒƒƒƒˆ 20-34 ‚ 0 ‚ 10 ‚ 127 ‚ 137 ‚ 0.00 ‚ 0.73 ‚ 9.32 ‚ 10.05 ‚ 0.00 ‚ 7.30 ‚ 92.70 ‚ ‚ 0.00 ‚ 16.39 ‚ 9.78 ‚ ƒƒƒƒƒƒƒƒƒˆƒƒƒƒƒƒƒƒˆƒƒƒƒƒƒƒƒˆƒƒƒƒƒƒƒƒˆ 35-44 ‚ 0 ‚ 9 ‚ 180 ‚ 189 ‚ 0.00 ‚ 0.66 ‚ 13.21 ‚ 13.87 ‚ 0.00 ‚ 4.76 ‚ 95.24 ‚ ‚ 0.00 ‚ 14.75 ‚ 13.86 ‚ ƒƒƒƒƒƒƒƒƒˆƒƒƒƒƒƒƒƒˆƒƒƒƒƒƒƒƒˆƒƒƒƒƒƒƒƒˆ 45-54 ‚ 0 ‚ 18 ‚ 515 ‚ 533 ‚ 0.00 ‚ 1.32 ‚ 37.78 ‚ 39.10 ‚ 0.00 ‚ 3.38 ‚ 96.62 ‚ ‚ 0.00 ‚ 29.51 ‚ 39.65 ‚ ƒƒƒƒƒƒƒƒƒˆƒƒƒƒƒƒƒƒˆƒƒƒƒƒƒƒƒˆƒƒƒƒƒƒƒƒˆ 55-64 ‚ 0 ‚ 23 ‚ 455 ‚ 478 ‚ 0.00 ‚ 1.69 ‚ 33.38 ‚ 35.07 ‚ 0.00 ‚ 4.81 ‚ 95.19 ‚ ‚ 0.00 ‚ 37.70 ‚ 35.03 ‚ ƒƒƒƒƒƒƒƒƒˆƒƒƒƒƒƒƒƒˆƒƒƒƒƒƒƒƒˆƒƒƒƒƒƒƒƒˆ 65+ ‚ 0 ‚ 0 ‚ 3 ‚ 3 ‚ 0.00 ‚ 0.00 ‚ 0.22 ‚ 0.22 ‚ 0.00 ‚ 0.00 ‚ 100.00 ‚ ‚ 0.00 ‚ 0.00 ‚ 0.23 ‚ ƒƒƒƒƒƒƒƒƒˆƒƒƒƒƒƒƒƒˆƒƒƒƒƒƒƒƒˆƒƒƒƒƒƒƒƒˆ Total 3 61 1299 1363 0.22 4.48 95.30 100.00
APPENDIX 3
Table 3.2.12. Respondents by age, gender and country United Kingdom
Age Gender
Frequency‚Percent ‚ Row Pct ‚ Col Pct ‚Missing ‚Male ‚Female ‚ Total ƒƒƒƒƒƒƒƒƒˆƒƒƒƒƒƒƒƒˆƒƒƒƒƒƒƒƒˆƒƒƒƒƒƒƒƒˆ Missing ‚ 3 ‚ 4 ‚ 11 ‚ 18 ‚ 0.36 ‚ 0.47 ‚ 1.30 ‚ 2.14 ‚ 16.67 ‚ 22.22 ‚ 61.11 ‚ ‚ 100.00 ‚ 1.06 ‚ 2.38 ‚ ƒƒƒƒƒƒƒƒƒˆƒƒƒƒƒƒƒƒˆƒƒƒƒƒƒƒƒˆƒƒƒƒƒƒƒƒˆ 20-34 ‚ 0 ‚ 102 ‚ 218 ‚ 320 ‚ 0.00 ‚ 12.10 ‚ 25.86 ‚ 37.96 ‚ 0.00 ‚ 31.88 ‚ 68.13 ‚ ‚ 0.00 ‚ 27.06 ‚ 47.08 ‚ ƒƒƒƒƒƒƒƒƒˆƒƒƒƒƒƒƒƒˆƒƒƒƒƒƒƒƒˆƒƒƒƒƒƒƒƒˆ 35-44 ‚ 0 ‚ 105 ‚ 104 ‚ 209 ‚ 0.00 ‚ 12.46 ‚ 12.34 ‚ 24.79 ‚ 0.00 ‚ 50.24 ‚ 49.76 ‚ ‚ 0.00 ‚ 27.85 ‚ 22.46 ‚ ƒƒƒƒƒƒƒƒƒˆƒƒƒƒƒƒƒƒˆƒƒƒƒƒƒƒƒˆƒƒƒƒƒƒƒƒˆ 45-54 ‚ 0 ‚ 99 ‚ 103 ‚ 202 ‚ 0.00 ‚ 11.74 ‚ 12.22 ‚ 23.96 ‚ 0.00 ‚ 49.01 ‚ 50.99 ‚ ‚ 0.00 ‚ 26.26 ‚ 22.25 ‚ ƒƒƒƒƒƒƒƒƒˆƒƒƒƒƒƒƒƒˆƒƒƒƒƒƒƒƒˆƒƒƒƒƒƒƒƒˆ 55-64 ‚ 0 ‚ 59 ‚ 24 ‚ 83 ‚ 0.00 ‚ 7.00 ‚ 2.85 ‚ 9.85 ‚ 0.00 ‚ 71.08 ‚ 28.92 ‚ ‚ 0.00 ‚ 15.65 ‚ 5.18 ‚ ƒƒƒƒƒƒƒƒƒˆƒƒƒƒƒƒƒƒˆƒƒƒƒƒƒƒƒˆƒƒƒƒƒƒƒƒˆ 65+ ‚ 0 ‚ 8 ‚ 3 ‚ 11 ‚ 0.00 ‚ 0.95 ‚ 0.36 ‚ 1.30 ‚ 0.00 ‚ 72.73 ‚ 27.27 ‚ ‚ 0.00 ‚ 2.12 ‚ 0.65 ‚ ƒƒƒƒƒƒƒƒƒˆƒƒƒƒƒƒƒƒˆƒƒƒƒƒƒƒƒˆƒƒƒƒƒƒƒƒˆ Total 3 377 463 843 0.36 44.72 54.92 100.00
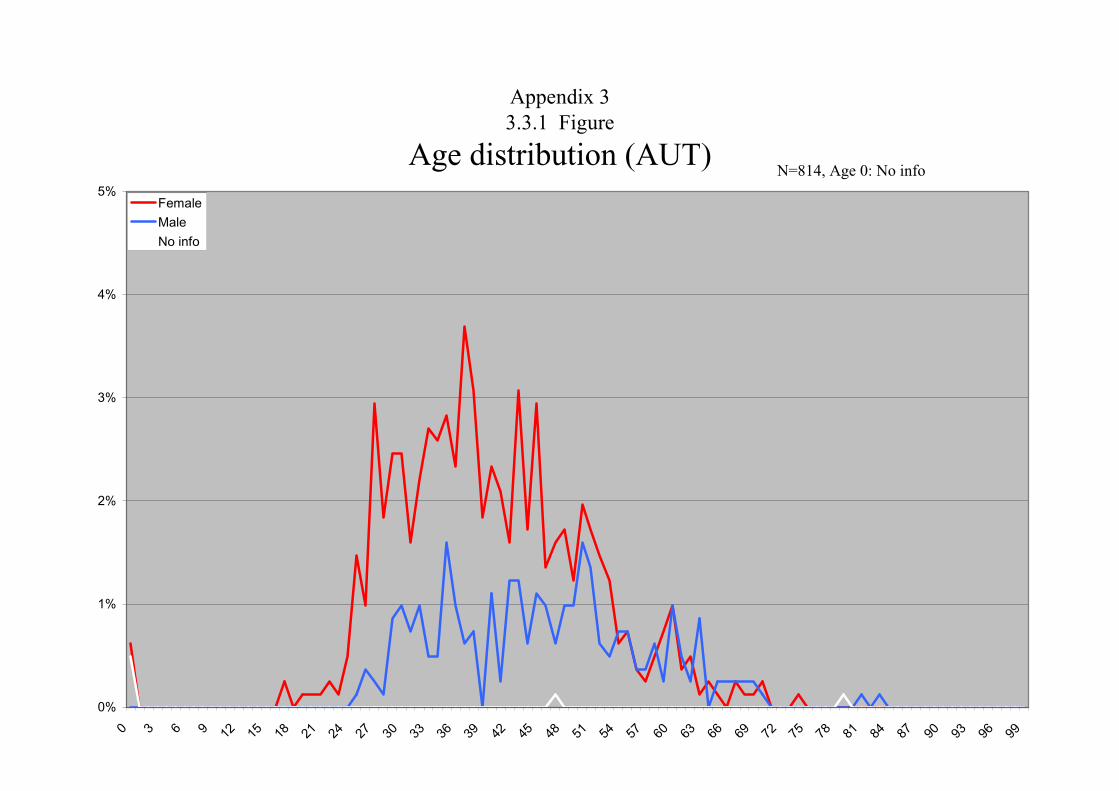
Appendix 33.3.1 Figure
Age distribution (AUT)N=814, Age 0: No info
0%
1%
2%
3%
4%
5%
0 3 6 9 12 15 18 21 24 27 30 33 36 39 42 45 48 51 54 57 60 63 66 69 72 75 78 81 84 87 90 93 96 99
Female
Male
No info

Appendix 33.3.2 Figure
Age distribution (BEL)n=438, Age 0: No info
0%
1%
2%
3%
4%
5%
0 3 6 9 12 15 18 21 24 27 30 33 36 39 42 45 48 51 54 57 60 63 66 69 72 75 78 81 84 87 90 93 96 99
Female
Male
No info
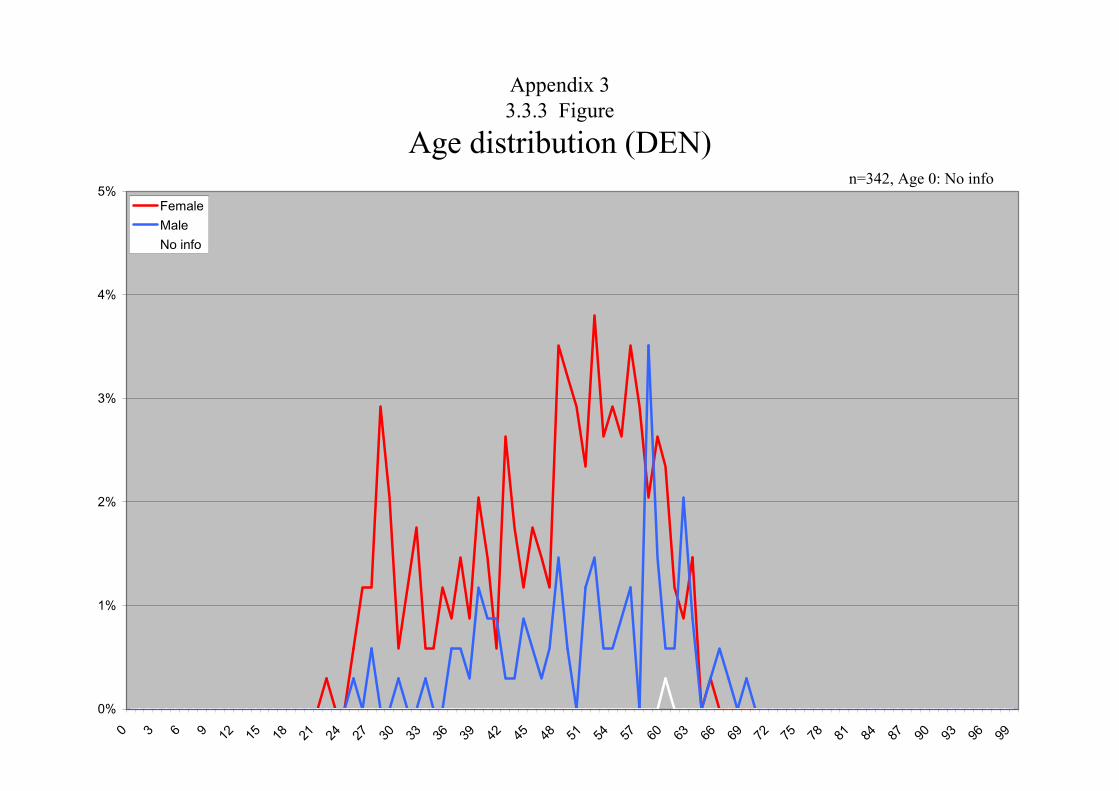
Appendix 33.3.3 Figure
Age distribution (DEN)n=342, Age 0: No info
0%
1%
2%
3%
4%
5%
0 3 6 9 12 15 18 21 24 27 30 33 36 39 42 45 48 51 54 57 60 63 66 69 72 75 78 81 84 87 90 93 96 99
Female
Male
No info

Appendix 33.3.4 Figure
Age distribution (DEU) n=734, Age 0: No info
0%
1%
2%
3%
4%
5%
0 3 6 9 12 15 18 21 24 27 30 33 36 39 42 45 48 51 54 57 60 63 66 69 72 75 78 81 84 87 90 93 96 99
Female
Male
No info
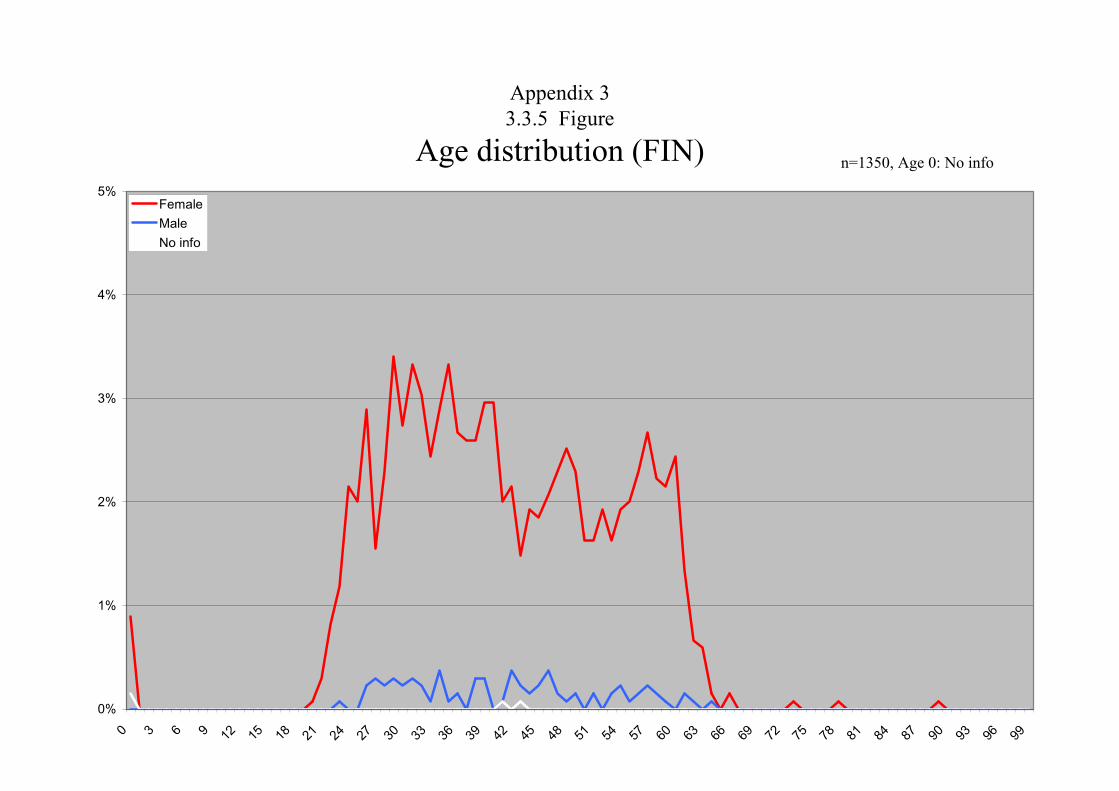
Appendix 33.3.5 Figure
Age distribution (FIN) n=1350, Age 0: No info
0%
1%
2%
3%
4%
5%
0 3 6 9 12 15 18 21 24 27 30 33 36 39 42 45 48 51 54 57 60 63 66 69 72 75 78 81 84 87 90 93 96 99
Female
Male
No info

Appendix 33.3.6 Figure
Age distribution (FRA) n=789, Age 0: No info
0%
1%
2%
3%
4%
5%
0 3 6 9 12 15 18 21 24 27 30 33 36 39 42 45 48 51 54 57 60 63 66 69 72 75 78 81 84 87 90 93 96 99
Female
Male
No info
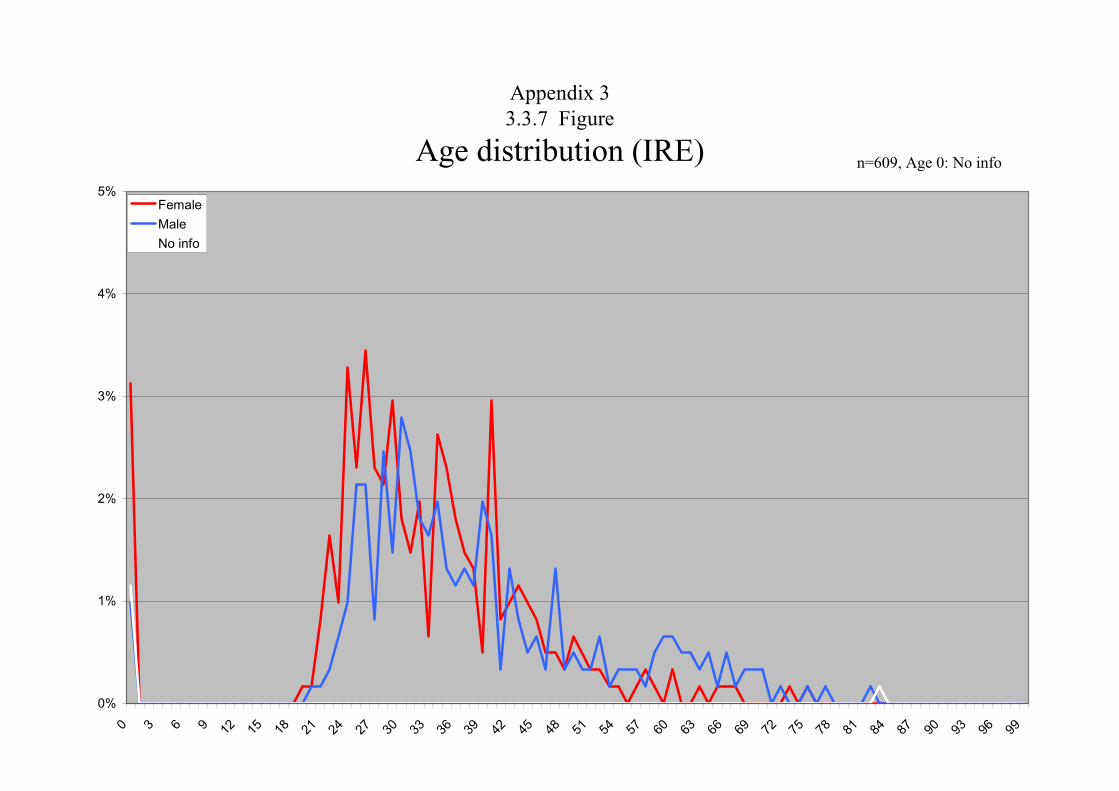
Appendix 33.3.7 Figure
Age distribution (IRE) n=609, Age 0: No info
0%
1%
2%
3%
4%
5%
0 3 6 9 12 15 18 21 24 27 30 33 36 39 42 45 48 51 54 57 60 63 66 69 72 75 78 81 84 87 90 93 96 99
Female
Male
No info
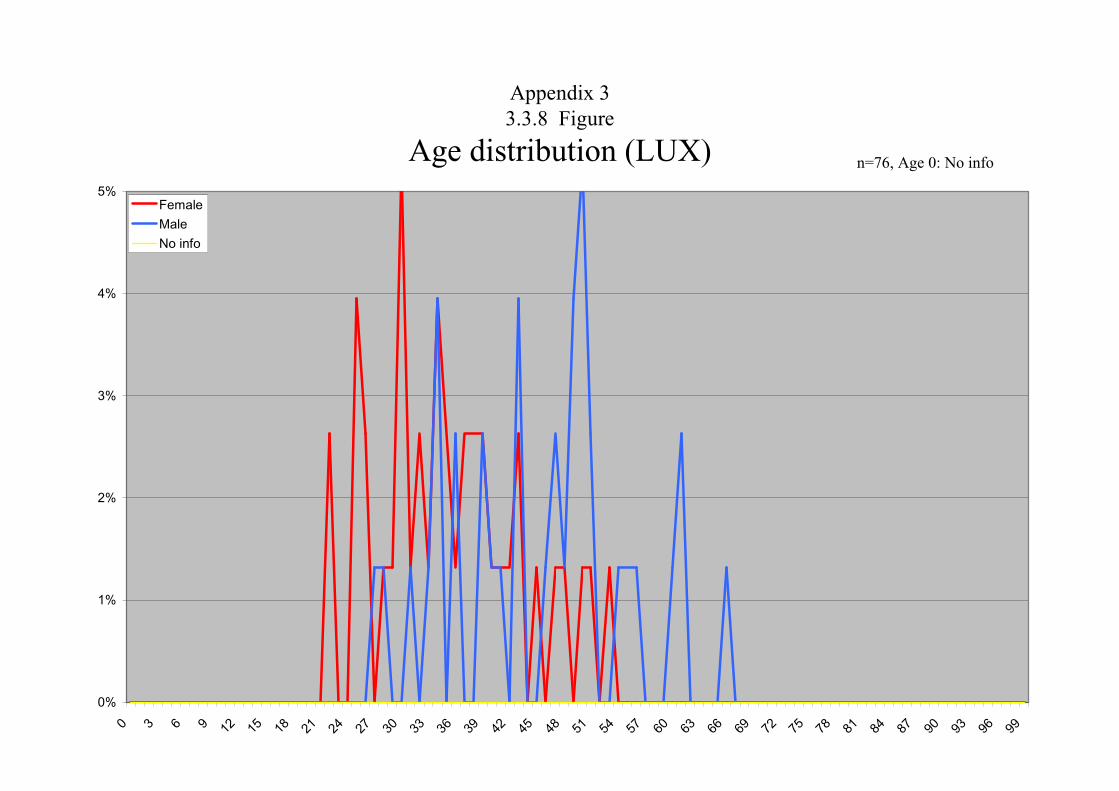
Appendix 33.3.8 Figure
Age distribution (LUX) n=76, Age 0: No info
0%
1%
2%
3%
4%
5%
0 3 6 9 12 15 18 21 24 27 30 33 36 39 42 45 48 51 54 57 60 63 66 69 72 75 78 81 84 87 90 93 96 99
Female
Male
No info

Appendix 33.3.9 Figure
Age distribution (NET) n=1014, Age 0: No info
0%
1%
2%
3%
4%
5%
0 3 6 9 12 15 18 21 24 27 30 33 36 39 42 45 48 51 54 57 60 63 66 69 72 75 78 81 84 87 90 93 96 99
Female
Male
No info
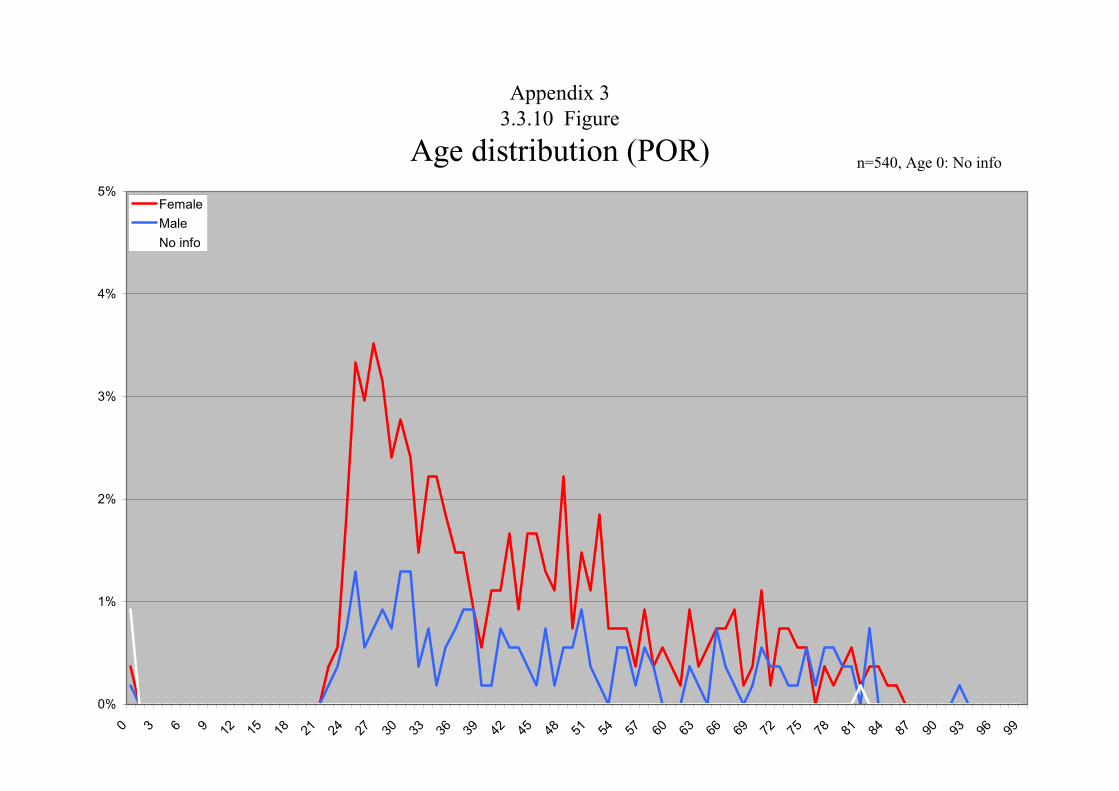
Appendix 33.3.10 Figure
Age distribution (POR) n=540, Age 0: No info
0%
1%
2%
3%
4%
5%
0 3 6 9 12 15 18 21 24 27 30 33 36 39 42 45 48 51 54 57 60 63 66 69 72 75 78 81 84 87 90 93 96 99
Female
Male
No info

Appendix 33.3.11 Figure
Age distribution (SWE) n=1368, Age 0: No info
0%
1%
2%
3%
4%
5%
6%
7%
8%
0 3 6 9 12 15 18 21 24 27 30 33 36 39 42 45 48 51 54 57 60 63 66 69 72 75 78 81 84 87 90 93 96 99
Female
Male
No info
Please note: different scaling

Appendix 33.3.12 Figure
Age distribution (UNK)n=856, Age 0: No info
0%
1%
2%
3%
4%
5%
0 3 6 9 12 15 18 21 24 27 30 33 36 39 42 45 48 51 54 57 60 63 66 69 72 75 78 81 84 87 90 93 96 99
Female
Male
No info

Appendix 4 Distribution of smoking status by country4 Figure
Do you smoke now?
0%
20%
40%
60%
80%
100%
AUT BEL DEN DEU FIN FRA IRE LUX NET POR SWE UNK
No info
Contradicting
Yes
Stopped
No
814 438 342 734 1350 789 609 76 1014 540 1368 856

APPENDIX 5 Table 5.2.Tobacco consumption among the smokers
„ƒƒƒƒƒƒƒƒƒƒƒƒƒƒƒƒƒƒ…ƒƒƒƒƒƒƒƒƒƒƒƒƒƒƒƒƒƒƒƒƒƒƒƒƒƒƒƒƒƒƒƒƒƒƒƒƒƒƒƒƒƒƒƒƒƒƒƒƒƒƒƒƒƒƒƒƒƒƒƒƒƒ†‚ ‚ Q04_1 ‚‚ ‡ƒƒƒƒƒƒƒƒ…ƒƒƒƒƒƒƒƒ…ƒƒƒƒƒƒƒƒ…ƒƒƒƒƒƒƒƒ…ƒƒƒƒƒƒƒƒ…ƒƒƒƒƒƒƒƒ…ƒƒƒƒƒƒƒƒ‰‚ ‚ ‚Does not‚ ‚ ‚ ‚ ‚ ‚‚ ‚ ‚ smoke ‚ ‚ ‚ ‚ ‚ ‚‚ ‚ ‚cigaret-‚ ‚ ‚ ‚ ‚ ‚‚ ‚Missing ‚ tes ‚ 1-2 ‚ 3-4 ‚ 5-9 ‚ 10-19 ‚ 20+ ‚‡ƒƒƒƒƒƒƒƒ…ƒƒƒƒƒƒƒƒƒˆƒƒƒƒƒƒƒƒ̂ ƒƒƒƒƒƒƒƒˆƒƒƒƒƒƒƒƒˆƒƒƒƒƒƒƒƒˆƒƒƒƒƒƒƒƒˆƒƒƒƒƒƒƒƒˆƒƒƒƒƒƒƒƒ‰‚Country ‚ ‚ ‚ ‚ ‚ ‚ ‚ ‚ ‚‡ƒƒƒƒƒƒƒƒˆƒƒƒƒƒƒƒƒƒ‰ ‚ ‚ ‚ ‚ ‚ ‚ ‚‚AUT ‚N ‚ 8‚ 17‚ 17‚ 7‚ 20‚ 37‚ 37‚‚ ‡ƒƒƒƒƒƒƒƒƒˆƒƒƒƒƒƒƒƒˆƒƒƒƒƒƒƒƒˆƒƒƒƒƒƒƒƒˆƒƒƒƒƒƒƒƒˆƒƒƒƒƒƒƒƒˆƒƒƒƒƒƒƒƒˆƒƒƒƒƒƒƒƒ‰‚ ‚RowPctN ‚ 5.6‚ 11.9‚ 11.9‚ 4.9‚ 14.0‚ 25.9‚ 25.9‚‡ƒƒƒƒƒƒƒƒˆƒƒƒƒƒƒƒƒƒˆƒƒƒƒƒƒƒƒˆƒƒƒƒƒƒƒƒˆƒƒƒƒƒƒƒƒˆƒƒƒƒƒƒƒƒˆƒƒƒƒƒƒƒƒˆƒƒƒƒƒƒƒƒˆƒƒƒƒƒƒƒƒ‰‚BEL ‚N ‚ 2‚ 10‚ 4‚ 2‚ 5‚ 12‚ 11‚‚ ‡ƒƒƒƒƒƒƒƒƒˆƒƒƒƒƒƒƒƒˆƒƒƒƒƒƒƒƒˆƒƒƒƒƒƒƒƒˆƒƒƒƒƒƒƒƒˆƒƒƒƒƒƒƒƒˆƒƒƒƒƒƒƒƒˆƒƒƒƒƒƒƒƒ‰‚ ‚RowPctN ‚ 4.3‚ 21.7‚ 8.7‚ 4.3‚ 10.9‚ 26.1‚ 23.9‚‡ƒƒƒƒƒƒƒƒˆƒƒƒƒƒƒƒƒƒˆƒƒƒƒƒƒƒƒˆƒƒƒƒƒƒƒƒˆƒƒƒƒƒƒƒƒˆƒƒƒƒƒƒƒƒˆƒƒƒƒƒƒƒƒˆƒƒƒƒƒƒƒƒˆƒƒƒƒƒƒƒƒ‰‚DEN ‚N ‚ 2‚ 8‚ 8‚ 2‚ 4‚ 11‚ 8‚‚ ‡ƒƒƒƒƒƒƒƒƒˆƒƒƒƒƒƒƒƒˆƒƒƒƒƒƒƒƒˆƒƒƒƒƒƒƒƒˆƒƒƒƒƒƒƒƒˆƒƒƒƒƒƒƒƒˆƒƒƒƒƒƒƒƒˆƒƒƒƒƒƒƒƒ‰‚ ‚RowPctN ‚ 4.7‚ 18.6‚ 18.6‚ 4.7‚ 9.3‚ 25.6‚ 18.6‚‡ƒƒƒƒƒƒƒƒˆƒƒƒƒƒƒƒƒƒˆƒƒƒƒƒƒƒƒˆƒƒƒƒƒƒƒƒˆƒƒƒƒƒƒƒƒˆƒƒƒƒƒƒƒƒˆƒƒƒƒƒƒƒƒˆƒƒƒƒƒƒƒƒˆƒƒƒƒƒƒƒƒ‰‚DEU ‚N ‚ 6‚ 13‚ 9‚ 3‚ 14‚ 18‚ 28‚‚ ‡ƒƒƒƒƒƒƒƒƒˆƒƒƒƒƒƒƒƒˆƒƒƒƒƒƒƒƒˆƒƒƒƒƒƒƒƒˆƒƒƒƒƒƒƒƒˆƒƒƒƒƒƒƒƒˆƒƒƒƒƒƒƒƒˆƒƒƒƒƒƒƒƒ‰‚ ‚RowPctN ‚ 6.6‚ 14.3‚ 9.9‚ 3.3‚ 15.4‚ 19.8‚ 30.8‚‡ƒƒƒƒƒƒƒƒˆƒƒƒƒƒƒƒƒƒˆƒƒƒƒƒƒƒƒˆƒƒƒƒƒƒƒƒˆƒƒƒƒƒƒƒƒˆƒƒƒƒƒƒƒƒˆƒƒƒƒƒƒƒƒˆƒƒƒƒƒƒƒƒˆƒƒƒƒƒƒƒƒ‰‚FIN ‚N ‚ 10‚ 5‚ 19‚ 6‚ 14‚ 29‚ 14‚‚ ‡ƒƒƒƒƒƒƒƒƒˆƒƒƒƒƒƒƒƒˆƒƒƒƒƒƒƒƒˆƒƒƒƒƒƒƒƒˆƒƒƒƒƒƒƒƒˆƒƒƒƒƒƒƒƒˆƒƒƒƒƒƒƒƒˆƒƒƒƒƒƒƒƒ‰‚ ‚RowPctN ‚ 10.3‚ 5.2‚ 19.6‚ 6.2‚ 14.4‚ 29.9‚ 14.4‚‡ƒƒƒƒƒƒƒƒˆƒƒƒƒƒƒƒƒƒˆƒƒƒƒƒƒƒƒˆƒƒƒƒƒƒƒƒˆƒƒƒƒƒƒƒƒˆƒƒƒƒƒƒƒƒˆƒƒƒƒƒƒƒƒˆƒƒƒƒƒƒƒƒˆƒƒƒƒƒƒƒƒ‰‚FRA ‚N ‚ 10‚ 12‚ 11‚ 5‚ 25‚ 36‚ 20‚‚ ‡ƒƒƒƒƒƒƒƒƒˆƒƒƒƒƒƒƒƒˆƒƒƒƒƒƒƒƒˆƒƒƒƒƒƒƒƒˆƒƒƒƒƒƒƒƒˆƒƒƒƒƒƒƒƒˆƒƒƒƒƒƒƒƒˆƒƒƒƒƒƒƒƒ‰‚ ‚RowPctN ‚ 8.4‚ 10.1‚ 9.2‚ 4.2‚ 21.0‚ 30.3‚ 16.8‚‡ƒƒƒƒƒƒƒƒˆƒƒƒƒƒƒƒƒƒˆƒƒƒƒƒƒƒƒˆƒƒƒƒƒƒƒƒˆƒƒƒƒƒƒƒƒˆƒƒƒƒƒƒƒƒˆƒƒƒƒƒƒƒƒˆƒƒƒƒƒƒƒƒˆƒƒƒƒƒƒƒƒ‰‚IRE ‚N ‚ 7‚ 8‚ 8‚ 7‚ 9‚ 27‚ 26‚‚ ‡ƒƒƒƒƒƒƒƒƒˆƒƒƒƒƒƒƒƒˆƒƒƒƒƒƒƒƒˆƒƒƒƒƒƒƒƒˆƒƒƒƒƒƒƒƒˆƒƒƒƒƒƒƒƒˆƒƒƒƒƒƒƒƒˆƒƒƒƒƒƒƒƒ‰‚ ‚RowPctN ‚ 7.6‚ 8.7‚ 8.7‚ 7.6‚ 9.8‚ 29.3‚ 28.3‚‡ƒƒƒƒƒƒƒƒˆƒƒƒƒƒƒƒƒƒˆƒƒƒƒƒƒƒƒˆƒƒƒƒƒƒƒƒˆƒƒƒƒƒƒƒƒˆƒƒƒƒƒƒƒƒˆƒƒƒƒƒƒƒƒˆƒƒƒƒƒƒƒƒˆƒƒƒƒƒƒƒƒ‰‚LUX ‚N ‚ 2‚ .‚ .‚ 2‚ 2‚ 3‚ 5‚‚ ‡ƒƒƒƒƒƒƒƒƒˆƒƒƒƒƒƒƒƒˆƒƒƒƒƒƒƒƒˆƒƒƒƒƒƒƒƒˆƒƒƒƒƒƒƒƒˆƒƒƒƒƒƒƒƒˆƒƒƒƒƒƒƒƒˆƒƒƒƒƒƒƒƒ‰‚ ‚RowPctN ‚ 14.3‚ .‚ .‚ 14.3‚ 14.3‚ 21.4‚ 35.7‚‡ƒƒƒƒƒƒƒƒˆƒƒƒƒƒƒƒƒƒˆƒƒƒƒƒƒƒƒˆƒƒƒƒƒƒƒƒˆƒƒƒƒƒƒƒƒˆƒƒƒƒƒƒƒƒˆƒƒƒƒƒƒƒƒˆƒƒƒƒƒƒƒƒˆƒƒƒƒƒƒƒƒ‰‚NET ‚N ‚ 8‚ 61‚ 11‚ 10‚ 16‚ 12‚ 12‚‚ ‡ƒƒƒƒƒƒƒƒƒˆƒƒƒƒƒƒƒƒˆƒƒƒƒƒƒƒƒˆƒƒƒƒƒƒƒƒˆƒƒƒƒƒƒƒƒˆƒƒƒƒƒƒƒƒˆƒƒƒƒƒƒƒƒˆƒƒƒƒƒƒƒƒ‰‚ ‚RowPctN ‚ 6.2‚ 46.9‚ 8.5‚ 7.7‚ 12.3‚ 9.2‚ 9.2‚‡ƒƒƒƒƒƒƒƒˆƒƒƒƒƒƒƒƒƒˆƒƒƒƒƒƒƒƒˆƒƒƒƒƒƒƒƒˆƒƒƒƒƒƒƒƒˆƒƒƒƒƒƒƒƒˆƒƒƒƒƒƒƒƒˆƒƒƒƒƒƒƒƒˆƒƒƒƒƒƒƒƒ‰‚POR ‚N ‚ 3‚ 4‚ 4‚ 9‚ 6‚ 18‚ 25‚‚ ‡ƒƒƒƒƒƒƒƒƒˆƒƒƒƒƒƒƒƒˆƒƒƒƒƒƒƒƒˆƒƒƒƒƒƒƒƒˆƒƒƒƒƒƒƒƒˆƒƒƒƒƒƒƒƒˆƒƒƒƒƒƒƒƒˆƒƒƒƒƒƒƒƒ‰‚ ‚RowPctN ‚ 4.3‚ 5.8‚ 5.8‚ 13.0‚ 8.7‚ 26.1‚ 36.2‚Šƒƒƒƒƒƒƒƒ‹ƒƒƒƒƒƒƒƒƒ‹ƒƒƒƒƒƒƒƒ‹ƒƒƒƒƒƒƒƒ‹ƒƒƒƒƒƒƒƒ‹ƒƒƒƒƒƒƒƒ‹ƒƒƒƒƒƒƒƒ‹ƒƒƒƒƒƒƒƒ‹ƒƒƒƒƒƒƒƒŒ
(Continued)
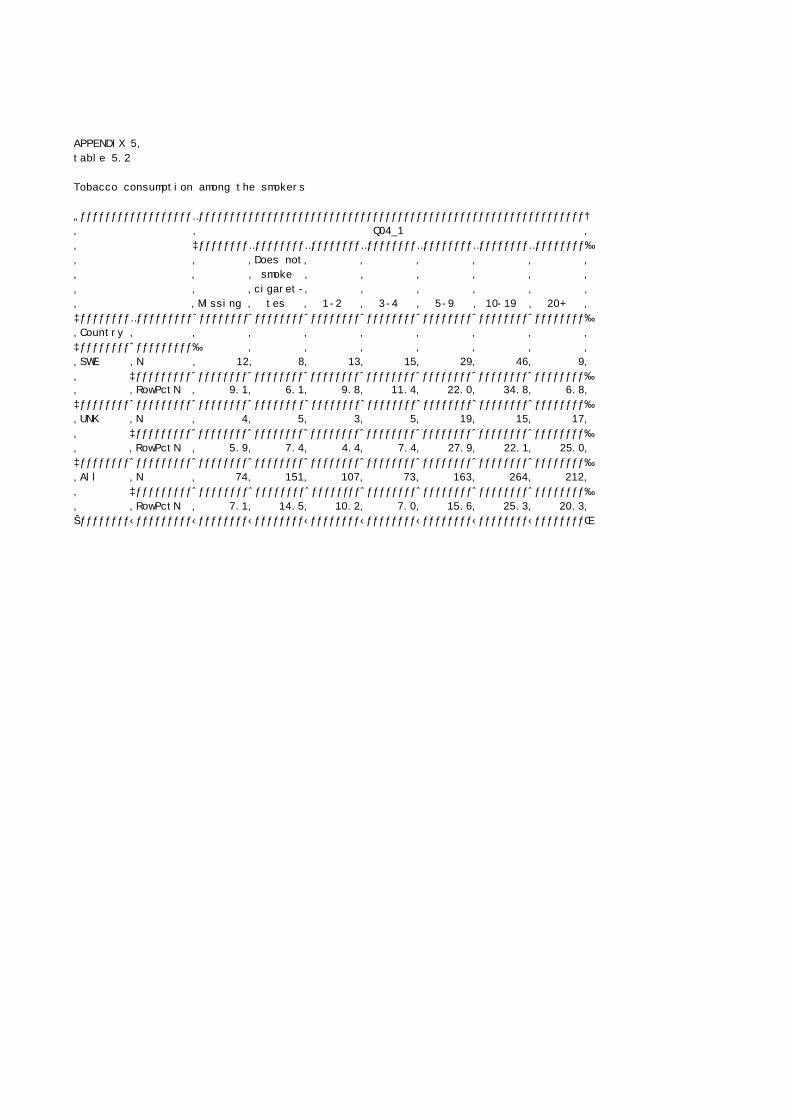
APPENDIX 5,table 5.2
Tobacco consumption among the smokers
„ƒƒƒƒƒƒƒƒƒƒƒƒƒƒƒƒƒƒ…ƒƒƒƒƒƒƒƒƒƒƒƒƒƒƒƒƒƒƒƒƒƒƒƒƒƒƒƒƒƒƒƒƒƒƒƒƒƒƒƒƒƒƒƒƒƒƒƒƒƒƒƒƒƒƒƒƒƒƒƒƒƒ†‚ ‚ Q04_1 ‚‚ ‡ƒƒƒƒƒƒƒƒ…ƒƒƒƒƒƒƒƒ…ƒƒƒƒƒƒƒƒ…ƒƒƒƒƒƒƒƒ…ƒƒƒƒƒƒƒƒ…ƒƒƒƒƒƒƒƒ…ƒƒƒƒƒƒƒƒ‰‚ ‚ ‚Does not‚ ‚ ‚ ‚ ‚ ‚‚ ‚ ‚ smoke ‚ ‚ ‚ ‚ ‚ ‚‚ ‚ ‚cigaret-‚ ‚ ‚ ‚ ‚ ‚‚ ‚Missing ‚ tes ‚ 1-2 ‚ 3-4 ‚ 5-9 ‚ 10-19 ‚ 20+ ‚‡ƒƒƒƒƒƒƒƒ…ƒƒƒƒƒƒƒƒƒˆƒƒƒƒƒƒƒƒ̂ ƒƒƒƒƒƒƒƒˆƒƒƒƒƒƒƒƒˆƒƒƒƒƒƒƒƒˆƒƒƒƒƒƒƒƒˆƒƒƒƒƒƒƒƒˆƒƒƒƒƒƒƒƒ‰‚Country ‚ ‚ ‚ ‚ ‚ ‚ ‚ ‚ ‚‡ƒƒƒƒƒƒƒƒˆƒƒƒƒƒƒƒƒƒ‰ ‚ ‚ ‚ ‚ ‚ ‚ ‚‚SWE ‚N ‚ 12‚ 8‚ 13‚ 15‚ 29‚ 46‚ 9‚‚ ‡ƒƒƒƒƒƒƒƒƒˆƒƒƒƒƒƒƒƒˆƒƒƒƒƒƒƒƒˆƒƒƒƒƒƒƒƒˆƒƒƒƒƒƒƒƒˆƒƒƒƒƒƒƒƒˆƒƒƒƒƒƒƒƒˆƒƒƒƒƒƒƒƒ‰‚ ‚RowPctN ‚ 9.1‚ 6.1‚ 9.8‚ 11.4‚ 22.0‚ 34.8‚ 6.8‚‡ƒƒƒƒƒƒƒƒˆƒƒƒƒƒƒƒƒƒˆƒƒƒƒƒƒƒƒˆƒƒƒƒƒƒƒƒˆƒƒƒƒƒƒƒƒˆƒƒƒƒƒƒƒƒˆƒƒƒƒƒƒƒƒˆƒƒƒƒƒƒƒƒˆƒƒƒƒƒƒƒƒ‰‚UNK ‚N ‚ 4‚ 5‚ 3‚ 5‚ 19‚ 15‚ 17‚‚ ‡ƒƒƒƒƒƒƒƒƒˆƒƒƒƒƒƒƒƒˆƒƒƒƒƒƒƒƒˆƒƒƒƒƒƒƒƒˆƒƒƒƒƒƒƒƒˆƒƒƒƒƒƒƒƒˆƒƒƒƒƒƒƒƒˆƒƒƒƒƒƒƒƒ‰‚ ‚RowPctN ‚ 5.9‚ 7.4‚ 4.4‚ 7.4‚ 27.9‚ 22.1‚ 25.0‚‡ƒƒƒƒƒƒƒƒˆƒƒƒƒƒƒƒƒƒˆƒƒƒƒƒƒƒƒˆƒƒƒƒƒƒƒƒˆƒƒƒƒƒƒƒƒˆƒƒƒƒƒƒƒƒˆƒƒƒƒƒƒƒƒˆƒƒƒƒƒƒƒƒˆƒƒƒƒƒƒƒƒ‰‚All ‚N ‚ 74‚ 151‚ 107‚ 73‚ 163‚ 264‚ 212‚‚ ‡ƒƒƒƒƒƒƒƒƒˆƒƒƒƒƒƒƒƒˆƒƒƒƒƒƒƒƒˆƒƒƒƒƒƒƒƒˆƒƒƒƒƒƒƒƒˆƒƒƒƒƒƒƒƒˆƒƒƒƒƒƒƒƒˆƒƒƒƒƒƒƒƒ‰‚ ‚RowPctN ‚ 7.1‚ 14.5‚ 10.2‚ 7.0‚ 15.6‚ 25.3‚ 20.3‚Šƒƒƒƒƒƒƒƒ‹ƒƒƒƒƒƒƒƒƒ‹ƒƒƒƒƒƒƒƒ‹ƒƒƒƒƒƒƒƒ‹ƒƒƒƒƒƒƒƒ‹ƒƒƒƒƒƒƒƒ‹ƒƒƒƒƒƒƒƒ‹ƒƒƒƒƒƒƒƒ‹ƒƒƒƒƒƒƒƒŒ
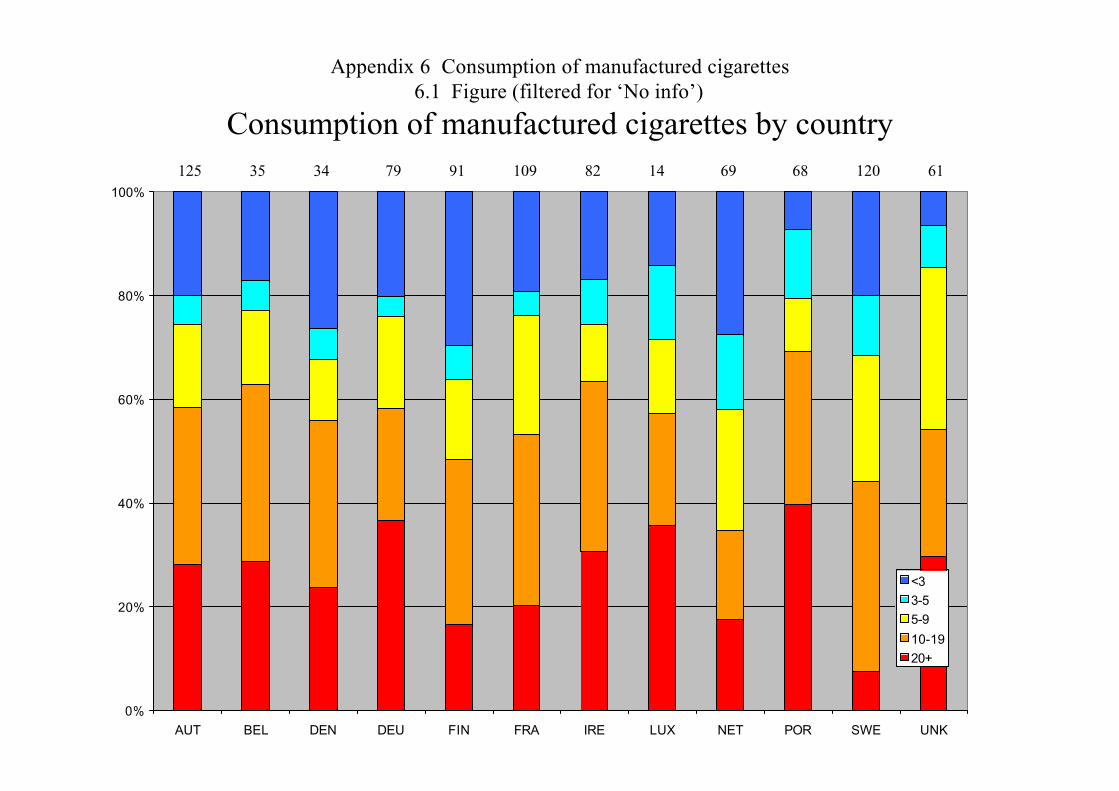
Appendix 6 Consumption of manufactured cigarettes6.1 Figure (filtered for ‘No info’)
Consumption of manufactured cigarettes by country
0%
20%
40%
60%
80%
100%
AUT BEL DEN DEU FIN FRA IRE LUX NET POR SWE UNK
<33-55-9
10-1920+
125 35 34 79 91 109 82 14 69 68 120 61
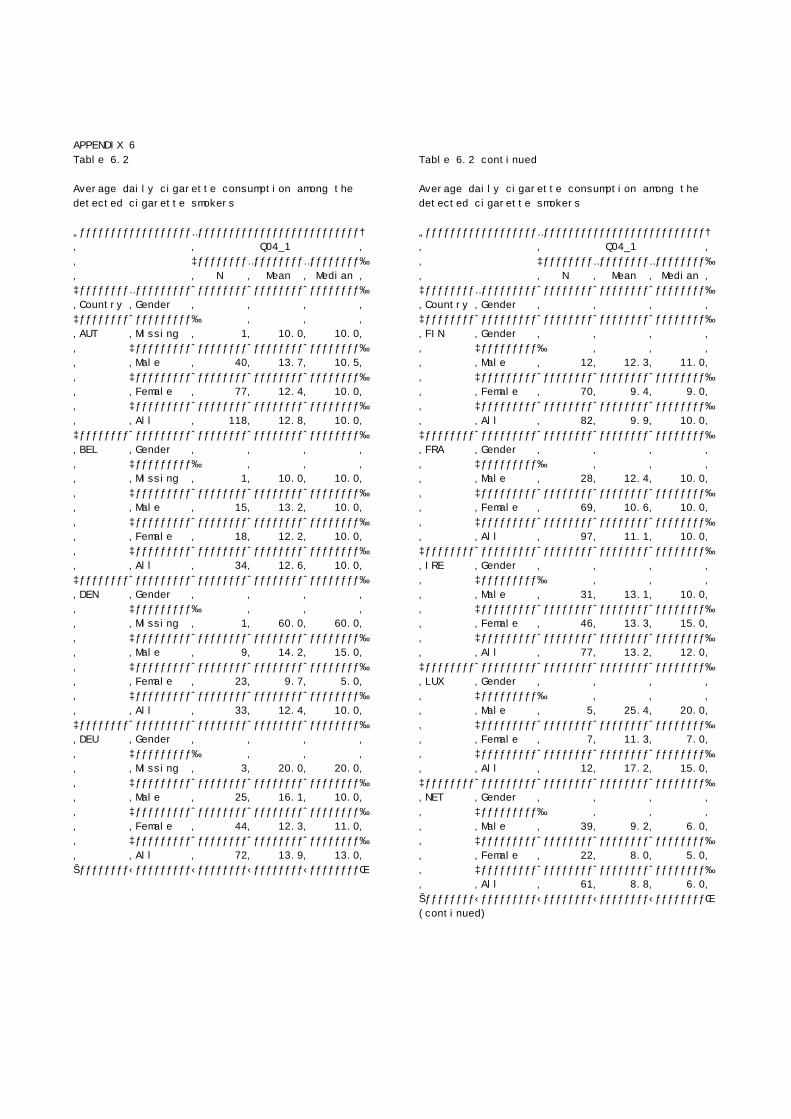
APPENDIX 6 Table 6.2
Average daily cigarette consumption among the detected cigarette smokers
„ƒƒƒƒƒƒƒƒƒƒƒƒƒƒƒƒƒƒ…ƒƒƒƒƒƒƒƒƒƒƒƒƒƒƒƒƒƒƒƒƒƒƒƒƒƒ† ‚ ‚ Q04_1 ‚ ‚ ‡ƒƒƒƒƒƒƒƒ…ƒƒƒƒƒƒƒƒ…ƒƒƒƒƒƒƒƒ‰ ‚ ‚ N ‚ Mean ‚ Median ‚ ‡ƒƒƒƒƒƒƒƒ…ƒƒƒƒƒƒƒƒƒˆƒƒƒƒƒƒƒƒˆƒƒƒƒƒƒƒƒˆƒƒƒƒƒƒƒƒ‰ ‚Country ‚Gender ‚ ‚ ‚ ‚ ‡ƒƒƒƒƒƒƒƒˆƒƒƒƒƒƒƒƒƒ‰ ‚ ‚ ‚ ‚AUT ‚Missing ‚ 1‚ 10.0‚ 10.0‚ ‚ ‡ƒƒƒƒƒƒƒƒƒˆƒƒƒƒƒƒƒƒˆƒƒƒƒƒƒƒƒˆƒƒƒƒƒƒƒƒ‰ ‚ ‚Male ‚ 40‚ 13.7‚ 10.5‚ ‚ ‡ƒƒƒƒƒƒƒƒƒˆƒƒƒƒƒƒƒƒˆƒƒƒƒƒƒƒƒˆƒƒƒƒƒƒƒƒ‰ ‚ ‚Female ‚ 77‚ 12.4‚ 10.0‚ ‚ ‡ƒƒƒƒƒƒƒƒƒˆƒƒƒƒƒƒƒƒˆƒƒƒƒƒƒƒƒˆƒƒƒƒƒƒƒƒ‰ ‚ ‚All ‚ 118‚ 12.8‚ 10.0‚ ‡ƒƒƒƒƒƒƒƒˆƒƒƒƒƒƒƒƒƒˆƒƒƒƒƒƒƒƒˆƒƒƒƒƒƒƒƒˆƒƒƒƒƒƒƒƒ‰ ‚BEL ‚Gender ‚ ‚ ‚ ‚ ‚ ‡ƒƒƒƒƒƒƒƒƒ‰ ‚ ‚ ‚ ‚ ‚Missing ‚ 1‚ 10.0‚ 10.0‚ ‚ ‡ƒƒƒƒƒƒƒƒƒˆƒƒƒƒƒƒƒƒˆƒƒƒƒƒƒƒƒˆƒƒƒƒƒƒƒƒ‰ ‚ ‚Male ‚ 15‚ 13.2‚ 10.0‚ ‚ ‡ƒƒƒƒƒƒƒƒƒˆƒƒƒƒƒƒƒƒˆƒƒƒƒƒƒƒƒˆƒƒƒƒƒƒƒƒ‰ ‚ ‚Female ‚ 18‚ 12.2‚ 10.0‚ ‚ ‡ƒƒƒƒƒƒƒƒƒˆƒƒƒƒƒƒƒƒˆƒƒƒƒƒƒƒƒˆƒƒƒƒƒƒƒƒ‰ ‚ ‚All ‚ 34‚ 12.6‚ 10.0‚ ‡ƒƒƒƒƒƒƒƒˆƒƒƒƒƒƒƒƒƒˆƒƒƒƒƒƒƒƒˆƒƒƒƒƒƒƒƒˆƒƒƒƒƒƒƒƒ‰ ‚DEN ‚Gender ‚ ‚ ‚ ‚ ‚ ‡ƒƒƒƒƒƒƒƒƒ‰ ‚ ‚ ‚ ‚ ‚Missing ‚ 1‚ 60.0‚ 60.0‚ ‚ ‡ƒƒƒƒƒƒƒƒƒˆƒƒƒƒƒƒƒƒˆƒƒƒƒƒƒƒƒˆƒƒƒƒƒƒƒƒ‰ ‚ ‚Male ‚ 9‚ 14.2‚ 15.0‚ ‚ ‡ƒƒƒƒƒƒƒƒƒˆƒƒƒƒƒƒƒƒˆƒƒƒƒƒƒƒƒˆƒƒƒƒƒƒƒƒ‰ ‚ ‚Female ‚ 23‚ 9.7‚ 5.0‚ ‚ ‡ƒƒƒƒƒƒƒƒƒˆƒƒƒƒƒƒƒƒˆƒƒƒƒƒƒƒƒˆƒƒƒƒƒƒƒƒ‰ ‚ ‚All ‚ 33‚ 12.4‚ 10.0‚ ‡ƒƒƒƒƒƒƒƒˆƒƒƒƒƒƒƒƒƒˆƒƒƒƒƒƒƒƒˆƒƒƒƒƒƒƒƒˆƒƒƒƒƒƒƒƒ‰ ‚DEU ‚Gender ‚ ‚ ‚ ‚ ‚ ‡ƒƒƒƒƒƒƒƒƒ‰ ‚ ‚ ‚ ‚ ‚Missing ‚ 3‚ 20.0‚ 20.0‚ ‚ ‡ƒƒƒƒƒƒƒƒƒˆƒƒƒƒƒƒƒƒˆƒƒƒƒƒƒƒƒˆƒƒƒƒƒƒƒƒ‰ ‚ ‚Male ‚ 25‚ 16.1‚ 10.0‚ ‚ ‡ƒƒƒƒƒƒƒƒƒˆƒƒƒƒƒƒƒƒˆƒƒƒƒƒƒƒƒˆƒƒƒƒƒƒƒƒ‰ ‚ ‚Female ‚ 44‚ 12.3‚ 11.0‚ ‚ ‡ƒƒƒƒƒƒƒƒƒˆƒƒƒƒƒƒƒƒˆƒƒƒƒƒƒƒƒˆƒƒƒƒƒƒƒƒ‰ ‚ ‚All ‚ 72‚ 13.9‚ 13.0‚ Šƒƒƒƒƒƒƒƒ‹ƒƒƒƒƒƒƒƒƒ‹ƒƒƒƒƒƒƒƒ‹ƒƒƒƒƒƒƒƒ‹ƒƒƒƒƒƒƒƒŒ
Table 6.2 continued
Average daily cigarette consumption among the detected cigarette smokers
„ƒƒƒƒƒƒƒƒƒƒƒƒƒƒƒƒƒƒ…ƒƒƒƒƒƒƒƒƒƒƒƒƒƒƒƒƒƒƒƒƒƒƒƒƒƒ† ‚ ‚ Q04_1 ‚ ‚ ‡ƒƒƒƒƒƒƒƒ…ƒƒƒƒƒƒƒƒ…ƒƒƒƒƒƒƒƒ‰ ‚ ‚ N ‚ Mean ‚ Median ‚ ‡ƒƒƒƒƒƒƒƒ…ƒƒƒƒƒƒƒƒƒˆƒƒƒƒƒƒƒƒˆƒƒƒƒƒƒƒƒˆƒƒƒƒƒƒƒƒ‰ ‚Country ‚Gender ‚ ‚ ‚ ‚ ‡ƒƒƒƒƒƒƒƒˆƒƒƒƒƒƒƒƒƒˆƒƒƒƒƒƒƒƒˆƒƒƒƒƒƒƒƒˆƒƒƒƒƒƒƒƒ‰ ‚FIN ‚Gender ‚ ‚ ‚ ‚ ‚ ‡ƒƒƒƒƒƒƒƒƒ‰ ‚ ‚ ‚ ‚ ‚Male ‚ 12‚ 12.3‚ 11.0‚ ‚ ‡ƒƒƒƒƒƒƒƒƒˆƒƒƒƒƒƒƒƒˆƒƒƒƒƒƒƒƒˆƒƒƒƒƒƒƒƒ‰ ‚ ‚Female ‚ 70‚ 9.4‚ 9.0‚ ‚ ‡ƒƒƒƒƒƒƒƒƒˆƒƒƒƒƒƒƒƒˆƒƒƒƒƒƒƒƒˆƒƒƒƒƒƒƒƒ‰ ‚ ‚All ‚ 82‚ 9.9‚ 10.0‚ ‡ƒƒƒƒƒƒƒƒˆƒƒƒƒƒƒƒƒƒˆƒƒƒƒƒƒƒƒˆƒƒƒƒƒƒƒƒˆƒƒƒƒƒƒƒƒ‰ ‚FRA ‚Gender ‚ ‚ ‚ ‚ ‚ ‡ƒƒƒƒƒƒƒƒƒ‰ ‚ ‚ ‚ ‚ ‚Male ‚ 28‚ 12.4‚ 10.0‚ ‚ ‡ƒƒƒƒƒƒƒƒƒˆƒƒƒƒƒƒƒƒˆƒƒƒƒƒƒƒƒˆƒƒƒƒƒƒƒƒ‰ ‚ ‚Female ‚ 69‚ 10.6‚ 10.0‚ ‚ ‡ƒƒƒƒƒƒƒƒƒˆƒƒƒƒƒƒƒƒˆƒƒƒƒƒƒƒƒˆƒƒƒƒƒƒƒƒ‰ ‚ ‚All ‚ 97‚ 11.1‚ 10.0‚ ‡ƒƒƒƒƒƒƒƒˆƒƒƒƒƒƒƒƒƒˆƒƒƒƒƒƒƒƒˆƒƒƒƒƒƒƒƒˆƒƒƒƒƒƒƒƒ‰ ‚IRE ‚Gender ‚ ‚ ‚ ‚ ‚ ‡ƒƒƒƒƒƒƒƒƒ‰ ‚ ‚ ‚ ‚ ‚Male ‚ 31‚ 13.1‚ 10.0‚ ‚ ‡ƒƒƒƒƒƒƒƒƒˆƒƒƒƒƒƒƒƒˆƒƒƒƒƒƒƒƒˆƒƒƒƒƒƒƒƒ‰ ‚ ‚Female ‚ 46‚ 13.3‚ 15.0‚ ‚ ‡ƒƒƒƒƒƒƒƒƒˆƒƒƒƒƒƒƒƒˆƒƒƒƒƒƒƒƒˆƒƒƒƒƒƒƒƒ‰ ‚ ‚All ‚ 77‚ 13.2‚ 12.0‚ ‡ƒƒƒƒƒƒƒƒˆƒƒƒƒƒƒƒƒƒˆƒƒƒƒƒƒƒƒˆƒƒƒƒƒƒƒƒˆƒƒƒƒƒƒƒƒ‰ ‚LUX ‚Gender ‚ ‚ ‚ ‚ ‚ ‡ƒƒƒƒƒƒƒƒƒ‰ ‚ ‚ ‚ ‚ ‚Male ‚ 5‚ 25.4‚ 20.0‚ ‚ ‡ƒƒƒƒƒƒƒƒƒˆƒƒƒƒƒƒƒƒˆƒƒƒƒƒƒƒƒˆƒƒƒƒƒƒƒƒ‰ ‚ ‚Female ‚ 7‚ 11.3‚ 7.0‚ ‚ ‡ƒƒƒƒƒƒƒƒƒˆƒƒƒƒƒƒƒƒˆƒƒƒƒƒƒƒƒˆƒƒƒƒƒƒƒƒ‰ ‚ ‚All ‚ 12‚ 17.2‚ 15.0‚ ‡ƒƒƒƒƒƒƒƒˆƒƒƒƒƒƒƒƒƒˆƒƒƒƒƒƒƒƒˆƒƒƒƒƒƒƒƒˆƒƒƒƒƒƒƒƒ‰ ‚NET ‚Gender ‚ ‚ ‚ ‚ ‚ ‡ƒƒƒƒƒƒƒƒƒ‰ ‚ ‚ ‚ ‚ ‚Male ‚ 39‚ 9.2‚ 6.0‚ ‚ ‡ƒƒƒƒƒƒƒƒƒˆƒƒƒƒƒƒƒƒˆƒƒƒƒƒƒƒƒˆƒƒƒƒƒƒƒƒ‰ ‚ ‚Female ‚ 22‚ 8.0‚ 5.0‚ ‚ ‡ƒƒƒƒƒƒƒƒƒˆƒƒƒƒƒƒƒƒˆƒƒƒƒƒƒƒƒˆƒƒƒƒƒƒƒƒ‰ ‚ ‚All ‚ 61‚ 8.8‚ 6.0‚ Šƒƒƒƒƒƒƒƒ‹ƒƒƒƒƒƒƒƒƒ‹ƒƒƒƒƒƒƒƒ‹ƒƒƒƒƒƒƒƒ‹ƒƒƒƒƒƒƒƒŒ (continued)

APPENDIX 6 Table 6.2 continued
Average daily cigarette consumption among the detected cigarette smokers
„ƒƒƒƒƒƒƒƒƒƒƒƒƒƒƒƒƒƒ…ƒƒƒƒƒƒƒƒƒƒƒƒƒƒƒƒƒƒƒƒƒƒƒƒƒƒ† ‚ ‚ Q04_1 ‚ ‚ ‡ƒƒƒƒƒƒƒƒ…ƒƒƒƒƒƒƒƒ…ƒƒƒƒƒƒƒƒ‰ ‚ ‚ N ‚ Mean ‚ Median ‚ ‡ƒƒƒƒƒƒƒƒ…ƒƒƒƒƒƒƒƒƒˆƒƒƒƒƒƒƒƒˆƒƒƒƒƒƒƒƒˆƒƒƒƒƒƒƒƒ‰ ‚Country ‚Gender ‚ ‚ ‚ ‚ ‡ƒƒƒƒƒƒƒƒˆƒƒƒƒƒƒƒƒƒ‰ ‚ ‚ ‚ ‚POR ‚Gender ‚ ‚ ‚ ‚ ‚ ‡ƒƒƒƒƒƒƒƒƒ‰ ‚ ‚ ‚ ‚ ‚Male ‚ 23‚ 18.6‚ 20.0‚ ‚ ‡ƒƒƒƒƒƒƒƒƒˆƒƒƒƒƒƒƒƒˆƒƒƒƒƒƒƒƒˆƒƒƒƒƒƒƒƒ‰ ‚ ‚Female ‚ 39‚ 12.4‚ 10.0‚ ‚ ‡ƒƒƒƒƒƒƒƒƒˆƒƒƒƒƒƒƒƒˆƒƒƒƒƒƒƒƒˆƒƒƒƒƒƒƒƒ‰ ‚ ‚All ‚ 62‚ 14.7‚ 10.0‚ ‡ƒƒƒƒƒƒƒƒˆƒƒƒƒƒƒƒƒƒˆƒƒƒƒƒƒƒƒˆƒƒƒƒƒƒƒƒˆƒƒƒƒƒƒƒƒ‰ ‚SWE ‚Male ‚ 6‚ 8.7‚ 9.0‚ ‚ ‡ƒƒƒƒƒƒƒƒƒˆƒƒƒƒƒƒƒƒˆƒƒƒƒƒƒƒƒˆƒƒƒƒƒƒƒƒ‰ ‚ ‚Female ‚ 106‚ 8.9‚ 8.0‚ ‚ ‡ƒƒƒƒƒƒƒƒƒˆƒƒƒƒƒƒƒƒˆƒƒƒƒƒƒƒƒˆƒƒƒƒƒƒƒƒ‰ ‚ ‚All ‚ 112‚ 8.9‚ 8.0‚ ‡ƒƒƒƒƒƒƒƒˆƒƒƒƒƒƒƒƒƒˆƒƒƒƒƒƒƒƒˆƒƒƒƒƒƒƒƒˆƒƒƒƒƒƒƒƒ‰ ‚UNK ‚Gender ‚ ‚ ‚ ‚ ‚ ‡ƒƒƒƒƒƒƒƒƒ‰ ‚ ‚ ‚ ‚ ‚Male ‚ 30‚ 15.2‚ 13.5‚ ‚ ‡ƒƒƒƒƒƒƒƒƒˆƒƒƒƒƒƒƒƒˆƒƒƒƒƒƒƒƒˆƒƒƒƒƒƒƒƒ‰ ‚ ‚Female ‚ 29‚ 10.4‚ 8.0‚ ‚ ‡ƒƒƒƒƒƒƒƒƒˆƒƒƒƒƒƒƒƒˆƒƒƒƒƒƒƒƒˆƒƒƒƒƒƒƒƒ‰ ‚ ‚All ‚ 59‚ 12.8‚ 10.0‚ ‡ƒƒƒƒƒƒƒƒˆƒƒƒƒƒƒƒƒƒˆƒƒƒƒƒƒƒƒˆƒƒƒƒƒƒƒƒˆƒƒƒƒƒƒƒƒ‰ ‚All ‚Gender ‚ ‚ ‚ ‚ ‚ ‡ƒƒƒƒƒƒƒƒƒ‰ ‚ ‚ ‚ ‚ ‚Missing ‚ 6‚ 23.3‚ 20.0‚ ‚ ‡ƒƒƒƒƒƒƒƒƒˆƒƒƒƒƒƒƒƒˆƒƒƒƒƒƒƒƒˆƒƒƒƒƒƒƒƒ‰ ‚ ‚Male ‚ 263‚ 13.7‚ 10.0‚ ‚ ‡ƒƒƒƒƒƒƒƒƒˆƒƒƒƒƒƒƒƒˆƒƒƒƒƒƒƒƒˆƒƒƒƒƒƒƒƒ‰ ‚ ‚Female ‚ 550‚ 10.8‚ 10.0‚ ‚ ‡ƒƒƒƒƒƒƒƒƒˆƒƒƒƒƒƒƒƒˆƒƒƒƒƒƒƒƒˆƒƒƒƒƒƒƒƒ‰ ‚ ‚All ‚ 819‚ 11.8‚ 10.0‚ Šƒƒƒƒƒƒƒƒ‹ƒƒƒƒƒƒƒƒƒ‹ƒƒƒƒƒƒƒƒ‹ƒƒƒƒƒƒƒƒ‹ƒƒƒƒƒƒƒƒŒ
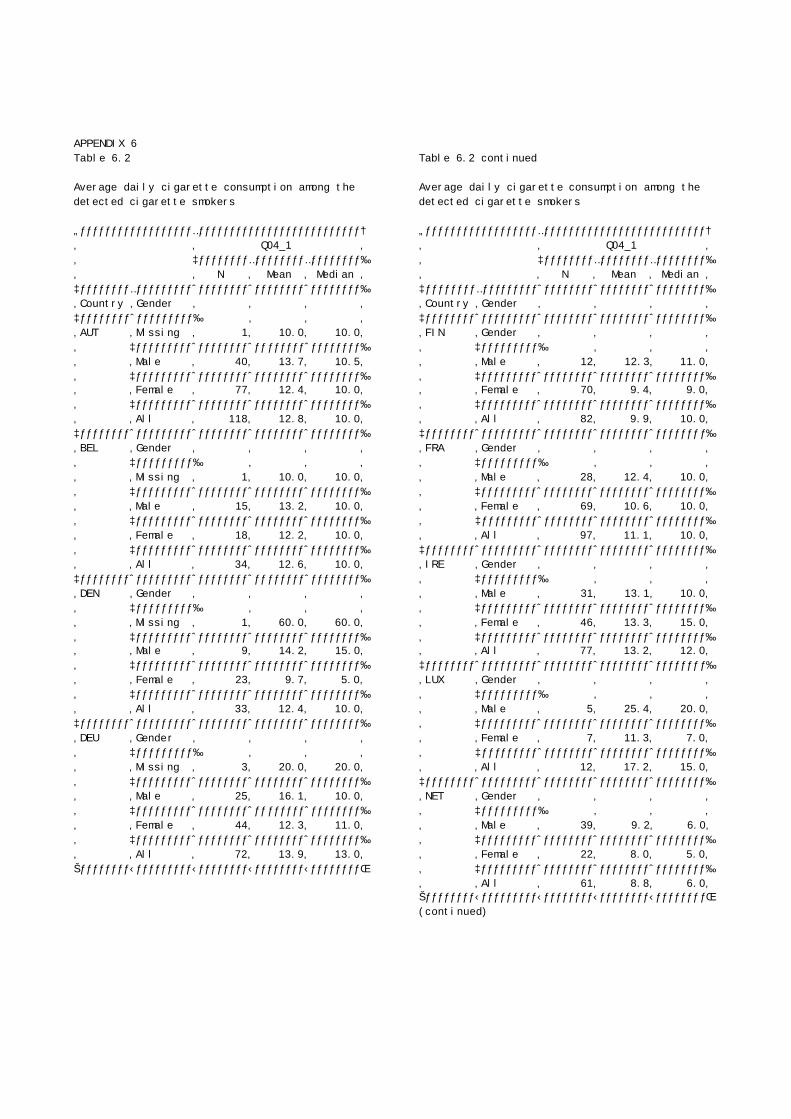
APPENDIX 6 Table 6.2
Average daily cigarette consumption among the detected cigarette smokers
„ƒƒƒƒƒƒƒƒƒƒƒƒƒƒƒƒƒƒ…ƒƒƒƒƒƒƒƒƒƒƒƒƒƒƒƒƒƒƒƒƒƒƒƒƒƒ†‚ ‚ Q04_1 ‚‚ ‡ƒƒƒƒƒƒƒƒ…ƒƒƒƒƒƒƒƒ…ƒƒƒƒƒƒƒƒ‰‚ ‚ N ‚ Mean ‚ Median ‚‡ƒƒƒƒƒƒƒƒ…ƒƒƒƒƒƒƒƒƒˆƒƒƒƒƒƒƒƒˆƒƒƒƒƒƒƒƒˆƒƒƒƒƒƒƒƒ‰‚Country ‚Gender ‚ ‚ ‚ ‚‡ƒƒƒƒƒƒƒƒˆƒƒƒƒƒƒƒƒƒ‰ ‚ ‚ ‚‚AUT ‚Missing ‚ 1‚ 10.0‚ 10.0‚‚ ‡ƒƒƒƒƒƒƒƒƒˆƒƒƒƒƒƒƒƒˆƒƒƒƒƒƒƒƒˆƒƒƒƒƒƒƒƒ‰‚ ‚Male ‚ 40‚ 13.7‚ 10.5‚‚ ‡ƒƒƒƒƒƒƒƒƒˆƒƒƒƒƒƒƒƒˆƒƒƒƒƒƒƒƒˆƒƒƒƒƒƒƒƒ‰‚ ‚Female ‚ 77‚ 12.4‚ 10.0‚‚ ‡ƒƒƒƒƒƒƒƒƒˆƒƒƒƒƒƒƒƒˆƒƒƒƒƒƒƒƒˆƒƒƒƒƒƒƒƒ‰‚ ‚All ‚ 118‚ 12.8‚ 10.0‚‡ƒƒƒƒƒƒƒƒˆƒƒƒƒƒƒƒƒƒˆƒƒƒƒƒƒƒƒˆƒƒƒƒƒƒƒƒˆƒƒƒƒƒƒƒƒ‰‚BEL ‚Gender ‚ ‚ ‚ ‚‚ ‡ƒƒƒƒƒƒƒƒƒ‰ ‚ ‚ ‚‚ ‚Missing ‚ 1‚ 10.0‚ 10.0‚‚ ‡ƒƒƒƒƒƒƒƒƒˆƒƒƒƒƒƒƒƒˆƒƒƒƒƒƒƒƒˆƒƒƒƒƒƒƒƒ‰‚ ‚Male ‚ 15‚ 13.2‚ 10.0‚‚ ‡ƒƒƒƒƒƒƒƒƒˆƒƒƒƒƒƒƒƒˆƒƒƒƒƒƒƒƒˆƒƒƒƒƒƒƒƒ‰‚ ‚Female ‚ 18‚ 12.2‚ 10.0‚‚ ‡ƒƒƒƒƒƒƒƒƒˆƒƒƒƒƒƒƒƒˆƒƒƒƒƒƒƒƒˆƒƒƒƒƒƒƒƒ‰‚ ‚All ‚ 34‚ 12.6‚ 10.0‚‡ƒƒƒƒƒƒƒƒˆƒƒƒƒƒƒƒƒƒˆƒƒƒƒƒƒƒƒˆƒƒƒƒƒƒƒƒˆƒƒƒƒƒƒƒƒ‰‚DEN ‚Gender ‚ ‚ ‚ ‚‚ ‡ƒƒƒƒƒƒƒƒƒ‰ ‚ ‚ ‚‚ ‚Missing ‚ 1‚ 60.0‚ 60.0‚‚ ‡ƒƒƒƒƒƒƒƒƒˆƒƒƒƒƒƒƒƒˆƒƒƒƒƒƒƒƒˆƒƒƒƒƒƒƒƒ‰‚ ‚Male ‚ 9‚ 14.2‚ 15.0‚‚ ‡ƒƒƒƒƒƒƒƒƒˆƒƒƒƒƒƒƒƒˆƒƒƒƒƒƒƒƒˆƒƒƒƒƒƒƒƒ‰‚ ‚Female ‚ 23‚ 9.7‚ 5.0‚‚ ‡ƒƒƒƒƒƒƒƒƒˆƒƒƒƒƒƒƒƒˆƒƒƒƒƒƒƒƒˆƒƒƒƒƒƒƒƒ‰‚ ‚All ‚ 33‚ 12.4‚ 10.0‚‡ƒƒƒƒƒƒƒƒˆƒƒƒƒƒƒƒƒƒˆƒƒƒƒƒƒƒƒˆƒƒƒƒƒƒƒƒˆƒƒƒƒƒƒƒƒ‰‚DEU ‚Gender ‚ ‚ ‚ ‚‚ ‡ƒƒƒƒƒƒƒƒƒ‰ ‚ ‚ ‚‚ ‚Missing ‚ 3‚ 20.0‚ 20.0‚‚ ‡ƒƒƒƒƒƒƒƒƒˆƒƒƒƒƒƒƒƒˆƒƒƒƒƒƒƒƒˆƒƒƒƒƒƒƒƒ‰‚ ‚Male ‚ 25‚ 16.1‚ 10.0‚‚ ‡ƒƒƒƒƒƒƒƒƒˆƒƒƒƒƒƒƒƒˆƒƒƒƒƒƒƒƒˆƒƒƒƒƒƒƒƒ‰‚ ‚Female ‚ 44‚ 12.3‚ 11.0‚‚ ‡ƒƒƒƒƒƒƒƒƒˆƒƒƒƒƒƒƒƒˆƒƒƒƒƒƒƒƒˆƒƒƒƒƒƒƒƒ‰‚ ‚All ‚ 72‚ 13.9‚ 13.0‚Šƒƒƒƒƒƒƒƒ‹ƒƒƒƒƒƒƒƒƒ‹ƒƒƒƒƒƒƒƒ‹ƒƒƒƒƒƒƒƒ‹ƒƒƒƒƒƒƒƒŒ
Table 6.2 continued
Average daily cigarette consumption among the detected cigarette smokers
„ƒƒƒƒƒƒƒƒƒƒƒƒƒƒƒƒƒƒ…ƒƒƒƒƒƒƒƒƒƒƒƒƒƒƒƒƒƒƒƒƒƒƒƒƒƒ†‚ ‚ Q04_1 ‚‚ ‡ƒƒƒƒƒƒƒƒ…ƒƒƒƒƒƒƒƒ…ƒƒƒƒƒƒƒƒ‰‚ ‚ N ‚ Mean ‚ Median ‚‡ƒƒƒƒƒƒƒƒ…ƒƒƒƒƒƒƒƒƒˆƒƒƒƒƒƒƒƒˆƒƒƒƒƒƒƒƒˆƒƒƒƒƒƒƒƒ‰‚Country ‚Gender ‚ ‚ ‚ ‚‡ƒƒƒƒƒƒƒƒˆƒƒƒƒƒƒƒƒƒˆƒƒƒƒƒƒƒƒˆƒƒƒƒƒƒƒƒˆƒƒƒƒƒƒƒƒ‰‚FIN ‚Gender ‚ ‚ ‚ ‚‚ ‡ƒƒƒƒƒƒƒƒƒ‰ ‚ ‚ ‚‚ ‚Male ‚ 12‚ 12.3‚ 11.0‚‚ ‡ƒƒƒƒƒƒƒƒƒˆƒƒƒƒƒƒƒƒˆƒƒƒƒƒƒƒƒˆƒƒƒƒƒƒƒƒ‰‚ ‚Female ‚ 70‚ 9.4‚ 9.0‚‚ ‡ƒƒƒƒƒƒƒƒƒˆƒƒƒƒƒƒƒƒˆƒƒƒƒƒƒƒƒˆƒƒƒƒƒƒƒƒ‰‚ ‚All ‚ 82‚ 9.9‚ 10.0‚‡ƒƒƒƒƒƒƒƒˆƒƒƒƒƒƒƒƒƒˆƒƒƒƒƒƒƒƒˆƒƒƒƒƒƒƒƒˆƒƒƒƒƒƒƒƒ‰‚FRA ‚Gender ‚ ‚ ‚ ‚‚ ‡ƒƒƒƒƒƒƒƒƒ‰ ‚ ‚ ‚‚ ‚Male ‚ 28‚ 12.4‚ 10.0‚‚ ‡ƒƒƒƒƒƒƒƒƒˆƒƒƒƒƒƒƒƒˆƒƒƒƒƒƒƒƒˆƒƒƒƒƒƒƒƒ‰‚ ‚Female ‚ 69‚ 10.6‚ 10.0‚‚ ‡ƒƒƒƒƒƒƒƒƒˆƒƒƒƒƒƒƒƒˆƒƒƒƒƒƒƒƒˆƒƒƒƒƒƒƒƒ‰‚ ‚All ‚ 97‚ 11.1‚ 10.0‚‡ƒƒƒƒƒƒƒƒˆƒƒƒƒƒƒƒƒƒˆƒƒƒƒƒƒƒƒˆƒƒƒƒƒƒƒƒˆƒƒƒƒƒƒƒƒ‰‚IRE ‚Gender ‚ ‚ ‚ ‚‚ ‡ƒƒƒƒƒƒƒƒƒ‰ ‚ ‚ ‚‚ ‚Male ‚ 31‚ 13.1‚ 10.0‚‚ ‡ƒƒƒƒƒƒƒƒƒˆƒƒƒƒƒƒƒƒˆƒƒƒƒƒƒƒƒˆƒƒƒƒƒƒƒƒ‰‚ ‚Female ‚ 46‚ 13.3‚ 15.0‚‚ ‡ƒƒƒƒƒƒƒƒƒˆƒƒƒƒƒƒƒƒˆƒƒƒƒƒƒƒƒˆƒƒƒƒƒƒƒƒ‰‚ ‚All ‚ 77‚ 13.2‚ 12.0‚‡ƒƒƒƒƒƒƒƒˆƒƒƒƒƒƒƒƒƒˆƒƒƒƒƒƒƒƒˆƒƒƒƒƒƒƒƒˆƒƒƒƒƒƒƒƒ‰‚LUX ‚Gender ‚ ‚ ‚ ‚‚ ‡ƒƒƒƒƒƒƒƒƒ‰ ‚ ‚ ‚‚ ‚Male ‚ 5‚ 25.4‚ 20.0‚‚ ‡ƒƒƒƒƒƒƒƒƒˆƒƒƒƒƒƒƒƒˆƒƒƒƒƒƒƒƒˆƒƒƒƒƒƒƒƒ‰‚ ‚Female ‚ 7‚ 11.3‚ 7.0‚‚ ‡ƒƒƒƒƒƒƒƒƒˆƒƒƒƒƒƒƒƒˆƒƒƒƒƒƒƒƒˆƒƒƒƒƒƒƒƒ‰‚ ‚All ‚ 12‚ 17.2‚ 15.0‚‡ƒƒƒƒƒƒƒƒˆƒƒƒƒƒƒƒƒƒˆƒƒƒƒƒƒƒƒˆƒƒƒƒƒƒƒƒˆƒƒƒƒƒƒƒƒ‰‚NET ‚Gender ‚ ‚ ‚ ‚‚ ‡ƒƒƒƒƒƒƒƒƒ‰ ‚ ‚ ‚‚ ‚Male ‚ 39‚ 9.2‚ 6.0‚‚ ‡ƒƒƒƒƒƒƒƒƒˆƒƒƒƒƒƒƒƒˆƒƒƒƒƒƒƒƒˆƒƒƒƒƒƒƒƒ‰‚ ‚Female ‚ 22‚ 8.0‚ 5.0‚‚ ‡ƒƒƒƒƒƒƒƒƒˆƒƒƒƒƒƒƒƒˆƒƒƒƒƒƒƒƒˆƒƒƒƒƒƒƒƒ‰‚ ‚All ‚ 61‚ 8.8‚ 6.0‚Šƒƒƒƒƒƒƒƒ‹ƒƒƒƒƒƒƒƒƒ‹ƒƒƒƒƒƒƒƒ‹ƒƒƒƒƒƒƒƒ‹ƒƒƒƒƒƒƒƒŒ(continued)
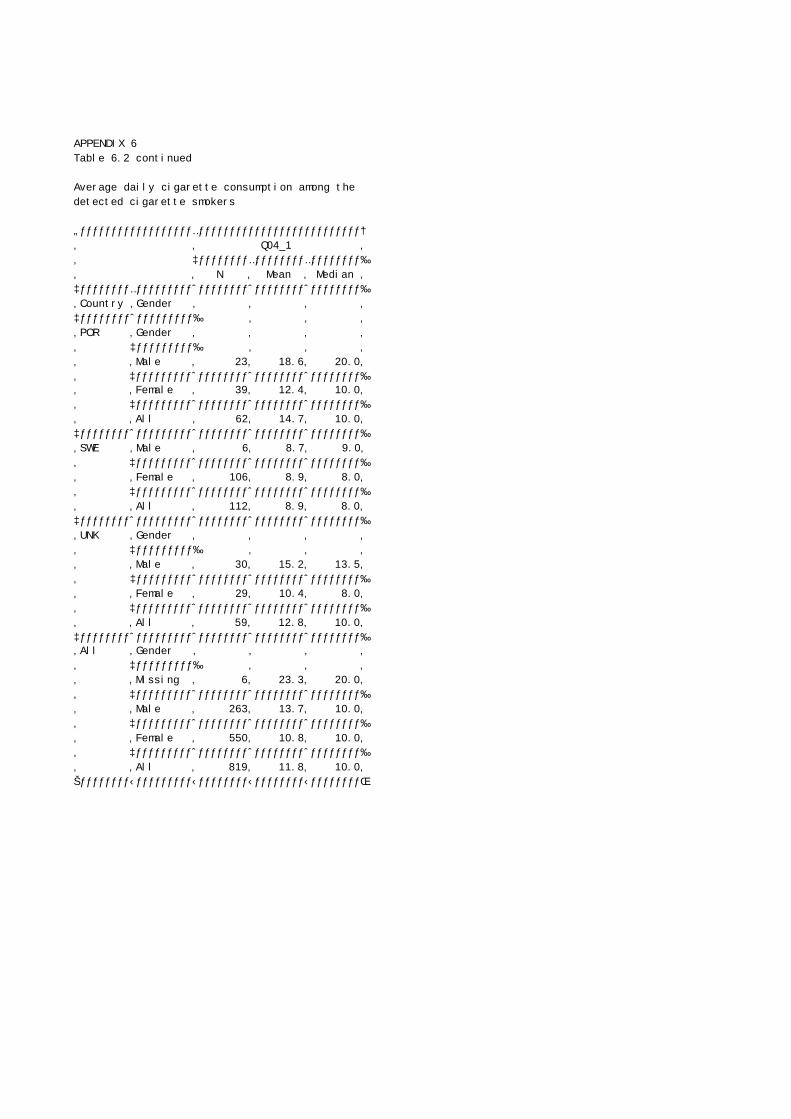
APPENDIX 6 Table 6.2 continued
Average daily cigarette consumption among the detected cigarette smokers
„ƒƒƒƒƒƒƒƒƒƒƒƒƒƒƒƒƒƒ…ƒƒƒƒƒƒƒƒƒƒƒƒƒƒƒƒƒƒƒƒƒƒƒƒƒƒ†‚ ‚ Q04_1 ‚‚ ‡ƒƒƒƒƒƒƒƒ…ƒƒƒƒƒƒƒƒ…ƒƒƒƒƒƒƒƒ‰‚ ‚ N ‚ Mean ‚ Median ‚‡ƒƒƒƒƒƒƒƒ…ƒƒƒƒƒƒƒƒƒˆƒƒƒƒƒƒƒƒˆƒƒƒƒƒƒƒƒˆƒƒƒƒƒƒƒƒ‰‚Country ‚Gender ‚ ‚ ‚ ‚‡ƒƒƒƒƒƒƒƒˆƒƒƒƒƒƒƒƒƒ‰ ‚ ‚ ‚‚POR ‚Gender ‚ ‚ ‚ ‚‚ ‡ƒƒƒƒƒƒƒƒƒ‰ ‚ ‚ ‚‚ ‚Male ‚ 23‚ 18.6‚ 20.0‚‚ ‡ƒƒƒƒƒƒƒƒƒˆƒƒƒƒƒƒƒƒˆƒƒƒƒƒƒƒƒˆƒƒƒƒƒƒƒƒ‰‚ ‚Female ‚ 39‚ 12.4‚ 10.0‚‚ ‡ƒƒƒƒƒƒƒƒƒˆƒƒƒƒƒƒƒƒˆƒƒƒƒƒƒƒƒˆƒƒƒƒƒƒƒƒ‰‚ ‚All ‚ 62‚ 14.7‚ 10.0‚‡ƒƒƒƒƒƒƒƒˆƒƒƒƒƒƒƒƒƒˆƒƒƒƒƒƒƒƒˆƒƒƒƒƒƒƒƒˆƒƒƒƒƒƒƒƒ‰‚SWE ‚Male ‚ 6‚ 8.7‚ 9.0‚‚ ‡ƒƒƒƒƒƒƒƒƒˆƒƒƒƒƒƒƒƒˆƒƒƒƒƒƒƒƒˆƒƒƒƒƒƒƒƒ‰‚ ‚Female ‚ 106‚ 8.9‚ 8.0‚‚ ‡ƒƒƒƒƒƒƒƒƒˆƒƒƒƒƒƒƒƒˆƒƒƒƒƒƒƒƒˆƒƒƒƒƒƒƒƒ‰‚ ‚All ‚ 112‚ 8.9‚ 8.0‚‡ƒƒƒƒƒƒƒƒˆƒƒƒƒƒƒƒƒƒˆƒƒƒƒƒƒƒƒˆƒƒƒƒƒƒƒƒˆƒƒƒƒƒƒƒƒ‰‚UNK ‚Gender ‚ ‚ ‚ ‚‚ ‡ƒƒƒƒƒƒƒƒƒ‰ ‚ ‚ ‚‚ ‚Male ‚ 30‚ 15.2‚ 13.5‚‚ ‡ƒƒƒƒƒƒƒƒƒˆƒƒƒƒƒƒƒƒˆƒƒƒƒƒƒƒƒˆƒƒƒƒƒƒƒƒ‰‚ ‚Female ‚ 29‚ 10.4‚ 8.0‚‚ ‡ƒƒƒƒƒƒƒƒƒˆƒƒƒƒƒƒƒƒˆƒƒƒƒƒƒƒƒˆƒƒƒƒƒƒƒƒ‰‚ ‚All ‚ 59‚ 12.8‚ 10.0‚‡ƒƒƒƒƒƒƒƒˆƒƒƒƒƒƒƒƒƒˆƒƒƒƒƒƒƒƒˆƒƒƒƒƒƒƒƒˆƒƒƒƒƒƒƒƒ‰‚All ‚Gender ‚ ‚ ‚ ‚‚ ‡ƒƒƒƒƒƒƒƒƒ‰ ‚ ‚ ‚‚ ‚Missing ‚ 6‚ 23.3‚ 20.0‚‚ ‡ƒƒƒƒƒƒƒƒƒˆƒƒƒƒƒƒƒƒˆƒƒƒƒƒƒƒƒˆƒƒƒƒƒƒƒƒ‰‚ ‚Male ‚ 263‚ 13.7‚ 10.0‚‚ ‡ƒƒƒƒƒƒƒƒƒˆƒƒƒƒƒƒƒƒˆƒƒƒƒƒƒƒƒˆƒƒƒƒƒƒƒƒ‰‚ ‚Female ‚ 550‚ 10.8‚ 10.0‚‚ ‡ƒƒƒƒƒƒƒƒƒˆƒƒƒƒƒƒƒƒˆƒƒƒƒƒƒƒƒˆƒƒƒƒƒƒƒƒ‰‚ ‚All ‚ 819‚ 11.8‚ 10.0‚Šƒƒƒƒƒƒƒƒ‹ƒƒƒƒƒƒƒƒƒ‹ƒƒƒƒƒƒƒƒ‹ƒƒƒƒƒƒƒƒ‹ƒƒƒƒƒƒƒƒŒ
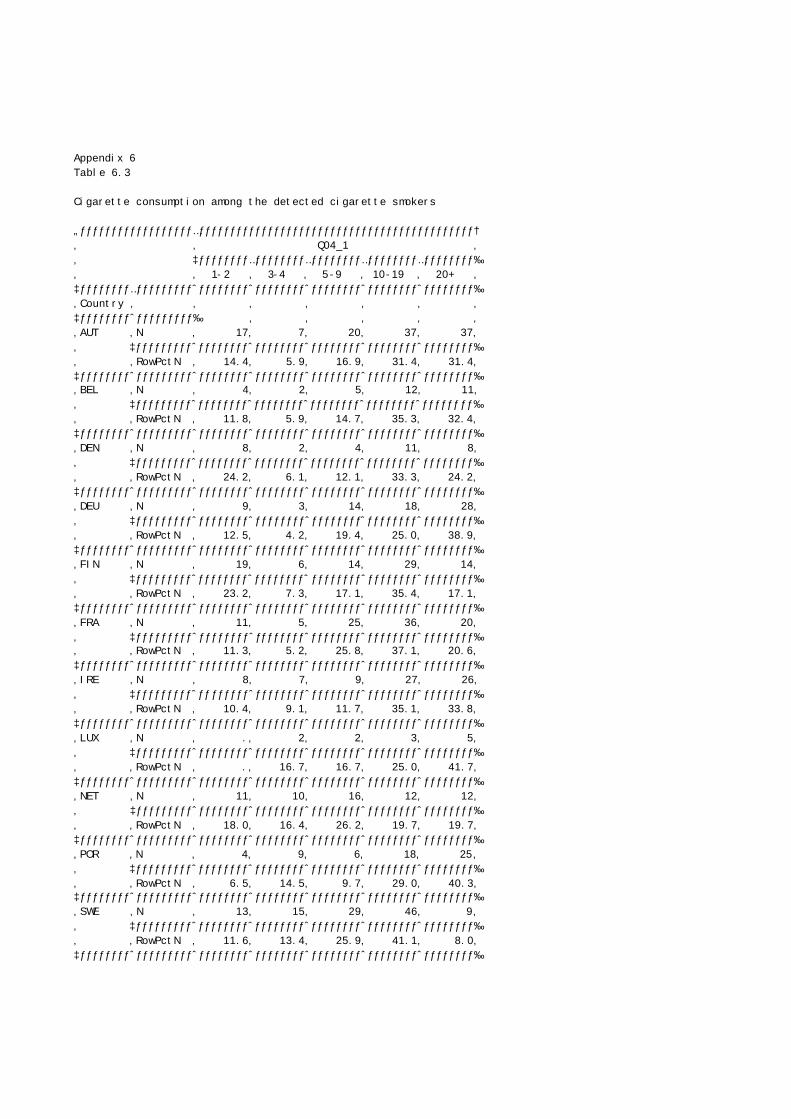
Appendix 6Table 6.3
Cigarette consumption among the detected cigarette smokers
„ƒƒƒƒƒƒƒƒƒƒƒƒƒƒƒƒƒƒ…ƒƒƒƒƒƒƒƒƒƒƒƒƒƒƒƒƒƒƒƒƒƒƒƒƒƒƒƒƒƒƒƒƒƒƒƒƒƒƒƒƒƒƒƒ†‚ ‚ Q04_1 ‚‚ ‡ƒƒƒƒƒƒƒƒ…ƒƒƒƒƒƒƒƒ…ƒƒƒƒƒƒƒƒ…ƒƒƒƒƒƒƒƒ…ƒƒƒƒƒƒƒƒ‰‚ ‚ 1-2 ‚ 3-4 ‚ 5-9 ‚ 10-19 ‚ 20+ ‚‡ƒƒƒƒƒƒƒƒ…ƒƒƒƒƒƒƒƒƒˆƒƒƒƒƒƒƒƒˆƒƒƒƒƒƒƒƒˆƒƒƒƒƒƒƒƒˆƒƒƒƒƒƒƒƒˆƒƒƒƒƒƒƒƒ‰‚Country ‚ ‚ ‚ ‚ ‚ ‚ ‚‡ƒƒƒƒƒƒƒƒˆƒƒƒƒƒƒƒƒƒ‰ ‚ ‚ ‚ ‚ ‚‚AUT ‚N ‚ 17‚ 7‚ 20‚ 37‚ 37‚‚ ‡ƒƒƒƒƒƒƒƒƒˆƒƒƒƒƒƒƒƒˆƒƒƒƒƒƒƒƒˆƒƒƒƒƒƒƒƒˆƒƒƒƒƒƒƒƒˆƒƒƒƒƒƒƒƒ‰‚ ‚RowPctN ‚ 14.4‚ 5.9‚ 16.9‚ 31.4‚ 31.4‚‡ƒƒƒƒƒƒƒƒˆƒƒƒƒƒƒƒƒƒˆƒƒƒƒƒƒƒƒˆƒƒƒƒƒƒƒƒˆƒƒƒƒƒƒƒƒˆƒƒƒƒƒƒƒƒˆƒƒƒƒƒƒƒƒ‰‚BEL ‚N ‚ 4‚ 2‚ 5‚ 12‚ 11‚‚ ‡ƒƒƒƒƒƒƒƒƒˆƒƒƒƒƒƒƒƒˆƒƒƒƒƒƒƒƒˆƒƒƒƒƒƒƒƒˆƒƒƒƒƒƒƒƒˆƒƒƒƒƒƒƒƒ‰‚ ‚RowPctN ‚ 11.8‚ 5.9‚ 14.7‚ 35.3‚ 32.4‚‡ƒƒƒƒƒƒƒƒˆƒƒƒƒƒƒƒƒƒˆƒƒƒƒƒƒƒƒˆƒƒƒƒƒƒƒƒˆƒƒƒƒƒƒƒƒˆƒƒƒƒƒƒƒƒˆƒƒƒƒƒƒƒƒ‰‚DEN ‚N ‚ 8‚ 2‚ 4‚ 11‚ 8‚‚ ‡ƒƒƒƒƒƒƒƒƒˆƒƒƒƒƒƒƒƒˆƒƒƒƒƒƒƒƒˆƒƒƒƒƒƒƒƒˆƒƒƒƒƒƒƒƒˆƒƒƒƒƒƒƒƒ‰‚ ‚RowPctN ‚ 24.2‚ 6.1‚ 12.1‚ 33.3‚ 24.2‚‡ƒƒƒƒƒƒƒƒˆƒƒƒƒƒƒƒƒƒˆƒƒƒƒƒƒƒƒˆƒƒƒƒƒƒƒƒˆƒƒƒƒƒƒƒƒˆƒƒƒƒƒƒƒƒˆƒƒƒƒƒƒƒƒ‰‚DEU ‚N ‚ 9‚ 3‚ 14‚ 18‚ 28‚‚ ‡ƒƒƒƒƒƒƒƒƒˆƒƒƒƒƒƒƒƒˆƒƒƒƒƒƒƒƒˆƒƒƒƒƒƒƒƒ̂ ƒƒƒƒƒƒƒƒˆƒƒƒƒƒƒƒƒ‰‚ ‚RowPctN ‚ 12.5‚ 4.2‚ 19.4‚ 25.0‚ 38.9‚‡ƒƒƒƒƒƒƒƒˆƒƒƒƒƒƒƒƒƒˆƒƒƒƒƒƒƒƒˆƒƒƒƒƒƒƒƒˆƒƒƒƒƒƒƒƒˆƒƒƒƒƒƒƒƒˆƒƒƒƒƒƒƒƒ‰‚FIN ‚N ‚ 19‚ 6‚ 14‚ 29‚ 14‚‚ ‡ƒƒƒƒƒƒƒƒƒˆƒƒƒƒƒƒƒƒˆƒƒƒƒƒƒƒƒˆƒƒƒƒƒƒƒƒˆƒƒƒƒƒƒƒƒˆƒƒƒƒƒƒƒƒ‰‚ ‚RowPctN ‚ 23.2‚ 7.3‚ 17.1‚ 35.4‚ 17.1‚‡ƒƒƒƒƒƒƒƒˆƒƒƒƒƒƒƒƒƒˆƒƒƒƒƒƒƒƒˆƒƒƒƒƒƒƒƒˆƒƒƒƒƒƒƒƒˆƒƒƒƒƒƒƒƒˆƒƒƒƒƒƒƒƒ‰‚FRA ‚N ‚ 11‚ 5‚ 25‚ 36‚ 20‚‚ ‡ƒƒƒƒƒƒƒƒƒˆƒƒƒƒƒƒƒƒˆƒƒƒƒƒƒƒƒˆƒƒƒƒƒƒƒƒˆƒƒƒƒƒƒƒƒˆƒƒƒƒƒƒƒƒ‰‚ ‚RowPctN ‚ 11.3‚ 5.2‚ 25.8‚ 37.1‚ 20.6‚‡ƒƒƒƒƒƒƒƒˆƒƒƒƒƒƒƒƒƒˆƒƒƒƒƒƒƒƒˆƒƒƒƒƒƒƒƒˆƒƒƒƒƒƒƒƒˆƒƒƒƒƒƒƒƒˆƒƒƒƒƒƒƒƒ‰‚IRE ‚N ‚ 8‚ 7‚ 9‚ 27‚ 26‚‚ ‡ƒƒƒƒƒƒƒƒƒˆƒƒƒƒƒƒƒƒˆƒƒƒƒƒƒƒƒˆƒƒƒƒƒƒƒƒˆƒƒƒƒƒƒƒƒˆƒƒƒƒƒƒƒƒ‰‚ ‚RowPctN ‚ 10.4‚ 9.1‚ 11.7‚ 35.1‚ 33.8‚‡ƒƒƒƒƒƒƒƒˆƒƒƒƒƒƒƒƒƒˆƒƒƒƒƒƒƒƒˆƒƒƒƒƒƒƒƒˆƒƒƒƒƒƒƒƒˆƒƒƒƒƒƒƒƒˆƒƒƒƒƒƒƒƒ‰‚LUX ‚N ‚ .‚ 2‚ 2‚ 3‚ 5‚‚ ‡ƒƒƒƒƒƒƒƒƒˆƒƒƒƒƒƒƒƒˆƒƒƒƒƒƒƒƒˆƒƒƒƒƒƒƒƒˆƒƒƒƒƒƒƒƒˆƒƒƒƒƒƒƒƒ‰‚ ‚RowPctN ‚ .‚ 16.7‚ 16.7‚ 25.0‚ 41.7‚‡ƒƒƒƒƒƒƒƒˆƒƒƒƒƒƒƒƒƒˆƒƒƒƒƒƒƒƒˆƒƒƒƒƒƒƒƒˆƒƒƒƒƒƒƒƒˆƒƒƒƒƒƒƒƒˆƒƒƒƒƒƒƒƒ‰‚NET ‚N ‚ 11‚ 10‚ 16‚ 12‚ 12‚‚ ‡ƒƒƒƒƒƒƒƒƒˆƒƒƒƒƒƒƒƒˆƒƒƒƒƒƒƒƒˆƒƒƒƒƒƒƒƒˆƒƒƒƒƒƒƒƒˆƒƒƒƒƒƒƒƒ‰‚ ‚RowPctN ‚ 18.0‚ 16.4‚ 26.2‚ 19.7‚ 19.7‚‡ƒƒƒƒƒƒƒƒˆƒƒƒƒƒƒƒƒƒˆƒƒƒƒƒƒƒƒˆƒƒƒƒƒƒƒƒˆƒƒƒƒƒƒƒƒˆƒƒƒƒƒƒƒƒˆƒƒƒƒƒƒƒƒ‰‚POR ‚N ‚ 4‚ 9‚ 6‚ 18‚ 25‚‚ ‡ƒƒƒƒƒƒƒƒƒˆƒƒƒƒƒƒƒƒˆƒƒƒƒƒƒƒƒˆƒƒƒƒƒƒƒƒˆƒƒƒƒƒƒƒƒˆƒƒƒƒƒƒƒƒ‰‚ ‚RowPctN ‚ 6.5‚ 14.5‚ 9.7‚ 29.0‚ 40.3‚‡ƒƒƒƒƒƒƒƒˆƒƒƒƒƒƒƒƒƒˆƒƒƒƒƒƒƒƒˆƒƒƒƒƒƒƒƒˆƒƒƒƒƒƒƒƒˆƒƒƒƒƒƒƒƒˆƒƒƒƒƒƒƒƒ‰‚SWE ‚N ‚ 13‚ 15‚ 29‚ 46‚ 9‚‚ ‡ƒƒƒƒƒƒƒƒƒˆƒƒƒƒƒƒƒƒˆƒƒƒƒƒƒƒƒˆƒƒƒƒƒƒƒƒˆƒƒƒƒƒƒƒƒˆƒƒƒƒƒƒƒƒ‰‚ ‚RowPctN ‚ 11.6‚ 13.4‚ 25.9‚ 41.1‚ 8.0‚‡ƒƒƒƒƒƒƒƒˆƒƒƒƒƒƒƒƒƒˆƒƒƒƒƒƒƒƒˆƒƒƒƒƒƒƒƒˆƒƒƒƒƒƒƒƒˆƒƒƒƒƒƒƒƒˆƒƒƒƒƒƒƒƒ‰
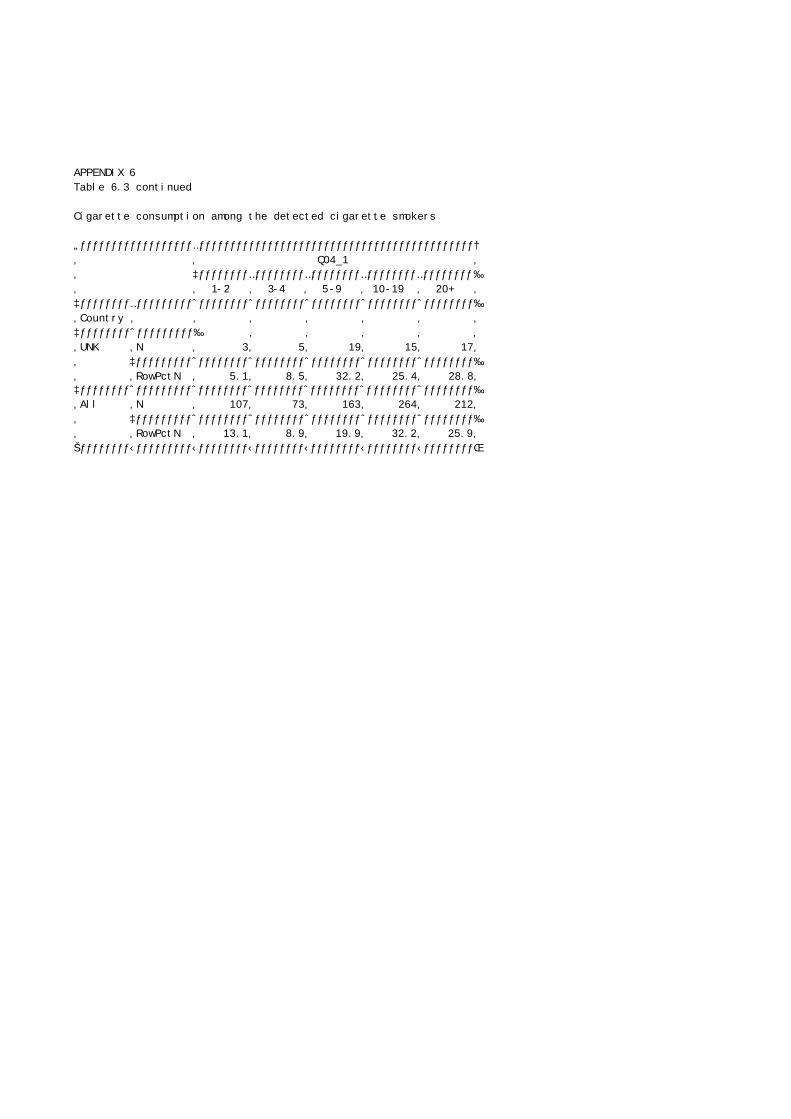
APPENDIX 6Table 6.3 continued
Cigarette consumption among the detected cigarette smokers
„ƒƒƒƒƒƒƒƒƒƒƒƒƒƒƒƒƒƒ…ƒƒƒƒƒƒƒƒƒƒƒƒƒƒƒƒƒƒƒƒƒƒƒƒƒƒƒƒƒƒƒƒƒƒƒƒƒƒƒƒƒƒƒƒ†‚ ‚ Q04_1 ‚‚ ‡ƒƒƒƒƒƒƒƒ…ƒƒƒƒƒƒƒƒ…ƒƒƒƒƒƒƒƒ…ƒƒƒƒƒƒƒƒ…ƒƒƒƒƒƒƒƒ‰‚ ‚ 1-2 ‚ 3-4 ‚ 5-9 ‚ 10-19 ‚ 20+ ‚‡ƒƒƒƒƒƒƒƒ…ƒƒƒƒƒƒƒƒƒˆƒƒƒƒƒƒƒƒˆƒƒƒƒƒƒƒƒˆƒƒƒƒƒƒƒƒˆƒƒƒƒƒƒƒƒˆƒƒƒƒƒƒƒƒ‰‚Country ‚ ‚ ‚ ‚ ‚ ‚ ‚‡ƒƒƒƒƒƒƒƒˆƒƒƒƒƒƒƒƒƒ‰ ‚ ‚ ‚ ‚ ‚‚UNK ‚N ‚ 3‚ 5‚ 19‚ 15‚ 17‚‚ ‡ƒƒƒƒƒƒƒƒƒˆƒƒƒƒƒƒƒƒˆƒƒƒƒƒƒƒƒˆƒƒƒƒƒƒƒƒˆƒƒƒƒƒƒƒƒˆƒƒƒƒƒƒƒƒ‰‚ ‚RowPctN ‚ 5.1‚ 8.5‚ 32.2‚ 25.4‚ 28.8‚‡ƒƒƒƒƒƒƒƒˆƒƒƒƒƒƒƒƒƒˆƒƒƒƒƒƒƒƒˆƒƒƒƒƒƒƒƒˆƒƒƒƒƒƒƒƒˆƒƒƒƒƒƒƒƒˆƒƒƒƒƒƒƒƒ‰‚All ‚N ‚ 107‚ 73‚ 163‚ 264‚ 212‚‚ ‡ƒƒƒƒƒƒƒƒƒˆƒƒƒƒƒƒƒƒˆƒƒƒƒƒƒƒƒˆƒƒƒƒƒƒƒƒˆƒƒƒƒƒƒƒƒˆƒƒƒƒƒƒƒƒ‰‚ ‚RowPctN ‚ 13.1‚ 8.9‚ 19.9‚ 32.2‚ 25.9‚Šƒƒƒƒƒƒƒƒ‹ƒƒƒƒƒƒƒƒƒ‹ƒƒƒƒƒƒƒƒ‹ƒƒƒƒƒƒƒƒ‹ƒƒƒƒƒƒƒƒ‹ƒƒƒƒƒƒƒƒ‹ƒƒƒƒƒƒƒƒŒ

Appendix 7 Question 5.1, Would you like to stop smoking?
7.1 Figure
Willingness to stop smoking by country
0%
10%
20%
30%
40%
50%
60%
70%
80%
90%
100%
AUT BEL DEN DEU FIN FRA IRE LUX NET POR SWE UNK
No infoNo
Yes
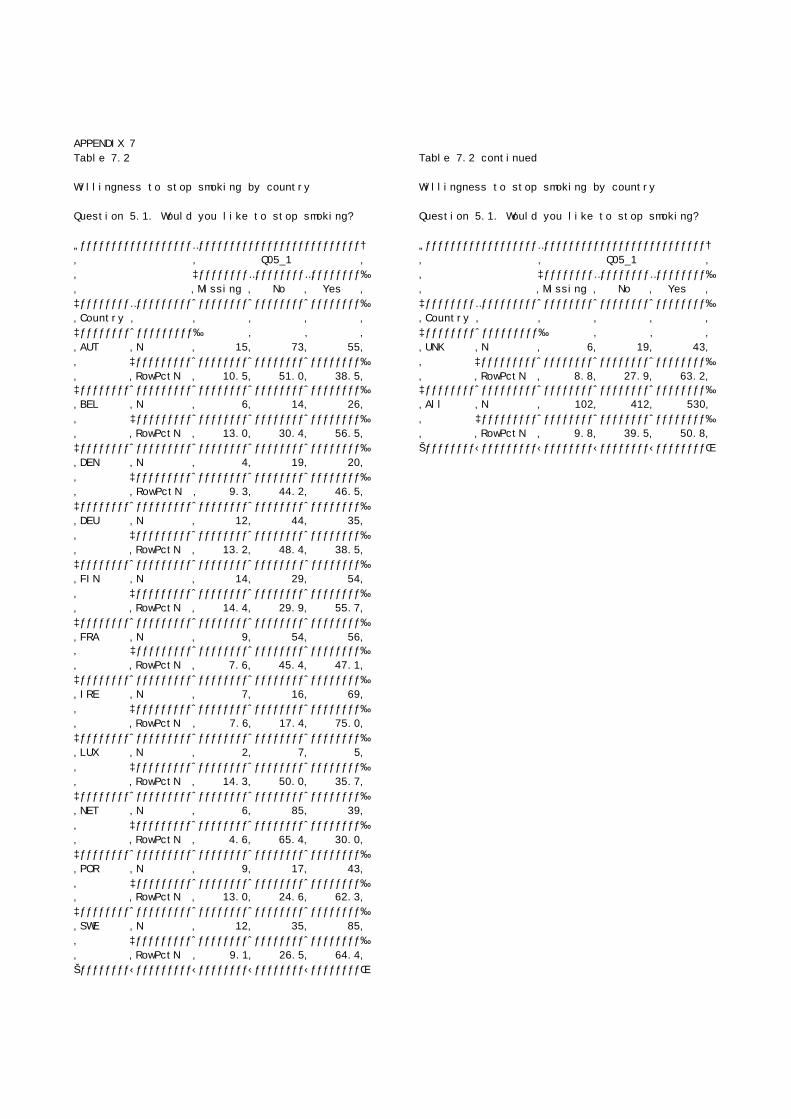
APPENDIX 7Table 7.2
Willingness to stop smoking by country
Question 5.1. Would you like to stop smoking?
„ƒƒƒƒƒƒƒƒƒƒƒƒƒƒƒƒƒƒ…ƒƒƒƒƒƒƒƒƒƒƒƒƒƒƒƒƒƒƒƒƒƒƒƒƒƒ†‚ ‚ Q05_1 ‚‚ ‡ƒƒƒƒƒƒƒƒ…ƒƒƒƒƒƒƒƒ…ƒƒƒƒƒƒƒƒ‰‚ ‚Missing ‚ No ‚ Yes ‚‡ƒƒƒƒƒƒƒƒ…ƒƒƒƒƒƒƒƒƒˆƒƒƒƒƒƒƒƒˆƒƒƒƒƒƒƒƒˆƒƒƒƒƒƒƒƒ‰‚Country ‚ ‚ ‚ ‚ ‚‡ƒƒƒƒƒƒƒƒˆƒƒƒƒƒƒƒƒƒ‰ ‚ ‚ ‚‚AUT ‚N ‚ 15‚ 73‚ 55‚‚ ‡ƒƒƒƒƒƒƒƒƒˆƒƒƒƒƒƒƒƒˆƒƒƒƒƒƒƒƒˆƒƒƒƒƒƒƒƒ‰‚ ‚RowPctN ‚ 10.5‚ 51.0‚ 38.5‚‡ƒƒƒƒƒƒƒƒˆƒƒƒƒƒƒƒƒƒˆƒƒƒƒƒƒƒƒˆƒƒƒƒƒƒƒƒˆƒƒƒƒƒƒƒƒ‰‚BEL ‚N ‚ 6‚ 14‚ 26‚‚ ‡ƒƒƒƒƒƒƒƒƒˆƒƒƒƒƒƒƒƒˆƒƒƒƒƒƒƒƒˆƒƒƒƒƒƒƒƒ‰‚ ‚RowPctN ‚ 13.0‚ 30.4‚ 56.5‚‡ƒƒƒƒƒƒƒƒˆƒƒƒƒƒƒƒƒƒˆƒƒƒƒƒƒƒƒˆƒƒƒƒƒƒƒƒˆƒƒƒƒƒƒƒƒ‰‚DEN ‚N ‚ 4‚ 19‚ 20‚‚ ‡ƒƒƒƒƒƒƒƒƒˆƒƒƒƒƒƒƒƒˆƒƒƒƒƒƒƒƒˆƒƒƒƒƒƒƒƒ‰‚ ‚RowPctN ‚ 9.3‚ 44.2‚ 46.5‚‡ƒƒƒƒƒƒƒƒˆƒƒƒƒƒƒƒƒƒˆƒƒƒƒƒƒƒƒˆƒƒƒƒƒƒƒƒˆƒƒƒƒƒƒƒƒ‰‚DEU ‚N ‚ 12‚ 44‚ 35‚‚ ‡ƒƒƒƒƒƒƒƒƒˆƒƒƒƒƒƒƒƒˆƒƒƒƒƒƒƒƒˆƒƒƒƒƒƒƒƒ‰‚ ‚RowPctN ‚ 13.2‚ 48.4‚ 38.5‚‡ƒƒƒƒƒƒƒƒˆƒƒƒƒƒƒƒƒƒˆƒƒƒƒƒƒƒƒˆƒƒƒƒƒƒƒƒˆƒƒƒƒƒƒƒƒ‰‚FIN ‚N ‚ 14‚ 29‚ 54‚‚ ‡ƒƒƒƒƒƒƒƒƒˆƒƒƒƒƒƒƒƒˆƒƒƒƒƒƒƒƒˆƒƒƒƒƒƒƒƒ‰‚ ‚RowPctN ‚ 14.4‚ 29.9‚ 55.7‚‡ƒƒƒƒƒƒƒƒˆƒƒƒƒƒƒƒƒƒˆƒƒƒƒƒƒƒƒˆƒƒƒƒƒƒƒƒˆƒƒƒƒƒƒƒƒ‰‚FRA ‚N ‚ 9‚ 54‚ 56‚‚ ‡ƒƒƒƒƒƒƒƒƒˆƒƒƒƒƒƒƒƒˆƒƒƒƒƒƒƒƒˆƒƒƒƒƒƒƒƒ‰‚ ‚RowPctN ‚ 7.6‚ 45.4‚ 47.1‚‡ƒƒƒƒƒƒƒƒˆƒƒƒƒƒƒƒƒƒˆƒƒƒƒƒƒƒƒˆƒƒƒƒƒƒƒƒˆƒƒƒƒƒƒƒƒ‰‚IRE ‚N ‚ 7‚ 16‚ 69‚‚ ‡ƒƒƒƒƒƒƒƒƒˆƒƒƒƒƒƒƒƒˆƒƒƒƒƒƒƒƒˆƒƒƒƒƒƒƒƒ‰‚ ‚RowPctN ‚ 7.6‚ 17.4‚ 75.0‚‡ƒƒƒƒƒƒƒƒˆƒƒƒƒƒƒƒƒƒˆƒƒƒƒƒƒƒƒˆƒƒƒƒƒƒƒƒˆƒƒƒƒƒƒƒƒ‰‚LUX ‚N ‚ 2‚ 7‚ 5‚‚ ‡ƒƒƒƒƒƒƒƒƒˆƒƒƒƒƒƒƒƒˆƒƒƒƒƒƒƒƒˆƒƒƒƒƒƒƒƒ‰‚ ‚RowPctN ‚ 14.3‚ 50.0‚ 35.7‚‡ƒƒƒƒƒƒƒƒˆƒƒƒƒƒƒƒƒƒˆƒƒƒƒƒƒƒƒˆƒƒƒƒƒƒƒƒˆƒƒƒƒƒƒƒƒ‰‚NET ‚N ‚ 6‚ 85‚ 39‚‚ ‡ƒƒƒƒƒƒƒƒƒˆƒƒƒƒƒƒƒƒˆƒƒƒƒƒƒƒƒˆƒƒƒƒƒƒƒƒ‰‚ ‚RowPctN ‚ 4.6‚ 65.4‚ 30.0‚‡ƒƒƒƒƒƒƒƒˆƒƒƒƒƒƒƒƒƒˆƒƒƒƒƒƒƒƒˆƒƒƒƒƒƒƒƒˆƒƒƒƒƒƒƒƒ‰‚POR ‚N ‚ 9‚ 17‚ 43‚‚ ‡ƒƒƒƒƒƒƒƒƒˆƒƒƒƒƒƒƒƒˆƒƒƒƒƒƒƒƒˆƒƒƒƒƒƒƒƒ‰‚ ‚RowPctN ‚ 13.0‚ 24.6‚ 62.3‚‡ƒƒƒƒƒƒƒƒˆƒƒƒƒƒƒƒƒƒˆƒƒƒƒƒƒƒƒˆƒƒƒƒƒƒƒƒˆƒƒƒƒƒƒƒƒ‰‚SWE ‚N ‚ 12‚ 35‚ 85‚‚ ‡ƒƒƒƒƒƒƒƒƒˆƒƒƒƒƒƒƒƒˆƒƒƒƒƒƒƒƒˆƒƒƒƒƒƒƒƒ‰‚ ‚RowPctN ‚ 9.1‚ 26.5‚ 64.4‚Šƒƒƒƒƒƒƒƒ‹ƒƒƒƒƒƒƒƒƒ‹ƒƒƒƒƒƒƒƒ‹ƒƒƒƒƒƒƒƒ‹ƒƒƒƒƒƒƒƒŒ
Table 7.2 continued
Willingness to stop smoking by country
Question 5.1. Would you like to stop smoking?
„ƒƒƒƒƒƒƒƒƒƒƒƒƒƒƒƒƒƒ…ƒƒƒƒƒƒƒƒƒƒƒƒƒƒƒƒƒƒƒƒƒƒƒƒƒƒ†‚ ‚ Q05_1 ‚‚ ‡ƒƒƒƒƒƒƒƒ…ƒƒƒƒƒƒƒƒ…ƒƒƒƒƒƒƒƒ‰‚ ‚Missing ‚ No ‚ Yes ‚‡ƒƒƒƒƒƒƒƒ…ƒƒƒƒƒƒƒƒƒˆƒƒƒƒƒƒƒƒˆƒƒƒƒƒƒƒƒˆƒƒƒƒƒƒƒƒ‰‚Country ‚ ‚ ‚ ‚ ‚‡ƒƒƒƒƒƒƒƒˆƒƒƒƒƒƒƒƒƒ‰ ‚ ‚ ‚‚UNK ‚N ‚ 6‚ 19‚ 43‚‚ ‡ƒƒƒƒƒƒƒƒƒˆƒƒƒƒƒƒƒƒˆƒƒƒƒƒƒƒƒˆƒƒƒƒƒƒƒƒ‰‚ ‚RowPctN ‚ 8.8‚ 27.9‚ 63.2‚‡ƒƒƒƒƒƒƒƒˆƒƒƒƒƒƒƒƒƒˆƒƒƒƒƒƒƒƒˆƒƒƒƒƒƒƒƒˆƒƒƒƒƒƒƒƒ‰‚All ‚N ‚ 102‚ 412‚ 530‚‚ ‡ƒƒƒƒƒƒƒƒƒˆƒƒƒƒƒƒƒƒˆƒƒƒƒƒƒƒƒˆƒƒƒƒƒƒƒƒ‰‚ ‚RowPctN ‚ 9.8‚ 39.5‚ 50.8‚Šƒƒƒƒƒƒƒƒ‹ƒƒƒƒƒƒƒƒƒ‹ƒƒƒƒƒƒƒƒ‹ƒƒƒƒƒƒƒƒ‹ƒƒƒƒƒƒƒƒŒ
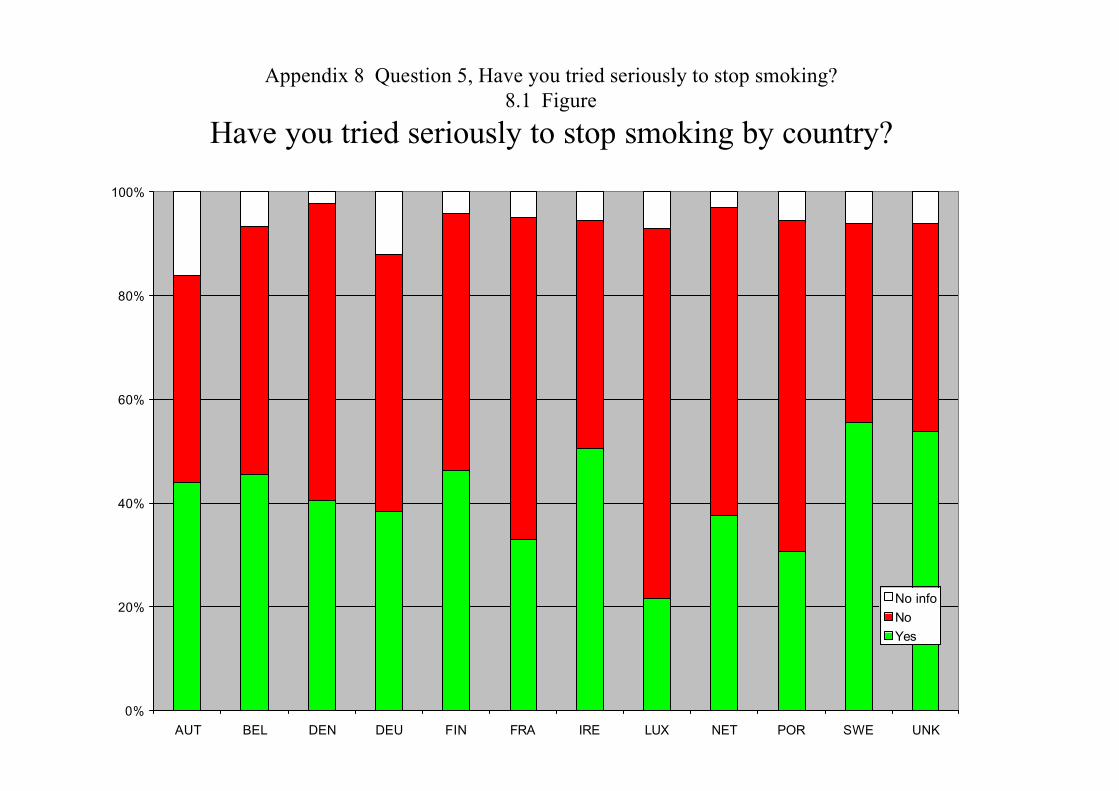
Appendix 8 Question 5, Have you tried seriously to stop smoking?8.1 Figure
Have you tried seriously to stop smoking by country?
0%
20%
40%
60%
80%
100%
AUT BEL DEN DEU FIN FRA IRE LUX NET POR SWE UNK
No infoNoYes
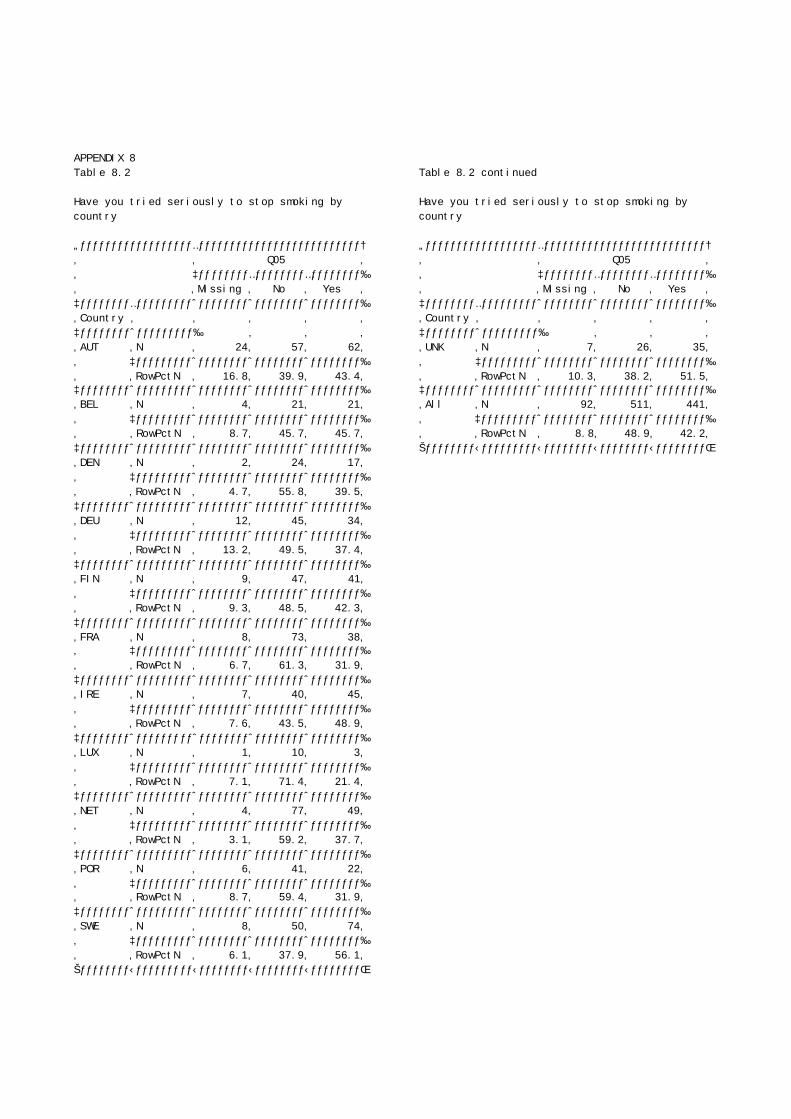
APPENDIX 8Table 8.2
Have you tried seriously to stop smoking by country
„ƒƒƒƒƒƒƒƒƒƒƒƒƒƒƒƒƒƒ…ƒƒƒƒƒƒƒƒƒƒƒƒƒƒƒƒƒƒƒƒƒƒƒƒƒƒ†‚ ‚ Q05 ‚‚ ‡ƒƒƒƒƒƒƒƒ…ƒƒƒƒƒƒƒƒ…ƒƒƒƒƒƒƒƒ‰‚ ‚Missing ‚ No ‚ Yes ‚‡ƒƒƒƒƒƒƒƒ…ƒƒƒƒƒƒƒƒƒˆƒƒƒƒƒƒƒƒˆƒƒƒƒƒƒƒƒˆƒƒƒƒƒƒƒƒ‰‚Country ‚ ‚ ‚ ‚ ‚‡ƒƒƒƒƒƒƒƒˆƒƒƒƒƒƒƒƒƒ‰ ‚ ‚ ‚‚AUT ‚N ‚ 24‚ 57‚ 62‚‚ ‡ƒƒƒƒƒƒƒƒƒˆƒƒƒƒƒƒƒƒˆƒƒƒƒƒƒƒƒˆƒƒƒƒƒƒƒƒ‰‚ ‚RowPctN ‚ 16.8‚ 39.9‚ 43.4‚‡ƒƒƒƒƒƒƒƒˆƒƒƒƒƒƒƒƒƒˆƒƒƒƒƒƒƒƒˆƒƒƒƒƒƒƒƒˆƒƒƒƒƒƒƒƒ‰‚BEL ‚N ‚ 4‚ 21‚ 21‚‚ ‡ƒƒƒƒƒƒƒƒƒˆƒƒƒƒƒƒƒƒˆƒƒƒƒƒƒƒƒˆƒƒƒƒƒƒƒƒ‰‚ ‚RowPctN ‚ 8.7‚ 45.7‚ 45.7‚‡ƒƒƒƒƒƒƒƒˆƒƒƒƒƒƒƒƒƒˆƒƒƒƒƒƒƒƒˆƒƒƒƒƒƒƒƒˆƒƒƒƒƒƒƒƒ‰‚DEN ‚N ‚ 2‚ 24‚ 17‚‚ ‡ƒƒƒƒƒƒƒƒƒˆƒƒƒƒƒƒƒƒˆƒƒƒƒƒƒƒƒˆƒƒƒƒƒƒƒƒ‰‚ ‚RowPctN ‚ 4.7‚ 55.8‚ 39.5‚‡ƒƒƒƒƒƒƒƒˆƒƒƒƒƒƒƒƒƒˆƒƒƒƒƒƒƒƒˆƒƒƒƒƒƒƒƒˆƒƒƒƒƒƒƒƒ‰‚DEU ‚N ‚ 12‚ 45‚ 34‚‚ ‡ƒƒƒƒƒƒƒƒƒˆƒƒƒƒƒƒƒƒˆƒƒƒƒƒƒƒƒˆƒƒƒƒƒƒƒƒ‰‚ ‚RowPctN ‚ 13.2‚ 49.5‚ 37.4‚‡ƒƒƒƒƒƒƒƒˆƒƒƒƒƒƒƒƒƒˆƒƒƒƒƒƒƒƒˆƒƒƒƒƒƒƒƒˆƒƒƒƒƒƒƒƒ‰‚FIN ‚N ‚ 9‚ 47‚ 41‚‚ ‡ƒƒƒƒƒƒƒƒƒˆƒƒƒƒƒƒƒƒˆƒƒƒƒƒƒƒƒˆƒƒƒƒƒƒƒƒ‰‚ ‚RowPctN ‚ 9.3‚ 48.5‚ 42.3‚‡ƒƒƒƒƒƒƒƒˆƒƒƒƒƒƒƒƒƒˆƒƒƒƒƒƒƒƒˆƒƒƒƒƒƒƒƒˆƒƒƒƒƒƒƒƒ‰‚FRA ‚N ‚ 8‚ 73‚ 38‚‚ ‡ƒƒƒƒƒƒƒƒƒˆƒƒƒƒƒƒƒƒˆƒƒƒƒƒƒƒƒˆƒƒƒƒƒƒƒƒ‰‚ ‚RowPctN ‚ 6.7‚ 61.3‚ 31.9‚‡ƒƒƒƒƒƒƒƒˆƒƒƒƒƒƒƒƒƒˆƒƒƒƒƒƒƒƒˆƒƒƒƒƒƒƒƒˆƒƒƒƒƒƒƒƒ‰‚IRE ‚N ‚ 7‚ 40‚ 45‚‚ ‡ƒƒƒƒƒƒƒƒƒˆƒƒƒƒƒƒƒƒˆƒƒƒƒƒƒƒƒˆƒƒƒƒƒƒƒƒ‰‚ ‚RowPctN ‚ 7.6‚ 43.5‚ 48.9‚‡ƒƒƒƒƒƒƒƒˆƒƒƒƒƒƒƒƒƒˆƒƒƒƒƒƒƒƒˆƒƒƒƒƒƒƒƒˆƒƒƒƒƒƒƒƒ‰‚LUX ‚N ‚ 1‚ 10‚ 3‚‚ ‡ƒƒƒƒƒƒƒƒƒˆƒƒƒƒƒƒƒƒˆƒƒƒƒƒƒƒƒˆƒƒƒƒƒƒƒƒ‰‚ ‚RowPctN ‚ 7.1‚ 71.4‚ 21.4‚‡ƒƒƒƒƒƒƒƒˆƒƒƒƒƒƒƒƒƒˆƒƒƒƒƒƒƒƒˆƒƒƒƒƒƒƒƒˆƒƒƒƒƒƒƒƒ‰‚NET ‚N ‚ 4‚ 77‚ 49‚‚ ‡ƒƒƒƒƒƒƒƒƒˆƒƒƒƒƒƒƒƒˆƒƒƒƒƒƒƒƒˆƒƒƒƒƒƒƒƒ‰‚ ‚RowPctN ‚ 3.1‚ 59.2‚ 37.7‚‡ƒƒƒƒƒƒƒƒˆƒƒƒƒƒƒƒƒƒˆƒƒƒƒƒƒƒƒˆƒƒƒƒƒƒƒƒˆƒƒƒƒƒƒƒƒ‰‚POR ‚N ‚ 6‚ 41‚ 22‚‚ ‡ƒƒƒƒƒƒƒƒƒˆƒƒƒƒƒƒƒƒˆƒƒƒƒƒƒƒƒˆƒƒƒƒƒƒƒƒ‰‚ ‚RowPctN ‚ 8.7‚ 59.4‚ 31.9‚‡ƒƒƒƒƒƒƒƒˆƒƒƒƒƒƒƒƒƒˆƒƒƒƒƒƒƒƒˆƒƒƒƒƒƒƒƒˆƒƒƒƒƒƒƒƒ‰‚SWE ‚N ‚ 8‚ 50‚ 74‚‚ ‡ƒƒƒƒƒƒƒƒƒˆƒƒƒƒƒƒƒƒˆƒƒƒƒƒƒƒƒˆƒƒƒƒƒƒƒƒ‰‚ ‚RowPctN ‚ 6.1‚ 37.9‚ 56.1‚Šƒƒƒƒƒƒƒƒ‹ƒƒƒƒƒƒƒƒƒ‹ƒƒƒƒƒƒƒƒ‹ƒƒƒƒƒƒƒƒ‹ƒƒƒƒƒƒƒƒŒ
Table 8.2 continued
Have you tried seriously to stop smoking by country
„ƒƒƒƒƒƒƒƒƒƒƒƒƒƒƒƒƒƒ…ƒƒƒƒƒƒƒƒƒƒƒƒƒƒƒƒƒƒƒƒƒƒƒƒƒƒ†‚ ‚ Q05 ‚‚ ‡ƒƒƒƒƒƒƒƒ…ƒƒƒƒƒƒƒƒ…ƒƒƒƒƒƒƒƒ‰‚ ‚Missing ‚ No ‚ Yes ‚‡ƒƒƒƒƒƒƒƒ…ƒƒƒƒƒƒƒƒƒˆƒƒƒƒƒƒƒƒˆƒƒƒƒƒƒƒƒˆƒƒƒƒƒƒƒƒ‰‚Country ‚ ‚ ‚ ‚ ‚‡ƒƒƒƒƒƒƒƒˆƒƒƒƒƒƒƒƒƒ‰ ‚ ‚ ‚‚UNK ‚N ‚ 7‚ 26‚ 35‚‚ ‡ƒƒƒƒƒƒƒƒƒˆƒƒƒƒƒƒƒƒˆƒƒƒƒƒƒƒƒˆƒƒƒƒƒƒƒƒ‰‚ ‚RowPctN ‚ 10.3‚ 38.2‚ 51.5‚‡ƒƒƒƒƒƒƒƒˆƒƒƒƒƒƒƒƒƒˆƒƒƒƒƒƒƒƒˆƒƒƒƒƒƒƒƒˆƒƒƒƒƒƒƒƒ‰‚All ‚N ‚ 92‚ 511‚ 441‚‚ ‡ƒƒƒƒƒƒƒƒƒˆƒƒƒƒƒƒƒƒˆƒƒƒƒƒƒƒƒˆƒƒƒƒƒƒƒƒ‰‚ ‚RowPctN ‚ 8.8‚ 48.9‚ 42.2‚Šƒƒƒƒƒƒƒƒ‹ƒƒƒƒƒƒƒƒƒ‹ƒƒƒƒƒƒƒƒ‹ƒƒƒƒƒƒƒƒ‹ƒƒƒƒƒƒƒƒŒ

APPENDIX 8Table 8.2 continued
Have you tried seriously to stop smoking - frequences
Cumulative CumulativeQ05_1 Frequency Percent Frequency Percentƒƒƒƒƒƒƒƒƒƒƒƒƒƒƒƒƒƒƒƒƒƒƒƒƒƒƒƒƒƒƒƒƒƒƒƒƒƒƒƒƒƒƒƒƒƒƒƒƒƒƒƒƒƒƒƒƒƒ
-1 87 8.33 87 8.33 0 15 1.44 102 9.77 1 412 39.46 514 49.23 2 530 50.77 1044 100.00
Cumulative CumulativeQ05 Frequency Percent Frequency Percentƒƒƒƒƒƒƒƒƒƒƒƒƒƒƒƒƒƒƒƒƒƒƒƒƒƒƒƒƒƒƒƒƒƒƒƒƒƒƒƒƒƒƒƒƒƒƒƒƒƒƒƒƒƒƒƒ-1 79 7.57 79 7.57
0 13 1.25 92 8.81 1 511 48.95 603 57.76 2 441 42.24 1044 100.00
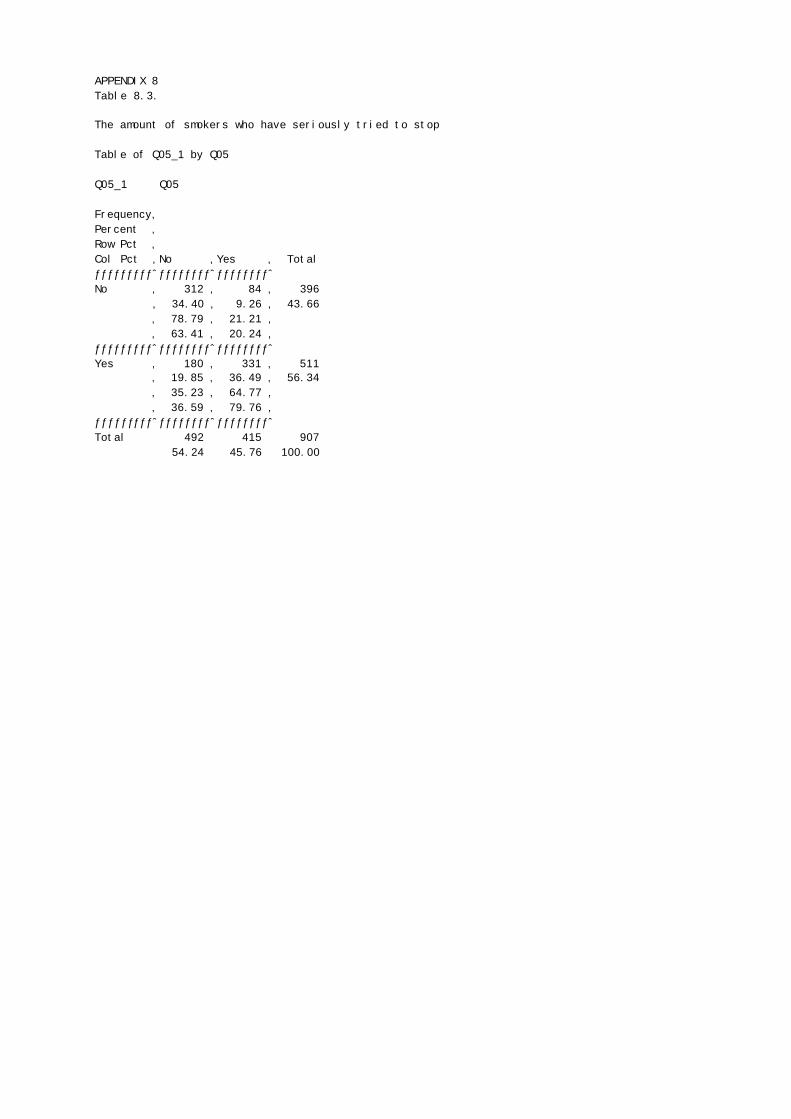
APPENDIX 8Table 8.3.
The amount of smokers who have seriously tried to stop
Table of Q05_1 by Q05
Q05_1 Q05
Frequency‚Percent ‚Row Pct ‚Col Pct ‚No ‚Yes ‚ TotalƒƒƒƒƒƒƒƒƒˆƒƒƒƒƒƒƒƒˆƒƒƒƒƒƒƒƒˆNo ‚ 312 ‚ 84 ‚ 396
‚ 34.40 ‚ 9.26 ‚ 43.66 ‚ 78.79 ‚ 21.21 ‚ ‚ 63.41 ‚ 20.24 ‚ƒƒƒƒƒƒƒƒƒˆƒƒƒƒƒƒƒƒˆƒƒƒƒƒƒƒƒˆYes ‚ 180 ‚ 331 ‚ 511 ‚ 19.85 ‚ 36.49 ‚ 56.34 ‚ 35.23 ‚ 64.77 ‚ ‚ 36.59 ‚ 79.76 ‚ƒƒƒƒƒƒƒƒƒˆƒƒƒƒƒƒƒƒˆƒƒƒƒƒƒƒƒˆTotal 492 415 907 54.24 45.76 100.00

APPENDIX 9Table 9.1. Do you ever smoke in the public area of the pharmacy you are working in?
„ƒƒƒƒƒƒƒƒƒƒƒƒƒƒƒƒƒƒ…ƒƒƒƒƒƒƒƒƒƒƒƒƒƒƒƒƒƒƒƒƒƒƒƒƒƒ†‚ ‚ Q06 ‚‚ ‡ƒƒƒƒƒƒƒƒ…ƒƒƒƒƒƒƒƒ…ƒƒƒƒƒƒƒƒ‰‚ ‚Missing ‚ No ‚ Yes ‚‡ƒƒƒƒƒƒƒƒ…ƒƒƒƒƒƒƒƒƒˆƒƒƒƒƒƒƒƒˆƒƒƒƒƒƒƒƒˆƒƒƒƒƒƒƒƒ‰‚Country ‚ ‚ ‚ ‚ ‚‡ƒƒƒƒƒƒƒƒˆƒƒƒƒƒƒƒƒƒ‰ ‚ ‚ ‚‚AUT ‚N ‚ 6‚ 129‚ 8‚‚ ‡ƒƒƒƒƒƒƒƒƒˆƒƒƒƒƒƒƒƒˆƒƒƒƒƒƒƒƒˆƒƒƒƒƒƒƒƒ‰‚ ‚RowPctN ‚ 4.2‚ 90.2‚ 5.6‚‡ƒƒƒƒƒƒƒƒˆƒƒƒƒƒƒƒƒƒˆƒƒƒƒƒƒƒƒˆƒƒƒƒƒƒƒƒˆƒƒƒƒƒƒƒƒ‰‚BEL ‚N ‚ 3‚ 41‚ 2‚‚ ‡ƒƒƒƒƒƒƒƒƒˆƒƒƒƒƒƒƒƒˆƒƒƒƒƒƒƒƒˆƒƒƒƒƒƒƒƒ‰‚ ‚RowPctN ‚ 6.5‚ 89.1‚ 4.3‚‡ƒƒƒƒƒƒƒƒˆƒƒƒƒƒƒƒƒƒˆƒƒƒƒƒƒƒƒˆƒƒƒƒƒƒƒƒˆƒƒƒƒƒƒƒƒ‰‚DEN ‚N ‚ 1‚ 40‚ 2‚‚ ‡ƒƒƒƒƒƒƒƒƒˆƒƒƒƒƒƒƒƒˆƒƒƒƒƒƒƒƒˆƒƒƒƒƒƒƒƒ‰‚ ‚RowPctN ‚ 2.3‚ 93.0‚ 4.7‚‡ƒƒƒƒƒƒƒƒˆƒƒƒƒƒƒƒƒƒˆƒƒƒƒƒƒƒƒˆƒƒƒƒƒƒƒƒˆƒƒƒƒƒƒƒƒ‰‚DEU ‚N ‚ 6‚ 80‚ 5‚‚ ‡ƒƒƒƒƒƒƒƒƒˆƒƒƒƒƒƒƒƒˆƒƒƒƒƒƒƒƒˆƒƒƒƒƒƒƒƒ‰‚ ‚RowPctN ‚ 6.6‚ 87.9‚ 5.5‚‡ƒƒƒƒƒƒƒƒˆƒƒƒƒƒƒƒƒƒˆƒƒƒƒƒƒƒƒˆƒƒƒƒƒƒƒƒˆƒƒƒƒƒƒƒƒ‰‚FIN ‚N ‚ 9‚ 88‚ .‚‚ ‡ƒƒƒƒƒƒƒƒƒˆƒƒƒƒƒƒƒƒˆƒƒƒƒƒƒƒƒˆƒƒƒƒƒƒƒƒ‰‚ ‚RowPctN ‚ 9.3‚ 90.7‚ .‚‡ƒƒƒƒƒƒƒƒˆƒƒƒƒƒƒƒƒƒˆƒƒƒƒƒƒƒƒˆƒƒƒƒƒƒƒƒˆƒƒƒƒƒƒƒƒ‰‚FRA ‚N ‚ 3‚ 113‚ 3‚‚ ‡ƒƒƒƒƒƒƒƒƒˆƒƒƒƒƒƒƒƒˆƒƒƒƒƒƒƒƒˆƒƒƒƒƒƒƒƒ‰‚ ‚RowPctN ‚ 2.5‚ 95.0‚ 2.5‚‡ƒƒƒƒƒƒƒƒˆƒƒƒƒƒƒƒƒƒˆƒƒƒƒƒƒƒƒˆƒƒƒƒƒƒƒƒˆƒƒƒƒƒƒƒƒ‰‚IRE ‚N ‚ 6‚ 82‚ 4‚‚ ‡ƒƒƒƒƒƒƒƒƒˆƒƒƒƒƒƒƒƒˆƒƒƒƒƒƒƒƒˆƒƒƒƒƒƒƒƒ‰‚ ‚RowPctN ‚ 6.5‚ 89.1‚ 4.3‚‡ƒƒƒƒƒƒƒƒˆƒƒƒƒƒƒƒƒƒˆƒƒƒƒƒƒƒƒˆƒƒƒƒƒƒƒƒˆƒƒƒƒƒƒƒƒ‰‚LUX ‚N ‚ 1‚ 13‚ .‚‚ ‡ƒƒƒƒƒƒƒƒƒˆƒƒƒƒƒƒƒƒˆƒƒƒƒƒƒƒƒˆƒƒƒƒƒƒƒƒ‰‚ ‚RowPctN ‚ 7.1‚ 92.9‚ .‚‡ƒƒƒƒƒƒƒƒˆƒƒƒƒƒƒƒƒƒˆƒƒƒƒƒƒƒƒˆƒƒƒƒƒƒƒƒˆƒƒƒƒƒƒƒƒ‰‚NET ‚N ‚ 3‚ 125‚ 2‚‚ ‡ƒƒƒƒƒƒƒƒƒˆƒƒƒƒƒƒƒƒˆƒƒƒƒƒƒƒƒˆƒƒƒƒƒƒƒƒ‰‚ ‚RowPctN ‚ 2.3‚ 96.2‚ 1.5‚‡ƒƒƒƒƒƒƒƒˆƒƒƒƒƒƒƒƒƒˆƒƒƒƒƒƒƒƒˆƒƒƒƒƒƒƒƒˆƒƒƒƒƒƒƒƒ‰‚POR ‚N ‚ 5‚ 64‚ .‚‚ ‡ƒƒƒƒƒƒƒƒƒˆƒƒƒƒƒƒƒƒˆƒƒƒƒƒƒƒƒˆƒƒƒƒƒƒƒƒ‰‚ ‚RowPctN ‚ 7.2‚ 92.8‚ .‚‡ƒƒƒƒƒƒƒƒˆƒƒƒƒƒƒƒƒƒˆƒƒƒƒƒƒƒƒˆƒƒƒƒƒƒƒƒˆƒƒƒƒƒƒƒƒ‰‚SWE ‚N ‚ 7‚ 124‚ 1‚‚ ‡ƒƒƒƒƒƒƒƒƒˆƒƒƒƒƒƒƒƒˆƒƒƒƒƒƒƒƒˆƒƒƒƒƒƒƒƒ‰‚ ‚RowPctN ‚ 5.3‚ 93.9‚ 0.8‚‡ƒƒƒƒƒƒƒƒˆƒƒƒƒƒƒƒƒƒˆƒƒƒƒƒƒƒƒˆƒƒƒƒƒƒƒƒˆƒƒƒƒƒƒƒƒ‰‚UNK ‚N ‚ 7‚ 61‚ .‚‚ ‡ƒƒƒƒƒƒƒƒƒˆƒƒƒƒƒƒƒƒˆƒƒƒƒƒƒƒƒˆƒƒƒƒƒƒƒƒ‰‚ ‚RowPctN ‚ 10.3‚ 89.7‚ .‚‡ƒƒƒƒƒƒƒƒˆƒƒƒƒƒƒƒƒƒˆƒƒƒƒƒƒƒƒˆƒƒƒƒƒƒƒƒˆƒƒƒƒƒƒƒƒ‰‚All ‚N ‚ 57‚ 960‚ 27‚‚ ‡ƒƒƒƒƒƒƒƒƒˆƒƒƒƒƒƒƒƒˆƒƒƒƒƒƒƒƒˆƒƒƒƒƒƒƒƒ‰‚ ‚RowPctN ‚ 5.5‚ 92.0‚ 2.6‚Šƒƒƒƒƒƒƒƒ‹ƒƒƒƒƒƒƒƒƒ‹ƒƒƒƒƒƒƒƒ‹ƒƒƒƒƒƒƒƒ‹ƒƒƒƒƒƒƒƒŒ
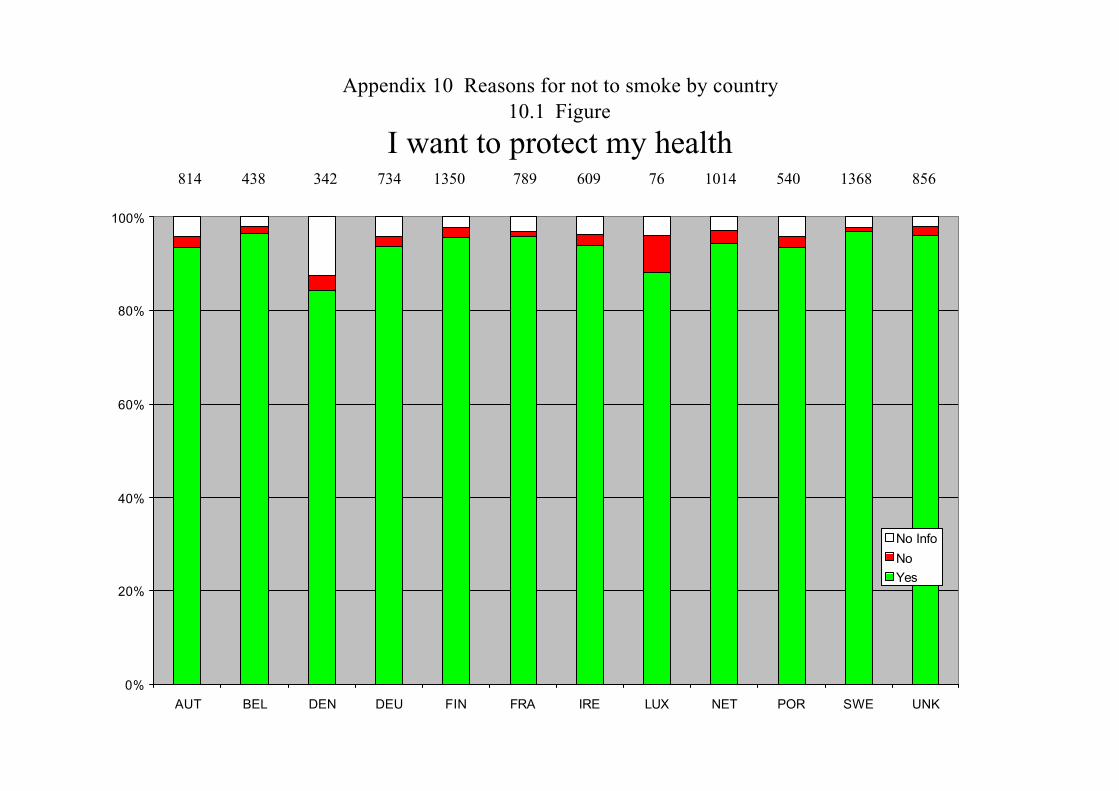
Appendix 10 Reasons for not to smoke by country10.1 Figure
I want to protect my health
0%
20%
40%
60%
80%
100%
AUT BEL DEN DEU FIN FRA IRE LUX NET POR SWE UNK
No Info
NoYes
814 438 342 734 1350 789 609 76 1014 540 1368 856
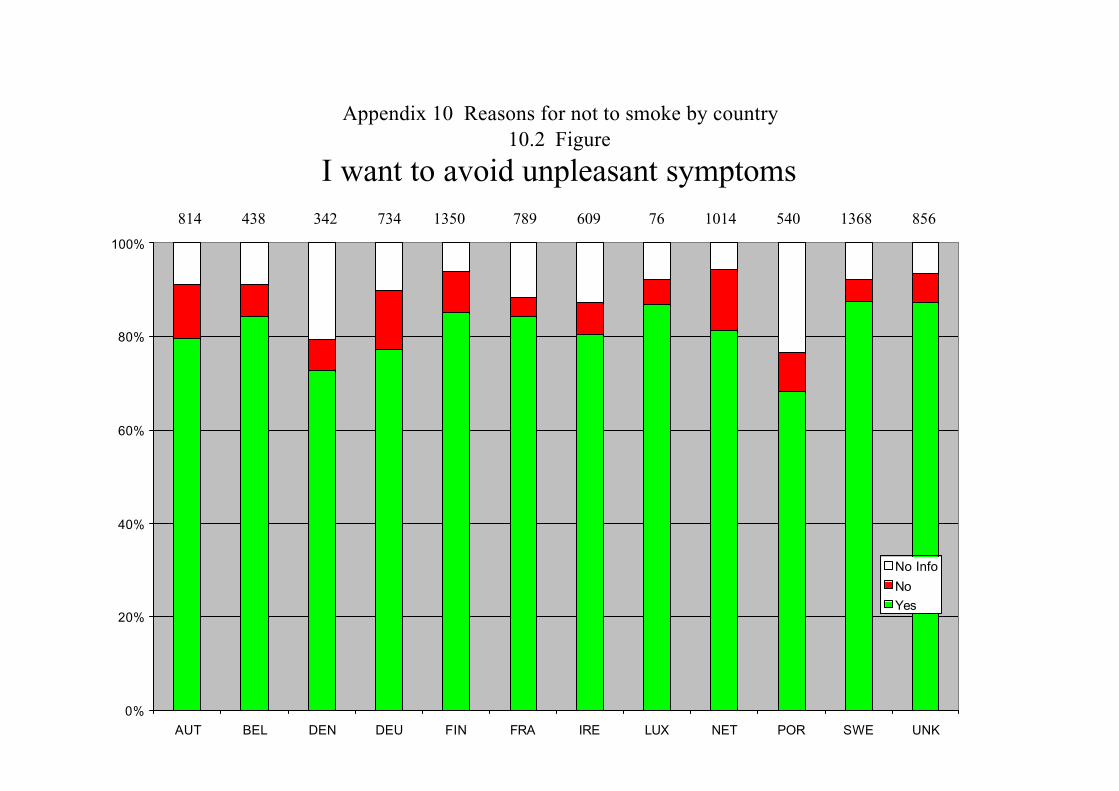
Appendix 10 Reasons for not to smoke by country10.2 Figure
I want to avoid unpleasant symptoms
0%
20%
40%
60%
80%
100%
AUT BEL DEN DEU FIN FRA IRE LUX NET POR SWE UNK
No Info
NoYes
814 438 342 734 1350 789 609 76 1014 540 1368 856
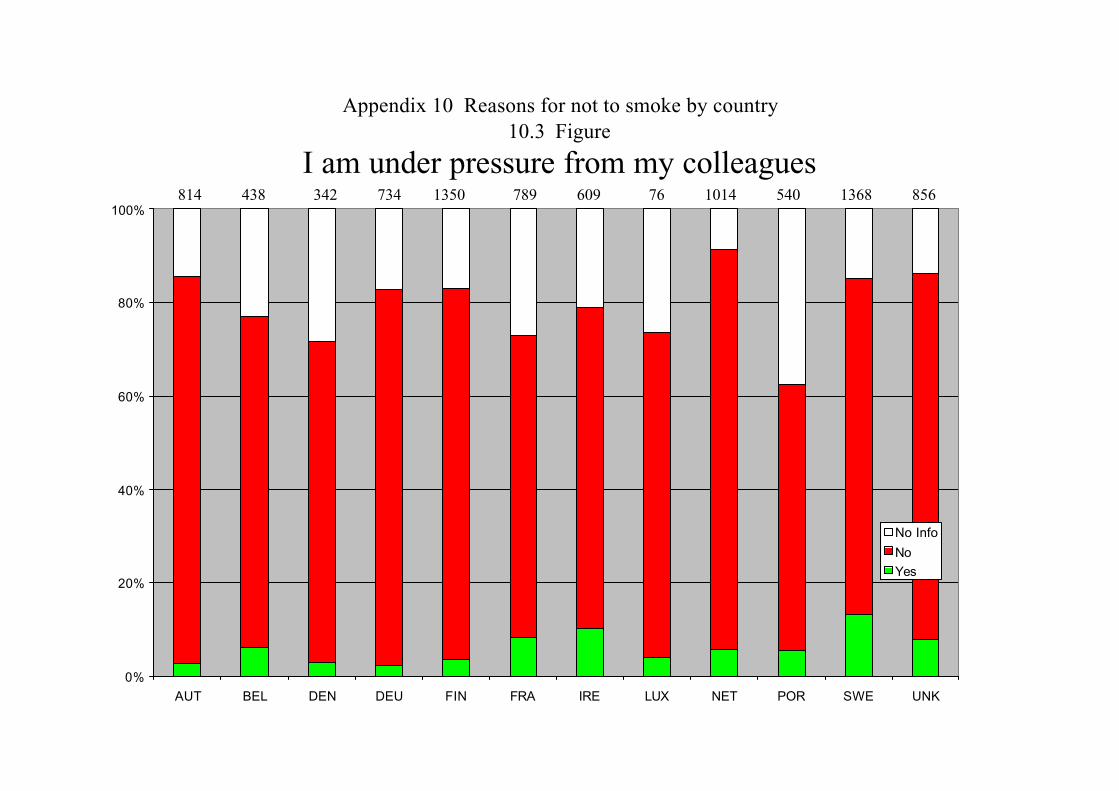
Appendix 10 Reasons for not to smoke by country10.3 Figure
I am under pressure from my colleagues
0%
20%
40%
60%
80%
100%
AUT BEL DEN DEU FIN FRA IRE LUX NET POR SWE UNK
No Info
NoYes
814 438 342 734 1350 789 609 76 1014 540 1368 856
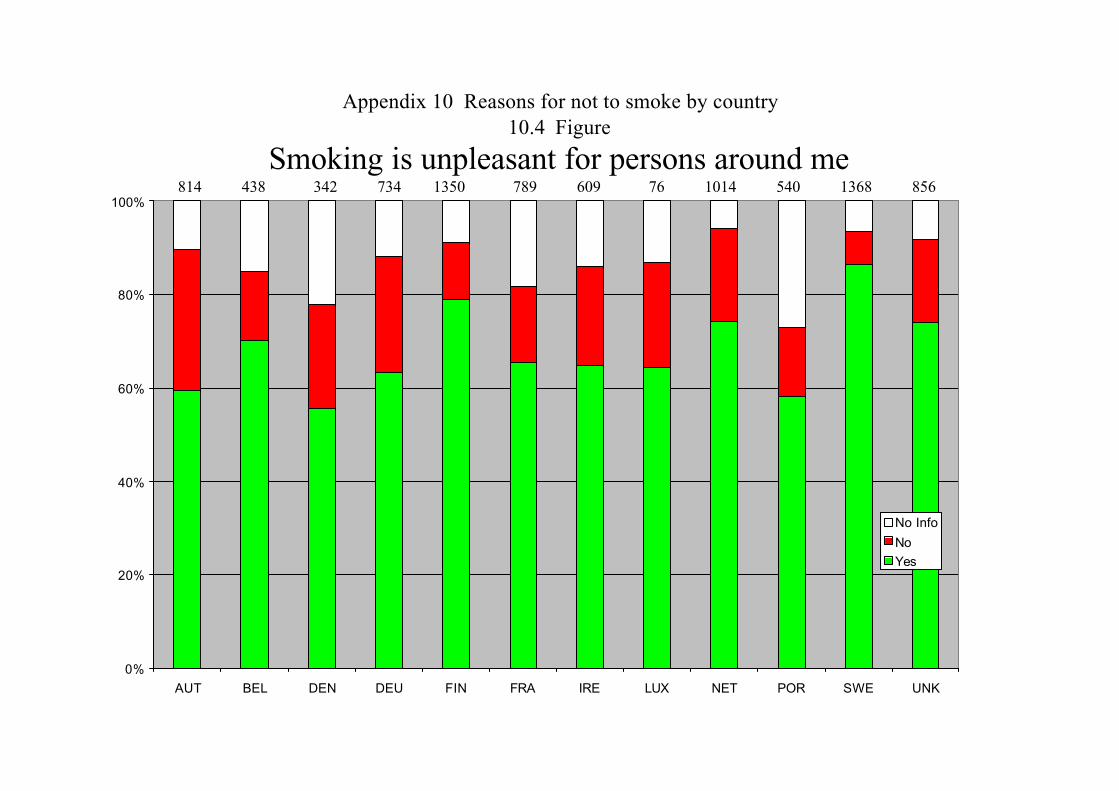
Appendix 10 Reasons for not to smoke by country10.4 Figure
Smoking is unpleasant for persons around me
0%
20%
40%
60%
80%
100%
AUT BEL DEN DEU FIN FRA IRE LUX NET POR SWE UNK
No Info
NoYes
814 438 342 734 1350 789 609 76 1014 540 1368 856
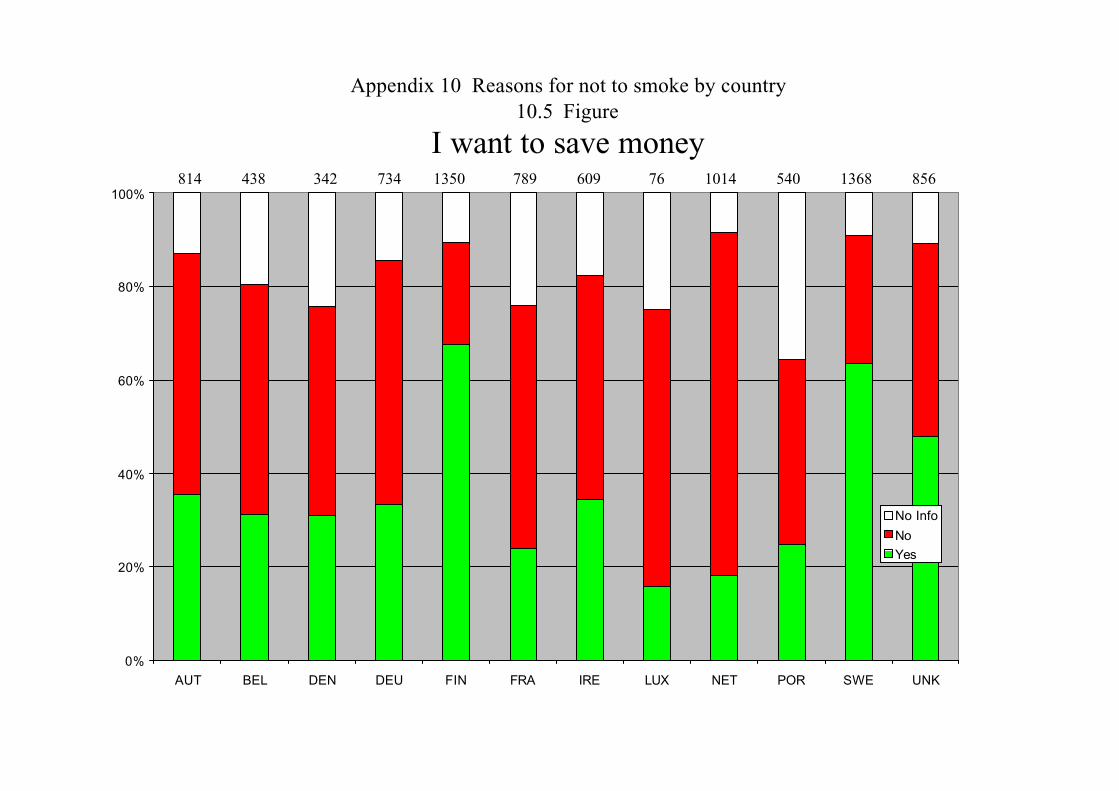
Appendix 10 Reasons for not to smoke by country10.5 Figure
I want to save money
0%
20%
40%
60%
80%
100%
AUT BEL DEN DEU FIN FRA IRE LUX NET POR SWE UNK
No Info
NoYes
814 438 342 734 1350 789 609 76 1014 540 1368 856
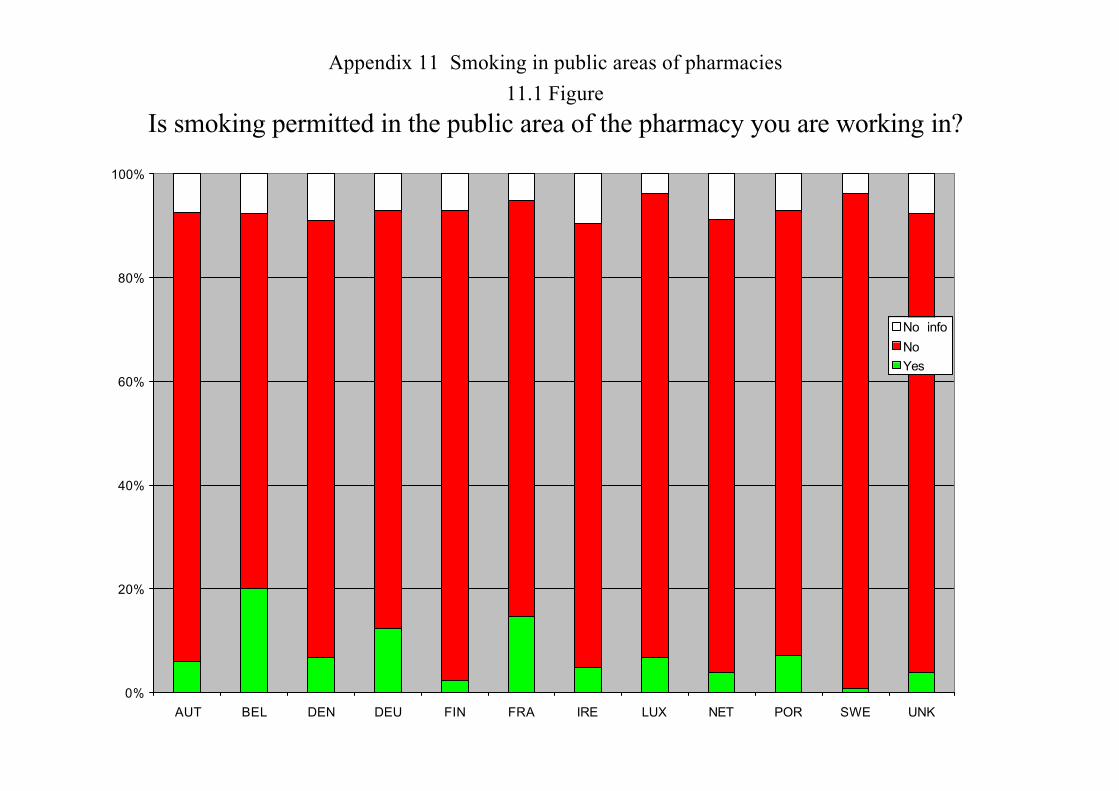
Appendix 11 Smoking in public areas of pharmacies
11.1 Figure
Is smoking permitted in the public area of the pharmacy you are working in?
0%
20%
40%
60%
80%
100%
AUT BEL DEN DEU FIN FRA IRE LUX NET POR SWE UNK
No info
NoYes
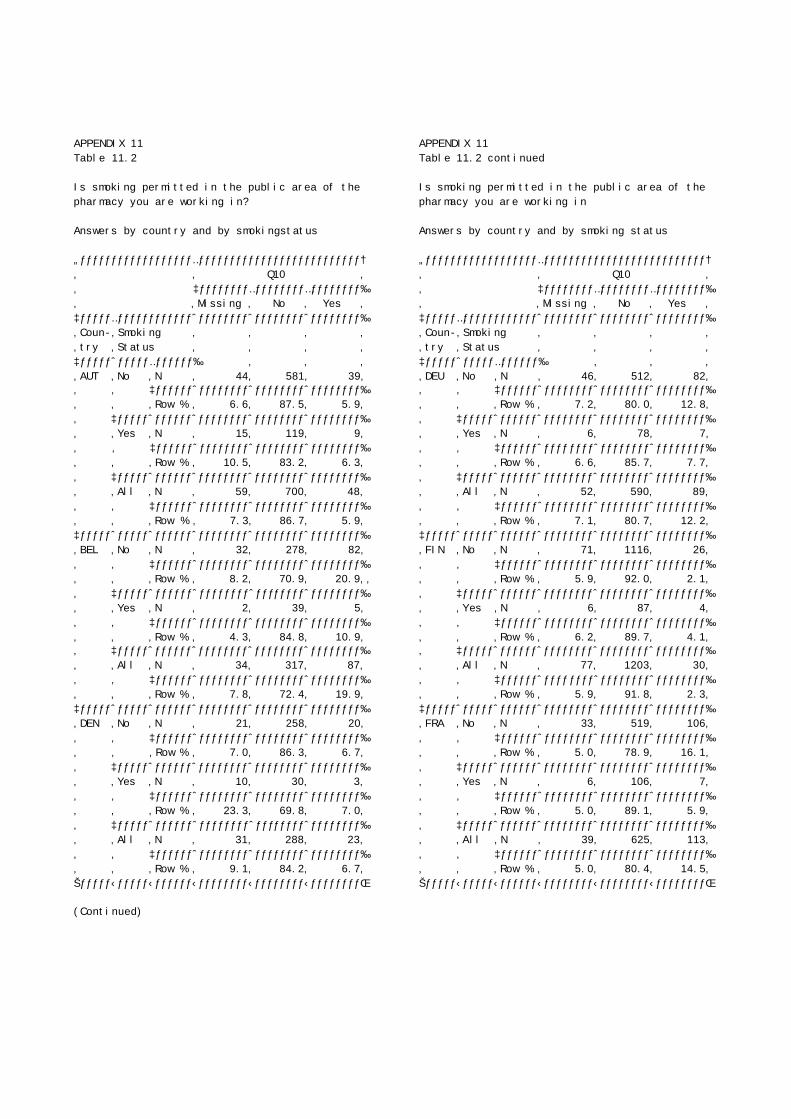
APPENDIX 11Table 11.2
Is smoking permitted in the public area of the pharmacy you are working in?
Answers by country and by smokingstatus
„ƒƒƒƒƒƒƒƒƒƒƒƒƒƒƒƒƒƒ…ƒƒƒƒƒƒƒƒƒƒƒƒƒƒƒƒƒƒƒƒƒƒƒƒƒƒ†‚ ‚ Q10 ‚‚ ‡ƒƒƒƒƒƒƒƒ…ƒƒƒƒƒƒƒƒ…ƒƒƒƒƒƒƒƒ‰‚ ‚Missing ‚ No ‚ Yes ‚‡ƒƒƒƒƒ…ƒƒƒƒƒƒƒƒƒƒƒƒˆƒƒƒƒƒƒƒƒˆƒƒƒƒƒƒƒƒˆƒƒƒƒƒƒƒƒ‰‚Coun-‚Smoking ‚ ‚ ‚ ‚‚try ‚Status ‚ ‚ ‚ ‚‡ƒƒƒƒƒˆƒƒƒƒƒ…ƒƒƒƒƒƒ‰ ‚ ‚ ‚‚AUT ‚No ‚N ‚ 44‚ 581‚ 39‚‚ ‚ ‡ƒƒƒƒƒƒˆƒƒƒƒƒƒƒƒˆƒƒƒƒƒƒƒƒˆƒƒƒƒƒƒƒƒ‰‚ ‚ ‚Row % ‚ 6.6‚ 87.5‚ 5.9‚‚ ‡ƒƒƒƒƒˆƒƒƒƒƒƒˆƒƒƒƒƒƒƒƒˆƒƒƒƒƒƒƒƒˆƒƒƒƒƒƒƒƒ‰‚ ‚Yes ‚N ‚ 15‚ 119‚ 9‚‚ ‚ ‡ƒƒƒƒƒƒˆƒƒƒƒƒƒƒƒˆƒƒƒƒƒƒƒƒˆƒƒƒƒƒƒƒƒ‰‚ ‚ ‚Row % ‚ 10.5‚ 83.2‚ 6.3‚‚ ‡ƒƒƒƒƒˆƒƒƒƒƒƒˆƒƒƒƒƒƒƒƒˆƒƒƒƒƒƒƒƒˆƒƒƒƒƒƒƒƒ‰‚ ‚All ‚N ‚ 59‚ 700‚ 48‚‚ ‚ ‡ƒƒƒƒƒƒˆƒƒƒƒƒƒƒƒˆƒƒƒƒƒƒƒƒˆƒƒƒƒƒƒƒƒ‰‚ ‚ ‚Row % ‚ 7.3‚ 86.7‚ 5.9‚‡ƒƒƒƒƒˆƒƒƒƒƒˆƒƒƒƒƒƒˆƒƒƒƒƒƒƒƒˆƒƒƒƒƒƒƒƒˆƒƒƒƒƒƒƒƒ‰‚BEL ‚No ‚N ‚ 32‚ 278‚ 82‚‚ ‚ ‡ƒƒƒƒƒƒˆƒƒƒƒƒƒƒƒˆƒƒƒƒƒƒƒƒˆƒƒƒƒƒƒƒƒ‰‚ ‚ ‚Row % ‚ 8.2‚ 70.9‚ 20.9‚‚‚ ‡ƒƒƒƒƒˆƒƒƒƒƒƒˆƒƒƒƒƒƒƒƒˆƒƒƒƒƒƒƒƒˆƒƒƒƒƒƒƒƒ‰‚ ‚Yes ‚N ‚ 2‚ 39‚ 5‚‚ ‚ ‡ƒƒƒƒƒƒˆƒƒƒƒƒƒƒƒˆƒƒƒƒƒƒƒƒˆƒƒƒƒƒƒƒƒ‰‚ ‚ ‚Row % ‚ 4.3‚ 84.8‚ 10.9‚‚ ‡ƒƒƒƒƒˆƒƒƒƒƒƒˆƒƒƒƒƒƒƒƒˆƒƒƒƒƒƒƒƒˆƒƒƒƒƒƒƒƒ‰‚ ‚All ‚N ‚ 34‚ 317‚ 87‚‚ ‚ ‡ƒƒƒƒƒƒˆƒƒƒƒƒƒƒƒˆƒƒƒƒƒƒƒƒˆƒƒƒƒƒƒƒƒ‰‚ ‚ ‚Row % ‚ 7.8‚ 72.4‚ 19.9‚‡ƒƒƒƒƒˆƒƒƒƒƒˆƒƒƒƒƒƒˆƒƒƒƒƒƒƒƒˆƒƒƒƒƒƒƒƒˆƒƒƒƒƒƒƒƒ‰‚DEN ‚No ‚N ‚ 21‚ 258‚ 20‚‚ ‚ ‡ƒƒƒƒƒƒˆƒƒƒƒƒƒƒƒˆƒƒƒƒƒƒƒƒˆƒƒƒƒƒƒƒƒ‰‚ ‚ ‚Row % ‚ 7.0‚ 86.3‚ 6.7‚‚ ‡ƒƒƒƒƒˆƒƒƒƒƒƒˆƒƒƒƒƒƒƒƒˆƒƒƒƒƒƒƒƒˆƒƒƒƒƒƒƒƒ‰‚ ‚Yes ‚N ‚ 10‚ 30‚ 3‚‚ ‚ ‡ƒƒƒƒƒƒˆƒƒƒƒƒƒƒƒˆƒƒƒƒƒƒƒƒˆƒƒƒƒƒƒƒƒ‰‚ ‚ ‚Row % ‚ 23.3‚ 69.8‚ 7.0‚‚ ‡ƒƒƒƒƒˆƒƒƒƒƒƒˆƒƒƒƒƒƒƒƒˆƒƒƒƒƒƒƒƒˆƒƒƒƒƒƒƒƒ‰‚ ‚All ‚N ‚ 31‚ 288‚ 23‚‚ ‚ ‡ƒƒƒƒƒƒˆƒƒƒƒƒƒƒƒˆƒƒƒƒƒƒƒƒˆƒƒƒƒƒƒƒƒ‰‚ ‚ ‚Row % ‚ 9.1‚ 84.2‚ 6.7‚Šƒƒƒƒƒ‹ƒƒƒƒƒ‹ƒƒƒƒƒƒ‹ƒƒƒƒƒƒƒƒ‹ƒƒƒƒƒƒƒƒ‹ƒƒƒƒƒƒƒƒŒ
(Continued)
APPENDIX 11Table 11.2 continued
Is smoking permitted in the public area of the pharmacy you are working in
Answers by country and by smoking status
„ƒƒƒƒƒƒƒƒƒƒƒƒƒƒƒƒƒƒ…ƒƒƒƒƒƒƒƒƒƒƒƒƒƒƒƒƒƒƒƒƒƒƒƒƒƒ†‚ ‚ Q10 ‚‚ ‡ƒƒƒƒƒƒƒƒ…ƒƒƒƒƒƒƒƒ…ƒƒƒƒƒƒƒƒ‰‚ ‚Missing ‚ No ‚ Yes ‚‡ƒƒƒƒƒ…ƒƒƒƒƒƒƒƒƒƒƒƒˆƒƒƒƒƒƒƒƒˆƒƒƒƒƒƒƒƒˆƒƒƒƒƒƒƒƒ‰‚Coun-‚Smoking ‚ ‚ ‚ ‚‚try ‚Status ‚ ‚ ‚ ‚‡ƒƒƒƒƒˆƒƒƒƒƒ…ƒƒƒƒƒƒ‰ ‚ ‚ ‚‚DEU ‚No ‚N ‚ 46‚ 512‚ 82‚‚ ‚ ‡ƒƒƒƒƒƒˆƒƒƒƒƒƒƒƒˆƒƒƒƒƒƒƒƒˆƒƒƒƒƒƒƒƒ‰‚ ‚ ‚Row % ‚ 7.2‚ 80.0‚ 12.8‚‚ ‡ƒƒƒƒƒˆƒƒƒƒƒƒˆƒƒƒƒƒƒƒƒˆƒƒƒƒƒƒƒƒˆƒƒƒƒƒƒƒƒ‰‚ ‚Yes ‚N ‚ 6‚ 78‚ 7‚‚ ‚ ‡ƒƒƒƒƒƒˆƒƒƒƒƒƒƒƒˆƒƒƒƒƒƒƒƒˆƒƒƒƒƒƒƒƒ‰‚ ‚ ‚Row % ‚ 6.6‚ 85.7‚ 7.7‚‚ ‡ƒƒƒƒƒˆƒƒƒƒƒƒˆƒƒƒƒƒƒƒƒˆƒƒƒƒƒƒƒƒˆƒƒƒƒƒƒƒƒ‰‚ ‚All ‚N ‚ 52‚ 590‚ 89‚‚ ‚ ‡ƒƒƒƒƒƒˆƒƒƒƒƒƒƒƒˆƒƒƒƒƒƒƒƒˆƒƒƒƒƒƒƒƒ‰‚ ‚ ‚Row % ‚ 7.1‚ 80.7‚ 12.2‚‡ƒƒƒƒƒˆƒƒƒƒƒˆƒƒƒƒƒƒˆƒƒƒƒƒƒƒƒˆƒƒƒƒƒƒƒƒˆƒƒƒƒƒƒƒƒ‰‚FIN ‚No ‚N ‚ 71‚ 1116‚ 26‚‚ ‚ ‡ƒƒƒƒƒƒˆƒƒƒƒƒƒƒƒˆƒƒƒƒƒƒƒƒˆƒƒƒƒƒƒƒƒ‰‚ ‚ ‚Row % ‚ 5.9‚ 92.0‚ 2.1‚‚ ‡ƒƒƒƒƒˆƒƒƒƒƒƒˆƒƒƒƒƒƒƒƒˆƒƒƒƒƒƒƒƒˆƒƒƒƒƒƒƒƒ‰‚ ‚Yes ‚N ‚ 6‚ 87‚ 4‚‚ ‚ ‡ƒƒƒƒƒƒˆƒƒƒƒƒƒƒƒˆƒƒƒƒƒƒƒƒˆƒƒƒƒƒƒƒƒ‰‚ ‚ ‚Row % ‚ 6.2‚ 89.7‚ 4.1‚‚ ‡ƒƒƒƒƒˆƒƒƒƒƒƒˆƒƒƒƒƒƒƒƒˆƒƒƒƒƒƒƒƒˆƒƒƒƒƒƒƒƒ‰‚ ‚All ‚N ‚ 77‚ 1203‚ 30‚‚ ‚ ‡ƒƒƒƒƒƒˆƒƒƒƒƒƒƒƒˆƒƒƒƒƒƒƒƒˆƒƒƒƒƒƒƒƒ‰‚ ‚ ‚Row % ‚ 5.9‚ 91.8‚ 2.3‚‡ƒƒƒƒƒˆƒƒƒƒƒˆƒƒƒƒƒƒˆƒƒƒƒƒƒƒƒˆƒƒƒƒƒƒƒƒˆƒƒƒƒƒƒƒƒ‰‚FRA ‚No ‚N ‚ 33‚ 519‚ 106‚‚ ‚ ‡ƒƒƒƒƒƒˆƒƒƒƒƒƒƒƒˆƒƒƒƒƒƒƒƒˆƒƒƒƒƒƒƒƒ‰‚ ‚ ‚Row % ‚ 5.0‚ 78.9‚ 16.1‚‚ ‡ƒƒƒƒƒˆƒƒƒƒƒƒˆƒƒƒƒƒƒƒƒˆƒƒƒƒƒƒƒƒˆƒƒƒƒƒƒƒƒ‰‚ ‚Yes ‚N ‚ 6‚ 106‚ 7‚‚ ‚ ‡ƒƒƒƒƒƒˆƒƒƒƒƒƒƒƒˆƒƒƒƒƒƒƒƒˆƒƒƒƒƒƒƒƒ‰‚ ‚ ‚Row % ‚ 5.0‚ 89.1‚ 5.9‚‚ ‡ƒƒƒƒƒˆƒƒƒƒƒƒˆƒƒƒƒƒƒƒƒˆƒƒƒƒƒƒƒƒˆƒƒƒƒƒƒƒƒ‰‚ ‚All ‚N ‚ 39‚ 625‚ 113‚‚ ‚ ‡ƒƒƒƒƒƒˆƒƒƒƒƒƒƒƒˆƒƒƒƒƒƒƒƒˆƒƒƒƒƒƒƒƒ‰‚ ‚ ‚Row % ‚ 5.0‚ 80.4‚ 14.5‚Šƒƒƒƒƒ‹ƒƒƒƒƒ‹ƒƒƒƒƒƒ‹ƒƒƒƒƒƒƒƒ‹ƒƒƒƒƒƒƒƒ‹ƒƒƒƒƒƒƒƒŒ

Table 11.2 continued
Is smoking permitted in the public area of the pharmacy you are working in
Answers by country and by smoking status
„ƒƒƒƒƒƒƒƒƒƒƒƒƒƒƒƒƒƒ…ƒƒƒƒƒƒƒƒƒƒƒƒƒƒƒƒƒƒƒƒƒƒƒƒƒƒ†‚ ‚ Q10 ‚‚ ‡ƒƒƒƒƒƒƒƒ…ƒƒƒƒƒƒƒƒ…ƒƒƒƒƒƒƒƒ‰‚ ‚Missing ‚ No ‚ Yes ‚‡ƒƒƒƒƒ…ƒƒƒƒƒƒƒƒƒƒƒƒˆƒƒƒƒƒƒƒƒˆƒƒƒƒƒƒƒƒˆƒƒƒƒƒƒƒƒ‰‚Coun-‚Smoking ‚ ‚ ‚ ‚‚try ‚Status ‚ ‚ ‚ ‚‡ƒƒƒƒƒˆƒƒƒƒƒ…ƒƒƒƒƒƒ‰ ‚ ‚ ‚‚IRE ‚No ‚N ‚ 52‚ 433‚ 25‚‚ ‚ ‡ƒƒƒƒƒƒˆƒƒƒƒƒƒƒƒˆƒƒƒƒƒƒƒƒˆƒƒƒƒƒƒƒƒ‰‚ ‚ ‚Row % ‚ 10.2‚ 84.9‚ 4.9‚‚ ‡ƒƒƒƒƒˆƒƒƒƒƒƒˆƒƒƒƒƒƒƒƒˆƒƒƒƒƒƒƒƒˆƒƒƒƒƒƒƒƒ‰‚ ‚Yes ‚N ‚ 3‚ 85‚ 4‚‚ ‚ ‡ƒƒƒƒƒƒˆƒƒƒƒƒƒƒƒˆƒƒƒƒƒƒƒƒˆƒƒƒƒƒƒƒƒ‰‚ ‚ ‚Row % ‚ 3.3‚ 92.4‚ 4.3‚‚ ‡ƒƒƒƒƒˆƒƒƒƒƒƒˆƒƒƒƒƒƒƒƒˆƒƒƒƒƒƒƒƒˆƒƒƒƒƒƒƒƒ‰‚ ‚All ‚N ‚ 55‚ 518‚ 29‚‚ ‚ ‡ƒƒƒƒƒƒˆƒƒƒƒƒƒƒƒˆƒƒƒƒƒƒƒƒˆƒƒƒƒƒƒƒƒ‰‚ ‚ ‚Row % ‚ 9.1‚ 86.0‚ 4.8‚‡ƒƒƒƒƒˆƒƒƒƒƒˆƒƒƒƒƒƒˆƒƒƒƒƒƒƒƒˆƒƒƒƒƒƒƒƒˆƒƒƒƒƒƒƒƒ‰‚LUX ‚No ‚N ‚ 3‚ 53‚ 5‚‚ ‚ ‡ƒƒƒƒƒƒˆƒƒƒƒƒƒƒƒˆƒƒƒƒƒƒƒƒˆƒƒƒƒƒƒƒƒ‰‚ ‚ ‚Row % ‚ 4.9‚ 86.9‚ 8.2‚‚ ‡ƒƒƒƒƒˆƒƒƒƒƒƒˆƒƒƒƒƒƒƒƒˆƒƒƒƒƒƒƒƒˆƒƒƒƒƒƒƒƒ‰‚ ‚Yes ‚N ‚ .‚ 14‚ .‚‚ ‚ ‡ƒƒƒƒƒƒˆƒƒƒƒƒƒƒƒˆƒƒƒƒƒƒƒƒˆƒƒƒƒƒƒƒƒ‰‚ ‚ ‚Row % ‚ .‚ 100.0‚ .‚‚ ‡ƒƒƒƒƒˆƒƒƒƒƒƒˆƒƒƒƒƒƒƒƒˆƒƒƒƒƒƒƒƒˆƒƒƒƒƒƒƒƒ‰‚ ‚All ‚N ‚ 3‚ 67‚ 5‚‚ ‚ ‡ƒƒƒƒƒƒˆƒƒƒƒƒƒƒƒˆƒƒƒƒƒƒƒƒˆƒƒƒƒƒƒƒƒ‰‚ ‚ ‚Row % ‚ 4.0‚ 89.3‚ 6.7‚‡ƒƒƒƒƒˆƒƒƒƒƒˆƒƒƒƒƒƒˆƒƒƒƒƒƒƒƒˆƒƒƒƒƒƒƒƒˆƒƒƒƒƒƒƒƒ‰‚NET ‚No ‚N ‚ 82‚ 762‚ 37‚‚ ‚ ‡ƒƒƒƒƒƒˆƒƒƒƒƒƒƒƒˆƒƒƒƒƒƒƒƒˆƒƒƒƒƒƒƒƒ‰‚ ‚ ‚Row % ‚ 9.3‚ 86.5‚ 4.2‚‚ ‡ƒƒƒƒƒˆƒƒƒƒƒƒˆƒƒƒƒƒƒƒƒˆƒƒƒƒƒƒƒƒˆƒƒƒƒƒƒƒƒ‰‚ ‚Yes ‚N ‚ 8‚ 120‚ 2‚‚ ‚ ‡ƒƒƒƒƒƒˆƒƒƒƒƒƒƒƒˆƒƒƒƒƒƒƒƒˆƒƒƒƒƒƒƒƒ‰‚ ‚ ‚Row % ‚ 6.2‚ 92.3‚ 1.5‚‚ ‡ƒƒƒƒƒˆƒƒƒƒƒƒˆƒƒƒƒƒƒƒƒˆƒƒƒƒƒƒƒƒˆƒƒƒƒƒƒƒƒ‰‚ ‚All ‚N ‚ 90‚ 882‚ 39‚‚ ‚ ‡ƒƒƒƒƒƒˆƒƒƒƒƒƒƒƒˆƒƒƒƒƒƒƒƒˆƒƒƒƒƒƒƒƒ‰‚ ‚ ‚Row % ‚ 8.9‚ 87.2‚ 3.9‚Šƒƒƒƒƒ‹ƒƒƒƒƒ‹ƒƒƒƒƒƒ‹ƒƒƒƒƒƒƒƒ‹ƒƒƒƒƒƒƒƒ‹ƒƒƒƒƒƒƒƒŒ
(Continued)
Table 11.2 continued
Is smoking permitted in the public area of the pharmacy you are working in
Answers by country and by smoking status
„ƒƒƒƒƒƒƒƒƒƒƒƒƒƒƒƒƒƒ…ƒƒƒƒƒƒƒƒƒƒƒƒƒƒƒƒƒƒƒƒƒƒƒƒƒƒ†‚ ‚ Q10 ‚‚ ‡ƒƒƒƒƒƒƒƒ…ƒƒƒƒƒƒƒƒ…ƒƒƒƒƒƒƒƒ‰‚ ‚Missing ‚ No ‚ Yes ‚‡ƒƒƒƒƒ…ƒƒƒƒƒƒƒƒƒƒƒƒˆƒƒƒƒƒƒƒƒˆƒƒƒƒƒƒƒƒˆƒƒƒƒƒƒƒƒ‰‚Coun-‚Smoking ‚ ‚ ‚ ‚‚try ‚Status ‚ ‚ ‚ ‚‡ƒƒƒƒƒˆƒƒƒƒƒ…ƒƒƒƒƒƒ‰ ‚ ‚ ‚‚POR ‚No ‚N ‚ 31‚ 392‚ 35‚‚ ‚ ‡ƒƒƒƒƒƒˆƒƒƒƒƒƒƒƒˆƒƒƒƒƒƒƒƒˆƒƒƒƒƒƒƒƒ‰‚ ‚ ‚Row % ‚ 6.8‚ 85.6‚ 7.6‚‚ ‡ƒƒƒƒƒˆƒƒƒƒƒƒˆƒƒƒƒƒƒƒƒˆƒƒƒƒƒƒƒƒˆƒƒƒƒƒƒƒƒ‰‚ ‚Yes ‚N ‚ 5‚ 63‚ 1‚‚ ‚ ‡ƒƒƒƒƒƒˆƒƒƒƒƒƒƒƒˆƒƒƒƒƒƒƒƒˆƒƒƒƒƒƒƒƒ‰‚ ‚ ‚Row % ‚ 7.2‚ 91.3‚ 1.4‚‚ ‡ƒƒƒƒƒˆƒƒƒƒƒƒˆƒƒƒƒƒƒƒƒˆƒƒƒƒƒƒƒƒˆƒƒƒƒƒƒƒƒ‰‚ ‚All ‚N ‚ 36‚ 455‚ 36‚‚ ‚ ‡ƒƒƒƒƒƒˆƒƒƒƒƒƒƒƒˆƒƒƒƒƒƒƒƒˆƒƒƒƒƒƒƒƒ‰‚ ‚ ‚Row % ‚ 6.8‚ 86.3‚ 6.8‚‡ƒƒƒƒƒˆƒƒƒƒƒˆƒƒƒƒƒƒˆƒƒƒƒƒƒƒƒˆƒƒƒƒƒƒƒƒˆƒƒƒƒƒƒƒƒ‰‚SWE ‚No ‚N ‚ 50‚ 1173‚ 8‚‚ ‚ ‡ƒƒƒƒƒƒˆƒƒƒƒƒƒƒƒˆƒƒƒƒƒƒƒƒˆƒƒƒƒƒƒƒƒ‰‚ ‚ ‚Row % ‚ 4.1‚ 95.3‚ 0.6‚‚ ‡ƒƒƒƒƒˆƒƒƒƒƒƒˆƒƒƒƒƒƒƒƒˆƒƒƒƒƒƒƒƒˆƒƒƒƒƒƒƒƒ‰‚ ‚Yes ‚N ‚ 3‚ 128‚ 1‚‚ ‚ ‡ƒƒƒƒƒƒˆƒƒƒƒƒƒƒƒˆƒƒƒƒƒƒƒƒˆƒƒƒƒƒƒƒƒ‰‚ ‚ ‚Row % ‚ 2.3‚ 97.0‚ 0.8‚‚ ‡ƒƒƒƒƒˆƒƒƒƒƒƒˆƒƒƒƒƒƒƒƒˆƒƒƒƒƒƒƒƒˆƒƒƒƒƒƒƒƒ‰‚ ‚All ‚N ‚ 53‚ 1301‚ 9‚‚ ‚ ‡ƒƒƒƒƒƒˆƒƒƒƒƒƒƒƒˆƒƒƒƒƒƒƒƒˆƒƒƒƒƒƒƒƒ‰‚ ‚ ‚Row % ‚ 3.9‚ 95.5‚ 0.7‚‡ƒƒƒƒƒˆƒƒƒƒƒˆƒƒƒƒƒƒˆƒƒƒƒƒƒƒƒˆƒƒƒƒƒƒƒƒˆƒƒƒƒƒƒƒƒ‰‚UNK ‚No ‚N ‚ 61‚ 684‚ 30‚‚ ‚ ‡ƒƒƒƒƒƒˆƒƒƒƒƒƒƒƒˆƒƒƒƒƒƒƒƒˆƒƒƒƒƒƒƒƒ‰‚ ‚ ‚Row ^ ‚ 7.9‚ 88.3‚ 3.9‚‚ ‡ƒƒƒƒƒˆƒƒƒƒƒƒˆƒƒƒƒƒƒƒƒˆƒƒƒƒƒƒƒƒˆƒƒƒƒƒƒƒƒ‰‚ ‚Yes ‚N ‚ 2‚ 64‚ 2‚‚ ‚ ‡ƒƒƒƒƒƒˆƒƒƒƒƒƒƒƒˆƒƒƒƒƒƒƒƒˆƒƒƒƒƒƒƒƒ‰‚ ‚ ‚Row % ‚ 2.9‚ 94.1‚ 2.9‚‚ ‡ƒƒƒƒƒˆƒƒƒƒƒƒˆƒƒƒƒƒƒƒƒˆƒƒƒƒƒƒƒƒˆƒƒƒƒƒƒƒƒ‰‚ ‚All ‚N ‚ 63‚ 748‚ 32‚‚ ‚ ‡ƒƒƒƒƒƒˆƒƒƒƒƒƒƒƒˆƒƒƒƒƒƒƒƒˆƒƒƒƒƒƒƒƒ‰‚ ‚ ‚Row % ‚ 7.5‚ 88.7‚ 3.8‚Šƒƒƒƒƒ‹ƒƒƒƒƒ‹ƒƒƒƒƒƒ‹ƒƒƒƒƒƒƒƒ‹ƒƒƒƒƒƒƒƒ‹ƒƒƒƒƒƒƒƒŒ
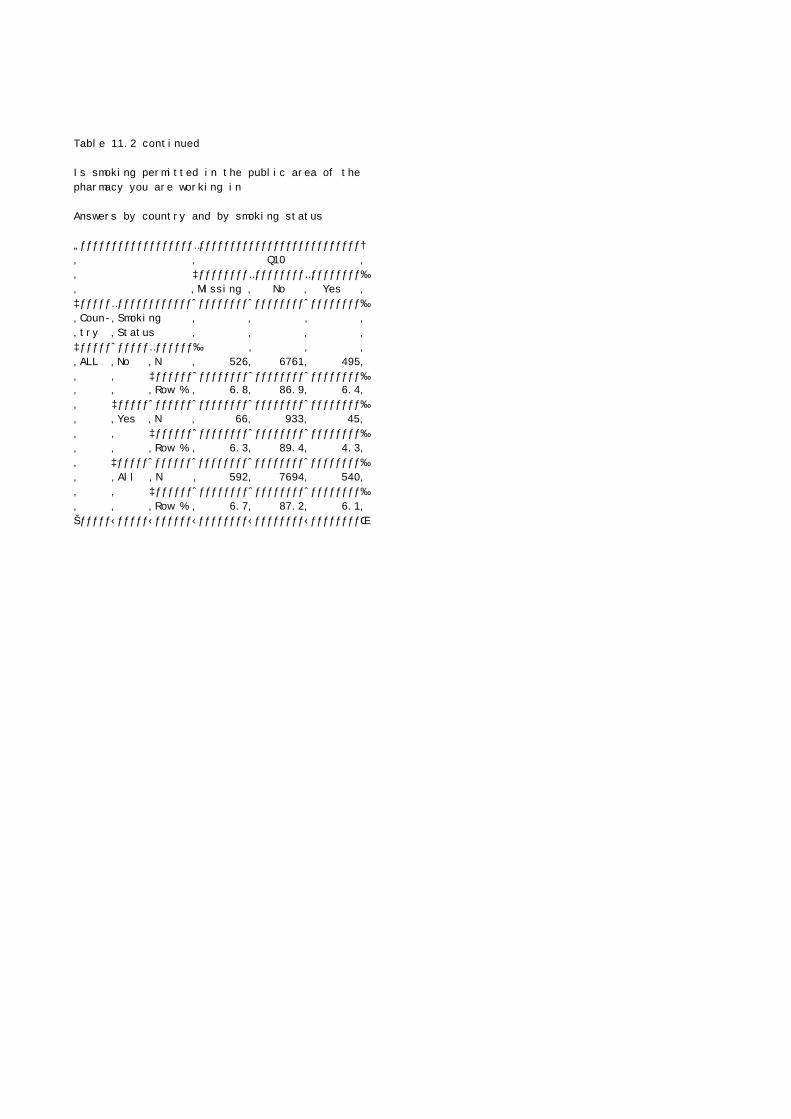
Table 11.2 continued
Is smoking permitted in the public area of the pharmacy you are working in
Answers by country and by smoking status
„ƒƒƒƒƒƒƒƒƒƒƒƒƒƒƒƒƒƒ…ƒƒƒƒƒƒƒƒƒƒƒƒƒƒƒƒƒƒƒƒƒƒƒƒƒƒ†‚ ‚ Q10 ‚‚ ‡ƒƒƒƒƒƒƒƒ…ƒƒƒƒƒƒƒƒ…ƒƒƒƒƒƒƒƒ‰‚ ‚Missing ‚ No ‚ Yes ‚‡ƒƒƒƒƒ…ƒƒƒƒƒƒƒƒƒƒƒƒˆƒƒƒƒƒƒƒƒˆƒƒƒƒƒƒƒƒˆƒƒƒƒƒƒƒƒ‰‚Coun-‚Smoking ‚ ‚ ‚ ‚‚try ‚Status ‚ ‚ ‚ ‚‡ƒƒƒƒƒˆƒƒƒƒƒ…ƒƒƒƒƒƒ‰ ‚ ‚ ‚‚ALL ‚No ‚N ‚ 526‚ 6761‚ 495‚‚ ‚ ‡ƒƒƒƒƒƒˆƒƒƒƒƒƒƒƒˆƒƒƒƒƒƒƒƒˆƒƒƒƒƒƒƒƒ‰‚ ‚ ‚Row % ‚ 6.8‚ 86.9‚ 6.4‚‚ ‡ƒƒƒƒƒˆƒƒƒƒƒƒˆƒƒƒƒƒƒƒƒˆƒƒƒƒƒƒƒƒˆƒƒƒƒƒƒƒƒ‰‚ ‚Yes ‚N ‚ 66‚ 933‚ 45‚‚ ‚ ‡ƒƒƒƒƒƒˆƒƒƒƒƒƒƒƒˆƒƒƒƒƒƒƒƒˆƒƒƒƒƒƒƒƒ‰‚ ‚ ‚Row % ‚ 6.3‚ 89.4‚ 4.3‚‚ ‡ƒƒƒƒƒˆƒƒƒƒƒƒˆƒƒƒƒƒƒƒƒˆƒƒƒƒƒƒƒƒˆƒƒƒƒƒƒƒƒ‰‚ ‚All ‚N ‚ 592‚ 7694‚ 540‚‚ ‚ ‡ƒƒƒƒƒƒˆƒƒƒƒƒƒƒƒˆƒƒƒƒƒƒƒƒˆƒƒƒƒƒƒƒƒ‰‚ ‚ ‚Row % ‚ 6.7‚ 87.2‚ 6.1‚Šƒƒƒƒƒ‹ƒƒƒƒƒ‹ƒƒƒƒƒƒ‹ƒƒƒƒƒƒƒƒ‹ƒƒƒƒƒƒƒƒ‹ƒƒƒƒƒƒƒƒŒ
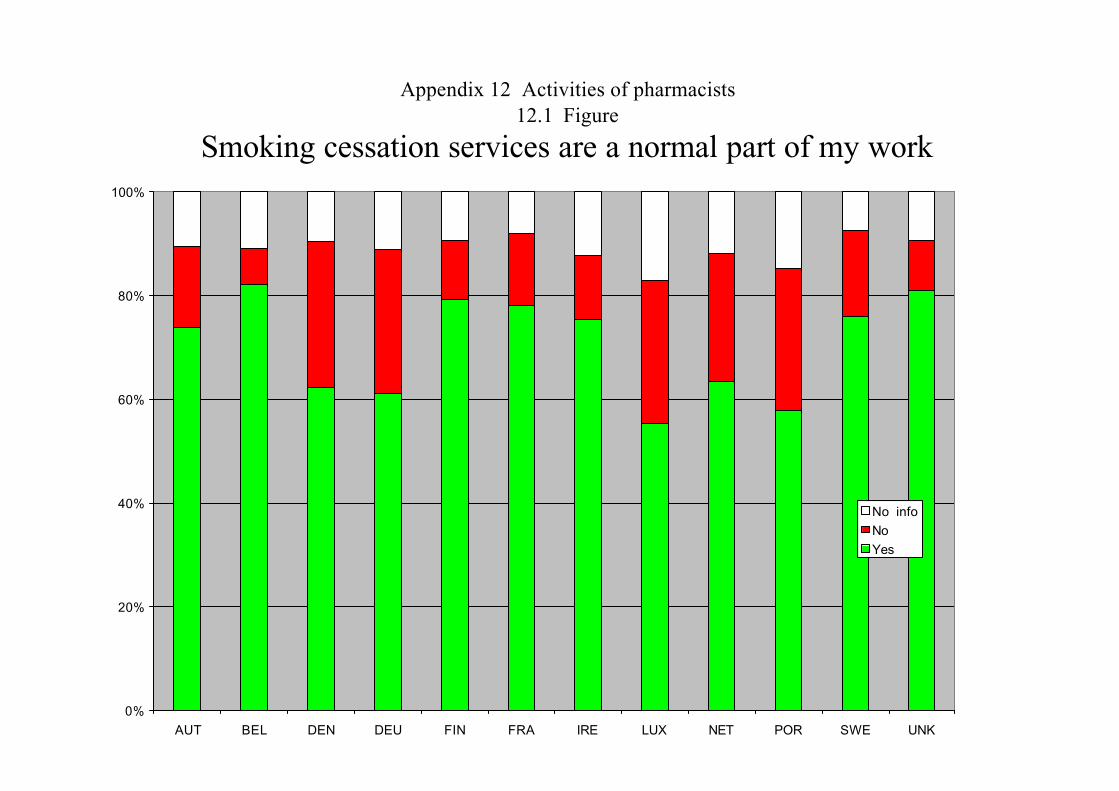
Appendix 12 Activities of pharmacists12.1 Figure
Smoking cessation services are a normal part of my work
0%
20%
40%
60%
80%
100%
AUT BEL DEN DEU FIN FRA IRE LUX NET POR SWE UNK
No infoNoYes
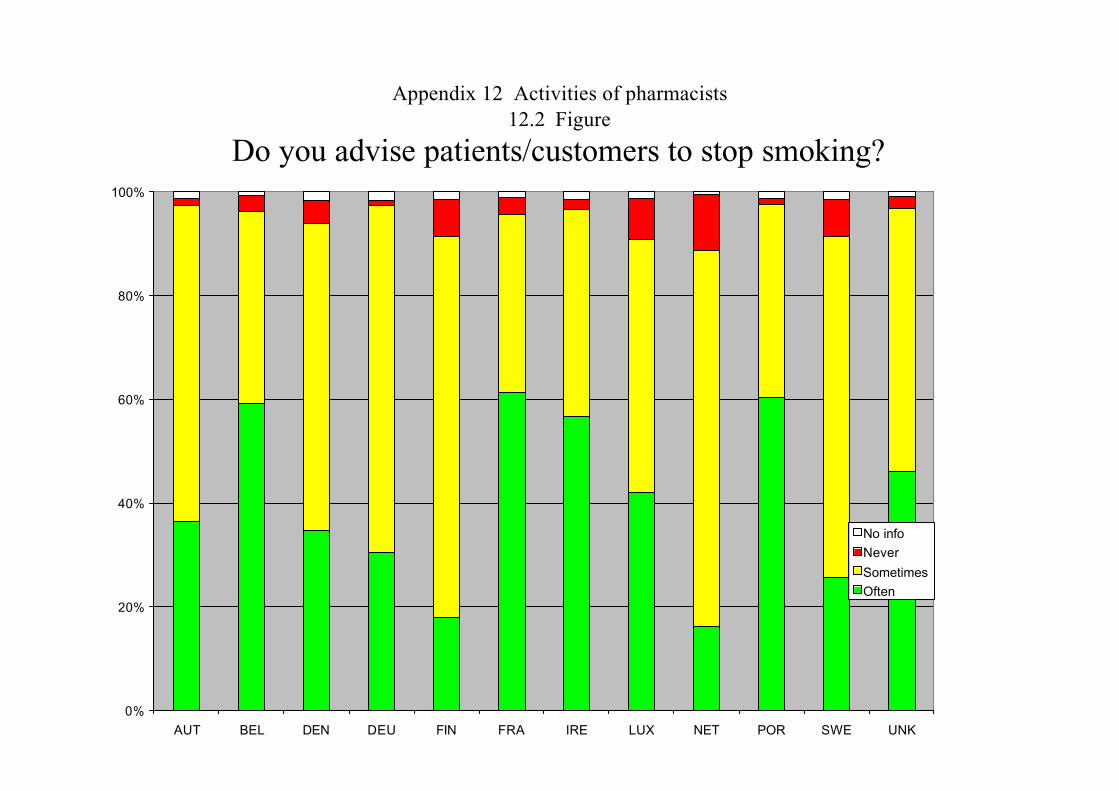
Appendix 12 Activities of pharmacists12.2 Figure
Do you advise patients/customers to stop smoking?
0%
20%
40%
60%
80%
100%
AUT BEL DEN DEU FIN FRA IRE LUX NET POR SWE UNK
No infoNever
SometimesOften
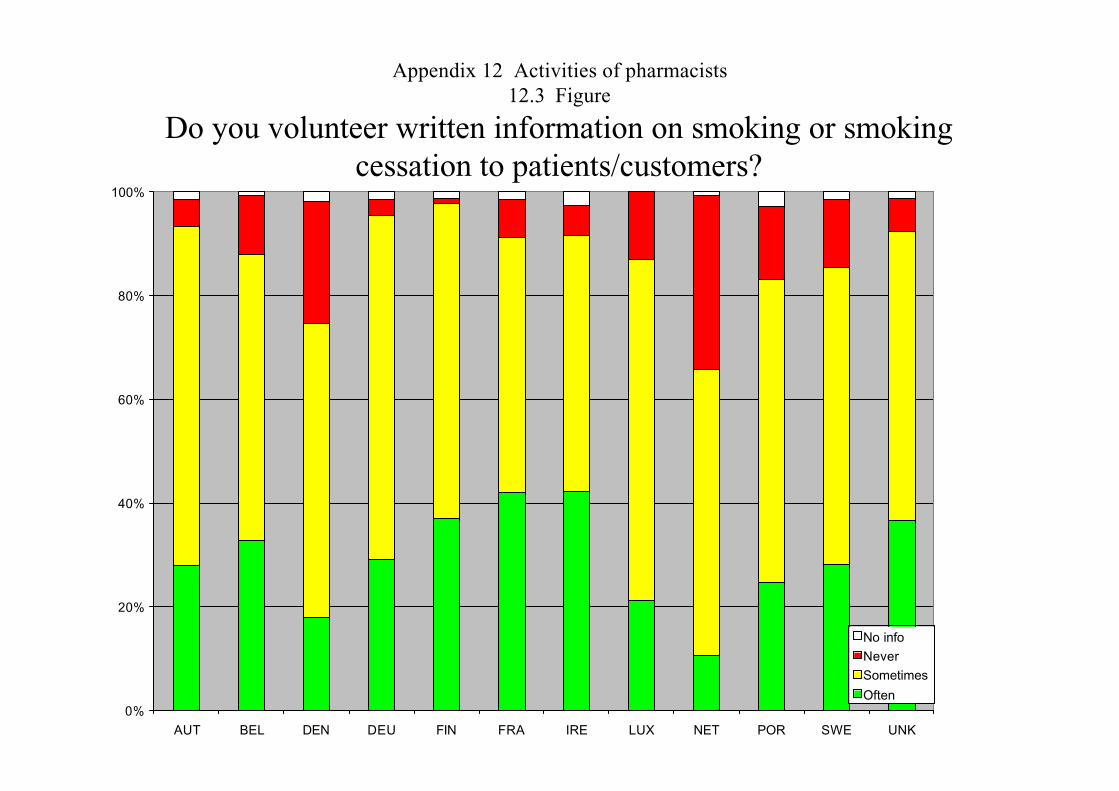
Appendix 12 Activities of pharmacists12.3 Figure
Do you volunteer written information on smoking or smoking cessation to patients/customers?
0%
20%
40%
60%
80%
100%
AUT BEL DEN DEU FIN FRA IRE LUX NET POR SWE UNK
No infoNeverSometimes
Often
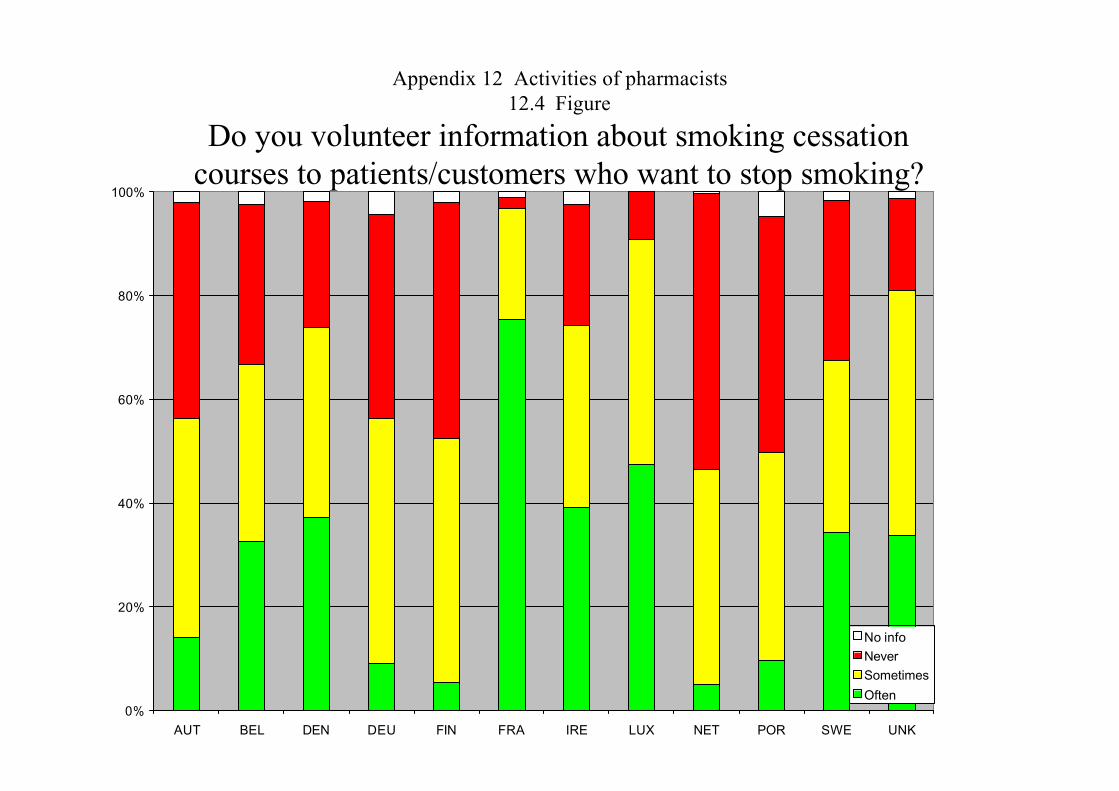
Appendix 12 Activities of pharmacists12.4 Figure
Do you volunteer information about smoking cessation courses to patients/customers who want to stop smoking?
0%
20%
40%
60%
80%
100%
AUT BEL DEN DEU FIN FRA IRE LUX NET POR SWE UNK
No infoNeverSometimes
Often
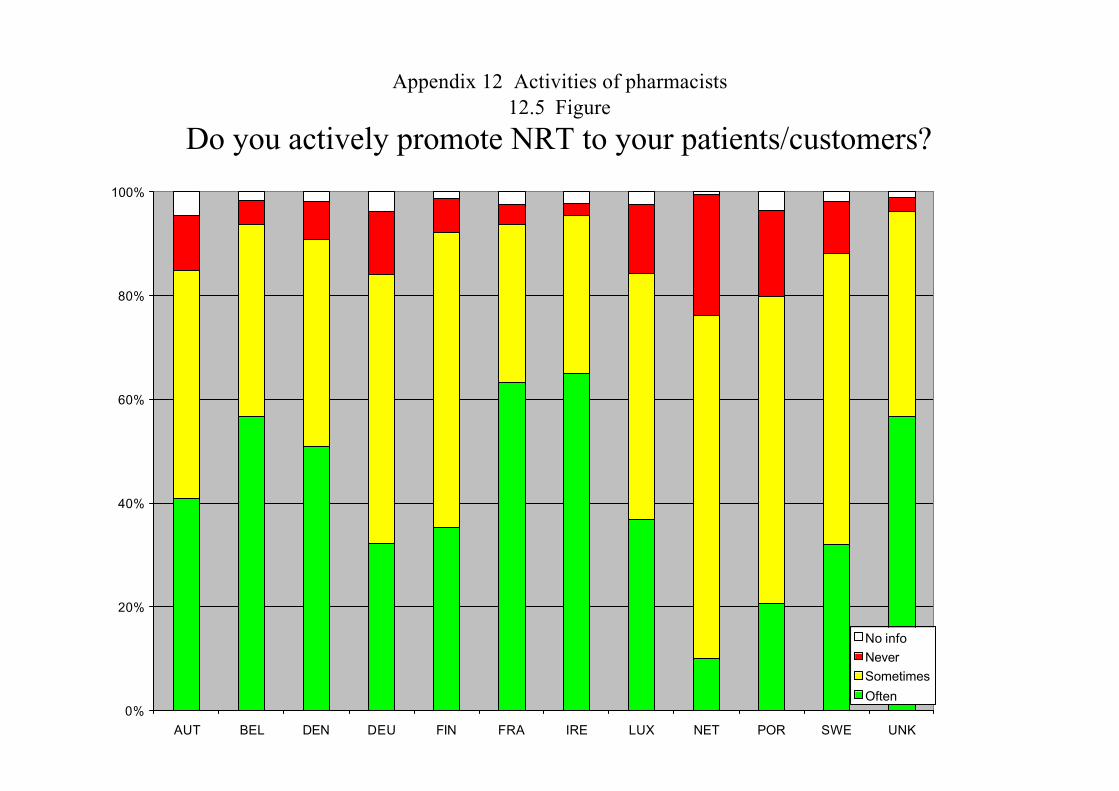
Appendix 12 Activities of pharmacists12.5 Figure
Do you actively promote NRT to your patients/customers?
0%
20%
40%
60%
80%
100%
AUT BEL DEN DEU FIN FRA IRE LUX NET POR SWE UNK
No infoNeverSometimes
Often
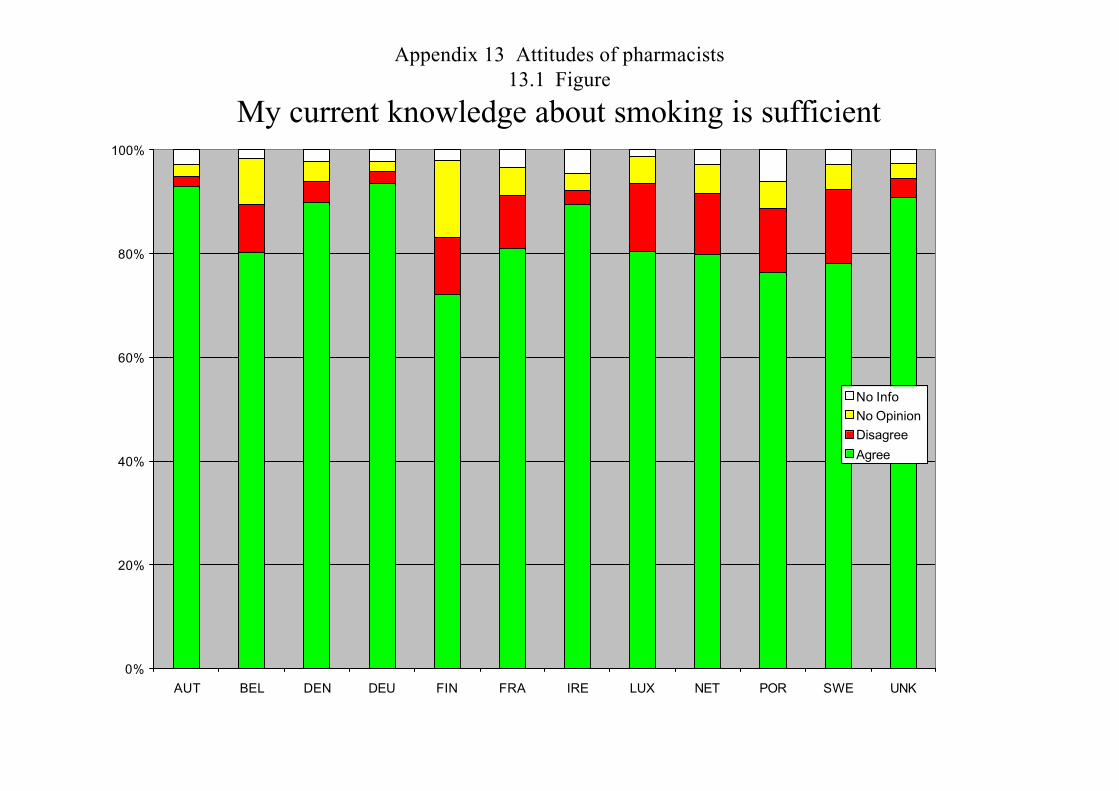
Appendix 13 Attitudes of pharmacists13.1 Figure
My current knowledge about smoking is sufficient
0%
20%
40%
60%
80%
100%
AUT BEL DEN DEU FIN FRA IRE LUX NET POR SWE UNK
No InfoNo OpinionDisagree
Agree
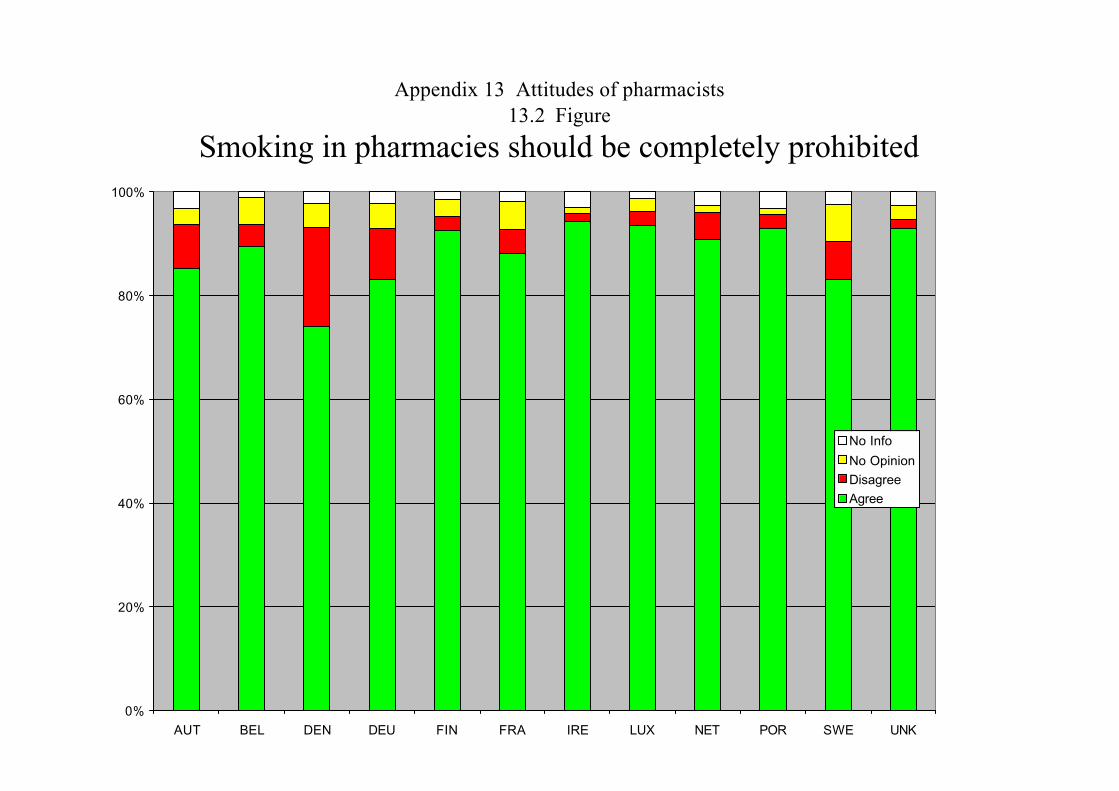
Appendix 13 Attitudes of pharmacists13.2 Figure
Smoking in pharmacies should be completely prohibited
0%
20%
40%
60%
80%
100%
AUT BEL DEN DEU FIN FRA IRE LUX NET POR SWE UNK
No Info
No OpinionDisagreeAgree
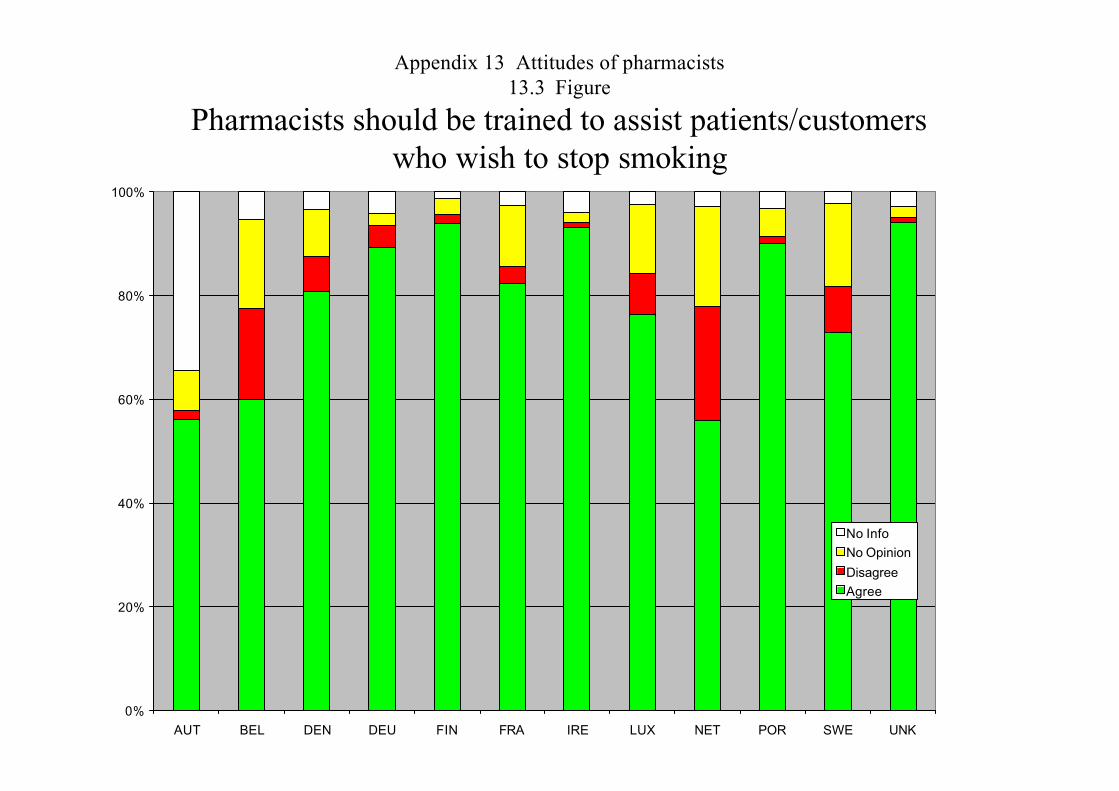
Appendix 13 Attitudes of pharmacists13.3 Figure
Pharmacists should be trained to assist patients/customers who wish to stop smoking
0%
20%
40%
60%
80%
100%
AUT BEL DEN DEU FIN FRA IRE LUX NET POR SWE UNK
No InfoNo Opinion
DisagreeAgree
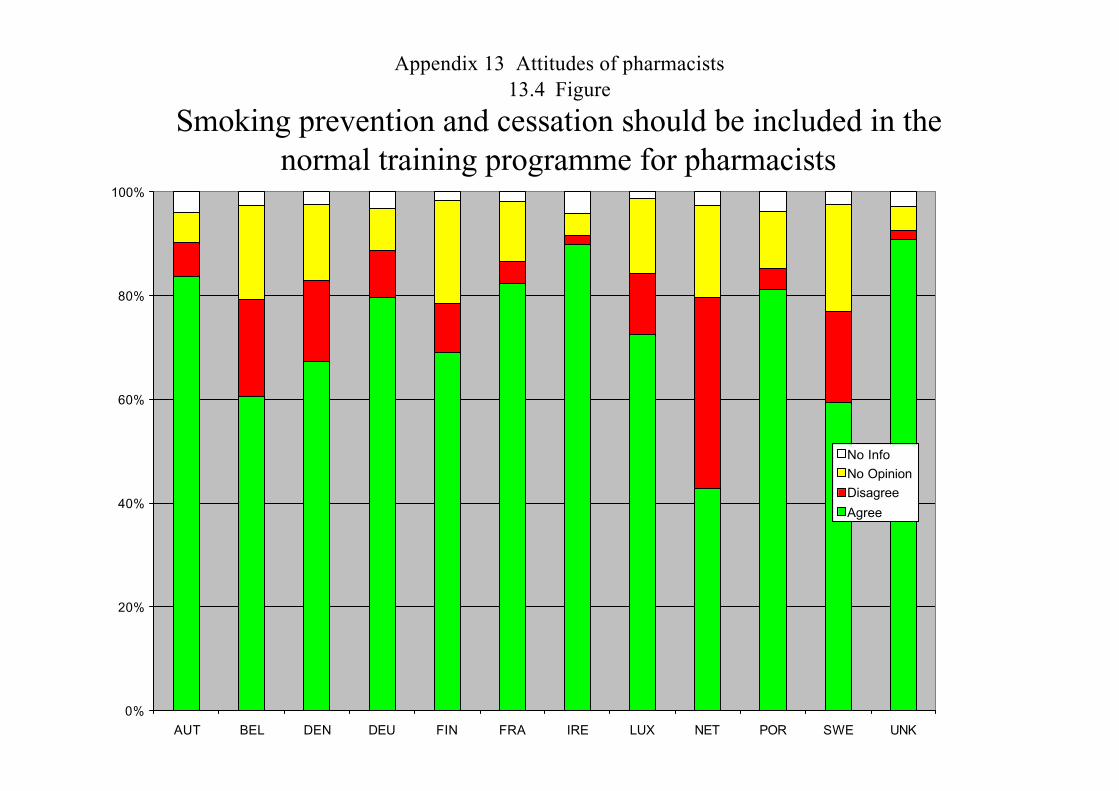
Appendix 13 Attitudes of pharmacists13.4 Figure
Smoking prevention and cessation should be included in the normal training programme for pharmacists
0%
20%
40%
60%
80%
100%
AUT BEL DEN DEU FIN FRA IRE LUX NET POR SWE UNK
No InfoNo OpinionDisagree
Agree
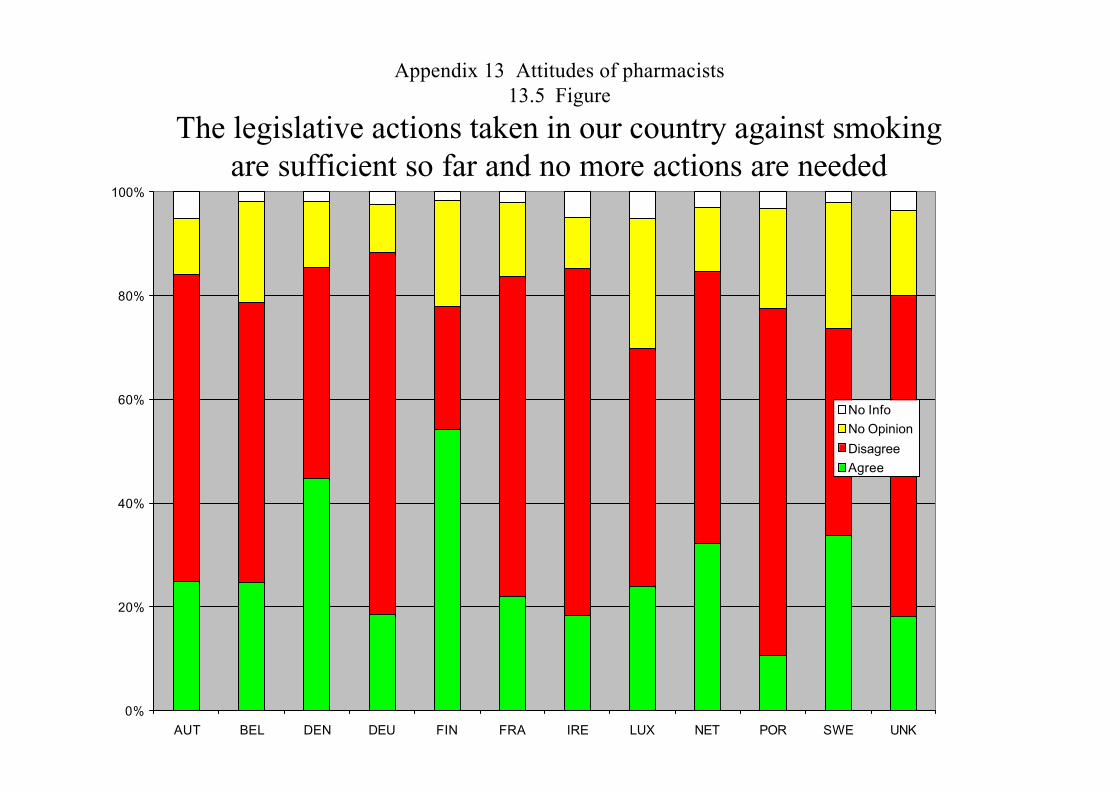
Appendix 13 Attitudes of pharmacists13.5 Figure
The legislative actions taken in our country against smoking are sufficient so far and no more actions are needed
0%
20%
40%
60%
80%
100%
AUT BEL DEN DEU FIN FRA IRE LUX NET POR SWE UNK
No InfoNo Opinion
DisagreeAgree

EUR/01/5025372ORIGINAL: ENGLISHUNEDITED