Pharmaceutical
49
The ECONOMICS of Pharmaceutical Industry
-
Upload
healtheconomics -
Category
Documents
-
view
262 -
download
0
description
Economics of Pharmaceutical Industry
Transcript of Pharmaceutical

The ECONOMICSof
Pharmaceutical Industry

2
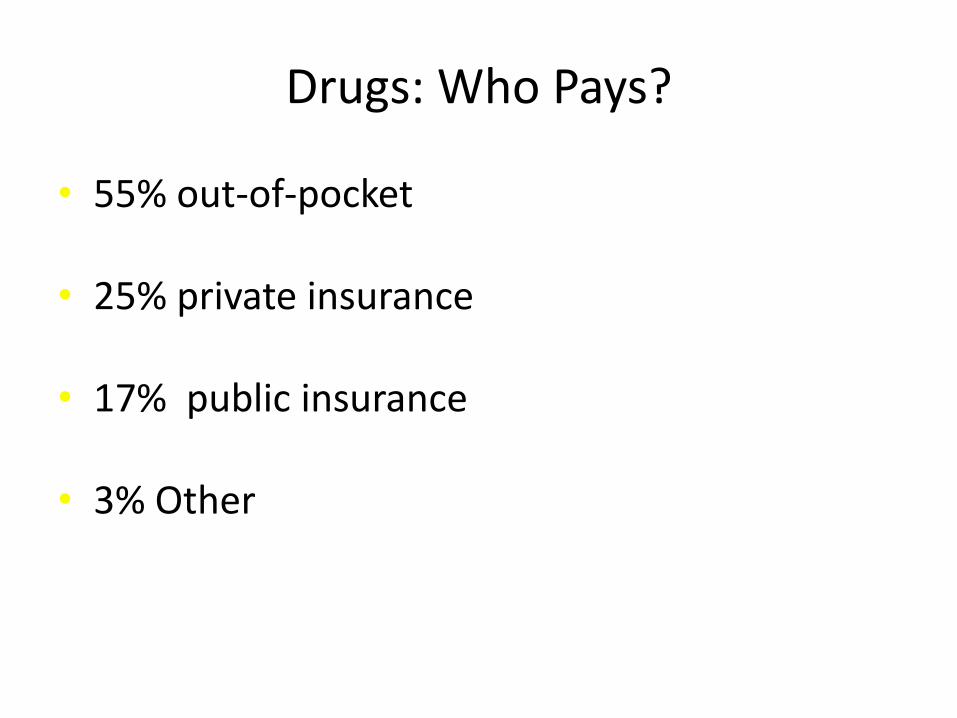
Drugs: Who Pays?
• 55% out-of-pocket
• 25% private insurance
• 17% public insurance
• 3% Other
4
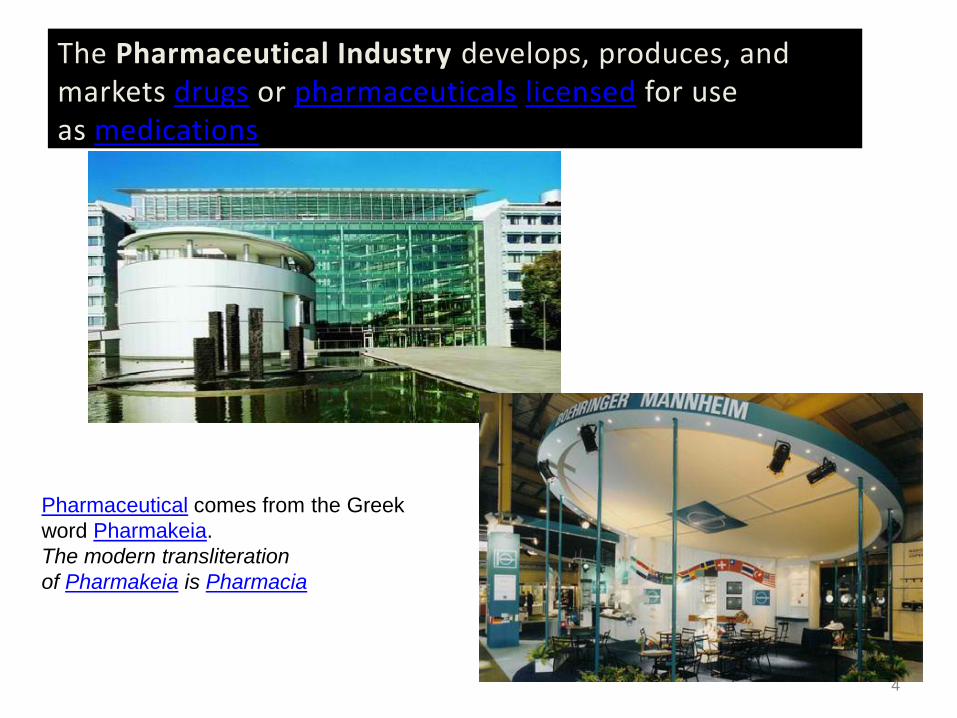
The Pharmaceutical Industry develops, produces, and markets drugs or pharmaceuticals licensed for use as medications
Pharmaceutical comes from the Greek
word Pharmakeia.
The modern transliteration
of Pharmakeia is Pharmacia

Benefits of Drugs
• Reduce mortality
• Reduce morbidity/improve quality of life
• Reduce cost of treating diseases

HISTORY• The origins of the pharmaceutical
industry can be traced back to the chemical industries (of the late nineteenth century) in the upper Rhine Valley of Switzerland. These industries were producing dye. When dye stuffs were found to have antiseptic properties, a number of these industries turned into pharmaceutical industries e.g. Hoffman-La Roche, Sandoz, Ciba-Geigy, etc.
• Key discoveries of the 1920s and 1930s, such as insulin and penicillin, became mass-manufactured and distributed. Switzerland, Germany, Italy, UK, US, Belgium and Netherlands, had strong industries.

• As a result of introduction and success of penicillin in the early forties and the relative success of other innovative drugs, research and development (R&D) became a major thrust area of the pharmaceutical industry.
• The industry expanded rapidly in the sixties, benefiting from new discoveries. In the1960s attempts were made by the U.S. Food and Drug Administration (FDA) to increase regulation of pharmaceutical industries and to limit financial links between companies and prescribing physicians. In 1964, after the thalidomide tragedy (in which the use of a new tranquilizer in pregnant women caused severe birth defects in the new born child), the World Medical Association set standards for clinical research.

• . Drugs for heart disease and for AIDS were a feature of the 1980s, and the US FDA started approving such drugs quickly keeping in view the nature of the disease. Legislation allowing strong patents, to cover both the process of manufacture and the specific products came in to force in most countries, and the small industries were hit by this and many closed down or were taken over by large industries. In 1990s and till date a number of mergers and takeovers have taken place. As a result pharmaceutical manufacturing became concentrated, with a few large companies holding a dominant position throughout the world.
• Tighter regulatory controls were introduced in the seventies. • The new regulations revoked permanent patents and established
fixed periods on patent protection for branded products. As a result industries flourished by producing generic products and they started earning huge profits, because generic manufacturers do not incur the cost of drug discovery.
8
HISTORY
HISTORY
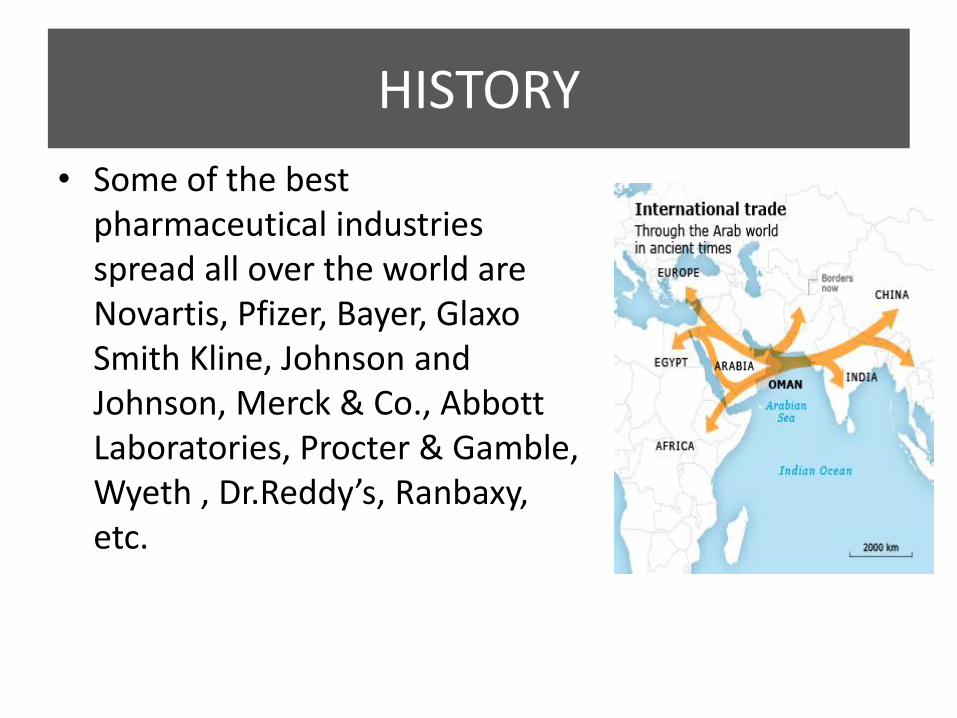
• Some of the best pharmaceutical industries spread all over the world are Novartis, Pfizer, Bayer, GlaxoSmith Kline, Johnson and Johnson, Merck & Co., Abbott Laboratories, Procter & Gamble, Wyeth , Dr.Reddy’s, Ranbaxy, etc.
HISTORY
• Another origin is the drug store. The first known drug store was opened by Arabian pharmacists in Baghdad in 754, and many more soon began operating throughout the Islamic world and Europe. By the 19th century, many of the drug stores in Europe and North America had developed into larger pharmaceutical companies. Most of today's major pharmaceutical companies were founded in the late 19th and early 20th centuries.

HISTORY
• From 1978, India took over as the primary center of pharmaceutical production of bulk drugs and products without patent protection. The industry remained relatively small scale until the 1970s when it began to expand at a greater rate
Outline
• Competitiveness of the pharmaceutical industry
• Conduct
• Performance

Industry Structure
COMPETITIVENESS

COMPETITIVENESS

The bargaining power of suppliers
• Providers of the raw materials and intermediates
• manufacturing and production plants• the overseas head offices who supply
finished product• the local co-marketing partners who
supply product and/or third party suppliers
• Labor
Suppliers can affect in several ways: by threatening to raise prices or threatening to reduce the quality of goods and services. Both these prospects are unattractive to a business because of their affect on profitability.

The bargaining power of buyers
• In the pharmaceutical industry, the buyers are the patients, the family members(indirecty), the finance departments, the hospital boards, the tender boards, the chief pharmacist along with a range of other buyers, depending on the specific business.
• Their influence needs to be considered. In various ways, buyers can affect a business by seeking price reductions, - demanding higher quality and demanding better service.
• A buyer is powerful in the following situations:
• when they purchase large volumes,• when they buy your products from other
suppliers because they are standardised• when they are knowledgeable and make
demands based on this knowledge.
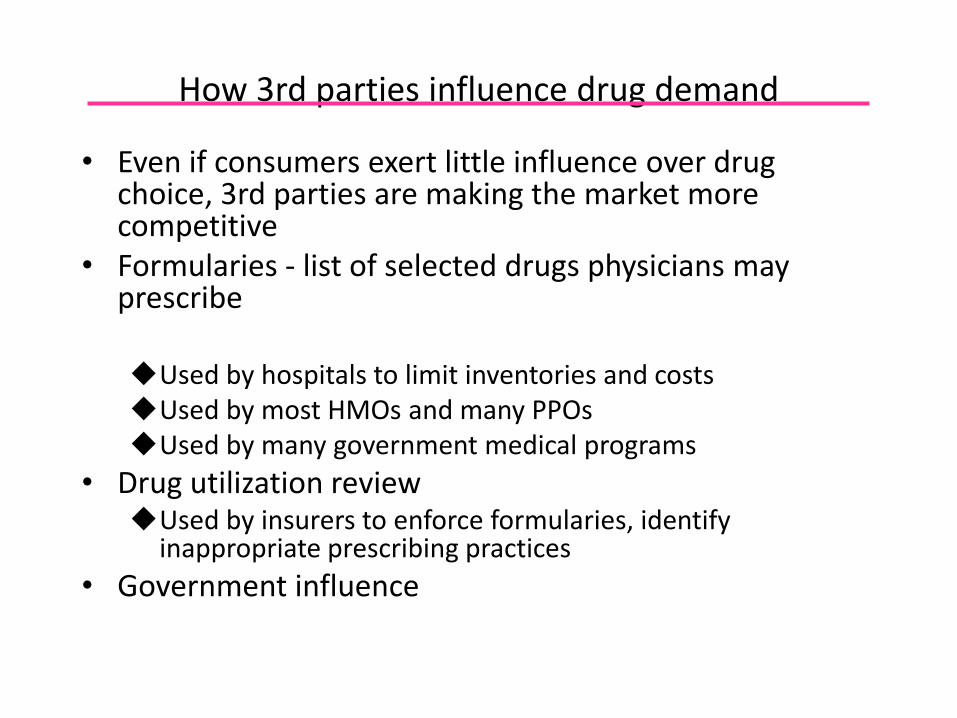
How 3rd parties influence drug demand
• Even if consumers exert little influence over drug choice, 3rd parties are making the market more competitive
• Formularies - list of selected drugs physicians may prescribe
Used by hospitals to limit inventories and costsUsed by most HMOs and many PPOsUsed by many government medical programs
• Drug utilization reviewUsed by insurers to enforce formularies, identify
inappropriate prescribing practices
• Government influence
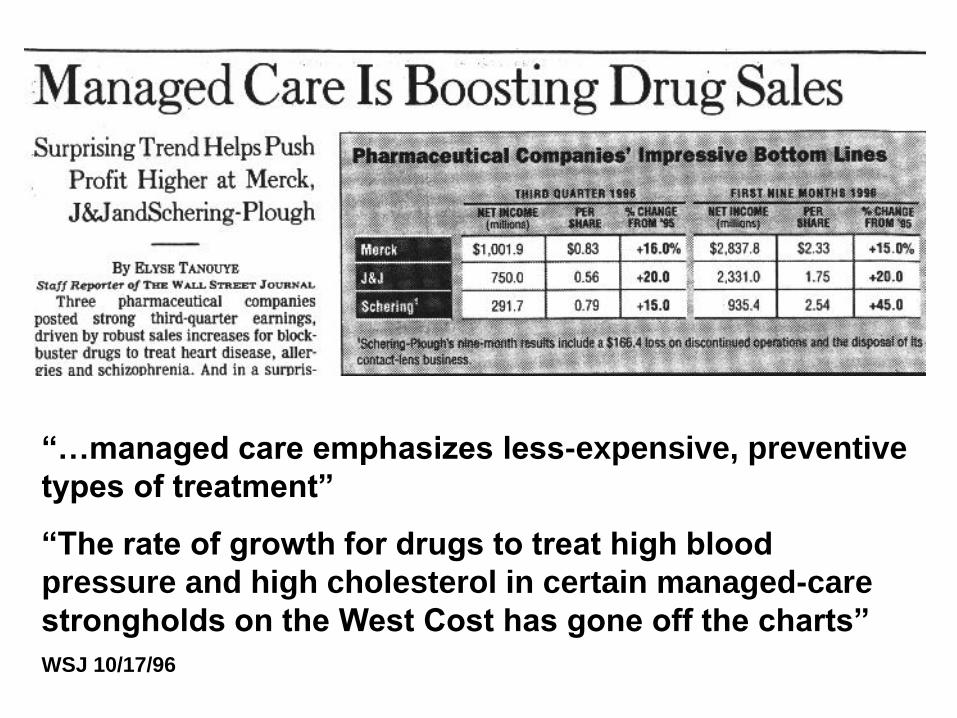
“…managed care emphasizes less-expensive, preventive
types of treatment”
“The rate of growth for drugs to treat high blood
pressure and high cholesterol in certain managed-care
strongholds on the West Cost has gone off the charts”
WSJ 10/17/96

“Consumers in the $94
billion prescription drug
market are mostly
indifferent to price.
What will happen when
they all become budget
conscious?

The threat of substitutes
• Substitute products perform the same function as the product, and are a competitive force as they can take away demand or tie up those customers who choose to use the substitute instead of your product.

The threat of new entrants
• New entrants into the industry affect the competitive dynamics and need to be taken into consideration when analysing the competition
• Possible barriers for the new entrants
• Economies of scale - manufacturing, R&D, marketing, sales, distribution.
• Product differentiation - established products, brands and relationships
• Capital requirements and financial resources
• Access to distribution channels: preferred arrangements
• Regulatory policy: patents, regulatory standards
• Switching costs - employee retraining, new equipment, technical assistance
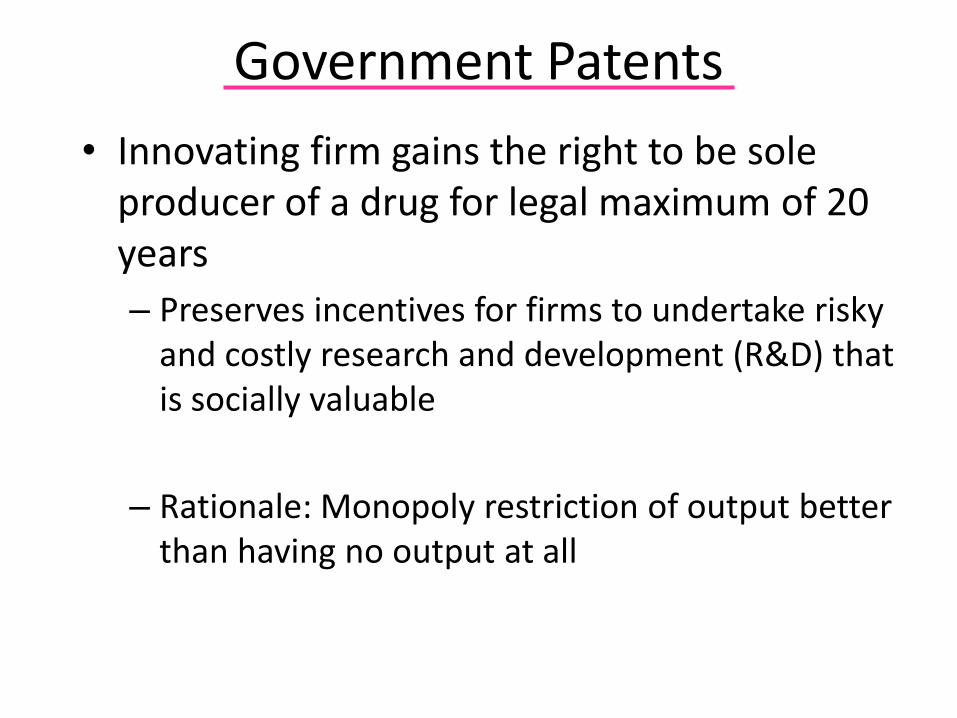
Government Patents
• Innovating firm gains the right to be sole producer of a drug for legal maximum of 20 years
– Preserves incentives for firms to undertake risky and costly research and development (R&D) that is socially valuable
– Rationale: Monopoly restriction of output better than having no output at all

Monopoly power of patents is not always strong
• Patents granted for chemical composition, not therapeutic novelty
Lipitor, Crestor, and Zocor all compete in the cholesterol-lowering drug market
• Significant part of patent life may be spent trying to get FDA approval
“effective” patent life = 8 years
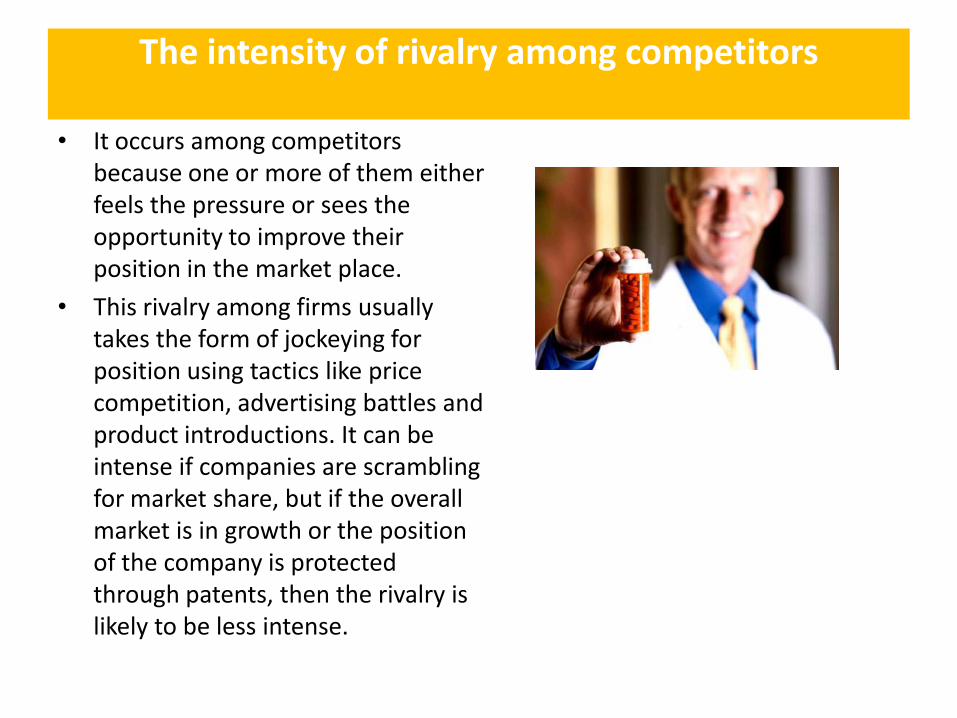
The intensity of rivalry among competitors
• It occurs among competitors because one or more of them either feels the pressure or sees the opportunity to improve their position in the market place.
• This rivalry among firms usually takes the form of jockeying for position using tactics like price competition, advertising battles and product introductions. It can be intense if companies are scrambling for market share, but if the overall market is in growth or the position of the company is protected through patents, then the rivalry is likely to be less intense.

25
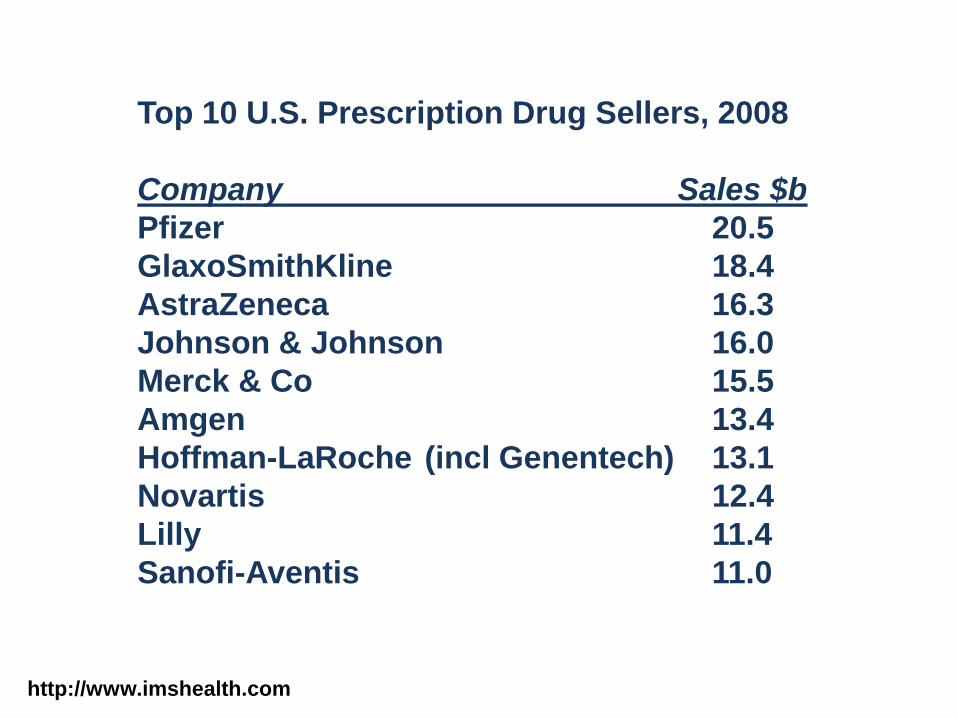
http://www.imshealth.com
Top 10 U.S. Prescription Drug Sellers, 2008
Company Sales $b
Pfizer 20.5
GlaxoSmithKline 18.4
AstraZeneca 16.3
Johnson & Johnson 16.0
Merck & Co 15.5
Amgen 13.4
Hoffman-LaRoche (incl Genentech) 13.1
Novartis 12.4
Lilly 11.4
Sanofi-Aventis 11.0

CONDUCT
28

Prescription Drugs
• 10,000 FDA-approved drugs
• 70% of all office visits lead to prescriptions
• 1.5 - 2.0 billion prescriptions/year

Influences on Physician Prescribing Habits
• Texts• Journals• Colleagues• Formularies• Samples• Patient requests• Personal experience• Cost• Gifts• Drug advertisements• Pharmaceutical
representatives

Gifts from Pharmaceutical Companies
• Pens, toys and puzzles
• Household gadgets
• Food
• Books
• Event tickets
• Travel and meeting expenses
• Cash

AMA Guidelines Re Gifts to Physicians from Industry
• Gifts of modest value which benefit patients O.K.
– Pens, notepads, modest meals, textbooks acceptable
– Film, videos, CDs; “Dinner to Go” (Merck); “Look for a Book” GlaxoSmithKline PLC); Palm Pilots (Dupont) – may be acceptable
• No cash gifts
• No gifts with strings attached
• CME sponsorship money to conference sponsor, not participating physicians
• Meeting expenses for trainees funneled through institution

Pharmaceutical Company Advertising
• $15 billion in 2000
– up to $15,000/U.S. physician
– over $6 billion -advertising and marketing
– over $7 billion - sales reps’ salaries
• 50,000 salespersons: 1/10 prescribing physicians

Pharmaceutical Company Advertising – Drug Samples
• $8 billion/year in samples
• Dispensed at 10% - 20% of visits
Only ½ of samples go to patients
60% of pharmaceutical reps self-medicate50% of residents self-medicate, often using samples

Truthfulness in Drug AdsWilkes et al.
Ann Int Med 1992:116:912-9
• 10 leading medical journals
• 109 ads and all available references (82%)
• 3 independent reviewers

Doctors are Influenced by Pharmaceutical Advertising and Marketing
• Prescribing patterns
–e.g., Calcium channel blockers
• 1998: Trovan most promoted drug in US; sales most ever for an antibiotic in one year; use since limited by FDA due to liver toxicity

Doctors are Influenced:Formulary Requests
by P and T Committee Members(JAMA 1994;271:684-9)
• Met with drug rep – 3.4X more likely to request company’s drug
• Accepted money to speak at symposia – 3.9X
• Accepted money to attend symposia – 7.9X
• Accepted money to perform company-sponsored research – 9.5X

Pharmaceuticals Sales Reps’ Techniques
• Appeal to authority• Appeal to popularity• The “red herring”• Appeal to pity
– Dryden - “Pity melts the mind”• Appeal to curiosity• Free food/gifts• Testimonials• Relationship building/face time• Active learning – reinforcement / change • Favorable but inaccurate statements• Negative comments re competitors’
products• Reprints not conforming to FDA
regulations

PERFORMANCE
39

Economics
• 16.4% profit margin in 2000 ($24 billion)
-Largest of any industry
-4 times greater than average return of all fortune 500 companies
-8 out of 25 most profitable U.S. companies are pharmaceutical companies
• Greater than 5000 companies worldwide
• Less than 100 companies account for over 90% of worldwide market
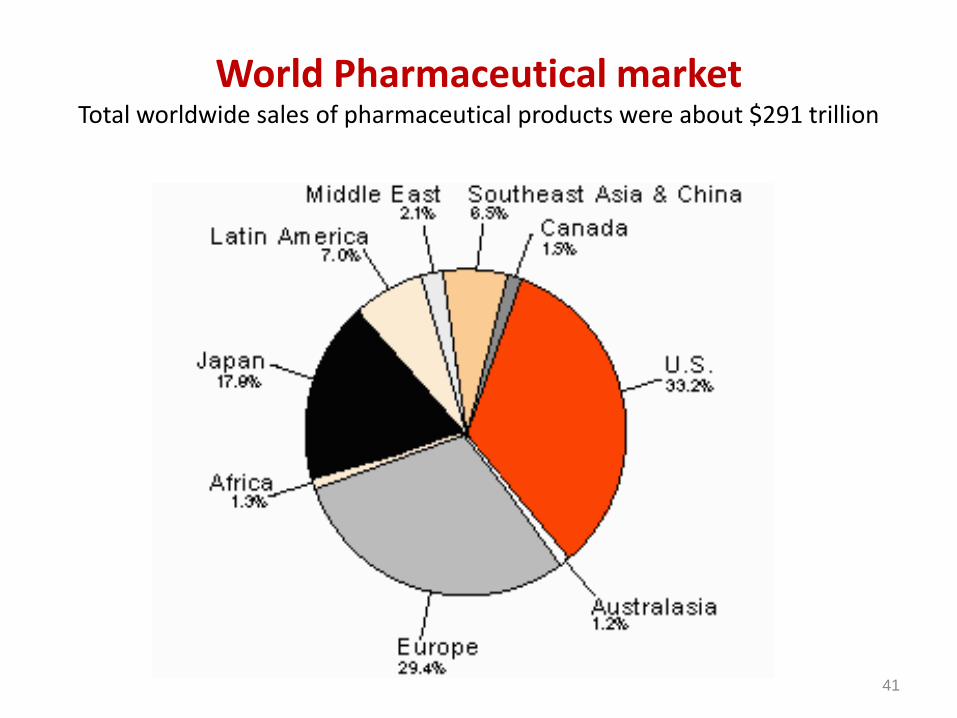
World Pharmaceutical marketTotal worldwide sales of pharmaceutical products were about $291 trillion
41
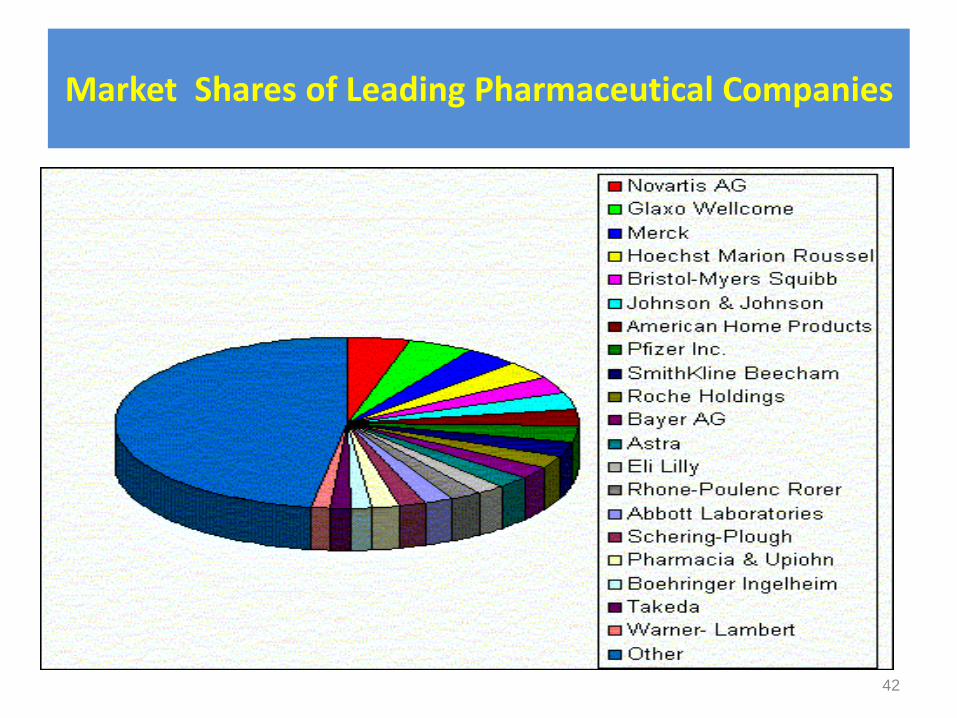
Market Shares of Leading Pharmaceutical Companies
42

Manufactures' Sales by Class of Customer
43

Mergers and Acquisitions
• Drug company mergers
- Pfizer-Warner-Lambert
- Upjohn-Pharmacia
→Pfizer acquired Pharmacia in 2002 for $60 billion to become the world’s most powerful drug conglomerate
Drug Costs
• U.S. highest in the world55% > Europe35% to 80% > Canada (drug companies still among the most profitable in Canada)
• Cross border pharmacy visits increasingly common– Canada vs. Mexico
• U.S. only large industrialized country which does not regulate drug prices
• Single payer system would dramatically decrease drug costs– Single purchaser able to negotiate deep
discounts
Increasing Involvement of Industry in Provision of Continuing Medical Education
• 1/2 of the $1.1 billion spent on CME in 1999 from industry
• Medical Education and Communication Companies
– Sponsored/paid mainly by drug companies
– Provide “educational” materials gratis

Where Prescription Peso Go
• Research and development - 12%-preclinical testing - 6%-clinical testing - 6%
• Manufacturing and distribution - 24%
• Sales and marketing - 26%
• Administrative / miscellaneous expenses - 12%
• Taxes - 9%
• Net profit - 17%

Conclusion
• Pharmaceuticals and Biotechnology Industries-Tremendous contributions to health-Motivation = “alleviate suffering”-Primary responsibility = “make money for shareholders”
49