
PHAK Ch-13 - Federal Aviation Administration Ch-13 - Federal Aviation Administration
24
13-1 Introduction In aviation, weather service is a combined effort of the National Weather Service (NWS), Federal Aviation Administration (FAA), Department of Defense (DOD), other aviation groups, and individuals. Because of the increasing need for worldwide weather services, foreign weather organizations also provide vital input. While weather forecasts are not 100 percent accurate, meteorologists, through careful scientific study and computer modeling, have the ability to predict weather patterns, trends, and characteristics with increasing accuracy. Through a complex system of weather services, government agencies, and independent weather observers, pilots and other aviation professionals receive the benefit of this vast knowledge base in the form of up-to-date weather reports and forecasts. These reports and forecasts enable pilots to make informed decisions regarding weather and flight safety before and during a flight. Aviation Weather Services Chapter 13
Transcript of PHAK Ch-13 - Federal Aviation Administration Ch-13 - Federal Aviation Administration
13-1
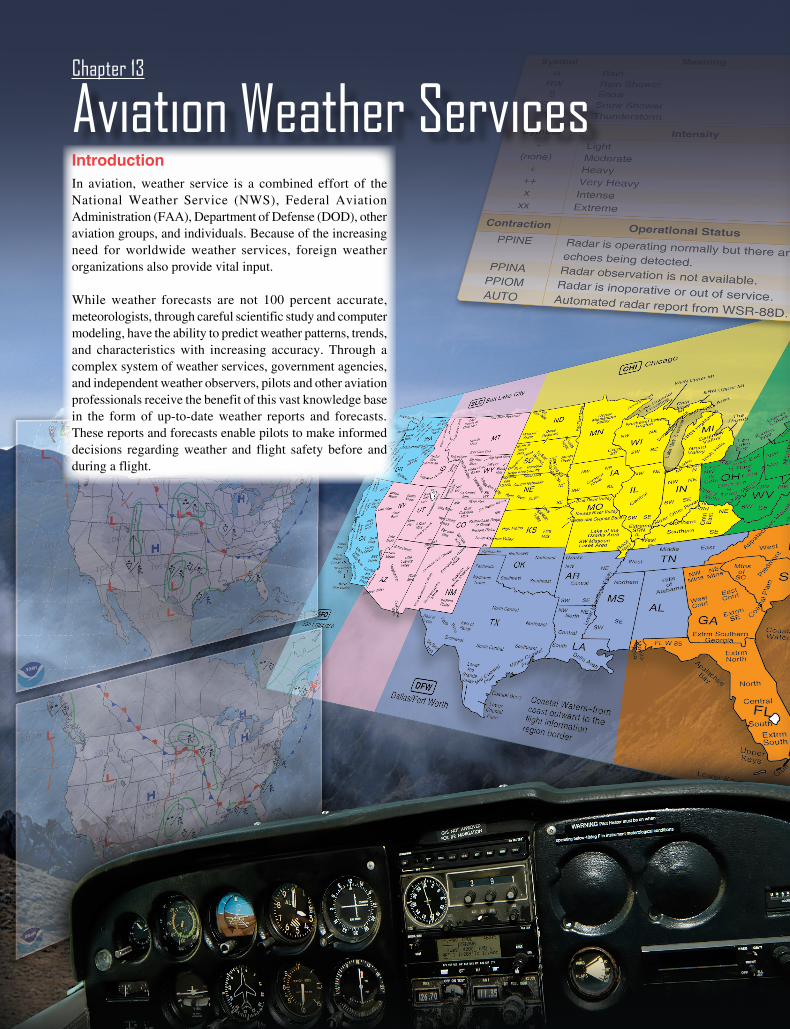
IntroductionIn aviation, weather service is a combined effort of the National Weather Service (NWS), Federal Aviation Administration (FAA), Department of Defense (DOD), other aviation groups, and individuals. Because of the increasing need for worldwide weather services, foreign weather organizations also provide vital input.
While weather forecasts are not 100 percent accurate, meteorologists, through careful scientific study and computer modeling, have the ability to predict weather patterns, trends, and characteristics with increasing accuracy. Through a complex system of weather services, government agencies, and independent weather observers, pilots and other aviation professionals receive the benefit of this vast knowledge base in the form of up-to-date weather reports and forecasts. These reports and forecasts enable pilots to make informed decisions regarding weather and flight safety before and during a flight.
Aviation Weather ServicesChapter 13
13-2
ObservationsThe data gathered from surface and upper altitude observations form the basis of all weather forecasts, advisories, and briefings. There are four types of weather observations: surface, upper air, radar, and satellite.
Surface Aviation Weather ObservationsSurface aviation weather observations (METARs) are a compilation of elements of the current weather at individual ground stations across the United States. The network is made up of government and privately contracted facilities that provide continuous up-to-date weather information. Automated weather sources, such as the Automated Weather Observing Systems (AWOS), Automated Surface Observing Systems (ASOS), as well as other automated facilities, also play a major role in the gathering of surface observations.
Surface observations provide local weather conditions and other relevant information for a specific airport. This information includes the type of report, station identifier, date and time, modifier (as required), wind, visibility, runway visual range (RVR), weather phenomena, sky condition, temperature/dew point, altimeter reading, and applicable remarks. The information gathered for the surface observation may be from a person, an automated station, or an automated station that is updated or enhanced by a weather observer. In any form, the surface observation provides valuable information about individual airports around the country. Although the reports cover only a small radius, the pilot can generate a good picture of the weather over a wide area when many reporting stations are viewed together.
Air Route Traffic Control Center (ARTCC)The Air Route Traffic Control Center (ARTCC) facilities are responsible for maintaining separation between flights conducted under instrument flight rules (IFR) in the en route structure. Center radars (Air Route Surveillance Radar (ARSR)) acquire and track transponder returns using the same basic technology as terminal radars. Earlier center radars displayed weather as an area of slashes (light precipitation) and Hs (moderate rainfall). Because the controller could not detect higher levels of precipitation, pilots had to be wary of areas showing moderate rainfall. Newer radar displays show weather as three shades of blue. Controllers can select the level of weather to be displayed. Weather displays of higher levels of intensity make it difficult for controllers to see aircraft data blocks, so pilots should not expect air traffic control (ATC) to keep weather displayed continuously.
Upper Air ObservationsObservations of upper air weather are more challenging than surface observations. There are several methods by which upper air weather phenomena can be observed:
radiosonde observations, pilot weather reports (PIREPs), Aircraft Meteorological Data Relay (AMDAR) and the Meteorological Data Collection and Reporting System (MDCRS). A radiosonde is a small cubic instrumentation package that is suspended below a six foot hydrogen- or helium-filled balloon. Once released, the balloon rises at a rate of approximately 1,000 feet per minute (fpm). As it ascends, the instrumentation gathers various pieces of data, such as air temperature, moisture, and pressure, as well as wind speed and direction. Once the information is gathered, it is relayed to ground stations via a 300 milliwatt radio transmitter.
The balloon flight can last as long as 2 hours or more and can ascend to altitudes as high as 115,000 feet and drift as far as 125 miles. The temperatures and pressures experienced during the flight can be as low as -130 °F and pressures as low as a few thousandths of what is experienced at sea level.
Since the pressure decreases as the balloon rises in the atmosphere, the balloon expands until it reaches the limits of its elasticity. This point is reached when the diameter has increased to over 20 feet. At this point, the balloon pops and the radiosonde falls back to Earth. The descent is slowed by means of a parachute. The parachute aids in protecting people and objects on the ground. Each year over 75,000 balloons are launched. Of that number, 20 percent are recovered and returned for reconditioning. Return instructions are printed on the side of each radiosonde.
Pilots also provide vital information regarding upper air weather observations and remain the only real-time source of information regarding turbulence, icing, and cloud heights. This information is gathered and filed by pilots in flight. Together, PIREPs and radiosonde observations provide information on upper air conditions important for flight planning. Many domestic and international airlines have equipped their aircraft with instrumentation that automatically transmits in flight weather observations through the DataLink system.
The Aircraft Meteorological Data Relay (AMDAR) is an international program utilizing commercial aircraft to provide automated weather observations. The AMDAR program provides approximately 220,000-230,000 aircraft observations per day on a worldwide basis utilizing aircraft onboard sensors and probes that measure wind, temperature, humidity/water vapor, turbulence and icing data. AMDAR vertical profiles and en route observations provide significant benefits to the aviation community by enhancing aircraft safety and operating efficiency through improved weather analysis and forecasting. The AMDAR program also contributes to improved short and medium term numerical weather forecasts for a wide range of services including
13-3
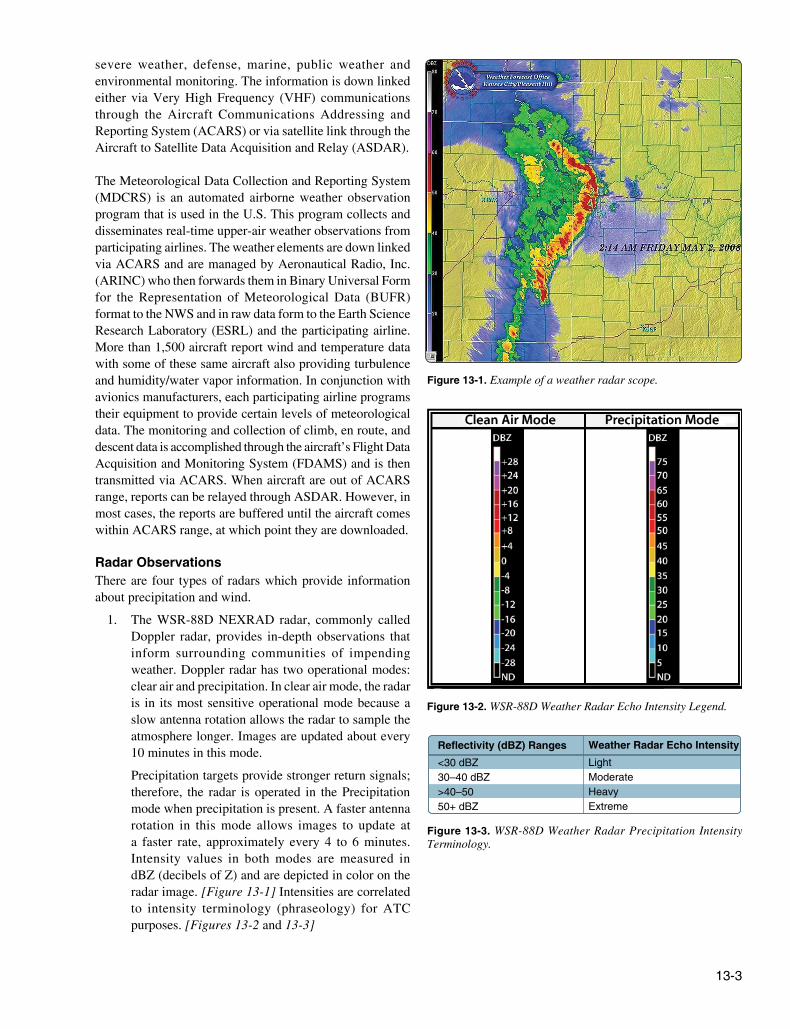
Weather Radar Echo Intensity LightModerateHeavyExtreme
Reflectivity (dBZ) Ranges<30 dBZ30–40 dBZ>40–5050+ dBZ
Figure 13-3. WSR-88D Weather Radar Precipitation Intensity Terminology.
Figure 13-1. Example of a weather radar scope.
Figure 13-2. WSR-88D Weather Radar Echo Intensity Legend.
severe weather, defense, marine, public weather and environmental monitoring. The information is down linked either via Very High Frequency (VHF) communications through the Aircraft Communications Addressing and Reporting System (ACARS) or via satellite link through the Aircraft to Satellite Data Acquisition and Relay (ASDAR).
The Meteorological Data Collection and Reporting System (MDCRS) is an automated airborne weather observation program that is used in the U.S. This program collects and disseminates real-time upper-air weather observations from participating airlines. The weather elements are down linked via ACARS and are managed by Aeronautical Radio, Inc. (ARINC) who then forwards them in Binary Universal Form for the Representation of Meteorological Data (BUFR) format to the NWS and in raw data form to the Earth Science Research Laboratory (ESRL) and the participating airline. More than 1,500 aircraft report wind and temperature data with some of these same aircraft also providing turbulence and humidity/water vapor information. In conjunction with avionics manufacturers, each participating airline programs their equipment to provide certain levels of meteorological data. The monitoring and collection of climb, en route, and descent data is accomplished through the aircraft’s Flight Data Acquisition and Monitoring System (FDAMS) and is then transmitted via ACARS. When aircraft are out of ACARS range, reports can be relayed through ASDAR. However, in most cases, the reports are buffered until the aircraft comes within ACARS range, at which point they are downloaded.
Radar ObservationsThere are four types of radars which provide information about precipitation and wind.
1. The WSR-88D NEXRAD radar, commonly called Doppler radar, provides in-depth observations that inform surrounding communities of impending weather. Doppler radar has two operational modes: clear air and precipitation. In clear air mode, the radar is in its most sensitive operational mode because a slow antenna rotation allows the radar to sample the atmosphere longer. Images are updated about every 10 minutes in this mode.
Precipitation targets provide stronger return signals; therefore, the radar is operated in the Precipitation mode when precipitation is present. A faster antenna rotation in this mode allows images to update at a faster rate, approximately every 4 to 6 minutes. Intensity values in both modes are measured in dBZ (decibels of Z) and are depicted in color on the radar image. [Figure 13-1] Intensities are correlated to intensity terminology (phraseology) for ATC purposes. [Figures 13-2 and 13-3]
13-4
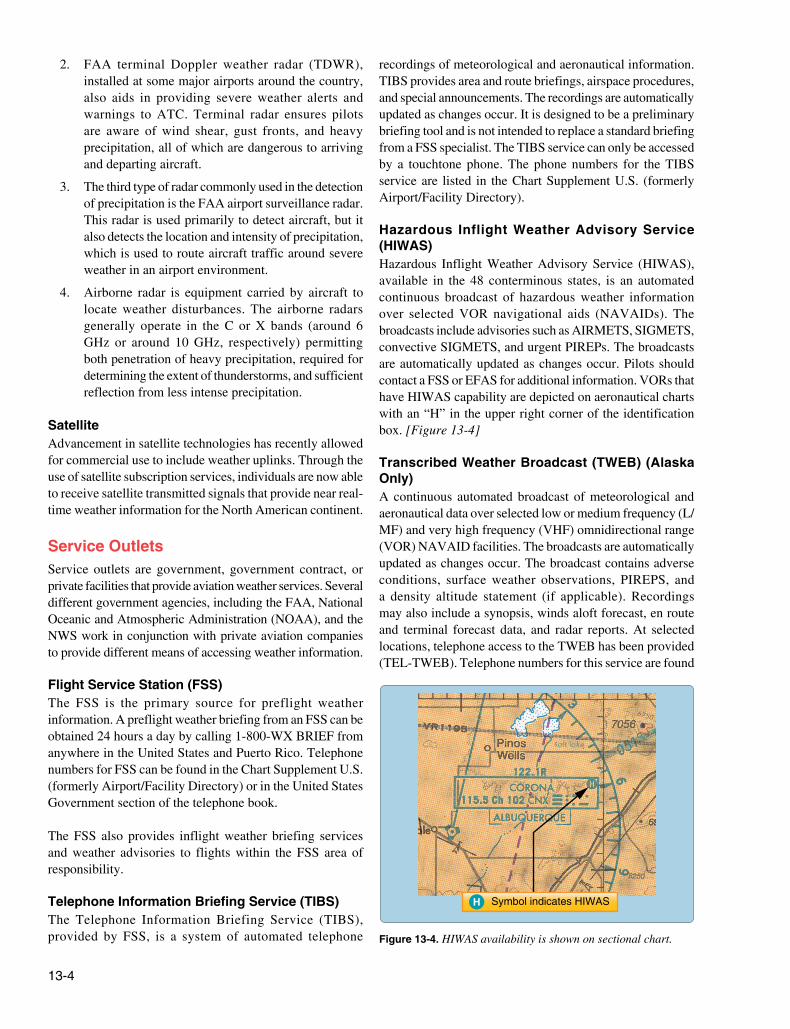
Symbol indicates HIWAS
Figure 13-4. HIWAS availability is shown on sectional chart.
2. FAA terminal Doppler weather radar (TDWR), installed at some major airports around the country, also aids in providing severe weather alerts and warnings to ATC. Terminal radar ensures pilots are aware of wind shear, gust fronts, and heavy precipitation, all of which are dangerous to arriving and departing aircraft.
3. The third type of radar commonly used in the detection of precipitation is the FAA airport surveillance radar. This radar is used primarily to detect aircraft, but it also detects the location and intensity of precipitation, which is used to route aircraft traffic around severe weather in an airport environment.
4. Airborne radar is equipment carried by aircraft to locate weather disturbances. The airborne radars generally operate in the C or X bands (around 6 GHz or around 10 GHz, respectively) permitting both penetration of heavy precipitation, required for determining the extent of thunderstorms, and sufficient reflection from less intense precipitation.
SatelliteAdvancement in satellite technologies has recently allowed for commercial use to include weather uplinks. Through the use of satellite subscription services, individuals are now able to receive satellite transmitted signals that provide near real-time weather information for the North American continent.
Service OutletsService outlets are government, government contract, or private facilities that provide aviation weather services. Several different government agencies, including the FAA, National Oceanic and Atmospheric Administration (NOAA), and the NWS work in conjunction with private aviation companies to provide different means of accessing weather information.
Flight Service Station (FSS)The FSS is the primary source for preflight weather information. A preflight weather briefing from an FSS can be obtained 24 hours a day by calling 1-800-WX BRIEF from anywhere in the United States and Puerto Rico. Telephone numbers for FSS can be found in the Chart Supplement U.S. (formerly Airport/Facility Directory) or in the United States Government section of the telephone book.
The FSS also provides inflight weather briefing services and weather advisories to flights within the FSS area of responsibility.
Telephone Information Briefing Service (TIBS)The Telephone Information Briefing Service (TIBS), provided by FSS, is a system of automated telephone
recordings of meteorological and aeronautical information. TIBS provides area and route briefings, airspace procedures, and special announcements. The recordings are automatically updated as changes occur. It is designed to be a preliminary briefing tool and is not intended to replace a standard briefing from a FSS specialist. The TIBS service can only be accessed by a touchtone phone. The phone numbers for the TIBS service are listed in the Chart Supplement U.S. (formerly Airport/Facility Directory).
Hazardous Inflight Weather Advisory Service (HIWAS)Hazardous Inflight Weather Advisory Service (HIWAS), available in the 48 conterminous states, is an automated continuous broadcast of hazardous weather information over selected VOR navigational aids (NAVAIDs). The broadcasts include advisories such as AIRMETS, SIGMETS, convective SIGMETS, and urgent PIREPs. The broadcasts are automatically updated as changes occur. Pilots should contact a FSS or EFAS for additional information. VORs that have HIWAS capability are depicted on aeronautical charts with an “H” in the upper right corner of the identification box. [Figure 13-4]
Transcribed Weather Broadcast (TWEB) (Alaska Only) A continuous automated broadcast of meteorological and aeronautical data over selected low or medium frequency (L/MF) and very high frequency (VHF) omnidirectional range (VOR) NAVAID facilities. The broadcasts are automatically updated as changes occur. The broadcast contains adverse conditions, surface weather observations, PIREPS, and a density altitude statement (if applicable). Recordings may also include a synopsis, winds aloft forecast, en route and terminal forecast data, and radar reports. At selected locations, telephone access to the TWEB has been provided (TEL-TWEB). Telephone numbers for this service are found
13-5
in the Alaska Chart Supplement U.S. (formerly Airport/Facility Directory). These broadcasts are made available primarily for preflight and inflight planning, and as such, should not be considered as a substitute for specialist-provided preflight briefings.
Weather BriefingsPrior to every flight, pilots should gather all information vital to the nature of the flight. This includes an appropriate weather briefing obtained from a specialist at a FSS.
For weather specialists to provide an appropriate weather briefing, they need to know which of the three types of briefings is needed—standard, abbreviated, or outlook. Other helpful information is whether the flight is visual flight rules (VFR) or IFR, aircraft identification and type, departure point, estimated time of departure (ETD), flight altitude, route of flight, destination, and estimated time en route (ETE).
This information is recorded in the flight plan system and a note is made regarding the type of weather briefing provided. If necessary, it can be referenced later to file or amend a flight plan. It is also used when an aircraft is overdue or is reported missing.
Standard BriefingA standard briefing provides the most complete information and a more complete weather picture. This type of briefing should be obtained prior to the departure of any flight and should be used during flight planning. A standard briefing provides the following information in sequential order if it is applicable to the route of flight.
1. Adverse conditions—this includes information about adverse conditions that may influence a decision to cancel or alter the route of flight. Adverse conditions include significant weather, such as thunderstorms or aircraft icing, or other important items such as airport closings.
2. VFR flight not recommended—if the weather for the route of flight is below VFR minimums, or if it is doubtful the flight could be made under VFR conditions due to the forecast weather, the briefer may state “VFR flight not recommended.” It is the pilot’s decision whether or not to continue the flight under VFR, but this advisory should be weighed carefully.
3. Synopsis—an overview of the larger weather picture. Fronts and major weather systems that affect the general area are provided.
4. Current conditions—the current ceilings, visibility, winds, and temperatures. If the departure time is more than 2 hours away, current conditions are not included in the briefing.
5. En route forecast—a summary of the weather forecast for the proposed route of flight.
6. Destination forecast—a summary of the expected weather for the destination airport at the estimated time of arrival (ETA).
7. Forecast winds and temperatures aloft—a forecast of the winds at specific altitudes for the route of flight. The forecast temperature information aloft is provided only upon request.
8. Notices to Airmen (NOTAM)—information pertinent to the route of flight that has not been published in the NOTAM publication. Published NOTAM information is provided during the briefing only when requested.
9. ATC delays—an advisory of any known ATC delays that may affect the flight.
10. Other information—at the end of the standard briefing, the FSS specialist provides the radio frequencies needed to open a flight plan and to contact EFAS. Any additional information requested is also provided at this time.
Abbreviated BriefingAn abbreviated briefing is a shortened version of the standard briefing. It should be requested when a departure has been delayed or when weather information is needed to update the previous briefing. When this is the case, the weather specialist needs to know the time and source of the previous briefing so the necessary weather information is not omitted inadvertently. It is always a good idea for the pilot to update the weather information whenever he/she has additional time.
Outlook BriefingAn outlook briefing should be requested when a planned departure is 6 hours or more away. It provides initial forecast information that is limited in scope due to the time frame of the planned flight. This type of briefing is a good source of flight planning information that can influence decisions regarding route of flight, altitude, and ultimately the go/no-go decision. A prudent pilot requests a follow-up briefing prior to departure since an outlook briefing generally only contains information based on weather trends and existing weather in geographical areas at or near the departure airport. A standard briefing near the time of departure ensures that the pilot has the latest information available prior to his/her flight.
Aviation Weather ReportsAviation weather reports are designed to give accurate depictions of current weather conditions. Each report provides current information that is updated at different times. Some typical reports are METARs and PIREPs.
13-6
Aviation Routine Weather Report (METAR)A METAR is an observation of current surface weather reported in a standard international format. While the METAR code has been adopted worldwide, each country is allowed to make modifications to the code. Normally, these differences are minor but necessary to accommodate local procedures or particular units of measure. This discussion of METAR covers elements used in the United States.
METARs are issued on a regularly scheduled basis unless significant weather changes have occurred. A special METAR (SPECI) can be issued at any time between routine METAR reports.
Example:METAR KGGG 161753Z AUTO 14021G26KT 3/4SM+TSRA BR BKN008 OVC012CB 18/17 A2970 RMKPRESFR
A typical METAR report contains the following information in sequential order:
1. Type of report—there are two types of METAR reports. The first is the routine METAR report that is transmitted on a regular time interval. The second is the aviation selected SPECI. This is a special report that can be given at any time to update the METAR for rapidly changing weather conditions, aircraft mishaps, or other critical information.
2. Station identifier—a four-letter code as established by the International Civil Aviation Organization (ICAO). In the 48 contiguous states, a unique three-letter identifier is preceded by the letter “K.” For example, Gregg County Airport in Longview, Texas, is identified by the letters “KGGG,” K being the country designation and GGG being the airport identifier. In other regions of the world, including Alaska and Hawaii, the first two letters of the four-letter ICAO identifier indicate the region, country, or state. Alaska identifiers always begin with the letters “PA” and Hawaii identifiers always begin with the letters “PH.” Station identifiers can be found by calling the FSS, a NWS office, or by searching various websites such as DUATS and NOAA's Aviation Weather Aviation Digital Data Services (ADDS).
3. Date and time of report—depicted in a six-digit group (161753Z). The first two digits are the date. The last four digits are the time of the METAR/SPECI, which is always given in coordinated universal time (UTC). A “Z” is appended to the end of the time to denote the time is given in Zulu time (UTC) as opposed to local time.
4. Modifier—denotes that the METAR/SPECI came from an automated source or that the report was corrected. If the notation “AUTO” is listed in the METAR/SPECI, the report came from an automated source. It also lists “AO1” (for no precipitation discriminator) or “AO2” (with precipitation discriminator) in the “Remarks” section to indicate the type of precipitation sensors employed at the automated station.
When the modifier “COR” is used, it identifies a corrected report sent out to replace an earlier report
that contained an error (for example: METAR KGGG 161753Z COR).
5. Wind—reported with five digits (14021KT) unless the speed is greater than 99 knots, in which case the wind is reported with six digits. The first three digits indicate the direction the true wind is blowing from in tens of degrees. If the wind is variable, it is reported as “VRB.” The last two digits indicate the speed of the wind in knots unless the wind is greater than 99 knots, in which case it is indicated by three digits. If the winds are gusting, the letter “G” follows the wind speed (G26KT). After the letter “G,” the peak gust recorded is provided. If the wind direction varies more than 60° and the wind speed is greater than six knots, a separate group of numbers, separated by a “V,” will indicate the extremes of the wind directions.
6. Visibility—the prevailing visibility (¾ SM) is reported in statute miles as denoted by the letters “SM.” It is reported in both miles and fractions of miles. At times, runway visual range (RVR) is reported following the prevailing visibility. RVR is the distance a pilot can see down the runway in a moving aircraft. When RVR is reported, it is shown with an R, then the runway number followed by a slant, then the visual range in feet. For example, when the RVR is reported as R17L/1400FT, it translates to a visual range of 1,400 feet on runway 17 left.
7. Weather—can be broken down into two different categories: qualifiers and weather phenomenon (+TSRA BR). First, the qualifiers of intensity, proximity, and the descriptor of the weather are given. The intensity may be light (–), moderate ( ), or heavy (+). Proximity only depicts weather phenomena that are in the airport vicinity. The notation “VC” indicates a specific weather phenomenon is in the vicinity of five to ten miles from the airport. Descriptors are used to describe certain types of precipitation and obscurations. Weather phenomena may be reported as being precipitation, obscurations, and other phenomena, such as squalls or funnel clouds.
13-7
Intensity or Proximity 1 Precipitation 3 Obscuration 4 Other 5Descriptor 2
– Light
Moderate (no qualifier)
+ Heavy
VC in the vicinity
MI Shallow
BC Patches
DR Low drifting
BL Blowing
SH Showers
TS Thunderstorms
FZ Freezing
PR Partial
DZ Drizzle
RA Rain
SN Snow
SG Snow grains
IC Ice crystals (diamond dust)
PL Ice pellets
GR Hail
GS Small hail or snow pellets
UP *Unknown precipitation
BR Mist
FG Fog
FU Smoke
DU Dust
SA Sand
HZ Haze
PY Spray
VA Volcanic ash
PO Dust/sand whirls
SQ Squalls
FC Funnel cloud
+FC Tornado or waterspout
SS Sandstorm
DS Dust storm
The weather groups are constructed by considering columns 1–5 in this table in sequence:intensity, followed by descriptor, followed by weather phenomena (e.g., heavy rain showers(s) is coded as +SHRA).* Automated stations only
Qualifier Weather Phenomena
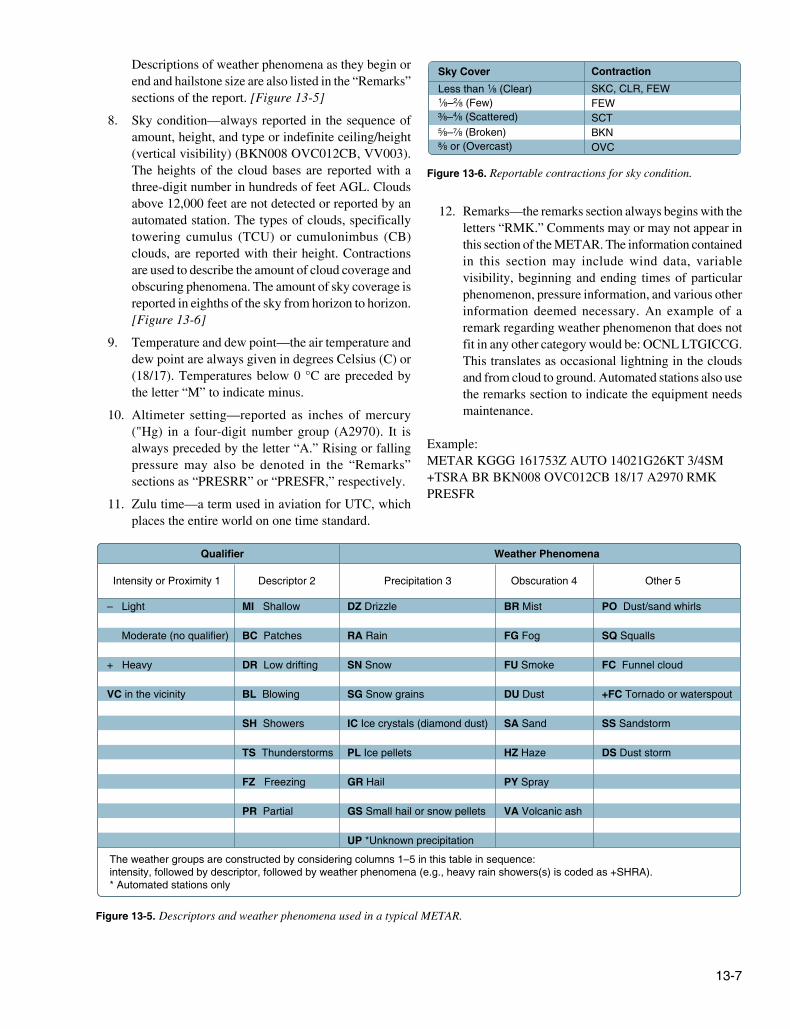
Figure 13-5. Descriptors and weather phenomena used in a typical METAR.
ContractionSKC, CLR, FEWFEWSCTBKNOVC
Sky CoverLess than 1∕8 (Clear) 1∕8–2∕8 (Few)³∕8–4∕8 (Scattered) 5∕8–7∕8 (Broken)8∕8 or (Overcast)
Figure 13-6. Reportable contractions for sky condition.
Descriptions of weather phenomena as they begin or end and hailstone size are also listed in the “Remarks” sections of the report. [Figure 13-5]
8. Sky condition—always reported in the sequence ofamount, height, and type or indefinite ceiling/height(vertical visibility) (BKN008 OVC012CB, VV003).The heights of the cloud bases are reported with athree-digit number in hundreds of feet AGL. Cloudsabove 12,000 feet are not detected or reported by anautomated station. The types of clouds, specificallytowering cumulus (TCU) or cumulonimbus (CB)clouds, are reported with their height. Contractionsare used to describe the amount of cloud coverage and obscuring phenomena. The amount of sky coverage is reported in eighths of the sky from horizon to horizon. [Figure 13-6]
9. Temperature and dew point—the air temperature anddew point are always given in degrees Celsius (C) or(18/17). Temperatures below 0 °C are preceded bythe letter “M” to indicate minus.
10. Altimeter setting—reported as inches of mercury("Hg) in a four-digit number group (A2970). It isalways preceded by the letter “A.” Rising or fallingpressure may also be denoted in the “Remarks”sections as “PRESRR” or “PRESFR,” respectively.
11. Zulu time—a term used in aviation for UTC, whichplaces the entire world on one time standard.
12. Remarks—the remarks section always begins with the letters “RMK.” Comments may or may not appear inthis section of the METAR. The information contained in this section may include wind data, variablevisibility, beginning and ending times of particularphenomenon, pressure information, and various other information deemed necessary. An example of aremark regarding weather phenomenon that does notfit in any other category would be: OCNL LTGICCG. This translates as occasional lightning in the cloudsand from cloud to ground. Automated stations also use the remarks section to indicate the equipment needsmaintenance.
Example:METAR KGGG 161753Z AUTO 14021G26KT 3/4SM+TSRA BR BKN008 OVC012CB 18/17 A2970 RMKPRESFR
13-8
123
4567
8
910
11
12
13
XXXUA/OV
/TM/FL/TP/SK
/WX
/TA/WV
/TB
/IC
/RM
3-letter station identifierRoutine PIREP, UUA-Urgent PIREP.Location
TimeAltitude/flight levelType aircraftSky cover/cloud layers
Weather
Air temperature in celsius (C)Wind
Turbulence
Icing
Remarks
Nearest weather reporting location to the reported phenomenon
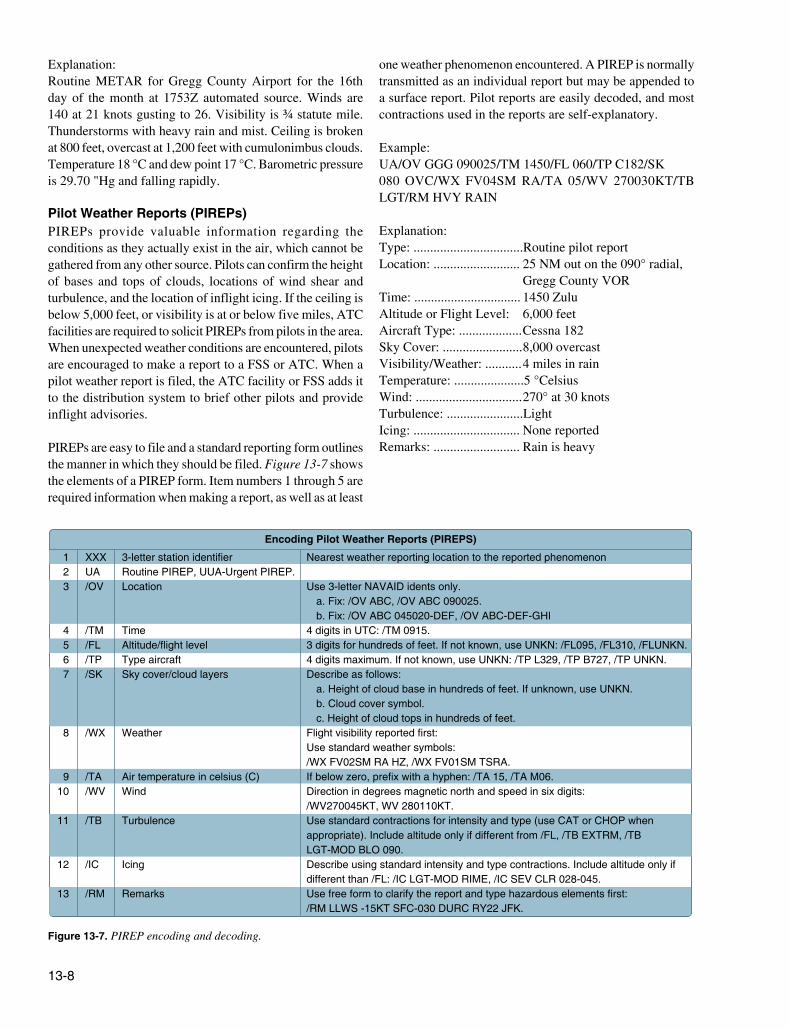
Use 3-letter NAVAID idents only. a. Fix: /OV ABC, /OV ABC 090025. b. Fix: /OV ABC 045020-DEF, /OV ABC-DEF-GHI4 digits in UTC: /TM 0915.3 digits for hundreds of feet. If not known, use UNKN: /FL095, /FL310, /FLUNKN.4 digits maximum. If not known, use UNKN: /TP L329, /TP B727, /TP UNKN.Describe as follows: a. Height of cloud base in hundreds of feet. If unknown, use UNKN. b. Cloud cover symbol. c. Height of cloud tops in hundreds of feet.Flight visibility reported first:Use standard weather symbols: /WX FV02SM RA HZ, /WX FV01SM TSRA.If below zero, prefix with a hyphen: /TA 15, /TA M06.Direction in degrees magnetic north and speed in six digits: /WV270045KT, WV 280110KT.Use standard contractions for intensity and type (use CAT or CHOP whenappropriate). Include altitude only if different from /FL, /TB EXTRM, /TB LGT-MOD BLO 090.Describe using standard intensity and type contractions. Include altitude only ifdifferent than /FL: /IC LGT-MOD RIME, /IC SEV CLR 028-045.Use free form to clarify the report and type hazardous elements first:/RM LLWS -15KT SFC-030 DURC RY22 JFK.
Encoding Pilot Weather Reports (PIREPS)
Figure 13-7. PIREP encoding and decoding.
Explanation:Routine METAR for Gregg County Airport for the 16th day of the month at 1753Z automated source. Winds are 140 at 21 knots gusting to 26. Visibility is ¾ statute mile. Thunderstorms with heavy rain and mist. Ceiling is broken at 800 feet, overcast at 1,200 feet with cumulonimbus clouds. Temperature 18 °C and dew point 17 °C. Barometric pressure is 29.70 "Hg and falling rapidly.
Pilot Weather Reports (PIREPs)PIREPs provide valuable information regarding the conditions as they actually exist in the air, which cannot be gathered from any other source. Pilots can confirm the height of bases and tops of clouds, locations of wind shear and turbulence, and the location of inflight icing. If the ceiling is below 5,000 feet, or visibility is at or below five miles, ATC facilities are required to solicit PIREPs from pilots in the area. When unexpected weather conditions are encountered, pilots are encouraged to make a report to a FSS or ATC. When a pilot weather report is filed, the ATC facility or FSS adds it to the distribution system to brief other pilots and provide inflight advisories. PIREPs are easy to file and a standard reporting form outlines the manner in which they should be filed. Figure 13-7 shows the elements of a PIREP form. Item numbers 1 through 5 are required information when making a report, as well as at least
one weather phenomenon encountered. A PIREP is normally transmitted as an individual report but may be appended to a surface report. Pilot reports are easily decoded, and most contractions used in the reports are self-explanatory.
Example:UA/OV GGG 090025/TM 1450/FL 060/TP C182/SK080 OVC/WX FV04SM RA/TA 05/WV 270030KT/TB LGT/RM HVY RAIN
Explanation:Type: .................................Routine pilot reportLocation: .......................... 25 NM out on the 090° radial, Gregg County VORTime: ................................ 1450 ZuluAltitude or Flight Level: 6,000 feetAircraft Type: ................... Cessna 182Sky Cover: ........................ 8,000 overcastVisibility/Weather: ........... 4 miles in rainTemperature: .....................5 °CelsiusWind: ................................ 270° at 30 knotsTurbulence: .......................LightIcing: ................................ None reportedRemarks: .......................... Rain is heavy
13-9
7. Forecast significant weather—weather phenomena are coded in the TAF reports in the same format as the METAR.
8. Forecast sky condition—given in the same format as the METAR. Only cumulonimbus (CB) clouds are forecast in this portion of the TAF report as opposed to CBs and towering cumulus in the METAR.
9. Forecast change group—for any significant weather change forecast to occur during the TAF time period, the expected conditions and time period are included in this group. This information may be shown as from (FM), and temporary (TEMPO). “FM” is used when a rapid and significant change, usually within an hour, is expected. “TEMPO” is used for temporary fluctuations of weather, expected to last less than 1 hour.
10. PROB30—a given percentage that describes the probability of thunderstorms and precipitation occurring in the coming hours. This forecast is not used for the first 6 hours of the 24-hour forecast.
Example:TAFKPIR 111130Z 1112/1212 TEMPO 1112/1114 5SM BRFM1500 16015G25KT P6SM SCT040 BKN250FM120000 14012KT P6SM BKN080 OVC150 PROB30 1200/1204 3SM TSRA BKN030CBFM120400 1408KT P6SM SCT040 OVC080TEMPO 1204/1208 3SM TSRA OVC030CB
Explanation:Routine TAF for Pierre, South Dakota…on the 11th day of the month, at 1130Z…valid for 24 hours from 1200Z on the 11th to 1200Z on the 12th…wind from 150° at 12 knots…visibility greater than 6 SM…broken clouds at 9,000 feet…temporarily, between 1200Z and 1400Z, visibility 5 SM in mist…from 1500Z winds from 160° at 15 knots, gusting to 25 knots visibility greater than 6 SM…clouds scattered at 4,000 feet and broken at 25,000 feet…from 0000Z wind from 140° at 12 knots…visibility greater than 6 SM…clouds broken at 8,000 feet, overcast at 15,000 feet…between 0000Z and 0400Z, there is 30 percent probability of visibility 3 SM…thunderstorm with moderate rain showers…clouds broken at 3,000 feet with cumulonimbus clouds…from 0400Z…winds from 140° at 8 knots…visibility greater than 6 miles…clouds at 4,000 scattered and overcast at 8,000…temporarily between 0400Z and 0800Z…visibility 3 miles…thunderstorms with moderate rain showers…clouds overcast at 3,000 feet with cumulonimbus clouds…end of report (=).
Aviation ForecastsObserved weather condition reports are often used in the creation of forecasts for the same area. A variety of different forecast products are produced and designed to be used in the preflight planning stage. The printed forecasts that pilots need to be familiar with are the terminal aerodrome forecast (TAF), aviation area forecast (FA), inflight weather advisories (SIGMET, AIRMET), and the winds and temperatures aloft forecast (FB).
Terminal Aerodrome Forecasts (TAF)A TAF is a report established for the five statute mile radius around an airport. TAF reports are usually given for larger airports. Each TAF is valid for a 24 or 30-hour time period and is updated four times a day at 0000Z, 0600Z, 1200Z, and 1800Z. The TAF utilizes the same descriptors and abbreviations as used in the METAR report. The TAF includes the following information in sequential order:
1. Type of report—a TAF can be either a routine forecast (TAF) or an amended forecast (TAF AMD).
2. ICAO station identifier—the station identifier is the same as that used in a METAR.
3. Date and time of origin—time and date (081125Z) of TAF origination is given in the six-number code with the first two being the date, the last four being the time. Time is always given in UTC as denoted by the Z following the time block.
4. Valid period dates and times—The TAF valid period (0812/0912) follows the date/time of forecast origin group. Scheduled 24 and 30 hour TAFs are issued four times per day, at 0000, 0600, 1200, and 1800Z. The first two digits (08) are the day of the month for the start of the TAF. The next two digits (12) are the starting hour (UTC). 09 is the day of the month for the end of the TAF, and the last two digits (12) are the ending hour (UTC) of the valid period. A forecast period that begins at midnight UTC is annotated as 00. If the end time of a valid period is at midnight UTC, it is annotated as 24. For example, a 00Z TAF issued on the 9th of the month and valid for 24 hours would have a valid period of 0900/0924.
5. Forecast wind—the wind direction and speed forecast are coded in a five-digit number group. An example would be 15011KT. The first three digits indicate the direction of the wind in reference to true north. The last two digits state the windspeed in knots appended with “KT.” Like the METAR, winds greater than 99 knots are given in three digits.
6. Forecast visibility—given in statute miles and may be in whole numbers or fractions. If the forecast is greater than six miles, it is coded as “P6SM.”
13-10
and implies there may be occurrences of severe or greater turbulence, severe icing, low-level wind shear, and IFR conditions. The final line of the precautionary statement alerts the user that heights, for the most part, are MSL. Those that are not MSL will state AGL or CIG.
3. Synopsis—gives a brief summary identifying the location and movement of pressure systems, fronts, and circulation patterns.
Example:SYNOPSIS…LOW PRES TROF 10Z OK/TX PNHDL AREA FCST MOV EWD INTO CNTRL-SWRN OK BY 04Z. WRMFNT 10Z CNTRL OK-SRN AR-NRN MS FCST LIFT NWD INTO NERN OK-NRN AR EXTRM NRN MS BY 04Z.
Explanation:As of 1000Z, there is a low pressure trough over the Oklahoma and Texas panhandle area, which is forecast to move eastward into central to southwestern Oklahoma by 0400Z. A warm front located over central Oklahoma, southern Arkansas, and northern Mississippi at 1000Z is forecast to lift northwestward into northeastern Oklahoma, northern Arkansas, and extreme northern Mississippi by 0400Z.
4. VFR Clouds and Weather—This section lists expected sky conditions, visibility, and weather for the next 12 hours and an outlook for the following 6 hours.
Example:S CNTRL AND SERN TXAGL SCT-BKN010. TOPS 030. VIS 3-5SM BR. 14-16Z BECMG AGL SCT030. 19Z AGL SCT050.OTLK…VFROKPNDLAND NW…AGL SCT030 SCT-BKN100.TOPS FL200.15Z AGL SCT040 SCT100. AFT 20Z SCT TSRA DVLPG..FEW POSS SEV. CB TOPS FL450.OTLK…VFR
Explanation:In south central and southeastern Texas, there is a scattered to broken layer of clouds from 1,000 feet AGL with tops at 3,000 feet, visibility is 3 to 5 SM in mist. Between 1400Z and 1600Z, the cloud bases are expected to increase to 3,000 feet AGL. After 1900Z, the cloud bases are expected to continue to increase to 5,000 feet AGL and the outlook is VFR.
In northwestern Oklahoma and panhandle, the clouds are scattered at 3,000 feet with another scattered to broken layer at 10,000 feet AGL, with the tops at 20,000 feet. At 1500 Z, the lowest cloud base is expected to increase to 4,000 feet AGL with a scattered layer at 10,000 feet AGL. After
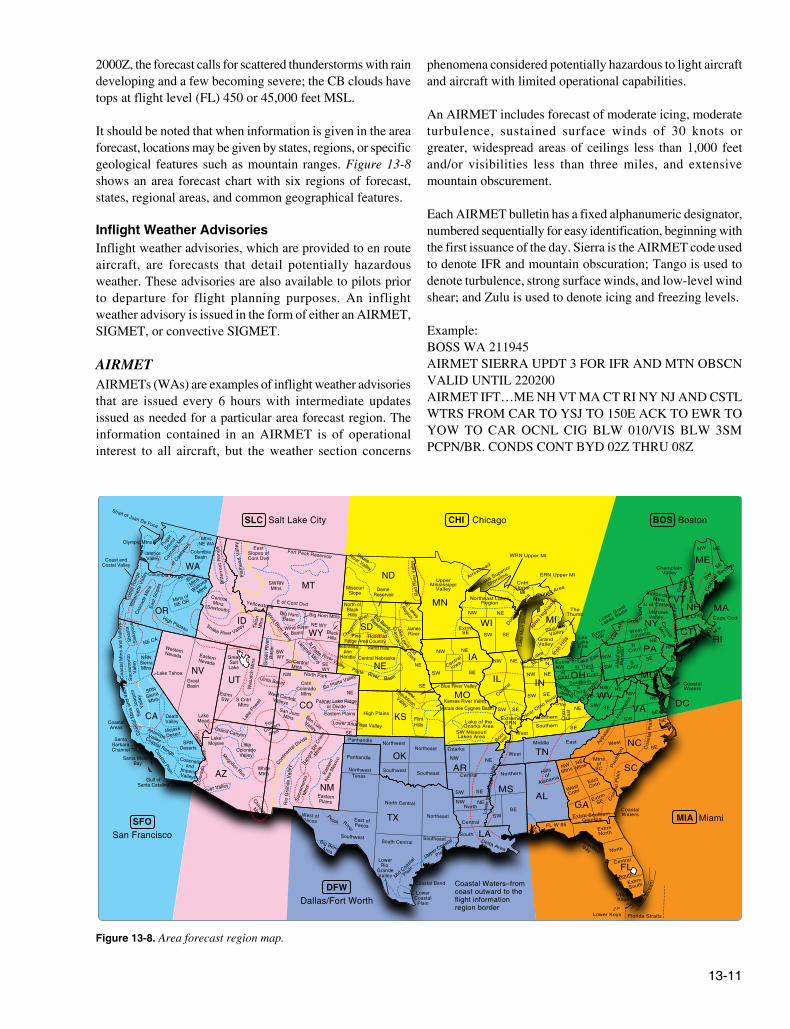
Area Forecasts (FA)The FA gives a picture of clouds, general weather conditions, and visual meteorological conditions (VMC) expected over a large area encompassing several states. There are six areas for which area forecasts are published in the contiguous 48 states. Area forecasts are issued three times a day and are valid for 18 hours. This type of forecast gives information vital to en route operations, as well as forecast information for smaller airports that do not have terminal forecasts.
Area forecasts are typically disseminated in four sections and include the following information:
1. Header—gives the location identifier of the source of the FA, the date and time of issuance, the valid forecast time, and the area of coverage.
Example:DFWC FA 120945SYNOPSIS AND VFR CLDS/WXSYNOPSIS VALID UNTIL 130400CLDS/WX VALID UNTIL 122200…OTLK VALID122200-130400OK TX AR LA MS AL AND CSTL WTRS
Explanation:The area forecast shows information given by Dallas Fort Worth, for the region of Oklahoma, Texas, Arkansas, Louisiana, Mississippi, and Alabama, as well as a portion of the Gulf coastal waters. It was issued on the 12th day of the month at 0945. The synopsis is valid from the time of issuance until 0400 hours on the 13th. VFR clouds and weather information on this area forecast are valid until 2200 hours on the 12th and the outlook is valid from 2200Z on the 12th to 0400Z on the 13th.
2. Precautionary statements—IFR conditions, mountain obscurations, and thunderstorm hazards are described in this section. Statements made here regarding height are given in MSL, and if given otherwise, AGL or ceiling (CIG) is noted.
Example:SEE AIRMET SIERRA FOR IFR CONDS AND MTN OBSCN.TS IMPLY SEV OR GTR TURB SEV ICE LLWS AND IFR CONDS.NON MSL HGTS DENOTED BYAGL OR CIG.
Explanation:The area forecast covers VFR clouds and weather, so the precautionary statement warns that AIRMET Sierra should be referenced for IFR conditions and mountain obscuration. The code TS indicates the possibility of thunderstorms
13-11
SouthDelta Area
NW NENorth
Central
SW SE
NW NE
Ozarks
Boot
Heel
SW MissouriLakes Area
Lake of theOzarks Area
ExtremeSRN
IL
SW SE
Central
NW NE
NW NE
SW SECentra
l
Iowa
SW SEExtrm
SE
NW NE
Northeast LakesRegion
UpperMississippi
Valley
Arrowhead
Lake Superior
Shoreline
WRN Upper MI
CntrlUpper
MI
ERN Upper MI
Doo
r Pen
insu
la Mackinac Area
NR
N H
ighl
ands
TheThumb
Saginaw
Valley
GrandValley
Irish
Hills
Near Lake
Mi ExtrmN
NW NE
SW SE
Near Ohio R
iver
SW
SEWest
NCntrl
Northern
Southern
Cn
trl
Ea
st
NE
West
Middle East Appa
lach
ian
Mou
ntai
ns
SE
NENWAlong Ohi
o R
ive
r
ExtrmNW
SWRNSouthern
WCntrl
ECntrl
N Third
SThird
Near Lake Erie
LeeLakeErie
Lower Great
Lakes Basin
ExtrmNW
Alle
gh
en
yP
late
au
NW
SWS
Cntrl
NE
SE
NCntrl
Lee
Lake
Ontario
NRN
SRNNE
Eastern
Shore CoastalWaters
NENW
SWSE
Coa
sta
l Pla
in
NE
SE
Pie
dmon
t
West
Mtnsof
SC
Coa
stal
Pla
in NW
MtnsHills
of
Alabama
West
Cntrl
East
Cntrl
ExtrmSE
Extrm SouthernGeorgia
Mobile
Area
FL W 85ExtrmNorth
North
Central
ApalacheeBay
South
ExtrmSouth
UpperKeys
Lower Keys
Gul
f S
trea
m
Florida Straits
CoastalWaters
Catskill
Mtns
E Cntrl Cape Cod
Coasta
l Plains
Hu
dso
n V
alle
y
MohawkValley
West of
Catskills
AdirondackMtns
ChamplainValley
Gre
enM
tns
N of Catskills Wh
ite M
tns
NW NE
Coa
stal
Section SE
SW
MN
IA
MI
IL INMO
AR
LA
MSAL
TN
GA
FL
SC
NC
VA
MD
DC
NJ
OH
WI
WV
PA
NY
ME
VTNH MA
RICT
Coastal Waters–from coast outward to the flight information region border
SWSE
Northern
NEMtns
Central
Strait of Juan De Fuca
Olympic Mtns
Sac
ram
ento
Val
ley
Northwest
North Central
South Central
LowerRio
GrandeValley
LowerCoastal
Plain
Mid Coasta
l
Plain
Upper Coastal
Plain
Northwest
Texas
Puget
Sound
Casca
de M
tns
Cas
cade
Mtn
s
of C
asca
des
MtnsNE WA
ColumbiaBasin
InteriorValley
Columbia GorgeBlue
Mtns
Wallowa
Mtns
Mtns of
NE ORCos
tal R
ange
Will
amet
te V
alle
y
Coast andCostal Valley
High Plateau
Eas
t Slo
pes
WA
OR
Sha
sta
Sis
kiyo
us
NE CA
NRNSierraMtns
Coa
stal
Mtn
s an
d V
alle
ys
San
Joa
quin
Val
ley
SRNSierraMtns
Coa
stal
Mtn
s an
d V
alle
ys
WesternNevada EasternNevada
CoastalAreas
DeathValley
Lake Tahoe
LakeMead
LakeMojave
MojaveDesert
AntelopeValleyCoastal Range
SRNDeserts
SantaBarbaraChannel
Santa MonicaBay
Coastal Plain
Gulf ofSanta Catalina
Coacnellaand
ImperialValleys
GreatBasin
Col
orad
oR
iver
Valle
y
Gilariver Valley
Mogollon Rim
Chiricahua
Mtns
WhiteMtns
LittleColorado
Valley
Grand Canyon
Four
Corners
Area
ExtrmSW
Uinta Basin
S CntrlMtns
GreatSaltLake
Was
atch
Mtn
s
West CentralValleysSan JuanMtns
NW
CntrlColorado
MtnsSo Platte Valley
NE
Palmer Lake Ridgeor Divide
Eastern Plains
Lower Arkansas ValleySE
San LuisValley
North Park
Rio
Gra
nde
Val
leyCon
tinen
tal Divide
Sac
rem
ento
Mtn
sSa
ngre
De
Cris
toM
tns
East
ern
New
Mex
ico
EasternPlains
Gre
en R
iver
Bas
in
So CentralMtns
SW WY
Laramie Mtns
N Platte River Valley SEWY
BlackHills
NE WY
Big Horn MtnsBig Horn
Basin
Wind River M
tns
Tet
onM
tns
Snake River Valley
CentralMtns(Sawtooth)
YellowstonePark
Bitt
erro
ot R
ange
Fla
thea
d V
alle
y
EastSlopes ofCont Dvd
SWRNMtns
Fort Peck Reservoir
Wind RiverBasin
E of Cont Dvd
Pecos River
West ofPecos
Big BendArea
East ofPecos
Southwest
Panhandle
Northeast
Southeast
Coastal Bend
Southwest Southeast
Panhandle
Northeast
High PlainsFlintHills
Marais des Cygnes BasinKansas River Valley
Blue River ValleyLowerRepublicanValley
Cheyen
ne
River
JamesRiver
NE Lakes
Region
RosebudCountry
PineRidge Area
Big Bend
Reservoir
North ofBlackHills
Lake Lewis and
Francis Case Clark
Dame Reservoir
MissouriSlope
SourisRiver Valley
Sand Hills
Central Nebraska
Nebraskapan
Handle
Platte River Basin
SE
NE
CA
NV
ID
MTND
SD
NE
KS
OK
TX
WY
UT
CO
AZNM
Lake
Pow
ell
Red
Riv
er V
alle
y
Low
er M
issi
ssip
pi V
alle
y
CHI Chicago BOS Boston
MIA MiamiSFOSan Francisco
SLC Salt Lake City
DFWDallas/Fort Worth
Lake
Mic
h S
hore
line
Figure 13-8. Area forecast region map.
2000Z, the forecast calls for scattered thunderstorms with rain developing and a few becoming severe; the CB clouds have tops at flight level (FL) 450 or 45,000 feet MSL.
It should be noted that when information is given in the area forecast, locations may be given by states, regions, or specific geological features such as mountain ranges. Figure 13-8 shows an area forecast chart with six regions of forecast, states, regional areas, and common geographical features. Inflight Weather AdvisoriesInflight weather advisories, which are provided to en route aircraft, are forecasts that detail potentially hazardous weather. These advisories are also available to pilots prior to departure for flight planning purposes. An inflight weather advisory is issued in the form of either an AIRMET, SIGMET, or convective SIGMET.
AIRMETAIRMETs (WAs) are examples of inflight weather advisories that are issued every 6 hours with intermediate updates issued as needed for a particular area forecast region. The information contained in an AIRMET is of operational interest to all aircraft, but the weather section concerns
phenomena considered potentially hazardous to light aircraft and aircraft with limited operational capabilities.
An AIRMET includes forecast of moderate icing, moderate turbulence, sustained surface winds of 30 knots or greater, widespread areas of ceilings less than 1,000 feet and/or visibilities less than three miles, and extensive mountain obscurement.
Each AIRMET bulletin has a fixed alphanumeric designator, numbered sequentially for easy identification, beginning with the first issuance of the day. Sierra is the AIRMET code used to denote IFR and mountain obscuration; Tango is used to denote turbulence, strong surface winds, and low-level wind shear; and Zulu is used to denote icing and freezing levels.
Example:BOSS WA 211945AIRMET SIERRA UPDT 3 FOR IFR AND MTN OBSCN VALID UNTIL 220200AIRMET IFT…ME NH VT MA CT RI NY NJ AND CSTL WTRS FROM CAR TO YSJ TO 150E ACK TO EWR TO YOW TO CAR OCNL CIG BLW 010/VIS BLW 3SM PCPN/BR. CONDS CONT BYD 02Z THRU 08Z
13-12
AIRMET MTN OBSCN…ME NH VT MA NY PAFROM CAR TO MLT TO CON TO SLT TO SYR TO CARMTNS OCNLY OBSCD BY CLDS/PCPN/BR. CONDS CONT BYD 02Z THRU 08Z
Explanation:AIRMET SIERRA was issued for the Boston area at 1945Z on the 21st day of the month. SIERRA contains information on IFR and/or mountain obscurations. This is the third updated issuance of this Boston AIRMET series as indicated by “SIERRA UPDT 3” and is valid until 0200Z on the 22nd. The affected states within the BOS area are: Maine, New Hampshire, Vermont, Massachusetts, New York, and Pennsylvania. Within an area bounded by: Caribou, ME; to Saint Johns, New Brunswick; to 150 nautical miles east of Nantucket, MA; to Newark, NJ; to Ottawa, Ontario; to Caribou, ME. The effected states within Caribou, ME to Millinocket, ME to Concord, NH to Slate Run, PA to Syracuse, NY to Caribou, ME will experience ceilings below 1,000 feet/visibility below 3 SM, precipitation/mist. Conditions will continue beyond 0200Z through 0800Z.
SIGMETSIGMETs (WSs) are inflight advisories concerning non-convective weather that is potentially hazardous to all aircraft. They report weather forecasts that include severe icing not associated with thunderstorms, severe or extreme turbulence or clear air turbulence (CAT) not associated with thunderstorms, dust storms or sandstorms that lower surface or inflight visibilities to below three miles, and volcanic ash. SIGMETs are unscheduled forecasts that are valid for 4 hours unless the SIGMET relates to a hurricane, in which case it is valid for 6 hours.
A SIGMET is issued under an alphabetic identifier, from November through Yankee. The first issuance of a SIGMET is designated as an Urgent Weather SIGMET (UWS). Reissued SIGMETs for the same weather phenomenon are sequentially numbered until the weather phenomenon ends.
Example:SFOR WS 100130SIGMET ROME02 VALID UNTIL 100530OR WAFROM SEA TO PDT TO EUG TO SEAOCNL SEV CAT BTN FL280 AND FL350 EXPCDDUE TO JTSTR. CONDS BGNG AFT 0200Z CONTG BYD 0530Z .
Explanation:This is SIGMET Romeo 2, the second issuance for this weather phenomenon. It is valid until the 10th day of the month at 0530Z time. This SIGMET is for Oregon and
Washington, for a defined area from Seattle to Portland to Eugene to Seattle. It calls for occasional severe clear air turbulence between FL280 and FL350 due to the location of the jet stream. These conditions will begin after 0200Z and continue beyond the forecast scope of this SIGMET of 0530Z.
Convective Significant Meteorological Information (WST)A Convective SIGMET (WST) is an inflight weather advisory issued for hazardous convective weather that affects the safety of every flight. Convective SIGMETs are issued for severe thunderstorms with surface winds greater than 50 knots, hail at the surface greater than or equal to ¾ inch in diameter, or tornadoes. They are also issued to advise pilots of embedded thunderstorms, lines of thunderstorms, or thunderstorms with heavy or greater precipitation that affect 40 percent or more of a 3,000 square mile or greater region.
Convective SIGMETs are issued for each area of the contiguous 48 states but not Alaska or Hawaii. Convective SIGMETs are issued for the eastern (E), western (W), and central (C) United States. Each report is issued at 55 minutes past the hour, but special Convective SIGMETs can be issued during the interim for any reason. Each forecast is valid for 2 hours. They are numbered sequentially each day from 1–99, beginning at 00Z time. If no hazardous weather exists, the convective SIGMET is still issued; however, it states “CONVECTIVE SIGMET…NONE.”
Example:MKCC WST 221855CONVECTIVE SIGMET 20CVALID UNTIL 2055ZND SDFROM 90W MOT-GFK-ABR-90W MOTINTSFYG AREA SEV TS MOVG FROM 24045KT. TOPSABV FL450. WIND GUSTS TO 60KTS RPRTD.TORNADOES…HAIL TO 2 IN… WIND GUSTS TO 65KTSPOSS ND PTN
Explanation:Convective SIGMET was issued for the central portion of the United States on the 22nd at 1855Z. This is the 20th Convective SIGMET issued on the 22nd for the central United States as indicated by “20C” and is valid until 2055Z. The affected states are North and South Dakota, from 90 nautical miles west of Minot, ND; to Grand Forks, ND; to Aberdeen, SD; to 90 nautical miles west of Minot, ND. An intensifying area of severe thunderstorms moving from 240 degrees at 45 knots (to the northeast). Thunderstorm tops will be above FL 450. Wind gusts up to 60 knots were reported.
13-13
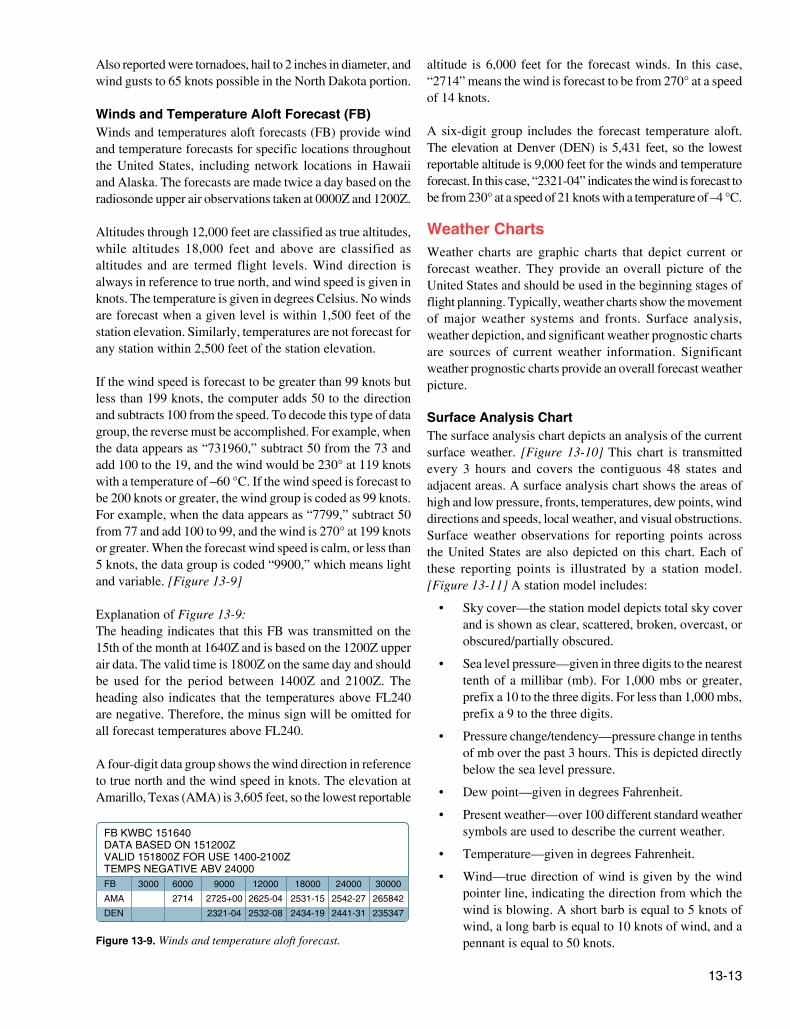
FB KWBC 151640DATA BASED ON 151200ZVALID 151800Z FOR USE 1400-2100ZTEMPS NEGATIVE ABV 24000 FB 3000 6000 9000 12000 18000 24000 30000
AMA 2714 2725+00 2625-04 2531-15 2542-27 265842
DEN 2321-04 2532-08 2434-19 2441-31 235347
Figure 13-9. Winds and temperature aloft forecast.
Also reported were tornadoes, hail to 2 inches in diameter, and wind gusts to 65 knots possible in the North Dakota portion.
Winds and Temperature Aloft Forecast (FB)Winds and temperatures aloft forecasts (FB) provide wind and temperature forecasts for specific locations throughout the United States, including network locations in Hawaii and Alaska. The forecasts are made twice a day based on the radiosonde upper air observations taken at 0000Z and 1200Z.
Altitudes through 12,000 feet are classified as true altitudes, while altitudes 18,000 feet and above are classified as altitudes and are termed flight levels. Wind direction is always in reference to true north, and wind speed is given in knots. The temperature is given in degrees Celsius. No winds are forecast when a given level is within 1,500 feet of the station elevation. Similarly, temperatures are not forecast for any station within 2,500 feet of the station elevation.
If the wind speed is forecast to be greater than 99 knots but less than 199 knots, the computer adds 50 to the direction and subtracts 100 from the speed. To decode this type of data group, the reverse must be accomplished. For example, when the data appears as “731960,” subtract 50 from the 73 and add 100 to the 19, and the wind would be 230° at 119 knots with a temperature of –60 °C. If the wind speed is forecast to be 200 knots or greater, the wind group is coded as 99 knots. For example, when the data appears as “7799,” subtract 50 from 77 and add 100 to 99, and the wind is 270° at 199 knots or greater. When the forecast wind speed is calm, or less than 5 knots, the data group is coded “9900,” which means light and variable. [Figure 13-9]
Explanation of Figure 13-9:The heading indicates that this FB was transmitted on the 15th of the month at 1640Z and is based on the 1200Z upper air data. The valid time is 1800Z on the same day and should be used for the period between 1400Z and 2100Z. The heading also indicates that the temperatures above FL240 are negative. Therefore, the minus sign will be omitted for all forecast temperatures above FL240.
A four-digit data group shows the wind direction in reference to true north and the wind speed in knots. The elevation at Amarillo, Texas (AMA) is 3,605 feet, so the lowest reportable
altitude is 6,000 feet for the forecast winds. In this case, “2714” means the wind is forecast to be from 270° at a speed of 14 knots.
A six-digit group includes the forecast temperature aloft. The elevation at Denver (DEN) is 5,431 feet, so the lowest reportable altitude is 9,000 feet for the winds and temperature forecast. In this case, “2321-04” indicates the wind is forecast to be from 230° at a speed of 21 knots with a temperature of –4 °C.
Weather ChartsWeather charts are graphic charts that depict current or forecast weather. They provide an overall picture of the United States and should be used in the beginning stages of flight planning. Typically, weather charts show the movement of major weather systems and fronts. Surface analysis, weather depiction, and significant weather prognostic charts are sources of current weather information. Significant weather prognostic charts provide an overall forecast weather picture.
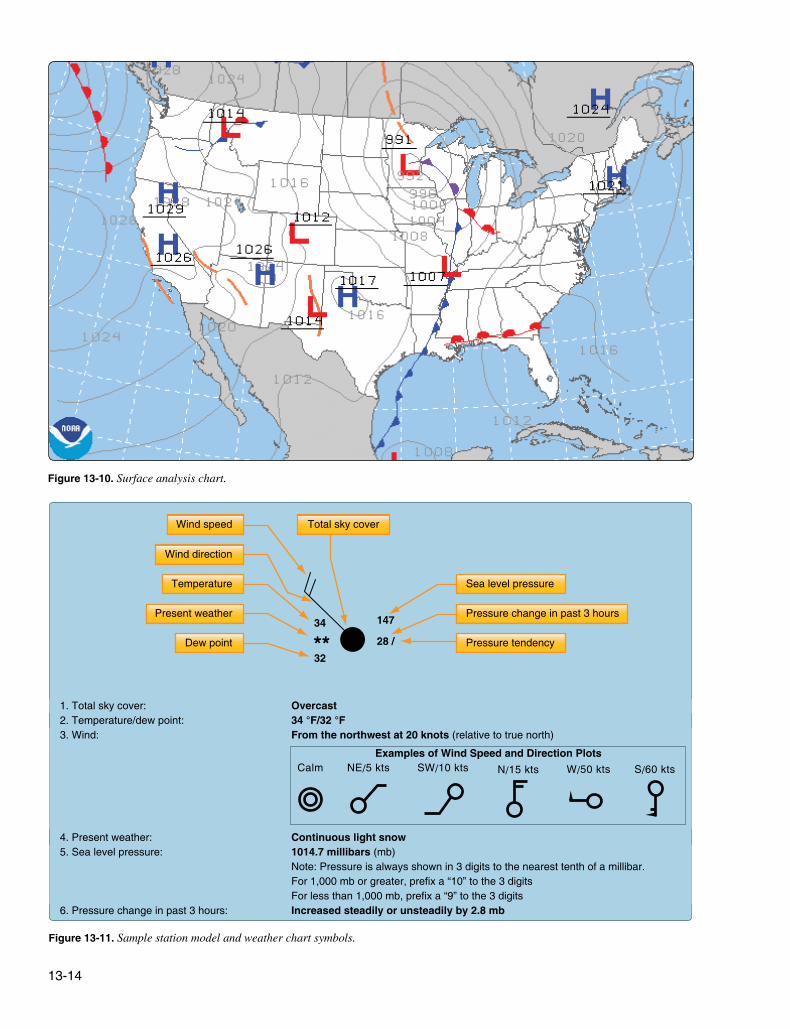
Surface Analysis ChartThe surface analysis chart depicts an analysis of the current surface weather. [Figure 13-10] This chart is transmitted every 3 hours and covers the contiguous 48 states and adjacent areas. A surface analysis chart shows the areas of high and low pressure, fronts, temperatures, dew points, wind directions and speeds, local weather, and visual obstructions.Surface weather observations for reporting points across the United States are also depicted on this chart. Each of these reporting points is illustrated by a station model. [Figure 13-11] A station model includes:
• Sky cover—the station model depicts total sky cover and is shown as clear, scattered, broken, overcast, or obscured/partially obscured.
• Sea level pressure—given in three digits to the nearest tenth of a millibar (mb). For 1,000 mbs or greater, prefix a 10 to the three digits. For less than 1,000 mbs, prefix a 9 to the three digits.
• Pressure change/tendency—pressure change in tenths of mb over the past 3 hours. This is depicted directly below the sea level pressure.
• Dew point—given in degrees Fahrenheit.
• Present weather—over 100 different standard weather symbols are used to describe the current weather.
• Temperature—given in degrees Fahrenheit.
• Wind—true direction of wind is given by the wind pointer line, indicating the direction from which the wind is blowing. A short barb is equal to 5 knots of wind, a long barb is equal to 10 knots of wind, and a pennant is equal to 50 knots.
13-14
Figure 13-10. Surface analysis chart.
1. Total sky cover: Overcast2. Temperature/dew point: 34 °F/32 °F3. Wind: From the northwest at 20 knots (relative to true north)
4. Present weather: Continuous light snow5. Sea level pressure: 1014.7 millibars (mb) Note: Pressure is always shown in 3 digits to the nearest tenth of a millibar. For 1,000 mb or greater, prefix a “10” to the 3 digits For less than 1,000 mb, prefix a “9” to the 3 digits 6. Pressure change in past 3 hours: Increased steadily or unsteadily by 2.8 mb
Examples of Wind Speed and Direction PlotsNE/5 kts SW/10 kts N/15 kts W/50 kts S/60 ktsCalm
147
28 /
34
32**
Pressure change in past 3 hours
Pressure tendency
Sea level pressure
Wind speed
Wind direction
Temperature
Total sky cover
Present weather
Dew point
Figure 13-11. Sample station model and weather chart symbols.
13-15
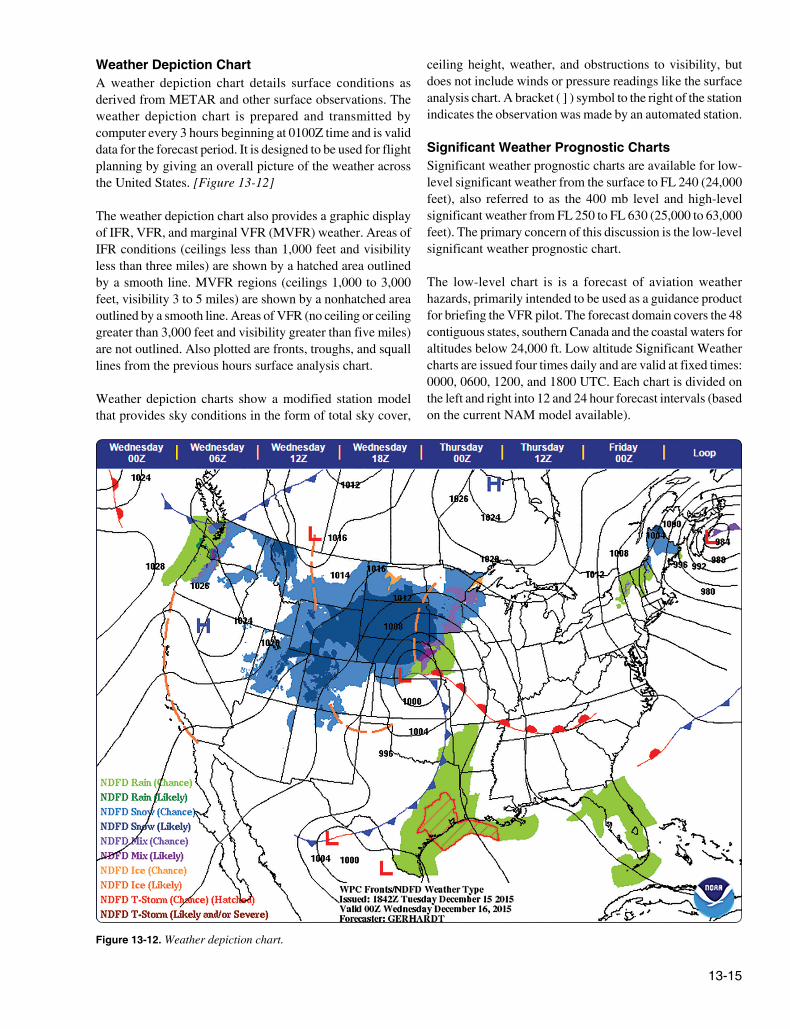
Figure 13-12. Weather depiction chart.
Weather Depiction ChartA weather depiction chart details surface conditions as derived from METAR and other surface observations. The weather depiction chart is prepared and transmitted by computer every 3 hours beginning at 0100Z time and is valid data for the forecast period. It is designed to be used for flight planning by giving an overall picture of the weather across the United States. [Figure 13-12]
The weather depiction chart also provides a graphic display of IFR, VFR, and marginal VFR (MVFR) weather. Areas of IFR conditions (ceilings less than 1,000 feet and visibility less than three miles) are shown by a hatched area outlined by a smooth line. MVFR regions (ceilings 1,000 to 3,000 feet, visibility 3 to 5 miles) are shown by a nonhatched area outlined by a smooth line. Areas of VFR (no ceiling or ceiling greater than 3,000 feet and visibility greater than five miles) are not outlined. Also plotted are fronts, troughs, and squall lines from the previous hours surface analysis chart.
Weather depiction charts show a modified station model that provides sky conditions in the form of total sky cover,
ceiling height, weather, and obstructions to visibility, but does not include winds or pressure readings like the surface analysis chart. A bracket ( ] ) symbol to the right of the station indicates the observation was made by an automated station.
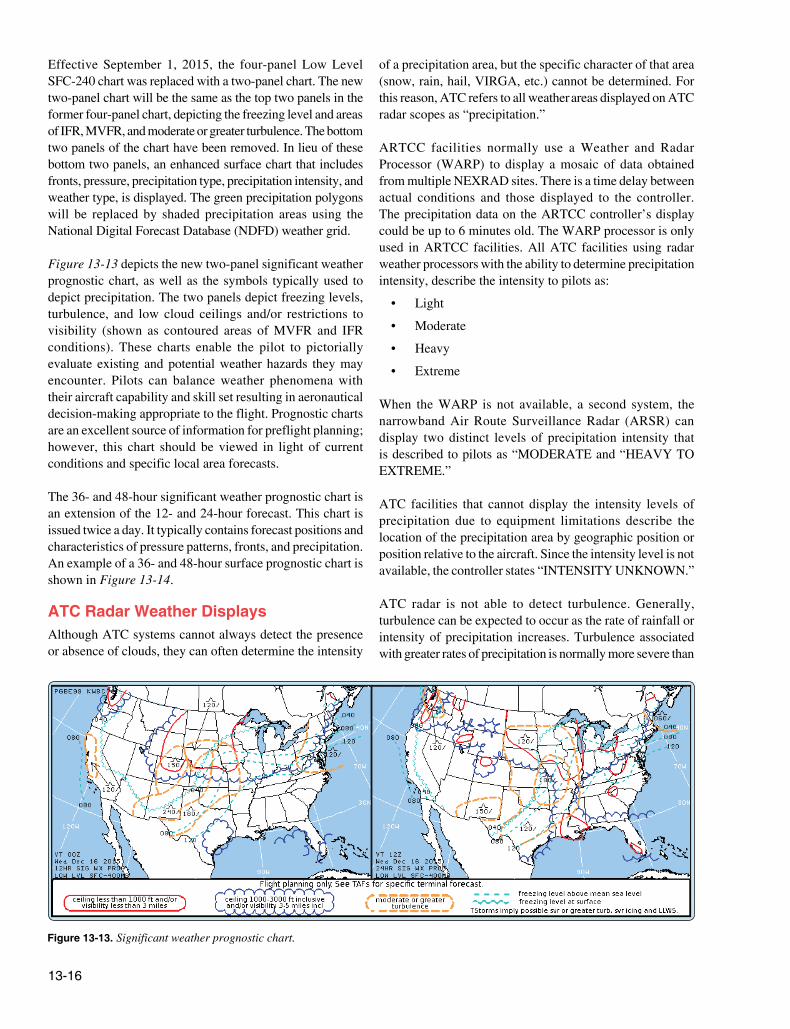
Significant Weather Prognostic ChartsSignificant weather prognostic charts are available for low-level significant weather from the surface to FL 240 (24,000 feet), also referred to as the 400 mb level and high-level significant weather from FL 250 to FL 630 (25,000 to 63,000 feet). The primary concern of this discussion is the low-level significant weather prognostic chart.
The low-level chart is is a forecast of aviation weather hazards, primarily intended to be used as a guidance product for briefing the VFR pilot. The forecast domain covers the 48 contiguous states, southern Canada and the coastal waters for altitudes below 24,000 ft. Low altitude Significant Weather charts are issued four times daily and are valid at fixed times: 0000, 0600, 1200, and 1800 UTC. Each chart is divided on the left and right into 12 and 24 hour forecast intervals (based on the current NAM model available).
13-16
Figure 13-13. Significant weather prognostic chart.
Effective September 1, 2015, the four-panel Low Level SFC-240 chart was replaced with a two-panel chart. The new two-panel chart will be the same as the top two panels in the former four-panel chart, depicting the freezing level and areas of IFR, MVFR, and moderate or greater turbulence. The bottom two panels of the chart have been removed. In lieu of these bottom two panels, an enhanced surface chart that includes fronts, pressure, precipitation type, precipitation intensity, and weather type, is displayed. The green precipitation polygons will be replaced by shaded precipitation areas using the National Digital Forecast Database (NDFD) weather grid.
Figure 13-13 depicts the new two-panel significant weather prognostic chart, as well as the symbols typically used to depict precipitation. The two panels depict freezing levels, turbulence, and low cloud ceilings and/or restrictions to visibility (shown as contoured areas of MVFR and IFR conditions). These charts enable the pilot to pictorially evaluate existing and potential weather hazards they may encounter. Pilots can balance weather phenomena with their aircraft capability and skill set resulting in aeronautical decision-making appropriate to the flight. Prognostic charts are an excellent source of information for preflight planning; however, this chart should be viewed in light of current conditions and specific local area forecasts.
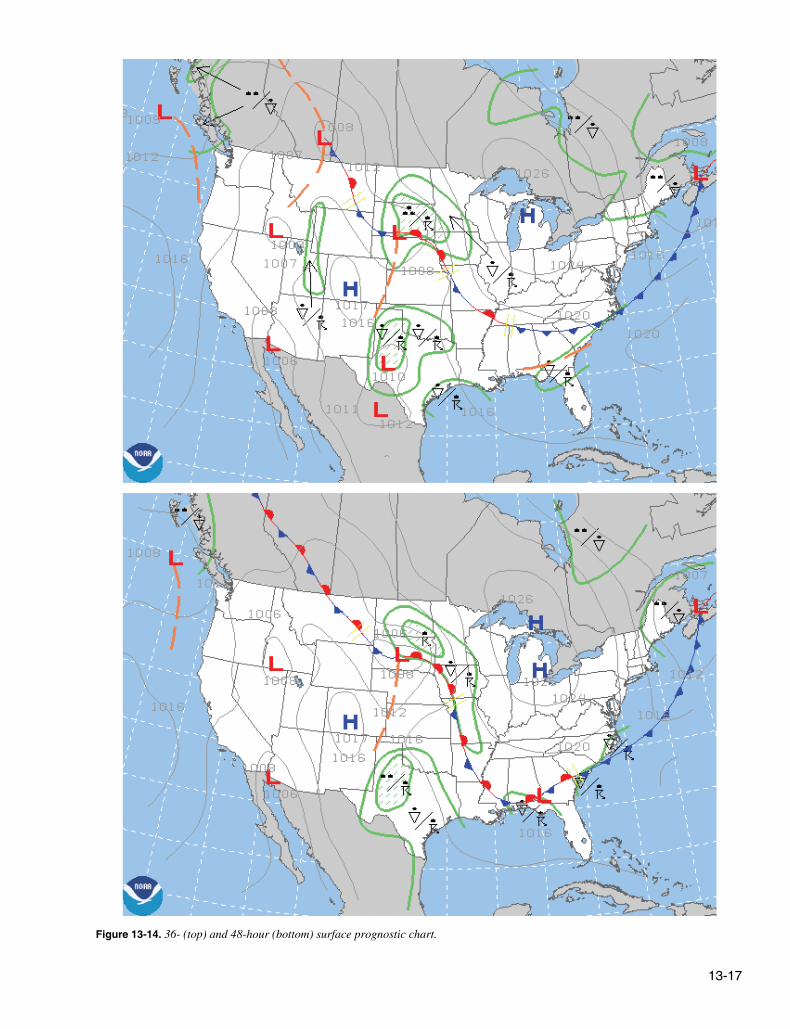
The 36- and 48-hour significant weather prognostic chart is an extension of the 12- and 24-hour forecast. This chart is issued twice a day. It typically contains forecast positions and characteristics of pressure patterns, fronts, and precipitation. An example of a 36- and 48-hour surface prognostic chart is shown in Figure 13-14.
ATC Radar Weather Displays Although ATC systems cannot always detect the presence or absence of clouds, they can often determine the intensity
of a precipitation area, but the specific character of that area (snow, rain, hail, VIRGA, etc.) cannot be determined. For this reason, ATC refers to all weather areas displayed on ATC radar scopes as “precipitation.”
ARTCC facilities normally use a Weather and Radar Processor (WARP) to display a mosaic of data obtained from multiple NEXRAD sites. There is a time delay between actual conditions and those displayed to the controller. The precipitation data on the ARTCC controller’s display could be up to 6 minutes old. The WARP processor is only used in ARTCC facilities. All ATC facilities using radar weather processors with the ability to determine precipitation intensity, describe the intensity to pilots as:
• Light
• Moderate
• Heavy
• Extreme
When the WARP is not available, a second system, the narrowband Air Route Surveillance Radar (ARSR) can display two distinct levels of precipitation intensity that is described to pilots as “MODERATE and “HEAVY TO EXTREME.”
ATC facilities that cannot display the intensity levels of precipitation due to equipment limitations describe the location of the precipitation area by geographic position or position relative to the aircraft. Since the intensity level is not available, the controller states “INTENSITY UNKNOWN.”
ATC radar is not able to detect turbulence. Generally, turbulence can be expected to occur as the rate of rainfall or intensity of precipitation increases. Turbulence associated with greater rates of precipitation is normally more severe than
13-17
Figure 13-14. 36- (top) and 48-hour (bottom) surface prognostic chart.
13-18
any associated with lesser rates of precipitation. Turbulence should be expected to occur near convective activity, even in clear air. Thunderstorms are a form of convective activity that imply severe or greater turbulence. Operation within 20 miles of thunderstorms should be approached with great caution, as the severity of turbulence can be much greater than the precipitation intensity might indicate.
Weather Avoidance AssistanceTo the extent possible, controllers will issue pertinent information on weather and assist pilots in avoiding such areas when requested. Pilots should respond to a weather advisory by either acknowledging the advisory or by acknowledging the advisory and requesting an alternative course of action as follows:
• Request to deviate off course by stating the number of miles and the direction of the requested deviation.
• Request a new route to avoid the affected area.
• Request a change of altitude.
• Request radar vectors around the affected areas.
The controller’s primary function is to provide safe separation between aircraft. Any additional service, such as weather avoidance assistance, can only be provided to the extent that it does not detract from the primary function. It’s also worth noting that the separation workload is generally greater than normal when weather disrupts the usual flow of traffic. ATC radar limitations and frequency congestion may also be a factor in limiting the controller’s capability to provide additional service.
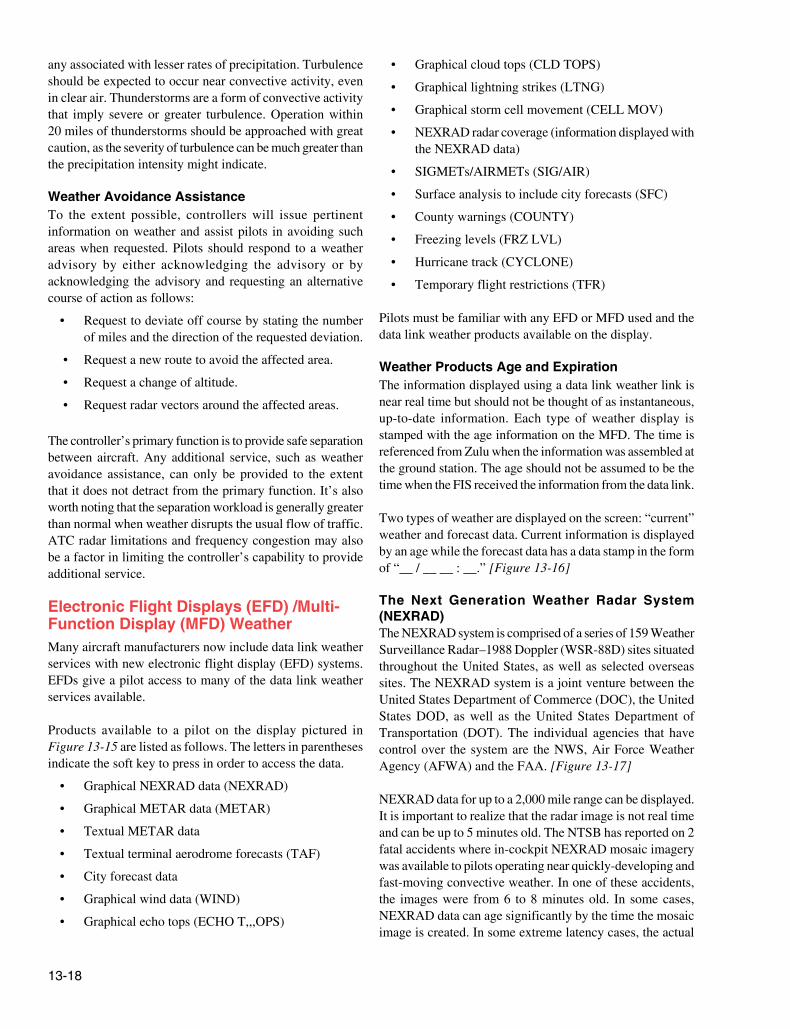
Electronic Flight Displays (EFD) /Multi-Function Display (MFD) Weather Many aircraft manufacturers now include data link weather services with new electronic flight display (EFD) systems. EFDs give a pilot access to many of the data link weather services available.
Products available to a pilot on the display pictured in Figure 13-15 are listed as follows. The letters in parentheses indicate the soft key to press in order to access the data.
• Graphical NEXRAD data (NEXRAD)
• Graphical METAR data (METAR)
• Textual METAR data
• Textual terminal aerodrome forecasts (TAF)
• City forecast data
• Graphical wind data (WIND)
• Graphical echo tops (ECHO T,,,OPS)
• Graphical cloud tops (CLD TOPS)
• Graphical lightning strikes (LTNG)
• Graphical storm cell movement (CELL MOV)
• NEXRAD radar coverage (information displayed with the NEXRAD data)
• SIGMETs/AIRMETs (SIG/AIR)
• Surface analysis to include city forecasts (SFC)
• County warnings (COUNTY)
• Freezing levels (FRZ LVL)
• Hurricane track (CYCLONE)
• Temporary flight restrictions (TFR)
Pilots must be familiar with any EFD or MFD used and the data link weather products available on the display.
Weather Products Age and ExpirationThe information displayed using a data link weather link is near real time but should not be thought of as instantaneous, up-to-date information. Each type of weather display is stamped with the age information on the MFD. The time is referenced from Zulu when the information was assembled at the ground station. The age should not be assumed to be the time when the FIS received the information from the data link.
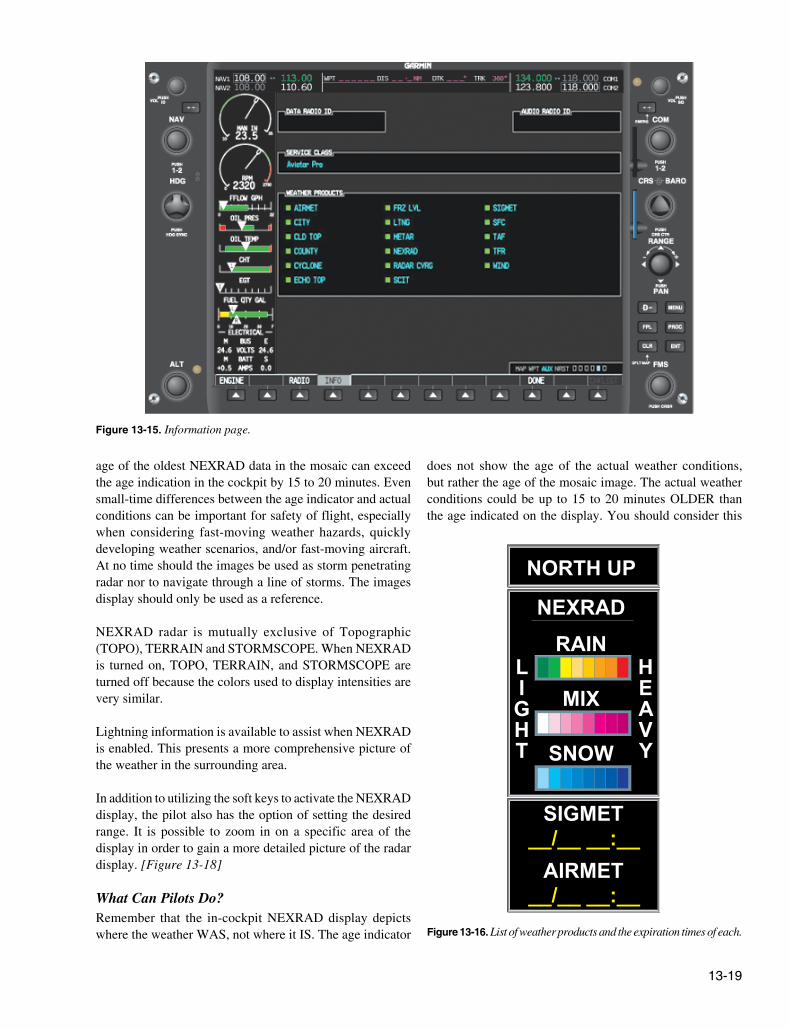
Two types of weather are displayed on the screen: “current” weather and forecast data. Current information is displayed by an age while the forecast data has a data stamp in the form of “__ / __ __ : __.” [Figure 13-16]
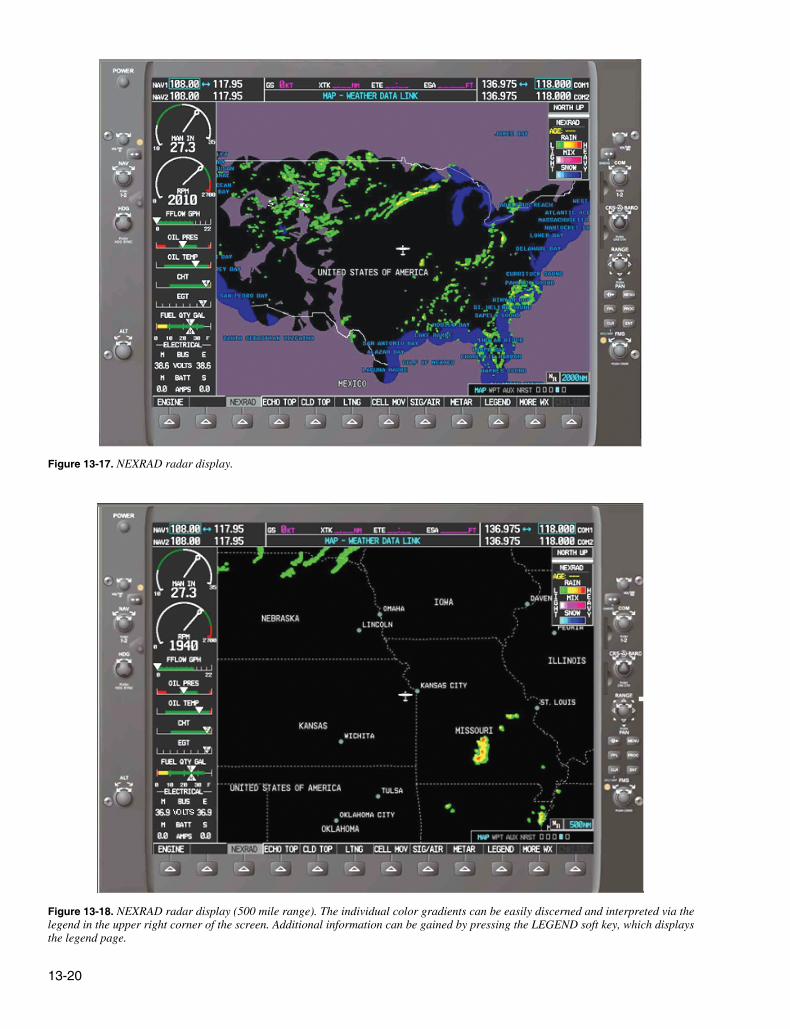
The Next Generation Weather Radar System (NEXRAD)The NEXRAD system is comprised of a series of 159 Weather Surveillance Radar–1988 Doppler (WSR-88D) sites situated throughout the United States, as well as selected overseas sites. The NEXRAD system is a joint venture between the United States Department of Commerce (DOC), the United States DOD, as well as the United States Department of Transportation (DOT). The individual agencies that have control over the system are the NWS, Air Force Weather Agency (AFWA) and the FAA. [Figure 13-17]
NEXRAD data for up to a 2,000 mile range can be displayed. It is important to realize that the radar image is not real time and can be up to 5 minutes old. The NTSB has reported on 2 fatal accidents where in-cockpit NEXRAD mosaic imagery was available to pilots operating near quickly-developing and fast-moving convective weather. In one of these accidents, the images were from 6 to 8 minutes old. In some cases, NEXRAD data can age significantly by the time the mosaic image is created. In some extreme latency cases, the actual
13-19
Figure 13-15. Information page.
Figure 13-16. List of weather products and the expiration times of each.
NEXRAD
RAIN
MIX
SNOW
HEAVY
LIGHT
SIGMET
AIRMET__/__ __:__
__/__ __:__
NORTH UP
does not show the age of the actual weather conditions, but rather the age of the mosaic image. The actual weather conditions could be up to 15 to 20 minutes OLDER than the age indicated on the display. You should consider this
age of the oldest NEXRAD data in the mosaic can exceed the age indication in the cockpit by 15 to 20 minutes. Even small-time differences between the age indicator and actual conditions can be important for safety of flight, especially when considering fast-moving weather hazards, quickly developing weather scenarios, and/or fast-moving aircraft. At no time should the images be used as storm penetrating radar nor to navigate through a line of storms. The images display should only be used as a reference.
NEXRAD radar is mutually exclusive of Topographic (TOPO), TERRAIN and STORMSCOPE. When NEXRAD is turned on, TOPO, TERRAIN, and STORMSCOPE are turned off because the colors used to display intensities are very similar.
Lightning information is available to assist when NEXRAD is enabled. This presents a more comprehensive picture of the weather in the surrounding area.
In addition to utilizing the soft keys to activate the NEXRAD display, the pilot also has the option of setting the desired range. It is possible to zoom in on a specific area of the display in order to gain a more detailed picture of the radar display. [Figure 13-18]
What Can Pilots Do?Remember that the in-cockpit NEXRAD display depicts where the weather WAS, not where it IS. The age indicator
13-20
Figure 13-17. NEXRAD radar display.
Figure 13-18. NEXRAD radar display (500 mile range). The individual color gradients can be easily discerned and interpreted via the legend in the upper right corner of the screen. Additional information can be gained by pressing the LEGEND soft key, which displays the legend page.
13-21
potential delay when using in-cockpit NEXRAD capabilities, as the movement and/or intensification of weather could adversely affect safety of flight.
• Understand that the common perception of a “5-minute latency” with radar data is not always correct.
• Get your preflight weather briefing! Having in-cockpit weather capabilities does not circumvent the need for a complete weather briefing before takeoff.
• Use all appropriate sources of weather information to make in-flight decisions.
• Let your fellow pilots know about the limitations of in-cockpit NEXRAD.
NEXRAD AbnormalitiesAlthough NEXRAD is a compilation of stations across the country, there can be abnormalities associated with the system. Some of the abnormalities are listed below.
• Ground clutter
• Strobes and spurious radar data
• Sun strobes, when the radar antenna points directly at the sun
• Interference from buildings or mountains that may cause shadows
• Military aircraft that deploy metallic dust and may reflect the radar signature
NEXRAD LimitationsIn addition to the abnormalities listed, the NEXRAD system does have some specific limitations.
Base Reflectivity
The NEXRAD base reflectivity does not provide adequate information from which to determine cloud layers or type of precipitation with respect to hail versus rain. Therefore, a pilot may mistake rain for hail.
In addition, the base reflectivity is sampled at the minimum antenna elevation angle. With this minimum angle, an individual site cannot depict high altitude storms directly over the station. This leaves an area of null coverage if an adjacent site does not also cover the affected area.
Resolution Display
The resolution of the displayed data poses additional concerns when the range is decreased. The minimum resolution for NEXRAD returns is 1.24 miles. This means that when the display range is zoomed in to approximately ten miles, the individual square return boxes are more prevalent. Each
square indicates the strongest display return within that 1.24 mile square area.
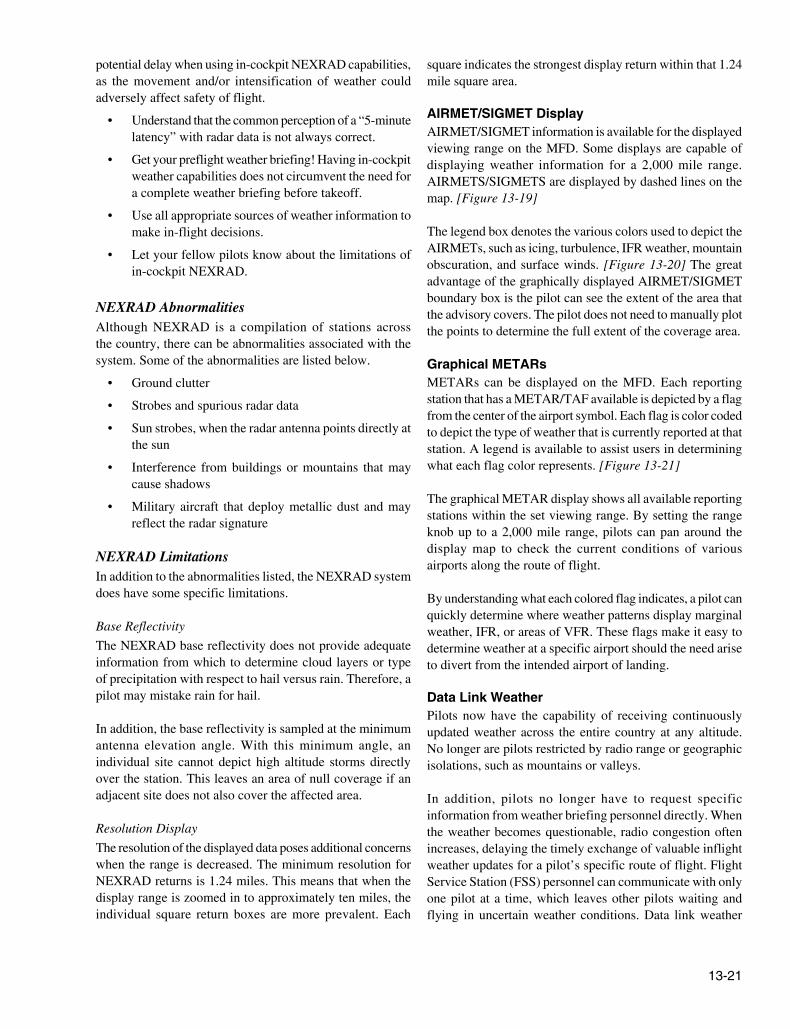
AIRMET/SIGMET DisplayAIRMET/SIGMET information is available for the displayed viewing range on the MFD. Some displays are capable of displaying weather information for a 2,000 mile range. AIRMETS/SIGMETS are displayed by dashed lines on the map. [Figure 13-19]
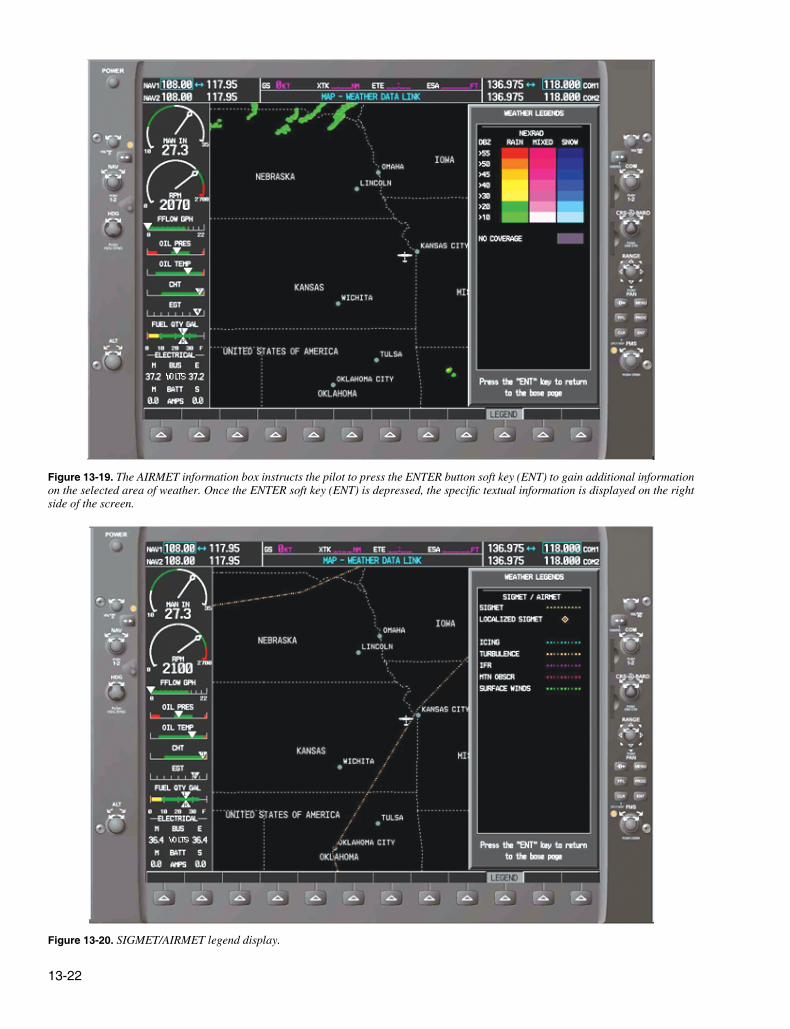
The legend box denotes the various colors used to depict the AIRMETs, such as icing, turbulence, IFR weather, mountain obscuration, and surface winds. [Figure 13-20] The great advantage of the graphically displayed AIRMET/SIGMET boundary box is the pilot can see the extent of the area that the advisory covers. The pilot does not need to manually plot the points to determine the full extent of the coverage area.
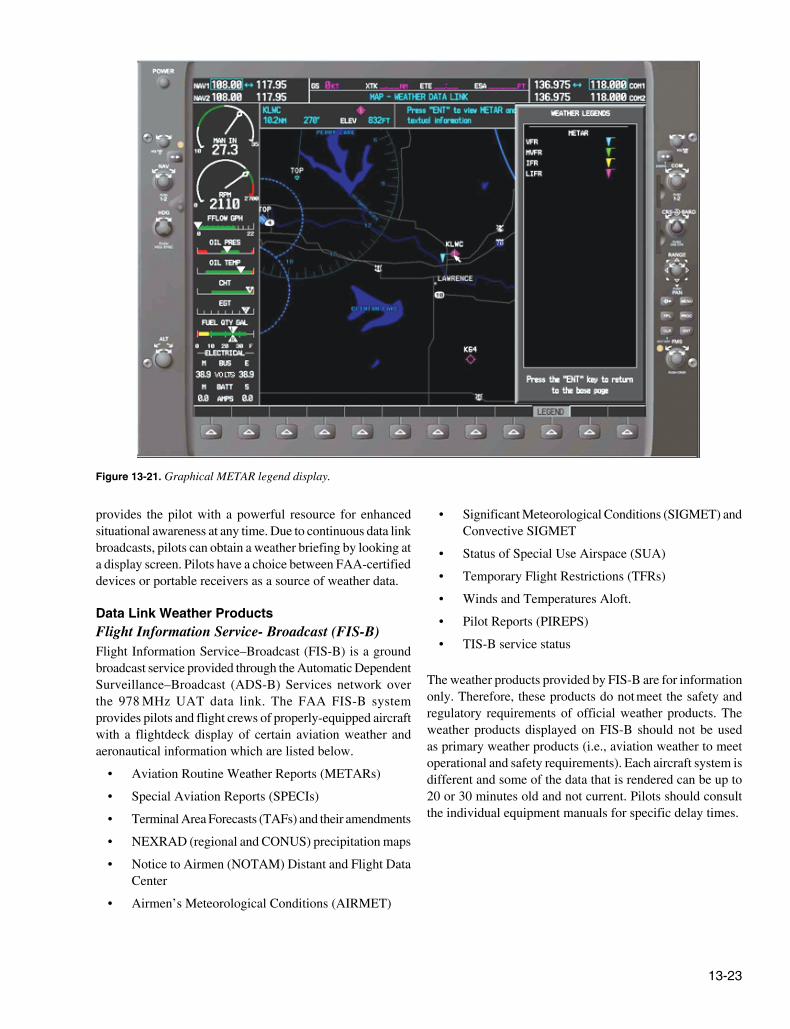
Graphical METARsMETARs can be displayed on the MFD. Each reporting station that has a METAR/TAF available is depicted by a flag from the center of the airport symbol. Each flag is color coded to depict the type of weather that is currently reported at that station. A legend is available to assist users in determining what each flag color represents. [Figure 13-21]
The graphical METAR display shows all available reporting stations within the set viewing range. By setting the range knob up to a 2,000 mile range, pilots can pan around the display map to check the current conditions of various airports along the route of flight.
By understanding what each colored flag indicates, a pilot can quickly determine where weather patterns display marginal weather, IFR, or areas of VFR. These flags make it easy to determine weather at a specific airport should the need arise to divert from the intended airport of landing.
Data Link WeatherPilots now have the capability of receiving continuously updated weather across the entire country at any altitude. No longer are pilots restricted by radio range or geographic isolations, such as mountains or valleys.
In addition, pilots no longer have to request specific information from weather briefing personnel directly. When the weather becomes questionable, radio congestion often increases, delaying the timely exchange of valuable inflight weather updates for a pilot’s specific route of flight. Flight Service Station (FSS) personnel can communicate with only one pilot at a time, which leaves other pilots waiting and flying in uncertain weather conditions. Data link weather
13-22
Figure 13-19. The AIRMET information box instructs the pilot to press the ENTER button soft key (ENT) to gain additional information on the selected area of weather. Once the ENTER soft key (ENT) is depressed, the specific textual information is displayed on the right side of the screen.
Figure 13-20. SIGMET/AIRMET legend display.
13-23
Figure 13-21. Graphical METAR legend display.
provides the pilot with a powerful resource for enhanced situational awareness at any time. Due to continuous data link broadcasts, pilots can obtain a weather briefing by looking at a display screen. Pilots have a choice between FAA-certified devices or portable receivers as a source of weather data.
Data Link Weather ProductsFlight Information Service- Broadcast (FIS-B)Flight Information Service–Broadcast (FIS-B) is a ground broadcast service provided through the Automatic Dependent Surveillance–Broadcast (ADS-B) Services network over the 978 MHz UAT data link. The FAA FIS-B system provides pilots and flight crews of properly-equipped aircraft with a flightdeck display of certain aviation weather and aeronautical information which are listed below.
• Aviation Routine Weather Reports (METARs)
• Special Aviation Reports (SPECIs)
• Terminal Area Forecasts (TAFs) and their amendments
• NEXRAD (regional and CONUS) precipitation maps
• Notice to Airmen (NOTAM) Distant and Flight Data Center
• Airmen’s Meteorological Conditions (AIRMET)
• Significant Meteorological Conditions (SIGMET) and Convective SIGMET
• Status of Special Use Airspace (SUA)
• Temporary Flight Restrictions (TFRs)
• Winds and Temperatures Aloft.
• Pilot Reports (PIREPS)
• TIS-B service status
The weather products provided by FIS-B are for information only. Therefore, these products do not meet the safety and regulatory requirements of official weather products. The weather products displayed on FIS-B should not be used as primary weather products (i.e., aviation weather to meet operational and safety requirements). Each aircraft system is different and some of the data that is rendered can be up to 20 or 30 minutes old and not current. Pilots should consult the individual equipment manuals for specific delay times.
13-24
Pilot ResponsibilityIt is important for pilots to understand the realization that the derived safety benefits of data link depends heavily upon the pilot’s understanding of the specific system’s capabilities and limitations which are listed below.
• Product latency—be aware of the time stamp or “valid until” time on the particular data link information displayed in the flightdeck. For example, since initial processing and transmission of NEXRAD data can take several minutes, pilots must assume that data link weather information will always be a minimum of seven to eight minutes older than shown on the time stamp and only use data link weather radar images for broad strategic avoidance of adverse weather.
• Product update cycles—be aware of when and how often a product is updated as well as the Data Link Service Providers (DLSP) update rate for particular products.
• Indication of system failure—be aware of partial or total system failure indications.
• Coverage areas/service volume—coverage limitations are associated with the type of data link network being used. For example, ground-based systems that require a line-of-sight may have relatively limited coverage below 5,000 feet AGL. Satellite-based data link weather systems can have limitations stemming from whether the network is in geosynchronous orbit or low earth orbit. Also, NWS NEXRAD coverage has gaps, especially in the western states.
• Content/format—since service providers often refine or enhance data link products for flightdeck display, pilots must be familiar with the content, format, and meaning of symbols and displays (i.e., the legend) in the specific system.
• Data integrity/limitations to use—reliability of information depicted. Be aware of any applicable disclaimer provided by the service provider.
• Use of equipment/avionics display—pilots remain responsible for the proper use of an electronic flight bag (EFB) or installed avionics. Pilots should be cognizant that, per the FAA Practical Test Standards, they may be evaluated on the use and interpretation of an EFB or installed avionics on the aircraft.
• Overload of Information—most DLSPs offer numerous products with information that can be layered on top of each other. Pilots need to be aware that too much information can have a negative effect on their cognitive work load. Pilots need to manage the amount of information to a level that offers the most pertinent information to that specific flight without
creating a distraction. Pilots may need to adjust the amount of information based on numerous factors including, but not limited to, the phase of flight, single pilot operation, autopilot availability, class of airspace, and the weather conditions encountered.
Chapter SummaryWhile no weather forecast is guaranteed to be 100 percent accurate, pilots have access to a myriad of weather information on which to base flight decisions. Weather products available for preflight planning to en route information received over the radio or via data link provide the pilot with the most accurate and up-to-date information available. Each report provides a piece of the weather puzzle. Pilots must use several reports to get an overall picture and gain an understanding of the weather that affects the safe completion of a flight.