
Ph. Wipfler and G.Deckmyn Kranzberg Forest Experiment : upscaling to the forest. From the empirical...
19
Ph. Wipfler and G.Deckmyn Kranzberg Forest Experiment : upscaling to the forest. From the empirical approach to the mechanistic simulation of ozone effects using the ANAFORE forest model. W aldwachstum System analyse
-
Upload
helena-norton -
Category
Documents
-
view
213 -
download
0
Transcript of Ph. Wipfler and G.Deckmyn Kranzberg Forest Experiment : upscaling to the forest. From the empirical...
Ph. Wipfler and G.Deckmyn
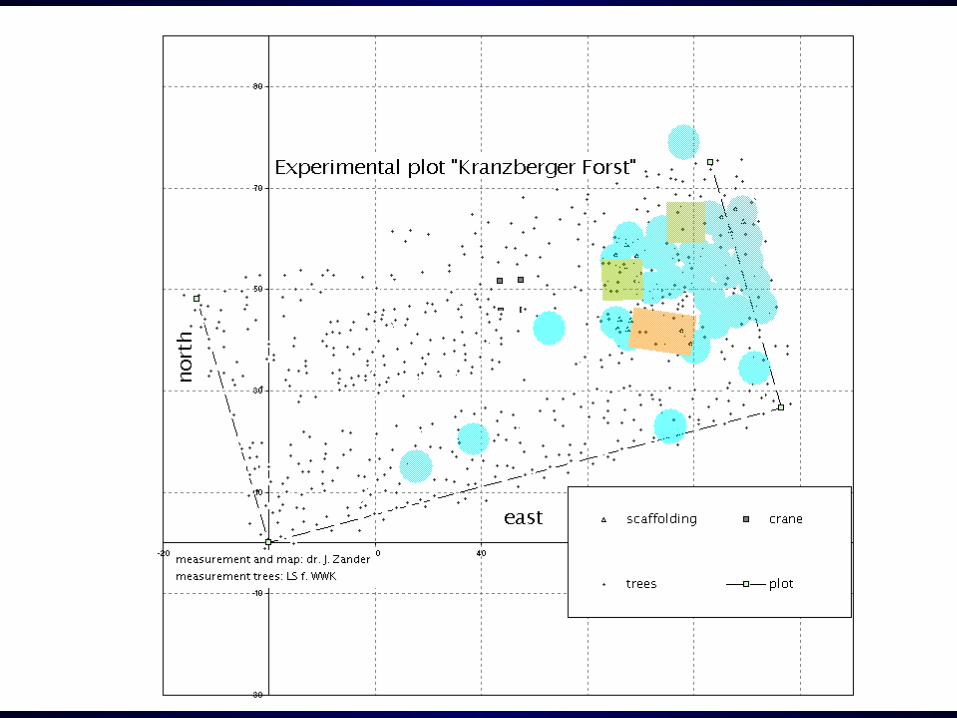
Kranzberg Forest Experiment : upscaling to the forest.
From the empirical approach to the mechanistic simulation of ozone effects using
the ANAFORE forest model.
WaldwachstumSystemanalyse
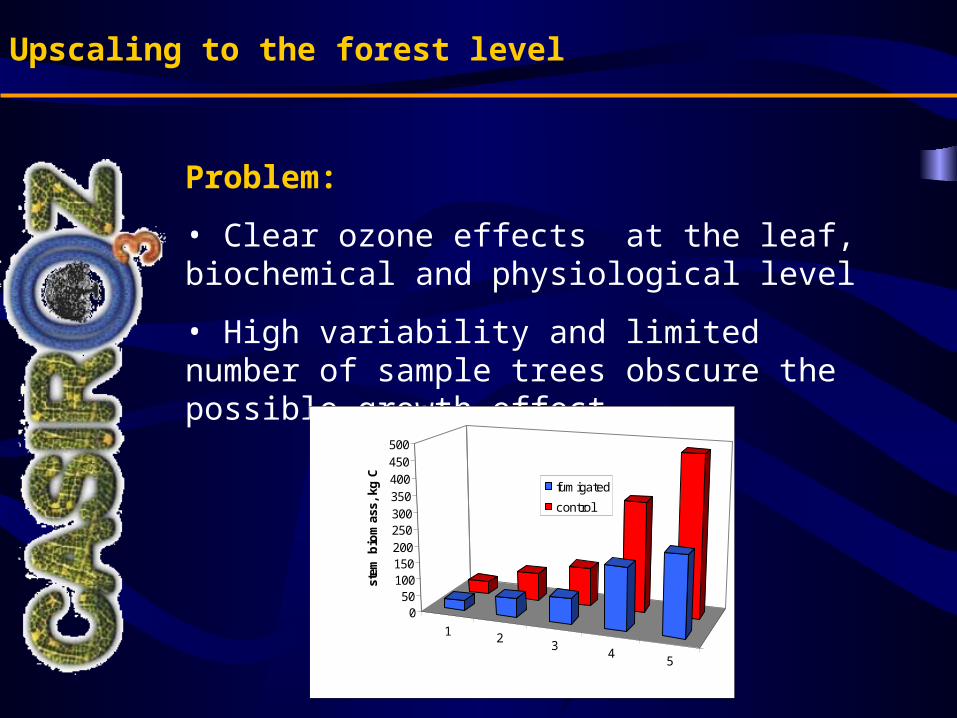
Upscaling to the forest level
Problem:
• Clear ozone effects at the leaf, biochemical and physiological level
• High variability and limited number of sample trees obscure the possible growth effect
1 23
45
050
100150200250300350400450500
stem
bio
mas
s, k
g C
fumigated
control
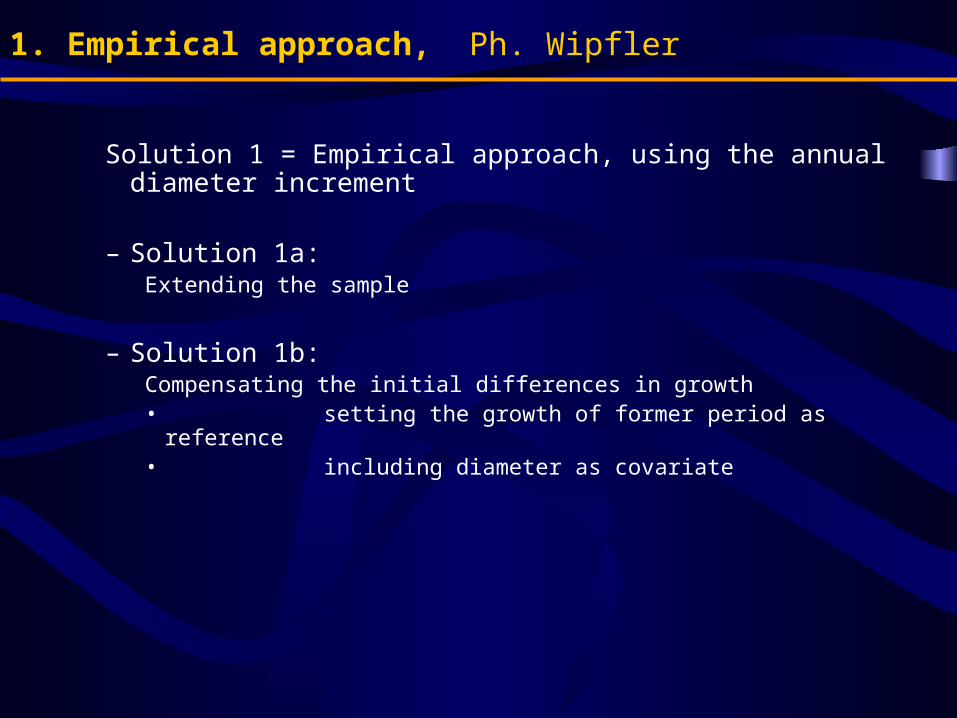
1. Empirical approach, Ph. Wipfler
Solution 1 = Empirical approach, using the annual diameter increment
– Solution 1a: Extending the sample
– Solution 1b:Compensating the initial differences in growth• setting the growth of former period as reference• including diameter as covariate
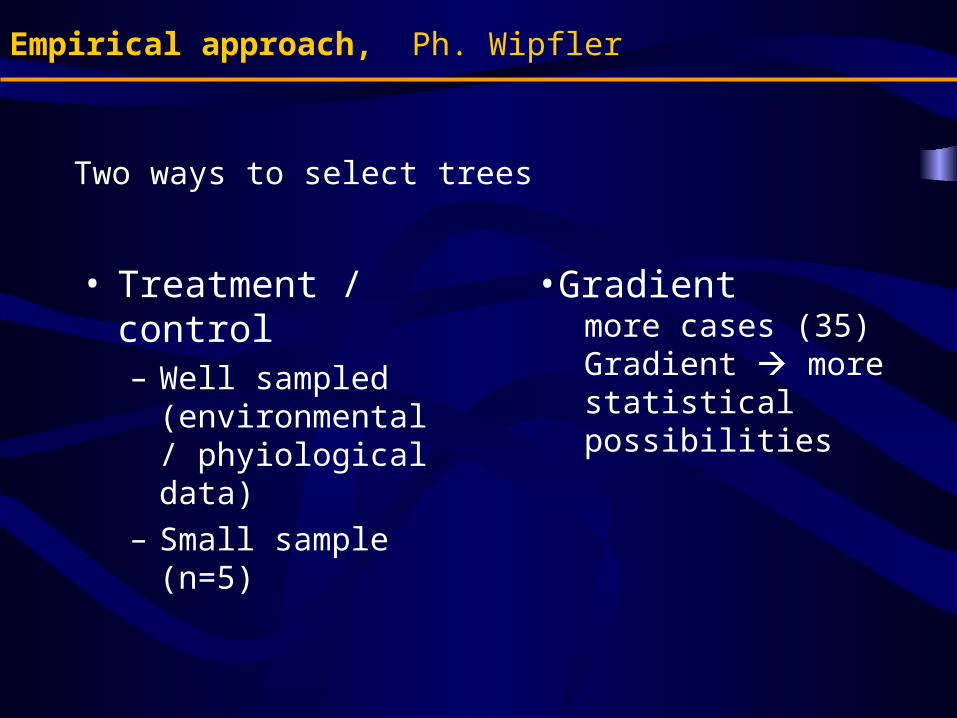
Empirical approach, Ph. Wipfler
Two ways to select trees
• Treatment / control– Well sampled
(environmental / phyiological data)
– Small sample (n=5)
•Gradientmore cases (35)Gradient more statistical possibilities
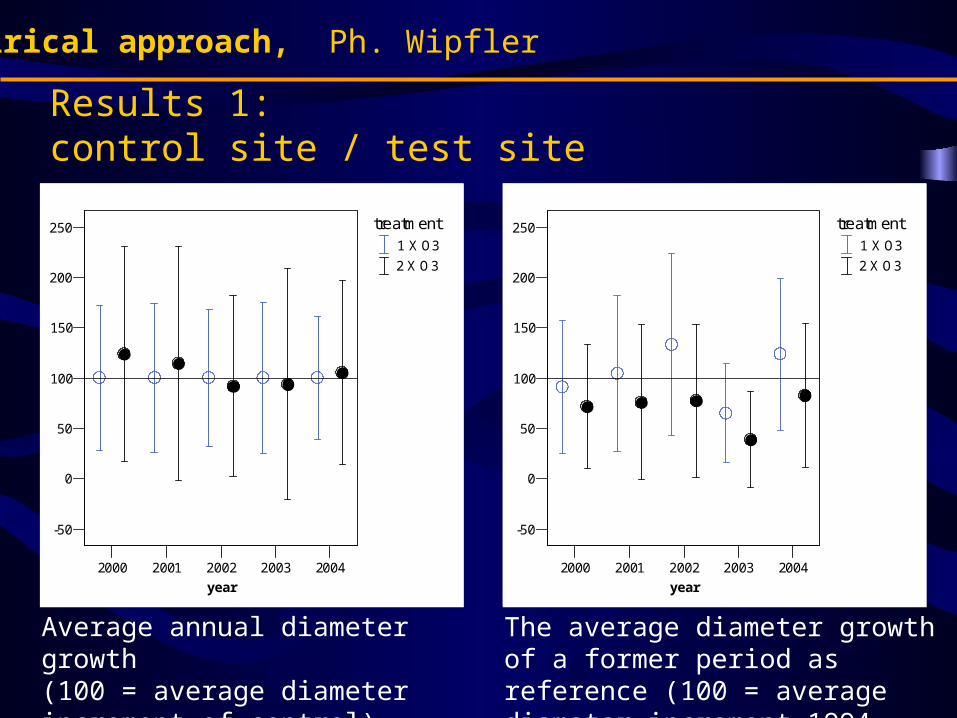
Results 1:control site / test site
Empirical approach, Ph. Wipfler
2000 2001 2002 2003 2004
year
-50
0
50
100
150
200
250 treatment1 X O3
2 X O3
2000 2001 2002 2003 2004
year
-50
0
50
100
150
200
250 treatment1 X O3
2 X O3
Average annual diameter growth(100 = average diameter increment of control)
The average diameter growth of a former period as reference (100 = average diameter increment 1994 - 1999)

Results 2: GradientCorrelation analysis
Empirical approach, Ph. Wipfler
df coeff sign
33 0.032 0.853
Correlation analysis: Coefficient and significance of the the parameter related to ozone exposure
Wipfler et. al. (2006) in press
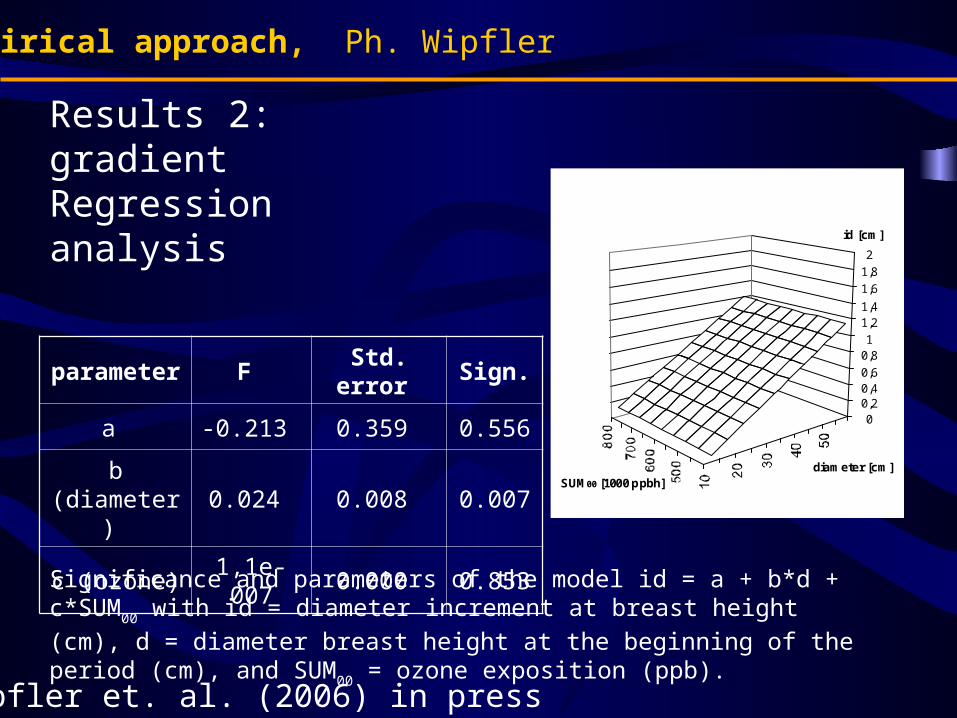
Results 2: gradientRegression analysis
Empirical approach, Ph. Wipfler
SUM00 [1000 ppbh]
id [cm]
diameter [cm]
00,20,40,6
0,81
1,21,4
1,6
1,8
2
Significance and parameters of the model id = a + b*d + c*SUM00 with id =
diameter increment at breast height (cm), d = diameter breast height at the beginning of the period (cm), and SUM00 = ozone exposition (ppb).
parameter F Std. error Sign.
a -0.213 0.359 0.556
b (diameter) 0.024 0.008 0.007
c (ozone) 1,1e-007 0.000 0.853
Wipfler et. al. (2006) in press
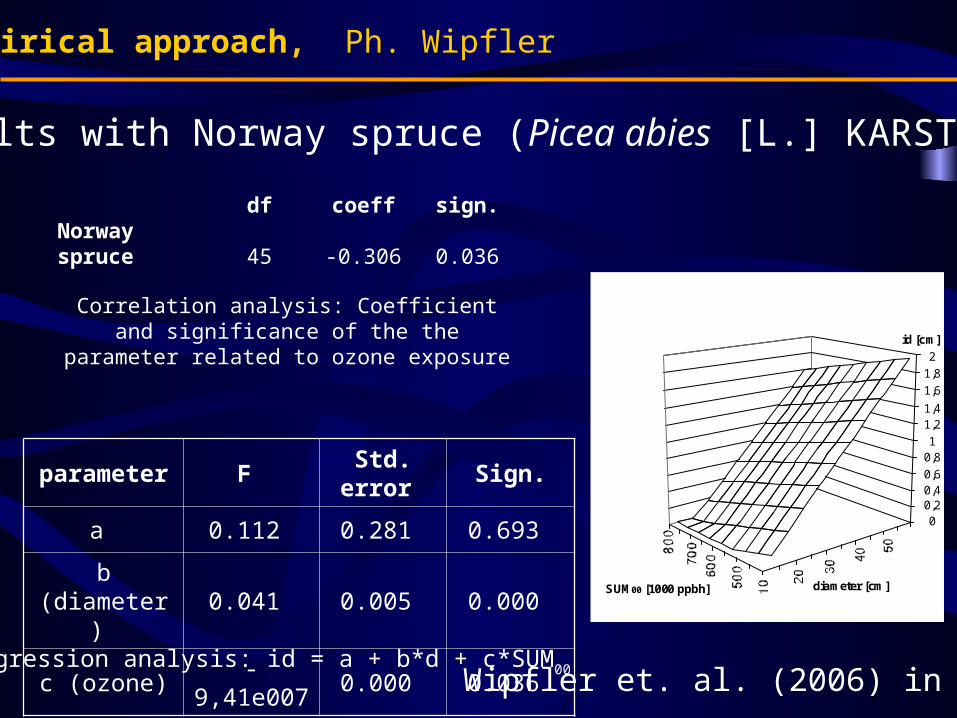
df coeff sign.Norway spruce 45 -0.306 0.036
Correlation analysis: Coefficient and significance of the the parameter related to ozone exposure
id [cm]
SUM00 [1000 ppbh] diameter [cm]
00,20,40,6
0,81
1,21,4
1,6
1,8
2
parameter F Std. error Sign.
a 0.112 0.281 0.693
b (diameter) 0.041 0.005 0.000
c (ozone) -9,41e007 0.000 0.036
Empirical approach, Ph. Wipfler
Results with Norway spruce (Picea abies [L.] KARST.)
Regression analysis: id = a + b*d + c*SUM00 Wipfler et. al. (2006) in press

2. Modelling approach, G. Deckmyn
Why mechanistic modelling?– Improve on understanding
• s.a. Explain specific results
– Synthesize knowledge– Explore research hypothesis– Predict effects at stand and landscape level
0
1
2
3
4
5
6
7
8
9
0 20 40 60 80
model complexity
nu
mb
er o
f p
aram
ete
rs
empirical
mechanistic
2. Modelling approach , G. Deckmyn
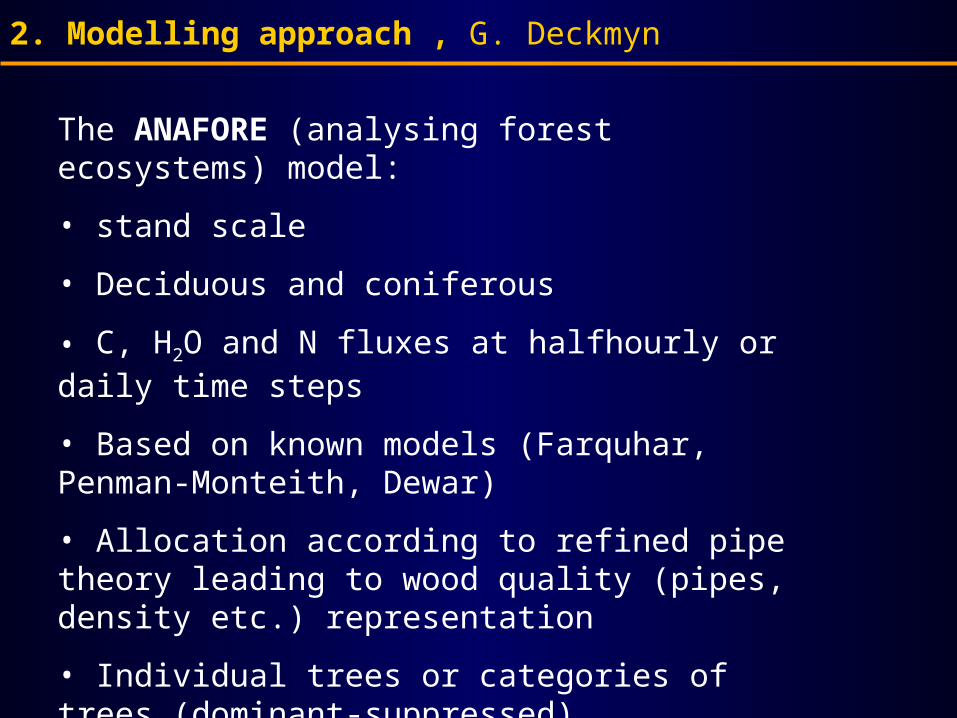
The ANAFORE (analysing forest ecosystems) model:
• stand scale
• Deciduous and coniferous
• C, H2O and N fluxes at halfhourly or daily time steps
• Based on known models (Farquhar, Penman-Monteith, Dewar)
• Allocation according to refined pipe theory leading to wood quality (pipes, density etc.) representation
• Individual trees or categories of trees (dominant-suppressed)

2. Modelling approach , G. Deckmyn
2. Modelling approach , G. Deckmyn
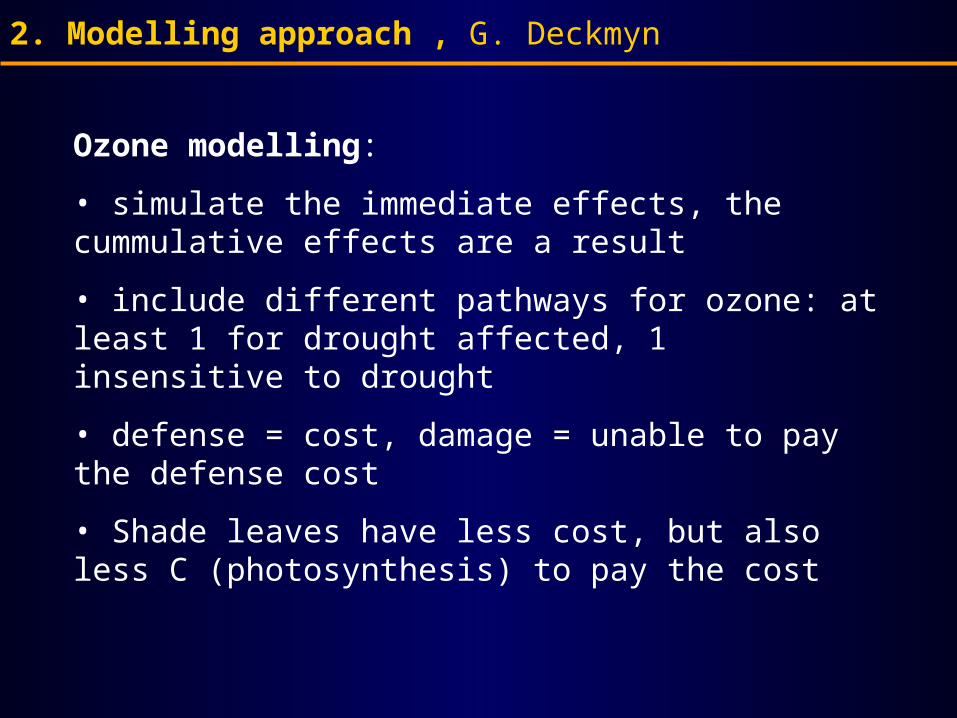
Ozone modelling:
• simulate the immediate effects, the cummulative effects are a result
• include different pathways for ozone: at least 1 for drought affected, 1 insensitive to drought
• defense = cost, damage = unable to pay the defense cost
• Shade leaves have less cost, but also less C (photosynthesis) to pay the cost
321
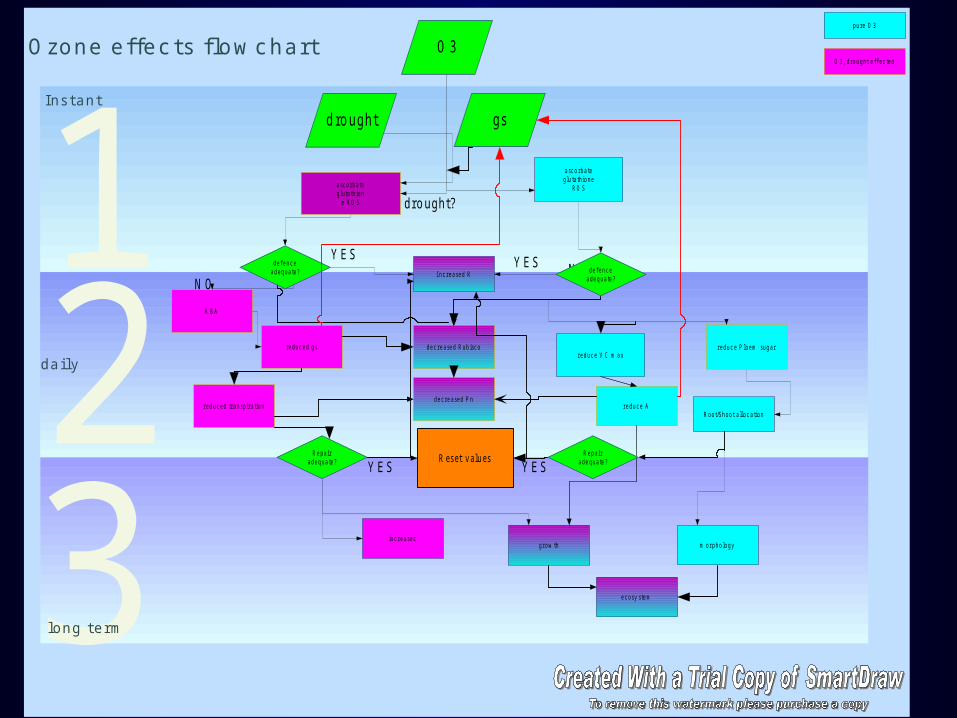
Ozone eff ec ts flow c hart O 3
a sc o r b a teg lu ta th io n e
R O S
A B A
r e d u c e d g sr e d u c e V C m a x
r e d u c e A
m o r p h o lo g yg r o w th
e c o sy ste m
I ns tant
dai ly
long term
p u r e O 3
O 3 , d r o u g h t e f f e c te d
YE S N O
R o o t/Sh o o t a llo c a tio n
r e d u c e P lo e m su g a r
a sc o r b a teg lu ta th io n
e R O S
in c r e a se c
d ro ught
dro ught?
d e f e n c ea d e q u a te ? d e f e n c e
a d e q u a te ?I n c r e a se d R
YE S
N O
R e p a ira d e q u a te ? YE S
r e d u c e d tr a n sp ir a tio n
YE SR e p a ir
a d e q u a te ?
d e c r e a se d R u b isc o
d e c r e a se d P n
gs
R es et v alu es
Modelling approach, G. Deckmyn
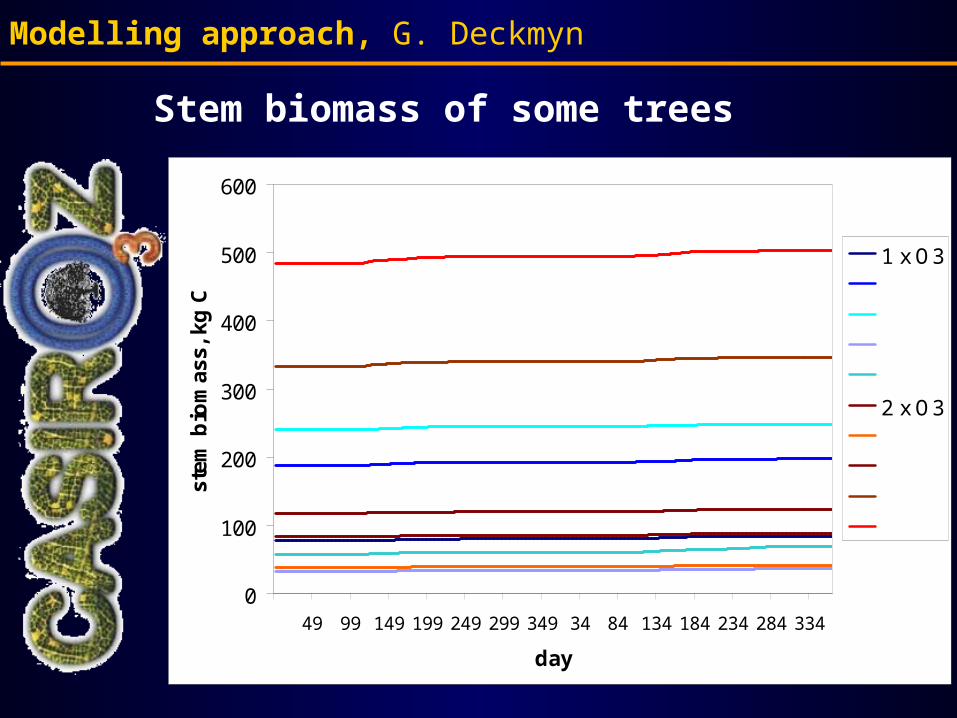
Stem biomass of some trees
0
100
200
300
400
500
600
49 99 149 199 249 299 349 34 84 134 184 234 284 334
day
stem
bio
mas
s, k
g C
1 x O3
2 x O3
2. Modelling approach , G. Deckmyn
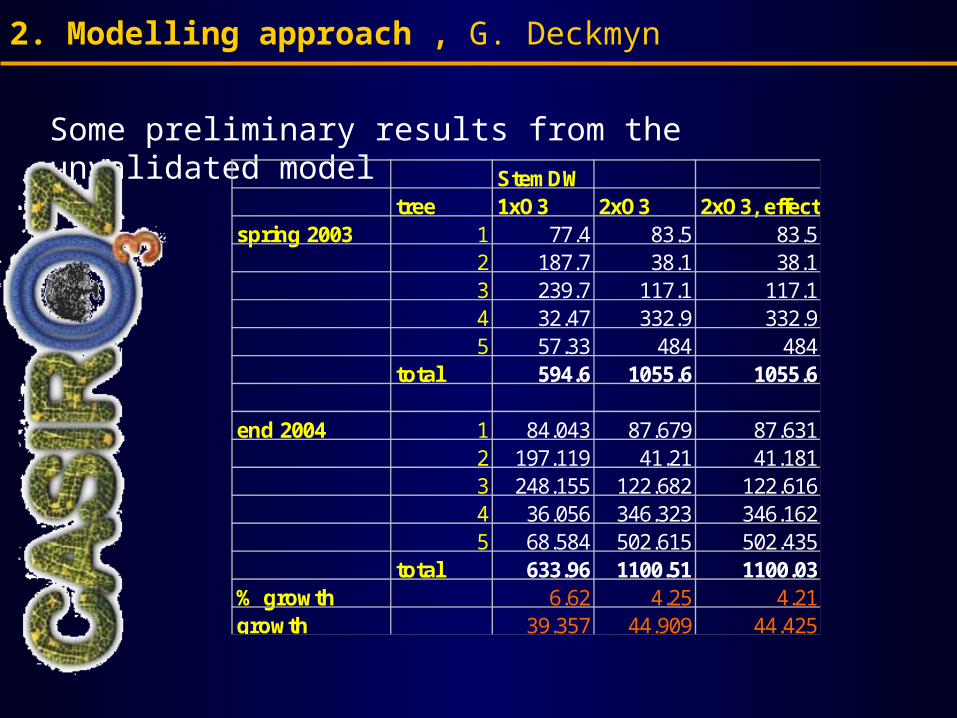
Some preliminary results from the unvalidated modelStemDW
tree 1xO3 2xO3 2xO3, effectspring 2003 1 77.4 83.5 83.5
2 187.7 38.1 38.13 239.7 117.1 117.14 32.47 332.9 332.95 57.33 484 484
total 594.6 1055.6 1055.6
end 2004 1 84.043 87.679 87.6312 197.119 41.21 41.1813 248.155 122.682 122.6164 36.056 346.323 346.1625 68.584 502.615 502.435
total 633.96 1100.51 1100.03% growth 6.62 4.25 4.21growth 39.357 44.909 44.425
2. Modelling approach, G. Deckmyn
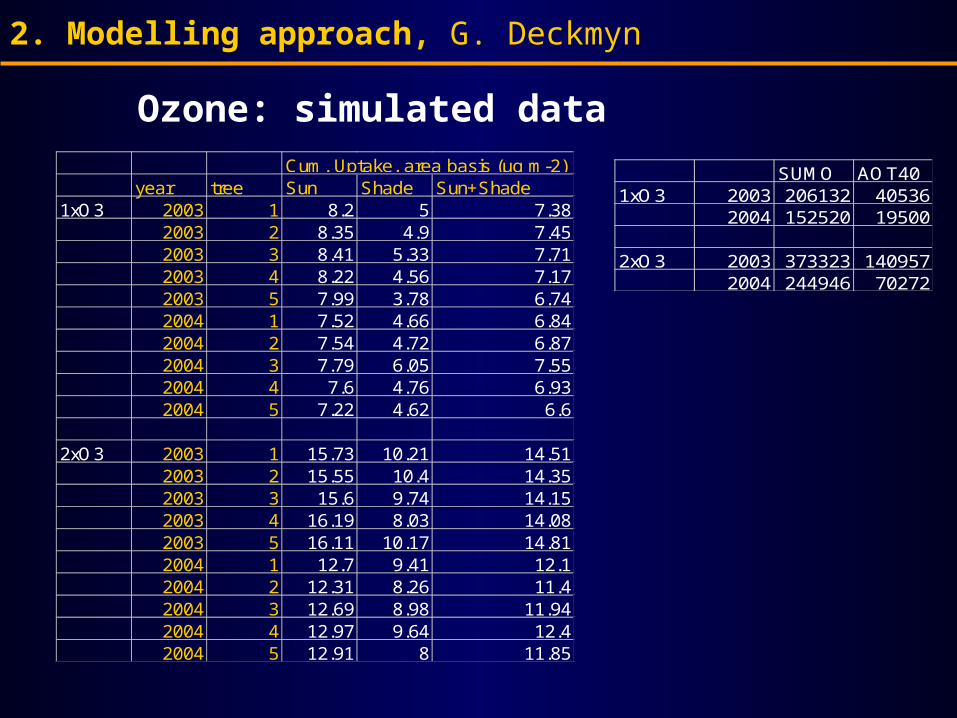
Ozone: simulated dataCum. Uptake, area basis (µg m-2)
year tree Sun Shade Sun+Shade1xO3 2003 1 8.2 5 7.38
2003 2 8.35 4.9 7.452003 3 8.41 5.33 7.712003 4 8.22 4.56 7.172003 5 7.99 3.78 6.742004 1 7.52 4.66 6.842004 2 7.54 4.72 6.872004 3 7.79 6.05 7.552004 4 7.6 4.76 6.932004 5 7.22 4.62 6.6
2xO3 2003 1 15.73 10.21 14.512003 2 15.55 10.4 14.352003 3 15.6 9.74 14.152003 4 16.19 8.03 14.082003 5 16.11 10.17 14.812004 1 12.7 9.41 12.12004 2 12.31 8.26 11.42004 3 12.69 8.98 11.942004 4 12.97 9.64 12.42004 5 12.91 8 11.85
SUMO AOT401xO3 2003 206132 40536
2004 152520 19500
2xO3 2003 373323 1409572004 244946 70272

2. Modelling approach, G. Deckmyn
Conclusions- We can improve our understanding of the kranzberg results– We can investigate the flux concept after validation of the
Dewar stomatal model– We can differentiate between immediate and cummulative
effects– We can differentiate between sun and shade leaves– We can investigate the interaction with drought, T, CO2,
soil,...– We can investigate the total C balance at the stand level– We can upscale– ...We have a lot more work to do....
Thank You