pg 35. Limits of knowledge and value of trust pg 37. INTERVIEW:...
48
1 ST - 31 ST October 2015 . Vol 2 Issue 6. For Private Circulation Only pg 35. Limits of knowledge and value of trust pg 37. INTERVIEW: Nitin Ghadiyar pg 39. Indian Economy – Trend indicators
Transcript of pg 35. Limits of knowledge and value of trust pg 37. INTERVIEW:...
1ST - 31ST October 2015 . Vol 2 Issue 6. For Private Circulation Only
pg 35. Limits of knowledge and value of trust
pg 37. INTERVIEW: Nitin Ghadiyar
pg 39. Indian Economy – Trend indicators

3GROUND VIEW GROUND VIEW 1 - 31 October 2015 1 - 31 October 2015 2
VOL 2 . ISSUE 6 . 1ST - 31ST OCT 2015
Vineet Bhatnagar- Managing Director and CEO
EDITORIAL BOARD:Naveen Kulkarni, Manish Agarwalla, Kinshuk Bharti Tiwari
COVER & MAGAZINE DESIGN Chaitanya Modak, www.inhousedesign.co.in
EDITOR:Roshan Sony
FOR EDITORIAL QUERIES:PhillipCapital (India) Private LimitedNo. 1, 18th Floor, Urmi Estate, 95 Ganpatrao Kadam Marg, Lower Parel West, Mumbai 400 013
RESEARCH Banking, NBFCs Manish Agarwalla, Pradeep Agrawal, Paresh Jain
Consumer, Media, Telecom Naveen Kulkarni, Jubil Jain, Manoj Behera
Cement Vaibhav Agarwal
Economics Anjali Verma
Engineering, Capital Goods Jonas Bhutta, Hrishikesh Bhagat
Infrastructure & IT Services Vibhor Singhal, Deepan Kapadia
Logistics, Transportation & Midcap Vikram Suryavanshi
Midcap Amol Rao
Metals & Automobiles Dhawal Doshi, Nitesh Sharma, Yash Doshi
Agri Inputs Gauri Anand
Oil & Gas Sabri Hazarika
Pharmaceuticals Surya Patra, Mehul Sheth
Portfolio Strategy Anindya Bhowmik
Technicals Subodh Gupta
Production Manager Ganesh Deorukhkar
Database Manager Deepak Agrawal
Sr. Manager – Equities Support Rosie Ferns
SALES & DISTRIBUTION Ashvin Patil, Shubhangi Agrawal, Kishor Binwal, Sidharth Agrawal, Bhavin Shah, Varun Kumar, Narayan Mulchandani
CORPORATE COMMUNICATIONS Zarine Damania
GROUND VIEW - PREVIOUS ISSUES
1st June 2015 Issue 41st July 2015 Issue 5
1st Apr 2015 Issue 3 1st Feb 2015 Issue 2
1st Jan 2015 Issue 1 16th Dec 2014 Issue 12

3GROUND VIEW GROUND VIEW 1 - 31 October 2015 1 - 31 October 2015 2
4. COVER STORY: What’s making Indian specialty chemicals so special?
Ground View highlights the changing global trends and outlines potential beneficiaries
35. Limits of knowledge and value of trust
37. INTERVIEW: Nitin GhadiyarShares his insights on brand building and his outlook on the FMCG industry
39. Indian Economy – Trend indicators
41. PhillipCapital Coverage Universe: Valuation Summary
LETTER FROM THE MANAGING DIRECTORThe Indian specialty-chemicals sector has come
a long way in the last seven decades or so — it
has grown from a small-scale sector to a multi-di-
mensional one, taking on the challenges of glo-
balisation. While our domestic sector now holds
a recognised position on the global map, India’s
disadvantage in feedstock position and lack of
adequate infrastructure hinders its progress into the
big league.
However, the sector is going to benefit from the
steadily growing domestic demand, conducive
export environment, and positive policy initiatives
by the government under its Make-in-India cam-
paign. While a healthy domestic demand remains
the backbone of Indian specialty chemicals, robust
export opportunity emerging from moderating Chi-
nese exports (with the country’s regulatory clamp
down) should propel the Indian specialty chemicals
industry.
So far, the Indian specialty chemicals sector has
failed to fascinate the investor community due to
its low growth and highly fragmented structure.
Our cover story on “What’s making Indian specialty
chemicals so special?,” authored by Surya Narayan
Patra, highlights the changing global trends that
favour the domestic industry, and outlines potential
beneficiaries. Hope you enjoy this very interesting
and informative journey.
Wishing everybody a happy and prosperous
Dussehra and Diwali.
Best Wishes
Vineet
CONTENTS

5GROUND VIEW GROUND VIEW 1 - 31 October 2015 1 - 31 October 2015 4
Chemical hubs accross India

5GROUND VIEW GROUND VIEW 1 - 31 October 2015 1 - 31 October 2015 4
COVER STORY
Will the investor community continue to ignore the Indian specialty chemicals sector, with a
market size of about US$ 25bn? This industry has already delivered healthy 13% CAGR (next
only to China and Korea) over the last decade. India has emerged as the fastest-growing
specialty chemicals market fuelled by sturdy domestic demand with strong economic growth,
a large population, and rise in per-capita income. A simultaneous reduction in input costs, due
to the sharp correction in crude prices, enhanced the earning efficiency of the industry, which
relies on imported inputs. Moreover, softening of Chinese chemical exports, with environmental
issues leading to a shut down and relocation of 1000+ chemical plants, adds zing to India’s
specialty chemicals exports potential for the next couple of years. Additionally, the Indian
government’s ‘Make-in-India’ initiatives in addressing the old hurdles of the industry, with
enhanced focus on R&D and the rapid flow of FDI into the sector indicates value growth in the
domestic specialty-chemicals industry. This issue takes an in-depth look into the rising tide that
will float all speciality-chemicals boats.
BY SURYA PATRA & MEHUL SHETH
pg. 6 INDIAN CHEMICALS SCENARIO Indian chemicals is one of the fastest growing industries in the world___________________________________________________pg.9 SPECIALTY CHEMICALS TREND India’s natural disadvantage in feedstock shifted the focus to ‘specialty chemicals’___________________________________________________pg.17 CHINESE ISSUES AND IMPLICATIONS Environmental issues in China add zing to India’s specialty chemicals export potential___________________________________________________pg.23 “MAKE IN INDIA” COMPLEMENTS Government’s Make-in-India initiatives to address key hurdles for Indian specialty chemicals___________________________________________________pg.25 CONCLUSION Indian specialty chemicals is set for accelerated growth___________________________________________________
7GROUND VIEW GROUND VIEW 1 - 31 October 2015 1 - 31 October 2015 6
Chemicals are now an integral part of
human life due to their numerous
applications that help improve the
quality of life — these include break-
through innovations enabling pure drinking water,
faster medical treatment, stronger homes, and
greener fuels. The chemicals industry is critical for
the economic development of any country, as it
caters to the needs of various industries.
In India, the industry facilitated the country’s march
from being an agrarian economy to an industrial
one, and provided huge employment oppor-
tunities. It is a significant contributor to India’s
economic development. While it is one of India’s
oldest industries, it has evolved to a mature core
industry from a low-growth regulated one. Over
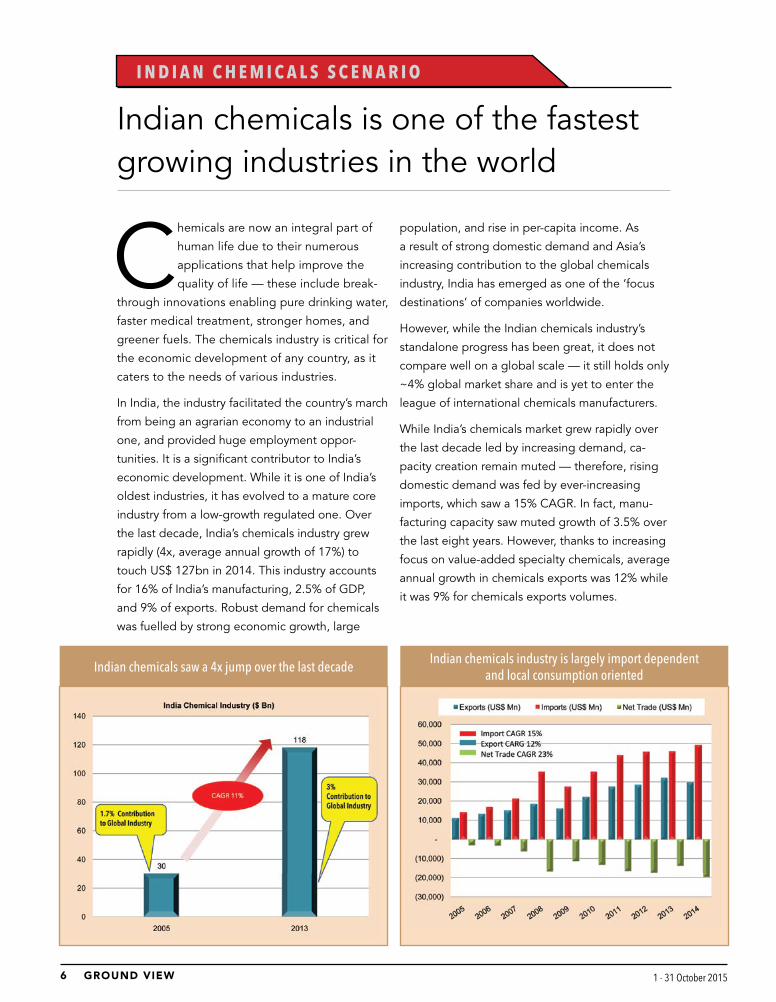
the last decade, India’s chemicals industry grew
rapidly (4x, average annual growth of 17%) to
touch US$ 127bn in 2014. This industry accounts
for 16% of India’s manufacturing, 2.5% of GDP,
and 9% of exports. Robust demand for chemicals
was fuelled by strong economic growth, large
Indian chemicals is one of the fastest growing industries in the world
I N D I A N C H E M I C A L S S C E N A R I O
population, and rise in per-capita income. As
a result of strong domestic demand and Asia’s
increasing contribution to the global chemicals
industry, India has emerged as one of the ‘focus
destinations’ of companies worldwide.
However, while the Indian chemicals industry’s
standalone progress has been great, it does not
compare well on a global scale — it still holds only
~4% global market share and is yet to enter the
league of international chemicals manufacturers.
While India’s chemicals market grew rapidly over
the last decade led by increasing demand, ca-
pacity creation remain muted — therefore, rising
domestic demand was fed by ever-increasing
imports, which saw a 15% CAGR. In fact, manu-
facturing capacity saw muted growth of 3.5% over
the last eight years. However, thanks to increasing
focus on value-added specialty chemicals, average
annual growth in chemicals exports was 12% while
it was 9% for chemicals exports volumes.
Indian chemicals saw a 4x jump over the last decade Indian chemicals industry is largely import dependent and local consumption oriented

7GROUND VIEW GROUND VIEW 1 - 31 October 2015 1 - 31 October 2015 6
The world chemicals industry saw steady progress to
US$ 4.20tn in 2013 from US$ 1.50tn in 2003, reflecting
an average annual growth of about ~11%. It was largely
driven by China, where chemicals sales swelled rapidly
at 27% CAGR to US$ 1.39tn in 2013 from US$ 131bn in
2003. Primarily led by Chinese progress, the centre of the
world’s chemical industry saw ‘easternisation’ during the
last decade — the share of emerging Asian markets such
as China, South Korea, India, and rest of Asia, saw their
combined chemicals market share increasing to 53% in
2013 from 23% in 2003. During the same period, China
led the chemical sales growth at 27% CAGR, followed by
Global chemical scenario – Easternisation is the key trend
South Korea and India at 13% each, and the rest of Asia
(excluding Japan) at 15%.
By contrast, annual chemicals sales by developed mar-
kets like North America, European Union, and Japan
remain muted at 2-4%. Europe, the traditional leader of
the world’s chemicals industry, gradually lost its top spot
to China. However, even as European countries lost their
traditional leadership in terms of market size, they still
maintained their leadership in terms of exports of chem-
icals, accounting for 43% of global chemicals exports.
While Europe’s technological advantage remained its key
strength, rising energy and feedstock prices proved to be
China led ‘Easternisation’ of global chemical industryChina became the undisputed leader of chemicals globally
China became the undisputed leader of chemicals globallyEU remains the world’s leading exporter of chemical

9GROUND VIEW GROUND VIEW 1 - 31 October 2015 1 - 31 October 2015 8
its Achilles’ heel, especially compared to the oil and gas-
rich Middle East and the United States.
While the global chemicals market shifted to the emerging
Asian regions from the developed western world, produc-
tion of chemicals saw ‘easternisation’ in the last decade.
Production in China saw a healthy average annual growth
of 14% in 2003-13, followed by other emerging economies
such as India at 5%, Korea at 4%, Russia at 3.5%, and Brazil
at 2%. While the developed world’s industrial competitive-
ness (particularly in Europe) came under pressure due to an
ageing population and strict environmental/health/climate
regulations, the emerging world gained from cost-effective
manufacturing, rising chemical demand led by relatively
higher economic expansion, and population growth.
Improving chemical production in the emerging markets
Emerging economies outpace advanced markets in chemical production
has already been well complemented by rising capi-
tal-spend intensity (as a % of sales). Additionally, steadily
growing R&D spending in chemicals by emerging countries
suggests continued outperformance over the developed
world.
Although China and USA are large global chemical mar-
kets, Germany leads in terms of net chemical exports, fol-
lowed by Belgium, Korea, and Japan. China and India are
net importers of chemicals. China’s net import in 2013 was
US$ 25.6bn for all chemicals and US$ 11.1bn for chemicals
excluding pharma — this implies that China’s dependency
on imported pharma products is much more than chem-
icals. On the contrary, India’s pharmaceutical exports are
stronger compared to its chemicals exports.
R&D spending by Asian countries saw rapid progress
Capital intensity of advanced countries far below emerging markets
Country (All Chem.)
Rank Net Exp ($ mn)
Country (All Chem. Ex-Pharma)
Rank Net Exp ($ mn)
Germany 1 63,278 Germany 1 33,501
Belgium 2 36,056 Japan 2 30,407
Rep. of Korea 3 26,867 Rep. Of Korea 3 29,868
Japan 4 12,786 Belgium 4 26,662
USA 5 6,628 USA 5 21,969
China (25,624) China (11,113)
India (3,920) India (13,984)
Net Export of Chemicals - 2013

9GROUND VIEW GROUND VIEW 1 - 31 October 2015 1 - 31 October 2015 8
S P E C I A L T Y C H E M I C A L S T R E N D
India’s natural disadvantage in feedstock shifted the focus to ‘specialty chemicals’
Specialty chemicals are relatively high-val-
ue, low-volume chemicals. They are
normally produced at a smaller scale
(compared to commodity chemicals)
and are sold based on their performance or
function, rather than for their composition. They
can be single-chemical entities or combinations
of several chemicals and they tend to sharply
influence the performance and processing of cus-
tomers’ products. Specialty chemicals’ products
and services need intensive knowledge, process
development, and innovation whereas com-
modity chemicals are sold strictly based on their
chemical composition — they are single-chemical
entities. The commodity chemical product of one
supplier is generally readily interchangeable with
another.
The Indian chemicals industry (highly fragment-
ed; largely represented by over 40,000 SMEs)
has a natural disadvantage in terms of feedstock
vis-à-vis the disproportionate cost advantage that
Chinese players enjoy in bulk/commodity chemi-
cals (led by their scale, provincial capital funding,
and fiscal benefits) — therefore, the Indian players
maintained their focus on small-scale, custom-
ised, value-added segments (basically, specialty
chemicals).
The Indian specialty chemicals industry (US$ 25bn)
accounts for a marginal 3% of the global specialty
chemicals market and about 20% of the overall
Indian chemicals market. Unlike the domestic
chemicals industry, which is dominated by a few
large upstream players (Reliance industries, Indian
Oil Corporation, Essar Oil), the domestic specialty
chemical industry is highly fragmented (40,000
companies) and 60% of its volume is produced by
SMEs. Most of the domestic specialty chemicals
businesses were created to meet immediate local
demand with relatively smaller investments. None-
theless, there are a select few (Aarti Industries,
Vinati Organics) for whom supply arrangements
with global chemical majors has worked wonders.
Nevertheless, due to a lack of innovation in new
products and applications, most Indian specialty
players lack connectivity with ultimate consumers
and operate as low-cost manufacturers of materials
that the MNCs deem basic for their own specialty
chemicals businesses. Hence, the Indian specialty
chemical sector is largely an intermediate-man-
ufacturing industry with its prime focus on cost
containment.
60% of India’s specialty chemcal volume is produced by SMEs
Indian specialty chemicals, like commodity chemi-
cals, is one of the fastest growing industry globally
(only after China) and delivered 13% annual aver-
age growth over the last five years to US$ 25bn
in 2014. More than exports, steadily rising local
demand supported the momentum. The industry
gained from faster GDP growth, domestic demand
attaining critical mass, low-cost manufacturing,
and enhanced focus on process R&D and engi-
neering capabilities.

11GROUND VIEW GROUND VIEW 1 - 31 October 2015 1 - 31 October 2015 10
Since the domestic industry is focused on inter-
mediate manufacturing, its growth is linked to the
progress of end-use industries. While agrochemical
ingredients represent the biggest single segment of
the Indian specialty chemicals market, followed by
paints, coatings and specialty polymers, the do-
mestic industry is particularly strong in textiles and
dyestuffs. Export of textile chemicals is an important
contributor to this industry as this segment (rep-
resented by dyes, manmade filaments, and man-
made staple fibres) is the only one that attained net
exporter status.
Composition of the Indian specialty chemicals market and target growth in respective segments
Fastest growth in Indian specialty chemicals market globally
Specialty accounts 20% Indian chemicals market

11GROUND VIEW GROUND VIEW 1 - 31 October 2015 1 - 31 October 2015 10
With the healthy double-digit growth anticipation
in user industries, the Indian specialty chemicals
market is likely to deliver 12-15% average annual
growth over FY15-20. Primarily led by ever-rising
domestic consumption, increasing disposable per
capita income, and changing life style in the coun-
try, Tata Strategic Management Group estimates
Indian specialty chemicals to emerge as the fastest
growing industry of the world and reach US$ 80-
100bn by 2023.
Polymer additives: To see over 15% compound-
ed annual growth
The Indian polymer additives market is estimated
at ~US$ 450mn and is the third-largest consumer
of polymers, only after China and the USA, with
about 6% of total market share. Polymer additives
are specialty chemicals added to base polymers to
enhance certain properties or improve processing.
The market is dominated by multinational com-
panies such as Clariant Chemicals, BASF, Lanxess,
Baerlocher, Akzo Nobel, and Dow Chemical. Major
domestic players include KLJ Group, Fine Organ-
ics, and Vision Organics. KLJ Group and Baerloch-
er India are market leaders in plasticisers and heat
stabilisers, respectively. BASF, after its acquisition
of Ciba, is the market leader in flame-retardants,
light stabilizers, and antioxidants.
The Indian polymer additive market saw 10%
CAGR over the last few years and is expected to
report >10% CAGR on a low per-capita consump-
tion base (i.e., 5kg in India vs. 12kg in China, 65kg
in EU, and 90kg in North America), increasing de-
mand of plastic in end-use segments (packaging,
construction, and automotive sectors) and rising
applications (replacing wood, metals, and glass).
Global polymer demand scenario
Mr Prabhsaran Singh, FICCI, says, “Domestic plastic-processing industry is expected to grow by more than 50%, driven by higher plastic usage in existing applications and end-use industries, to US$ 21bn by 2017-18. Polymer consumption is expected to double by 2020 and with increased demand for polymers across the country,
India is expected to become the seventh-largest consumer by 2025.”
13GROUND VIEW GROUND VIEW 1 - 31 October 2015 1 - 31 October 2015 12
Dyes & pigments segment set for accelerated
growth led by softening Chinese exports
Dyes & pigments is a leading segment of the
Indian specialty chemicals industry, as India is
a net exporter and accounts for ~15% of the
global market, second only to China. The pigment
market is largely represented by carbon black and
titanium dioxide (TiO2) and their respective target
end-users are rubber/tyre and paint industries. On
the other hand, textiles consume 60% of dyestuff
while the rest is shared by paper, leather, and
other consumer industries.
As per industry sources, the global demand for
dyes and organic pigments is forecast to increase
9% p.a. to reach 9mn tonnes with a market size
of ~US$ 24.2bn in 2015. This growth will have a
direct bearing on the domestic production of dyes
and organic pigments since a large proportion of
production is exported. On the other hand, sof-
tening Chinese exports (which account for about
one-third of global demand) due to environmental
concerns would drive accelerated growth for the
Indian colorant segment.
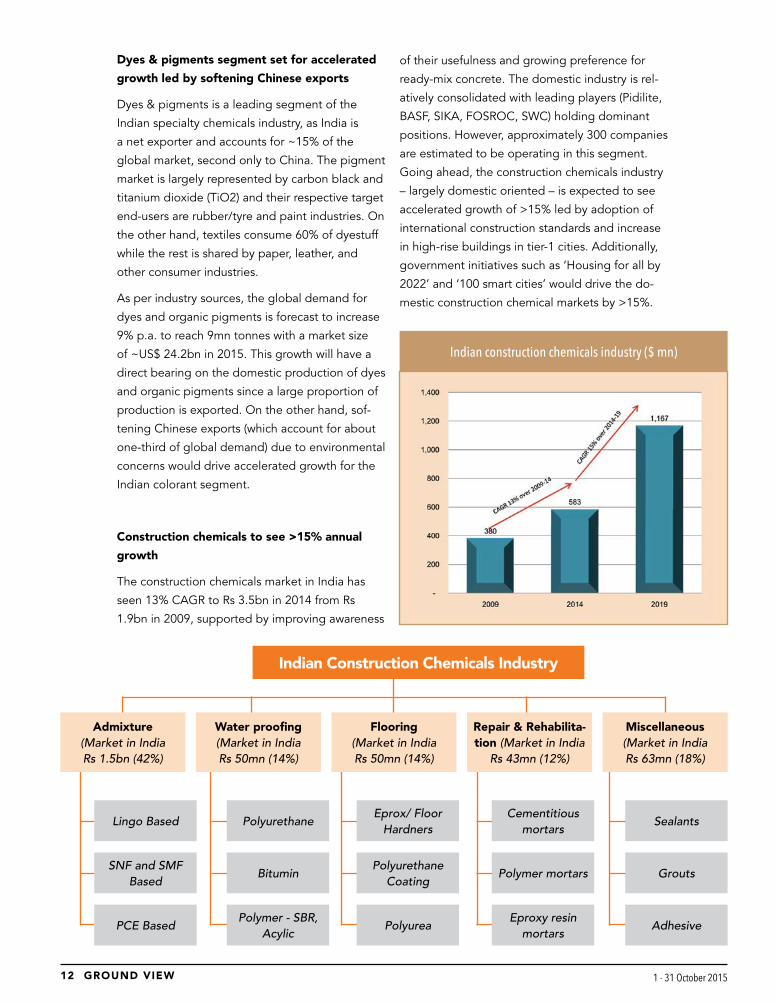
Construction chemicals to see >15% annual
growth
The construction chemicals market in India has
seen 13% CAGR to Rs 3.5bn in 2014 from Rs
1.9bn in 2009, supported by improving awareness
of their usefulness and growing preference for
ready-mix concrete. The domestic industry is rel-
atively consolidated with leading players (Pidilite,
BASF, SIKA, FOSROC, SWC) holding dominant
positions. However, approximately 300 companies
are estimated to be operating in this segment.
Going ahead, the construction chemicals industry
– largely domestic oriented – is expected to see
accelerated growth of >15% led by adoption of
international construction standards and increase
in high-rise buildings in tier-1 cities. Additionally,
government initiatives such as ‘Housing for all by
2022’ and ‘100 smart cities’ would drive the do-
mestic construction chemical markets by >15%.
Indian Construction Chemicals Industry
Admixture (Market in India Rs 1.5bn (42%)
Lingo Based PolyurethaneEprox/ Floor
HardnersCementitious
mortarsSealants
SNF and SMF Based
BituminPolyurethane
CoatingPolymer mortars Grouts
PCE BasedPolymer - SBR,
AcylicPolyurea
Eproxy resin mortars
Adhesive
Water proofing (Market in India Rs 50mn (14%)
Flooring (Market in India Rs 50mn (14%)
Repair & Rehabilita-tion (Market in India
Rs 43mn (12%)
Miscellaneous (Market in India Rs 63mn (18%)
Indian construction chemicals industry ($ mn)

13GROUND VIEW GROUND VIEW 1 - 31 October 2015 1 - 31 October 2015 12
well entrenched in the Indian industry, led by their
alliances with Indian peers and better technology.
With increasing rural demand, urbanization, and
rising industrial output, the Indian paint industry
has already reported 14% CAGR over the past four
years. Going ahead, the industry expects a shift in
favour of organized companies, due to their entry
into low-cost distempers and enamels. While sol-
vent-based enamels are still popular in India, there
is definitely a shift to water-based paints from
solvents. Keeping environment concerns in mind,
companies are coming up with new lead-free and
low-Volatile Organic Compound (VOC) products.
There is also a perceptible shift towards usage of
organic pigments in premium paints with heavy
metal pigments being phased out. With a shift in
focus to value-added products and continued rise
in rural demand and demand from urbanization,
the Indian paint industry is likely to grow at 14%
p.a. over the next five years.
Water treatment chemicals: Market to grow
with stricter government regulations
The Indian water treatment chemicals market was
at ~US$ 744mn in FY13. It experienced a 10%
CAGR from 2010 to 2013. Based on applications,
the market is classified into chemical processing,
food and beverage, metal and mining, pulp and
paper, power generation, oil and gas, and refinery.
India paints market (Rs bn)
Segment-wise Breakup of Industrial Paints Overall market Shares
Paints segment CAGR at 14% to touch US$
9.3bn in FY20
The Indian paint industry is pegged at about US$
4bn (4% of global paint market) and split between
decorative (70%) and industrial paints (30%). The
segment is crowded with the presence of both
organized and unorganized players. While the
industrial paints segment is dominated by or-
ganized players (due to the need for specialized
technology, higher capital investments, and good
relationships with institutional/industrial buyers),
the decorative segment sees competition from
unorganized players. Global paint leaders are also

15GROUND VIEW GROUND VIEW 1 - 31 October 2015 1 - 31 October 2015 14
Coagulants and flocculants, which are used to pu-
rify water by coagulating the dissolved impurities,
form the largest segment with ~37-40% market
share, followed by biocides and disinfectants with
17-19% market share. Apart from use in potable
water, the customer base is widespread across
diverse industries ranging from large power plants,
refineries, and fertilizer factories, to pharmaceuti-
cals, food and beverages, electronics, and auto-
mobile companies. The market is highly compet-
itive and participants include private companies,
MNCs, and JVs. The market for water-treatment
chemicals has seen a shift from traditional prod-
ucts to technically more advanced products.
Manufacturers are increasingly producing patent-
ed formulations with exclusive rights that offer
customized solutions in a particular market.
Around 70% of the market is dominated by the
organized sector, largely water management mul-
tinationals and large-scale domestic companies
such as Nalco Chemicals India, Thermax, and Ion
Exchange (India). These companies have a diverse
product portfolio and a strong distribution network
to cater to the Indian market. The water treatment
chemicals market is likely to see a CAGR of 10%
to reach ~US$ 1.4bn in 2020. In its 12th five-year
plan, the planning commission has earmarked an
investment of US$ 26.5bn, to ensure safe drinking
water for rural and urban areas. The plan aims to
increase focus on desalination and on ensuring en-
vironment protection through wastewater, and sol-
id and sewage treatment. Over the next five years,
the oil and gas sector is likely to be buoyant with
major government and private sector companies
expanding their plant capacities — this will boost
water consumption and the need for wastewater
treatment chemicals. Another critical success
factor could be the ‘Clean Ganga’ initiative.
Segment-wise Breakup of Water Treatment Chemicals 2013 Water Treatment Chemical Market (US$ mn)
Water Treatment Chemicals
Products Groups Applications
l Biocides and Disinfectants
l Coagulants and Flocculants
l pH Adjustors and Water Softeners
l Defoamers and Defoaming Agents
l Others
l Industrial
l Institutional
l Commercial
l Private

15GROUND VIEW GROUND VIEW 1 - 31 October 2015 1 - 31 October 2015 14
Agro-chemicals are expected to see 12% CAGR
until FY20 to reach US$ 9.3bn
The Indian crop-protection industry is estimated
to be US$ 4.25bn in FY14 and grow at a CAGR of
12% to reach US$ 9.3bn by FY20. Exports current-
ly constitute almost 50% of this industry and are
seen growing at a 16% CAGR to reach US$ 5.7bn
by FY20, thereby touching 60% share. Domestic
market is seen growing at 8% CAGR to US$ 3.6bn
by FY20, as it is predominantly monsoon depend-
ent. Globally, India is the third-largest producer of
crop-protection chemicals, after the United States,
Indian Agrochemical Industry (US$ bn) Indian Agrochem market shares of Top 10
Agrochemicals Going Off-Patent (USD bn) Pesticide consumption comparison (Kg/ha)
and Japan. While the exports of agrochemicals will
see accelerated growth led by upcoming patent
cliff (expanding the generic opportunity) and cost
advantage, the domestic market would see better
growth led by rising agrochemical consumption
and increasing demand of food grains from declin-
ing farmlands.

17GROUND VIEW GROUND VIEW 1 - 31 October 2015 1 - 31 October 2015 16
Indian Personal Care ingredients
industry
Commodity chemicals
Inactive ingredients (Market size
~US$ 290mn)
Specialty chemicals
Fine chemicals
Active ingredients (Market size
~US$ 200mn)
Exfoliators (7%)
Skin lightening (22%)
Other (33%)
Conditioning ingredients
(30%)
Anti-ageing ingredients (8%)
Surfactants (39%)
Colorants (5%)
Preservatives (5%)
Polymer ingredients
(51%)
Personal care ingredients: Rising income and
shift towards quality products to lead to 14%
annual growth
While the Indian personal-care industry (targeting
bath and shower products, hair care, skin care,
oral care, and fragrances) is estimated to be ~US$
7bn, the personal-care ingredients market is about
US$ 485mn. This market is characterized by strong
presence of MNCs such as Cognis, Dow Corning,
BASF, ISP, DSM, and Merck. Key domestic players
include Vivimed Laboratories, SAMI Labs, and
India Glycols. The market delivered 13% CAGR
over the last few years. Rising income, increased
availability, and wider product portfolio of compa-
nies has led to growth in personal-care products
and thereby personal-care ingredients. Premium
segments will show good growth potential with
increasing awareness and evolving consumers who
are ready to spend more on quality products. In-
dustry estimates peg the personal care ingredients
market growth at 14-15% to reach ~US$ 1.5bn by
2020.

17GROUND VIEW GROUND VIEW 1 - 31 October 2015 1 - 31 October 2015 16
C H I N E S E I S S U E S A N D I M P L I C A T I O N S
Environmental issues in China add zing to India’s specialty chemicals export potential
Rapid economic progress and simultane-
ous fast industrialization has certainly
made China the global leader in terms
of production, consumption, and exports
of industrial output such as chemicals. On the
other hand, blind economic/industrial expansion
and lax regulations have contributed to serious
environmental problems. Various studies indi-
cate that 16 of the world’s 20 most polluted
cities are found in China. Moreover, 20% of
China’s farmland, 16% of its overall soil, and
~60% of its groundwater is polluted. A study
by an NGO says that 1.6mn deaths in China
are caused by air pollution every year (4,000+
each day) — 17% of all deaths.
In response to these human hazards, the Chinese
Ministry of Environmental Protection (tasked
with protecting China’s air, water, and land from
pollution and contamination) has implemented
environmental protection provisions effective from
January 2015 that enforce strict penalties and
seize property of illegal environmental polluters.
There will be no upper limit on fines and more
than 300 different groups will be able to sue on
the behalf of people harmed by pollution.
Under the new law, even local governments/
provinces will be subject to discipline for failing to
Acute air pollution in Beijing force people to wear mask1.6mn deaths in China are caused by air pollution every year i.e.17% of all deaths.

19GROUND VIEW GROUND VIEW 1 - 31 October 2015 1 - 31 October 2015 18
enforce environmental laws. Regions will no longer
be judged solely on their economic progress, but
instead must balance progress with environmental
protection. Additionally, local governments will be
required to disclose environmental information to
the public.
Such policy initiatives have already resulted in a
shutdown of several major polluting industries
such as papermaking, food processing, chemi-
cals, and textiles — accounting for half the total
water-pollutant emissions in China. As a result,
Chinese exports have already softened starting
January 2015.
Mr Chen Jining, China’s Minister of Environmental
Protection, warned (in the media) about taking
further serious action against polluting industries
that fail to meet national requirements by the
end of 2016. This would lead to numerous plant
shutdowns and shifting of plants, resulting in
supply-demand imbalance in the global chemical
industry — creating an export opportunity for
Indian peers.
Mr Miao Wei, China’s industry minister, was quot-
ed by the Communist-party newspaper, People’s
Daily, as saying, “Many provinces are planning to
relocate more than 1,000 chemical plants away
from populated regions, a move which may cost
around 400bn yuan.”
“China’s chemical industry has ignored environ-
mental issues in the past. In order to have US$ 1
benefit they have destroyed environment worth
US$ 10. Now china has become more sensitive
and has to spend almost US$ 1tn per year to clean
up its environment,” says Mr Satyen Daga.
Mr Rajendra Gogri, MD, Aarti Industries says,
“Stricter environmental pollution practices in
China and consequent clampdown on inefficient
chemical plants have certainly led to import
substitution from China by many global chemicals
players. Such a scenario enhances Aarti industries’
export scope and similarly other Indian companies
should also benefit.”
Though China has been a net importer of all
chemicals put together, it is a large exporter of
various chemicals such as manmade filaments
Visible decline in Chinese export volumes (primarily chemicals) in YTD 2015
A dead fish floats in water filled with blue-green algae at the East Lake in Wuhan, Hubei province August 20, 2012
Chemical factory in Tianjin16 of the world’s 20 most polluted cities are found in China
60% of China’s groundwater is polluted

19GROUND VIEW GROUND VIEW 1 - 31 October 2015 1 - 31 October 2015 18
(worth US$ 13.1bn), manmade staple fibres (US$
9.5bn), fertilisers (US$ 5.57bn), inorganic chemicals
(US$ 4.6bn), and tanning/dyeing extracts (US$
2.2bn). Implementation of new environmental
laws in China has already caused a decline in its
chemicals exports and the trend is likely to sustain
in FY16-17, led by the enforcement of stricter en-
Chemicals (US$ mn) China Exports % share in global trade China Net Export India Net Export
Inorganic 15,026 13.9% 4592 -3634
Organic 45,444 11.5% -14974 -3620
Pharma 6,592 1.3% -11165 10064
Fertilizers 8,920 15.2% 5568 -5882
Tanning or Dyeing Extracts 6,724 8.4% 2204 1100
Miscellaneous Chemical 14,211 7.7% -2872 -445
Plastics and articles 66,793 11.9% -10760 -3762
Synthetic rubber/ factice 510 2.6% -3489 -1194
Man-made Filaments 16,879 37.8% 13097 1896
Man-made staple fibres 12,818 32.9% 9507 1559
All Chemicals 193,916 9.7% -8292 -3920
All Chemicals (Ex Pharma) 187,324 12.6% 2873 -13984
Although China is a net importer of many chemicals, its exports size in chemicals is huge — softening of these exports could multiply export growth opportunities for India
vironmental laws. Incidentally, India’s net chemical
trade with international markets is almost similar
to China (although much smaller than China’s).
Hence, the emerging trade gap due to softening
Chinese exports offers huge export opportunity
for Indian chemical players.
1978-1990 - An era of reforms and economic opening
up: The Chinese government reformed and opened to
the world in 1978. Considering the importance of the
chemicals industry, the government permitted FDI, but
maintained control. Alongside opening up, China’s do-
mestic consumption boom coupled with rapid economic
expansion was where most of the FDI inflow happened.
Most companies invested in China to produce for Chi-
nese domestic demand.
1990-2000 - Building China as a global manufacturing
hub: During this period, the Chinese government permit-
ted the entry of many MNCs into the country by forming
JVs between local firms (primarily state-owned enter-
prises) to generate export sales. Fiscal incentives, ready
common infrastructure (in terms of chemical industrial
parks), quick approvals, and facilitating land acquisition,
encouraged MNC investment in China.
Dr Rajan Venkatesh, VP at BASF says, “China created
enough demand for chemicals domestically and then
smartly bargained with global leaders for technology
collaborations, sighting the fact that China would be the
largest global customer of their chemicals. That’s how
they ensured huge flow of FDI and ultimate multiplying
growth in Chinese chemical industry”.
2000-2013 - Phase of rapid growth led by operating
leverage: With multiplying capacity expansion and gov-
ernment facilitation, China became the land of opportu-
nities with both export and domestic consumption seeing
limitless growth. FDI by chemical MNCs boomed as
China became more integrated into the world economy
and chemicals became a major Chinese export.
A case study: How China became global chemical leader

21GROUND VIEW GROUND VIEW 1 - 31 October 2015 1 - 31 October 2015 20
Various issues in China make India stand out as an alternate source
While rising chemicals demand led by rapid
economic expansion propelled China towards
becoming a choice destination for MNCs, govern-
ment facilitation and cost advantages made the
country a global manufacturing hub for chemicals
for these MNCs in the last couple of decades. The
very reasons for China’s booming chemical indus-
try are turning sour — rampant growth has started
hitting its environment in a big way and labour
cost advantages are no longer a reality.
Strategic facilitation by government agencies in
China has resulted in massive FDI flow into the
chemicals industry, but perils of subsequent exces-
sive capacity creation (i.e., rising dependency on
imported feedstock, scarcity of resources such as
energy and water), and more importantly, frequent
government intervention favouring state-owned
enterprises has become a concern for MNCs’ busi-
ness strategies from 2014.
Since China’s key advantage – low labour costs – is
no longer a reality, MNCs have already wheeled their facilities from their homeland to emerging
markets and find India (with cheap work force,
quality standards, rapid growing economy, and
good demand) a decent alternate source for man-
ufacturing chemicals.
The Indian chemicals market, which has so far
largely been driven by internal consumption,
would benefit from steady growing domestic con-
sumption on one hand, and the emerging export
opportunity due to moderating of export from
China.
China cost advantages not any more
Mr Venkat, Sr VP, BASF, says, “India has certainly emerged as an alternate source for BASF and we are already sourcing various chemical intermediates from Indian players, not only for our domestic operations, but also for global businesses — and the reliability on safety and
quality front has already been established with many Indian suppliers. Other MNCs would also have a similar experience in India. Such alliances are a win-win for both — BASF gets quality inputs at competitive costs and domestic players upgrade their manufacturing capabilities with the technical input from MNCs.”

21GROUND VIEW GROUND VIEW 1 - 31 October 2015 1 - 31 October 2015 20
Will ‘China’s pain India’s gain’ really last long?
Production disturbance in the Chinese chemicals space certainly enhances export
visibility for Indian specialty chemicals in the medium term, but Mr Satyen Daga,
MD, Daga Global Chemicals Ltd. cautions the competitive positioning of the Indian
specialty-chemicals industry vs. the Chinese ones in the long term. He says, “Chi-
nese rail connections into Europe, Saudi Arabia, and Mongolia through its huge rail
infrastructure project – Silk Route – could pose a big threat for the export competi-
tiveness of the Indian industry. While the rail link to Europe would ensure quick and
cost-effective supply of material, the link to Magnolia and the upcoming largest-ev-
er global chemical industrial park – SADARA – in Saudi Arabia would ensure quick
procurement of cost-effective input materials into China.”
Mr Venkat, Sr VP, BASF, says, “India has certainly emerged as an alternate source for BASF and we are already sourcing various chemical intermediates from Indian players, not only for our domestic operations, but also for global businesses — and the reliability on safety and
quality front has already been established with many Indian suppliers. Other MNCs would also have a similar experience in India. Such alliances are a win-win for both — BASF gets quality inputs at competitive costs and domestic players upgrade their manufacturing capabilities with the technical input from MNCs.”
China’s massive upcoming rail - Silk Route - connecting Europe and Saudi Arabia poses a threat to the cost-competitive position of the Indian specialty chemicals industry
23GROUND VIEW GROUND VIEW 1 - 31 October 2015 1 - 31 October 2015 22
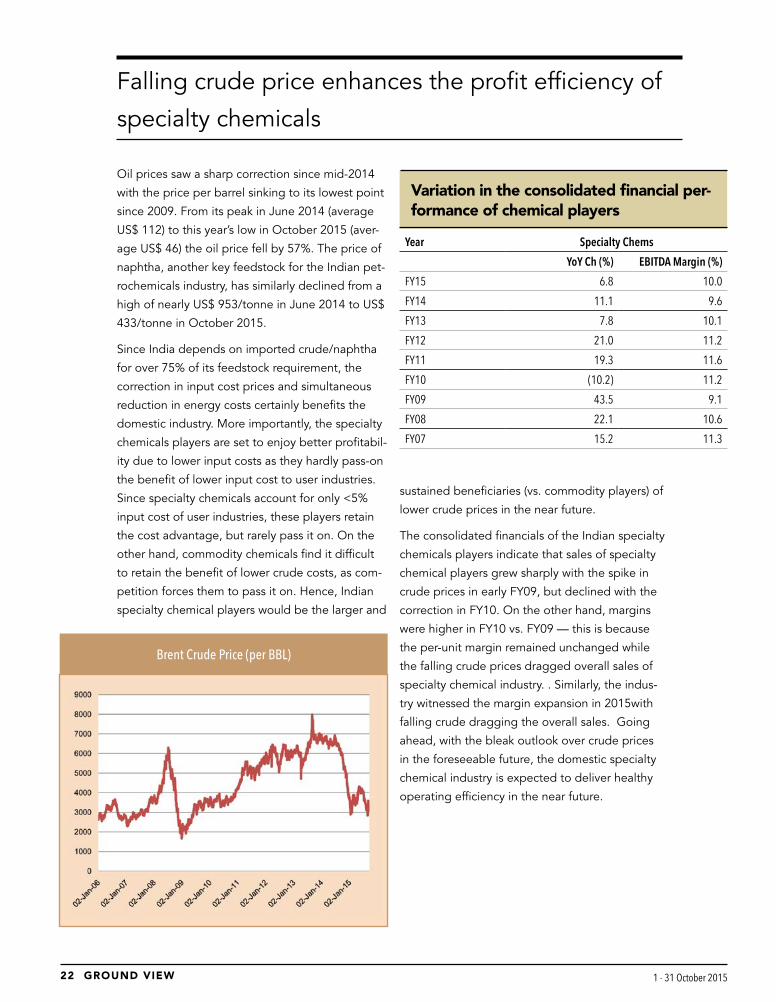
Oil prices saw a sharp correction since mid-2014
with the price per barrel sinking to its lowest point
since 2009. From its peak in June 2014 (average
US$ 112) to this year’s low in October 2015 (aver-
age US$ 46) the oil price fell by 57%. The price of
naphtha, another key feedstock for the Indian pet-
rochemicals industry, has similarly declined from a
high of nearly US$ 953/tonne in June 2014 to US$
433/tonne in October 2015.
Since India depends on imported crude/naphtha
for over 75% of its feedstock requirement, the
correction in input cost prices and simultaneous
reduction in energy costs certainly benefits the
domestic industry. More importantly, the specialty
chemicals players are set to enjoy better profitabil-
ity due to lower input costs as they hardly pass-on
the benefit of lower input cost to user industries.
Since specialty chemicals account for only <5%
input cost of user industries, these players retain
the cost advantage, but rarely pass it on. On the
other hand, commodity chemicals find it difficult
to retain the benefit of lower crude costs, as com-
petition forces them to pass it on. Hence, Indian
specialty chemical players would be the larger and
sustained beneficiaries (vs. commodity players) of
lower crude prices in the near future.
The consolidated financials of the Indian specialty
chemicals players indicate that sales of specialty
chemical players grew sharply with the spike in
crude prices in early FY09, but declined with the
correction in FY10. On the other hand, margins
were higher in FY10 vs. FY09 — this is because
the per-unit margin remained unchanged while
the falling crude prices dragged overall sales of
specialty chemical industry. . Similarly, the indus-
try witnessed the margin expansion in 2015with
falling crude dragging the overall sales. Going
ahead, with the bleak outlook over crude prices
in the foreseeable future, the domestic specialty
chemical industry is expected to deliver healthy
operating efficiency in the near future.
Falling crude price enhances the profit efficiency of
specialty chemicals
Brent Crude Price (per BBL)
Year Specialty Chems
YoY Ch (%) EBITDA Margin (%)
FY15 6.8 10.0
FY14 11.1 9.6
FY13 7.8 10.1
FY12 21.0 11.2
FY11 19.3 11.6
FY10 (10.2) 11.2
FY09 43.5 9.1
FY08 22.1 10.6
FY07 15.2 11.3
Variation in the consolidated financial per-formance of chemical players

23GROUND VIEW GROUND VIEW 1 - 31 October 2015 1 - 31 October 2015 22
“ M A K E I N I N D I A” C O M P L E M E N T S
Government’s Make-in-India initiatives to address key hurdles for Indian specialty chemicals
The Indian specialty chemicals sector has
come a long way in the last seven dec-
ades or so — it has grown from a small-
scale sector to a multi-dimensional one,
which is taking on the challenges of globalization.
The sector now holds a recognised position in
the global map; however, India’s disadvantage in
feedstock position and lack of adequate infra-
structure hinders its progress into the big league.
“The Indian chemicals industry either uses natural
gas or crude oil as feedstock for manufacturing
and these constitute a major portion of cost of
production (30-60%). India imports nearly 76% of
its crude oil requirements. Fluctuations in oil prices
affects the growth projections of chemicals man-
ufacturers — at times they are unable to pass-on
the cost escalation (due to sudden increase in oil
prices) to end consumers,” says Mr Prabhsharan
Singh, Head, Chemicals & Petrochemicals Division,
FICCI.
The other big deterrent in the growth of the Indian
chemicals industry is inadequate infrastructure
or lack of common infrastructure. Due to its very
nature, the chemicals/petrochemicals industry
requires certain basic infrastructure facilities such
as common-effluent treatment plants, an effective
green belt segregating the chemical units from
the human habitat, a good port with a chemical
storage terminal, and adequate berthing facilities.
At present, each unit has to create specialised
facilities on its own, which leads to duplication of
efforts and investment that impacts the earning
efficiency of the Indian chemicals industry that is
largely represented by small and medium enter-
prises.
Import dependency in feedstock is one of the key hurdles for the domestic industry growth

25GROUND VIEW GROUND VIEW 1 - 31 October 2015 1 - 31 October 2015 24
More often, the scale of the Indian chemicals
industry is believed to be one of the key restricting
factors in domestic market growth. The industry
is highly fragmented — with over 40,000 units in
small-scale sectors and spread over various parts
of the country. Installed capacities in most of these
units are much smaller than global scales, which
puts them in a disadvantageous position while
tapping export opportunities where large volumes
and operating efficiency is almost always a must.
Mr Sanjay Chaturvedi, Ex-Strategy Director, Rohm
and Haas, has a different take on the challenges
that the industry faces. He believes that the root
cause of weakness in India’s specialty chemi-
cals industry is lack of technical talent. Specialty
chemicals is an application-driven industry and it
requires an integrated team of material scientists,
chemical engineers, and chemists — which India
lacks. He also believes that another key concern
is that the Indian entrepreneur lacks a ‘global’
mind-set.
Mr Chaturvedi feels that chemicals is a knowl-
edge-based industry and the areas for R&D in-
clude improvements in the manufacturing process
for reduction in cost of production, application
development to diversify demand, and new-prod-
uct development. The level of R&D investments in
the Indian chemical sector is low at around 0.3%
of total sales and this is mainly concentrated on
process development by local players. Thus, India
does not have even a single application-testing
centre.
However, the government’s “Make-in-India”
initiatives such as (1) setting up of reverse SEZs
in feedstock-rich countries of the Middle-East, (2)
formation of industrial clusters with common infra-
structure, (3) facilitation for innovation in chem-
icals, and (4) establishing specialized vocation-
al-training centres coupled with a continuous focus
on green technology in chemicals are likely to
address the age-old hurdles that Indian specialty
chemicals industry has faced.
In its drive to make India a global manufacturing hub for
chemicals, the Indian government has already made the
following initiatives under its Make-in-India campaign,
which complements the growth of the Indian specialty
chemicals industry:
l Industrial licensing has been abolished for most
sub-sectors except for certain hazardous chemicals.
l 100% FDI is allowed under the automatic route in
the chemicals sector, subject to all the applicable
regulations and laws.
l The government is continuously reducing the list of
reserved chemical items for production in the small-
scale sector, thereby facilitating greater investment
in technology upgradation and modernisation.
l Policies have been initiated to set up integrated pe-
troleum, chemicals, and Petrochemicals Investment
Regions (PCPIRs will be investment regions spread
across 250 square kilometres for manufacturing
domestic and export-related products of petroleum,
chemicals, and petrochemicals).
Strategies Proposed to be executed until 2017:
l Implementation of strategy for sourcing and alloca-
tion of feedstock. Government is evaluating the pro-
posal of setting up “reverse SEZ” in the feedstock
rich country of the Middle-East to meet India’s future
feedstock requirement.
l Development of an innovation roadmap for chem-
icals sector and setting up of R&D fund under PPP
model.
l Focus on green and sustainable technologies and
reducing the environmental impact of the sector.
l Augmenting existing testing centres to act as certi-
fying agencies for testing plastic products and raw
materials to meet BIS standards.
l Establishing specialized vocational training centres
in clusters for the chemicals industry.
l Formation of industrial clusters/plastic parks of
world-class quality.
Make-in-India campaign to complement the industry growth well

25GROUND VIEW GROUND VIEW 1 - 31 October 2015 1 - 31 October 2015 24
C O N C L U S I O N
Indian specialty chemicals is set for accelerated growth
Although the Indian specialty chemicals industry
has come a long way, it remains at a relatively
early stage of development. However, the cur-
rent outlook for Indian specialty chemicals is at
its best for an accelerated and quality growth led by steady
domestic demand, emergence of conducive export oppor-
tunity led by Chinese environment issues and enhanced
facilitation by government initiatives.
While the healthy track record of double-digit growth in do-
mestic demand for specialty chemicals has already attracted
global MNCs into India, the entry of more such MNCs will
intensify competition for small and inefficient local players,
making their survival difficult. Hence, the industry should
see gradual but definite consolidation, leading to qualitative
growth.
On the other hand, rising population with lowest per-capita
consumption of chemicals in the country and India’s relatively
strong GDP growth outlook (7-8% over the next few years) in-
dicates strong potential for India’s chemicals demand. As per
industry estimates, India’s specialty chemicals market should
deliver strongest annual growth in the world (outpacing even
China’s) over the next five years.
Additionally, favourable business initiatives by the Indian
government — in chemicals infrastructure development,
facilitating international investment, and the Make in India
campaign — give visibility. With the government’s focus on
creating a conducive business environment, capex into the
Indian chemicals sector has already seen a 52% yoy jump
to Rs 1.46tn in 2014 and FDI into the sector has jumped
by 49% yoy in FY15 to US$ 4bn (DIPP). Such capacity
creation, along with China’s exports softening and global
peers looking at India as an alternate source of specialty
chemicals, enhances the growth visibility this industry.
Dr Rajan says, “BASF is convinced about the growth of the
Indian specialty chemicals industry and that it can grow
more and faster, which is evidenced from our commitment
to the country. BASF is already setting up a huge plant in
Dahej, Gujarat, with an investment of Rs 10bn. A new plant is
coming up in Chennai for automotive catalyst business. We
are setting up two other plants for the construction chemicals
business. Additionally, BASF is setting up its global R&D/
innovation campus in Mumbai. Such initiatives indicate the
growth potential of Indian specialty chemicals”.
“We are set to establish highly advanced technologies
leading to the creation of a robust system across platforms,
for example, upgraded technical-service labs to modernise
manufacturing practices, leading to tailor-made products and
services. This will further reinforce our commitment towards
the specialty chemicals business in India and bring us closer
to offering innovative and customised solutions for our cus-
tomers,” says Dr Deepak Parikh, Vice-Chairman & Managing
Director, Clariant India.
The recent upgrading of India’s rank in terms of ‘ease of do-
ing business in the world’ to 52nd from 76th, at a time when
global MNCs are feeling the heat of excessive government
intervention in Chinese chemicals industry, would further
India stands out as the fastest growing specialty chemical market in the world till 2020

27GROUND VIEW GROUND VIEW 1 - 31 October 2015 1 - 31 October 2015 26
drive FDI flows into Indian chemicals. Indian spe-
cialty chemicals industry is all set for accelerated
growth over the next decade compared with its
historical growth of 11-14%.
Mr Manish Phanchal, Chemicals Head, Tata
Strategic Management Group says, “The Make
in India campaign is a key initiative of the current
government, which aims to make India a global
manufacturing hub. We expect the Indian specialty
chemical market to grow at 15-18% per annum
in FY14-20 and majority of it will be catered to
by domestic production. Additionally, the entry
of more and more MNCs into the country with an
intention of tapping domestic demand and as an
alternate source of intermediates to China would
further scale up the domestic industry. That is
how India would gain prominence in the global
specialty chemicals industry like it earned in the
pharmaceutical world.”
Scalability and efficiency to drive value growth
of Indian chemicals peers
While the Indian specialty chemicals market is larg-
er (US$ 25bn) than the domestic pharma market
(US$ 15bn), it is relatively less preferred by inves-
tors, primarily due to lack of scale and/or lower
operational efficiency. Domestic specialty chemi-
cals are highly fragmented — there are about 40
listed specialty companies with consolidated sales
about US$ 8bn, representing just about 30% of
the total market.
Although the Indian specialty chemicals market is
well represented by global MNCs (BASF, Clariant,
Dow Chemical, Huntsman, Akzonobel, Mitsubishi
Chemical Corp, Croda, Du Pont, Henkel, Wacker,
Evonik, Syngenta, Solvay), barely a handful of
companies are large. Among the listed names,
BASF, SRF, Pidilite, Gujarat Flurochem, Aarti Indus-
tries, and Atul have sales in excess of Rs 250bn.
While Indian specialty chemicals should see accel-
erated growth, it is scalability and efficiency (led
by R&D process/product/application) that would
drive progress, as increasing competition from
MNCs will pose a challenge for Indian companies.
Considering the highly fragmented nature and
smaller scale of Indian specialty chemicals players,
it is best to segregate them in terms of peers with
sales of >Rs 5bn and with sales Rs 1.5-5.0bn with
efficiency defined in terms of EBITDA margin of
>15% and ROCE/ROE of > 20%.
Efficient names among listed specialty players
with revenues of over Rs 5bn are Vinati Organ-
ics, Aarti Industries, Atul, Sharda Crop, Pidil-
ite, Solar Industries, and Camlin. In this block,
peers such as SRF and Gujarat FluoroChemicals,
whose ROCEs dropped below 20% due to large
capex, would mainly benefit from on-going
emergence for special fluoro-chemistry capabil-
ity, thereby enhancing their earning efficiency.
On the other hand, listed MNC majors such as
BASF and Clariant fall in the bracket of ineffi-
ciency due to major capex and high overheads.
Efficient names among listed specialty play-
ers with revenues between Rs 1.5-5bn are –
Alkylamane, OCCL, Dai-Ichi Karkaria, Foseco,
Ultramarine, and Adi Fine Chem. Efficient listed
commodity chemicals players with revenues
over Rs 3bn are – Bodal Chemical, Vishnu
Chemical, Bhageria, Elantas Beck, Poddar Pig-
ment, Transpek, and Indo Borax.
Mr Manish Phanchal, Chemicals Head, Tata Strategic Management Group says, “Indian specialty chemical market to grow at 15-18% per annum in FY14-20 and majority of it will be catered to by domestic production”

27GROUND VIEW GROUND VIEW 1 - 31 October 2015 1 - 31 October 2015 26
Positioning of Indian Specialty Chemicals peers (FY15 sales Rs 1.5-5.0bn) based on scale and efficiency
Positioning of Indian Specialty Chemicals peers (FY15 sales >Rs 5bn) based on scale and efficiency Mr Manish Phanchal, Chemicals Head, Tata Strategic Management Group says, “Indian specialty chemical market to grow at 15-18% per annum in FY14-20 and majority of it will be catered to by domestic production”

29GROUND VIEW GROUND VIEW 1 - 31 October 2015 1 - 31 October 2015 28
Positioning of Indian commodity chemicals peers (FY15 sales >Rs 3bn) based on scale and efficiency

29GROUND VIEW GROUND VIEW 1 - 31 October 2015 1 - 31 October 2015 28
In the context of a slump in crude prices and bleak
near-term outlook, how have the dynamics of the global
chemicals industry changed; also, what is the impact on
the Indian chemicals industry?
The current fall in oil prices is primarily due to oversupply
rather than weak demand. Based on our analysis, supply-in-
duced oil price declines have coincided with robust growth
in the chemicals sector while demand-induced declines
have coincided with declines in chemical-industry growth.
Lower oil prices have reduced the industry’s input costs,
which some companies will be able to retain in higher
gross profit. Specialized products that have demonstrated
strong historical pricing power (such as paints and coat-
ings) will see the strongest margin improvement because
of lower oil prices, while commodity chemicals will be the
least to gain.
Chemical imports have grown five times faster than
domestic production in FY06-14. Do you see domestic
chemical production scaling up meaningfully and India
becoming self-sufficient? Also, can India become a
global manufacturing hub in chemicals, and if so, what
can drive this?
India is short of many critical feedstock that are needed to
drive downstream domestic production. For example, eth-
ylene and propylene, which are the basic building blocks
for many downstream chemicals are majorly (90%) used
for manufacturing bulk plastics. Feedstock is much cheap-
er in the Middle East — so petrochemical intermediates
produced there are cheaper. Hence, import dependency is
here to stay. This, along with other factors, has led to more
investments in the chemical sector in the Middle East, Chi-
na, and Singapore in the last five years, compared to India.
However, just like the pharma sector, we expect the special-
ty-chemical industry in India to scale up rapidly in the next
five years. India has the potential to become a manufac-
turing hub of specialty chemicals. We expect the Indian
specialty chemical market to grow at 12-15% p.a. between
FY14-20 and most of it will be catered to by domestic
production.
Do you see any progress in the Make-in-India campaign;
any progress for the Indian chemicals sector? How
would challenges (long approval process, high cost of
production, availability of feedstock, infrastructure,
taxation issues, land and labour issues) be addressed?
The campaign is a key initiative of the current government
and its aim is to make India a global manufacturing hub.
We expect the chemical sector to gain immensely from
this campaign, as solid steps are being taken to pro-
mote chemical manufacturing in India. For example, coal
gasification for making fertilisers, Reverse SEZ, removal
I N T E R V I E W
India’s specialty chemicals market will grow at 12-15% p.a. between FY14-20 and most of it will be catered to by domestic production
Manish Panchal, Practice Head Chemicals TATA Strategic Management Group

31GROUND VIEW GROUND VIEW 1 - 31 October 2015 1 - 31 October 2015 30
of industrial licensing for most sub-sectors except certain
hazardous chemicals are steps taken in this direction. The
government’s target is to up India’s ranking in the Ease Of
Doing Business Index to #50 (from current #142) in the next
two years! We are optimistic that these challenges that the
industry is facing will moderate in the next 2-3 years.
Do you see a contract-manufacturing opportunity for
Indian chemicals players under Make in India?
Yes, this is true in case of knowledge chemicals. Large
chemical companies want to focus on their core activities
and are therefore outsourcing the manufacturing of certain
chemicals to Indian manufacturers. With incentives under
Make in India for industry/private-sponsored research pro-
grams, we expect more outsourcing of research programs
as well. With high-cost operations in the USA and Europe,
the focus is gradually shifting to India due to India’s better
IPR regime compared to China, cost advantage, and availa-
bility of technical manpower at low cost.
Do MNCs see India as a target market for their chemi-
cal business, or a sourcing point? Do you see any trend
emerging for cross-border alliances for the Indian chem-
icals industry?
We can divide chemicals MNCs into two categories - MNCs
with strong presence in India and MNCs with limited
presence. MNCs having a strong presence are looking to
increase market penetration and using India as an export/
sourcing hub. Most of these MNCs also have R&D centres
in India. MNCs with limited presence (mostly indent sales)
are looking at both organic and inorganic growth options.
Indian chemical industry saw three-fold growth vs.122%
growth in the global market in 2005-13. Is this an
indication of rising value play by the domestic industry
or higher focus on specialty chemicals rather than bulk/
commodity chemicals? What is your outlook for the
Indian specialty chemical industry and what would drive
growth?
There are still challenges associated with manufacturing of
bulk chemicals in India like availability of feedstock, cheap-
er imports from neighbouring geographies, high interest
rates, and infrastructure problems. However, the Indian
specialty chemicals industry is in for multi-fold growth in
the next five years. Our per capita consumption of most
specialty chemicals is among the lowest in the world. We
expect this industry to reach US$85-100bnby 2025 (cur-
rently US$ 25bn). Agro chem/paint and coatings/polymers
will continue to lead the pack. However, with government
initiatives such as Swachh Bharat Abhiyan, Clean Ganga
Project,and Smart Cities, demand for some other special-
ty-chemicals segments (water treatment chemicals, home
care surfactants, construction chemicals) will grow at high-
er rates in the next five years.
What is your assessment of the Indian specialty-chemi-
cals market in comparison to China?
Growth in demand for specialty chemicals in India will
not only depend on the growth of end-use industries, but
also on product penetration (consumption per capita) and
specifications &standards. Specialty chemicals penetration
in India is much lower compared to China. For example,
spending on concrete admixtures in India is US$1.5/m3
compared US$3/m3in China. Other key growth drivers
of the Indian specialty chemicals industry include strong
R&D capabilities, low-cost manufacturing, and improving
standards. On the downside, it is still a highly fragmented
industry. However, we expect it to consolidate in the next
decade.
Do you see a trend of Chinese import substitution in
specialty chemicals? If so, and would that boost Indian
specialty chemicals peers’ exports? How would the
on-going currency devaluation by China impact the
global speciality chemicalstrade?
Increasing cost of labour and power, and tightening
pollution control norms, have diluted the cost advantages
enjoyed by the Chinese specialty-chemical manufacturers.
Devaluation of Chinese Yuan will help Chinese exporters in
the medium term, but in the long term, India is in a strong
position to capture considerable share of global specialty
chemical exports.
What has really made China the global leader (in all
respects— consumption, production, exports and im-
ports) in the global chemicals space? How India is dif-

31GROUND VIEW GROUND VIEW 1 - 31 October 2015 1 - 31 October 2015 30
ferent from China and what would catapult the growth
of the Indian chemicalsindustry?
The main reasons why the chemical industry in China flour-
ished are ease of acquiring land for world scale plants, tax
incentives, promotion of chemical exports by establishing
export zones with hi-tech infrastructure, and availability
of capital at subsidized interest rates. India is a consump-
tion-driven economy, which holds true for the chemicalsin-
dustry too —we have vibrant downstream industries in
different segments. Also, India has the advantage of being
close to ME where feedstock is cheaper. We have a strong
R&D base and have the capability to produce world-class
products. We also have strong presence in the export mar-
ket in sub segments such as dyes, pharma, and agrochem-
icals. We can expect more such segments to be added in
that list in the next 5-7 years.
It seems the knowledge paper of “Reverse SEZ” by
FICCI has captured a special interest of the govern-
ment. Could you update us on the initiatives?
Reverse SEZ concept was developed mainly to address
our feedstock challenges. The basic idea is to develop
SEZs in countries where raw material is available in abun-
dance and at a lower price. For example, price of gas in
Iran is US$2.5/mmBtu compared to US$4.66/mmBtu in
India. These SEZs can be used to manufacture chemical
feedstock, which can be sent to India for further value
addition. The department of chemicals has proposed a
reverse SEZ in Chabahar Port area (Iran) for manufactur-
ing industrial chemicals. We can expect similar activity in
Myanmar, Mozambique, etc., in the next 2-3 years.
Indian specialty chemicals industry is highly fragment-
ed with large number of marginal players. Do you see
enhanced consolidation amongst local players and do
you expect meaningful M&A by global leaders in the
Indian specialty chemicals sector?
M&A has been playing a critical role in shaping the Indian
specialty chemicals industry — in the last five years, sev-
eral large- and medium-sized global specialty chemicals
companies have used the acquisition route to establish
their presence in India. For example, in 2013 alone, there
were 34 deals in the Indian chemical industry with an
estimated value of US$ 2.2bn. This trend may get more
Several companies have used the M&A route to aggressively grow their business in India

33GROUND VIEW GROUND VIEW 1 - 31 October 2015 1 - 31 October 2015 32
Parameter Challenges Actions taken so far
Infrastructure Poor connectivity by road, rail, and water 7,900km of highway projects awarded till March 2015 and corporatiza-tion of public ports for improving its efficiency have been proposed
Power shortage Coal blocks and spectrum allocated transparently through auctions
Regulations & Licenses Too many and complex regulations Target to increase India’s ranking in ‘ease of doing business index’ to #50 in the next two years
Multiple licenses / certificates are required to operate a plant in India
Industrial licensing has been abolished for most sub-sectors except in hazardous chemicals
Availability of Feedstock Lack of adequate feedstock (higher cost and unavailability)
Gas prices linked to international prices. Will bring in investment to explore and increase supplies
Reverse SEZ concept is being actively considered
Complex tax system Inverted duty structure Customs duty on basic chemicals like ethane propane, propylene, reduced to 2.5%from 5%
Multiple taxes Consensus arrived with states for amending constitution to implement GST (if implemented can contribute 2% to GDP growth)
Integrated Chemical Parks Cumbersome land acquisition process Centre to permit states to make changes to the Land Acquisition Act
Slow implementation of PCPIRs More investment planned to develop PCPIR’s faster
What are the challenges faced by the industry and what has the government done to address those?
About TATA Strategic Management Group (TSMG)
TSMG is a division of TATA Industries Ltd. TSMG was established in 1991 and since then has helped over 500 cli-
ents to grow their business in India and worldwide. It supports clients with a wide spectrum of benefit realization
offerings including strategy formulation, product portfolio analysis, integrated cost reduction, supply chain trans-
formation, strategic sourcing and organizational alignment. Its client’s portfolio includes companies like Sabic, DSM,
DuPont, Lanxess, Evonik, Merck, Pfizer, ACC, Aditya Birla Chemicals, Corning, Akzo Nobel, GE, Toshiba, Mitsubishi,
Godrej Chemicals, TATA Chemicals, Rallis, Ecolab, Vopak, Maersk, Stolt-Nielsen, Yamato, Sony, and many more.
pronounced provided companies adopt a proactive ap-
proach to M&A. Faster speed to market, stronger value chain
presence, and product-portfolio optimization will be the key
reason for companies to take the M&A route in the specialty
chemicals space.
If the government is able to implement GST in April
2016, how will it affect the Indian chemicals sector and
more importantly, the specialty chemicals sector?
Implementation of the GST will have a significant impact and
will change the manner in which business is carried out. The
application of a single tax rate across all goods and service
will result in redistribution of taxes across all categories. This
will lead to a reduction in taxes on manufactured goods,
thereby impacting pricing of the final product. Unified
GST will have favourable effect on logistics cost and
transit time.
The biggest advantage to the industry would be that of
reduction in transaction cost, with an immediate impact
coming from the discontinuance of CST. Multi-stage taxa-
tion, along with an inability to take full benefit of CENVAT
credit/refund, has been an issue for the industry. With
central GST expected to be single rate for goods and
services, going forward, credit accumulation may not be
an area of concern. An additional boost to the industry is
if the legislation provides for carrying forward of unuti-
lized credit.

33GROUND VIEW GROUND VIEW 1 - 31 October 2015 1 - 31 October 2015 32
Rank Company Chemical sales ($ mn)
Chemical sales as % of total sales
Headquarters country
Chemical operat-ing profits ($ mn)
Operating profit margin
Operating return on chemical assets
1 BASF 78,698 79.6 Germany 7,896 10 10.3
2 Dow Chemical 58,167 100 U.S. 5,950 10.2 8.6
3 Sinopec 57,953 12.8 China –351 def def
4 SABIC 43,341 86.4 Saudi Arabia 12,033 27.8 14.3
5 ExxonMobil 38,178 9.7 U.S. 5,705 14.9 20.9
6 Formosa Plasticse 37,059 60.4 Taiwan 1,592 4.3 3.7
7 LyondellBasell Industries 34,839 76.4 Netherlands na na na
8 DuPont 29,945 86.2 U.S. 6,184 20.7 32.7
9 Ineos 29,652 100 Switzerland 2,768 9.3 na
10 Bayer 28,120 50.1 Germany 4,717 16.8 16.1
11 Mitsubishi Chemical 26,342 76.2 Japan 870 3.3 3
12 Shell 24,607 5.8 Netherlands na na na
13 LG Chem 21,456 100 South Korea 1,656 7.7 9.6
14 Braskem 19,578 100 Brazil 1,475 7.5 7
15 Air Liquide 19,210 94.1 France 3,688 19.2 11.6
16 AkzoNobel 19,011 100 Netherlands 1,426 7.5 6.6
17 Linde 18,593 82 Germany 5,100 27.4 na
18 Sumitomo Chemical 17,833 79.3 Japan 1,041 5.8 6
19 Mitsui Chemicals 17,201 100 Japan 454 2.6 3.6
20 Evonik Industries 17,177 100 Germany 1,737 10.1 8.3
21 Toray Industries 17,006 89.4 Japan 1,231 7.2 6.3
22 Reliance Industries 15,870 25.8 India 1,359 8.6 14
23 Yara 15,141 100 Norway 2,217 14.6 12.5
24 PPG Industries 14,250 92.8 U.S. 2,156 15.1 15
25 Solvay 14,134 100 Belgium 1,445 10.2 6.1
Positioning of top 50 global chemical players based on 2014 operational performance (contd.)

35GROUND VIEW GROUND VIEW 1 - 31 October 2015 1 - 31 October 2015 34
Positioning of top 50 global chemical players based on 2014 operational performance
Rank Company Chemical sales ($ mn)
Chemical sales as % of total sales
Headquarters country
Chemical operat-ing profits ($ mn)
Operating profit margin
Operating return on chemical assets
26 Lotte Chemical 14,121 100 South Korea 333 2.4 3.4
27 Chevron Phillips Chemical 13,416 100 U.S. na na na
28 DSM 12,344 100 Netherlands 339 2.7 2.1
29 Praxair 12,273 100 U.S. 3,907 31.8 19.7
30 SK Innovation 12,011 19.2 South Korea 341 2.8 na
31 Shin–Etsu Chemical 11,874 100 Japan 1,753 14.8 7.6
32 Huntsman Corp. 11,578 100 U.S. 787 6.8 7.2
33 Syngenta 11,286 74.6 Switzerland na na na
34 Borealis 11,076 100 Austria 326 2.9 2.9
35 Lanxess 10,646 100 Germany 543 5.1 5.6
36 Asahi Kasei 10,628 55.4 Japan 746 7 8
37 Sasol 10,299 55.1 South Africa 775 7.5 8.2
38 Air Products & Chemicals 9,989 95.7 U.S. 1,582 15.8 10
39 Eastman Chemical 9,527 100 U.S. 1,239 13 7.7
40 PTT Global Chemical 9,522 53.8 Thailand 1,038 10.9 11.2
41 Mosaic 9,056 100 U.S. 1,544 17.1 8.4
42 DIC 8,218 100 Japan 434 5.3 5.7
43 Arkema 7,915 100 France 594 7.5 6.6
44 Tosoh 7,657 100 Japan 486 6.3 6.7
45 Hanwha Chemical 7,655 100 Korea 134 1.8 1.1
46 Siam Cement 7,617 50.7 Thailand 481 6.3 8.5
47 Indorama 7,514 100 Thailand 161 2.1 2.7
48 BP 7,284 2.1 U.K. na na na
49 Ecolab 7,215 50.5 U.S. na na na
50 Johnson Matthey 7,203 43.4 U.K. 675 9.4 16.7

35GROUND VIEW GROUND VIEW 1 - 31 October 2015 1 - 31 October 2015 34
A year ago, my then 2.5 year old came
running to me and told me what
he had learnt in school -- there are
seven continents. It was cute. I was
left wondering - he has no idea what a continent
is and he hasn’t mastered the concept of enumer-
ation so even “7” is not exactly what he under-
stands well.
Then I realized that “understanding well”, like
everything in life, is a relative term and there are
limits to knowledge because of sheer lack of a
requisite background understanding, lack of time,
and most important of all - what we know is mostly
enough to serve our goals.
This idea applies to investing as well. I
first realized it when a very senior inves-
tor once told me about his big position
in TCS and said that sell side doesn’t
add much value and it’s all about the
management’s capability and integrity -
effectively indicating that trust is much
more important because knowledge
has limits. The more I thought about it,
the more I realized that people can’t be
investing hundreds of millions in say an
HDFC because an excel sheet indi-
cates it. It’s to do with trust in people and in their
passion.
I realized more about the limits of knowledge
when I was trying to do a new product series
with an aim of providing a bit thorough technical
details of products that research analysts generally
don’t touch upon.
I did a note on Siemen’s Signalling Systems, one
on basics of Titanium Forging in context of BHFC
and another on Waste Heat Recovery System in
cement plants. I was planning to do one on FAG
vs. SKF vs. NRB Bearings and that’s where I hit a
Limits of knowledge and
Value of TrustBY VARUN KUMAR

37GROUND VIEW GROUND VIEW 1 - 31 October 2015 1 - 31 October 2015 36
serious roadblock. It is incredibly hard to under-
stand the intricacies of different types of bearings
- what kind of loading they support, which is best
for axial load and which is best for radial load,
how they are being designed or manufactured
and where the critical challenges in new product
development are, and which company is focusing
on which area. Inspite of having done 1-2 courses
in Bearings Design in my IIT days, I failed to “un-
derstand well” how FAG is better than SKF or the
other way around.
A similar thing happened in Cummins when I tried
to learn more about the company vs. KOEL. The
products are so specialized that the background
knowledge base needed to understand product
competitiveness well is extremely thorough.
These roadblocks exist in understanding every
business and that is where I think the limits to
knowledge lie. We, as investors, aren’t equipped
with knowledge -- and time -- to understand well
so much diverse industries, engineering streams,
technology trends, consumer preferences in 100
segments, product designs, market dynamics etc.
We work with a bigger picture and that is where
the value of trust and passion comes in. Investing
is a team work and ultimately the promoters/CEOs
of companies are the real team for an investor -
one that fills the knowledge gaps or from a differ-
ent perspective - and brings complementary skills.
That’s where the value of trust lies. Trust in the
passion and ability of the people who are running
the firm, trust in the history of the franchise, trust
in their core values and outlook towards business,
towards minority shareholders etc.
The trust in the history of franchise of SKF makes
us believe, with reasonable confidence, that they
know how to design new products, how to run a
profitable franchise and be competitive. If we are
comfortable with market opportunities, we can be
comfortable in investing.
Same applies to say a Cummins. We trust in their
history, their global leadership and are comforta-
ble to extrapolate that going ahead. We trust their
management, the management’s commitment and
integrity and that I think plays the bigger part in
investing decision rather than how exactly their
new inlet valve system, driven by electronically
timed Cam mechanisms does a better job than
KOEL where Cam mechanisms are hydraulically
operated [I made that part up by the way].
A big part of investing decisions are based on
presence of Mr Parekh, Mr Puri, Mr Siddharth Lal,
Mr Murthy, Mr Uday Kotak, Ms Shikha Sharma,
Mr Adi Godrej, Mr Varun Berry, Mr Sobti and Mr
Sikka etc in their respective firms. The world works
in amazingly simple ways - it is just the people.
And it should be that way. People evolved before
businesses. And the interesting thing about trust,
as a senior client told me, is that it is earned, can
be examined and even intelligently analyzed. That
point makes investing a tad little easy.

37GROUND VIEW GROUND VIEW 1 - 31 October 2015 1 - 31 October 2015 36
Nitin Ghadiyar
Nitin Ghadiyar has over 35 years of experience in Leadership and
Head of Company positions in leading pharmaceutical and con-
sumer-product companies such as Colgate Palmolive, Parke-Da-
vis, Reckitt Piramal, Johnson & Johnson, Dabur and Strides
Arcolabs. He has made a significant contribution in building over
20 national brands in the FMCG and Health Care segments. He is
a graduate in Economics and Statistics from St. Xavier’s College,
Mumbai, and a Post Graduate Management from the Jamnalal
Bajaj Institute, also in Mumbai, with a specialization in Market-
ing. He currently serves on the Board of Rasna and has provided
consulting to various domestic and international firms in Health
Care - OTC, FMCG, and Pharma businesses. Being an expert in
brand building and brand development in the FMCG and Phar-
ma space, Nitin is a renowned consultant in the industry known
for his ability to provide out-of-the-box solutions given his experi-
ence in delivering quantum growth consistently.
Shares his insights on brand building and his outlook on the FMCG industry
BY JUBIL JAIN & NAVEEN KULKARNI

39GROUND VIEW GROUND VIEW 1 - 31 October 2015 1 - 31 October 2015 38
Q) Patanjali and its spectacular growth to Rs
25bn turnover in such a short period is the talk
of the town among FMCG companies and in the
analyst circles. What is your assessment of the
impact Patanjali will make on the FMCG sector
and specifically ayurvedic/herbal categories in
the medium term?
A) Patanjali has grown spectacularly in the last few
years. While the company is present in many diverse
FMCG categories such as biscuits, shampoos,
toothpaste, atta, and masala, I do not see Patanjali
making a significant dent on the market shares of
any of the larger FMCG brands in these segments in
the medium term. On the other hand, I believe that
Patanjali will help the Aurvedic and Herbal space
to grow and will also help accelerate the growth of
Companies such as Dabur, Baidhyanath, Emami,
and other regional and national companies already
present in this segment. It has been very successful
in attracting consumers with an inclination for yoga,
meditation, and ayurvedic remedies, but I believe
that the rest of the consumers, which are still in
a majority, will continue to find value in popular
products of leading domestic and MNC FMCG
companies and will not be swayed towards Patanjali
beyond an extent.
Q) In the last decade, in what way has the field of
sales changed the most?
One place where the sales structure and organi-
sation has seen change would be Modern Trade.
Emergence of modern trade has led to some
amount of polarisation in what you do in general
trade and what you do in modern trade. In modern
trade, you need to compete not only in terms of
price, but also relationships. This requires special
skills and you need to build a team that understands
this.
Q) How would you judge the impact of social
media on the way advertising is done today?
A) I feel that social-media marketing is currently
applicable only for premium categories – Sec A
products. It has not yet penetrated beyond these.
Nevertheless, one needs to be savvy and one needs
to include it in advertising spends wherever relevant.
But one need not go overboard. As a matter of fact,
for several FMCG brands, I would still continue with
traditional methods of advertising.
Q) What is your assessment of the impact of
Make in India for the FMCG industry?
A) India is a very exciting place when it comes to the
consumer industry. For major Indian brands such as
Dabur, GCPL, Marico and indeed the iconic Rasna,
exports markets are booming. The Modi govern-
ment has recently floated a proposal that they would
take the top-150 brands that are Made in India and
assist in expand their global foot prints. One of the
achievements of the Modi government has been to
give visibility to Brand India in developed markets
such as North America and various emerging mar-
kets in Africa, Latin America etc.
Q) If you could summarise the golden rules of
marketing in just four points….
1. Innovate. Think out of the box
2. Constantly seek consumer insights. The smell of
the bazaar should drive strategy
3. Take prudent risks and don’t be afraid of failure.
Tolerate and own failure and share and celebrate
success
4. Always think quantum rather than incremental
growth

39GROUND VIEW GROUND VIEW 1 - 31 October 2015 1 - 31 October 2015 38
Indian Economy – Trend Indicators
Monthly Economic Indicators
Quarterly Economic Indicators
Growth Rates (%) Sep-14 Oct-14 Nov-14 Dec-14 Jan-15 Feb-15 Mar-15 Apr-15 May-15 Jun-15 Jul-15 Aug-15 Sep-15
IIP 2.6 -2.7 5.2 3.6 2.8 4.8 2.5 3.0 2.5 4.4 4.2 6.4 4.4
PMI 51.0 51.6 53.3 54.5 52.9 51.2 52.1 51.3 52.6 51.3 52.7 52.3 51.2
Core sector 1.9 6.3 6.7 2.4 1.8 1.5 -0.1 -0.4 4.4 3.0 1.1 2.7 -
WPI 2.4 1.7 -0.2 -0.5 -0.9 -2.1 -2.3 -2.4 -2.4 -2.4 -4.1 -4.9 -4.5
CPI 6.5 5.5 4.4 5.0 5.2 5.4 5.3 4.9 5.0 5.4 3.8 3.7 4.4
Money Supply 12.7 12.0 11.4 10.2 11.5 11.4 11.3 11.5 11.7 11.1 11.3 10.9 11.2
Deposit 13.0 12.4 12.2 10.6 11.9 11.8 11.6 11.8 12.3 11.7 11.7 11.5 11.6
Credit 9.2 10.6 10.5 10.4 10.2 9.9 10.2 12.6 10.5 9.8 9.4 9.4 9.6
Exports 2.7 -5.0 7.3 -3.8 -11.2 -15.0 -21.1 -14.0 -20.2 -15.8 -10.3 -20.7 -23.9
Imports 26.0 3.6 26.8 -4.8 -11.4 -15.7 -13.4 -7.5 -16.5 -13.4 -10.3 -9.9 -18.9
Trade deficit (USD Bn) -14.2 -13.4 -16.9 -9.4 -8.3 -6.8 -11.8 -11.0 -10.4 -10.8 -12.8 -12.5 -13.0
Net FDI (USD Bn) 2.9 2.8 1.8 4.0 4.7 3.8 2.7 3.3 3.8 1.7 1.7 1.9 -
FII (USD Bn) 2.4 1.7 4.8 -0.4 6.6 3.8 2.0 3.1 -2.8 -2.0 -0.7 -3.5 -
ECB (USD Bn) 3.2 2.8 3.5 0.6 2.6 2.3 2.7 7.3 2.4 2.4 3.2 2.1 0.8
Dollar-Rupee 61.8 61.4 62.0 63.0 61.9 61.8 62.5 63.4 63.8 63.7 64.1 66.5 0.0
Foreign Exc Res (USD Bn) 314.2 315.9 316.3 319.7 327.9 338.1 341.4 344.6 352.5 355.2 353.3 355.4 0.0
Balance of Payment (USD Bn) Q1FY14 Q2FY14 Q3FY14 Q4FY14 Q1FY15 Q2FY15 Q3FY15 Q4FY15 Q1FY16Exports 73.9 81.2 79.8 83.7 81.7 85.3 79.0 70.8 68.0Imports 124.4 114.5 112.9 114.3 116.3 123.9 118.3 102.5 102.2Trade deficit -50.5 -33.3 -33.2 -30.7 -34.6 -38.6 -39.3 -31.7 -34.2Net Invisibles 28.7 28.1 29.1 29.3 26.7 28.5 30.9 30.2 28.0CAD -21.8 -5.2 -4.1 -1.3 -7.9 -10.1 -8.4 -1.5 -6.2CAD (% of GDP) 4.6 1.2 0.9 0.3 1.6 2.0 1.7 0.3 1.2Capital Account 20.6 -4.8 23.8 9.2 19.2 16.5 23.6 30.7 18.1BoP -0.3 -10.4 19.1 7.1 11.2 6.9 13.2 30.1 11.4
GDP and its Components (YoY, %) Q1FY14 Q2FY14 Q3FY14 Q4FY14 Q1FY15 Q2FY15 Q3FY15 Q4FY15 Q1FY16Agriculture 2.7 3.6 3.8 4.4 2.6 2.1 -1.1 -1.4 1.9Industry 5.9 4.2 5.5 5.5 8.1 7.2 3.8 7.2 6.4Mining and Quarrying 0.8 4.5 4.2 11.5 4.3 1.4 1.5 2.3 4.0Manufacturing 7.2 3.8 5.9 4.4 8.4 7.9 3.6 8.4 7.2Electricity, gas and water supply 2.8 6.5 3.9 5.9 10.1 8.7 8.7 4.2 3.2Services 8.9 9.7 8.3 5.6 8.4 10.2 11.1 8.0 8.6Construction 1.5 3.5 3.8 1.2 6.5 8.7 3.1 1.4 6.9Trade, hotels, Transport, & Communication 10.3 11.9 12.4 9.9 12.1 8.9 7.4 14.1 12.8Financing, Insurance, Real Estate& business services 7.7 11.9 5.7 5.5 9.3 13.5 13.3 10.2 8.9Public administration, defence, & other services 14.4 6.9 9.1 2.4 2.8 7.1 19.7 0.1 2.7GVA at Basic Price 7.2 7.5 6.6 5.3 7.4 8.4 6.8 6.1 7.1

41GROUND VIEW GROUND VIEW 1 - 31 October 2015 1 - 31 October 2015 40
Annual Economic Indicators and Forecasts Indicators Units FY8 FY9 FY10 FY11 FY12 FY13 FY14 FY15 FY16E FY17E
Real GDP growth % 9.3 6.7 8.6 8.9 6.7 4.5 4.7 7.2 7.4 8.0
Agriculture % 5.8 0.1 0.8 8.6 5.0 1.4 4.7 0.2 2.0 3.0
Industry % 9.2 4.1 10.2 8.3 6.7 0.9 -0.1 6.6 7.0 7.5
Services % 10.3 9.4 10.0 9.2 7.1 6.2 6.0 9.4 8.9 9.4
Real GDP Rs Bn 38966 41587 45161 49185 52475 54821 91698 98271 105543 113986
Real GDP US$ Bn 967 908 953 1079 1096 1008 1517 1611 1624 1809
Nominal GDP Rs Bn 49864 56301 64778 77841 90097 101133 113451 126538 139479 159079
Nominal GDP US$ Bn 1237 1229 1367 1707 1881 1859 1876 2074 2146 2525
Population Mn 1138 1154 1170 1186 1202 1219 1236 1254 1271 1302
Per Capita Income US$ 1087 1065 1168 1439 1565 1525 1518 1655 1688 1940
WPI (Average) % 4.7 8.1 3.8 9.6 8.7 7.4 6.0 2.0 -1.0 5-6
CPI (Average) 6.4 9.0 12.4 10.4 8.3 10.2 9.5 6.0 5.0 5.0
Money Supply % 22.1 20.5 19.2 16.2 15.8 13.6 13.5 12.0 12.0 13.0
CRR % 7.50 5.00 5.75 6.00 4.75 4.00 4.00 4.0 4.0 4.0
Repo rate % 7.75 5.00 5.00 6.75 8.50 7.50 8.00 7.50 7.0 7.00
Reverse repo rate % 6.00 3.50 3.50 5.75 7.50 6.50 7.00 6.50 6.0 6.0
Bank Deposit growth % 22.4 19.9 17.2 15.9 13.5 14.4 14.6 11.4 12.0 13.5
Bank Credit growth % 22.3 17.5 16.9 21.5 17.0 15.0 14.3 9.5 10.0 12.0
Centre Fiscal Deficit Rs Bn 1437 3370 4140 3736 5160 5209 5245 5126 16181 5568
Centre Fiscal Deficit % of GDP 2.9 6.0 6.4 4.8 5.7 5.2 4.6 4.1 3.9 3.5
Gross Central Govt Borrowings Rs Bn 1681 2730 4510 4370 5098 5580 5641 5920 6349 6313
Net Central Govt Borrowings Rs Bn 1318 2336 3984 3254 4362 4674 4536 4469 4603 4566
State Fiscal Deficit % of GDP 1.5 2.4 2.9 2.1 1.9 2.0 2.5 2.4 2.0 1.5
Consolidated Fiscal Deficit % of GDP 4.4 8.4 9.3 6.9 7.6 6.9 7.1 6.6 5.9 5.0
Exports US$ Bn 166.2 189.0 182.4 251.1 309.8 306.6 318.6 316.7 298.0 311.4
YoY Growth % 28.9 13.7 -3.5 37.6 23.4 -1.0 3.9 -0.6 -5.9 4.5
Imports US$ Bn 257.6 308.5 300.6 381.1 499.5 502.2 466.2 460.9 443.0 469.6
YoY Growth % 35.1 19.7 -2.5 26.7 31.1 0.5 -7.2 -1.1 -3.9 6.0
Trade Balance US$ Bn -91.5 -119.5 -118.2 -129.9 -189.8 -195.6 -147.6 -144.2 -145.0 -158.2
Net Invisibles US$ Bn 75.7 91.6 80.0 84.6 111.604 107.5 115.2 116.2 118.8 123.5
Current Account Deficit US$ Bn -15.7 -27.9 -38.2 -45.3 -78.2 -88.2 -32.4 -27.9 -26.2 -34.6
CAD (% of GDP) % -1.3 -2.3 -2.8 -2.6 -4.2 -4.7 -1.7 -1.4 -1.2 -1.4
Capital Account Balance US$ Bn 106.6 7.8 51.6 62.0 67.8 89.3 48.8 90.0 65.5 75.5
Dollar-Rupee (Average) 40.3 45.8 47.4 45.6 47.9 54.4 60.5 61.2 65.0 60.0
Source: RBI, CSO, CGA, Ministry of Agriculture, Ministry of commerce, Bloomberg, PhillipCapital India Research

41GROUND VIEW GROUND VIEW 1 - 31 October 2015 1 - 31 October 2015 40
Note
: For
ban
ks, E
BITD
A is
pre-
prov
ision
pro
fit
CMP
Mkt
Cap
Ne
t Sal
es (R
s mn)
EB
IDTA
(Rs
mn)
PAT (
Rs m
n)EP
S (R
s)
EPS
Grow
th (%
) P
/E (x
) P
/B (x
) EV
/EBI
TDA
(x)
ROE
(%)
ROCE
(%)
Nam
e of
com
pany
Sect
orRs
Rs m
nFY
16E
FY17
EFY
16E
FY17
EFY
16E
FY17
EFY
16E
FY17
EFY
16E
FY17
EFY
16E
FY17
EFY
16E
FY17
EFY
16E
FY17
EFY
16E
FY17
EFY
16E
FY17
E
Baja
j Aut
oAu
tom
obile
s 2
,439
7
05,7
52
230
,020
2
67,4
16
48,
248
56,
526
36,
576
41,
720
126
1
44
16.
0 1
4.1
19.
3 1
6.9
5.5
4
.6
14.
1 1
1.6
28.
7 2
7.5
26.
1 2
5.7
Bhar
at Fo
rge
Auto
mob
iles
890
2
07,2
80
89,
056
102
,437
1
7,16
0 1
9,99
6 9
,827
1
1,63
0 4
2 5
0 3
6.9
18.
3 2
1.1
17.
8 4
.9
4.0
1
3.2
11.
4 2
3.3
22.
7 1
8.7
21.
5
Hero
Mot
oCor
pAu
tom
obile
s 2
,500
4
99,2
19
283
,370
3
25,2
11
41,
714
48,
473
30,
162
34,
800
151
1
74
18.
7 1
5.4
16.
6 1
4.3
6.3
5
.2
11.
9 1
0.1
37.
9 3
6.5
37.
4 3
6.4
Asho
k Ley
land
Auto
mob
iles
95
269
,931
1
73,9
18
216
,048
1
8,39
1 2
3,57
4 8
,574
1
2,77
8 3
4
2
66.6
4
9.0
31.
5 2
1.1
4.7
3
.9
15.
3 1
1.4
14.
8 1
8.5
12.
3 1
6.0
Tata
Mot
ors
Auto
mob
iles
352
1
,140
,010
2
,588
,412
2
,882
,697
4
12,8
72
510
,805
1
33,8
21
174
,950
4
2 5
4 -5
.0
30.
7 8
.5
6.5
1
.6
1.3
4
.1
3.4
1
9.1
19.
9 8
.4
10.
8
Mah
indr
a & M
ahin
dra
Auto
mob
iles
1,2
88
800
,029
4
14,5
87
474
,617
5
0,04
8 6
1,62
7 3
5,60
1 4
4,71
5 6
0 7
6 1
9.3
25.
6 2
1.4
17.
0 3
.5
3.1
1
6.1
12.
9 1
6.4
18.
0 1
4.2
16.
2
Mah
indr
a CIE
Auto
mob
iles
264
8
5,32
2 6
2,11
7 7
0,08
0 7
,685
9
,580
3
,414
4
,988
1
1 1
5 4
3.1
46.
1 2
5.0
17.
1 3
.8
3.2
1
2.6
9.6
1
5.2
18.
7 1
0.9
15.
1
Apol
lo Ty
res
Auto
mob
iles
187
9
5,23
9 1
31,8
88
149
,178
2
0,24
5 2
3,49
6 1
0,85
7 1
3,01
3 2
1 2
6 7
.6
19.
9 8
.8
7.3
1
.5
1.3
5
.0
4.5
1
8.1
18.
5 1
5.4
15.
9
Mar
uti S
uzuk
iAu
tom
obile
s 4
,250
1
,283
,765
5
65,9
51
677
,653
9
6,35
3 1
13,0
46
57,
789
70,
480
191
2
33
55.
7 2
2.0
22.
2 1
8.2
4.5
3
.7
12.
9 1
0.4
20.
2 2
0.4
20.
6 2
1.0
ACC
Cem
ent
1,3
76
258
,385
1
26,6
98
146
,510
1
6,15
3 2
1,85
8 1
0,38
5 1
3,93
3 5
5 7
4 -1
0.6
34.
2 2
4.9
18.
6 3
.0
2.8
1
5.5
11.
5 1
2.1
15.
3 1
0.2
12.
9
Ambu
ja C
emen
tCe
men
t 2
10
325
,821
2
31,1
95
268
,414
3
4,63
4 4
7,12
0 1
6,53
6 2
1,85
7 8
1
1 -1
3.4
32.
2 2
5.2
19.
1 2
.2
2.1
8
.8
6.3
8
.8
11.
1 1
2.9
12.
5
Indi
a Cem
ent
Cem
ent
81
24,
881
58,
814
65,
319
8,2
24
9,9
26
966
2
,430
3
8
n
.a.
151
.7
25.
8 1
0.2
0.7
0
.6
6.4
4
.9
2.7
6
.0
4.6
6
.4
Man
gala
m C
emen
tCe
men
t 2
24
5,9
87
10,
756
11,
489
1,2
52
1,8
17
431
8
25
16
31
13.
8 9
1.5
13.
9 7
.3
1.1
1
.0
8.8
5
.5
7.8
1
3.5
6.4
9
.6
Shre
e Ce
men
tCe
men
t11
,879
4
13,8
23
60,
803
88,
591
14,
340
25,
234
5,3
23
11,
146
204
3
20
66.
5 5
7.1
58.
3 3
7.1
7.2
6
.2
28.
2 1
5.5
12.
4 1
6.7
11.
8 1
7.1
JK C
emen
tCe
men
t 6
23
43,
578
37,
856
45,
428
5,4
95
7,8
05
1,3
24
2,7
44
19
39
6.1
1
07.3
3
2.9
15.
9 2
.5
2.3
1
2.8
8.8
7
.7
14.
3 5
.7
8.1
Dalm
ia B
hara
t Ltd
Cem
ent
691
5
6,09
0 6
6,01
0 8
1,68
2 1
3,57
9 2
0,11
9 9
54
4,1
61
12
51
940
.7
336
.0
58.
8 1
3.5
1.2
1
.1
8.8
5
.6
2.1
8
.4
4.9
7
.6
OCL I
ndia
Cem
ent
514
2
9,24
4 2
5,84
3 3
0,09
8 4
,866
6
,425
2
,395
3
,661
4
2 6
4 7
6.3
52.
8 1
2.2
8.0
2
.0
1.7
6
.0
4.0
1
6.7
21.
4 1
3.6
19.
6
JK La
kshm
i Cem
ent
Cem
ent
378
4
4,45
6 2
7,01
1 3
4,30
0 5
,266
7
,079
1
,905
3
,244
1
6 2
8 5
.7
70.
3 2
3.3
13.
7 2
.8
2.5
1
1.8
8.3
1
2.2
18.
1 8
.4
11.
5
Heid
elbe
rgCe
men
t Ce
men
t 8
1 1
8,43
5 1
8,81
6 2
0,35
2 2
,543
3
,252
6
84
1,2
57
3
6
n.a
. 8
3.7
26.
9 1
4.7
2.0
1
.7
10.
5 7
.5
7.3
1
1.8
5.6
7
.8
Ultra
tech
Cem
ent
Cem
ent
2,9
07
797
,602
2
94,8
39
352
,072
5
5,91
0 7
3,16
8 2
8,83
4 4
0,67
7 1
05
148
3
7.4
41.
1 2
7.7
19.
6 3
.7
3.2
1
5.6
11.
3 1
3.4
16.
2 1
0.1
12.
9
ABB
Indi
aCa
pita
l Goo
ds 1
,101
2
33,3
43
79,
105
84,
530
6,8
19
8,3
06
3,7
95
4,6
02
18
22
66.
1 2
1.3
61.
5 5
0.7
7.7
7
.0
34.
4 2
8.1
12.
5 1
3.9
12.
1 1
3.2
BHEL
Capi
tal G
oods
205
5
02,4
92
271
,342
3
20,6
69
27,
361
43,
299
17,
997
30,
185
7
12
26.
8 6
7.7
27.
9 1
6.6
1.4
1
.3
14.
1 9
.3
5.1
8
.0
4.1
6
.4
Alsto
m T&
DCa
pita
l Goo
ds 5
26
134
,642
4
4,30
5 5
1,43
1 4
,241
6
,267
2
,130
3
,620
8
1
4 7
6.8
70.
0 6
3.2
37.
2 9
.4
8.3
3
2.0
21.
3 1
4.9
22.
3 1
5.5
22.
3
Crom
pton
Gre
aves
Capi
tal G
oods
178
1
11,5
92
131
,691
1
44,9
55
6,2
03
12,
015
2,1
94
5,7
76
4
9
19.
2 1
63.3
5
0.9
19.
3 2
.8
2.5
2
1.0
10.
9 5
.5
13.
1 4
.5
9.1
Engi
neer
s Ind
iaCa
pita
l Goo
ds 2
09
70,
453
16,
818
18,
624
1,8
59
3,1
20
3,0
88
4,0
24
9
12
5.0
3
0.3
22.
8 1
7.5
2.6
2
.4
24.
2 1
4.3
11.
3 1
3.6
11.
6 1
4.2
KEC
Inte
rnat
iona
lCa
pita
l Goo
ds 1
45
37,
214
90,
852
104
,389
6
,970
8
,527
1
,546
2
,423
6
9
1
19.2
5
6.7
24.
1 1
5.4
2.6
2
.2
8.3
6
.8
10.
6 1
4.6
9.9
1
0.8
Phill
ipC
apita
l Ind
ia C
over
age
Uni
vers
e: V
alua
tio
n Su
mm
ary

43GROUND VIEW GROUND VIEW 1 - 31 October 2015 1 - 31 October 2015 42
Phill
ipC
apita
l Ind
ia C
over
age
Uni
vers
e: V
alua
tio
n Su
mm
ary
CMP
Mkt
Cap
Ne
t Sal
es (R
s mn)
EB
IDTA
(Rs
mn)
PAT (
Rs m
n)EP
S (R
s)
EPS
Grow
th (%
) P
/E (x
) P
/B (x
) EV
/EBI
TDA
(x)
ROE
(%)
ROCE
(%)
Nam
e of
com
pany
Sect
orRs
Rs m
nFY
16E
FY17
EFY
16E
FY17
EFY
16E
FY17
EFY
16E
FY17
EFY
16E
FY17
EFY
16E
FY17
EFY
16E
FY17
EFY
16E
FY17
EFY
16E
FY17
EFY
16E
FY17
E
Alsto
m In
dia
Capi
tal G
oods
642
4
3,14
3 2
3,41
9 2
8,47
2 1
,687
2
,385
1
,569
2
,134
2
3 3
2 1
2.5
36.
0 2
7.5
20.
2 4
.0
3.5
2
0.5
13.
7 1
4.4
17.
3 1
5.3
18.
5
Lars
en &
Toub
roCa
pita
l Goo
ds 1
,540
1
,433
,545
1
,037
,731
1
,259
,213
1
23,9
53
168
,246
4
5,67
6 7
2,20
8 4
9 7
7 3
.4
58.
1 3
1.5
20.
0 3
.3
2.9
1
8.4
13.
7 1
0.4
14.
6 4
.8
6.5
Siem
ens
Capi
tal G
oods
1,3
70
487
,778
1
03,9
75
113
,400
7
,350
8
,987
5
,559
7
,961
1
6 2
2 5
6.6
43.
2 8
7.7
61.
3 1
0.5
9.6
6
3.0
50.
6 1
1.9
15.
7 9
.6
12.
8
Cum
min
s Ind
iaCa
pita
l Goo
ds 1
,051
2
91,2
40
51,
590
61,
220
8,1
44
11,
010
7,8
81
10,
141
28
37
0.3
2
8.7
37.
0 2
8.7
9.0
7
.9
35.
7 2
6.4
24.
3 2
7.4
21.
7 2
5.1
VA Te
ch W
abag
Capi
tal G
oods
639
3
4,79
9 2
6,96
3 3
1,99
9 2
,450
3
,076
1
,412
1
,840
2
6 3
4 2
6.3
30.
3 2
4.6
18.
9 3
.4
3.0
1
3.5
10.
8 1
4.0
15.
9 1
2.7
14.
5
Ther
max
Capi
tal G
oods
851
1
01,3
72
56,
147
60,
313
5,1
22
5,1
59
2,7
63
3,2
79
23
28
39.
9 1
8.7
36.
7 3
0.9
4.3
3
.9
19.
9 1
9.4
11.
7 1
2.7
11.
2 1
1.9
Volta
sCa
pita
l Goo
ds 2
72
89,
852
54,
322
62,
379
4,0
84
5,4
97
3,3
87
4,4
64
10
13
-0.3
3
1.8
26.
5 2
0.1
3.8
3
.3
21.
3 1
5.6
14.
4 1
6.6
14.
6 1
6.9
Coal
Indi
aPo
wer
335
2
,114
,403
8
09,0
32
907
,233
2
06,6
78
237
,819
1
70,5
71
191
,137
2
7 3
0 2
4.3
12.
1 1
2.4
11.
1 4
.5
3.8
7
.6
6.2
3
6.0
34.
5 3
8.5
36.
9
NTPC
Powe
r 1
26
1,0
37,6
92
777
,730
8
38,8
34
169
,155
1
92,0
50
88,
482
95,
766
11
12
-0.3
8
.2
11.
7 1
0.8
1.2
1
.1
11.
0 1
0.4
10.
2 1
0.5
6.2
6
.0
Powe
r Grid
Powe
r 1
33
695
,801
2
06,4
49
249
,467
1
79,8
09
218
,831
6
2,01
8 7
4,09
4 1
2 1
4 2
3.4
19.
5 1
1.2
9.4
1
.6
1.4
9
.6
8.5
1
5.3
16.
2 6
.1
6.6
PTC
Indi
aPo
wer
67
19,
892
150
,838
1
67,9
91
10,
803
12,
778
3,2
57
3,7
03
11
13
-8.4
1
3.7
6.1
5
.4
0.6
0
.6
7.2
6
.9
9.8
1
0.4
8.1
8
.1
Inox
Win
dPo
wer
381
8
4,50
6 4
6,13
4 5
7,39
0 8
,391
1
0,82
2 6
,016
7
,284
2
7 3
3 1
27.1
2
1.1
14.
0 1
1.6
4.6
3
.5
10.
6 8
.2
32.
5 3
0.2
26.
0 2
5.8
Cham
bal F
ertil
isers
Agri
Inpu
ts 5
9 2
4,63
7 1
08,3
94
108
,409
8
,288
8
,476
3
,594
3
,697
9
9
3
5.9
2.9
6
.8
6.6
1
.0
0.9
6
.7
6.3
1
4.3
13.
3 6
.7
6.8
Coro
man
del F
ertil
isers
Lt
dAg
ri In
puts
195
5
6,78
8 1
12,3
82
121
,927
9
,246
1
1,40
8 4
,980
6
,521
1
7 2
2 2
2.9
30.
9 1
1.4
8.7
1
.9
1.7
7
.1
5.3
1
6.7
19.
2 1
7.2
19.
8
Tata
Che
mica
ls Lt
dAg
ri In
puts
410
1
04,5
01
185
,584
1
90,0
64
24,
173
25,
159
8,9
04
9,5
93
35
38
11.
3 7
.7
11.
7 1
0.9
1.7
1
.6
6.1
5
.5
14.
6 1
4.4
9.0
9
.5
Kave
ri Se
eds
Agri
Inpu
ts 4
91
33,
906
9,5
77
11,
809
2,2
51
2,9
52
2,1
56
3,0
14
31
44
-28.
4 3
9.8
15.
7 1
1.2
3.7
3
.0
14.
1 1
0.3
23.
6 2
6.5
25.
1 2
8.5
PI In
dustr
ies
Agri
Inpu
ts 6
83
93,
261
22,
849
27,
361
4,4
77
5,3
55
2,8
71
3,6
37
21
27
16.
7 2
6.7
32.
5 2
5.6
8.2
6
.5
20.
5 1
6.8
25.
3 2
5.3
26.
1 2
6.0
Ralli
s Ind
iaAg
ri In
puts
213
4
1,38
3 2
0,42
3 2
3,01
6 3
,001
3
,636
1
,668
2
,088
9
1
1 6
.1
25.
2 2
4.8
19.
8 4
.5
3.9
1
4.2
11.
5 1
8.2
19.
8 1
6.6
18.
7
Unite
d Ph
osph
orus
Agri
Inpu
ts 4
70
201
,573
1
33,7
99
147
,892
2
6,27
6 2
8,45
2 1
3,80
9 1
5,01
1 3
2 3
5 1
7.1
8.7
1
4.6
13.
4 3
.0
2.7
8
.4
7.2
2
1.8
21.
0 1
7.7
17.
0
Zuar
i Agr
oche
mica
lsAg
ri In
puts
161
6
,780
5
6,59
6 n
.a.
3,0
60
n.a
. 7
30
n.a
. 1
7 n
.a.
370
.6
n.a
. 9
.3
0.8
9
.3
8.5
-
7.5
-
Deep
ak Fe
rtilis
ers
Agri
Inpu
ts 1
31
11,
555
33,
995
n.a
. 5
,176
n
.a.
2,6
10
n.a
. 3
0 n
.a.
13.
0 n
.a.
4.4
0
.6
3.1
1
5.2
- 1
1.6
-
Mon
sant
o In
dia
Agri
Inpu
ts 2
,508
4
3,29
5 6
,046
7
,487
1
,330
1
,623
1
,199
1
,474
6
9 8
5 1
2.3
23.
0 3
6.1
29.
4 1
1.5
11.
9 3
1.9
26.
1 3
1.8
40.
6 2
4.6
28.
0
Andh
ra B
ank
Finan
cials
69
45,
042
49,
573
55,
968
33,
634
37,
297
9,2
08
12,
407
14
19
31.
4 3
4.7
5.0
3
.7
0.6
0
.5
1.3
1
.2
9.2
1
1.2
0.5
0
.5
Bank
of B
arod
a Fin
ancia
ls 1
74
399
,772
1
44,3
25
164
,453
1
08,5
08
125
,258
4
2,84
7 5
6,73
8 1
9 2
5 2
6.1
30.
9 9
.0
6.9
1
.1
1.0
3
.7
3.2
1
0.3
11.
9 0
.6
0.9
Bank
of I
ndia
Fin
ancia
ls 1
41
112
,016
1
26,9
64
146
,510
8
7,47
8 1
01,8
14
20,
151
31,
557
12
27
-53.
5 1
27.2
1
1.8
5.2
0
.7
0.6
1
.3
1.1
7
.1
10.
4 0
.3
0.4
Cana
ra B
ank
Finan
cials
294
1
59,4
49
107
,311
1
38,6
54
80,
092
102
,497
2
9,99
4 4
5,15
5 5
1 7
3 -9
.8
42.
8 5
.7
4.0
0
.8
0.7
2
.0
1.6
1
0.2
14.
0 0
.5
1.0

43GROUND VIEW GROUND VIEW 1 - 31 October 2015 1 - 31 October 2015 42
CMP
Mkt
Cap
Ne
t Sal
es (R
s mn)
EB
IDTA
(Rs
mn)
PAT (
Rs m
n)EP
S (R
s)
EPS
Grow
th (%
) P
/E (x
) P
/B (x
) EV
/EBI
TDA
(x)
ROE
(%)
ROCE
(%)
Nam
e of
com
pany
Sect
orRs
Rs m
nFY
16E
FY17
EFY
16E
FY17
EFY
16E
FY17
EFY
16E
FY17
EFY
16E
FY17
EFY
16E
FY17
EFY
16E
FY17
EFY
16E
FY17
EFY
16E
FY17
EFY
16E
FY17
E
Corp
orat
ion
bank
Finan
cials
45
44,
347
46,
373
55,
993
34,
976
42,
505
10,
776
15,
844
12
22
-30.
4 8
1.2
3.7
2
.0
0.1
0
.1
1.3
1
.0
10.
0 1
3.6
0.4
0
.6
HDFC
Ban
kFin
ancia
ls 1
,085
2
,731
,610
2
64,0
87
314
,568
2
12,0
48
252
,451
1
20,8
21
145
,211
4
8 5
8 1
8.3
20.
2 2
2.5
18.
7 3
.9
3.3
1
2.9
10.
8 1
8.2
19.
0 1
.9
2.9
ICIC
I Ban
kFin
ancia
ls 2
83
1,6
42,9
92
215
,970
2
48,4
03
226
,725
2
53,4
43
123
,255
1
40,4
35
22
25
12.
1 1
6.1
13.
1 1
1.3
2.0
1
.8
7.2
6
.5
14.
5 1
4.9
1.8
2
.7
IOB
Finan
cials
37
45,
893
73,
446
n.a
. 4
8,07
2 n
.a.
11,
896
n.a
. 8
7
2.2
4.4
0
.5
1.0
7
.1
- 0
.3
-
Orie
ntal
Ban
k Fin
ancia
ls 1
45
43,
523
54,
736
62,
811
43,
469
48,
686
9,7
76
16,
586
33
55
96.
7 6
9.7
4.5
2
.6
0.4
0
.3
1.0
0
.9
7.1
1
0.9
0.4
0
.9
PNB
Finan
cials
136
2
66,1
66
177
,394
2
04,4
70
124
,506
1
38,2
11
36,
739
48,
306
20
26
20.
0 3
1.5
6.8
5
.2
0.9
0
.8
2.1
1
.9
9.4
1
1.3
0.6
0
.7
SBI
Finan
cials
244
1
,896
,058
7
99,7
67
910
,406
4
86,6
49
519
,916
1
87,5
34
220
,997
2
6 3
5 2
0.6
35.
2 9
.5
7.0
1
.3
1.1
3
.9
3.6
1
0.6
11.
0 0
.7
1.0
Unio
n Ba
nk
Finan
cials
176
1
11,6
11
94,
970
107
,929
6
0,82
2 6
7,75
1 2
3,55
5 3
3,61
6 3
7 5
3 3
2.2
42.
7 4
.7
3.3
0
.8
0.6
1
.8
1.6
1
2.2
15.
6 0
.6
0.8
Indi
an B
ank
Finan
cials
138
6
6,16
0 4
8,01
4 5
6,43
8 3
3,38
5 3
8,54
6 1
1,31
9 1
5,26
0 2
5 3
2 1
7.1
29.
3 5
.6
4.3
0
.6
0.5
2
.0
1.7
8
.6
10.
4 0
.6
1.0
DCB
Bank
Finan
cials
107
3
0,20
1 6
,249
7
,787
3
,634
4
,570
2
,094
2
,693
7
1
0 9
.5
28.
6 1
4.4
11.
2 1
.8
1.6
8
.3
6.6
1
2.8
14.
3 1
.2
1.2
AXIS
Ban
kFin
ancia
ls 4
96
1,1
78,2
28
163
,255
1
92,6
98
159
,084
1
81,8
27
85,
465
99,
622
36
41
15.
0 1
5.4
13.
9 1
2.0
2.4
2
.1
7.4
6
.5
17.
7 1
7.8
1.7
1
.7
Indu
sind
Bank
Finan
cials
950
5
62,1
66
42,
485
53,
394
39,
631
48,
893
22,
094
27,
426
38
47
12.
3 2
4.1
25.
0 2
0.1
3.4
3
.0
14.
2 1
1.5
16.
1 1
4.9
1.8
3
.0
HDFC
NBFC
1,2
94
2,0
41,7
53
311
,386
n
.a.
100
,235
-
69,
114
n.a
. 3
2 3
8 1
7.4
- 4
0.1
34.
0 5
.8
20.
4 2
1.0
- 2
.6
-
Shrir
am Tr
ansp
ort F
inNB
FC 9
90
224
,693
4
8,51
3 5
6,13
6 3
5,54
3 4
1,75
6 1
3,69
3 1
7,14
9 6
0 7
6 1
0.6
25.
2 1
6.4
13.
1 9
9.0
99.
0 6
.3
5.4
1
4.0
15.
4 2
.1
2.3
SKS
Micr
ofina
nce
NBFC
438
5
5,57
5 1
2,31
4 1
9,12
7 3
,469
5
,699
2
,440
4
,119
1
9 3
3 3
0.5
68.
8 2
2.6
13.
4 4
.3
3.3
1
6.0
9.8
2
0.9
27.
6 4
.0
4.2
LIC H
ousin
g Fin
ance
NBFC
482
2
43,3
23
124
,490
1
47,1
47
25,
186
29,
807
16,
280
19,
248
32
38
17.
4 1
8.2
15.
0 1
2.6
2.7
2
.3
9.7
8
.2
19.
2 1
9.4
1.3
1
.3
Chol
a I Fi
nanc
eNB
FC 6
21
96,
845
20,
449
24,
415
12,
049
14,
975
5,3
04
7,3
37
34
47
12.
5 3
8.3
18.
2 1
3.2
2.7
2
.2
8.0
6
.5
15.
6 1
8.5
2.0
2
.4
Mah
& M
ah Fi
nanc
eNB
FC 2
34
133
,262
3
4,01
1 3
7,69
8 2
2,54
8 2
5,01
6 8
,491
1
0,61
6 1
5 1
9 2
.1
25.
0 1
5.6
12.
5 2
.1
1.9
5
.9
5.3
1
4.2
15.
9 2
.4
2.7
Shrir
am C
ity U
nion
NB
FC 1
,839
1
21,2
15
23,
595
28,
070
15,
493
18,
486
7,0
95
8,6
60
108
1
31
27.
1 2
2.1
17.
1 1
4.0
2.6
2
.3
7.8
6
.6
16.
3 1
7.5
3.6
3
.7
Hind
usta
n Un
ileve
rFM
CG 7
97
1,7
25,0
36
323
,169
3
60,8
87
67,
438
76,
155
43,
943
49,
716
20
23
14.
0 1
3.1
39.
3 3
4.8
45.
3 4
3.5
25.
1 2
2.2
115
.2
125
.1
116
.9
127
.9
Mar
ico In
dustr
ies
FMCG
395
2
54,5
83
63,
524
71,
981
10,
220
11,
694
6,6
98
7,7
09
10
12
16.
8 1
5.1
38.
0 3
3.0
11.
3 9
.2
24.
7 2
1.2
29.
9 2
8.0
27.
9 2
7.0
Jubi
lant
Food
work
sFM
CG 1
,562
1
02,5
20
25,
784
33,
867
3,8
82
5,5
95
1,8
86
2,7
89
29
43
53.
0 4
7.9
54.
2 3
6.6
11.
9 9
.0
26.
3 1
8.0
21.
9 2
4.5
23.
7 2
7.1
Godr
ej C
onsu
mer
FMCG
1,2
45
423
,964
9
2,73
3 1
06,1
30
17,
029
19,
235
11,
709
13,
278
34
39
28.
7 1
3.4
36.
2 3
1.9
8.2
6
.9
25.
4 2
1.9
22.
6 2
1.6
17.
4 1
7.8
ITCFM
CG 3
44
2,7
61,9
17
386
,541
4
25,3
03
142
,239
1
57,8
63
97,
143
108
,674
1
2 1
4 5
.8
11.
9 2
8.3
25.
3 7
.9
6.9
1
8.8
16.
7 2
7.9
27.
2 2
3.7
23.
8
Nestl
eFM
CG 6
,211
5
98,8
04
88,
510
110
,477
1
6,72
0 2
3,84
6 1
0,76
6 1
3,84
5 1
12
144
-9
.2
28.
6 5
5.6
43.
3 2
4.0
21.
6 3
5.3
24.
6 4
3.2
50.
0 4
0.4
52.
5
Colg
ate
FMCG
910
2
47,5
07
42,
813
49,
624
9,7
31
11,
934
6,2
53
7,6
59
46
56
106
.7
22.
5 1
9.8
16.
2 1
4.7
13.
2 2
5.2
20.
4 7
4.2
81.
8 7
7.5
86.
1
Phill
ipC
apita
l Ind
ia C
over
age
Uni
vers
e: V
alua
tio
n Su
mm
ary

45GROUND VIEW GROUND VIEW 1 - 31 October 2015 1 - 31 October 2015 44
CMP
Mkt
Cap
Ne
t Sal
es (R
s mn)
EB
IDTA
(Rs
mn)
PAT (
Rs m
n)EP
S (R
s)
EPS
Grow
th (%
) P
/E (x
) P
/B (x
) EV
/EBI
TDA
(x)
ROE
(%)
ROCE
(%)
Nam
e of
com
pany
Sect
orRs
Rs m
nFY
16E
FY17
EFY
16E
FY17
EFY
16E
FY17
EFY
16E
FY17
EFY
16E
FY17
EFY
16E
FY17
EFY
16E
FY17
EFY
16E
FY17
EFY
16E
FY17
EFY
16E
FY17
E
Glax
o Sm
ithkl
ine
Cons
FMCG
6,0
44
254
,173
4
5,36
5 5
2,03
0 6
,359
5
,161
6
,558
6
,558
1
56
156
1
0.1
-0.0
3
8.8
38.
8 1
0.8
9.9
3
6.4
43.
6 2
7.8
25.
5 2
8.8
26.
5
Agro
Tech
Food
sFM
CG 6
39
15,
567
7,8
71
8,3
14
688
8
30
379
4
61
16
19
1.3
2
1.9
41.
1 3
3.7
4.5
4
.0
22.
7 1
8.4
10.
9 1
1.9
10.
6 1
1.7
Asia
n Pa
ints
FMCG
862
8
27,0
68
158
,237
1
90,3
30
28,
120
35,
717
17,
753
22,
383
19
23
28.
1 2
6.1
46.
6 3
7.0
14.
2 1
1.9
28.
7 2
2.5
30.
4 3
2.2
31.
6 3
3.6
Emam
iFM
CG 1
,068
2
42,4
24
28,
216
34,
697
8,1
72
10,
341
5,9
69
7,5
85
26
33
33.
9 2
7.1
40.
6 3
2.0
16.
2 1
3.2
30.
4 2
3.5
39.
8 4
1.3
33.
8 3
0.5
Brita
nnia
FMCG
3,1
81
381
,691
8
8,41
8 1
02,2
37
11,
765
14,
333
8,4
09
10,
274
70
86
55.
0 2
2.2
45.
4 3
7.1
21.
2 1
5.5
32.
4 2
6.1
46.
8 4
1.7
50.
1 4
4.9
Baja
j Cor
pFM
CG 4
19
61,
788
9,3
85
11,
089
2,8
10
3,2
94
2,5
79
2,9
51
17
20
15.
3 1
4.4
24.
0 2
0.9
11.
4 1
0.1
21.
3 1
7.9
47.
7 4
8.2
40.
5 4
8.0
Apco
tex I
ndus
tries
FMCG
255
5
,289
4
,823
5
,918
6
47
875
3
78
515
3
6 4
9 5
3.5
36.
2 7
.0
5.2
2
.1
1.6
7
.8
5.6
2
9.2
30.
8 2
8.0
30.
0
Dabu
rFM
CG 2
73
479
,261
8
8,38
0 1
01,9
67
17,
042
20,
291
13,
731
16,
058
8
9
28.
8 1
6.9
34.
9 2
9.8
11.
6 9
.5
28.
0 2
3.1
33.
1 3
1.9
30.
5 3
0.1
NCC
Infra
struc
ture
81
45,
030
82,
975
87,
126
7,2
60
8,0
59
2,6
22
3,5
15
5
6
134
.5
34.
1 1
7.2
12.
8 1
.3
1.2
8
.8
7.6
7
.6
9.2
1
0.2
10.
8
Asho
ka B
uild
con
Infra
struc
ture
164
3
0,70
2 2
9,22
4 3
6,92
5 8
,387
1
1,52
6 1
,180
1
,803
6
1
0 2
2.8
52.
8 2
6.0
17.
0 1
.6
1.4
8
.2
6.0
6
.0
8.5
5
.0
6.7
GMR
Infra
struc
ture
Infra
struc
ture
14
71,
758
82,
008
98,
433
25,
769
39,
980
-15,
716
-1,4
81
-3
-0
-48.
6 -9
0.6
-4.6
-4
8.4
0.9
0
.9
18.
8 1
1.3
-20.
3 -2
.0
0.4
2
.6
GVK
Powe
rIn
frastr
uctu
re 8
1
2,55
5 2
9,88
5 4
8,60
5 1
8,89
7 2
8,26
4 -6
,809
-3
,136
-4
-2
3
3.8
-53.
9 -1
.8
-4.0
0
.8
0.9
1
2.8
8.4
-4
5.7
-21.
7 1
.2
3.4
IRB
Infra
struc
ture
Infra
struc
ture
254
8
9,26
8 5
1,64
7 5
5,98
5 2
8,58
6 3
1,80
5 5
,031
6
,425
1
4 1
8 -7
.3
27.
7 1
7.7
13.
9 1
.7
1.4
8
.0
7.7
9
.7
10.
4 3
.4
3.6
KNR
Cons
tructi
onIn
frastr
uctu
re 5
72
16,
091
10,
076
12,
594
1,5
11
1,8
89
844
1
,124
3
0 4
0 1
5.5
33.
3 1
9.1
14.
3 2
.5
2.1
1
1.0
8.9
1
3.8
15.
9 1
3.3
15.
1
J Kum
ar In
frapr
ojec
tsIn
frastr
uctu
re 7
39
23,
810
17,
058
22,
176
3,1
56
4,1
03
1,3
39
1,9
28
42
60
41.
9 4
4.0
17.
8 1
2.4
2.6
2
.2
8.9
6
.9
15.
8 1
9.6
12.
9 1
5.3
Adan
i Por
ts &
SEZ
Infra
struc
ture
325
6
72,0
24
70,
310
86,
162
47,
201
58,
344
26,
419
36,
357
13
18
14.
0 3
7.6
25.
4 1
8.5
5.1
4
.1
17.
8 1
4.3
20.
1 2
2.0
12.
0 1
3.7
HCL T
echn
olog
ies
IT Se
rvice
s 8
34
1,1
72,1
48
435
,467
5
03,7
92
98,
727
117
,813
7
7,60
3 9
3,53
9 5
5 6
6 6
.9
20.
7 1
5.2
12.
6 4
.1
3.4
1
1.9
9.9
2
6.9
27.
0 2
7.3
28.
3
Info
sys
IT Se
rvice
s 1
,098
2
,521
,127
6
11,6
31
695
,923
1
67,7
54
198
,009
1
33,0
50
156
,204
5
8 6
8 7
.9
17.
4 1
8.9
16.
1 4
.5
4.0
1
2.9
10.
7 2
3.9
24.
7 2
4.1
26.
3
TCS
IT Se
rvice
s 2
,484
4
,893
,952
1
,078
,809
1
,248
,401
3
01,2
18
330
,985
2
40,1
33
271
,170
1
23
138
2
2.2
12.
9 2
0.3
17.
9 7
.4
6.0
1
6.1
14.
5 3
6.3
33.
7 3
8.5
35.
5
Pers
isten
t Sys
tem
sIT
Serv
ices
690
5
5,23
2 2
1,72
8 2
4,84
5 4
,348
4
,997
3
,124
3
,646
3
9 4
6 7
.5
16.
7 1
7.7
15.
1 3
.4
2.9
1
2.3
10.
5 1
9.0
19.
0 1
8.2
18.
5
KPIT
Tech
nolo
gies
IT Se
rvice
s 1
17
23,
047
32,
149
35,
749
3,0
50
4,3
70
1,8
95
2,7
75
10
15
-20.
0 4
6.4
11.
6 7
.9
1.5
1
.3
7.9
5
.5
12.
8 1
6.0
11.
0 1
4.3
Wip
roIT
Serv
ices
583
1
,439
,701
5
20,9
90
576
,884
1
10,6
60
117
,652
9
0,21
1 9
8,75
1 3
7 4
0 4
.5
9.5
1
5.9
14.
5 3
.2
2.8
1
2.2
11.
3 2
0.2
19.
3 2
0.0
19.
6
Tech
Mah
indr
aIT
Serv
ices
548
5
27,2
89
272
,238
3
22,1
12
43,
994
56,
779
29,
027
37,
010
30
38
19.
0 2
7.5
18.
2 1
4.2
3.4
2
.8
11.
5 8
.6
18.
5 1
9.8
19.
0 2
0.7
Min
dtre
e Lt
dIT
Serv
ices
1,4
09
118
,101
4
3,95
5 5
1,06
8 8
,239
1
0,02
5 5
,981
7
,301
7
1 8
7 1
1.3
22.
1 1
9.7
16.
2 4
.8
3.9
1
3.8
10.
8 2
4.5
24.
3 2
6.4
26.
4
NIIT
Tech
nolo
gies
IT Se
rvice
s 4
46
27,
245
27,
314
30,
378
4,5
70
4,9
67
2,6
45
2,9
88
44
49
132
.1
13.
0 1
0.2
9.0
1
.7
1.5
5
.7
4.9
1
7.0
16.
8 1
7.1
16.
3
Zee
Ente
rtain
men
tM
edia
387
3
71,3
09
56,
763
66,
309
14,
740
19,
196
9,2
93
12,
199
10
13
-4.9
3
1.3
39.
9 3
0.4
6.9
6
.2
24.
2 1
8.3
17.
2 2
0.3
19.
5 2
2.1
Phill
ipC
apita
l Ind
ia C
over
age
Uni
vers
e: V
alua
tio
n Su
mm
ary

45GROUND VIEW GROUND VIEW 1 - 31 October 2015 1 - 31 October 2015 44
CMP
Mkt
Cap
Ne
t Sal
es (R
s mn)
EB
IDTA
(Rs
mn)
PAT (
Rs m
n)EP
S (R
s)
EPS
Grow
th (%
) P
/E (x
) P
/B (x
) EV
/EBI
TDA
(x)
ROE
(%)
ROCE
(%)
Nam
e of
com
pany
Sect
orRs
Rs m
nFY
16E
FY17
EFY
16E
FY17
EFY
16E
FY17
EFY
16E
FY17
EFY
16E
FY17
EFY
16E
FY17
EFY
16E
FY17
EFY
16E
FY17
EFY
16E
FY17
EFY
16E
FY17
E
HT M
edia
Med
ia 9
1 2
1,14
5 2
4,77
5 2
7,42
3 3
,318
3
,820
2
,262
2
,626
1
0 1
1 2
5.8
16.
1 9
.3
8.1
0
.9
0.8
6
.5
4.8
1
0.2
10.
4 1
1.0
11.
4
Jagr
an P
raka
shan
Med
ia 1
41
45,
947
20,
844
22,
253
5,7
61
6,3
07
2,8
12
3,2
11
9
10
22.
4 1
4.2
15.
9 1
3.9
2.8
2
.5
8.3
7
.1
17.
7 1
7.7
15.
3 1
4.0
Hath
way C
able
Med
ia 4
1 3
4,00
9 2
7,80
4 4
0,40
1 6
,124
1
0,90
0 1
,270
5
,270
8
3
4 5
8.4
315
.1
4.9
1
.2
0.4
0
.3
7.2
3
.7
8.8
2
8.4
5.8
1
7.3
Den
Netw
orks
Med
ia 1
15
20,
564
23,
573
34,
431
6,2
03
11,
872
1,3
53
4,7
75
9
33
4.0
2
53.0
1
2.5
3.5
0
.8
0.7
2
.9
1.1
6
.6
19.
8 8
.6
19.
0
Dish
TVM
edia
103
1
09,9
85
31,
773
36,
769
10,
074
12,
179
2,5
72
4,2
75
2
4
66.
2 4
2.7
25.
7 -2
10.4
2
9.3
11.
8 9
.5
-492
.5
113
.9
59.
1 6
0.9
Hind
usta
n M
edia
Vent
Med
ia 2
64
19,
365
9,1
12
10,
147
2,1
90
2,6
28
1,6
84
2,0
70
23
28
19.
7 2
3.0
11.
5 9
.4
2.2
1
.8
8.5
6
.4
18.
8 1
8.9
21.
3 2
1.4
DB C
orp
Limite
dM
edia
308
5
6,64
3 2
1,14
1 2
3,84
1 6
,217
7
,330
3
,524
4
,507
1
9 2
5 1
1.4
27.
9 1
6.1
12.
6 3
.9
3.4
9
.0
7.3
2
4.2
27.
0 2
1.4
24.
4
Eros
Inte
rnat
iona
lM
edia
459
4
2,89
4 1
8,24
7 2
0,03
5 4
,447
5
,265
3
,190
3
,694
3
4 4
0 2
9.1
15.
8 1
3.4
11.
6 2
.4
2.0
1
0.4
8.6
1
7.8
17.
3 1
3.9
14.
0
Hind
alco
Inds
Met
als
89
182
,958
1
,060
,066
1
,104
,039
9
7,20
1 1
14,5
85
10,
857
23,
009
5
11
-61.
1 1
11.9
1
6.9
8.0
0
.5
0.4
7
.6
6.1
2
.8
5.6
3
.7
4.7
NALC
O M
etal
s 4
0 1
04,2
49
68,
246
72,
530
9,9
40
11,
726
8,5
60
9,3
88
3
4
-58.
5 9
.7
12.
2 1
1.1
0.8
0
.8
5.4
5
.5
6.5
6
.9
5.9
6
.3
Hind
usta
n Zi
ncM
etal
s 1
51
638
,446
1
55,9
76
164
,820
7
3,24
3 8
1,72
9 7
6,77
0 8
5,03
8 1
8 2
0 -6
.2
10.
8 8
.3
7.5
1
.3
1.2
3
.9
2.8
1
5.8
15.
6 1
5.4
15.
2
Tata
Ste
elM
etal
s 2
48
241
,201
1
,348
,037
1
,391
,486
1
31,5
32
169
,127
2
4,40
6 4
4,38
4 2
5 4
6 8
1.9
9.9
5
.4
0.7
0
.6
7.7
5
.7
7.2
1
1.9
4.3
5
.5
JSW
Ste
elM
etal
s 9
05
218
,843
4
76,1
43
548
,441
9
5,71
4 1
13,2
39
21,
707
31,
951
90
132
1
7.7
47.
2 1
0.1
6.8
0
.9
0.8
6
.1
4.9
9
.0
11.
8 6
.3
7.6
Jinda
l Ste
el &
Pow
erM
etal
s 7
4 6
7,74
9 2
05,6
64
230
,731
4
1,47
7 5
1,15
9 -1
8,14
8 -1
0,75
7 -2
0 -1
2 -3
86.5
-4
0.7
-3.7
-6
.3
0.3
0
.3
11.
4 9
.0
-8.6
-5
.4
3.2
1
.3
SAIL
Met
als
57
236
,035
4
26,0
75
472
,921
2
4,89
9 4
4,31
3 -2
,486
3
,847
-1
1
-1
11.4
-2
54.7
-9
5.0
61.
4 0
.6
0.6
1
9.9
11.
9 -0
.6
0.9
1
.2
2.1
Sesa
Ste
rlite
Met
als
108
3
19,8
91
751
,388
8
54,9
34
214
,326
2
34,9
72
66,
334
88,
469
18
24
-18.
4 3
3.4
6.0
4
.5
0.6
0
.5
5.0
4
.4
9.5
1
1.6
7.5
8
.6
ONGC
Oil &
Gas
255
2
,181
,650
1
,575
,249
1
,847
,063
6
30,0
97
712
,597
2
77,1
27
333
,773
3
2 3
9 2
2.3
20.
4 7
.9
6.5
1
.1
1.0
3
.9
3.3
1
3.6
14.
6 1
1.7
12.
8
Petro
net L
NGOi
l & G
as 1
88
140
,963
2
87,8
04
368
,036
1
5,93
7 1
8,78
2 8
,186
1
0,41
7 1
1 1
4 -7
.2
27.
2 1
7.2
13.
5 2
.3
2.0
1
0.3
8.5
1
3.1
14.
9 9
.8
11.
1
Cairn
Indi
aOi
l & G
as 1
59
297
,539
1
23,0
92
124
,761
6
4,94
0 6
3,38
2 3
8,97
4 3
4,06
2 2
1 1
8 -3
6.9
-12.
6 7
.6
8.7
0
.5
0.5
3
.8
3.6
6
.5
5.7
5
.9
5.1
GAIL
Oil &
Gas
317
4
01,9
17
583
,930
6
34,9
89
57,
593
70,
621
34,
491
43,
749
27
34
8.7
2
6.8
11.
7 9
.2
1.3
1
.2
8.4
6
.2
11.
0 1
2.9
7.8
9
.3
Indr
apra
stha G
asOi
l & G
as 4
78
66,
983
43,
984
48,
003
8,7
80
9,5
19
4,6
90
5,1
80
34
37
7.4
1
0.4
14.
3 1
2.9
2.8
2
.8
7.2
6
.7
21.
0 2
1.7
15.
7 1
6.3
Guja
rat S
tate
Pet
rone
tOi
l & G
as 1
24
69,
965
12,
888
13,
563
11,
501
12,
093
5,7
46
5,9
73
10
11
24.
0 3
.9
12.
2 1
1.7
1.7
1
.5
6.2
5
.4
13.
8 1
2.9
11.
4 1
0.8
Oil I
ndia
Oil &
Gas
444
2
66,8
44
119
,237
1
27,2
43
58,
603
63,
358
37,
321
40,
308
62
67
39.
0 8
.0
7.1
6
.6
1.1
1
.0
4.2
3
.7
15.
2 1
4.9
11.
1 1
1.2
Berg
er P
aint
sOt
her
227
1
57,6
28
54,
368
n.a
. 6
,498
n
.a.
3,8
68
n.a
. 1
1 n
.a.
22.
0 n
.a.
20.
4 4
.8
24.
8 2
3.7
- 2
0.8
-
Bhar
ti Ai
rtel
Tele
com
346
1
,384
,300
9
76,6
64
1,0
93,4
93
336
,030
3
91,3
96
54,
294
81,
753
14
20
-10.
1 5
0.6
25.
5 1
6.9
2.0
1
.7
7.4
6
.0
7.8
1
0.2
5.7
6
.8
Relia
nce
Com
mTe
leco
m 7
7 1
92,7
71
234
,448
n
.a.
82,
810
n.a
. 1
4,14
3 n
.a.
7
n.a
. 4
7.7
n.a
. 1
1.3
0.5
6
.0
4.8
-
4.2
-
Phill
ipC
apita
l Ind
ia C
over
age
Uni
vers
e: V
alua
tio
n Su
mm
ary

47GROUND VIEW GROUND VIEW 1 - 31 October 2015 1 - 31 October 2015 46
CMP
Mkt
Cap
Ne
t Sal
es (R
s mn)
EB
IDTA
(Rs
mn)
PAT (
Rs m
n)EP
S (R
s)
EPS
Grow
th (%
) P
/E (x
) P
/B (x
) EV
/EBI
TDA
(x)
ROE
(%)
ROCE
(%)
Nam
e of
com
pany
Sect
orRs
Rs m
nFY
16E
FY17
EFY
16E
FY17
EFY
16E
FY17
EFY
16E
FY17
EFY
16E
FY17
EFY
16E
FY17
EFY
16E
FY17
EFY
16E
FY17
EFY
16E
FY17
EFY
16E
FY17
E
Bhar
ti In
frate
lTe
leco
m 4
08
773
,935
8
0,09
9 8
7,24
4 5
6,48
3 6
3,55
5 2
3,15
5 2
7,39
0 1
2 1
5 1
6.3
18.
3 3
3.3
28.
1 4
.7
4.9
1
3.7
12.
1 1
4.1
17.
3 1
0.7
12.
3
Idea
Cel
lula
rTe
leco
m 1
51
543
,001
3
62,3
21
412
,443
1
32,3
03
158
,472
3
6,19
5 3
0,55
6 1
0 8
1
3.4
-15.
6 1
5.0
17.
7 2
.0
1.8
7
.3
5.8
1
3.6
10.
4 7
.9
7.3
Tata
Com
mun
icatio
nTe
leco
m 4
16
118
,517
2
10,2
25
223
,566
3
3,94
8 3
7,00
7 1
,600
2
,857
6
1
0 5
0.3
78.
5 7
4.1
41.
5 2
0.0
17.
0 5
.8
5.2
2
6.9
41.
0 4
.8
5.9
Auro
bind
o Ph
arm
aPh
arm
a 8
06
470
,646
1
41,3
86
155
,686
3
2,80
2 3
7,98
7 2
0,10
5 2
3,74
6 3
5 4
1 2
2.4
18.
1 2
3.3
19.
8 6
.6
5.0
1
5.6
13.
0 2
8.1
25.
3 2
4.8
26.
3
Bioc
onPh
arm
a 4
42
88,
370
34,
911
41,
122
8,5
60
10,
383
5,0
61
5,9
13
25
30
22.
8 1
6.8
17.
5 1
4.9
2.2
2
.0
9.5
7
.7
13.
7 -
11.
7 -
Cadi
la H
ealth
care
Phar
ma
423
4
33,1
97
98,
900
113
,024
2
1,85
9 2
5,83
4 1
4,64
4 1
7,89
0 7
2 8
7 2
4.2
22.
2 5
.9
4.8
1
.6
1.2
2
0.4
17.
0 2
6.8
25.
5 1
9.3
20.
8
Divi'
s Lab
orat
orie
sPh
arm
a 1
,071
2
84,3
57
37,
597
44,
330
14,
287
17,
067
10,
542
12,
606
40
47
22.
3 1
9.6
27.
0 2
2.6
6.7
5
.5
19.
9 1
6.5
24.
9 2
4.4
- -
Dr R
eddy
's La
bs.
Phar
ma
4,1
97
715
,632
1
75,4
42
199
,328
4
5,26
4 5
1,82
5 3
0,00
6 3
4,44
7 1
76
202
3
1.6
14.
8 2
3.8
20.
8 5
.1
4.2
1
6.2
13.
8 2
1.5
20.
0 1
4.9
14.
7
Glen
mar
k Pha
rma
Phar
ma
1,0
14
286
,191
8
1,04
6 9
6,56
1 1
8,24
0 2
2,89
0 1
0,36
6 1
3,90
5 3
7 4
9 3
3.6
34.
1 2
7.6
20.
6 5
.8
4.6
1
6.4
12.
8 2
1.1
22.
3 1
5.0
17.
3
Ipca
Labo
rato
ries
Phar
ma
742
9
3,60
6 3
5,04
5 4
4,25
4 6
,970
1
0,47
2 3
,410
5
,867
2
7 4
7 2
7.4
72.
1 2
7.2
15.
8 3
.6
3.0
1
4.4
9.5
1
3.4
19.
1 1
1.5
16.
3
Lupi
nPh
arm
a 2
,067
9
30,5
07
13,
728
17,
245
3,0
34
3,9
32
1,8
83
2,4
19
23
30
48.
0 2
8.5
88.
1 6
8.6
13.
0 1
1.0
307
.0
236
.9
15.
2 1
6.5
- -
Sun
Phar
ma
Phar
ma
884
2
,126
,568
2
95,9
08
340
,656
8
9,22
2 1
16,4
01
54,
821
76,
781
23
32
14.
7 4
0.1
38.
8 2
7.7
6.9
5
.6
23.
1 1
7.2
17.
8 2
0.4
15.
0 1
7.6
CIPL
A LT
DPh
arm
a 6
79
545
,469
1
3,72
8 1
7,24
5 3
,034
3
,932
1
,883
2
,419
2
3 3
0 4
8.0
28.
5 2
9.0
22.
5 4
.3
3.6
1
80.1
1
39.0
1
5.2
16.
5 -
-
Conc
orM
idca
ps 1
,498
2
92,0
13
66,
073
78,
090
15,
456
18,
324
12,
091
14,
126
62
72
15.
4 1
6.8
24.
2 2
0.7
3.4
3
.0
16.
9 1
3.9
14.
0 1
4.6
14.
0 1
4.7
Praj
Inds
.M
idca
ps 9
4 1
6,63
3 1
1,85
2 1
4,70
0 1
,083
1
,691
6
48
1,0
72
4
6
42.
4 6
5.4
25.
6 1
5.5
2.6
2
.4
15.
0 9
.3
10.
2 1
5.8
8.6
1
3.2
Penn
ar In
ds.
Mid
caps
48
5,8
01
15,
728
19,
290
1,5
53
2,1
32
596
9
03
5
8
66.
0 5
1.6
9.7
6
.4
1.2
1
.1
4.3
3
.2
12.
5 1
6.4
15.
3 1
8.1
Allca
rgo
Mid
caps
311
3
9,31
7 6
3,63
4 7
2,95
3 5
,762
7
,150
2
,966
3
,772
2
4 3
0 2
3.7
27.
2 1
3.2
10.
4 1
.8
1.6
7
.2
5.4
1
3.7
15.
2 1
1.7
13.
4
Sint
ex In
dustr
ies
Mid
caps
104
4
6,46
4 8
3,57
7 1
04,8
60
14,
451
18,
165
6,2
12
8,7
30
14
20
12.
8 4
0.5
7.5
5
.3
0.9
0
.8
6.2
4
.7
11.
8 1
4.4
8.2
9
.5
The
Byke
Hos
pita
lity
Mid
caps
159
6
,374
2
,137
2
,761
4
49
580
2
41
329
6
8
2
0.3
36.
7 2
6.4
19.
4 5
.4
4.5
1
4.2
10.
8 2
0.6
23.
0 1
9.3
22.
5
VRL L
ogist
ics Lt
d M
idca
ps 3
74
34,
111
18,
632
21,
013
3,1
34
3,6
53
1,2
66
1,6
13
14
18
38.
7 2
7.4
26.
9 2
1.1
7.7
6
.1
12.
0 1
0.0
28.
4 2
8.6
24.
7 2
7.4
Have
lls In
dia L
tdM
idca
ps 2
59
161
,768
9
3,95
2 1
05,6
64
9,0
23
11,
056
5,3
42
6,6
55
9
11
38.
6 2
4.6
30.
3 2
4.3
7.6
6
.3
17.
0 1
3.5
27.
1 2
8.3
35.
0 3
8.0
Finol
ex C
able
s Ltd
Mid
caps
256
3
9,15
2 2
5,74
3 3
0,30
1 2
,868
3
,808
2
,036
2
,748
1
3 1
8 2
.5
35.
0 1
9.2
14.
2 2
.7
2.4
1
3.0
9.2
1
5.1
17.
8 1
8.0
21.
2
V-Gu
ard
Indu
strie
s Ltd
Mid
caps
917
2
7,52
2 2
0,23
4 2
4,13
2 1
,591
1
,969
8
87
1,1
43
30
38
25.
5 2
8.8
30.
9 2
4.0
6.1
5
.0
17.
5 1
3.9
21.
5 2
3.0
29.
6 3
1.8
Baja
j Ele
ctrica
ls Lt
dM
idca
ps 2
46
24,
812
46,
479
52,
025
2,5
79
3,1
59
858
1
,219
9
1
2 -7
14.5
4
2.1
28.
6 2
0.1
3.3
2
.9
12.
7 1
0.2
11.
9 1
5.1
16.
5 1
9.4
Note
: For
ban
ks, E
BITD
A is
pre-
prov
ision
pro
fit
Phill
ipC
apita
l Ind
ia C
over
age
Uni
vers
e: V
alua
tio
n Su
mm
ary

47GROUND VIEW GROUND VIEW 1 - 31 October 2015 1 - 31 October 2015 46
Disclosures and Disclaimers
PhillipCapital (India) Pvt. Ltd. has three independent equity research groups: Institutional Equities, Institutional Equity Derivatives and Private Client Group. This report has been prepared by Institutional Equities Group. The views and opinions expressed in this document may or may not match or may be contrary at times with the views, estimates, rating, target price of the other equity research groups of PhillipCapital (India) Pvt. Ltd.
This report is issued by PhillipCapital (India) Pvt. Ltd. which is regulated by SEBI. PhillipCapital (India) Pvt. Ltd. is a subsidiary of Phillip (Mauritius) Pvt. Ltd. References to "PCIPL" in this report shall mean PhillipCapital (India) Pvt. Ltd unless otherwise stated. This report is prepared and distributed by PCIPL for information purposes only and neither the information contained herein nor any opinion expressed should be construed or deemed to be construed as solicitation or as offering advice for the purposes of the purchase or sale of any security, investment or derivatives. The information and opinions contained in the Report were considered by PCIPL to be valid when published. The report also contains information provided to PCIPL by third parties. The source of such information will usually be disclosed in the report. Whilst PCIPL has taken all reasonable steps to ensure that this information is correct, PCIPL does not offer any warranty as to the accuracy or complete-ness of such information. Any person placing reliance on the report to undertake trading does so entirely at his or her own risk and PCIPL does not accept any liability as a result. Securities and Derivatives markets may be subject to rapid and unexpected price movements and past performance is not necessarily an indication to future performance.
This report does not have regard to the specific investment objec-tives, financial situation and the particular needs of any specific person who may receive this report. Investors must undertake independent analysis with their own legal, tax and financial advisors and reach their own regarding the appropriateness of investing in any securities or investment strategies discussed or recommended in this report and should understand that statements regarding future prospects may not be realized. In no circumstances it be used or considered as an offer to sell or a solicitation of any offer to buy or sell the Securities mentioned in it. The information contained in the research reports may have been taken from trade and statistical services and other sources, which we believe are reliable. PhillipCapital (India) Pvt. Ltd. or any of its group/associate/affiliate companies do not guarantee that such information is accurate or complete and it should not be relied upon as such. Any opinions expressed reflect judgments at this date and are subject to change without notice
Important: These disclosures and disclaimers must be read in conjunction with the research report of which it forms part. Receipt and use of the research report is subject to all aspects of these disclosures and disclaimers. Additional information about the issuers and securities discussed in this research report is available on request.
Certifications: The research analyst(s) who prepared this research report hereby certifies that the views expressed in this research report accurately reflect the research analyst’s personal views about all of the subject issuers and/or securities, that the analyst have no known conflict of interest and no part of the research analyst’s compensation was, is or will be, directly or indirectly, related to the specific views or recommen-dations contained in this research report. The Research Analyst certifies that he /she or his / her family members does not own the stock(s) covered in this research report.
Independence: PhillipCapital (India) Pvt. Ltd. has not had an investment banking relationship with, and has not received any compensation for investment banking services from, the subject issuers in the past twelve (12) months, and PhillipCapital (India) Pvt. Ltd does not anticipate receiving or intend to seek compensation for investment banking services from the subject issuers in the next three (3) months.
PhillipCapital (India) Pvt. Ltd is not a market maker in the securities mentioned in this research report, although it or its affiliates may hold either long or short positions in such securities. PhillipCapital (India) Pvt. Ltd does not hold more than 1% of the shares of the company(ies) covered in this report.
Suitability and Risks: This research report is for informational purposes only and is not tailored to the specific investment objectives, financial situation or particular requirements of any individual recipient hereof. Certain securities may give rise to substantial risks and may not be suitable for certain investors. Each investor must make its own deter-mination as to the appropriateness of any securities referred to in this research report based upon the legal, tax and accounting considerations applicable to such investor and its own investment objectives or strate-gy, its financial situation and its investing experience. The value of any security may be positively or adversely affected by changes in foreign exchange or interest rates, as well as by other financial, economic or political factors. Past performance is not necessarily indicative of future performance or results.
Sources, Completeness and Accuracy: The material herein is based upon information obtained from sources that PCIPL and the research analyst believe to be reliable, but neither PCIPL nor the research analyst represents or guarantees that the information contained herein is accurate or complete and it should not be relied upon as such. Opinions expressed herein are current opinions as of the date appearing on this material and are subject to change without notice. Furthermore, PCIPL is under no obligation to update or keep the information current.
Copyright: The copyright in this research report belongs exclusively to PCIPL. All rights are reserved. Any unauthorized use or disclosure is prohibited. No reprinting or reproduction, in whole or in part, is permit-ted without the PCIPL’s prior consent, except that a recipient may reprint it for internal circulation only and only if it is reprinted in its entirety.
Caution: Risk of loss in trading in can be substantial. You should carefully consider whether trading is appropriate for you in light of your experience, objectives, financial resources and other relevant circumstances.
For U.S. persons only: This research report is a product of Phillip-Capital (India) Pvt Ltd. which is the employer of the research analyst(s) who has prepared the research report. The research analyst(s) preparing the research report is/are resident outside the United States (U.S.) and are not associated persons of any U.S. regulated broker-dealer and therefore the analyst(s) is/are not subject to supervision by a U.S. broker-dealer, and is/are not required to satisfy the regulatory licensing requirements of FINRA or required to otherwise comply with U.S. rules or regulations regarding, among other things, communications with a subject company, public appearances and trading securities held by a research analyst account.
This report is intended for distribution by PhillipCapital (India) Pvt Ltd. only to "Major Institutional Investors" as defined by Rule 15a-6(b)(4) of the U.S. Securities andExchange Act, 1934 (the Exchange Act) and interpretations thereof by U.S. Securities and Exchange Commission (SEC) in reliance on Rule 15a 6(a)(2). If the recipient of this report is not a Major Institutional Investor as specified above, then it should not act upon this report and return the same to the sender. Further, this report may not be copied, duplicated and/or transmitted onward to any U.S. person, which is not the Major Institutional Investor.
In reliance on the exemption from registration provided by Rule 15a-6 of the Exchange Act and interpretations thereof by the SEC in order to conduct certain business with Major Institutional Investors, PhillipCapi-tal (India) Pvt Ltd. has entered into an agreement with a U.S. registered broker-dealer, Marco Polo Securities Inc. ("Marco Polo").Transactions in securities discussed in this research report should be effected through Marco Polo or another U.S. registered broker dealer

PBGROUND VIEW GROUND VIEW 1 - 31 October 2015 1 - 31 October 2015 48