Pg. 209-212 #4-12e, 13-18, 23, 24, 26, 36, 42+43.
18
Pg. 209-212 #4-12e, 13-18, 23, 24, 26, 36, 42+43
-
Upload
gordon-cunningham -
Category
Documents
-
view
228 -
download
0
Transcript of Pg. 209-212 #4-12e, 13-18, 23, 24, 26, 36, 42+43.

Pg. 209-212 #4-12e, 13-18, 23, 24, 26, 36, 42+43

42.) B
43.) D


GRAPHING A LINEAR EQUATION
Rewrite the equation in function form, if necessary.
Choose a few values of x and make a table of values.
Plot the points from the table of values. A line through these points is the graph of the equation.
STEP 1
STEP 2
STEP 3
Vocabulary
Solution of an equation:
Graph of an equation:
an ordered pair, (x, y) that produces a true statement when the values of x and y are substituted into the equation.
the set of points in a coordinate plane that represent all solutions of the equation.

Horizontal and Vertical Lines
All linear equations in x and y can be written in the form A x + B y = C. When A = 0 the equation reduces to B y = C and the graph is a horizontal line. When B = 0 the equation reduces to A x = C and the graph is a vertical line.
EQUATIONS OF HORIZONTAL AND VERTICAL LINES
In the coordinate plane, the graph y = b is a horizontal line.
In the coordinate plane, the graph x = a is a vertical line.
y = b x = a

Substitute 3 for x and 4 for y.
Simplify.
Write original equation.
Check whether each ordered pair is a solution of the equation.
SOLUTION
Which ordered pair is a solution of 3x – y = 7?
EXAMPLE 1 Standardized Test Practice
(3, 4)A (1, –4)B (5, –3)C (–1, –2)D
Test (3, 4):
3(3) – 4 =? 7
3x – y = 7
5 = 7

Simplify.
Write original equation.
Standardized Test PracticeEXAMPLE 1
Test (1, –4): 3x – y = 7
3(1) – (–4) = ? 7 Substitute 1 for x and –4 for y.
So, (3, 4) is not a solution, but (1, – 4) is a solution of 3x – y = 7.
ANSWER
The correct answer is B. A B DC
7 = 7

GUIDED PRACTICE for Example 1
1.) Tell whether 4, – is a solution of x + 2y = 5.12
not a solutionANSWER
Solve the equation for y.SOLUTION
Graph the equation –2x + y = –3.
–2x + y = –3
y = 2x –3
STEP 1
Plot the points. Notice that the points appear to lie on a line.
STEP 3
Make a table by choosing a few values for x & finding the values of y.
x –2 –1 0 1 2
y –7 –5 –3 –1 1
STEP 2
Connect the points by drawing a line
through them. Use arrows to indicate that
the graph goes on without end.
STEP 4
EXAMPLE 2
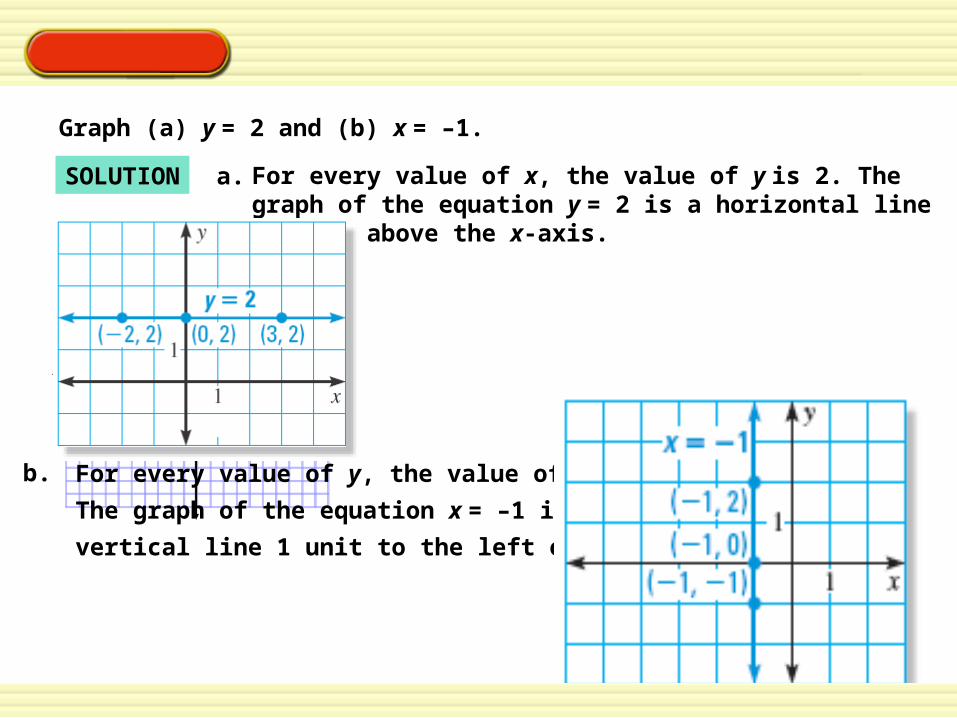
Graph (a) y = 2 and (b) x = –1.
Graph y = b and x = aEXAMPLE 3
SOLUTION For every value of x, the value of y is 2. The graph of the equation y = 2 is a horizontal line 2 units above the x-axis.
a.
For every value of y, the value of x is –1.
The graph of the equation x = –1 is a
vertical line 1 unit to the left of the y-axis.
b.

GUIDED PRACTICE for Examples 2 and 3
Graph the equations.
2.) y + 3x = –2
ANSWER
3.) y = 2.5
ANSWER
4.) x = –4
ANSWER

SOLUTION STEP 1 Make a table. x 0 2 4 6 8
y 4 3 2 1 0
EXAMPLE 4 Graph a linear function
1
2Graph the function y = with domain x 0. –
x + 4
Then identify the range of the function.
STEP 2
STEP 3 Connect the points with a ray because the domain is restricted.
STEP 4 Identify the range. From the graph, you can see that all points have a
y-coordinate of 4 or less, so the range of the function is y ≤ 4.
Plot the points.

GUIDED PRACTICE for Example 4
5. Graph the function y = –3x + 1 with domain x 0.
Then identify the range of the function.
ANSWER y 1

SOLUTION
RUNNING
The distance d (in miles) that a runner travels is given by the function d = 6t where t is the time (in hours) spent running. The runner plans to go for a 1.5 hour run. Graph the function and identify its domain and range.
STEP 1
Identify whether the problem specifies the domain or the range. You know the amount of time the runner plans to spend running. Because time is the independent variable, the domain is specified in this problem. The domain of the function is 0 ≤ t ≤ 1.5.
Solve a multi-step problemEXAMPLE 5
STEP 2Graph the function. Make a table of values. Then plot & connect the points.
t (hours) 0 0.5 1 1.5d (miles) 0 3 6 9
STEP 3Identify the unspecified domain or range.
From the table or graph, you can see
that the range of the function is 0 ≤ d ≤ 9.

SOLUTION
EXAMPLE 6 Solve a related problem
WHAT IF?
Suppose the runner in Example 5 instead plans to run 12 miles. Graph the function and identify its domain and range.
STEP 1
Identify whether the problem specifies the domain or the range. You are given the distance that the runner plans to travel. Because distance is the dependent variable, the range is specified in this problem. The range of the function is 0 ≤ d ≤ 12.
STEP 2 Graph the function. To make a table, you can substitute d-values (be sure to include 0 and 12) into the function d = 6t and solve for t.
t (hours) 0 1 2
d (miles) 0 6 12
STEP 3
Identify the unspecified domain or range. From the table or graph, you can see that the domain of the function is 0 ≤ t ≤ 2.

GUIDED PRACTICE for Examples 5 and 6
GAS COSTS
For gas that costs $2 per gallon, the equation C = 2g gives the cost C (in dollars) of pumping g gallons of gas. You plan to pump $10 worth of gas. Graph the function and identify its domain and range.
domain: 0 ≤ g ≤ 5, range: 0 ≤ C ≤ 10
6.
ANSWER

Summary- How do you graph a linear equation?
- How do you figure out whether an ordered pair is a solution of an equation? Is there more than 1 solution?
- What is the equation for a horizontal line?
- What is the equation for a vertical line?
- Describe the error in the steps: Graph the function x -3 0 3
y 3 1 3
make a table of values that make the equation true, plot those points and connect them as a line.
substitute it in for x and y and see if it makes the equation true. If it’s true, it is a solution. False, it is not. There are more than 1 solutions….there are an infinite # of solutions.
y = some #
x = some #
1st point is incorrect (-3,-1), it should be a straight line

Check YourselfPg. 219-221 # 4-32e, 33, 41-43