Pew Science and Society Report
111
FOR RELEAS Pu on Both cont diffe issue educ A PEW RESE AMERICAN A RECOMMEND E JANUARY 29, 2 ublic Sci h the pu ributio erences es. Bot cation EARCH CENTER S ASSOCIATION FO DED CITATION: Pe 015 c and enc ublic a ons of s in ho th grou falls b STUDY CONDUCT OR THE ADVANCE w Research Cent d Sc ce an and sci scienc ow eac ups ag behind ED IN COLLABOR EMENT OF SCIENC er, January 29, 20 cien nd S ientist ce, but ch perc ree tha other RATION WITH THE CE (AAAS) 015, “Public and n tist Socie s valu there ceives at K-12 nation E FOR FURT ON THIS R Cary Funk, Lee Rainie, Technology Dana Page 202.419.4 www.pewre Scientists’ Views NUMBERS, FAC ts’ V ety e the are la scienc 2 STEM ns. HER INFORMATI EPORT: Associate Directo , Director, Interne y Research , Communication 372 esearch.org s on Science and S CTS AND TRENDS View arge ce M ION or, Research et, Science and s Manager Society” S SHAPING THE W ws WORLD
-
Upload
scott-canon -
Category
Documents
-
view
10.150 -
download
1
description
Pew survey on attitudes about science policy
Transcript of Pew Science and Society Report

FOR RELEAS
PuonBothcontdiffeissueeduc
A PEW RESE
AMERICAN A
RECOMMEND
E JANUARY 29, 2
ublic Sci
h the puributio
erenceses. Botcation f
EARCH CENTER S
ASSOCIATION FO
DED CITATION: Pe
015
c andencublic aons of s in ho
th groufalls b
STUDY CONDUCT
OR THE ADVANCE
w Research Cent
d Scce anand scif sciencow eacups agbehind
ED IN COLLABOR
EMENT OF SCIENC
er, January 29, 20
ciennd Sientistce, but ch perc
ree thaother
RATION WITH THE
CE (AAAS)
015, “Public and
ntistSocie
s valu there
ceivesat K-12nation
E FOR FURTON THIS R
Cary Funk,
Lee Rainie,
Technology
Dana Page
202.419.4
www.pewre
Scientists’ Views
NUMBERS, FAC
ts’ Vety e the are lascienc2 STEMns.
HER INFORMATIEPORT:
Associate Directo
, Director, Interne
y Research
, Communication
372
esearch.org
s on Science and S
CTS AND TRENDS
View
arge ce M
ION
or, Research
et, Science and
s Manager
Society”
S SHAPING THE W
ws
WORLD

2
PEW RESEARCH CENTER
www.pewresearch.org
About This Report
This report is based on a pair of surveys conducted by the Pew Research Center in collaboration
with the American Association for the Advancement of Science (AAAS). It looks at the views of the
general public and scientists about the place of science in American culture, their views about
major science-related issues, and the role of science in public policy.
This is the first of several reports analyzing the data from this pair of surveys. This report focuses
on a comparison of the views of the general public and those of AAAS scientists as a whole. Follow
up reports planned for later this year will analyze views of the general public in more detail,
especially by demographic, religious, and political subgroups. And, some results from the survey of
AAAS scientists will be presented in a follow-up report in mid-February.
This report is a collaborative effort based on the input and analysis of the following individuals.
Find related reports online at http://www.pewresearch.org/science2015
Cary Funk, Associate Director, Research
Lee Rainie, Director Internet, Science and Technology Research
Aaron Smith, Senior Researcher
Kenneth Olmstead, Research Associate
Maeve Duggan, Research Analyst
Dana Page, Communications Manager
The fieldwork for both surveys was conducted by Princeton Survey Research Associates
International. Contact with AAAS members invited to participate in the survey was managed by
AAAS staff with the help of Princeton Survey Research Associates International; AAAS also
covered part of the costs associated with mailing members. All other costs of conducting the pair
of surveys were covered by the Pew Research Center. Pew Research bears all responsibility for the
content, design and analysis of both the AAAS member survey and the survey of the general
public.
Acknowledgements
Special thanks to Jeanne Braha and Tiffany Lohwater of AAAS who facilitated the interactions
between Pew Research and AAAS staff to conduct the survey of members and to Ian King, director
of marketing at AAAS, as well as Elizabeth Sattler and Julianne Wielga, who prepared the random
sample of members and sent out all contacts with AAAS members selected for participation. We
are also grateful to the team at Princeton Survey Research International who led the data
collection efforts for the two surveys.

www.pewresearch.org
About Pew Research Center
Pew Research Center is a nonpartisan fact tank that informs the public about the issues, attitudes
and trends shaping America and the world. It does not take policy positions. It conducts public
opinion polling, demographic research, media content analysis and other empirical social science
research. The center studies U.S. politics and policy views; media and journalism; internet,
science, and technology; religion and public life; Hispanic trends; global attitudes and U.S. social
and demo-graphic trends. All of the center’s reports are available at www.pewresearch.org. Pew
Research Center is a subsidiary of The Pew Charitable Trusts.
Michael Dimock, President
Elizabeth Mueller Gross, Vice President
Robyn Tomlin, Chief Digital Officer
Andrew Kohut, Founding Director
© Pew Research Center 2015
4
PEW RESEARCH CENTER
www.pewresearch.org
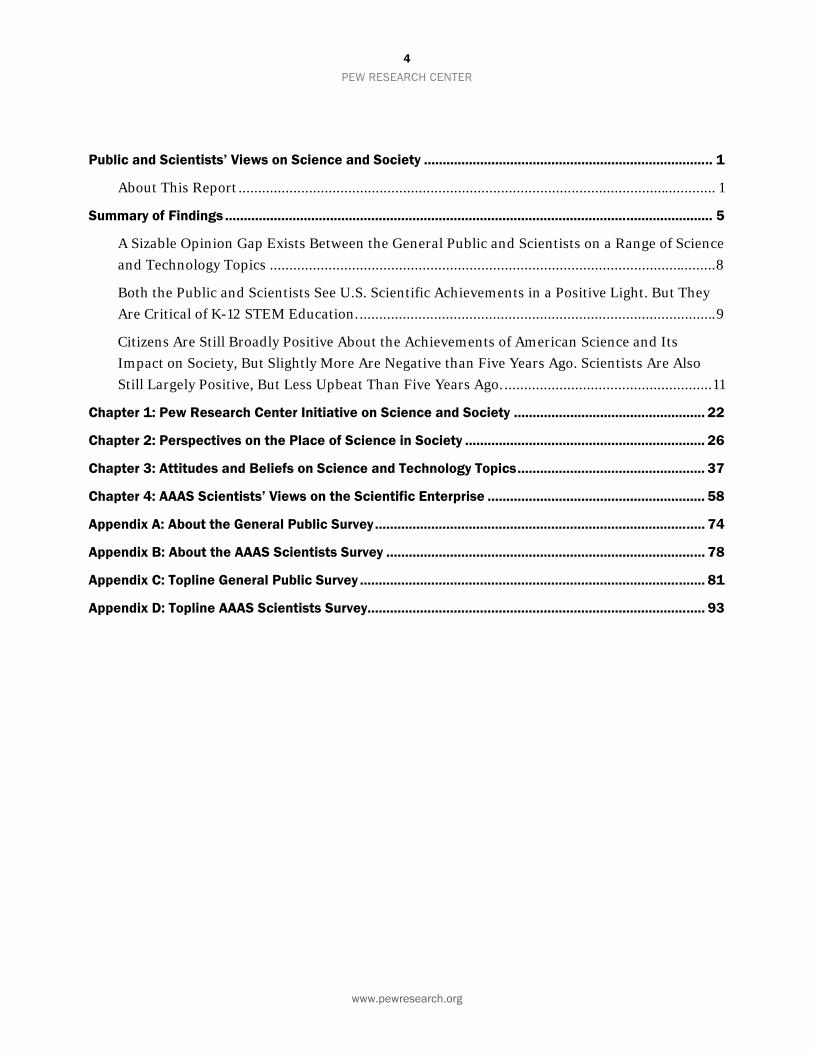
Public and Scientists’ Views on Science and Society ............................................................................. 1
About This Report .......................................................................................................................... 1
Summary of Findings .................................................................................................................................. 5
A Sizable Opinion Gap Exists Between the General Public and Scientists on a Range of Science
and Technology Topics .................................................................................................................. 8
Both the Public and Scientists See U.S. Scientific Achievements in a Positive Light. But They
Are Critical of K-12 STEM Education. ........................................................................................... 9
Citizens Are Still Broadly Positive About the Achievements of American Science and Its
Impact on Society, But Slightly More Are Negative than Five Years Ago. Scientists Are Also
Still Largely Positive, But Less Upbeat Than Five Years Ago. ..................................................... 11
Chapter 1: Pew Research Center Initiative on Science and Society ................................................... 22
Chapter 2: Perspectives on the Place of Science in Society ................................................................ 26
Chapter 3: Attitudes and Beliefs on Science and Technology Topics .................................................. 37
Chapter 4: AAAS Scientists’ Views on the Scientific Enterprise .......................................................... 58
Appendix A: About the General Public Survey ........................................................................................ 74
Appendix B: About the AAAS Scientists Survey ..................................................................................... 78
Appendix C: Topline General Public Survey ............................................................................................ 81
Appendix D: Topline AAAS Scientists Survey.......................................................................................... 93

www.pewresearch.org
Summary of Findings Scientific innovations are deeply embedded in national life – in the economy, in core policy
choices about how people care for themselves and use the resources around them, and in the
topmost reaches of Americans’ imaginations. New Pew Research Center surveys of citizens and a
representative sample of scientists connected to the American Association for the Advancement of
Science (AAAS) show powerful crosscurrents that both recognize the achievements of scientists
and expose stark fissures between scientists and citizens on a range of science, engineering and
technology issues. This report highlights these major findings:
Science holds an esteemed place among citizens and professionals. Americans recognize the accomplishments of scientists in key fields and, despite considerable dispute about the role of government in other realms, there is broad public support for government investment in scientific research.
The key data:
79% of adults say that science has made life easier for most people and a majority is
positive about science’s impact on the quality of health care, food and the environment.
54% of adults consider U.S. scientific achievements to be either the best in the world (15%)
or above average (39%) compared with other industrial countries.
92% of AAAS scientists say scientific achievements in the U.S. are the best in the world
(45%) or above average (47%).
About seven-in-ten adults say that government investments in engineering and technology
(72%) and in basic scientific research (71%) usually pay off in the long run. Some 61% say
that government investment is essential for scientific progress, while 34% say private
investment is enough to ensure scientific progress is made.
At the same time, both the public and scientists are critical of the quality of science, technology, engineering, and math (STEM subjects) in grades K-12.
The key data:
Only 16% of AAAS scientists and 29% of the general public rank U.S. STEM education for
grades K-12 as above average or the best in the world. Fully 46% of AAAS scientists and
29% of the public rank K-12 STEM as “below average.”
75% of AAAS scientists say too little STEM education for grades K-12 is a major factor in
the public’s limited knowledge about science. An overwhelming majority of scientists see
the public’s limited scientific knowledge as a problem for science.
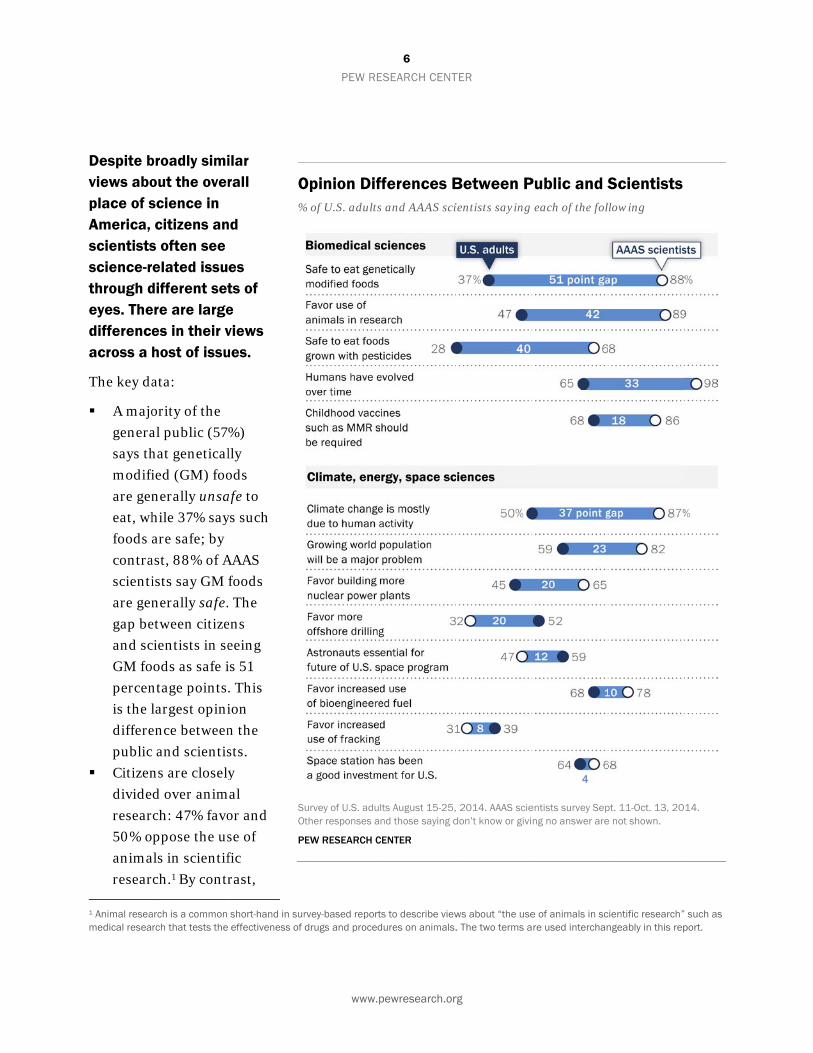
Despite bviews aboplace of sAmerica, scientistsscience-rthrough deyes. Thedifferenceacross a
The key da
A majo
genera
says th
modifi
are gen
eat, wh
foods a
contra
scienti
are gen
gap be
and sc
GM fo
percen
is the l
differe
public
Citizen
divide
resear
50% o
anima
resear 1 Animal reseamedical resea
broadly simiout the overscience in citizens ans often see elated issu
different setere are largees in their vhost of issu
ata:
ority of the
al public (57
hat genetical
ied (GM) foo
nerally unsa
hile 37% say
are safe; by
ast, 88% of A
ists say GM
nerally safe.
etween citize
cientists in se
oods as safe i
ntage points
largest opini
ence between
c and scientis
ns are closely
d over anim
rch: 47% favo
ppose the us
als in scientif
rch.1 By contr
arch is a common rch that tests the
ilar rall
nd es ts of e views ues.
%)
lly
ods
afe to
ys such
AAAS
foods
. The
ens
eeing
is 51
. This
ion
n the
sts.
y
mal
or and
se of
fic
rast, short-hand in sur effectiveness of
O%
SO
P
PEW RE
www.p
rvey-based reportdrugs and proced
Opinion Dif% of U.S. adults
urvey of U.S. aduther responses a
EW RESEARCH C
6
ESEARCH CENT
pewresearch.or
ts to describe viewdures on animals.
fferences Bs and AAAS sci
lts August 15-25,nd those saying d
CENTER
TER
rg
ws about “the use. The two terms a
Between Pientists saying
2014. AAAS sciedon’t know or givi
e of animals in scre used interchan
Public and S each of the fol
entists survey Sepng no answer are
ientific research”ngeably in this rep
Scientists lowing
pt. 11-Oct. 13, 20e not shown.
such as port.
14.
www.pewresearch.org
an overwhelming majority of scientists (89%) favor animal research. The difference in the
share favoring such research is 42 percentage points.
In some areas, like energy, the differences between the groups do not follow a single direction
— they can vary depending on the specific issue. For example, 52% of citizens favor allowing
more offshore drilling, while fewer AAAS scientists (32%), by comparison, favor increased
drilling. The gap in support of offshore drilling is 20 percentage points. But when it comes to
nuclear power, the gap runs in the opposite direction. Forty-five percent of citizens favor
building more nuclear power plants, while 65% of AAAS scientists favor this idea.
The only one of 13 issues compared where the differences between the two groups are
especially modest is the space station. Fully 64% of the public and 68% of AAAS scientists say
that the space station has been a good investment for the country; a difference of four
percentage points.
Compared with five years ago, both citizens and scientists are less upbeat about the scientific enterprise. Citizens are still broadly positive about the place of U.S. scientific achievements and its impact on society, but slightly more are negative than five years ago. And, while a majority of scientists think it is a good time for science, they are less upbeat than they were five years ago. Most scientists believe that policy regulations on land use and clean air and water are not often guided by the best science.
The key data:
While a majority of the public sees U.S. scientific achievements in positive terms, the share
saying U.S. scientific achievements are the best in the world or above average is down 11 points
to 54% today, compared with 65% in 2009.
79% of citizens say that science has made life easier for most people, while just 15% say it has
made life more difficult. However, the balance of opinion is slightly less positive today than in
2009 when positive views outpaced negative ones by a margin of 83% to 10%. A similar
pattern is found in views about the effect of science on the quality of health care, food, and the
environment. In each case, while most adults see a positive effect of science, there is a slight
rise in the share expressing negative views.
52% of AAAS scientists say this is generally a good time for science, down 24 percentage points
from 76% in 2009. Similarly, the share of scientists who say this is generally a good time for
their scientific specialty is down from 73% in 2009 to 62% today. And, the share of AAAS
scientists saying that this is a good or very good time to begin a career in their field now stands
at 59%, down from 67% in 2009.
Only 15% of scientists say they believe policy choices about land use are guided by the best
science most of the time or always; 27% think the best science frequently guides regulations

8
PEW RESEARCH CENTER
www.pewresearch.org
57
11
37
88
U.S. adults
AAAS scientists
Generally unsafe Generally safe
67 28U.S. adults
Scientists not clearScientists clear understanding
about clean air and water; 46% think the best science is frequently used in food safety
regulations and 58% say the same when it comes to regulations about new drug and medical
treatments.
These are some of the findings from a new pair of surveys conducted by the Pew Research Center
in collaboration with the AAAS. The survey of the general public was conducted by landline and
cellular telephone August 15-25, 2014 with a representative sample of 2,002 adults nationwide.
The margin of sampling error for results based on all adults is plus or minus 3.1 percentage points.
The survey of scientists is based on a representative sample of 3,748 U.S.-based members of
AAAS; the survey was conducted online from Sept. 11 to Oct. 13, 2014.2
A Sizable Opinion Gap Exists Between the General Public and Scientists on a Range of Science and Technology Topics
Citizens’ and scientists’ views diverge sharply across a range of science, engineering and
technology topics. Opinion differences occur
on all 13 issues where a direct comparison is
available. A difference of less than 10
percentage points occurs on only two of the 13.
The largest differences between the public and
the AAAS scientists are found in beliefs about
the safety of eating genetically modified (GM)
foods. Nearly nine-in-ten (88%) scientists say
it is generally safe to eat GM foods compared
with 37% of the general public, a difference of
51 percentage points. One possible reason for
the gap: when it comes to GM crops, two-
thirds of the public (67%) say scientists do not
have a clear understanding about the health
effects.
Chapter 3 looks at public and scientists’
attitudes on each of these issues in more detail
along with several topics asked only of the
general public, including access to
2 The AAAS survey is a sample of the U.S. based membership of the organization The margin of sampling error for estimates about the full U.S.-based membership of AAAS is plus or minus 1.7 percentage points.
Wide Differences Between Public and Scientists on Safety of GM Foods % of each group saying it is generally safe or unsafe to eat genetically modified foods
Public Largely Skeptical of Scientific Understanding of Health Effects % of U.S. adults saying that scientists have or do not have a clear understanding about the health effects of GM crops
Survey of U.S. adults August 15-25, 2014.Q38-39. AAAS scientists survey Sept. 11-Oct. 13, 2014. Other responses and those saying don’t know or giving no answer are not shown.
PEW RESEARCH CENTER
www.pewresearch.org
54
51
29
92
64
16
34
29
39
6
22
38
9
20
29
1
13
46
Scientificachievements
Medicaltreatment
K-12 STEM
Scientificachievements
Medicaltreatment
K-12 STEM
Best in world/Above average Average Below average
AAAS scientists
U.S. adults
experimental medical treatments, bioengineering and genetic modifications.
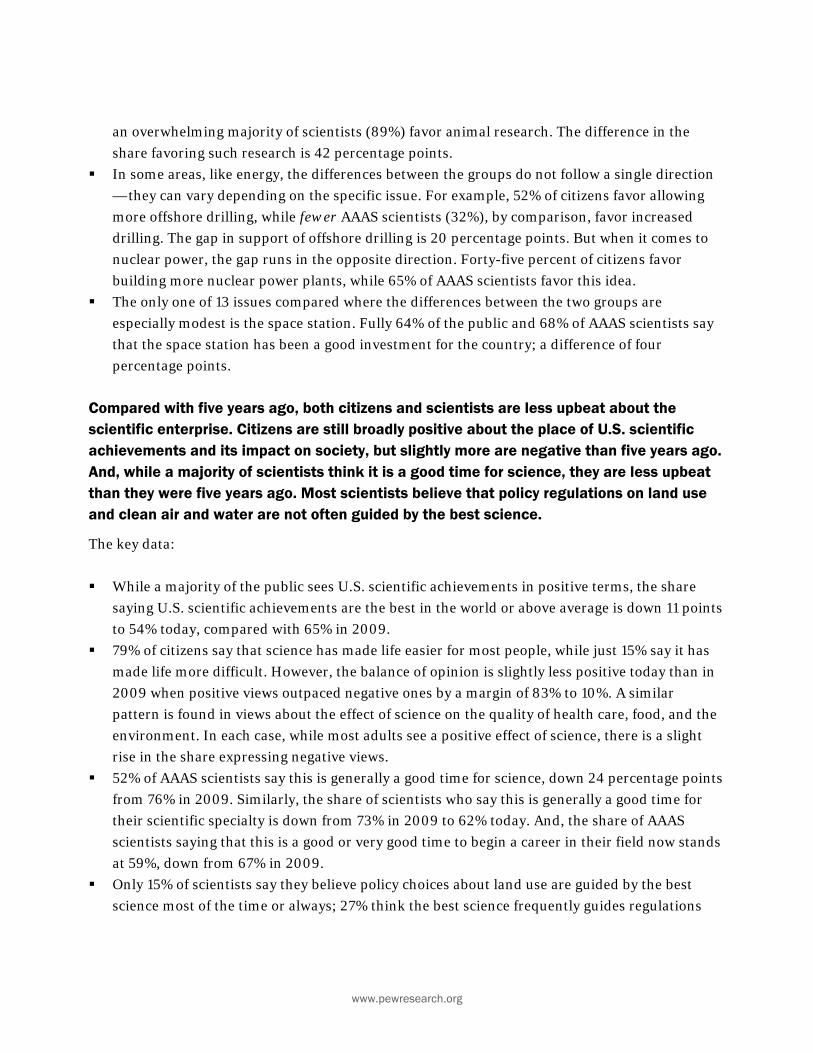
Both the Public and Scientists See U.S. Scientific Achievements in a Positive Light. But They Are Critical of K-12 STEM Education.
Despite differences in views about a range of biomedical and physical science topics, both the
public and scientists give relatively high marks to the nation’s scientific achievements and give
distinctly lower marks to K-12 education in science, technology, engineering and mathematics
(known as STEM). Just 16% of AAAS scientists and 29% of adults in the general public considers
K-12 STEM education in the U.S. to be the best or above average compared with other
industrialized countries. Both groups see U.S.
scientific achievements and medical treatment
in a more positive light, by comparison.
About half of Americans (54%) consider U.S.
scientific achievements to be above average or
among the best in the world. The only aspect
of American society rated more favorably is
the U.S. military system (77%). About half
(51%) also see U.S. medical treatment as in the
top tier compared with other industrialized
countries. Public views about K-12 STEM are
markedly more negative: 29% say it is the best
or above average, while 39% say it is average
and another 29% say it is below average. (For
more on public assessments of key institutions
and industries, including the economy, health
care, and the political system see Chapter 2.)
Compared with the general public, scientists
are even more positive about the place of U.S.
scientific achievements. Fully nine-in-ten
(92%) AAAS scientists consider scientific
achievements in the U.S. to be the best in the
world (45%) or above average (47%). Scientists
also have largely positive views about the
global standing of U.S. medical treatment (64% say it is the best in the world or above average) as
well as other aspects of science and technology including doctoral training (87%), cutting edge
Public and Scientists’ Give High Marks for U.S. Scientific Achievements, Are Critical of K-12 STEM Education % of U.S. adults and AAAS scientists rating scientific achievements, medical treatment, and K-12 STEM education in U.S. compared with other industrialized countries
Survey of U.S. adults August 15-25, 2014. Q2a,gf1,e. AAAS scientists survey Sept. 11-Oct. 13, 2014, Q3,4a,d. Those saying don’t know or giving no answer are not shown.
PEW RESEARCH CENTER
10
PEW RESEARCH CENTER
www.pewresearch.org
75
57
43
40
22
35
46
49
Not enough K-12 STEM
Lack of public interest inscience news
Lack of media interest inscience
Too few scientists whocommunicate findings
Major reason Minor reason
84 14Public doesn't know much
about science
Major problem Minor problem
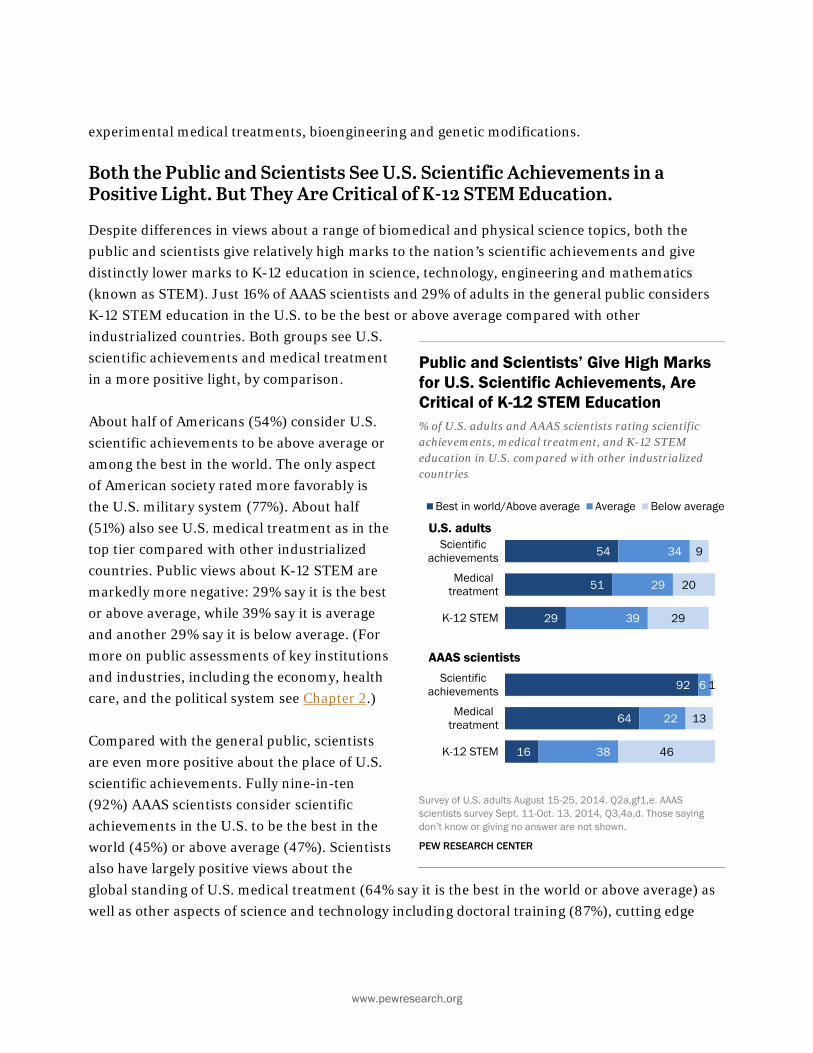
basic research (87%) and industry research and development innovation (81%). Just 16% of
scientists say the same about
K-12 STEM.
Among scientists, the public’s
knowledge about science — or
lack thereof — is widely
considered to be a major
(84%) or minor (14%)
problem for the field.
And when asked about four
possible reasons for the public
having limited science
knowledge, three-quarters of
AAAS scientists in the new
survey say too little K-12
STEM education is a major
factor.
Scientists’ Perspective: Limited Public Knowledge About Science Is a Major Problem % of AAAS scientists saying… is a major or minor problem for science in general
AAAS scientists survey Sept 11-Oct 13, 2014. Q5d. Those saying this is not a problem or giving no answer are not shown.
PEW RESEARCH CENTER
Scientists’ Perspective: Too Little K-12 STEM Linked to Limited Public Science Knowledge % of AAAS scientists saying each is a major/minor reason for the U.S. public having limited knowledge about science
AAAS scientists survey Sept 11-Oct 13, 2014. Q6a-d. Those saying not a reason or giving no answer are not shown.
PEW RESEARCH CENTER
www.pewresearch.org
Citizens Are Still Broadly Positive About the Achievements of American Science and Its Impact on Society, But Slightly More Are Negative than Five Years Ago. Scientists Are Also Still Largely Positive, But Less Upbeat Than Five Years Ago.
A number of the questions asked in these new surveys repeat questions that Pew Research Center
asked citizens and scientists in 2009. In key areas, both the public and AAAS scientists are less
upbeat today.
Among the public, perceptions of the scientific enterprise and its contribution to society, while still
largely positive, are a little less rosy than five years ago. Fewer citizens see U.S. scientific
contributions as top tier compared with other nations. And, while most adults see positive
contributions of science on life overall and on the quality of health care, food and the environment,
there is a slight rise in negative views in each area. Similarly, most citizens say government
investment in research pays off in the long run, but slightly more are skeptical about the benefits
of government spending today than in 2009. While the change is modest on several of these
measures, the share expressing negative views on each is slightly larger today than in 2009.3
Scientists’ views have moved in the same direction. Though scientists hold mostly positive
assessments of the state of science and their scientific specialty today, they are less sanguine than
they were in 2009 when Pew Research conducted a previous survey of AAAS members. The
downturn is shared widely among AAAS scientists regardless of discipline and employment sector.
3The General Social Survey (GSS) has tracked public confidence in key institutions since the 1970s. In the most recent survey, completed in 2012, four-in-ten (40%) adults had “a great deal of confidence” in the scientific community, 49% had “only some” confidence and 7% had “hardly any” confidence. The share of adults holding a great deal of confidence in the scientific community has been fairly stable since the 1970’s, though there has been long-term declines in confidence across the set of 12 institutions. See Tom W. Smith and Jaesok Son, May 2013, “Trends in Public Attitudes about Confidence in Institutions.” A multivariate analysis of the same data through 2010 by Gordon Gauchat suggest a long term decline in trust of the scientific community among political conservatives, particularly those with more education. See “Politicization of Science in the Public Sphere: A Study of Public Trust in the United States, 1974 to 2010,” American Sociological Review, 77(2):167-187.
12
PEW RESEARCH CENTER
www.pewresearch.org
54
65
34
26
9
5
2014
2009
Best in world/Above average Average Below average
U.S. scientific achievements
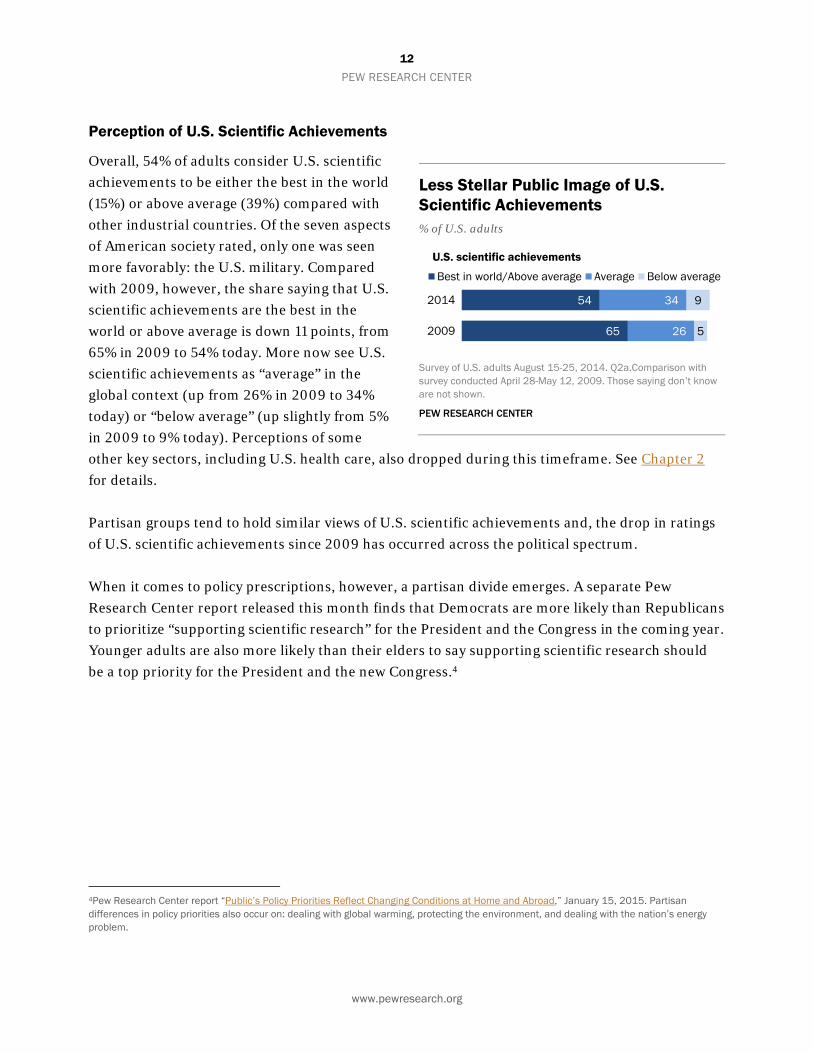
Perception of U.S. Scientific Achievements
Overall, 54% of adults consider U.S. scientific
achievements to be either the best in the world
(15%) or above average (39%) compared with
other industrial countries. Of the seven aspects
of American society rated, only one was seen
more favorably: the U.S. military. Compared
with 2009, however, the share saying that U.S.
scientific achievements are the best in the
world or above average is down 11 points, from
65% in 2009 to 54% today. More now see U.S.
scientific achievements as “average” in the
global context (up from 26% in 2009 to 34%
today) or “below average” (up slightly from 5%
in 2009 to 9% today). Perceptions of some
other key sectors, including U.S. health care, also dropped during this timeframe. See Chapter 2
for details.
Partisan groups tend to hold similar views of U.S. scientific achievements and, the drop in ratings
of U.S. scientific achievements since 2009 has occurred across the political spectrum.
When it comes to policy prescriptions, however, a partisan divide emerges. A separate Pew
Research Center report released this month finds that Democrats are more likely than Republicans
to prioritize “supporting scientific research” for the President and the Congress in the coming year.
Younger adults are also more likely than their elders to say supporting scientific research should
be a top priority for the President and the new Congress.4
4Pew Research Center report “Public’s Policy Priorities Reflect Changing Conditions at Home and Abroad,” January 15, 2015. Partisan differences in policy priorities also occur on: dealing with global warming, protecting the environment, and dealing with the nation’s energy problem.
Less Stellar Public Image of U.S. Scientific Achievements % of U.S. adults
Survey of U.S. adults August 15-25, 2014. Q2a.Comparison with survey conducted April 28-May 12, 2009. Those saying don’t know are not shown.
PEW RESEARCH CENTER
www.pewresearch.org
15
10
79
83
2014
2009
More difficult EasierLife for most people
18
10
79
85
2014
2009
Mostly negative Mostly positive
Health care
34
24
62
66
2014
2009Food
31
23
62
66
2014
2009The environment
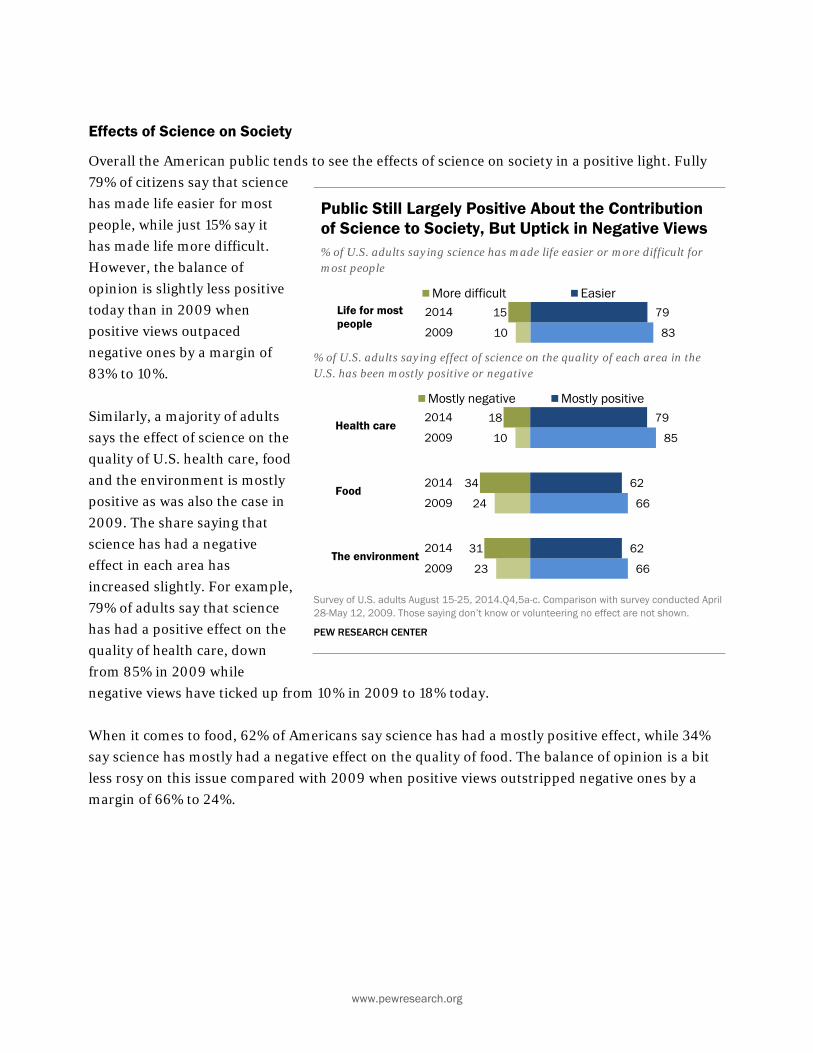
Effects of Science on Society
Overall the American public tends to see the effects of science on society in a positive light. Fully
79% of citizens say that science
has made life easier for most
people, while just 15% say it
has made life more difficult.
However, the balance of
opinion is slightly less positive
today than in 2009 when
positive views outpaced
negative ones by a margin of
83% to 10%.
Similarly, a majority of adults
says the effect of science on the
quality of U.S. health care, food
and the environment is mostly
positive as was also the case in
2009. The share saying that
science has had a negative
effect in each area has
increased slightly. For example,
79% of adults say that science
has had a positive effect on the
quality of health care, down
from 85% in 2009 while
negative views have ticked up from 10% in 2009 to 18% today.
When it comes to food, 62% of Americans say science has had a mostly positive effect, while 34%
say science has mostly had a negative effect on the quality of food. The balance of opinion is a bit
less rosy on this issue compared with 2009 when positive views outstripped negative ones by a
margin of 66% to 24%.
Public Still Largely Positive About the Contribution of Science to Society, But Uptick in Negative Views % of U.S. adults saying science has made life easier or more difficult for most people
% of U.S. adults saying effect of science on the quality of each area in the U.S. has been mostly positive or negative
Survey of U.S. adults August 15-25, 2014.Q4,5a-c. Comparison with survey conducted April 28-May 12, 2009. Those saying don’t know or volunteering no effect are not shown.
PEW RESEARCH CENTER
Similarly,
the enviro
with 2009
and 23% s
These mod
among bo
who lean R
independe
Republica
health car
Democrat
Both Repu
about the
science’s e
there are n
when it co
environme
independe
the effect
in the U.S
Democrat
Democrat
science an
forthcomi
more say sc
onment toda
9 when 66%
said it had a
dest changes
th Republica
Republican)
ents who lea
ans’ views ab
re and food h
ts.
ublicans and
same amoun
effect on the
no significan
omes to the o
ent. Two-thi
ents who lea
of science on
. has been m
ts and indepe
tic Party. (A
nd technolog
ing later this
cience has ha
y. But, the b
said science
negative eff
s over time h
ans (includin
as well as D
an Democrat
bout the effec
have changed
d Democrats
nt in their as
quality of th
nt difference
overall effect
irds (66%) o
an to the Rep
n the quality
mostly positiv
endents who
detailed look
gy topics by p
s year).
PEW RE
www.p
ad a positive
balance of op
e had a positi
fect.
have occurre
ng independ
Democrats (i
tic). Howeve
ct of science
d more than
have shifted
ssessment of
he environm
es by party af
t of science o
of Republican
publican Par
y of the envir
ve, as do 61%
o lean towar
k at attitude
political grou
14
ESEARCH CENT
pewresearch.or
e (62%) than
pinion on thi
ive effect
ed
dents
ncluding
er,
on
n those of
d by
f
ment;
ffiliation
on the
ns and
rty say
ronment
% of
d the
es about
ups is
TER
rg
n negative (3
is issue has s
PerceiveScientisMedicalA 2013 Pemilitary atoccupatiocontributifollowed bdoctors (6engineerseach of thsame in 2were modappreciat
Public appcontributiin 2009 tocorresponsaying scimuch” or 5% in 200contributi2009 to 6engineersin 2009 a
Adults undgraduatestheir asseengineersand ideoloin views ascientists about me“Public EsJuly 11, 2
1%) effect on
shifted some
ed Contribusts, Engineel Doctors toew Research rt the top of the
onal groups seng “a lot” to sby teachers (766%), scientists (63%). The ohe 10 groups w2013 as in 200dest declines iion for severa
preciation of son dropped 5 o 65% in 2013nding uptick toentists contrib “nothing at al09. Views of mon fell 3 point
66% in 2013. Ts stayed aboutand 63% in 20
der age 50 ans tended to beessments of scs and medical ogical differen
about the cont and engineerdical doctors.
steem for Milit013.
n the quality
ewhat compa
utions of ers, and o Society report found te list of 10
een as ociety (78%), 2%), medical ts (65%) and rder of ratingswas roughly th09, though then public l occupations.
scientists’ points from 73 with a o 8% in those bute “not very l” compared w
medical doctorsts from 69% inThose of t the same (64
013).
nd college e more upbeatcientists, doctors. Partisnces were fountribution of rs but not in vi For details setary Still High,”
y of
ared
he
s for he ere
.
70%
y with s’
n
4%
t in
san nd
ews ee ”

www.pewresearch.org
22
17
72
74
2014
2009
Not worth it Pays off in the long run
Engineering & technology
24
18
71
73
2014
2009
Not worth it Pays off in the long run
Basic science
61
60
34
29
5
11
2014
2009
Government investment essentialPrivate investment will be enoughDon't know
Public Support for Research Funding Since 2009
A majority of the public sees
societal benefit from
government investment in
science and engineering
research. Roughly seven-in-
ten adults say that
government investment in
engineering and technology
(72%) as well as basic science
research (71%) pays off in the
long run while a minority says
such spending is not worth it
(22% and 24%, respectively).
Positive views about the value
of government investment in
each area is about the same
as in 2009, though negative
views that such spending is
not worth it have ticked up 5
points for engineering and
technology research and 6
points for basic science
research.
Views about the role of
government funding as
compared with private
investment show steady
support for government
investment (61% in 2014 and 60% in 2009) but, there is a slight rise in the view that private
investment, without government funds, will be enough to ensure scientific progress (from 29% in
2009 to 34% today). The modest difference over time stems from more expressing an opinion
today than did so five years ago.
Support for Funding Holds Steady, Slight Rise in Naysayers % of U.S. adults saying that government investments in each area usually pay off in the long run or are not worth it
Survey of U.S. adults August 15-25, 2014.Q12a-b. Comparison with survey conducted April 28-May 12, 2009. Those saying don’t know are not shown.
PEW RESEARCH CENTER
Views About Government, Private Research Funding % of U.S. adults saying that government investment is essential for scientific progress or that private investment will ensure that enough scientific progress is made, even without government investment
Survey of U.S. adults August 15-25, 2014.Q13 Comparison with survey conducted April 28-May 12, 2009.
PEW RESEARCH CENTER
16
PEW RESEARCH CENTER
www.pewresearch.org
52 42U.S. adults
Scientists are divided Scientists generally believe"the Big Bang"
37 57U.S. adults
Scientists do not agree Scientists generally agreeClimate Change
29 66U.S. adults
Scientists do not agree Scientists generally agreeEvolution
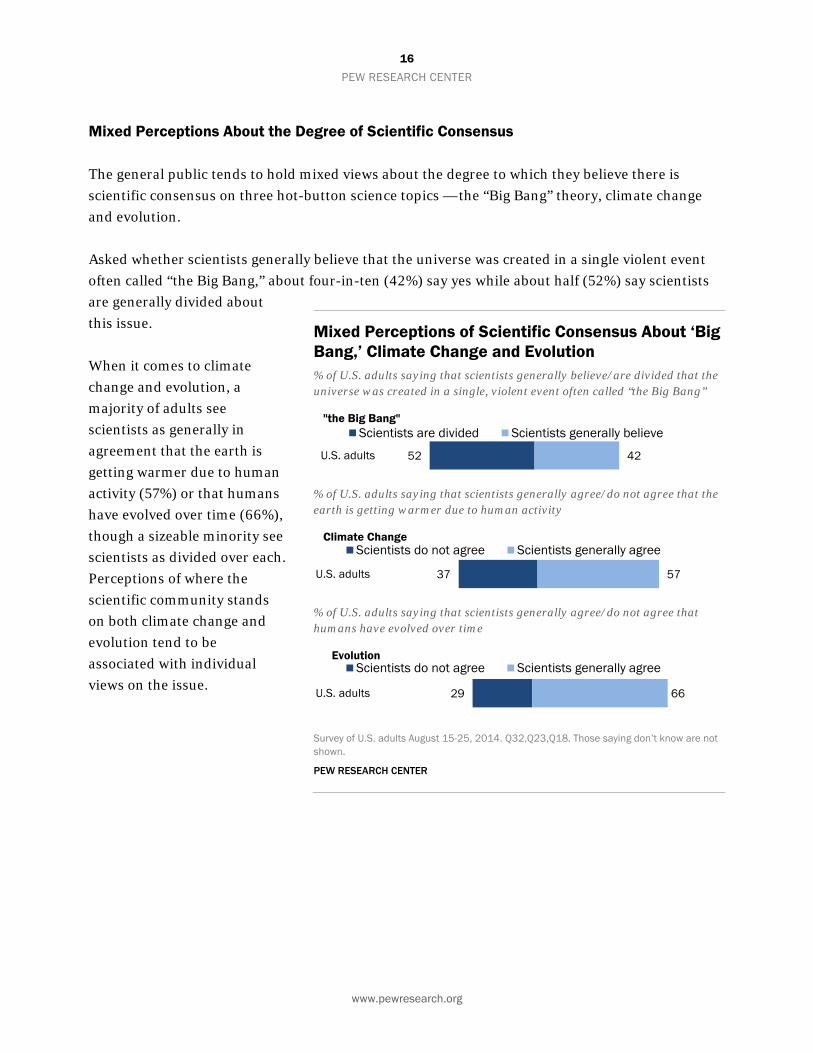
Mixed Perceptions About the Degree of Scientific Consensus
The general public tends to hold mixed views about the degree to which they believe there is
scientific consensus on three hot-button science topics — the “Big Bang” theory, climate change
and evolution.
Asked whether scientists generally believe that the universe was created in a single violent event
often called “the Big Bang,” about four-in-ten (42%) say yes while about half (52%) say scientists
are generally divided about
this issue.
When it comes to climate
change and evolution, a
majority of adults see
scientists as generally in
agreement that the earth is
getting warmer due to human
activity (57%) or that humans
have evolved over time (66%),
though a sizeable minority see
scientists as divided over each.
Perceptions of where the
scientific community stands
on both climate change and
evolution tend to be
associated with individual
views on the issue.
Mixed Perceptions of Scientific Consensus About ‘Big Bang,’ Climate Change and Evolution % of U.S. adults saying that scientists generally believe/are divided that the universe was created in a single, violent event often called “the Big Bang”
% of U.S. adults saying that scientists generally agree/do not agree that the earth is getting warmer due to human activity
% of U.S. adults saying that scientists generally agree/do not agree that humans have evolved over time
Survey of U.S. adults August 15-25, 2014. Q32,Q23,Q18. Those saying don’t know are not shown.
PEW RESEARCH CENTER
www.pewresearch.org
48
23
37
25
41
32
52
76
62
73
59
67
2014
2009
2014
2009
2014
2009
Bad time Good timeFor science
For their specialty
To begin a career in specialty
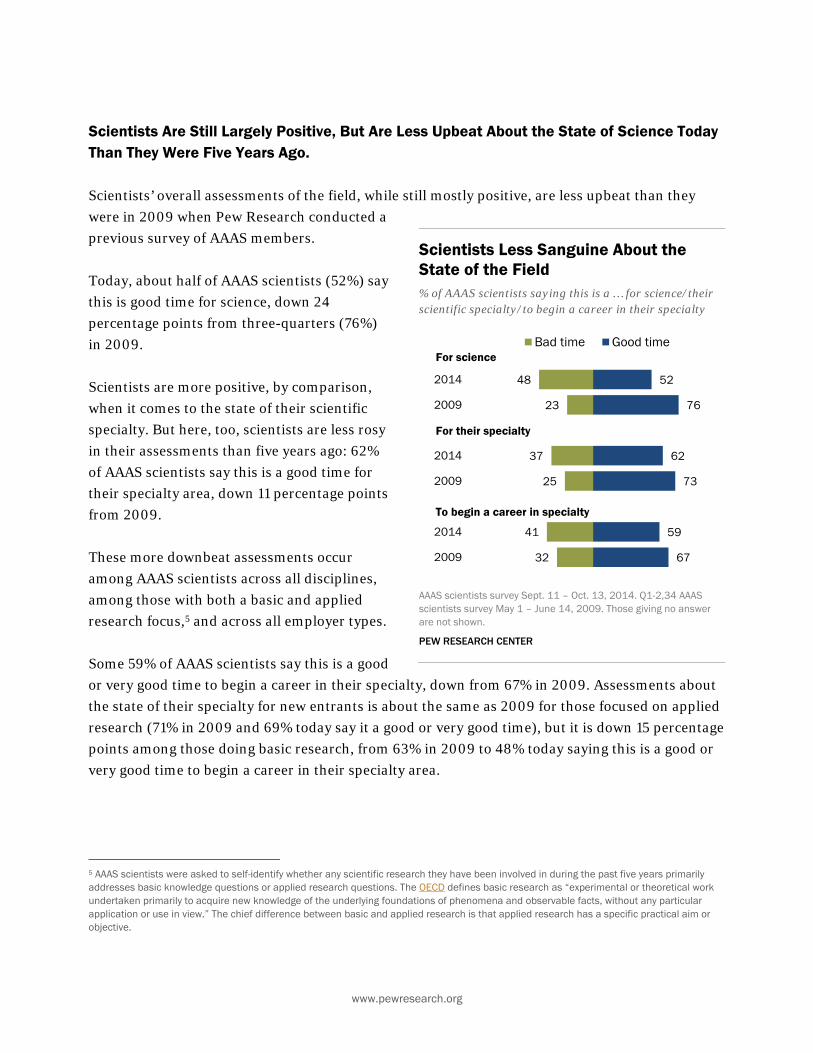
Scientists Are Still Largely Positive, But Are Less Upbeat About the State of Science Today Than They Were Five Years Ago.
Scientists’ overall assessments of the field, while still mostly positive, are less upbeat than they
were in 2009 when Pew Research conducted a
previous survey of AAAS members.
Today, about half of AAAS scientists (52%) say
this is good time for science, down 24
percentage points from three-quarters (76%)
in 2009.
Scientists are more positive, by comparison,
when it comes to the state of their scientific
specialty. But here, too, scientists are less rosy
in their assessments than five years ago: 62%
of AAAS scientists say this is a good time for
their specialty area, down 11 percentage points
from 2009.
These more downbeat assessments occur
among AAAS scientists across all disciplines,
among those with both a basic and applied
research focus,5 and across all employer types.
Some 59% of AAAS scientists say this is a good
or very good time to begin a career in their specialty, down from 67% in 2009. Assessments about
the state of their specialty for new entrants is about the same as 2009 for those focused on applied
research (71% in 2009 and 69% today say it a good or very good time), but it is down 15 percentage
points among those doing basic research, from 63% in 2009 to 48% today saying this is a good or
very good time to begin a career in their specialty area.
5 AAAS scientists were asked to self-identify whether any scientific research they have been involved in during the past five years primarily addresses basic knowledge questions or applied research questions. The OECD defines basic research as “experimental or theoretical work undertaken primarily to acquire new knowledge of the underlying foundations of phenomena and observable facts, without any particular application or use in view.” The chief difference between basic and applied research is that applied research has a specific practical aim or objective.
Scientists Less Sanguine About the State of the Field % of AAAS scientists saying this is a … for science/their scientific specialty/to begin a career in their specialty
AAAS scientists survey Sept. 11 – Oct. 13, 2014. Q1-2,34 AAAS scientists survey May 1 – June 14, 2009. Those giving no answer are not shown.
PEW RESEARCH CENTER

18
PEW RESEARCH CENTER
www.pewresearch.org
83
45
45
13
41
43
2
9
8
Federalfunding
Industryfunding
Privatefoundations
Harder today About the same Easier today
There are a number of possible reasons for
scientists’ less optimistic assessments over this
period including the different economic and
political contexts,6 heightened concerns
among scientists about the research funding
environment, and, perhaps, what scientists see
as the limited impact their work is having on
policy regulations.
Fully 83% of AAAS scientists report that
obtaining federal research funding is harder
today than it was five years ago. More than
four-in-ten say the same about industry
funding (45%) and private foundation funding
(45%) compared with five years ago. Further,
when asked to consider each of seven potential
issues as a “serious problem for conducting
high quality research today,” fully 88% of AAAS scientists say that a lack of funding for basic
research is a serious problem, substantially more than any of the other issues considered.7
6 While the 2009 survey was conducted when the Great Recession was taking hold, there was also a promise of scientific funding through the American Recovery and Reinvestment Act of 2009 around the same time. 7 For data on trends in research funding from government and industry sources see Chapters 4, 5 and 6 in the Science and Engineering Indicators 2014. The Congressional Research Office reviews federal research and development funding across agencies over recent years. The AAAS also compiles trend data on federal government research funding.
Most Scientists Say Finding Federal Funding Harder Today % of AAAS scientists saying that compared with five years ago funding in their specialty area from each source is …
AAAS scientists survey Sept. 11 – Oct. 13, 2014. Q9-11. Those giving no response are not shown.
PEW RESEARCH CENTER
www.pewresearch.org
58
46
27
15
41
52
72
84
New drug andmedical treatment
Food safety
Clean air and water
Land use
Always/Most of time Some of time/Never
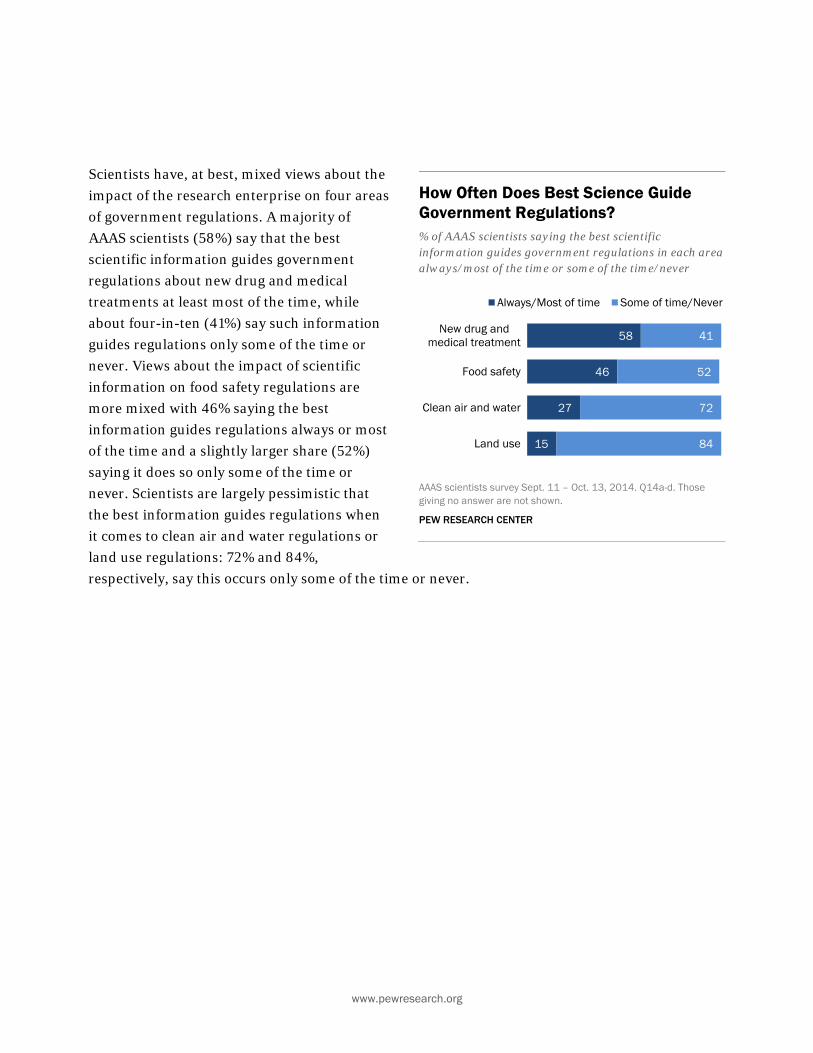
Scientists have, at best, mixed views about the
impact of the research enterprise on four areas
of government regulations. A majority of
AAAS scientists (58%) say that the best
scientific information guides government
regulations about new drug and medical
treatments at least most of the time, while
about four-in-ten (41%) say such information
guides regulations only some of the time or
never. Views about the impact of scientific
information on food safety regulations are
more mixed with 46% saying the best
information guides regulations always or most
of the time and a slightly larger share (52%)
saying it does so only some of the time or
never. Scientists are largely pessimistic that
the best information guides regulations when
it comes to clean air and water regulations or
land use regulations: 72% and 84%,
respectively, say this occurs only some of the time or never.
How Often Does Best Science Guide Government Regulations? % of AAAS scientists saying the best scientific information guides government regulations in each area always/most of the time or some of the time/never
AAAS scientists survey Sept. 11 – Oct. 13, 2014. Q14a-d. Those giving no answer are not shown.
PEW RESEARCH CENTER
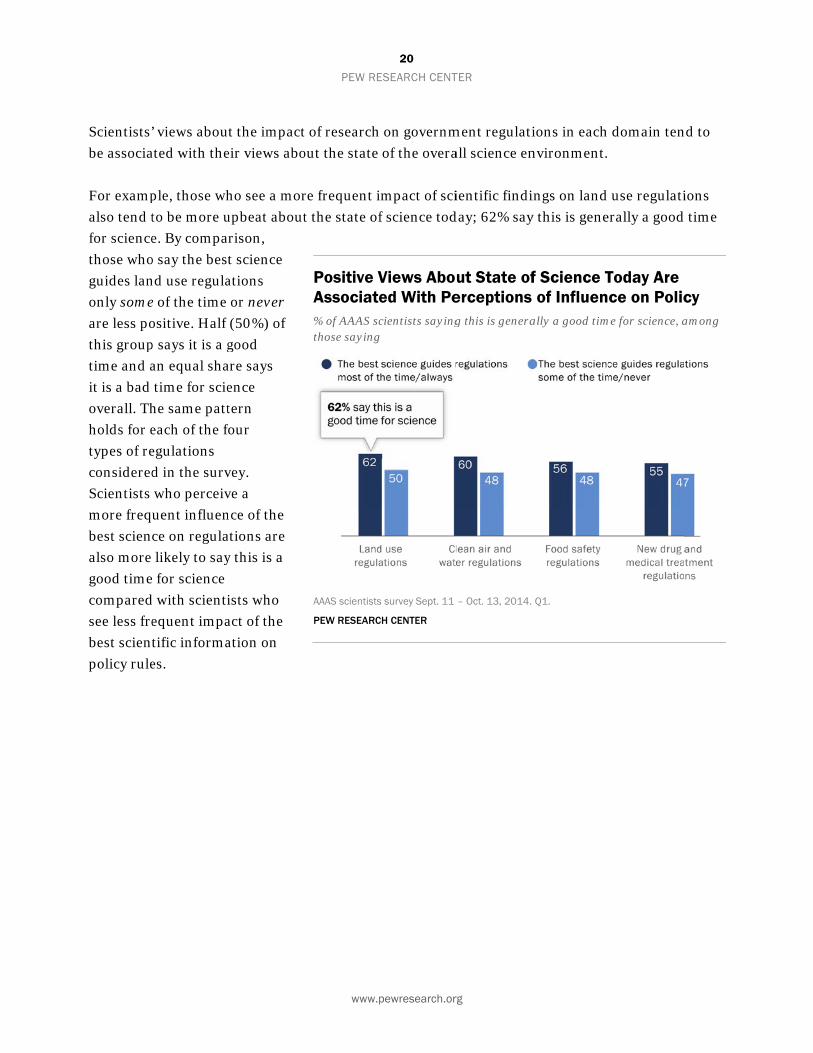
Scientists’
be associa
For examp
also tend t
for science
those who
guides lan
only some
are less po
this group
time and a
it is a bad
overall. Th
holds for e
types of re
considered
Scientists
more freq
best scien
also more
good time
compared
see less fre
best scient
policy rule
’ views abou
ated with the
ple, those wh
to be more u
e. By compa
o say the best
nd use regula
e of the time
ositive. Half
p says it is a g
an equal sha
time for scie
he same patt
each of the f
egulations
d in the surv
who perceiv
uent influen
ce on regula
likely to say
e for science
d with scienti
equent impa
tific informa
es.
t the impact
eir views abo
ho see a mor
upbeat about
rison,
t science
ations
or never
(50%) of
good
are says
ence
tern
four
vey.
ve a
nce of the
ations are
y this is a
ists who
act of the
ation on
PEW RE
www.p
t of research
out the state
re frequent i
t the state of
Positive VAssociate% of AAAS scthose saying
AAAS scientists
PEW RESEARC
20
ESEARCH CENT
pewresearch.or
on governm
of the overa
mpact of sci
f science tod
Views Aboed With Pecientists saying
s survey Sept. 11
CH CENTER
TER
rg
ment regulati
all science en
ientific findi
day; 62% say
ut State oferceptions g this is genera
– Oct. 13, 2014.
ions in each
nvironment.
ings on land
y this is gene
f Science T of Influenally a good tim
Q1.
domain ten
use regulati
erally a good
Today Are ce on Polic
me for science, a
nd to
ions
time
cy among

Roadmap
The remai
engineerin
and review
looks at ov
contributi
Chapter 3
biomedica
compariso
and also c
experimen
genetic mo
consensus
scientists
concerns f
those new
the experi
AAAS scie
detailed re
as well as
results for
p to the repo
inder of this
ng and techn
ws some of th
verall views
ions of scien
covers attitu
al and physic
ons between
covers public
ntal drugs, b
odifications
s. Chapter 4
about the sc
facing the sc
wly entering c
iences and b
entists in the
eport on the
the full ques
r each questi
ort
report detai
nology topics
he key cavea
about scienc
ce to society
udes and bel
cal science to
the public a
c attitudes on
bioengineerin
and percept
examines th
cientific ente
cientific com
careers in sc
ackground c
e survey. App
methodolog
stion wordin
ion in this re
www.p
ils the findin
s. Chapter 1
ats and conc
ce and societ
y, and views
liefs about a
opics. It focu
and AAAS sc
n access to
ng of artifici
tions of scien
he views of A
erprise, issue
mmunity, and
cience. It also
characteristi
pendices pro
gy used in ea
ng and frequ
eport.
pewresearch.or
ngs on both p
briefly outli
cerns in cond
ty, the image
about gover
a range of
uses on
cientists
al organs,
ntific
AAAS
es and
d issues for
o includes
ics of the
ovide a
ach survey
ency
rg
public and s
ines related P
ducting resea
e of the U.S.
rnment fund
What iThe AmeAdvanceworld’s land as sdisciplinFoundedSciencecirculatejournalsinternatwhose mseeking engineethe worl
scientists’ vie
Pew Researc
arch in this a
. as a global
ding for scien
s the AAASerican Associaement of Scienlargest generasuch, encompanes in the scied in 1848, AAA, one of the med peer-reviews in the world. ional non-prof
mission is broa to "advance sring, and innod for the bene
ews about sc
ch Center stu
area. Chapte
leader, perc
ntific researc
S? ation for the nce (AAAS) is tal scientific soasses all ntific communAS publishes
most widely-wed scientific It is an fit organizationadly defined asscience, ovation througefit of all peop
cience,
udies
er 2
eived
ch.
the ciety,
nity.
n s
hout le."
ChapScienScience is
drawn reg
since its fo
related po
exploratio
Research’s
relative pr
policy issu
1990s as t
mattered m
intersectio
such matt
treatment
Research C
of digital t
ongoing su
With this
more delib
intersectio
public opi
religious a
the econom
a sustaine
scientists
scientific i
in the new
terms of th
are contrib
data” is m
where peo
scientific i
Pew Resea
and challe
pter 1: nce an a big, spraw
gular attentio
ounding. Pub
olicy matters
on to medica
s values que
riority that c
ues has been
the center as
most to them
on of people
ers as evolut
t issues have
Center’s sinc
technology in
ubject for stu
report, the P
berate and fo
on of science
inion, to poli
and ethical c
my. In the co
ed effort to u
think about
information
w media ecol
heir knowled
buting to sci
making an im
ople’s moral
innovations
arch is doing
enges are inf
Pew Rnd Soci
wling cluster
on from the
blic attitude
s from pollut
al practices h
estions since
citizens assig
n a standard
sked people t
m. Questions
’s spiritual a
tion, cloning
e been subjec
ce the 1990s
n people’s liv
udy at Pew R
Pew Researc
ormal comm
e with all asp
itics and pol
consideration
oming years
understand w
science-rela
is dissemina
ogy, where A
dge about sc
ientific ende
mpact on scie
and spiritua
and shape p
g this becaus
fluencing an
PEW RE
www.p
Researiety of subjects t
Pew Researc
es about scien
tion to space
have been pa
the late 198
gn to science
query since
to rank the i
s about the
and moral be
g, or end-of-
cts of study b
s. The particu
ves has been
Research sin
ch Center ma
mitment to st
pects of socie
licy-making,
ns, to educat
s, Pew Resea
what citizens
ated matters
ated and un
Americans s
cience, how a
eavors, wher
ntific inquir
al issues con
policies arou
se scientific a
ever-greate
22
ESEARCH CENT
pewresearch.or
rch Ce
that has
ch Center
nce-
e
art of Pew
80s. The
e-related
the mid-
ssues that
eliefs on
life
by the Pew
ular place
n an
nce 2000.
arks a
tudy the
ety from
to
tion and
arch plans
s and
, how
derstood
tand in
amateurs
e “big
ry, and
nect with
und them.
advances
r share of
TER
rg
enter I
About AAAS SThe genconductlandlinenational2,002 aattitudesmaps thrange ofscience error foris +/- 3.Appendisurvey m
The survconductof 3,748from Semargin oabout thAAAS is points Sthe surv
Where pto a sim2009. Tconductlandline2,001 aAAAS meMay 1 tosample AAAS. SeScientist2009.
Initiat
the GeneraScientist Sueral public su
ted August 15-e and cellular tlly representat
adults. The surs about scienc
he contours of f issues within and technologr results based1 percentage ix A for more dmethodology.
vey of AAAS scted online with8 U.S.-based mpt. 11 to Oct 1of sampling erhe full U.S.-basplus or minus
See Appendix Bvey methodolo
possible, compilar pair of sur
The general puted April 28-Me and cellular tadults nationwembers was co June 14, 20of 2,533 U.S.-ee “Public Prats Fault Public
tive on
al Public andurveys rvey was -25, 2014, by telephone, amtive sample ofrvey tracks pubce in society a opinion on a w
n the domain ogy. The margind on the full sa points. See details on the
cientists was h a random samembers of AA13, 2014. Therror for estimased membershs 1.7 percentaB for details abogy.
parisons are mrveys conducte
ublic survey waay 12, 2009 btelephone with
wide. The surveonducted onli09 with a rand-based memb
aises Science; c, Media,” July
n
d
mong a f blic
and wide of n of ample
ample AAS e ates hip of ge bout
made ed in as by h ey of ne dom ers of y 9,
www.pewresearch.org
American and global life. The pace of innovation and the urgency of scientific issues have captured
a growing share of policy energy and at times generated more and more dispute.
Studying science-related topics comes with some inherent challenges. The breadth and complexity
of the issues can be daunting. Translating complicated scientific ideas into research questions that
can be addressed by the general public can be particularly hard to do. Even understanding who
engages in the scientific enterprise has long been a subject where reasonable minds hold
differences of opinion. Thus, we offer this work with some caveats.
Caveats about the survey questionnaires
This pair of surveys is designed to cover a broad spectrum of science, engineering and technology
attitudes, but the collection of topics is by no means comprehensive. In the end, the set of topics
reflects Pew Research editorial judgment about issues of wide enough public attention to feasibly
include in a survey as well as practical time and space limits inherent to the research method.
Most of the survey questions ask for relatively simple judgments about potentially complex issues.
For example, questions about the appropriate use of medical advances ask for respondents’
summary judgments about what can be difficult ethical issues. Similarly, asking about whether one
favors or opposes the increased use of hydraulic fracturing is but one of many questions one could
ask about “fracking.” It does not capture related judgments about the issue, such as perceived risks
or benefits of “fracking” or the relative value of “fracking” compared with other forms of energy
development.
In future research, we expect to explore specific topics related to science and technology in more
depth. The trade-off in this pair of surveys was to cover a wider range of topics with just one, two
or sometimes three questions about each.
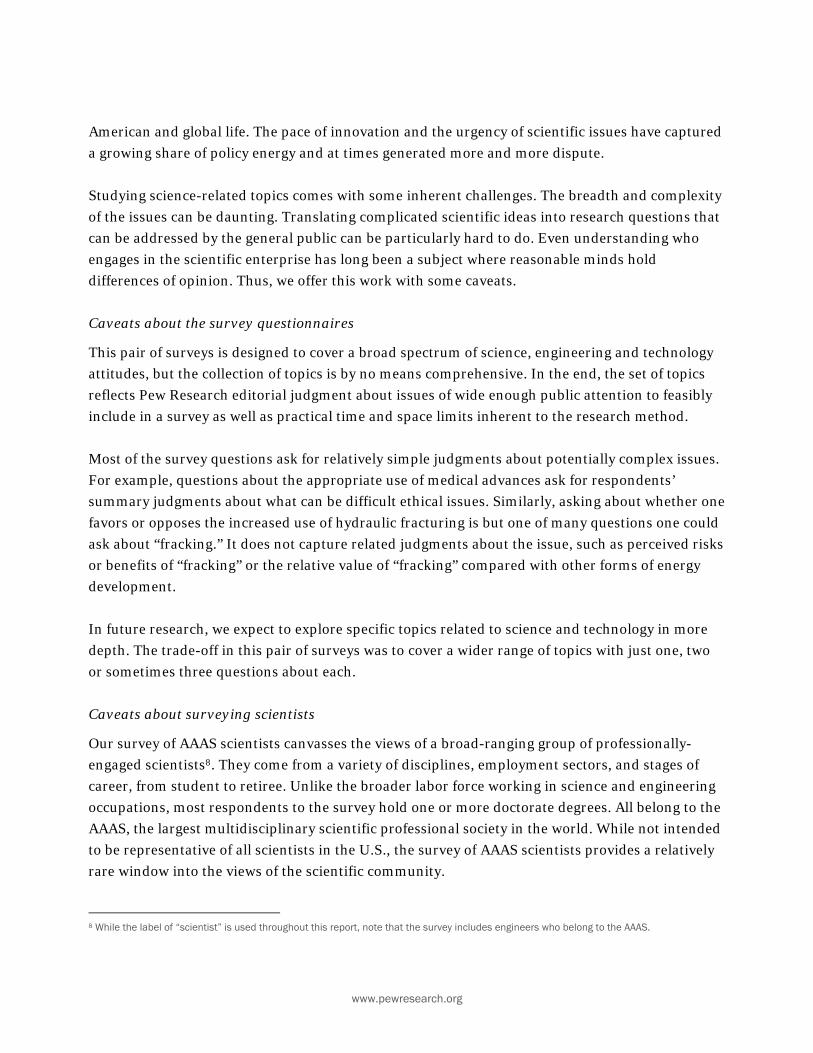
Caveats about surveying scientists
Our survey of AAAS scientists canvasses the views of a broad-ranging group of professionally-
engaged scientists8. They come from a variety of disciplines, employment sectors, and stages of
career, from student to retiree. Unlike the broader labor force working in science and engineering
occupations, most respondents to the survey hold one or more doctorate degrees. All belong to the
AAAS, the largest multidisciplinary scientific professional society in the world. While not intended
to be representative of all scientists in the U.S., the survey of AAAS scientists provides a relatively
rare window into the views of the scientific community.
8 While the label of “scientist” is used throughout this report, note that the survey includes engineers who belong to the AAAS.

24
PEW RESEARCH CENTER
www.pewresearch.org
There are a number of other possible approaches to identifying U.S. scientists.9 Some consider
only a narrow set of fields to be “science” or “science and engineering” careers. Others, such as the
National Science Foundation’s National Center of Science and Engineering Statistics program,
canvass a broad set of disciplines when tracking science and engineering indicators which include:
agricultural, physical, earth, atmospheric and ocean sciences, engineering, biological sciences,
computer sciences, medical and health sciences, psychology, mathematics and statistics and social
sciences. When identifying the science and engineering workforce, the National Science
Foundation uses a similarly broad definition: Those who either hold a degree in a science and
engineering-related field at the bachelor’s level or above or work in a science and engineering-
related field.10 This is an important distinction since about half of those with a degree in science
and engineering are working in field-related occupations while roughly half of those with such
training at the bachelor’s level or above are working in other occupations.
Help Navigating These and Other Pitfalls
We have tried to be conscious of these issues and to obtain the advice of the scientific community
and other stakeholders to help inform this research. We are grateful to a number of outside
advisors who shared their expertise with us during the development of the questionnaires and/or
in reviewing a draft version of this report. These include: John Besley, associate professor and the
Ellis N. Brand chair in public relations at Michigan State University; Bill Colglazier, visiting
scientist at the Center for Science Diplomacy; Banning Garrett, independent consultant on global
trends; Frank Macrina, vice president for research and innovation at Virginia Commonwealth
University; and Cliff Zukin, professor of public policy and political science at Rutgers University.
Senior staff at AAAS also generously shared their expertise. These include: Alan Leshner, chief
executive officer; Marcia McNutt, editor-in-chief of Science; Joanne Carney, director of
government relations; Edward Derrick, chief program director of the Center of Science, Policy and
Society Programs; Shirley Malcom, head of education and human resources programs; Vaughan
Turekian, chief international officer and editor-in-chief of Science & Diplomacy; Jennifer
Wiseman, director of the Dialogue on Science, Ethics, and Religion; Ginger Pinholster, director of
9 A different approach was taken in a survey directed by sociologist Elaine Ecklund at Rice University to identify employed scientists in the general public. The survey used a GfK Knowledge Panel sample and analyzed those who a) identify themselves as working in a science-related occupation b) hold at least a four-year college degree and c) report working in the following occupational groups: computer and mathematics, architecture and engineering, life, physical and social sciences, medical doctor, other health care practitioner, health technologist or technician. Preliminary findings were presented at the AAAS meetings in Chicago, IL, Feb. 16, 2014. A number of others have focused on identifying scientists in particular specialty areas, such as climate science. For example, Stenhouse and colleagues conducted a survey of members of the American Meteorological Society. See “Meteorologists’ Views About Global Warming,” Bulletin of the American Meteorological Society, July 2014. Keane and Martinez built a database of more than 10,000 earth scientists from lists of geoscience faculty at academic institutions and researchers associated with state geological surveys and U.S. federal research facilities which was used to survey geoscientists. See Doran and Zimmerman, 2009, “Examining the Scientific Consensus on Climate Change,” Eos, vol. 90 (3). 10 The National Science Foundation’s Scientists and Engineers Data System (SESTAT) combines data collected on the National Survey of College Graduates, the National Survey of Recent College Graduates, and the Survey of Doctorate Recipients to track scientists and engineers in the U.S. under age 76 who either hold a college degree in a relevant field or are employed in a science and engineering-related occupation.

www.pewresearch.org
the office of public programs; Jeanne Braha, public engagement manager and Tiffany Lohwater,
director of meetings and public engagement. Pew Research Center retains sole responsibility for
any errors.
26
PEW RESEARCH CENTER
www.pewresearch.org
77
54
51
34
33
29
26
15
34
29
32
36
39
32
5
9
20
31
29
29
39
Militarysystem
Scientificachievements
Medicaltreatment
Politicalsystem
Economy
K-12 STEM
Health care
Best in world/Above average Average Below average
Chapter 2: Perspectives on the Place of Science in Society Science holds an esteemed place in the public imagination and in the minds of professionals.
Americans are proud of the accomplishments of their scientists in key fields and, despite
considerable dispute about the role of government in other realms, there is broad public support
for government investment in scientific research.
At the same time, scientists and citizens are critical of the K-12 education system when it comes to
the quality of teaching about science, technology, engineering, and math (called STEM subjects).
Scientists are also pessimistic about the state
of funding for their research, even as the
public largely supports it.
This chapter covers the core findings about the
overall place of science as found in the Pew
Research survey of the general population and
that of a representative group of scientists who
belong to the American Association for the
Advancement of Science.
The Public Image of the U.S. as a Global Leader in Key Sectors
In the survey, we wanted to understand the
public’s views about science in the context of
other key American institutions and
industries, including some outside the realm
of science and technology. A mixed picture
emerges in people’s responses as they
generally value U.S. scientific achievements
but are critical about the state of science and
math education to primary and secondary
school students.
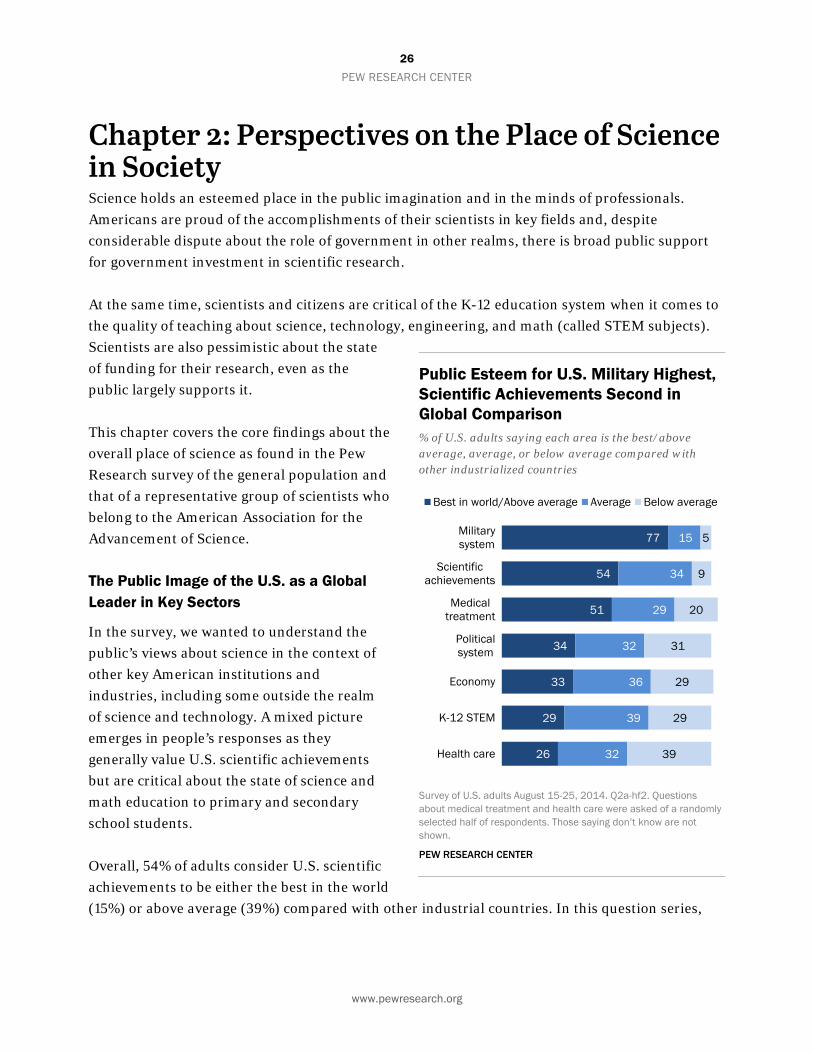
Overall, 54% of adults consider U.S. scientific
achievements to be either the best in the world
(15%) or above average (39%) compared with other industrial countries. In this question series,
Public Esteem for U.S. Military Highest, Scientific Achievements Second in Global Comparison % of U.S. adults saying each area is the best/above average, average, or below average compared with other industrialized countries
Survey of U.S. adults August 15-25, 2014. Q2a-hf2. Questions about medical treatment and health care were asked of a randomly selected half of respondents. Those saying don’t know are not shown.
PEW RESEARCH CENTER

www.pewresearch.org
the only aspect of American society rated more favorably is the U.S. military system, with 77% of
adults saying the U.S. military is the best in the world or above average.
The public’s views of how the education system is teaching science, technology, engineering, and
math (called STEM) to K-12 students is considerably less glowing. About three-in-ten (29%) adults
consider U.S. STEM education for grades K-12 to be above average or better compared with other
industrialized countries, another 39% say it is average and 29% say it is below average. 11
Public assessments of the U.S. medical system vary strongly, depending on the focus of the
question. Half of the survey respondents were asked to rate “U.S. medical treatment” while the
other half were asked about “U.S. health care.” Americans’ views of “medical treatment” in the U.S.
were considerably more positive than their views of “health care.” Some 51% of those asked about
medical treatments rated it the best in the world or above average. On the other hand, only 26%
said U.S. “health care” was the best or above average. These differences likely arise from different
connotations associated with each term. Those assessing “treatments” might have been thinking
about medical advances in fighting diseases and creating medical devices and felt the science
community is making notable progress. On the other hand, those asked about “health care” might
have been making a broader assessment about the system of providing health care in America, the
subject of considerable public dispute in recent years.
Public assessments of the U.S. political system and the economy are mixed. Fully 34% of adults say
the U.S. political system is the best or above average, another 32% say it is average and 31% say it
is below average compared with other industrialized countries. Similarly, a third (33%) of adults
say the U.S. economy is the best or above average, 36% say it is average and 29% say is below
average.
11 For international student performance comparisons see “Chapter 1: Elementary and Secondary Mathematics and Science Education” in Science and Engineering Indicators 2014.
28
PEW RESEARCH CENTER
www.pewresearch.org
77
54
51
34
33
29
26
82
65
50
34
39
Military
Scientificachievements
Medicaltreatment
Politicalsystem
Economy
K-12 STEM
Health care
2014 2009
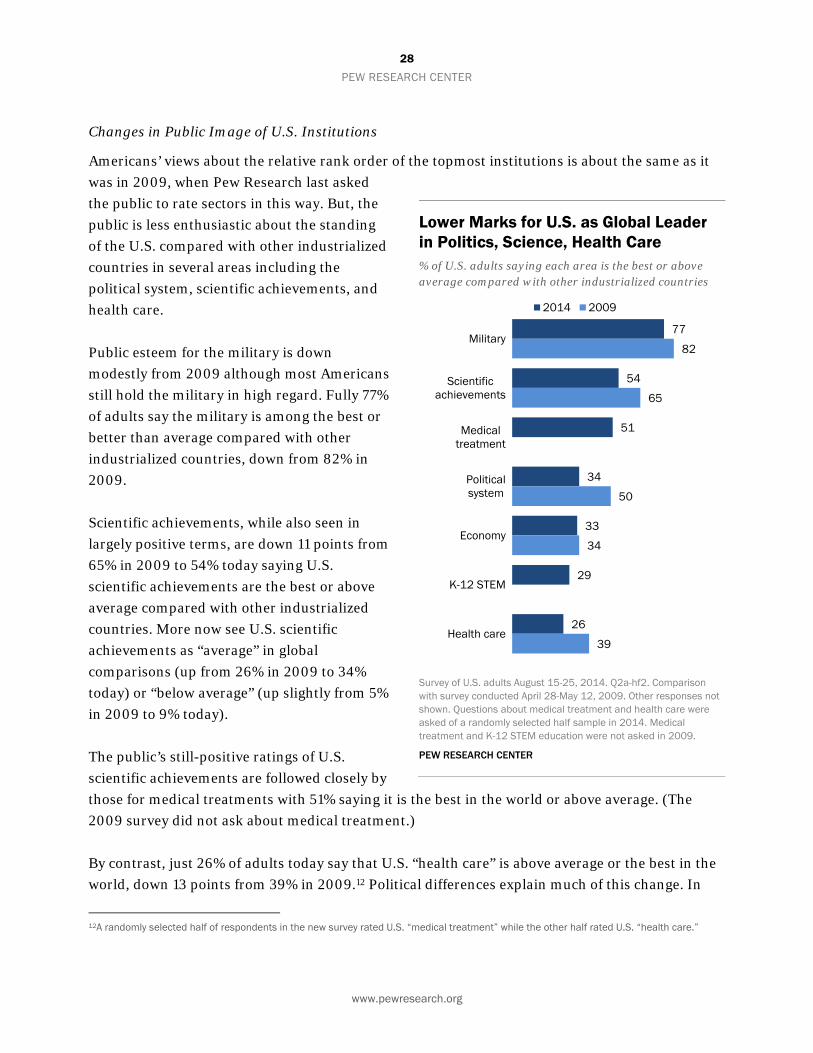
Changes in Public Image of U.S. Institutions
Americans’ views about the relative rank order of the topmost institutions is about the same as it
was in 2009, when Pew Research last asked
the public to rate sectors in this way. But, the
public is less enthusiastic about the standing
of the U.S. compared with other industrialized
countries in several areas including the
political system, scientific achievements, and
health care.
Public esteem for the military is down
modestly from 2009 although most Americans
still hold the military in high regard. Fully 77%
of adults say the military is among the best or
better than average compared with other
industrialized countries, down from 82% in
2009.
Scientific achievements, while also seen in
largely positive terms, are down 11 points from
65% in 2009 to 54% today saying U.S.
scientific achievements are the best or above
average compared with other industrialized
countries. More now see U.S. scientific
achievements as “average” in global
comparisons (up from 26% in 2009 to 34%
today) or “below average” (up slightly from 5%
in 2009 to 9% today).
The public’s still-positive ratings of U.S.
scientific achievements are followed closely by
those for medical treatments with 51% saying it is the best in the world or above average. (The
2009 survey did not ask about medical treatment.)
By contrast, just 26% of adults today say that U.S. “health care” is above average or the best in the
world, down 13 points from 39% in 2009.12 Political differences explain much of this change. In
12A randomly selected half of respondents in the new survey rated U.S. “medical treatment” while the other half rated U.S. “health care.”
Lower Marks for U.S. as Global Leader in Politics, Science, Health Care % of U.S. adults saying each area is the best or above average compared with other industrialized countries
Survey of U.S. adults August 15-25, 2014. Q2a-hf2. Comparison with survey conducted April 28-May 12, 2009. Other responses not shown. Questions about medical treatment and health care were asked of a randomly selected half sample in 2014. Medical treatment and K-12 STEM education were not asked in 2009.
PEW RESEARCH CENTER
www.pewresearch.org
2009, Republicans and independents who lean to the Republican Party were much more inclined
than their Democratic counterparts to see the U.S. health care system in a positive light (55% vs.
28% of each group, respectively, said it was the best in the world or above average). But
Republicans’ opinions about the place of U.S. health care in a global context have dropped sharply
since 2009, while views among Democrats’ have dropped a more modest 6 points. These partisan
differences are likely related to the debate over the Affordable Care Act, also called “Obamacare,”
during the same period. As a result, both groups now hold roughly similar views of how U.S. health
care stacks up in a global context.
Perceptions of the U.S. political system have also dropped over the same time period. Yet, unlike
perceptions of health care, people’s views about the political system are not associated with party
affiliation. Today, 34% of adults say the U.S. political system is the best in the world or above
average compared with other industrialized countries, down 16 points from 50% in 2009. Partisan
groups hold similar views about the political system, as was also the case in 2009.
People’s perceptions of the U.S. economy in global comparison have held steady. A third of adults
(33%) says the U.S. economy is the best or above average relative to other industrialized countries,
roughly the same as in 2009 (34%).
Patterns Among the General Public
There were some modest demographic differences among respondents in assessing U.S. scientific
achievements today. Men are more likely than women (60% vs. 48%) to consider U.S. scientific
achievements to be at least above average compared with other nations. Those with a college
degree tend to give higher marks to U.S. scientific achievements (as well as several other domains)
than do those with less formal education. But, those with a degree in a science field do not differ
from other college graduates in their views about U.S. scientific achievements. And, there are no
significant differences on this rating by age or political orientation.
There are no or only modest differences in assessments of K-12 STEM education by gender, age, or
political leanings. But unlike ratings of U.S. scientific achievements, education is inversely related
to ratings of STEM education for grades K through 12: 35% of college graduates say K-12 STEM is
below average compared with other nations while 23% of those with no more than a high school
diploma say the same.
30
PEW RESEARCH CENTER
www.pewresearch.org
54
92
51
64
29
16
34
6
29
22
39
38
9
1
20
13
29
46
U.S. adults
AAAS scientists
U.S. adults
AAAS scientists
U.S. adults
AAAS scientists
Best in world/Above average Average Below average
Scientific achievements
Medical treatment
K-12 STEM education
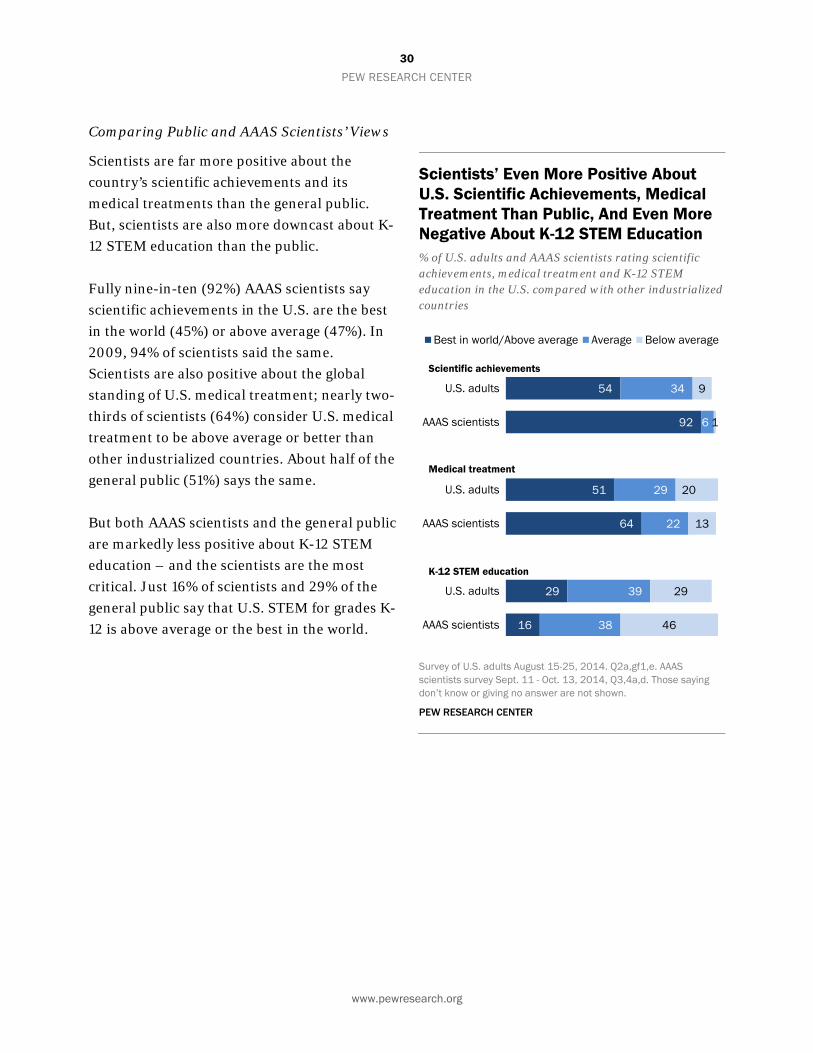
Comparing Public and AAAS Scientists’ Views
Scientists are far more positive about the
country’s scientific achievements and its
medical treatments than the general public.
But, scientists are also more downcast about K-
12 STEM education than the public.
Fully nine-in-ten (92%) AAAS scientists say
scientific achievements in the U.S. are the best
in the world (45%) or above average (47%). In
2009, 94% of scientists said the same.
Scientists are also positive about the global
standing of U.S. medical treatment; nearly two-
thirds of scientists (64%) consider U.S. medical
treatment to be above average or better than
other industrialized countries. About half of the
general public (51%) says the same.
But both AAAS scientists and the general public
are markedly less positive about K-12 STEM
education – and the scientists are the most
critical. Just 16% of scientists and 29% of the
general public say that U.S. STEM for grades K-
12 is above average or the best in the world.
Scientists’ Even More Positive About U.S. Scientific Achievements, Medical Treatment Than Public, And Even More Negative About K-12 STEM Education % of U.S. adults and AAAS scientists rating scientific achievements, medical treatment and K-12 STEM education in the U.S. compared with other industrialized countries
Survey of U.S. adults August 15-25, 2014. Q2a,gf1,e. AAAS scientists survey Sept. 11 - Oct. 13, 2014, Q3,4a,d. Those saying don’t know or giving no answer are not shown.
PEW RESEARCH CENTER

www.pewresearch.org
48
23
37
25
52
76
62
73
2014
2009
2014
2009
Bad time Good timeFor science
For their specialty
Scientists are Less Upbeat Than They Used To Be
Despite their overall positive views, scientists are more downbeat about the general state of
science compared with five years ago. Today, 52% of AAAS scientists say this is good time for
science, down from 76% in 2009.
Scientists tend to be more positive, by
comparison, when it comes to the state of their
scientific specialty. Yet, here too, scientists
today are less rosy in their assessments than in
our previous survey. Some 62% of AAAS
scientists say this is a good time for their
specialty area, down 11 percentage points from
2009.
The drop since 2009 in views about the state
of science occurred among AAAS scientists of
all disciplines, those with a basic and applied
research focus, and among those working in
industry and those in academia. For more on
scientists’ assessments of science and
technology today and in comparison with
other industrialized nations, see Chapter 4.
Scientists Less Upbeat Today About the State of the Field % of AAAS scientists saying this is a … for science/their scientific specialty
AAAS scientists survey Sept. 11 – Oct. 13, 2014. Q1-2. AAAS scientists survey May 1 – June 14, 2009. Those giving no answer are not shown.
PEW RESEARCH CENTER
32
PEW RESEARCH CENTER
www.pewresearch.org
18
34
31
79
62
62
Health care
Food
The environment
Mostly negative Mostly positive
15 79Life for most people
More difficult Easier
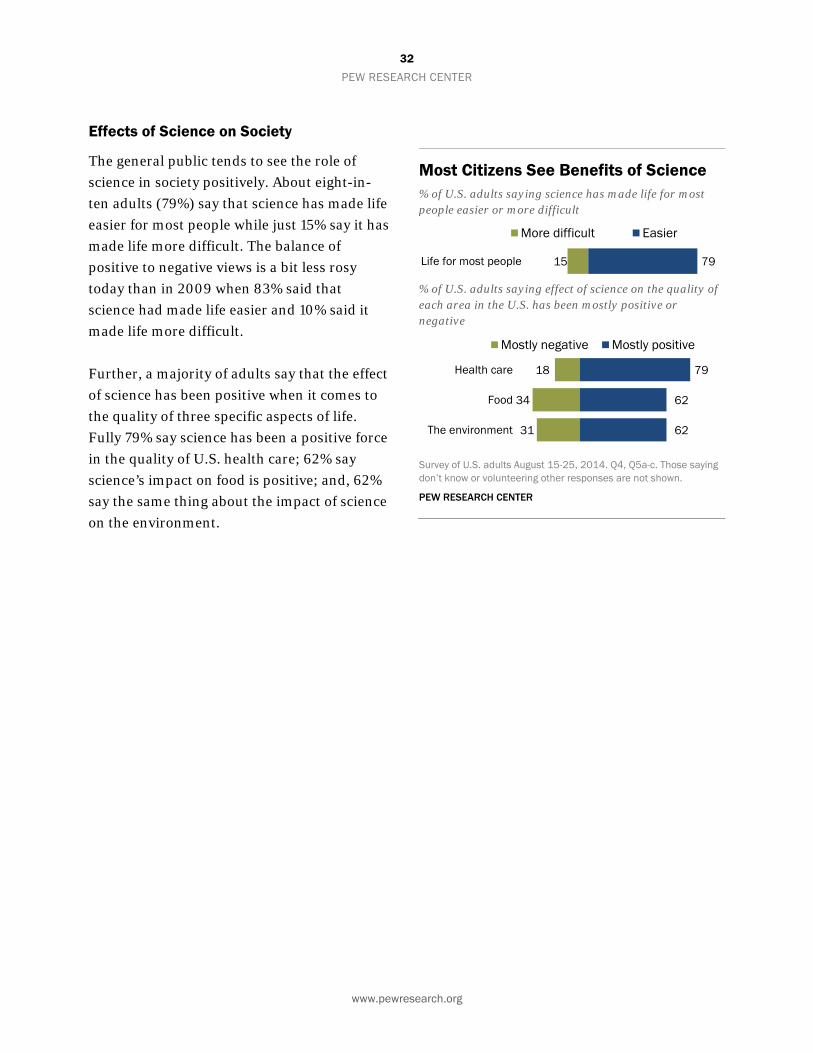
Effects of Science on Society
The general public tends to see the role of
science in society positively. About eight-in-
ten adults (79%) say that science has made life
easier for most people while just 15% say it has
made life more difficult. The balance of
positive to negative views is a bit less rosy
today than in 2009 when 83% said that
science had made life easier and 10% said it
made life more difficult.
Further, a majority of adults say that the effect
of science has been positive when it comes to
the quality of three specific aspects of life.
Fully 79% say science has been a positive force
in the quality of U.S. health care; 62% say
science’s impact on food is positive; and, 62%
say the same thing about the impact of science
on the environment.
Most Citizens See Benefits of Science % of U.S. adults saying science has made life for most people easier or more difficult
% of U.S. adults saying effect of science on the quality of each area in the U.S. has been mostly positive or negative
Survey of U.S. adults August 15-25, 2014. Q4, Q5a-c. Those saying don’t know or volunteering other responses are not shown.
PEW RESEARCH CENTER
www.pewresearch.org
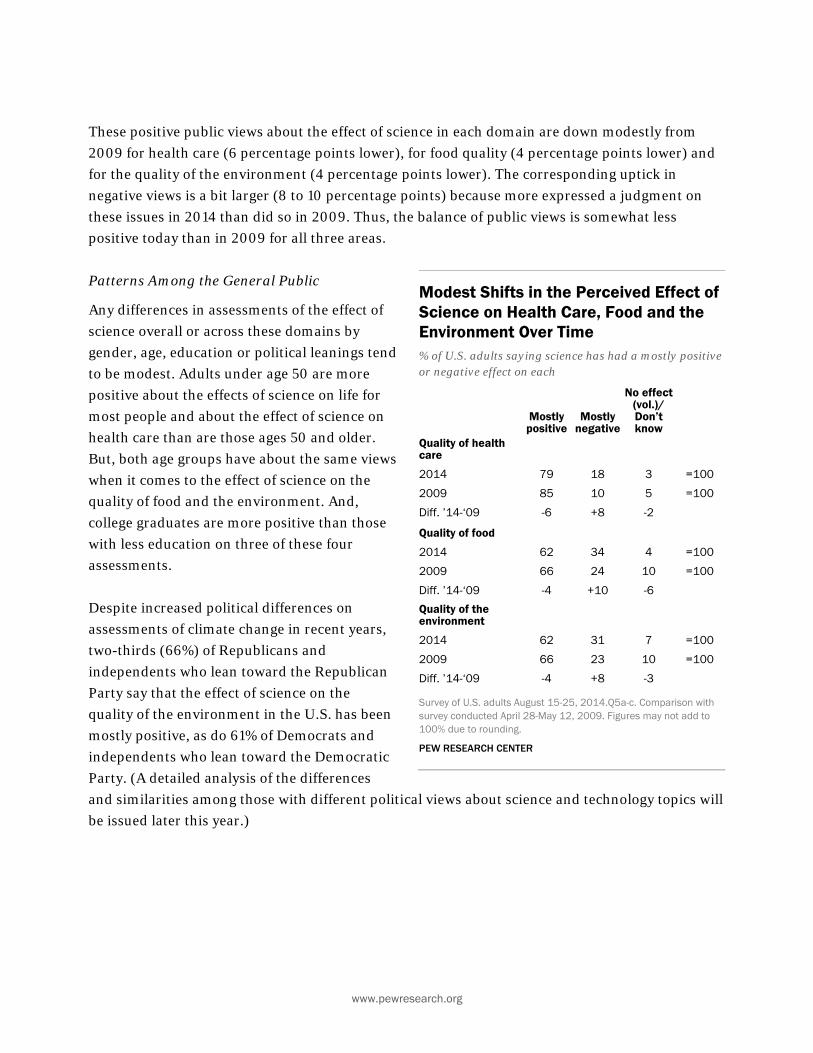
These positive public views about the effect of science in each domain are down modestly from
2009 for health care (6 percentage points lower), for food quality (4 percentage points lower) and
for the quality of the environment (4 percentage points lower). The corresponding uptick in
negative views is a bit larger (8 to 10 percentage points) because more expressed a judgment on
these issues in 2014 than did so in 2009. Thus, the balance of public views is somewhat less
positive today than in 2009 for all three areas.
Patterns Among the General Public
Any differences in assessments of the effect of
science overall or across these domains by
gender, age, education or political leanings tend
to be modest. Adults under age 50 are more
positive about the effects of science on life for
most people and about the effect of science on
health care than are those ages 50 and older.
But, both age groups have about the same views
when it comes to the effect of science on the
quality of food and the environment. And,
college graduates are more positive than those
with less education on three of these four
assessments.
Despite increased political differences on
assessments of climate change in recent years,
two-thirds (66%) of Republicans and
independents who lean toward the Republican
Party say that the effect of science on the
quality of the environment in the U.S. has been
mostly positive, as do 61% of Democrats and
independents who lean toward the Democratic
Party. (A detailed analysis of the differences
and similarities among those with different political views about science and technology topics will
be issued later this year.)
Modest Shifts in the Perceived Effect of Science on Health Care, Food and the Environment Over Time % of U.S. adults saying science has had a mostly positive or negative effect on each
Mostly positive
Mostly negative
No effect (vol.)/ Don’t know
Quality of health care
2014 79 18 3 =100
2009 85 10 5 =100
Diff. ’14-‘09 -6 +8 -2
Quality of food
2014 62 34 4 =100
2009 66 24 10 =100
Diff. ’14-‘09 -4 +10 -6
Quality of the environment
2014 62 31 7 =100
2009 66 23 10 =100
Diff. ’14-‘09 -4 +8 -3
Survey of U.S. adults August 15-25, 2014.Q5a-c. Comparison with survey conducted April 28-May 12, 2009. Figures may not add to 100% due to rounding.
PEW RESEARCH CENTER

34
PEW RESEARCH CENTER
www.pewresearch.org
22
24
72
71
Engineering & technology
Basic scientific research
Not worth it Pays off in long run
Funding for Research
A solid majority of the public expresses
support for government funding for science
and technology. About seven-in-ten adults say
that government investments in engineering
and technology (72%) and in basic scientific
research (71%) usually pay off in the long run.
While support for funding is about the same as
in 2009, negative views that each type of
funding is “not worth it” have edged up (5
percentage points for engineering and
technology and 6 points for basic science
research).
A majority of the public considers government funding critical to the scientific enterprise. Fully
61% say that government investment is
essential for scientific progress while 34% say
that “private investment will ensure that
enough scientific progress is made, even
without government investment” in research.
A similar share in 2009 said that government
investment was essential (60%) and a slightly
smaller share, 29%, said private investment
would be enough to ensure progress.
Patterns Among the General Public
Support for government funding of research
tends to be widespread across the
demographic spectrum. Fully 74% of women
and 68% of men say that government funding
of basic science pays off in the long run; men and women are about equally likely to say that
government funding of engineering pays off in the long run (72% each). College graduates tend to
express more support for research funding than do those with less formal education. Similarly,
younger generations are a bit more likely than older ones to say research funding pays off in the
long run, but a majority of all age groups say that government funding of both basic science and
engineering research pays off in the long run.
Broad Public Support for Science Research Funding % of U.S. adults saying that government investments in … usually pay off in the long run, or are not worth it
Survey of U.S. adults August 15-25, 2014. Q12a-b. Those saying don’t know are not shown.
PEW RESEARCH CENTER
Majority of Public Sees Government Research Funding as Essential % of U.S. adults who say … comes closest to their view
Survey of U.S. adults August 15-25, 2014. Q13.
PEW RESEARCH CENTER
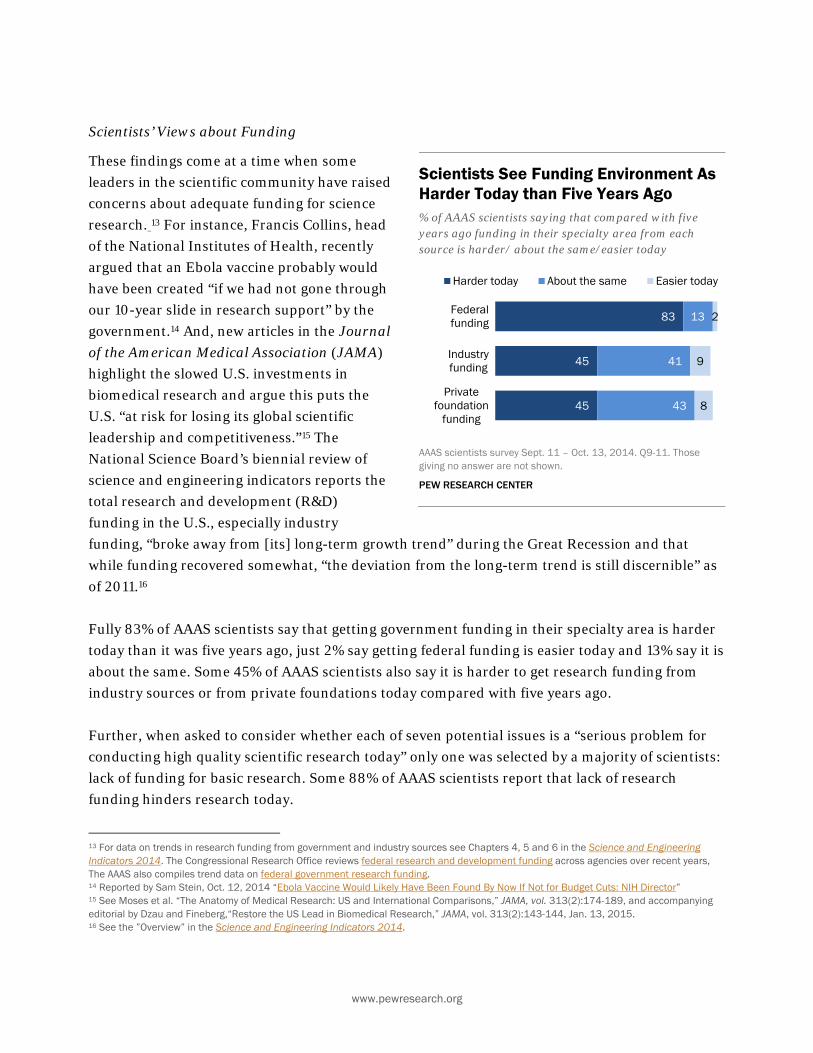
www.pewresearch.org
83
45
45
13
41
43
2
9
8
Federalfunding
Industryfunding
Privatefoundation
funding
Harder today About the same Easier today
Scientists’ Views about Funding
These findings come at a time when some
leaders in the scientific community have raised
concerns about adequate funding for science
research. 13 For instance, Francis Collins, head
of the National Institutes of Health, recently
argued that an Ebola vaccine probably would
have been created “if we had not gone through
our 10-year slide in research support” by the
government.14 And, new articles in the Journal
of the American Medical Association (JAMA)
highlight the slowed U.S. investments in
biomedical research and argue this puts the
U.S. “at risk for losing its global scientific
leadership and competitiveness.”15 The
National Science Board’s biennial review of
science and engineering indicators reports the
total research and development (R&D)
funding in the U.S., especially industry
funding, “broke away from [its] long-term growth trend” during the Great Recession and that
while funding recovered somewhat, “the deviation from the long-term trend is still discernible” as
of 2011.16
Fully 83% of AAAS scientists say that getting government funding in their specialty area is harder
today than it was five years ago, just 2% say getting federal funding is easier today and 13% say it is
about the same. Some 45% of AAAS scientists also say it is harder to get research funding from
industry sources or from private foundations today compared with five years ago.
Further, when asked to consider whether each of seven potential issues is a “serious problem for
conducting high quality scientific research today” only one was selected by a majority of scientists:
lack of funding for basic research. Some 88% of AAAS scientists report that lack of research
funding hinders research today.
13 For data on trends in research funding from government and industry sources see Chapters 4, 5 and 6 in the Science and Engineering Indicators 2014. The Congressional Research Office reviews federal research and development funding across agencies over recent years, The AAAS also compiles trend data on federal government research funding. 14 Reported by Sam Stein, Oct. 12, 2014 “Ebola Vaccine Would Likely Have Been Found By Now If Not for Budget Cuts: NIH Director” 15 See Moses et al. “The Anatomy of Medical Research: US and International Comparisons,” JAMA, vol. 313(2):174-189, and accompanying editorial by Dzau and Fineberg,“Restore the US Lead in Biomedical Research,” JAMA, vol. 313(2):143-144, Jan. 13, 2015. 16 See the ”Overview” in the Science and Engineering Indicators 2014.
Scientists See Funding Environment As Harder Today than Five Years Ago % of AAAS scientists saying that compared with five years ago funding in their specialty area from each source is harder/ about the same/easier today
AAAS scientists survey Sept. 11 – Oct. 13, 2014. Q9-11. Those giving no answer are not shown.
PEW RESEARCH CENTER
36
PEW RESEARCH CENTER
www.pewresearch.org
A majority of AAAS scientists identity funding as a serious problem for conducting research today,
regardless of discipline, employment setting, or a basic or applied research focus in their own
research.
For more on AAAS scientists’ views about funding, problems for conducting research and other
issues in science today, see Chapter 4.

www.pewresearch.org
37
47
28
65
68
50
59
45
52
59
68
39
64
88
89
68
98
86
87
82
65
32
47
78
31
68
U.S. adults AAAS scientists
Safe to eat GM foods
Favor use of animals in research
Safe to eat foods grown with pesticides
Climate change is mostly due to human activity
Humans have evolved over time
Growing world population willstrain natural resources
Favor more nuclear power plants
Favor more offshore drilling
Chilhood vaccines such as MMR should be required
Favor increased use of bioengineered fuel
Favor increased use of fracking
Space station has been good investment for country
Human astronauts essential for future space program
Biomedical science
Climate, energy, space science
Chapter 3: Attitudes and Beliefs on Science and Technology Topics Citizens and scientists often see science-related topics issues through different sets of eyes. This is
hardly a new reality, but there
are particularly stark
differences across the board in
these surveys.
The largest differences are
found in beliefs about the
safety of eating genetically
modified foods. Fully 88% of
AAAS scientists say it is
generally safe to eat
genetically modified (GM)
foods compared with 37% of
the general public who say the
same, a gap of 51 percentage
points. Sizable opinion
differences occur on both
biomedical science as well as
physical science topics: Only
two of the 13 comparisons find
a difference of less than 10
percentage points.
There is no single direction of
differences between the
groups. For example, when it
comes to building more
nuclear power plants
scientists are more inclined
than the general public to
favor the idea (65% vs. 45%,
respectively), while when it
comes to increasing the use of
hydraulic fracturing scientists
Opinion Differences Between Public and Scientists % of U.S. adults and AAAS scientists saying each of the following
Survey of U.S. adults August 15-25, 2014. AAAS scientists survey Sept. 11-Oct. 13, 2014. Other responses and those saying don’t know or giving no answer are not shown.
PEW RESEARCH CENTER
38
PEW RESEARCH CENTER
www.pewresearch.org
are less inclined than the general public to favor the idea (31% vs. 39%, respectively).
The remainder of this chapter looks at attitudes of the public and scientists on each of these issues.
In addition, we look at opinions on several issues asked only of the general public related to
bioengineering, genetic modifications, and perceptions of scientific consensus on evolution,
climate change, the creation of the universe, and health effects of genetically modified organisms
(GMOs). Throughout, we briefly evaluate patterns in science and technology attitudes by gender,
age, race/ethnicity and education. More details on views among the general public by subgroups,
including by education, science knowledge, religion and political groups, are forthcoming in a
separate report.
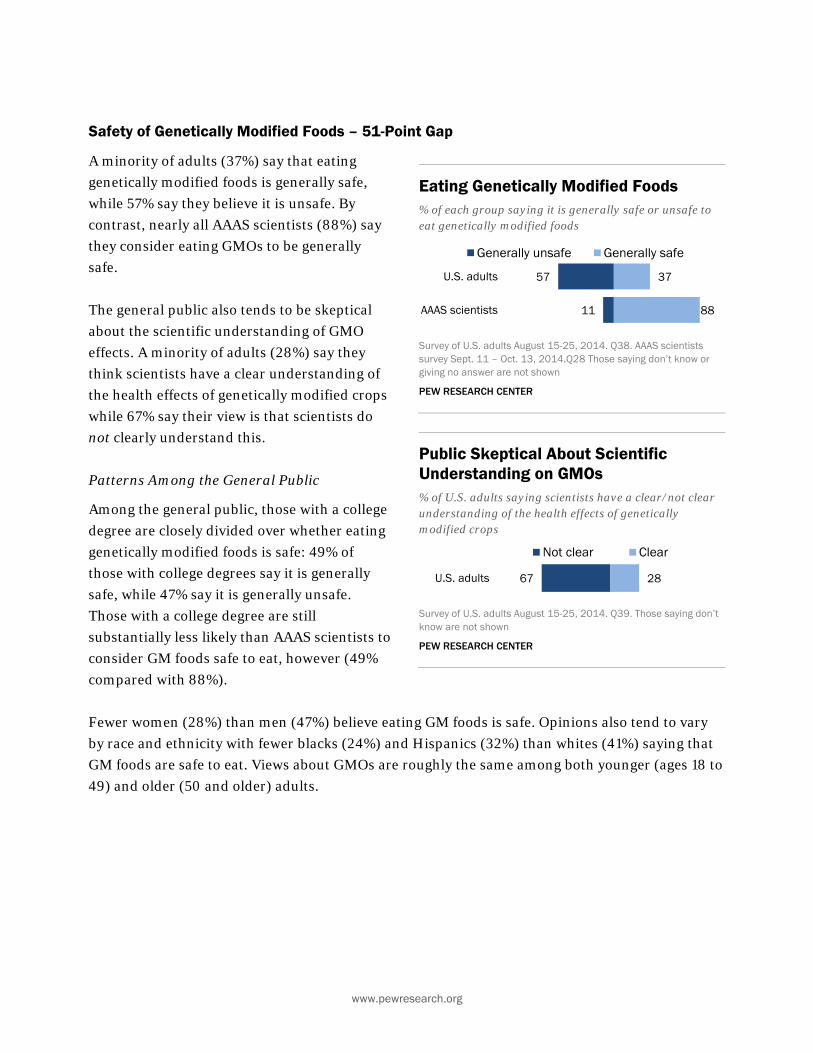
www.pewresearch.org
67 28U.S. adults
Not clear Clear
57
11
37
88
U.S. adults
AAAS scientists
Generally unsafe Generally safe
Safety of Genetically Modified Foods – 51-Point Gap
A minority of adults (37%) say that eating
genetically modified foods is generally safe,
while 57% say they believe it is unsafe. By
contrast, nearly all AAAS scientists (88%) say
they consider eating GMOs to be generally
safe.
The general public also tends to be skeptical
about the scientific understanding of GMO
effects. A minority of adults (28%) say they
think scientists have a clear understanding of
the health effects of genetically modified crops
while 67% say their view is that scientists do
not clearly understand this.
Patterns Among the General Public
Among the general public, those with a college
degree are closely divided over whether eating
genetically modified foods is safe: 49% of
those with college degrees say it is generally
safe, while 47% say it is generally unsafe.
Those with a college degree are still
substantially less likely than AAAS scientists to
consider GM foods safe to eat, however (49%
compared with 88%).
Fewer women (28%) than men (47%) believe eating GM foods is safe. Opinions also tend to vary
by race and ethnicity with fewer blacks (24%) and Hispanics (32%) than whites (41%) saying that
GM foods are safe to eat. Views about GMOs are roughly the same among both younger (ages 18 to
49) and older (50 and older) adults.
Eating Genetically Modified Foods % of each group saying it is generally safe or unsafe to eat genetically modified foods
Survey of U.S. adults August 15-25, 2014. Q38. AAAS scientists survey Sept. 11 – Oct. 13, 2014.Q28 Those saying don’t know or giving no answer are not shown
PEW RESEARCH CENTER
Public Skeptical About Scientific Understanding on GMOs % of U.S. adults saying scientists have a clear/not clear understanding of the health effects of genetically modified crops
Survey of U.S. adults August 15-25, 2014. Q39. Those saying don’t know are not shown
PEW RESEARCH CENTER
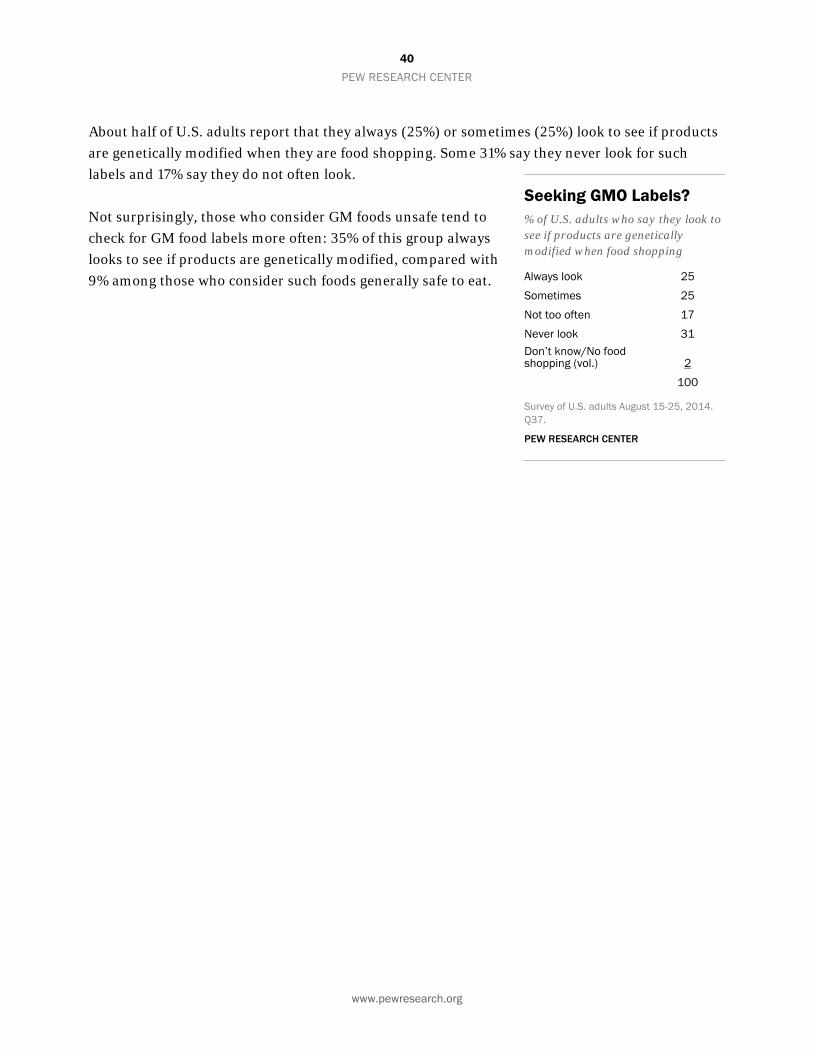
40
PEW RESEARCH CENTER
www.pewresearch.org
About half of U.S. adults report that they always (25%) or sometimes (25%) look to see if products
are genetically modified when they are food shopping. Some 31% say they never look for such
labels and 17% say they do not often look.
Not surprisingly, those who consider GM foods unsafe tend to
check for GM food labels more often: 35% of this group always
looks to see if products are genetically modified, compared with
9% among those who consider such foods generally safe to eat.
Seeking GMO Labels? % of U.S. adults who say they look to see if products are genetically modified when food shopping
Always look 25
Sometimes 25
Not too often 17
Never look 31 Don’t know/No food shopping (vol.) 2
100
Survey of U.S. adults August 15-25, 2014. Q37.
PEW RESEARCH CENTER
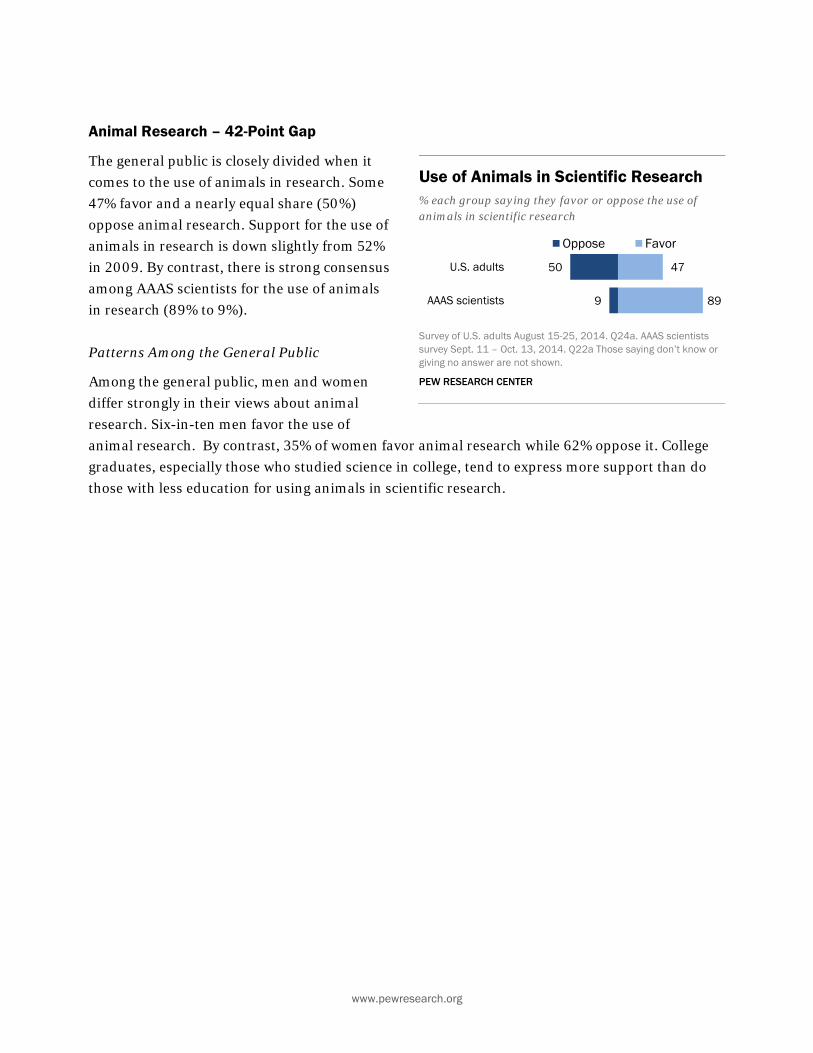
www.pewresearch.org
50
9
47
89
U.S. adults
AAAS scientists
Oppose Favor
Animal Research – 42-Point Gap
The general public is closely divided when it
comes to the use of animals in research. Some
47% favor and a nearly equal share (50%)
oppose animal research. Support for the use of
animals in research is down slightly from 52%
in 2009. By contrast, there is strong consensus
among AAAS scientists for the use of animals
in research (89% to 9%).
Patterns Among the General Public
Among the general public, men and women
differ strongly in their views about animal
research. Six-in-ten men favor the use of
animal research. By contrast, 35% of women favor animal research while 62% oppose it. College
graduates, especially those who studied science in college, tend to express more support than do
those with less education for using animals in scientific research.
Use of Animals in Scientific Research % each group saying they favor or oppose the use of animals in scientific research
Survey of U.S. adults August 15-25, 2014. Q24a. AAAS scientists survey Sept. 11 – Oct. 13, 2014. Q22a Those saying don’t know or giving no answer are not shown.
PEW RESEARCH CENTER
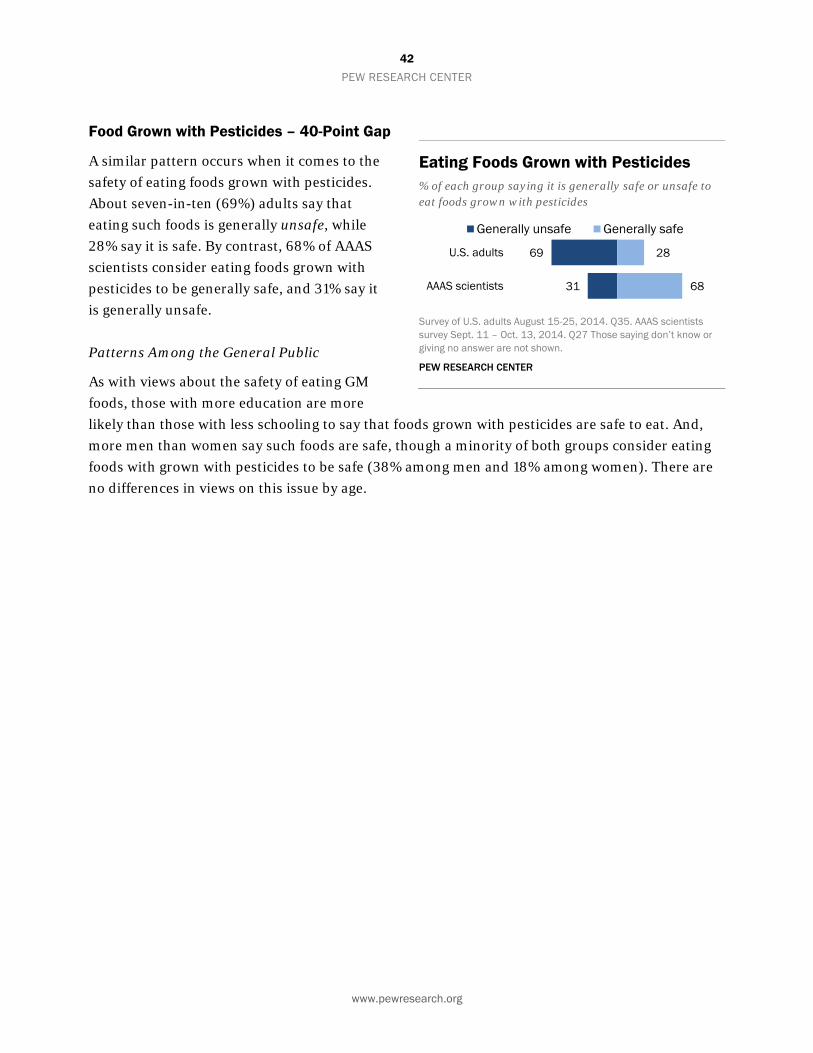
42
PEW RESEARCH CENTER
www.pewresearch.org
69
31
28
68
U.S. adults
AAAS scientists
Generally unsafe Generally safe
Food Grown with Pesticides – 40-Point Gap
A similar pattern occurs when it comes to the
safety of eating foods grown with pesticides.
About seven-in-ten (69%) adults say that
eating such foods is generally unsafe, while
28% say it is safe. By contrast, 68% of AAAS
scientists consider eating foods grown with
pesticides to be generally safe, and 31% say it
is generally unsafe.
Patterns Among the General Public
As with views about the safety of eating GM
foods, those with more education are more
likely than those with less schooling to say that foods grown with pesticides are safe to eat. And,
more men than women say such foods are safe, though a minority of both groups consider eating
foods with grown with pesticides to be safe (38% among men and 18% among women). There are
no differences in views on this issue by age.
Eating Foods Grown with Pesticides % of each group saying it is generally safe or unsafe to eat foods grown with pesticides
Survey of U.S. adults August 15-25, 2014. Q35. AAAS scientists survey Sept. 11 – Oct. 13, 2014. Q27 Those saying don’t know or giving no answer are not shown.
PEW RESEARCH CENTER
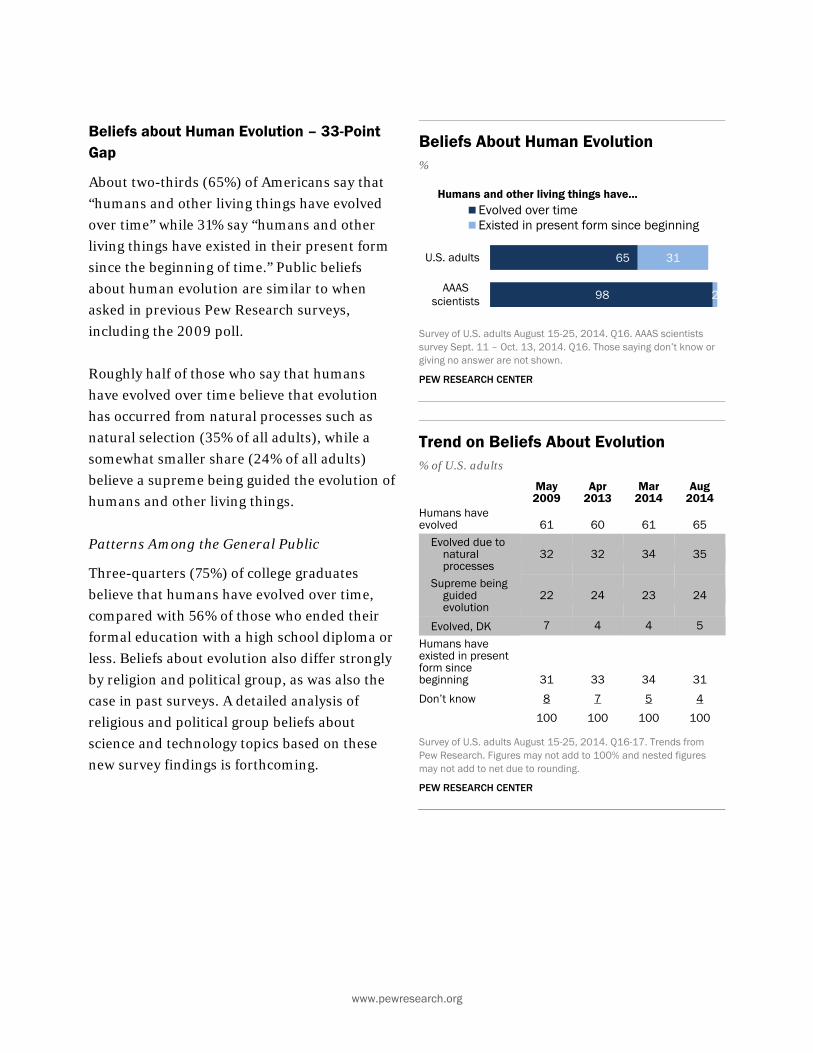
www.pewresearch.org
65
98
31
2
U.S. adults
AAASscientists
Evolved over timeExisted in present form since beginning
Humans and other living things have...
Beliefs about Human Evolution – 33-Point Gap
About two-thirds (65%) of Americans say that
“humans and other living things have evolved
over time” while 31% say “humans and other
living things have existed in their present form
since the beginning of time.” Public beliefs
about human evolution are similar to when
asked in previous Pew Research surveys,
including the 2009 poll.
Roughly half of those who say that humans
have evolved over time believe that evolution
has occurred from natural processes such as
natural selection (35% of all adults), while a
somewhat smaller share (24% of all adults)
believe a supreme being guided the evolution of
humans and other living things.
Patterns Among the General Public
Three-quarters (75%) of college graduates
believe that humans have evolved over time,
compared with 56% of those who ended their
formal education with a high school diploma or
less. Beliefs about evolution also differ strongly
by religion and political group, as was also the
case in past surveys. A detailed analysis of
religious and political group beliefs about
science and technology topics based on these
new survey findings is forthcoming.
Beliefs About Human Evolution %
Survey of U.S. adults August 15-25, 2014. Q16. AAAS scientists survey Sept. 11 – Oct. 13, 2014. Q16. Those saying don’t know or giving no answer are not shown.
PEW RESEARCH CENTER
Trend on Beliefs About Evolution % of U.S. adults
May 2009
Apr 2013
Mar 2014
Aug 2014
Humans have evolved 61 60 61 65
Evolved due to natural processes
32 32 34 35
Supreme being guided evolution
22 24 23 24
Evolved, DK 7 4 4 5
Humans have existed in present form since beginning 31 33 34 31
Don’t know 8 7 5 4
100 100 100 100
Survey of U.S. adults August 15-25, 2014. Q16-17. Trends from Pew Research. Figures may not add to 100% and nested figures may not add to net due to rounding.
PEW RESEARCH CENTER

44
PEW RESEARCH CENTER
www.pewresearch.org
29 66U.S. adults
Scientists do not agree Scientists generally agree
52 42U.S. adults
Scientists are divided Scientists generally believe
Regardless of their personal
beliefs about evolution, 66%
of the public say they believe
that scientists generally agree
that humans have evolved
over time while 29% say that
scientists do not agree about
this.
About half (47%) of those who
personally believe that
humans have existed in their
present form since the
beginning of time also see
scientists as generally in
agreement that humans have
evolved. Three-quarters of
those who believe humans
have evolved also see
scientists as largely in
agreement about evolution.
Perceptions of scientific consensus around the creation of the universe are less uniform. Some
42% of the public as whole says that scientists generally agree the universe was created in a single
event often called “the big bang,” while 52% say
that scientists are divided in their views about
creation of the universe.
Patterns Among the General Public
Perceptions of scientific consensus on both
evolution and the creation of the universe tend
to vary by education. About three-quarters of
college graduates (76%) say scientists generally
agree about evolution, compared with 58% of
those with a high school education or less.
Similarly, about half of those with a college
degree (52%) say that scientists generally
Do Scientists Generally Agree About Evolution? % of U.S. adults saying scientists generally agree or do not agree that humans evolved over time
Do Scientists Generally Believe in ‘Big Bang’? % of U.S. adults saying scientists generally believe the universe was created in a single, violent event or that scientists are divided in their views about how the universe was created
Survey of U.S. adults August 15-25, 2014. Q18, 32. Those saying don’t know are not shown.
PEW RESEARCH CENTER
Perception of Scientific Consensus by Personal Beliefs About Evolution % of U.S. adults in each group saying scientists generally agree or do not agree that humans evolved over time
Scientists
agree
Scientists do not agree
Don’t know
Among those who say… Humans have evolved over time 76 20 3 =100 Humans existed in present form since beginning 47 46 7 =100
Survey of U.S. adults August 15-25, 2014. Q18. Figures may not add to 100% due to rounding.
PEW RESEARCH CENTER

www.pewresearch.org
believe the universe was created in a single, violent event compared with 33% of those with a high
school degree or less education who say the same. Perceptions of scientific consensus also tend to
vary by age with younger generations (ages 18 to 49) more likely than older ones to see scientists
as in agreement on these topics.

46
PEW RESEARCH CENTER
www.pewresearch.org
30
13
68
86
U.S. adults
AAAS scientists
Parents should decide Should require
Vaccines and Access to Experimental Treatments – 18-Point Gap
Asked about whether vaccines for childhood diseases such as measles, mumps, rubella (MMR) and
polio should be required or left up to parental choice, 68% of adults say such vaccines should be
required while 30% say that parents should be able to decide whether or not to vaccinate their
children. Scientists are more likely than the
general public to say that such vaccines should
be required for all children: 86% of scientists
say this compared with 68% among the
general public.
Opinion about childhood vaccines among both
the public and scientists is about the same as
in 2009. Scientists are a bit more likely to say
that vaccines should be required (up from 82%
to 86% today). Thus the divide between public
and scientists’ views has ticked up from 13 to
18 percentage points today.
Patterns Among the General Public
Younger adults are less inclined than older generations to believe vaccines should be required for
all children: 37% of adults under age 50 say parents should be able to decide not to vaccinate their
children compared with 22% of those ages 50 and older. Men and women hold similar views about
requiring vaccines. There are no significant differences in views about this issue by education or
race and ethnicity.
Childhood Vaccines % of each group saying that parents should be able to decide not to vaccinate their children or that all children should be required to be vaccinated
Survey of U.S. adults August 15-25, 2014. Q25. AAAS scientists survey Sept. 11 – Oct. 13, 2014.Q23 Those saying don’t know or giving no answer are not shown.
PEW RESEARCH CENTER
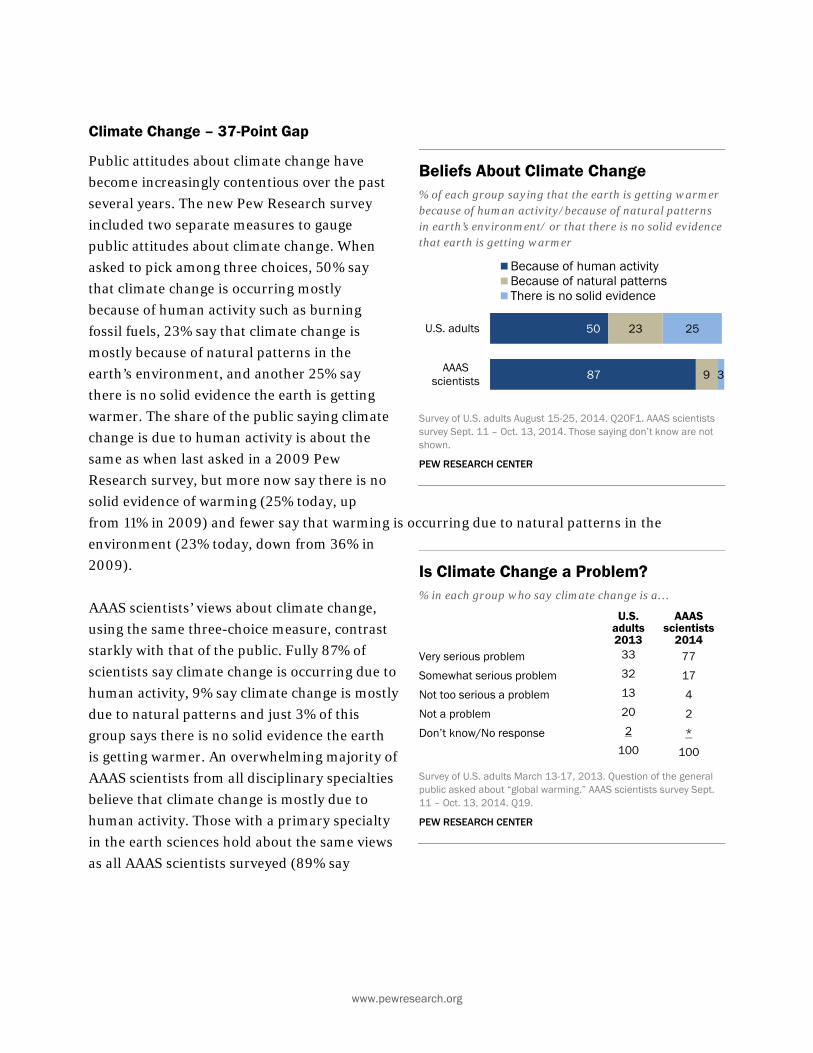
www.pewresearch.org
50
87
23
9
25
3
U.S. adults
AAASscientists
Because of human activityBecause of natural patternsThere is no solid evidence
Climate Change – 37-Point Gap
Public attitudes about climate change have
become increasingly contentious over the past
several years. The new Pew Research survey
included two separate measures to gauge
public attitudes about climate change. When
asked to pick among three choices, 50% say
that climate change is occurring mostly
because of human activity such as burning
fossil fuels, 23% say that climate change is
mostly because of natural patterns in the
earth’s environment, and another 25% say
there is no solid evidence the earth is getting
warmer. The share of the public saying climate
change is due to human activity is about the
same as when last asked in a 2009 Pew
Research survey, but more now say there is no
solid evidence of warming (25% today, up
from 11% in 2009) and fewer say that warming is occurring due to natural patterns in the
environment (23% today, down from 36% in
2009).
AAAS scientists’ views about climate change,
using the same three-choice measure, contrast
starkly with that of the public. Fully 87% of
scientists say climate change is occurring due to
human activity, 9% say climate change is mostly
due to natural patterns and just 3% of this
group says there is no solid evidence the earth
is getting warmer. An overwhelming majority of
AAAS scientists from all disciplinary specialties
believe that climate change is mostly due to
human activity. Those with a primary specialty
in the earth sciences hold about the same views
as all AAAS scientists surveyed (89% say
Beliefs About Climate Change % of each group saying that the earth is getting warmer because of human activity/because of natural patterns in earth’s environment/ or that there is no solid evidence that earth is getting warmer
Survey of U.S. adults August 15-25, 2014. Q20F1. AAAS scientists survey Sept. 11 – Oct. 13, 2014. Those saying don’t know are not shown.
PEW RESEARCH CENTER
Is Climate Change a Problem? % in each group who say climate change is a…
U.S. adults 2013
AAAS scientists
2014 Very serious problem 33 77
Somewhat serious problem 32 17
Not too serious a problem 13 4
Not a problem 20 2
Don’t know/No response 2 *
100 100
Survey of U.S. adults March 13-17, 2013. Question of the general public asked about “global warming.” AAAS scientists survey Sept. 11 – Oct. 13, 2014. Q19.
PEW RESEARCH CENTER
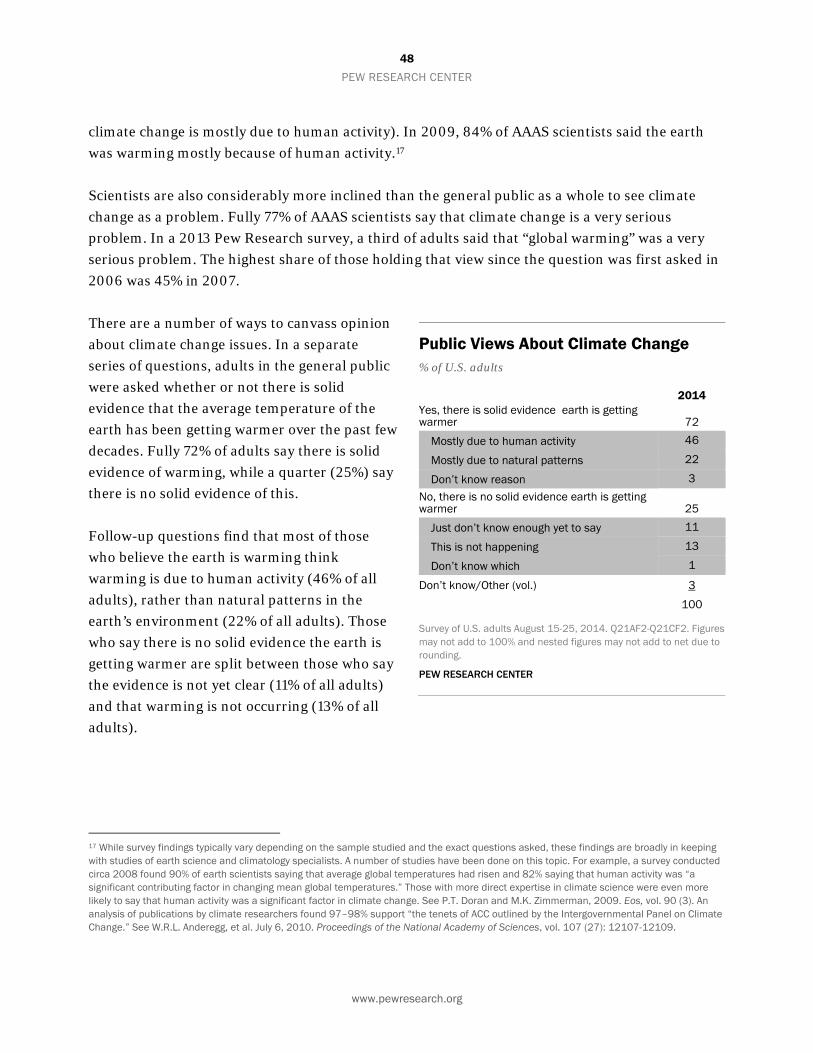
48
PEW RESEARCH CENTER
www.pewresearch.org
climate change is mostly due to human activity). In 2009, 84% of AAAS scientists said the earth
was warming mostly because of human activity.17
Scientists are also considerably more inclined than the general public as a whole to see climate
change as a problem. Fully 77% of AAAS scientists say that climate change is a very serious
problem. In a 2013 Pew Research survey, a third of adults said that “global warming” was a very
serious problem. The highest share of those holding that view since the question was first asked in
2006 was 45% in 2007.
There are a number of ways to canvass opinion
about climate change issues. In a separate
series of questions, adults in the general public
were asked whether or not there is solid
evidence that the average temperature of the
earth has been getting warmer over the past few
decades. Fully 72% of adults say there is solid
evidence of warming, while a quarter (25%) say
there is no solid evidence of this.
Follow-up questions find that most of those
who believe the earth is warming think
warming is due to human activity (46% of all
adults), rather than natural patterns in the
earth’s environment (22% of all adults). Those
who say there is no solid evidence the earth is
getting warmer are split between those who say
the evidence is not yet clear (11% of all adults)
and that warming is not occurring (13% of all
adults).
17 While survey findings typically vary depending on the sample studied and the exact questions asked, these findings are broadly in keeping with studies of earth science and climatology specialists. A number of studies have been done on this topic. For example, a survey conducted circa 2008 found 90% of earth scientists saying that average global temperatures had risen and 82% saying that human activity was “a significant contributing factor in changing mean global temperatures.” Those with more direct expertise in climate science were even more likely to say that human activity was a significant factor in climate change. See P.T. Doran and M.K. Zimmerman, 2009. Eos, vol. 90 (3). An analysis of publications by climate researchers found 97–98% support “the tenets of ACC outlined by the Intergovernmental Panel on Climate Change.” See W.R.L. Anderegg, et al. July 6, 2010. Proceedings of the National Academy of Sciences, vol. 107 (27): 12107-12109.
Public Views About Climate Change % of U.S. adults
2014 Yes, there is solid evidence earth is getting warmer 72
Mostly due to human activity 46
Mostly due to natural patterns 22
Don’t know reason 3
No, there is no solid evidence earth is getting warmer 25
Just don’t know enough yet to say 11
This is not happening 13
Don’t know which 1
Don’t know/Other (vol.) 3
100
Survey of U.S. adults August 15-25, 2014. Q21AF2-Q21CF2. Figures may not add to 100% and nested figures may not add to net due to rounding.
PEW RESEARCH CENTER
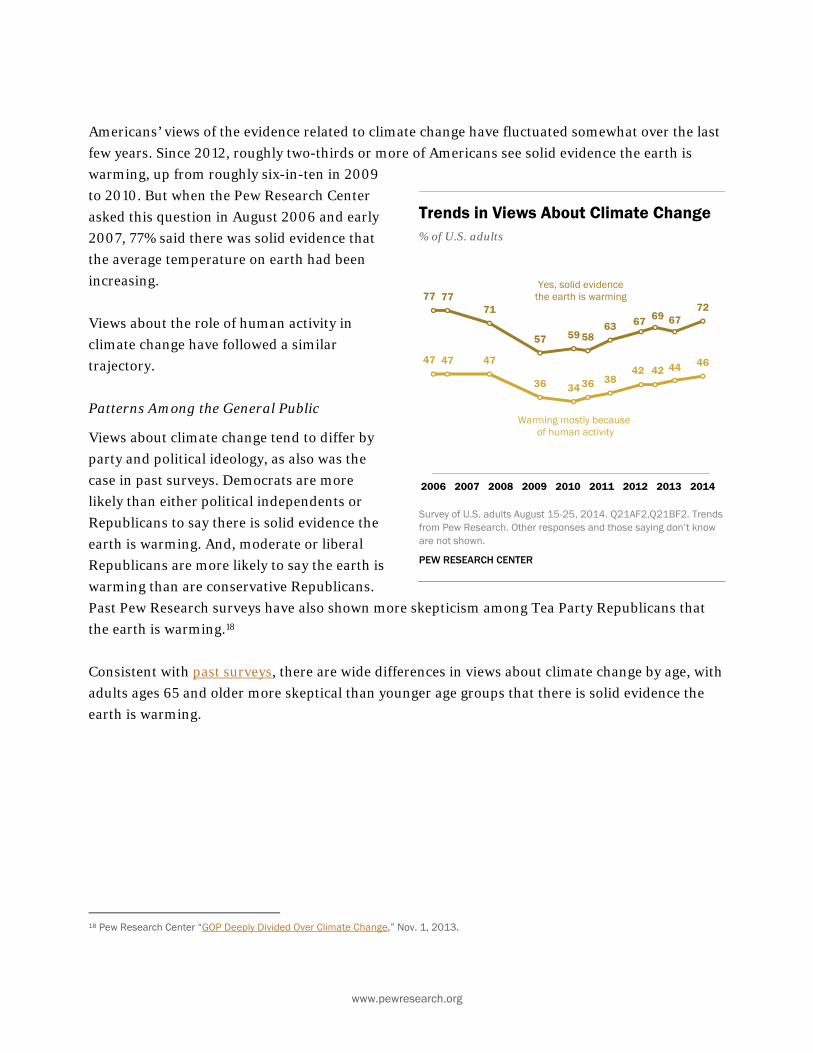
www.pewresearch.org
77 7771
57 59 5863 67 69 67
72
47 47 47
36 34 36 3842 42 44 46
2006 2007 2008 2009 2010 2011 2012 2013 2014
Yes, solid evidencethe earth is warming
Warming mostly because of human activity
Americans’ views of the evidence related to climate change have fluctuated somewhat over the last
few years. Since 2012, roughly two-thirds or more of Americans see solid evidence the earth is
warming, up from roughly six-in-ten in 2009
to 2010. But when the Pew Research Center
asked this question in August 2006 and early
2007, 77% said there was solid evidence that
the average temperature on earth had been
increasing.
Views about the role of human activity in
climate change have followed a similar
trajectory.
Patterns Among the General Public
Views about climate change tend to differ by
party and political ideology, as also was the
case in past surveys. Democrats are more
likely than either political independents or
Republicans to say there is solid evidence the
earth is warming. And, moderate or liberal
Republicans are more likely to say the earth is
warming than are conservative Republicans.
Past Pew Research surveys have also shown more skepticism among Tea Party Republicans that
the earth is warming.18
Consistent with past surveys, there are wide differences in views about climate change by age, with
adults ages 65 and older more skeptical than younger age groups that there is solid evidence the
earth is warming.
18 Pew Research Center “GOP Deeply Divided Over Climate Change,” Nov. 1, 2013.
Trends in Views About Climate Change % of U.S. adults
Survey of U.S. adults August 15-25, 2014. Q21AF2,Q21BF2. Trends from Pew Research. Other responses and those saying don’t know are not shown.
PEW RESEARCH CENTER

50
PEW RESEARCH CENTER
www.pewresearch.org
37 57U.S. adults
Scientists do not agree Scientists generally agree
A majority of Americans (57%) say they believe that scientists generally agree that the earth is
warming because of human
activity, while 37% say that
scientists generally do not
agree. Perceptions of where
the scientific community
stands on climate change have
fluctuated from a low of 44%
in 2010 who said that
scientists agree about human
activity as the main cause of
warming temperatures to a
high of 57% saying this
today.19
These public perceptions tend to be associated
with individual views on the issue. For example,
those who believe the earth is getting warmer
due to human activity are most inclined to see
scientists as in agreement on this point. Those
who say either that climate change is occurring
due to natural patterns in the earth’s
environment or who do not believe there is
solid evidence of climate change are more
inclined to see scientists as divided.
Patterns Among the General Public
As with perceptions of scientific consensus on
other topics, public perceptions that scientists
tend to agree about climate change tend to vary by education and age. College graduates are more
likely than those with less formal education to say that scientists generally agree the earth is
getting warmer due to human activity. Younger generations (ages 18 to 49) are more likely than
older ones to see scientists in agreement about climate change.
19 For more on the public’s climate change attitudes see Pew Research “GOP Deeply Divided Over Climate Change,” Nov. 1, 2013.
Do Scientists Generally Agree About Climate Change? % of U.S. adults saying scientists generally agree or do not agree that the earth is getting warmer due to human activity
Survey of U.S. adults August 15-25, 2014. Q23. Those saying don’t know are not shown.
PEW RESEARCH CENTER
Do Scientists Generally Agree that Human Activity Causes Warming? % of U.S. adults
2009 2010 2012 2013 2014
Yes, scientists generally agree that earth is getting warmer due to human activity
56 44 45 54 57
No, scientists do not generally agree 35 44 43 37 37
Don’t know 9 12 12 10 6
100 100 100 100 100
Survey of U.S. adults August 15-25, 2014. Q23. Trends from Pew Research. Figures may not add to 100% due to rounding.
PEW RESEARCH CENTER
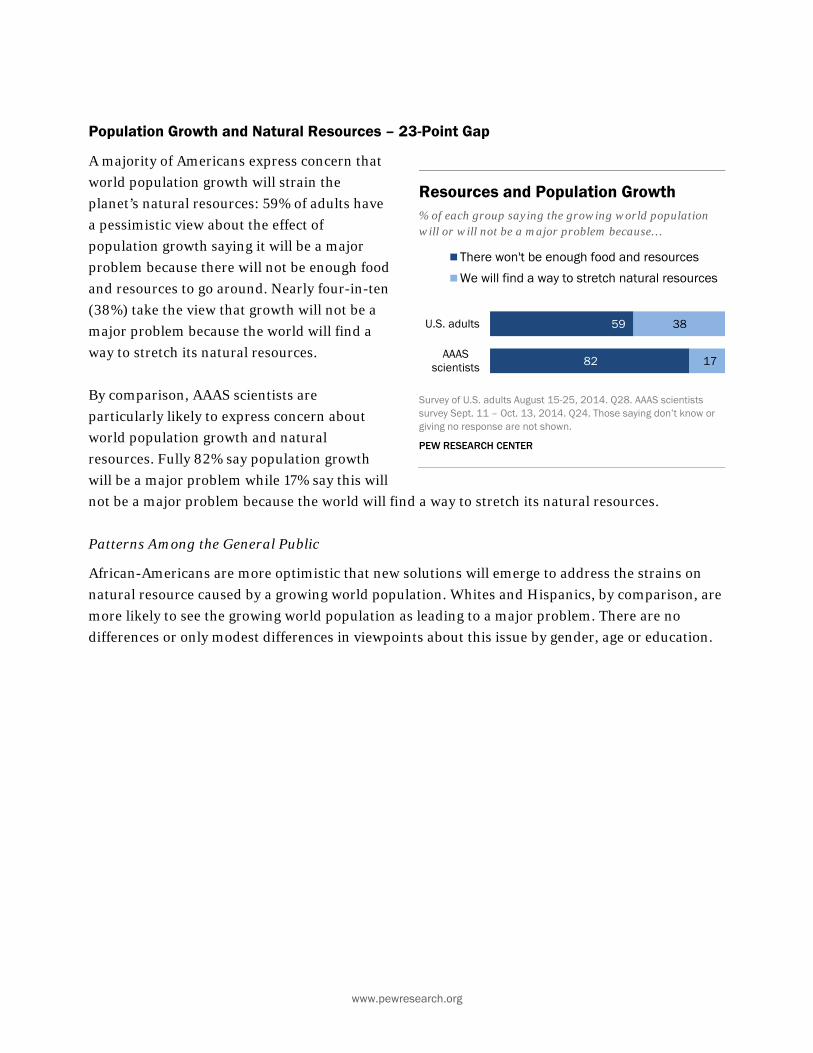
www.pewresearch.org
59
82
38
17
U.S. adults
AAASscientists
There won't be enough food and resources
We will find a way to stretch natural resources
Population Growth and Natural Resources – 23-Point Gap
A majority of Americans express concern that
world population growth will strain the
planet’s natural resources: 59% of adults have
a pessimistic view about the effect of
population growth saying it will be a major
problem because there will not be enough food
and resources to go around. Nearly four-in-ten
(38%) take the view that growth will not be a
major problem because the world will find a
way to stretch its natural resources.
By comparison, AAAS scientists are
particularly likely to express concern about
world population growth and natural
resources. Fully 82% say population growth
will be a major problem while 17% say this will
not be a major problem because the world will find a way to stretch its natural resources.
Patterns Among the General Public
African-Americans are more optimistic that new solutions will emerge to address the strains on
natural resource caused by a growing world population. Whites and Hispanics, by comparison, are
more likely to see the growing world population as leading to a major problem. There are no
differences or only modest differences in viewpoints about this issue by gender, age or education.
Resources and Population Growth % of each group saying the growing world population will or will not be a major problem because…
Survey of U.S. adults August 15-25, 2014. Q28. AAAS scientists survey Sept. 11 – Oct. 13, 2014. Q24. Those saying don’t know or giving no response are not shown.
PEW RESEARCH CENTER
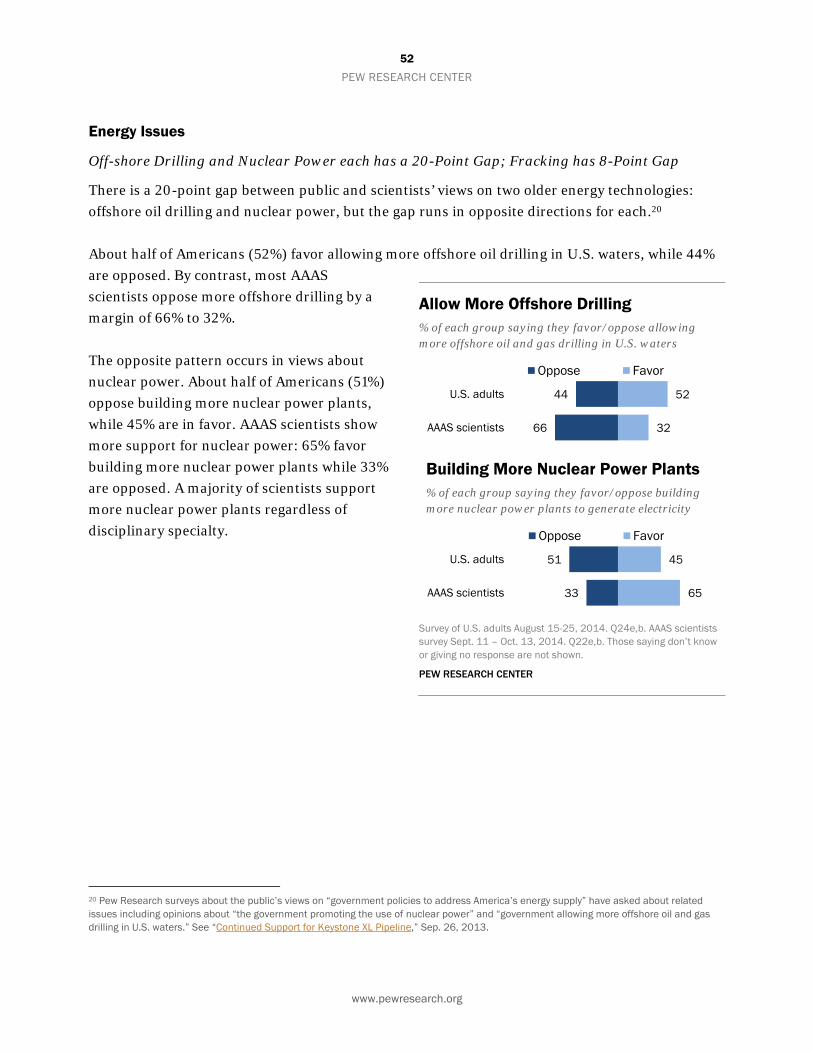
52
PEW RESEARCH CENTER
www.pewresearch.org
44
66
52
32
U.S. adults
AAAS scientists
Oppose Favor
51
33
45
65
U.S. adults
AAAS scientists
Oppose Favor
Energy Issues
Off-shore Drilling and Nuclear Power each has a 20-Point Gap; Fracking has 8-Point Gap
There is a 20-point gap between public and scientists’ views on two older energy technologies:
offshore oil drilling and nuclear power, but the gap runs in opposite directions for each.20
About half of Americans (52%) favor allowing more offshore oil drilling in U.S. waters, while 44%
are opposed. By contrast, most AAAS
scientists oppose more offshore drilling by a
margin of 66% to 32%.
The opposite pattern occurs in views about
nuclear power. About half of Americans (51%)
oppose building more nuclear power plants,
while 45% are in favor. AAAS scientists show
more support for nuclear power: 65% favor
building more nuclear power plants while 33%
are opposed. A majority of scientists support
more nuclear power plants regardless of
disciplinary specialty.
20 Pew Research surveys about the public’s views on “government policies to address America’s energy supply” have asked about related issues including opinions about “the government promoting the use of nuclear power” and “government allowing more offshore oil and gas drilling in U.S. waters.” See “Continued Support for Keystone XL Pipeline,” Sep. 26, 2013.
Allow More Offshore Drilling % of each group saying they favor/oppose allowing more offshore oil and gas drilling in U.S. waters
Building More Nuclear Power Plants % of each group saying they favor/oppose building more nuclear power plants to generate electricity
Survey of U.S. adults August 15-25, 2014. Q24e,b. AAAS scientists survey Sept. 11 – Oct. 13, 2014. Q22e,b. Those saying don’t know or giving no response are not shown.
PEW RESEARCH CENTER

www.pewresearch.org
26
21
68
78
U.S. adults
AAAS scientists
Oppose Favor
51
66
39
31
U.S. adults
AAAS scientists
Oppose Favor
One newer form of energy development — increased use of genetically-engineered plants as a fuel
alternative to gasoline — draws strong support among both the public and AAAS scientists. Fully
68% of Americans and 78% of AAAS scientists
favor increased use of this technology.
Views about the increased use of hydraulic
fracturing or ”fracking” tilt in the opposite
direction. A minority of the public (39%)
supports the increased use of fracking to
extract oil and natural gas from underground
rock formations, while about half (51%) are
opposed. By comparison, opinion about
fracking among AAAS scientists is more
negative: 31% of scientists favor the increased
use of fracking while66% are opposed.
However, scientists’ views about fracking vary
across specialty areas. Engineers are more
supportive of the increased use of fracking
(53% favor) while those with biological or
medical specialties are less supportive (25%
favor). Those with a specialty in the earth
sciences fall somewhere in between these two
groups (42% favor).
Public support for the increased use of
fracking has declined since March 2013 when there was more support (48%) than opposition
(38%). An earlier Pew Research analysis found that opposition to increased fracking has grown
since 2013 particularly among Midwesterners, women, and those under age 50.21
Patterns Among the General Public
Men express more support than women for building nuclear power plants, more offshore drilling,
and increased use of fracking. Both men and women hold about the same views when it comes to
bioengineered fuel alternatives from plants. There are no or only modest differences by education
on these energy issues.
21 Pew Research Center report, “Little Enthusiasm, Familiar Divisions After GOPs Big Midterm Victory,” Nov. 12, 2014. The Nov. 6-9, 2014 Pew Research survey repeated the question about support for fracking among the general public; it found overall support roughly the same as that reported above: 41% favor, 47% oppose the increased use of fracking.
Increase Use of Bioengineered Fuel % of each group saying they favor/oppose the increased use of genetically engineered plants to create a liquid fuel replacement for gasoline
Increase Use of Fracking % of each group saying they favor/oppose the increased use of fracking to extract oil and natural gas
Survey of U.S. adults August 15-25, 2014. Q24d,c. AAAS scientists survey Sept. 11 – Oct. 13, 2014. Q22d,c. Those saying don’t know or giving no response are not shown.
PEW RESEARCH CENTER
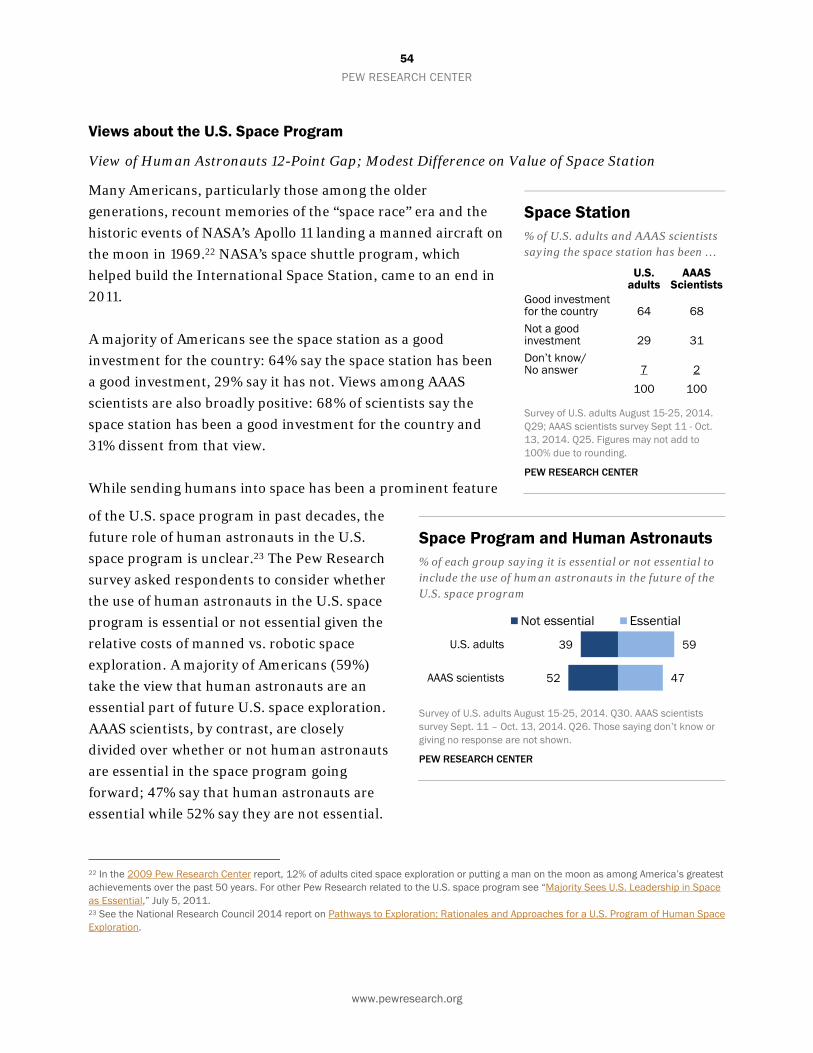
54
PEW RESEARCH CENTER
www.pewresearch.org
39
52
59
47
U.S. adults
AAAS scientists
Not essential Essential
Views about the U.S. Space Program
View of Human Astronauts 12-Point Gap; Modest Difference on Value of Space Station
Many Americans, particularly those among the older
generations, recount memories of the “space race” era and the
historic events of NASA’s Apollo 11 landing a manned aircraft on
the moon in 1969.22 NASA’s space shuttle program, which
helped build the International Space Station, came to an end in
2011.
A majority of Americans see the space station as a good
investment for the country: 64% say the space station has been
a good investment, 29% say it has not. Views among AAAS
scientists are also broadly positive: 68% of scientists say the
space station has been a good investment for the country and
31% dissent from that view.
While sending humans into space has been a prominent feature
of the U.S. space program in past decades, the
future role of human astronauts in the U.S.
space program is unclear.23 The Pew Research
survey asked respondents to consider whether
the use of human astronauts in the U.S. space
program is essential or not essential given the
relative costs of manned vs. robotic space
exploration. A majority of Americans (59%)
take the view that human astronauts are an
essential part of future U.S. space exploration.
AAAS scientists, by contrast, are closely
divided over whether or not human astronauts
are essential in the space program going
forward; 47% say that human astronauts are
essential while 52% say they are not essential.
22 In the 2009 Pew Research Center report, 12% of adults cited space exploration or putting a man on the moon as among America’s greatest achievements over the past 50 years. For other Pew Research related to the U.S. space program see “Majority Sees U.S. Leadership in Space as Essential,” July 5, 2011. 23 See the National Research Council 2014 report on Pathways to Exploration: Rationales and Approaches for a U.S. Program of Human Space Exploration.
Space Station % of U.S. adults and AAAS scientists saying the space station has been …
U.S.
adults AAAS
Scientists Good investment for the country 64 68 Not a good investment 29 31 Don’t know/ No answer 7 2
100 100
Survey of U.S. adults August 15-25, 2014. Q29; AAAS scientists survey Sept 11 - Oct. 13, 2014. Q25. Figures may not add to 100% due to rounding.
PEW RESEARCH CENTER
Space Program and Human Astronauts % of each group saying it is essential or not essential to include the use of human astronauts in the future of the U.S. space program
Survey of U.S. adults August 15-25, 2014. Q30. AAAS scientists survey Sept. 11 – Oct. 13, 2014. Q26. Those saying don’t know or giving no response are not shown.
PEW RESEARCH CENTER

www.pewresearch.org
54
43
Access to experimental drugs beforeclinical trials show drugs to be safe
or effective for that disease orcondition
Favor Oppose
There are only modest differences among scientists by specialty area about this issue. Among
those who identify their specialty as physics or astronomy 41% say human astronauts are essential
and 58% say they are not essential for the future U.S. space program.
Patterns Among the General Public
Men are more likely than women to say that human astronauts are essential for the future of the
U.S. space program (66% vs. 52%, respectively). Views about this issue are roughly the same
among age, education racial and ethnic groups.
Access to Experimental Drugs
The Pew Research survey also asked the general public (but not
the AAAS scientists) for their views about giving more people
access to experimental drug treatments before clinical trials
have shown whether such drugs are safe and effective for a
specific disease or condition. The general public tends to favor
this idea by a margin of 54% to 43%.24
Patterns Among the General Public
Some 59% of whites favor this idea, compared with about half
of Hispanics (48%) and 36% of African-Americans.25 College
graduates and those with higher family incomes tend to be
more strongly in favor of this idea than are those with less
education or income, respectively. Men and women are about
equally likely to favor increased access to experimental drugs
before clinical trials are complete, as are those under and over
age 50.
24 The general issue of access to experimental treatments before new treatments have been fully evaluated the Food and Drug Administration has long been a concern for those suffering from cancer, AIDS, and other life-threatening diseases. Public attention to this issue related to treatment for those with Ebola occurred after this survey was conducted. 25 This survey cannot provide a definitive explanation of the factors behind such differences. Other Pew Research studies which touch on views about medical treatments have also found sizeable differences among racial and ethnic groups, perhaps stemming from different group experiences as well as differences in religious views. See Chapter 7 in Pew Research Center report “Living to 120 and Beyond: Americans’ Views on Aging, Medical Advances and Radical Life Extension,” Aug. 6, 2013 and ”Views on End-of-Life Medical Treatments,” Nov. 21, 2013.
Access to Experimental Drug Treatments % of U.S. adults
Survey of U.S. adults August 15-25, 2014. Q24f. Those saying don’t know are not shown.
PEW RESEARCH CENTER

56
PEW RESEARCH CENTER
www.pewresearch.org
74
23
Bio engineering to create artificialorgans for human transplant
AppropriateTaking medical advances too far
Bioengineering
New technologies in science and medicine are generating an
increasingly wide array of medical treatments. One such
treatment involves creating artificial organs such as hearts or
kidneys for transplant in humans needing organ replacement.
The Pew Research survey asked the general public (but not the
AAAS scientists) whether or not they felt the use of
bioengineering to create artificial organs was an “appropriate
use of medical advances” or was “taking such advances too
far.” Fully 74% of adults say that bioengineering of organs is
appropriate while 23% say this is taking medical advances too
far.
Patterns Among the General Public
Whites are more inclined than African-Americans and
Hispanics to say bioengineered organs are appropriate,
although majorities in each of the three groups say this is
appropriate. There are also modest differences in views about
this issue by education and gender; college graduates more so
than those with less education say bioengineering of organs is
an appropriate use of medical advances. In addition, men more
than women say bioengineered organs are an appropriate use
of medical advances.
Bioengineering of Artificial Organs % of U.S. adults saying the use of bioengineering to create artificial organs for humans needing a transplant is …
Survey of U.S. adults August 15-25, 2014. Q27. Those saying don’t know are not shown.
PEW RESEARCH CENTER
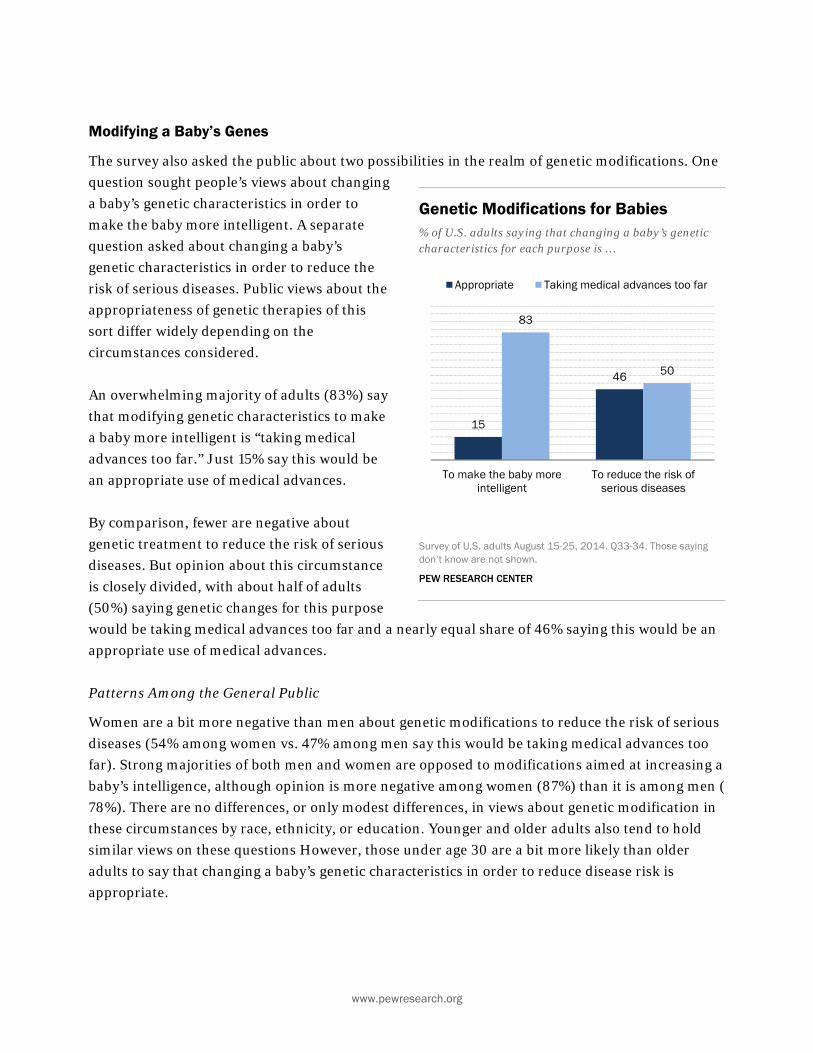
www.pewresearch.org
15
46
83
50
To make the baby moreintelligent
To reduce the risk ofserious diseases
Appropriate Taking medical advances too far
Modifying a Baby’s Genes
The survey also asked the public about two possibilities in the realm of genetic modifications. One
question sought people’s views about changing
a baby’s genetic characteristics in order to
make the baby more intelligent. A separate
question asked about changing a baby’s
genetic characteristics in order to reduce the
risk of serious diseases. Public views about the
appropriateness of genetic therapies of this
sort differ widely depending on the
circumstances considered.
An overwhelming majority of adults (83%) say
that modifying genetic characteristics to make
a baby more intelligent is “taking medical
advances too far.” Just 15% say this would be
an appropriate use of medical advances.
By comparison, fewer are negative about
genetic treatment to reduce the risk of serious
diseases. But opinion about this circumstance
is closely divided, with about half of adults
(50%) saying genetic changes for this purpose
would be taking medical advances too far and a nearly equal share of 46% saying this would be an
appropriate use of medical advances.
Patterns Among the General Public
Women are a bit more negative than men about genetic modifications to reduce the risk of serious
diseases (54% among women vs. 47% among men say this would be taking medical advances too
far). Strong majorities of both men and women are opposed to modifications aimed at increasing a
baby’s intelligence, although opinion is more negative among women (87%) than it is among men (
78%). There are no differences, or only modest differences, in views about genetic modification in
these circumstances by race, ethnicity, or education. Younger and older adults also tend to hold
similar views on these questions However, those under age 30 are a bit more likely than older
adults to say that changing a baby’s genetic characteristics in order to reduce disease risk is
appropriate.
Genetic Modifications for Babies % of U.S. adults saying that changing a baby’s genetic characteristics for each purpose is …
Survey of U.S. adults August 15-25, 2014. Q33-34. Those saying don’t know are not shown.
PEW RESEARCH CENTER
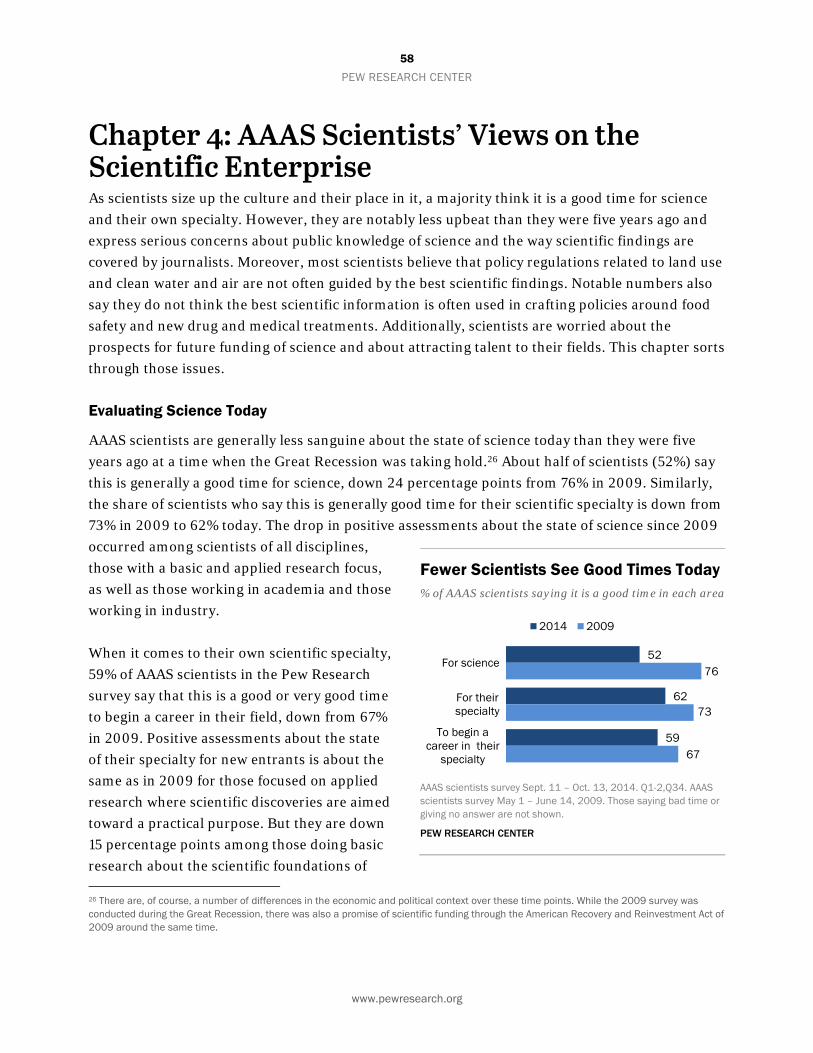
58
PEW RESEARCH CENTER
www.pewresearch.org
52
62
59
76
73
67
For science
For theirspecialty
To begin acareer in their
specialty
2014 2009
Chapter 4: AAAS Scientists’ Views on the Scientific Enterprise As scientists size up the culture and their place in it, a majority think it is a good time for science
and their own specialty. However, they are notably less upbeat than they were five years ago and
express serious concerns about public knowledge of science and the way scientific findings are
covered by journalists. Moreover, most scientists believe that policy regulations related to land use
and clean water and air are not often guided by the best scientific findings. Notable numbers also
say they do not think the best scientific information is often used in crafting policies around food
safety and new drug and medical treatments. Additionally, scientists are worried about the
prospects for future funding of science and about attracting talent to their fields. This chapter sorts
through those issues.
Evaluating Science Today
AAAS scientists are generally less sanguine about the state of science today than they were five
years ago at a time when the Great Recession was taking hold.26 About half of scientists (52%) say
this is generally a good time for science, down 24 percentage points from 76% in 2009. Similarly,
the share of scientists who say this is generally good time for their scientific specialty is down from
73% in 2009 to 62% today. The drop in positive assessments about the state of science since 2009
occurred among scientists of all disciplines,
those with a basic and applied research focus,
as well as those working in academia and those
working in industry.
When it comes to their own scientific specialty,
59% of AAAS scientists in the Pew Research
survey say that this is a good or very good time
to begin a career in their field, down from 67%
in 2009. Positive assessments about the state
of their specialty for new entrants is about the
same as in 2009 for those focused on applied
research where scientific discoveries are aimed
toward a practical purpose. But they are down
15 percentage points among those doing basic
research about the scientific foundations of 26 There are, of course, a number of differences in the economic and political context over these time points. While the 2009 survey was conducted during the Great Recession, there was also a promise of scientific funding through the American Recovery and Reinvestment Act of 2009 around the same time.
Fewer Scientists See Good Times Today % of AAAS scientists saying it is a good time in each area
AAAS scientists survey Sept. 11 – Oct. 13, 2014. Q1-2,Q34. AAAS scientists survey May 1 – June 14, 2009. Those saying bad time or giving no answer are not shown.
PEW RESEARCH CENTER
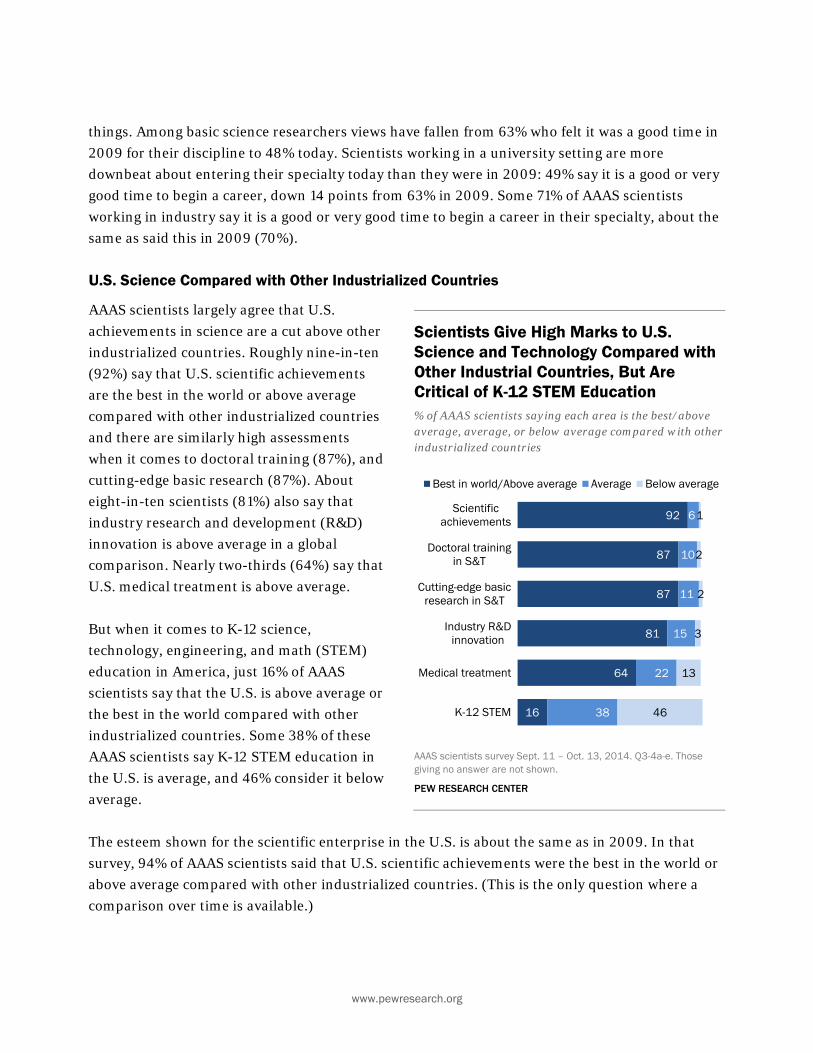
www.pewresearch.org
92
87
87
81
64
16
6
10
11
15
22
38
1
2
2
3
13
46
Scientificachievements
Doctoral trainingin S&T
Cutting-edge basicresearch in S&T
Industry R&Dinnovation
Medical treatment
K-12 STEM
Best in world/Above average Average Below average
things. Among basic science researchers views have fallen from 63% who felt it was a good time in
2009 for their discipline to 48% today. Scientists working in a university setting are more
downbeat about entering their specialty today than they were in 2009: 49% say it is a good or very
good time to begin a career, down 14 points from 63% in 2009. Some 71% of AAAS scientists
working in industry say it is a good or very good time to begin a career in their specialty, about the
same as said this in 2009 (70%).
U.S. Science Compared with Other Industrialized Countries
AAAS scientists largely agree that U.S.
achievements in science are a cut above other
industrialized countries. Roughly nine-in-ten
(92%) say that U.S. scientific achievements
are the best in the world or above average
compared with other industrialized countries
and there are similarly high assessments
when it comes to doctoral training (87%), and
cutting-edge basic research (87%). About
eight-in-ten scientists (81%) also say that
industry research and development (R&D)
innovation is above average in a global
comparison. Nearly two-thirds (64%) say that
U.S. medical treatment is above average.
But when it comes to K-12 science,
technology, engineering, and math (STEM)
education in America, just 16% of AAAS
scientists say that the U.S. is above average or
the best in the world compared with other
industrialized countries. Some 38% of these
AAAS scientists say K-12 STEM education in
the U.S. is average, and 46% consider it below
average.
The esteem shown for the scientific enterprise in the U.S. is about the same as in 2009. In that
survey, 94% of AAAS scientists said that U.S. scientific achievements were the best in the world or
above average compared with other industrialized countries. (This is the only question where a
comparison over time is available.)
Scientists Give High Marks to U.S. Science and Technology Compared with Other Industrial Countries, But Are Critical of K-12 STEM Education % of AAAS scientists saying each area is the best/above average, average, or below average compared with other industrialized countries
AAAS scientists survey Sept. 11 – Oct. 13, 2014. Q3-4a-e. Those giving no answer are not shown.
PEW RESEARCH CENTER

60
PEW RESEARCH CENTER
www.pewresearch.org
58
46
27
15
41
52
72
84
New drug andmedical treatment
Food safety
Clean air and water
Land use
Always/Most of time Some of time/Never
Evidence-Based Government Regulations?
Scientists’ views about the frequency with which the best science is implemented in government
regulations tend to vary by domain. Some
58% of AAAS scientists say that the best
science “always” (4%) or “most of the time”
(54%) guides regulations when it comes to
new drug and medical treatments while 41%
say some of the time (40%) or never (1%).
Nearly half of AAAS scientists (46%) say the
best science guides regulations related to
food safety at least most of the time.
Views about the use of scientific information
in clean air and water regulations are less
favorable. Fully 72% of scientists say the best
science guides such regulations no more than
some of the time. Similarly, when it comes to
land use regulations, 84% of AAAS scientists
think the best scientific information guides
regulations no more than some of the time.
How Often Does The Best Research Inform Government Regulations? % of AAAS scientists saying the best scientific information guides government regulations in each area
AAAS scientists survey Sept. 11 – Oct. 13, 2014. Q14a-d Those giving no answer are not shown.
PEW RESEARCH CENTER

www.pewresearch.org
84
79
52
49
14
20
43
44
1
2
5
7
Public doesn't know muchabout science
News reports don't distinguishwell-founded findings
News media oversimplifyfindings
Public expects solutions tooquickly
Major problem Minor problem Not a problem
Scientists’ Views about the Effect of the Public and Media on Science
The predominant view among
scientists is that limited public
knowledge about science, and
journalism about science,
pose problems for science.
Fully 84% of AAAS scientists
call the limited public
knowledge about science a
major problem and 14% say it
is a minor problem for
science.
About eight-in-ten AAAS
scientists (79%) say news
reports that don’t distinguish
between well-founded and not
well-founded scientific
findings are a major problem.
About half of scientists (52%) say that oversimplification of science findings by the media and
public expectations for a quick solution (49%) are major problems, Opinions on these questions
are about the same as in 2009. There has been a modest uptick in the share saying news media not
distinguishing between well-founded and not well-founded results is a major problem for science
(79% today and 76% in 2009) A slight rise also occurred in the share saying that media
oversimplifying research findings is a major problem (52% today and 48% in 2009).
Scientists Fault Public Knowledge and Media Reports as Problems for Science % of AAAS scientists saying each is a … for science in general
AAAS scientists survey Sept. 11 – Oct. 13, 2014. Q5a-d Those giving no answer are not shown.
PEW RESEARCH CENTER

62
PEW RESEARCH CENTER
www.pewresearch.org
75
57
43
40
22
35
46
49
3
7
12
11
Not enough K-12 STEM
Lack of public interest inscience news
Lack of media interest indevelopments
Too few scientistscommunicate findings
Major reason Minor reason Not a reason
Perceived Reasons for Limited Public Science Knowledge
The Pew Research survey asked AAAS scientists to consider the degree to which each of four
possible reasons contribute to the public’s limited knowledge about science. Three-quarters of
scientists consider too little STEM education in grades K through 12 a major reason the public has
a limited knowledge about science, another 22% say this is a minor reason.
A majority of scientists also fault public interest levels in science: 57% say the lack of interest in
science news contributes to limited public knowledge. By comparison, fewer fault the media or
scientists themselves. About four-in-ten (43%) say a major reason for limited public knowledge
about science is a lack of
media attention to scientific
developments while 40% say
that too few scientists
communicating their findings
through the media and online
(40%) is a major reason for
limited public knowledge
about science. (These
questions were not asked in
2009.)
Scientists Say More K-12 STEM Would Help Raise Public Science Knowledge % of AAAS scientists saying each is a major/minor/or not a reason for the U.S. public having limited knowledge about science
AAAS scientists survey Sept. 11 – Oct. 13, 2014. Q6a-d Those giving no answer are not shown.
PEW RESEARCH CENTER

www.pewresearch.org
88
48
32
13
12
8
6
Lack of funding for basic research
Not enough datareplication
Visa problems for intl. workers and study
IRB rules for research with human subjects
Conflict of interest rules in publications
ITAR regulations for using U.S. tech
oversears
Regulations on animal research
Perceived Problems in the Research World Today
The survey of AAAS scientists included a series
of questions to identify how the rules and
regulations governing the scientific community
and the research they conduct are working
today and how they are affecting scientific
research.27
Funding concerns dominate responses to this
list of seven potential issues facing
researchers: 88% of AAAS scientists say that
lack of funding for basic research is a serious
problem. Concerns about adequate funding are
widely shared among scientists of all
disciplines and employment sectors.
While a majority of AAAS scientists (56%) say
they have received some kind of research
funding within the past five years, the problem
of lack of funding is cited by both those who
have recently received funding (91%) and
those who have not (83%) as a serious
problem. As noted in Chapter 2, 83% of AAAS
scientists consider the federal funding environment to be harder today than it was five years ago
and a sizable minority view funding from industry (45%) and private sources (45%) to be harder
today.
Another question focused on scientists’ concern about the degree to which foundational research
studies are replicated by independent researchers. About half of scientists (48%) say that “not
enough data replication of previous research studies” is a serious problem for conducting high
quality scientific research. One reason for concern about this issue stems from the building-block
nature of scientific progress that may start, for example, with animal research and move to clinical
27 In 2009, AAAS scientists were asked to rate a similar list of potential problems on a four-point scale from very serious to not serious at all.
Problems for Conducting Quality Research Today % of AAAS scientists who identified each as a serious problem for conducting high quality scientific research today
AAAS scientists survey Sept. 11 – Oct. 13, 2014. Q8a-g. Those not selecting each as a serious problem or giving no answer are not shown.
PEW RESEARCH CENTER

64
PEW RESEARCH CENTER
www.pewresearch.org
trials and eventually to new medical treatments.28 If important studies are not replicated, it is
harder to know how valid they are and how much to base other research on those findings.
Another challenge cited by a sizeable share of scientists was difficulty that foreign scientists face in
gaining entrance to the U.S. More than a quarter of the science and engineering workforce is
foreign-born, with many in the U.S. on the H1B visas for highly-skilled workers, and more than a
third of doctorate recipients in science and engineering fields are international students in the U.S.
on temporary visas.29 Some 32% of AAAS scientists say that visa issues facing foreign scientists
wanting to study or work in the U.S. are a problem for conducting quality research. Fully 55% of
AAAS scientists who are themselves foreign born and not U.S. citizens cite visa and immigration
problems as a serious problem. U.S. citizens, whether foreign-born or U.S.-born, are less inclined
to say this is a problem (32% and 30% do so, respectively).
Further down the list of problems cited by scientists as serious problems for research: regulations
governing animal research (13% of AAAS scientists say it is a serious problem); the way
Institutional Review Boards30 (IRBs) implement rules to protect human research subjects (12% say
it is a serious problem); conflict of interest rules used by publications (8% say it is a serious
problem); International Traffic in Arms (ITAR) regulations that limit the way American
technology can be used overseas (6% say it is a serious problem).
28The National Institutes of Health (NIH) announced an initiative to enhance the reproducibility of biomedical research in 2013 in response to growing concern about this issue in the scientific community. 29 The Science and Engineering Indicators 2014 finds 36% of science and engineering doctorates have been awarded to students with temporary resident visas (Chapter 2, page 33). And, “compared with the entire college-educated workforce, college graduates working in science and engineering occupations are disproportionately foreign born” (Chapter 3, page 52). The share of international students receiving doctorates in science and engineering fields has grown since 2000 as has the share of foreign-born workers in science and engineering occupations. 30 IRBs are committees that perform an ethical review of possible risks and safeguards to protect people who participate in research studies such as medical, social and survey research. Most IRB’s are affiliated with institutions that conduct research with the financial support of the federal government, such as universities; their role is to implement the policies laid out in the U.S. Dept. of Health and Human Services 45 CFR 46.
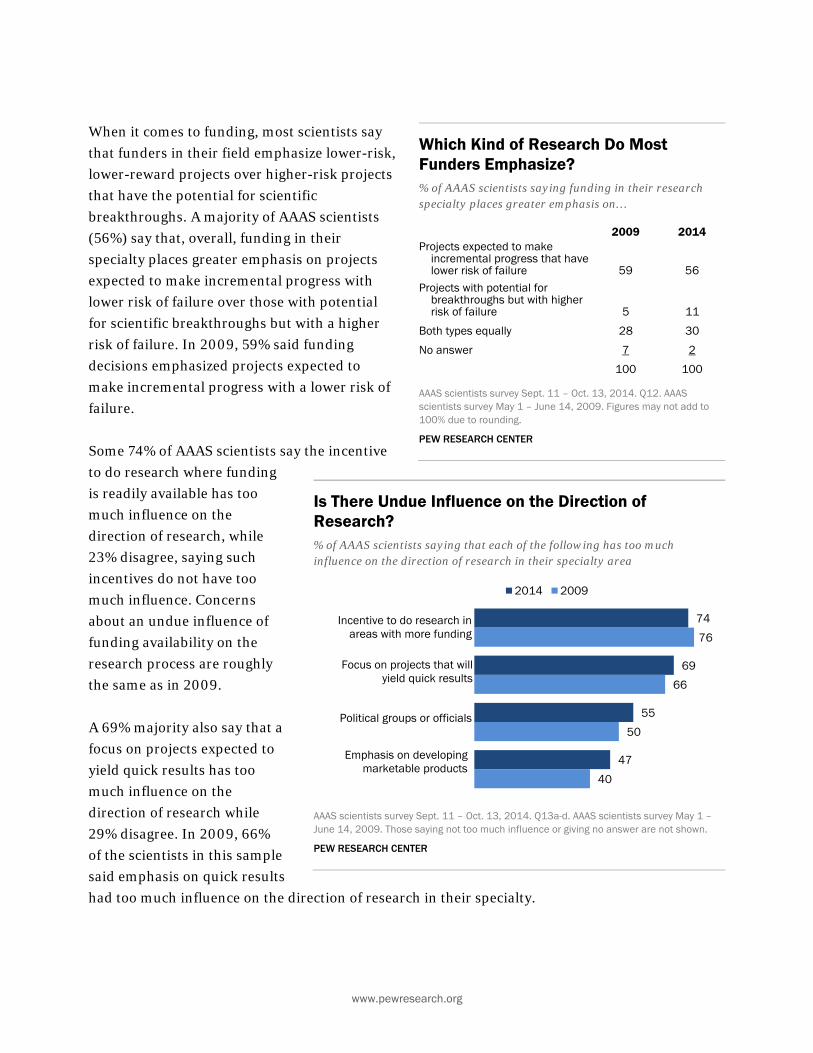
www.pewresearch.org
74
69
55
47
76
66
50
40
2014 2009
Incentive to do research in areas with more funding
Focus on projects that will yield quick results
Political groups or officials
Emphasis on developing marketable products
When it comes to funding, most scientists say
that funders in their field emphasize lower-risk,
lower-reward projects over higher-risk projects
that have the potential for scientific
breakthroughs. A majority of AAAS scientists
(56%) say that, overall, funding in their
specialty places greater emphasis on projects
expected to make incremental progress with
lower risk of failure over those with potential
for scientific breakthroughs but with a higher
risk of failure. In 2009, 59% said funding
decisions emphasized projects expected to
make incremental progress with a lower risk of
failure.
Some 74% of AAAS scientists say the incentive
to do research where funding
is readily available has too
much influence on the
direction of research, while
23% disagree, saying such
incentives do not have too
much influence. Concerns
about an undue influence of
funding availability on the
research process are roughly
the same as in 2009.
A 69% majority also say that a
focus on projects expected to
yield quick results has too
much influence on the
direction of research while
29% disagree. In 2009, 66%
of the scientists in this sample
said emphasis on quick results
had too much influence on the direction of research in their specialty.
Which Kind of Research Do Most Funders Emphasize? % of AAAS scientists saying funding in their research specialty places greater emphasis on…
2009 2014 Projects expected to make
incremental progress that have lower risk of failure 59 56
Projects with potential for breakthroughs but with higher risk of failure 5 11
Both types equally 28 30
No answer 7 2
100 100
AAAS scientists survey Sept. 11 – Oct. 13, 2014. Q12. AAAS scientists survey May 1 – June 14, 2009. Figures may not add to 100% due to rounding.
PEW RESEARCH CENTER
Is There Undue Influence on the Direction of Research? % of AAAS scientists saying that each of the following has too much influence on the direction of research in their specialty area
AAAS scientists survey Sept. 11 – Oct. 13, 2014. Q13a-d. AAAS scientists survey May 1 – June 14, 2009. Those saying not too much influence or giving no answer are not shown.
PEW RESEARCH CENTER
66
PEW RESEARCH CENTER
www.pewresearch.org
There has been a modest uptick in concerns about two other possible influences on research. A
majority (55%) of scientists say that political groups or officials have too much influence on the
direction of research in their specialty, up 5 points from 50% in 2009 who said the same.
Additionally, 47% of scientists say the emphasis on developing marketable products has too much
influence on research directions, while 51% say it does not. Concerns about market influences are
up from 2009 when 40% said this had too much influence and 56% said it did not.

www.pewresearch.org
58 32 9AAAS
scientists
Harder today About the same Easier today
85
73
54
50
46
31
Not enough fundingfor research needs
Too few tenure-track job openings
Too few industry R&D job openings
Salaries below market competition
Long hours needed to succeed in reseach
Graduate training that doesn't meet today's
needs
Entering a Career in Science Today
While a majority of AAAS scientists consider
this a good or very good time to begin a career
in their specialty areas, scientists are more
downbeat about entering the profession today
than they were five years ago. Some 59% of
scientists surveyed say this is a good time to
enter their specialty area, down 8 percentage
points since 2009. The more pessimistic
assessments are primarily among scientists
working in basic research as compared with
applied research, and among those working in
university settings as compared with business
or industry.
Among scientists whose research is focused on
basic knowledge questions 48% say it is a good
or very good time to start a career, down 15
points from 63% in 2009. Some 69% of those
in applied research say this is a good time to
enter their specialty area, roughly the same
share as said this in 2009 (71%). Similarly,
among all those working in a university
setting, 49% say this is a good or very good
time to enter their specialty, down 14 points
from 2009. Views among those working in
industry have held steady: 71% today and 70%
in 2009.
Fully 58% of AAAS scientists consider it
harder to attract the best people to the
profession today than it was five years ago,
32% say it is about the same and just 9% say it
is easier today. Basic researchers (62%) are
more likely than applied researchers (55%) to
say attracting talent is harder today.
Tougher Times for Attracting Talent % of AAAS scientists who say that attracting the best young people to a science career is…than it was five years ago
AAAS scientists survey Sept. 11 – Oct. 13, 2014. Q35. Those giving no answer are not shown.
PEW RESEARCH CENTER
Perceived Challenges for Entering a Research Science Career % of AAAS scientists who say each is a serious problem for people entering a career as a research scientist these days
AAAS scientists survey Sept. 11 – Oct. 13, 2014.Q36a-f. Those not selecting each as a serious problem or giving no answer are not shown.
PEW RESEARCH CENTER

68
PEW RESEARCH CENTER
www.pewresearch.org
Scientists see a number of hurdles facing new career entrants today. Fully 85% of AAAS scientists
say the lack of adequate funding for research is a serious problem for new entrants. They also cite
the limited number of tenure-track jobs (73% of AAAS scientists say it is a serious problem) in
university settings and too few R&D jobs in industry (54% say it is a serious problem). Half of
scientists (50%) consider salary levels to be a serious problem for new career entrants and 46% say
the long hours needed to succeed in a research career is a serious problem. By comparison, fewer
fault the graduate training being offered today. About three-in-ten (31%) say training that doesn’t
meet todays’ needs is a serious problem.
Looking across a wide range of survey
responses, there are relatively few differences in
views by age among those responding. To the
extent there are differences, they are modest.31
Larger differences by age among scientists
emerge when it comes to perceptions of the
hurdles facing new career entrants. Younger
scientists (ages 18 to 49) are more likely to see
four of the six possible problems asked about in
the survey as a serious problems for new career
entrants, (too few tenure-track openings,
salaries below market competition, long hours
needed to succeed and graduate training that
doesn’t meet today’s needs). Scientists under
age 50 and those ages 50 to 64 are about
equally likely to see the lack of adequate
research funding as a serious problem for new
entrants (90% and 87%, respectively) while
those ages 65 and older are less likely to cite
this as a serious problem (78%). There are no
differences by age in the perception that the
number of job openings in industry R&D is a
problem for people entering science research careers.
31 Responses among AAAS scientists by student, employment and retirement status show a similar pattern.
Age Differences in Perceived Challenges for New Career Scientists % of AAAS scientists in each age group saying each is a serious problem for people entering a career as a research scientist these days
18-49 50-64 65 and older
Lack of adequate funding for research needs 90 87 78
Too few tenure-track job openings 83 71 65
Too few industry research and development job openings
55 54 52
Salaries below market competition 66 46 37
Long hours needed to succeed in research 58 46 35
Graduate training that doesn’t meet today’s needs
38 27 26
AAAS scientists survey Sept. 11 – Oct. 13, 2014.Q36a-f. Those not selecting each as a serious problem or giving no answer are not shown.
PEW RESEARCH CENTER
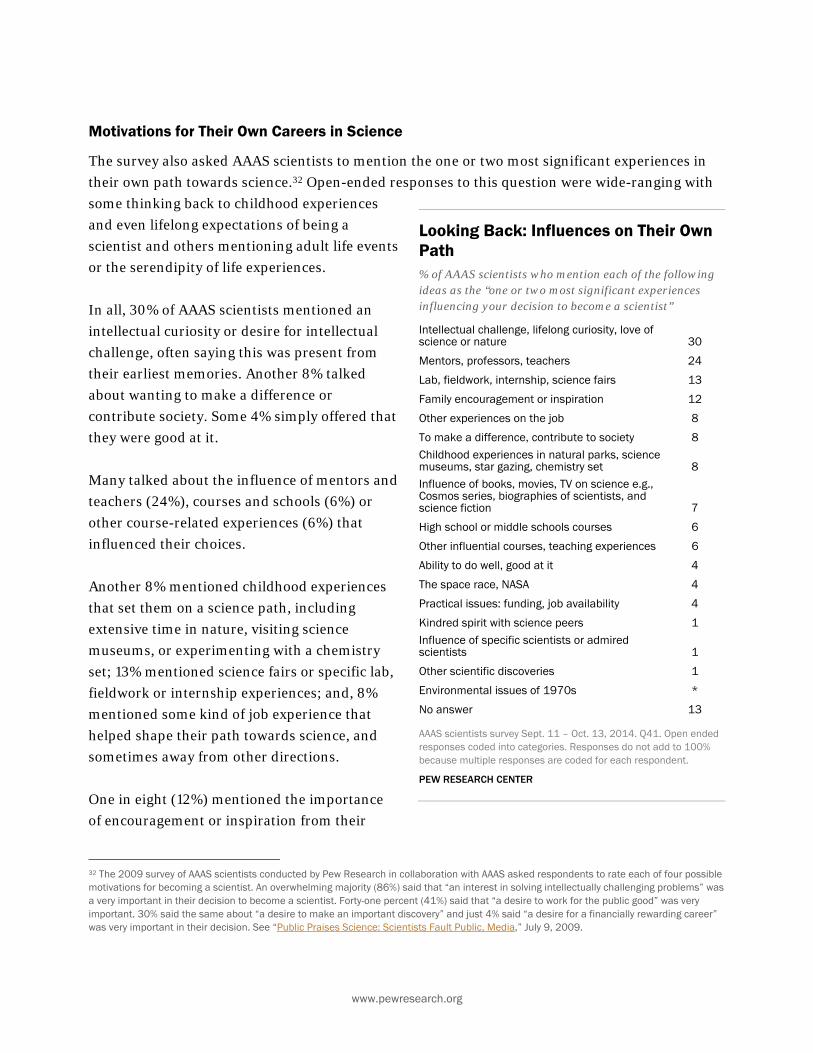
www.pewresearch.org
Motivations for Their Own Careers in Science
The survey also asked AAAS scientists to mention the one or two most significant experiences in
their own path towards science.32 Open-ended responses to this question were wide-ranging with
some thinking back to childhood experiences
and even lifelong expectations of being a
scientist and others mentioning adult life events
or the serendipity of life experiences.
In all, 30% of AAAS scientists mentioned an
intellectual curiosity or desire for intellectual
challenge, often saying this was present from
their earliest memories. Another 8% talked
about wanting to make a difference or
contribute society. Some 4% simply offered that
they were good at it.
Many talked about the influence of mentors and
teachers (24%), courses and schools (6%) or
other course-related experiences (6%) that
influenced their choices.
Another 8% mentioned childhood experiences
that set them on a science path, including
extensive time in nature, visiting science
museums, or experimenting with a chemistry
set; 13% mentioned science fairs or specific lab,
fieldwork or internship experiences; and, 8%
mentioned some kind of job experience that
helped shape their path towards science, and
sometimes away from other directions.
One in eight (12%) mentioned the importance
of encouragement or inspiration from their
32 The 2009 survey of AAAS scientists conducted by Pew Research in collaboration with AAAS asked respondents to rate each of four possible motivations for becoming a scientist. An overwhelming majority (86%) said that “an interest in solving intellectually challenging problems” was a very important in their decision to become a scientist. Forty-one percent (41%) said that “a desire to work for the public good” was very important. 30% said the same about “a desire to make an important discovery” and just 4% said “a desire for a financially rewarding career” was very important in their decision. See “Public Praises Science: Scientists Fault Public, Media,” July 9, 2009.
Looking Back: Influences on Their Own Path % of AAAS scientists who mention each of the following ideas as the “one or two most significant experiences influencing your decision to become a scientist”
Intellectual challenge, lifelong curiosity, love of science or nature 30
Mentors, professors, teachers 24
Lab, fieldwork, internship, science fairs 13
Family encouragement or inspiration 12
Other experiences on the job 8
To make a difference, contribute to society 8 Childhood experiences in natural parks, science museums, star gazing, chemistry set 8 Influence of books, movies, TV on science e.g., Cosmos series, biographies of scientists, and science fiction 7
High school or middle schools courses 6
Other influential courses, teaching experiences 6
Ability to do well, good at it 4
The space race, NASA 4
Practical issues: funding, job availability 4
Kindred spirit with science peers 1 Influence of specific scientists or admired scientists 1
Other scientific discoveries 1
Environmental issues of 1970s *
No answer 13
AAAS scientists survey Sept. 11 – Oct. 13, 2014. Q41. Open ended responses coded into categories. Responses do not add to 100% because multiple responses are coded for each respondent.
PEW RESEARCH CENTER

70
PEW RESEARCH CENTER
www.pewresearch.org
family. Others talked about the influence of books, movies and TV shows –either non-fiction or
fiction—that were influential in their lives (7%) and some talked about the influence of the space
race era (4%) or more practical concerns such as the availability of research funding or job
opportunities (4%).
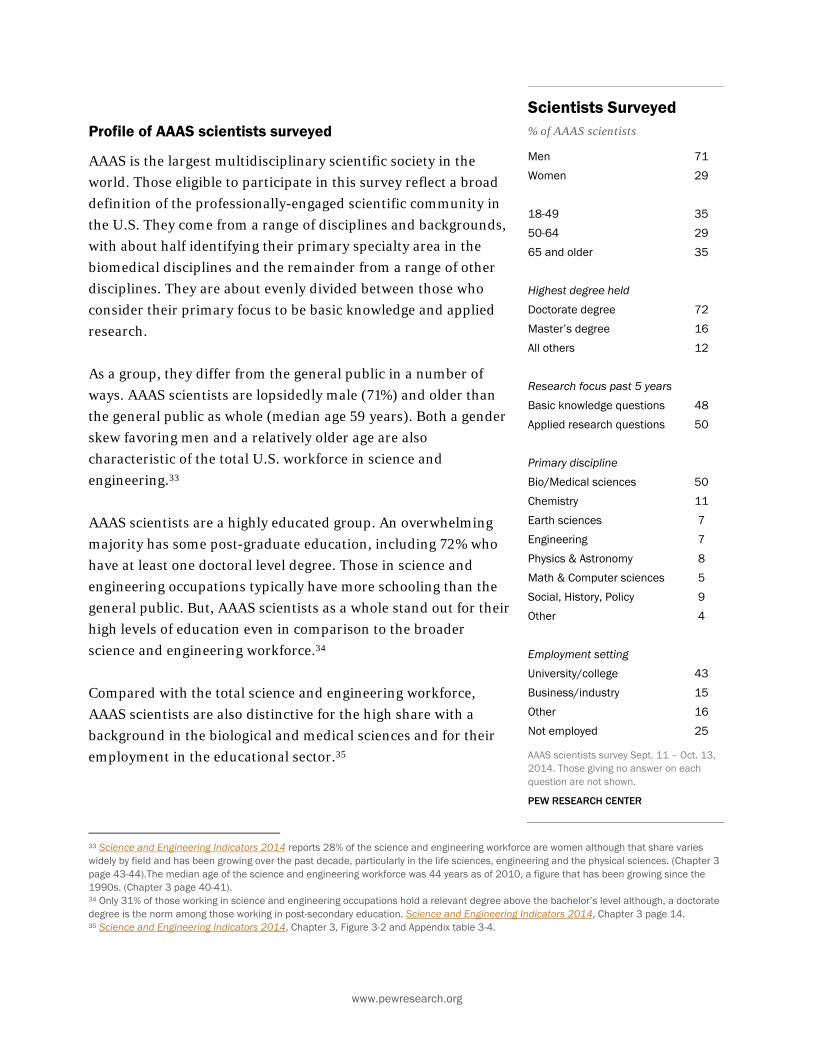
www.pewresearch.org
Profile of AAAS scientists surveyed
AAAS is the largest multidisciplinary scientific society in the
world. Those eligible to participate in this survey reflect a broad
definition of the professionally-engaged scientific community in
the U.S. They come from a range of disciplines and backgrounds,
with about half identifying their primary specialty area in the
biomedical disciplines and the remainder from a range of other
disciplines. They are about evenly divided between those who
consider their primary focus to be basic knowledge and applied
research.
As a group, they differ from the general public in a number of
ways. AAAS scientists are lopsidedly male (71%) and older than
the general public as whole (median age 59 years). Both a gender
skew favoring men and a relatively older age are also
characteristic of the total U.S. workforce in science and
engineering.33
AAAS scientists are a highly educated group. An overwhelming
majority has some post-graduate education, including 72% who
have at least one doctoral level degree. Those in science and
engineering occupations typically have more schooling than the
general public. But, AAAS scientists as a whole stand out for their
high levels of education even in comparison to the broader
science and engineering workforce.34
Compared with the total science and engineering workforce,
AAAS scientists are also distinctive for the high share with a
background in the biological and medical sciences and for their
employment in the educational sector.35
33 Science and Engineering Indicators 2014 reports 28% of the science and engineering workforce are women although that share varies widely by field and has been growing over the past decade, particularly in the life sciences, engineering and the physical sciences. (Chapter 3 page 43-44).The median age of the science and engineering workforce was 44 years as of 2010, a figure that has been growing since the 1990s. (Chapter 3 page 40-41). 34 Only 31% of those working in science and engineering occupations hold a relevant degree above the bachelor’s level although, a doctorate degree is the norm among those working in post-secondary education. Science and Engineering Indicators 2014, Chapter 3 page 14. 35 Science and Engineering Indicators 2014, Chapter 3, Figure 3-2 and Appendix table 3-4.
Scientists Surveyed % of AAAS scientists
Men 71
Women 29
18-49 35
50-64 29
65 and older 35
Highest degree held
Doctorate degree 72
Master’s degree 16
All others 12
Research focus past 5 years
Basic knowledge questions 48
Applied research questions 50
Primary discipline
Bio/Medical sciences 50
Chemistry 11
Earth sciences 7
Engineering 7
Physics & Astronomy 8
Math & Computer sciences 5
Social, History, Policy 9
Other 4
Employment setting
University/college 43
Business/industry 15
Other 16
Not employed 25
AAAS scientists survey Sept. 11 – Oct. 13, 2014. Those giving no answer on each question are not shown.
PEW RESEARCH CENTER

72
PEW RESEARCH CENTER
www.pewresearch.org
More than eight-in-ten (82%) AAAS scientists
consider their specialty “interdisciplinary” and
many have taken part in some kind of activity
that draws from more than one discipline. For
example, 57% of AAAS scientists say they
published a research study with a
multidisciplinary team and nearly all (92%)
report reading a journal article outside of their
primary specialty area in the past year.
Interdisciplinary Activities % of AAAS scientists
Read a journal article outside of their primary specialty area in past year 92
Primary specialty area is interdisciplinary 82
Published study with a multidisciplinary team 57
Taught a course with material from 2+ fields 47 Completed training in two or more primary fields 30
Held a university position in 2+ disciplines 20
AAAS scientists survey Sept. 11 – Oct. 13, 2014. Q45-46a-e. Those not selecting each item or giving no response are not shown.
PEW RESEARCH CENTER
Recent Research Experiences % of AAAS scientists
Received research funding within past 5 years 56
Conducted animal research within past 5 years 32 Conducted human subjects research within past 5 years 29 Clinical or translational research is primary specialty 27
AAAS scientists survey Sept. 11 – Oct. 13, 2014. Q44, Q55-57. Those saying this did not apply to them or giving no answer are not shown.
PEW RESEARCH CENTER
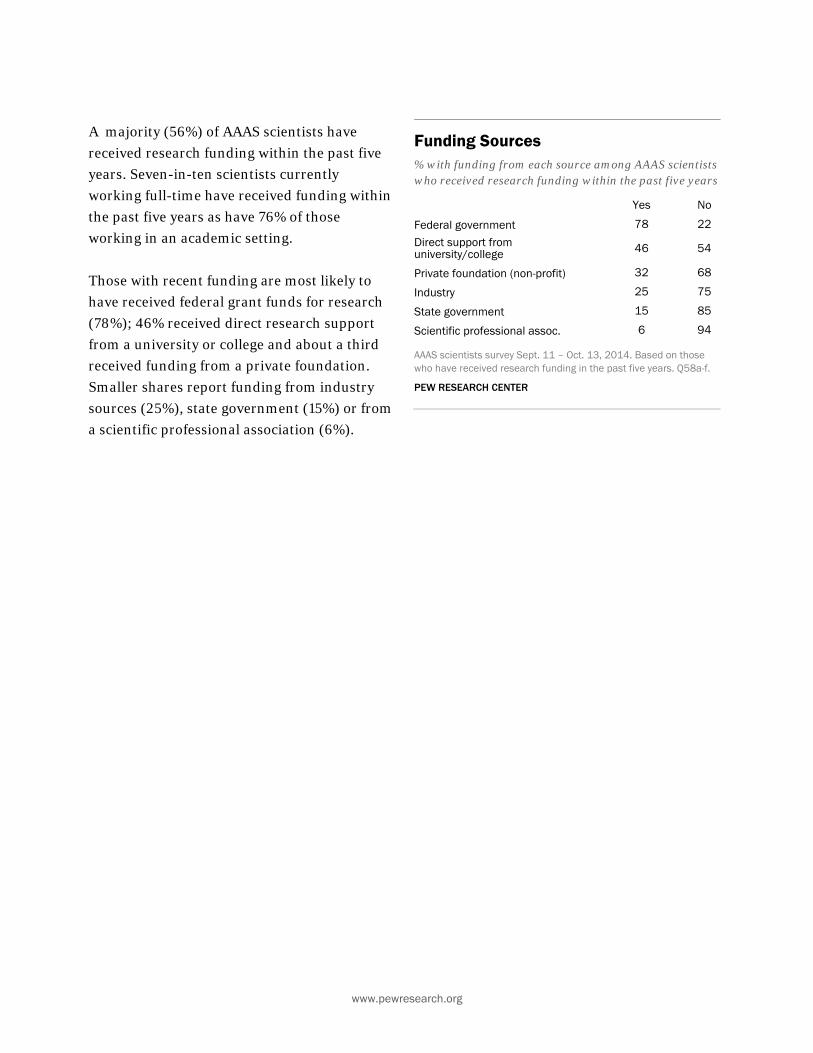
www.pewresearch.org
A majority (56%) of AAAS scientists have
received research funding within the past five
years. Seven-in-ten scientists currently
working full-time have received funding within
the past five years as have 76% of those
working in an academic setting.
Those with recent funding are most likely to
have received federal grant funds for research
(78%); 46% received direct research support
from a university or college and about a third
received funding from a private foundation.
Smaller shares report funding from industry
sources (25%), state government (15%) or from
a scientific professional association (6%).
Funding Sources % with funding from each source among AAAS scientists who received research funding within the past five years
Yes No
Federal government 78 22
Direct support from university/college 46 54
Private foundation (non-profit) 32 68
Industry 25 75
State government 15 85
Scientific professional assoc. 6 94
AAAS scientists survey Sept. 11 – Oct. 13, 2014. Based on those who have received research funding in the past five years. Q58a-f.
PEW RESEARCH CENTER

74
PEW RESEARCH CENTER
www.pewresearch.org
Appendix A: About the General Public Survey The general public survey was conducted by telephone with a national sample of adults (18 years
of age or older) living in all 50 U.S. states and the District of Columbia. The results reported here
are based on 2,002 interviews (801 respondents were interviewed on a landline telephone and
1,201 were interviewed on a cell phone). Interviews were completed in English and Spanish by live,
professionally trained interviewing staff at Princeton Data Source under the direction of Princeton
Survey Research Associates International from August 15 to 25, 2014.
Survey Design
A combination of landline and cell random digit dial (RDD) samples was used to reach a
representative sample of all adults in the United States who have access to either a landline or
cellular telephone. Both samples were disproportionately stratified to increase the incidence of
African-American and Hispanic respondents. Within each stratum, phone numbers were drawn
with equal probabilities. The landline samples were list-assisted and drawn from active blocks
containing one or more residential listings, while the cell samples were not list-assisted but were
drawn through a systematic sampling from dedicated wireless 100-blocks and shared service 100-
blocks with no directory-listed landline numbers. Both the landline and cell RDD samples were
disproportionately stratified by county based on estimated incidences of African-American and
Hispanic respondents.
Margin of Sampling Error
Statistical results are weighted to correct known demographic discrepancies, including
disproportionate stratification of the sample. The margins of error table shows the unweighted
sample sizes and the error attributable to sampling that would be expected at the 95% level of
confidence for different groups in the survey.
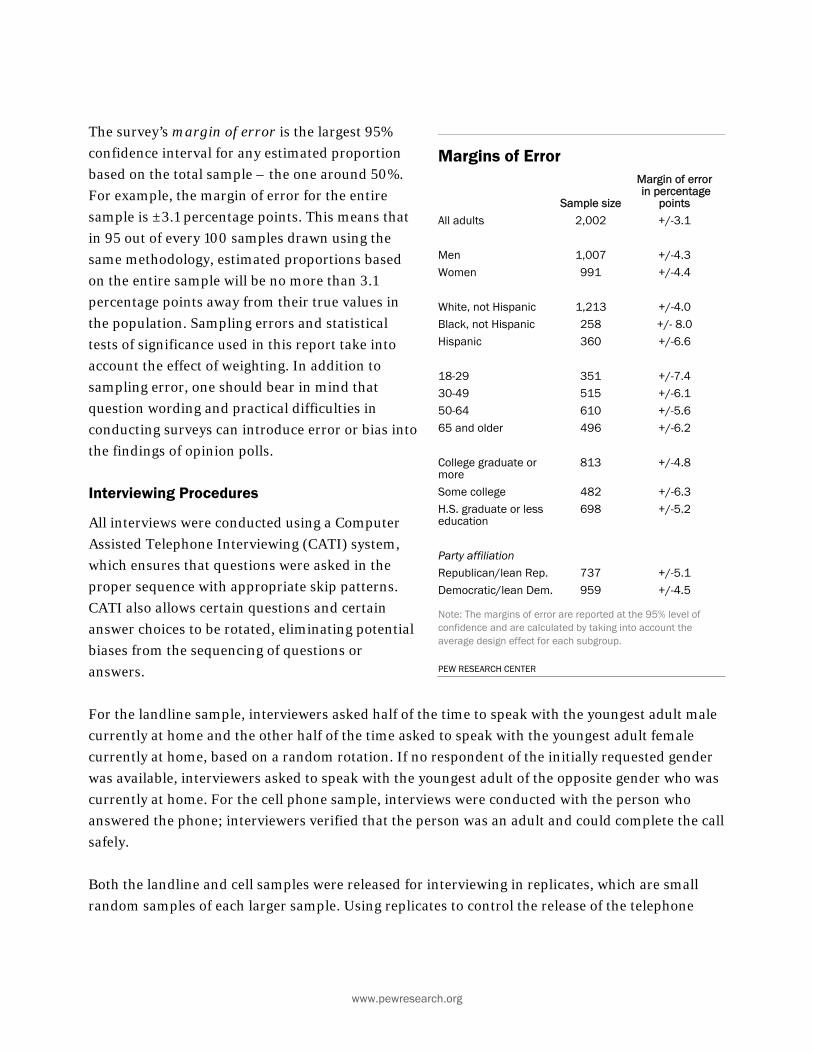
www.pewresearch.org
The survey’s margin of error is the largest 95%
confidence interval for any estimated proportion
based on the total sample – the one around 50%.
For example, the margin of error for the entire
sample is ±3.1 percentage points. This means that
in 95 out of every 100 samples drawn using the
same methodology, estimated proportions based
on the entire sample will be no more than 3.1
percentage points away from their true values in
the population. Sampling errors and statistical
tests of significance used in this report take into
account the effect of weighting. In addition to
sampling error, one should bear in mind that
question wording and practical difficulties in
conducting surveys can introduce error or bias into
the findings of opinion polls.
Interviewing Procedures
All interviews were conducted using a Computer
Assisted Telephone Interviewing (CATI) system,
which ensures that questions were asked in the
proper sequence with appropriate skip patterns.
CATI also allows certain questions and certain
answer choices to be rotated, eliminating potential
biases from the sequencing of questions or
answers.
For the landline sample, interviewers asked half of the time to speak with the youngest adult male
currently at home and the other half of the time asked to speak with the youngest adult female
currently at home, based on a random rotation. If no respondent of the initially requested gender
was available, interviewers asked to speak with the youngest adult of the opposite gender who was
currently at home. For the cell phone sample, interviews were conducted with the person who
answered the phone; interviewers verified that the person was an adult and could complete the call
safely.
Both the landline and cell samples were released for interviewing in replicates, which are small
random samples of each larger sample. Using replicates to control the release of the telephone
Margins of Error
Sample size
Margin of error in percentage
points All adults 2,002 +/-3.1 Men 1,007 +/-4.3 Women 991 +/-4.4 White, not Hispanic 1,213 +/-4.0 Black, not Hispanic 258 +/- 8.0 Hispanic 360 +/-6.6 18-29 351 +/-7.4 30-49 515 +/-6.1 50-64 610 +/-5.6 65 and older 496 +/-6.2 College graduate or more
813 +/-4.8
Some college 482 +/-6.3 H.S. graduate or less education
698 +/-5.2
Party affiliation Republican/lean Rep. 737 +/-5.1 Democratic/lean Dem. 959 +/-4.5
Note: The margins of error are reported at the 95% level of confidence and are calculated by taking into account the average design effect for each subgroup.
PEW RESEARCH CENTER
76
PEW RESEARCH CENTER
www.pewresearch.org
numbers ensures that the complete call procedures are followed for all numbers dialed. As many
as seven attempts were made to contact every sampled telephone number. The calls were
staggered at varied times of day and days of the week (including at least one daytime call) to
maximize the chances of making contact with a potential respondent.
Questionnaire Development
The Pew Research Center developed the questionnaire. The design of the questionnaire was
informed by consultation with a number of staff at the Pew Research Center, senior staff of the
AAAS, and several outside advisors. Questionnaire development is an iterative process. A pilot
study was conducted August 5-6, 2014 with 101 adults living in the continental U.S. The sample
was drawn from fresh RDD landline phone numbers (n=25) and a sample of cell phone numbers
from respondents interviewed in recent RDD omnibus studies (n=76). The tested questionnaire
included a number of open-ended questions to gauge what respondents had in mind when
thinking about the positive and negative effects of science on society. As a final step, a traditional
pretest was conducted August 12, 2014, with 24 adults living in the continental U.S. The sample
was drawn from fresh RDD landline phone numbers and a sample of cell phone numbers from
respondents interviewed in recent RDD omnibus studies. The interviews were conducted in
English under the direction of Princeton Survey Research Associates International. The interviews
tested the questions planned for the study questionnaire in the full survey context. The final
questionnaire lasted about 22 minutes, on average.
Weighting
Several stages of statistical adjustment or weighting are used to account for the complex nature of
the sample design. The weights account for numerous factors including (1) the different,
disproportionate probabilities of selection in each strata, (2) the overlap of the landline and cell
RDD sample frames and (3) differential nonresponse associated with sample demographics.
The first stage of weighting accounts for different probabilities of selection associated with the
number of adults in each household and each respondent’s telephone status.36 This weighting also
adjusts for the overlapping landline and cell RDD sample frames and the relative sizes of each
frame and each sample. Due to the disproportionately stratified sample design, the first-stage
weight was computed separately for each stratum in each sample frame.
After the first-stage weight adjustment, two rounds of poststratification were performed using an
iterative technique known as raking. The raking matches the selected demographics to parameters
36 Telephone status refers to whether respondents have only a landline telephone, only a cell phone or both kinds of telephone.
www.pewresearch.org
from the U.S. Census Bureau’s 2012 American Community Survey data.37 The population density
parameter was derived from 2010 census data. The telephone usage parameter came from an
analysis of the July-December, 2013 National Health Interview Survey.38 Raking was performed
separately for those asked each form of the questionnaire using sample balancing, a special
iterative sample weighting program that simultaneously balances the distributions of all variables
using a statistical technique called the Deming Algorithm. The raking corrects for differential
nonresponse that is related to particular demographic characteristics of the sample. This weight
ensures that the demographic characteristics of the sample closely approximate the demographic
characteristics of the population.
The first round of raking was done individually for three race/ethnicity groups (Hispanics, non-
Hispanic blacks, and all other non-Hispanics). The variables matched to population parameters
for each race/ethnicity group were gender, age, education and region. The variables matched to
population parameters for Hispanic respondents also included nativity (U.S. born versus foreign
born). The variables for other non-Hispanic respondents also included race (white race versus
some other or mixed race).
A second round of poststratification raking was performed on the total sample for each form. Each
form was raked to the following demographic variables: gender by age, gender by education, age
by education, census region, race/ethnicity, population density and household telephone status
(landline only, cell phone only, or both landline and cell phone).
37 ACS analysis was based on all adults excluding those living in institutional group quarters. 38 See Blumberg, S.J. and J.V. Luke. July 2014. Wireless substitution: Early Release of Estimates from the National Health Interview Survey, July-December, 2013. National Center for Health Statistics.

78
PEW RESEARCH CENTER
www.pewresearch.org
Appendix B: About the AAAS Scientists Survey The survey of scientists was conducted online with a random sample of 3,748 U.S.-based members
of the American Association for the Advancement of Science (AAAS) from September 11 to October
13, 2014. AAAS is the world’s largest general scientific society, and includes members from all
scientific fields. Founded in 1848, AAAS publishes Science, one of the most widely circulated peer-
reviewed scientific journals in the world. Membership in AAAS is open to all. The survey was
conducted under the direction of Princeton Survey Research Associates International.
Sampling
A simple random sample of AAAS members was selected for participation by the staff of AAAS.
Eligibility was limited to U.S. members but otherwise used a broad definition of the scientific
community. AAAS members of any discipline or background were eligible to participate except for
those whose membership type indicated that they were primary or secondary educators. AAAS
staff and institutional members were also excluded from eligibility.
The sample was designed to replicate that used in the 2009 survey of AAAS members, and thus to
maximize comparability of samples between the two time points. While it’s possible that the
composition of AAAS members could have changed in substantive ways over time, comparisons of
population characteristics in the AAAS membership database for 2009 and 2014 as well as sample
characteristics from survey respondents suggest that AAAS member characteristics have stayed
about the same on a variety of demographic and professional characteristics.
Weighting
Survey-based estimates of the population of AAAS members could be biased if some members are
more or less likely than others to participate in the survey. To help ensure sample
representativeness, the data were weighted to match population characteristics of AAAS
membership for three characteristics: membership category, fellowship status and email
availability. Membership categories of the organization adjust for a somewhat lower response rate
among student members and a somewhat higher response rate among other membership types
including emeritus and professional memberships. AAAS fellows also had somewhat higher
response rates compared with non-fellow members and thus weighting adjusts for that differential
response rate. As expected, those with no email availability responded at somewhat lower rates,
perhaps due to the greater difficulties this group faces participating in an online survey. Weighting
also included an adjustment for contact via email or mail-only. Post data collection statistical
adjustments require procedures that reflect departures from simple random sampling. The total
design effect for this survey is 1.10.
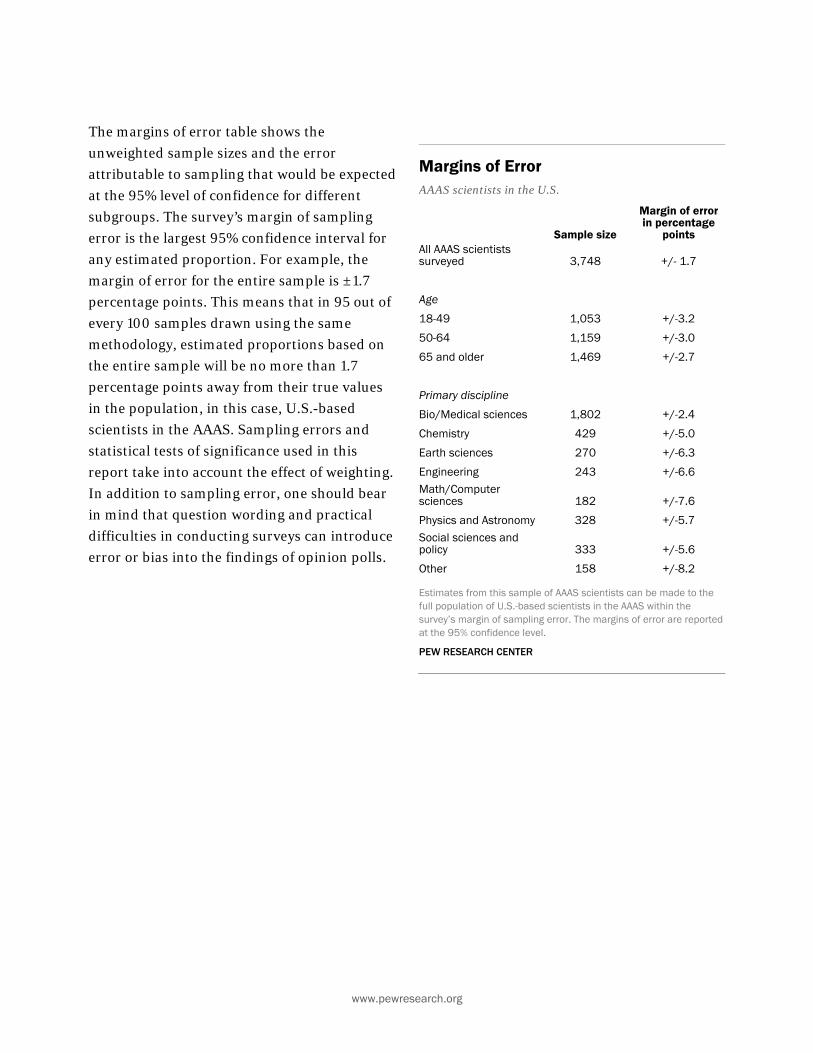
www.pewresearch.org
The margins of error table shows the
unweighted sample sizes and the error
attributable to sampling that would be expected
at the 95% level of confidence for different
subgroups. The survey’s margin of sampling
error is the largest 95% confidence interval for
any estimated proportion. For example, the
margin of error for the entire sample is ±1.7
percentage points. This means that in 95 out of
every 100 samples drawn using the same
methodology, estimated proportions based on
the entire sample will be no more than 1.7
percentage points away from their true values
in the population, in this case, U.S.-based
scientists in the AAAS. Sampling errors and
statistical tests of significance used in this
report take into account the effect of weighting.
In addition to sampling error, one should bear
in mind that question wording and practical
difficulties in conducting surveys can introduce
error or bias into the findings of opinion polls.
Margins of Error AAAS scientists in the U.S.
Sample size
Margin of error in percentage
points All AAAS scientists surveyed 3,748 +/- 1.7
Age
18-49 1,053 +/-3.2
50-64 1,159 +/-3.0
65 and older 1,469 +/-2.7
Primary discipline
Bio/Medical sciences 1,802 +/-2.4
Chemistry 429 +/-5.0
Earth sciences 270 +/-6.3
Engineering 243 +/-6.6 Math/Computer sciences 182 +/-7.6
Physics and Astronomy 328 +/-5.7 Social sciences and policy 333 +/-5.6
Other 158 +/-8.2
Estimates from this sample of AAAS scientists can be made to the full population of U.S.-based scientists in the AAAS within the survey’s margin of sampling error. The margins of error are reported at the 95% confidence level.
PEW RESEARCH CENTER
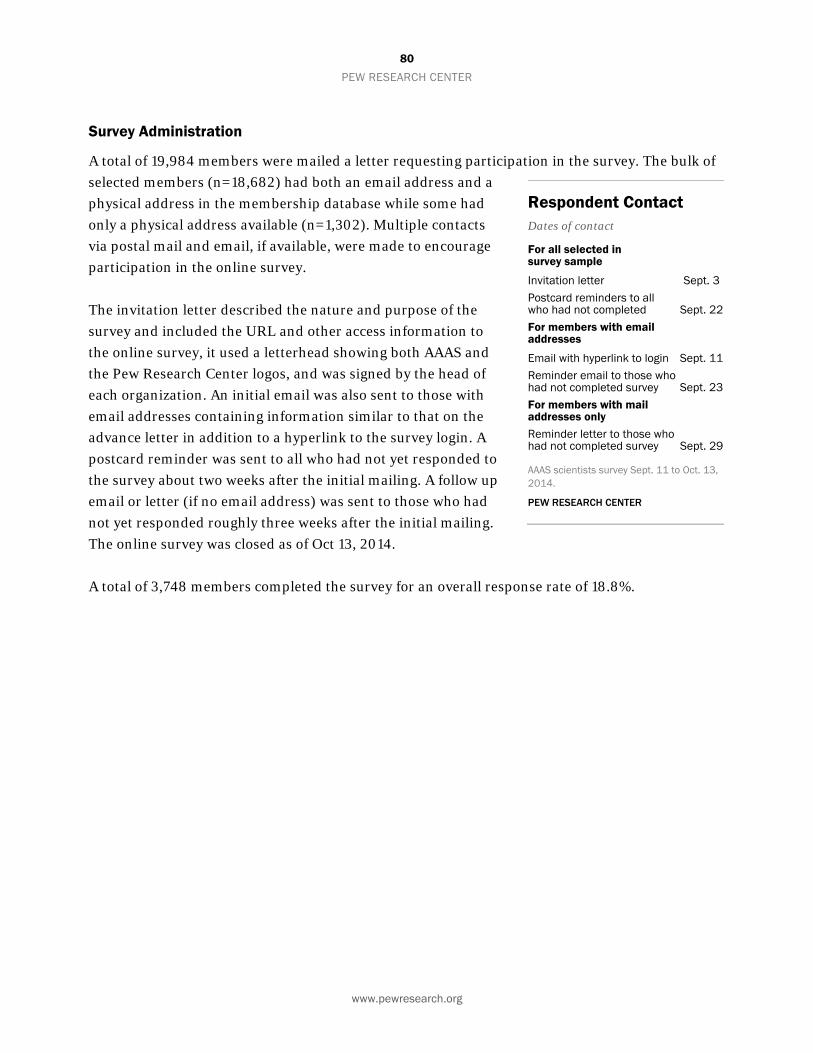
80
PEW RESEARCH CENTER
www.pewresearch.org
Survey Administration
A total of 19,984 members were mailed a letter requesting participation in the survey. The bulk of
selected members (n=18,682) had both an email address and a
physical address in the membership database while some had
only a physical address available (n=1,302). Multiple contacts
via postal mail and email, if available, were made to encourage
participation in the online survey.
The invitation letter described the nature and purpose of the
survey and included the URL and other access information to
the online survey, it used a letterhead showing both AAAS and
the Pew Research Center logos, and was signed by the head of
each organization. An initial email was also sent to those with
email addresses containing information similar to that on the
advance letter in addition to a hyperlink to the survey login. A
postcard reminder was sent to all who had not yet responded to
the survey about two weeks after the initial mailing. A follow up
email or letter (if no email address) was sent to those who had
not yet responded roughly three weeks after the initial mailing.
The online survey was closed as of Oct 13, 2014.
A total of 3,748 members completed the survey for an overall response rate of 18.8%.
Respondent Contact Dates of contact
For all selected in survey sample
Invitation letter Sept. 3 Postcard reminders to all who had not completed Sept. 22 For members with email addresses
Email with hyperlink to login Sept. 11 Reminder email to those who had not completed survey Sept. 23 For members with mail addresses only Reminder letter to those who had not completed survey Sept. 29
AAAS scientists survey Sept. 11 to Oct. 13, 2014.
PEW RESEARCH CENTER

www.pewresearch.org
Appendix C: Topline General Public Survey
PEW RESEARCH CENTER GENERAL PUBLIC SCIENCE SURVEY
TOPLINE AUGUST 15-25, 2014
N=2,002
NOTE: ALL NUMBERS ARE PERCENTAGES. ANY PERCENTAGES GREATER THAN ZERO BUT LESS THAN 0.5% ARE REPLACED BY AN
ASTERISK (*). COLUMNS/ROWS MAY NOT TOTAL 100% DUE TO ROUNDING. ASK ALL: Q.1 All in all, are you satisfied or dissatisfied with the way things are going in this country today? Aug 15-25, 201439 26 Satisfied 70 Dissatisfied 4 Don’t know/Refused (VOL.) ASK ALL: Q.2 We’d like you to compare the United States to other industrialized countries in a few different
areas. (First,) what about... [INSERT ITEM; READ AND RANDOMIZE]? [READ FOR FIRST ITEM, THEN AS NECESSARY: Do you think the U.S. is the BEST IN THE WORLD, above average, average or below average in [ITEM] compared to other industrialized countries?]
Best in Above Below (VOL.) the world average Average average DK/Ref a. Its scientific achievements Aug 15-25, 2014 15 39 34 9 3 Apr 28-May 12, 2009 17 47 26 5 4 TREND FOR COMPARISON: AAAS scientists survey: Sept 11-Oct 13, 201440 45 47 6 1 * May 1-June 14, 2009 49 45 5 1 * b. Its military Aug 15-25, 2014 39 37 15 5 3 Apr 28-May 12, 2009 42 39 13 3 3 c. Its economy Aug 15-25, 2014 7 26 36 29 2 Apr 28-May 12, 2009 12 22 33 31 3
39 Trends not shown. See Pew Research for trends from 1988 to present. 40 Survey of AAAS members conducted online. The share giving no answer to each question is listed under the “DK/Ref. (VOL.)” column. The question stem for the AAAS survey was “Compared with other industrialized countries, how would you rate the United States with regard to its overall scientific achievements?” RESPONSE OPTIONS: Best in the world; Above average; Average; Below average.”
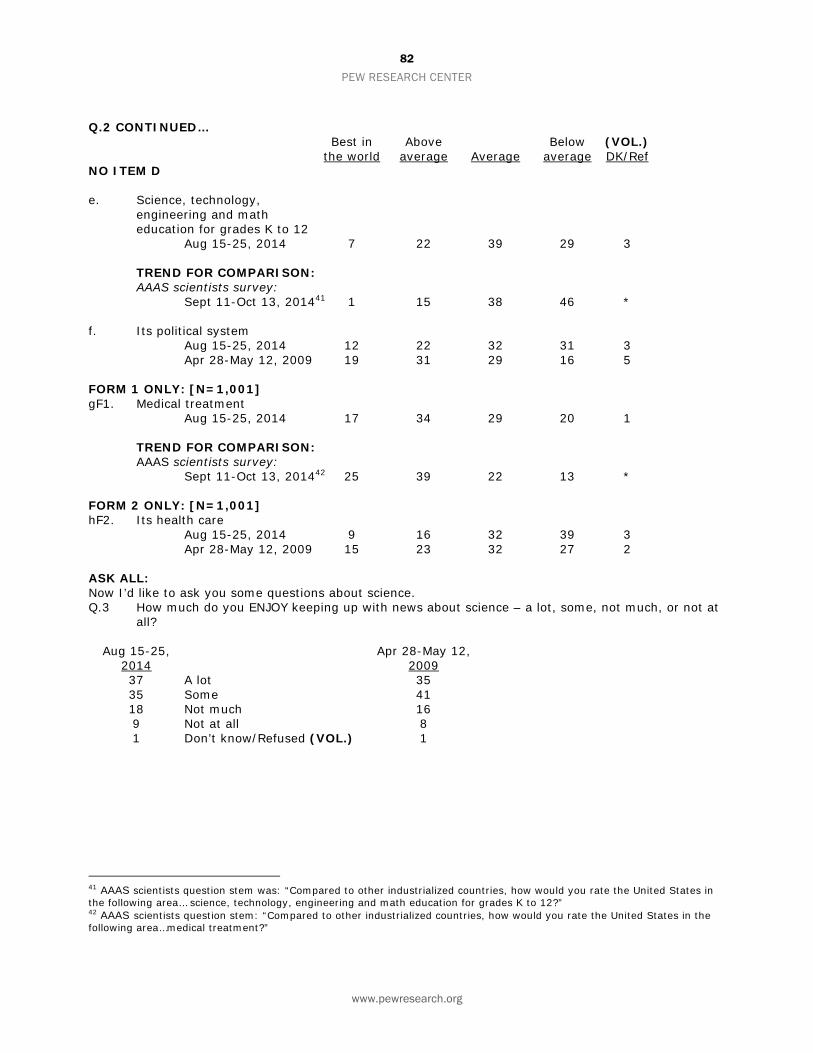
82
PEW RESEARCH CENTER
www.pewresearch.org
Q.2 CONTINUED… Best in Above Below (VOL.) the world average Average average DK/Ref NO ITEM D e. Science, technology,
engineering and math education for grades K to 12
Aug 15-25, 2014 7 22 39 29 3 TREND FOR COMPARISON: AAAS scientists survey: Sept 11-Oct 13, 201441 1 15 38 46 * f. Its political system Aug 15-25, 2014 12 22 32 31 3 Apr 28-May 12, 2009 19 31 29 16 5 FORM 1 ONLY: [N=1,001] gF1. Medical treatment Aug 15-25, 2014 17 34 29 20 1 TREND FOR COMPARISON: AAAS scientists survey: Sept 11-Oct 13, 201442 25 39 22 13 * FORM 2 ONLY: [N=1,001] hF2. Its health care Aug 15-25, 2014 9 16 32 39 3 Apr 28-May 12, 2009 15 23 32 27 2 ASK ALL: Now I’d like to ask you some questions about science. Q.3 How much do you ENJOY keeping up with news about science – a lot, some, not much, or not at
all? Aug 15-25, Apr 28-May 12, 2014 2009 37 A lot 35 35 Some 41 18 Not much 16 9 Not at all 8 1 Don’t know/Refused (VOL.) 1
41 AAAS scientists question stem was: “Compared to other industrialized countries, how would you rate the United States in the following area… science, technology, engineering and math education for grades K to 12?” 42 AAAS scientists question stem: “Compared to other industrialized countries, how would you rate the United States in the following area…medical treatment?”

www.pewresearch.org
ASK ALL: Q.4 Overall, has science made life easier or more difficult for most people? Aug 15-25, Apr 28-May 12, 2014 2009 79 Easier 83 15 More difficult 10 1 Not had much of an effect (VOL.) 1 4 Don’t know/Refused (VOL.) 6 ASK ALL: Q.5 Has science had a mostly positive or mostly negative effect on the quality of [INSERT ITEM;
RANDOMIZE] in the U.S.? What about [NEXT ITEM]? [IF NECESSARY: Has science had a mostly positive or mostly negative effect on the quality of [ITEM] in the U.S.?]
(VOL.) Mostly Mostly Not had much (VOL.) positive negative of an effect DK/Ref a. Food Aug 15-25, 2014 62 34 1 3 Apr 28-May 12, 200943 66 24 2 8 b. Health care Aug 15-25, 2014 79 18 1 3 Apr 28-May 12, 2009 85 10 1 4 c. The environment Aug 15-25, 2014 62 31 2 5 Apr 28-May 12, 2009 66 23 2 8 QUESTIONS 6 THROUGH 9 HELD FOR FUTURE RELEASE NO QUESTION 10-11 ASK ALL: Q.12 In your opinion, do government investments in [INSERT ITEM; RANDOMIZE] usually pay off
in the long run, or are they not worth it? Yes, pay off No, aren’t (VOL.) in the long run worth it DK/Ref a. Basic scientific research Aug 15-25, 2014 71 24 5 Apr 28-May 12, 2009 73 18 9 b. Engineering and technology Aug 15-25, 2014 72 22 6 Apr 28-May 12, 2009 74 17 9
43 In 2009, the question stem did not explicitly mention “in the U.S.”. The question wording was: “Has science had a mostly positive or mostly negative effect on the quality of [INSERT ITEM; RANDOMIZE]? What about [NEXT ITEM]? [IF NECESSARY: Has science had a mostly positive or mostly negative effect on the quality of [ITEM]?”

84
PEW RESEARCH CENTER
www.pewresearch.org
ASK ALL: Q.13 Which of these comes closer to your view? [READ AND RANDOMIZE RESPONSE OPTIONS] Aug 15-25, Apr 28-May 12, 2014 2009 61 Government investment in research is ESSENTIAL for scientific progress 60 [OR] 34 Private investment will ensure that enough scientific progress is made, 29 even without government investment 5 Don’t know/Refused (VOL.) 11 NO QUESTION 14-15 ASK ALL: Now a few questions about some issues... [RANDOMIZE QUESTIONS 16-18 IN BLOCKS WITH QUESTIONS Q20F1 to Q23 IN BLOCKS] ASK ALL: Q.16 Which comes closer to your view? [READ AND RANDOMIZE]: Humans and other living things
have evolved over time [OR] Humans and other living things have existed in their present form since the beginning of time.
IF EVOLVED (Q.16=1), ASK: Q.17 And do you think that…[READ OPTIONS AND RANDOMIZE]: Humans and other living things
have evolved due to natural processes such as natural selection [OR] A supreme being guided the evolution of living things for the purpose of creating humans and other life in the form it exists today?
--------------Evolved over time-------------- Due to Supreme (VOL.) Existed in (VOL.) natural being guided DK/ present form DK/ Total processes evolution Ref since beginning Ref Aug 15-25, 2014 65 35 24 5 31 4 Feb 27-Mar 16, 2014 61 34 23 4 34 5 Mar 21-Apr 8, 2013 60 32 24 4 33 7 Apr 28-May 12, 200944 61 32 22 7 31 8 TRENDS FOR COMPARISON: AAAS scientists survey Sept 11-Oct 13, 201445 98 90 8 1 2 * May 1-June 14, 2009 97 87 8 2 2 1
44 Similar questions on beliefs about evolution were asked in Pew Research surveys in July 2006 and July 2005. Beliefs about evolution were preceded by a question about whether or not respondents believed in God. That survey context may influence responses to questions about evolution. For details see topline in “Many Americans Uneasy with Mix of Religion and Politics”, August 24, 2006. 45 The nested Q17 responses do not add to the net of 98% on Q16 due to rounding.
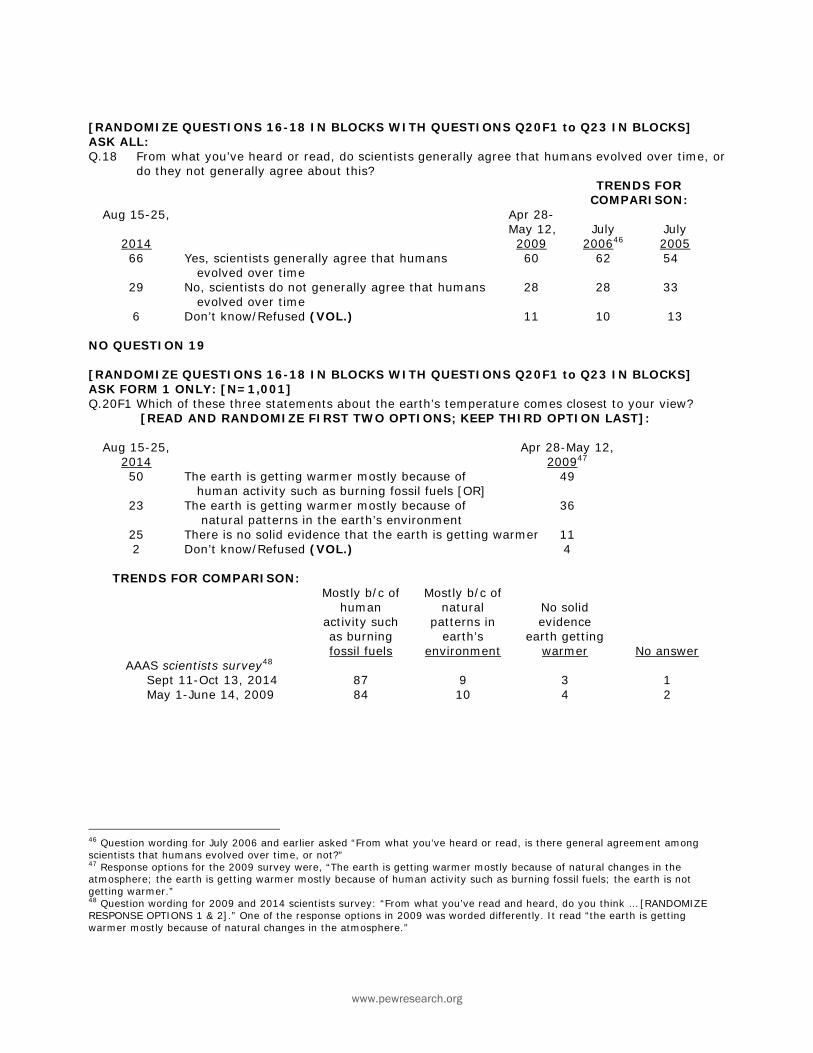
www.pewresearch.org
[RANDOMIZE QUESTIONS 16-18 IN BLOCKS WITH QUESTIONS Q20F1 to Q23 IN BLOCKS] ASK ALL: Q.18 From what you’ve heard or read, do scientists generally agree that humans evolved over time, or
do they not generally agree about this? TRENDS FOR COMPARISON: Aug 15-25, Apr 28-
May 12, July July 2014 2009 200646 2005 66 Yes, scientists generally agree that humans 60 62 54 evolved over time 29 No, scientists do not generally agree that humans 28 28 33 evolved over time 6 Don’t know/Refused (VOL.) 11 10 13 NO QUESTION 19 [RANDOMIZE QUESTIONS 16-18 IN BLOCKS WITH QUESTIONS Q20F1 to Q23 IN BLOCKS] ASK FORM 1 ONLY: [N=1,001] Q.20F1 Which of these three statements about the earth’s temperature comes closest to your view?
[READ AND RANDOMIZE FIRST TWO OPTIONS; KEEP THIRD OPTION LAST]: Aug 15-25, Apr 28-May 12, 2014 200947 50 The earth is getting warmer mostly because of 49
human activity such as burning fossil fuels [OR] 23 The earth is getting warmer mostly because of 36
natural patterns in the earth’s environment 25 There is no solid evidence that the earth is getting warmer 11 2 Don’t know/Refused (VOL.) 4 TRENDS FOR COMPARISON:
Mostly b/c of human
activity such as burning fossil fuels
Mostly b/c of natural
patterns in earth’s
environment
No solid evidence
earth getting warmer No answer
AAAS scientists survey48 Sept 11-Oct 13, 2014 87 9 3 1 May 1-June 14, 2009 84 10 4 2
46 Question wording for July 2006 and earlier asked “From what you’ve heard or read, is there general agreement among scientists that humans evolved over time, or not?” 47 Response options for the 2009 survey were, “The earth is getting warmer mostly because of natural changes in the atmosphere; the earth is getting warmer mostly because of human activity such as burning fossil fuels; the earth is not getting warmer.” 48 Question wording for 2009 and 2014 scientists survey: “From what you’ve read and heard, do you think … [RANDOMIZE RESPONSE OPTIONS 1 & 2].” One of the response options in 2009 was worded differently. It read “the earth is getting warmer mostly because of natural changes in the atmosphere.”

86
PEW RESEARCH CENTER
www.pewresearch.org
[RANDOMIZE QUESTIONS 16-18 IN BLOCKS WITH QUESTIONS Q20F1 to Q23 IN BLOCKS] ASK FORM 2 ONLY: [N=1,001] Q.21AF2 From what you’ve read and heard, is there solid evidence that the average temperature on
earth has been getting warmer over the past few decades, or not? ASK IF EARTH IS GETTING WARMER (Q.21AF2=1): Q.21BF2 Do you believe that the earth is getting warmer [READ AND RANDOMIZE: mostly because of
human activity such as burning fossil fuels/mostly because of natural patterns in the earth’s environment]?
---------------------Yes, solid evidence--------------------- (VOL.) Mostly b/c of human Mostly b/c of Mixed/ activity such as natural patterns in (VOL.) some (VOL.) Total burning fossil fuels earth’s environment DK/Ref No evidence DK/Ref Aug 15-25, 2014 72 46 22 3 25 1 2 Feb 27-Mar 16, 2014 61 40 18 3 35 1 3 Oct 9-13, 2013 67 44 18 4 26 2 5 Mar 13-17, 2013 69 42 23 4 27 1 4 Oct 4-7, 2012 67 42 19 6 26 1 6 Nov 9-14, 2011 63 38 18 6 28 1 8 Feb 22-Mar 1, 2011 58 36 18 5 34 2 5 Oct 13-18, 2010 59 34 18 6 32 1 8 Sep 30-Oct 4, 2009 57 36 16 6 33 2 8 April, 2008 71 47 18 6 21 3 5 January, 2007 77 47 20 10 16 1 6 August, 2006 77 47 20 10 17 1 5 July, 2006 79 50 23 6 17 1 3 June, 2006 70 41 21 8 20 1 9 [RANDOMIZE QUESTIONS 16-18 IN BLOCKS WITH QUESTIONS Q20F1 to Q23 IN BLOCKS] ASK FORM 2 ONLY: [N=1,001] Q.21AF2 From what you’ve read and heard, is there solid evidence that the average temperature on
earth has been getting warmer over the past few decades, or not? ASK IF EARTH IS NOT GETTING WARMER (Q.21AF2=2): Q.21CF2 Do you think that we just don’t know enough yet about whether the Earth is getting warmer or
do you think it’s just not happening? Aug 15-25, Feb 27-Mar 16 Oct 9-13 2014 2014 201349 25 NET No solid evidence (Q.21AF2) 35 26 11 Just don’t know enough yet 17 12 13 Just not happening 17 13 1 Don't know/Refused (VOL.) 1 1 75 Solid evidence/Some evidence (VOL.) 65 74
/Don’t know (VOL.)(Q.21AF2) NO QUESTION 22
49 Prior to October 2013, follow-up question was not asked of those who said there was no solid evidence.

www.pewresearch.org
[RANDOMIZE QUESTIONS 16-18 IN BLOCKS WITH QUESTIONS Q20F1 to Q23 IN BLOCKS] ASK ALL: Q.23 From what you’ve heard or read, do scientists generally agree that the earth is getting warmer
because of human activity, or do they not generally agree about this? Oct Oct Oct- Apr 28- Aug 15-25, 9-13 4-7 13-18 May 12 2014 2013 2012 2010 2009 Yes, scientists generally agree that the Earth is 57 getting warmer because of human activity 54 45 44 56 No, scientists do not generally agree that the Earth 37 is getting warmer because of human activity 37 43 44 35 6 Don’t know/Refused (VOL.) 10 12 12 9 ASK ALL: On another topic. Q.24 All in all, do you favor or oppose [INSERT ITEM; RANDOMIZE]? Do you favor or oppose
[NEXT ITEM]? (VOL.) Favor Oppose DK/Ref a. The use of animals in scientific research Aug 15-25, 2014 47 50 3 Apr 28-May 12, 2009 52 43 6 TRENDS FOR COMPARISON: AAAS scientists survey Sept 11-Oct 13, 2014 89 9 2 May 1-June 14, 2009 93 5 2 b. Building more nuclear power plants to generate electricity50 Aug 15-25, 2014 45 51 4 Apr 28-May 12, 2009 51 42 7 TRENDS FOR COMPARISON: AAAS scientists survey Sept 11-Oct 13, 2014 65 33 2 May 1-June 14, 2009 70 27 3 c. The increased use of fracking, a drilling method that uses high-pressure water and chemicals to extract oil and natural gas from underground rock formations51 Aug 15-25, 2014 39 51 10 Sep 4-8, 2013 44 49 7 Mar 13-17, 2013 48 38 14 TREND FOR COMPARISON: AAAS scientists survey Sept 11-Oct 13, 2014 31 66 3
50 Other Pew Research surveys have asked for views about “government policies to address America’s energy supply” including opinions about “the government promoting the use of nuclear power.” See “Continued Support for Keystone XL Pipeline,” Sep. 26, 2013. 51 A Pew Research survey conducted Nov. 6-9, 2014 repeated this question in a three-question set. See “Little Enthusiam, Familiar Divisions After the GOP’s Midterm Victory, Q.69 on the topline.
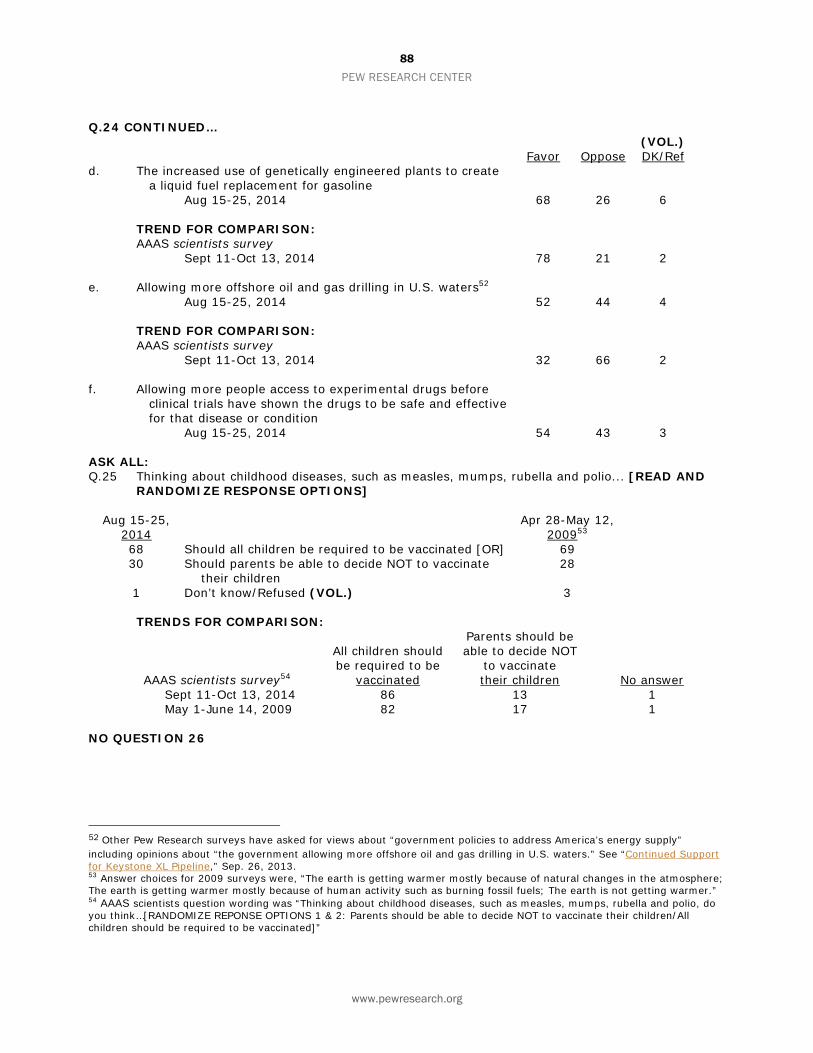
88
PEW RESEARCH CENTER
www.pewresearch.org
Q.24 CONTINUED… (VOL.) Favor Oppose DK/Ref d. The increased use of genetically engineered plants to create a liquid fuel replacement for gasoline Aug 15-25, 2014 68 26 6 TREND FOR COMPARISON: AAAS scientists survey Sept 11-Oct 13, 2014 78 21 2 e. Allowing more offshore oil and gas drilling in U.S. waters52 Aug 15-25, 2014 52 44 4 TREND FOR COMPARISON: AAAS scientists survey Sept 11-Oct 13, 2014 32 66 2 f. Allowing more people access to experimental drugs before clinical trials have shown the drugs to be safe and effective for that disease or condition Aug 15-25, 2014 54 43 3 ASK ALL: Q.25 Thinking about childhood diseases, such as measles, mumps, rubella and polio... [READ AND
RANDOMIZE RESPONSE OPTIONS] Aug 15-25, Apr 28-May 12, 2014 200953 68 Should all children be required to be vaccinated [OR] 69 30 Should parents be able to decide NOT to vaccinate 28
their children 1 Don’t know/Refused (VOL.) 3 TRENDS FOR COMPARISON:
AAAS scientists survey54
All children should be required to be
vaccinated
Parents should be able to decide NOT
to vaccinate their children No answer
Sept 11-Oct 13, 2014 86 13 1 May 1-June 14, 2009 82 17 1
NO QUESTION 26
52 Other Pew Research surveys have asked for views about “government policies to address America’s energy supply” including opinions about “the government allowing more offshore oil and gas drilling in U.S. waters.” See “Continued Support for Keystone XL Pipeline,” Sep. 26, 2013. 53 Answer choices for 2009 surveys were, “The earth is getting warmer mostly because of natural changes in the atmosphere; The earth is getting warmer mostly because of human activity such as burning fossil fuels; The earth is not getting warmer.” 54 AAAS scientists question wording was “Thinking about childhood diseases, such as measles, mumps, rubella and polio, do you think…[RANDOMIZE REPONSE OPTIONS 1 & 2: Parents should be able to decide NOT to vaccinate their children/All children should be required to be vaccinated]”

www.pewresearch.org
ASK ALL: Q.27 Thinking about the use of biological engineering to create artificial organs for humans needing a
transplant operation, would you say this is making appropriate use of medical advances OR is it taking medical advances too far?
Aug 15-25, 2014 74 Appropriate use of medical advances 23 Taking medical advances too far 3 Don’t know/Refused (VOL.) ASK ALL: Q.28 Which of these statements comes closest to your point of view, even if neither is exactly right?
[READ IN ORDER] Aug 15-25, Mar 21-Apr 8, Apr 6-May 6, 2014 2013 199955 38 (One) The growing world population will NOT be a major 37 42 problem because we will find a way to stretch our natural resources [OR] 59 (Two) The growing population WILL be a major problem 61 56 because there won’t be enough food and resources to go around -- Neither/Both equally (VOL.) 1 1 3 Don't know/Refused (VOL.) 2 1 TREND FOR COMPARISON:
AAAS scientists survey
The growing world population will NOT
be a major problem…
The growing world population WILL be a major problem… No answer
Sept 11-Oct 13, 2014 17 82 * ASK ALL: On another topic. Q.29 Do you think the SPACE STATION has been a good investment for this country, or don’t you
think so?56 Aug 15-25, 2014 64 Good investment 29 Not a good investment 7 Don’t know/Refused (VOL.) TREND FOR COMPARISON:
AAAS scientists survey Good investment Not a good investment No answer
Sept 11-Oct 13, 2014 68 31 2
55 In 1999 survey, response options one and two were randomized. 56 For other Pew Research surveys with questions related to the U.S. space program see “Majority Sees U.S. Leadership in Space as Essential,” July 5, 2011.

90
PEW RESEARCH CENTER
www.pewresearch.org
ASK ALL: Q.30 The cost of sending human astronauts to space is considerably greater than the cost of using
robotic machines for space exploration. As you think about the future of the U.S. space program, do you think it is essential or not essential to include the use of human astronauts in space?
Aug 15-25, 2014 59 Essential 39 Not essential 3 Don’t know/Refused (VOL.) TREND FOR COMPARISON:
AAAS scientists survey Essential Not essential No answer Sept 11-Oct 13, 2014 47 52 1
NO QUESTION 31 ASK ALL: Q.32 From what you’ve heard or read, would you say that [READ AND RANDOMIZE 1-2] Aug 15-25, 2014 42 Scientists generally believe that the universe was created in a single, violent event, often called “the Big Bang” 52 Scientists are divided in their views about how the universe was created 2 Both/Neither (VOL.) 5 Don’t know/Refused (VOL.) [RANDOMIZE ORDER OF Q33 AND Q34] ASK ALL: Q.33 Would you say that changing a baby's genetic characteristics to make the baby more intelligent
is making appropriate use of medical advances OR is it taking medical advances too far?57 Aug 15-25, 2014 15 Appropriate use of medical advances 83 Taking medical advances too far 2 Don’t know/Refused (VOL.)
57 A similar question was asked on the Virginia Commonwealth University Life Sciences Survey September 3-26, 2003. Question wording was, “Would you say that changing a baby’s genetic characteristics for cosmetic purposes such as eye or hair color is making appropriate use of medical advances or is it taking medical advances too far?” Fully 94% of adults said this was taking medical advances too far, 4% said it was an appropriate use of medical advances, 2% volunteered don’t know or gave no response. For details see “Public Values Science But Concerned About Biotechnology”
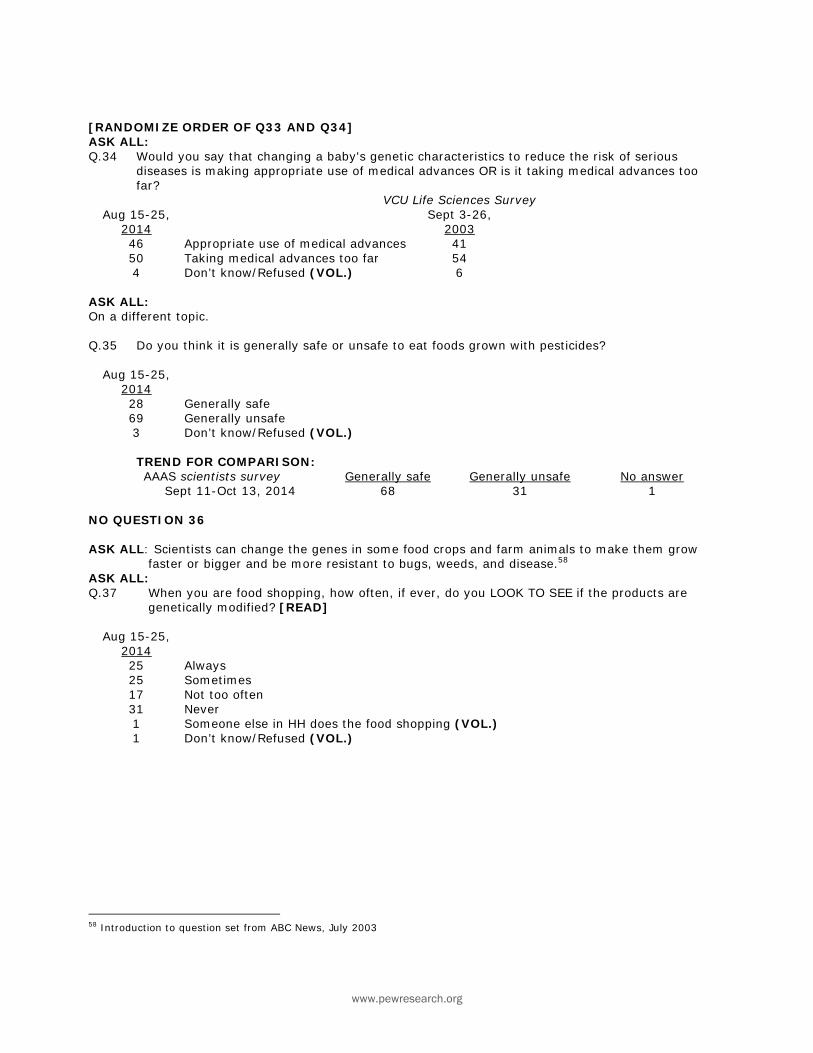
www.pewresearch.org
[RANDOMIZE ORDER OF Q33 AND Q34] ASK ALL: Q.34 Would you say that changing a baby's genetic characteristics to reduce the risk of serious
diseases is making appropriate use of medical advances OR is it taking medical advances too far?
VCU Life Sciences Survey Aug 15-25, Sept 3-26, 2014 2003 46 Appropriate use of medical advances 41 50 Taking medical advances too far 54 4 Don’t know/Refused (VOL.) 6 ASK ALL: On a different topic. Q.35 Do you think it is generally safe or unsafe to eat foods grown with pesticides? Aug 15-25, 2014 28 Generally safe 69 Generally unsafe 3 Don’t know/Refused (VOL.) TREND FOR COMPARISON:
AAAS scientists survey Generally safe Generally unsafe No answer Sept 11-Oct 13, 2014 68 31 1
NO QUESTION 36 ASK ALL: Scientists can change the genes in some food crops and farm animals to make them grow
faster or bigger and be more resistant to bugs, weeds, and disease.58 ASK ALL: Q.37 When you are food shopping, how often, if ever, do you LOOK TO SEE if the products are
genetically modified? [READ] Aug 15-25, 2014 25 Always 25 Sometimes 17 Not too often 31 Never 1 Someone else in HH does the food shopping (VOL.) 1 Don’t know/Refused (VOL.)
58 Introduction to question set from ABC News, July 2003
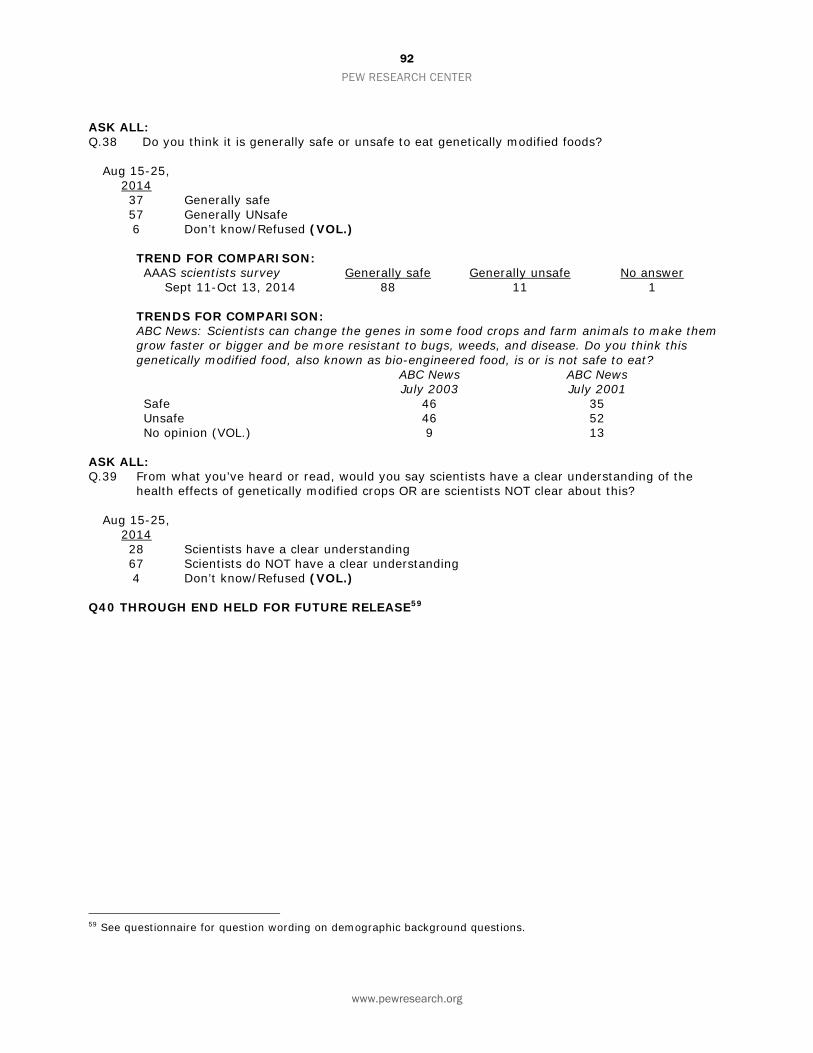
92
PEW RESEARCH CENTER
www.pewresearch.org
ASK ALL: Q.38 Do you think it is generally safe or unsafe to eat genetically modified foods? Aug 15-25, 2014 37 Generally safe 57 Generally UNsafe 6 Don’t know/Refused (VOL.) TREND FOR COMPARISON:
AAAS scientists survey Generally safe Generally unsafe No answer Sept 11-Oct 13, 2014 88 11 1
TRENDS FOR COMPARISON: ABC News: Scientists can change the genes in some food crops and farm animals to make them grow faster or bigger and be more resistant to bugs, weeds, and disease. Do you think this genetically modified food, also known as bio-engineered food, is or is not safe to eat? ABC News
July 2003 ABC News July 2001
Safe 46 35 Unsafe 46 52 No opinion (VOL.) 9 13
ASK ALL: Q.39 From what you’ve heard or read, would you say scientists have a clear understanding of the
health effects of genetically modified crops OR are scientists NOT clear about this? Aug 15-25, 2014 28 Scientists have a clear understanding 67 Scientists do NOT have a clear understanding 4 Don’t know/Refused (VOL.) Q40 THROUGH END HELD FOR FUTURE RELEASE59
59 See questionnaire for question wording on demographic background questions.

www.pewresearch.org
Appendix D: Topline AAAS Scientists Survey
PEW RESEARCH CENTER
2014 SURVEY OF AAAS SCIENTISTS TOPLINE
SEPTEMBER 11 ‐ OCTOBER 13, 2014 N=3,748
NOTE: ALL NUMBERS ARE PERCENTAGES. ANY PERCENTAGES GREATER THAN ZERO BUT LESS THAN 0.5% ARE REPLACED BY AN
ASTERISK (*). COLUMNS/ROWS MAY NOT TOTAL 100% DUE TO ROUNDING. ALL TREND COMPARISONS TO PEW RESEARCH SURVEY OF AAAS SCIENTISTS CONDUCTED MAY 1 TO JUNE 14, 2009, N=2,533
‐‐‐‐‐‐‐‐‐‐‐‐‐‐‐‐‐‐‐‐‐‐‐‐‐‐‐‐‐‐‐‐‐‐‐‐‐‐‐‐‐‐‐‐‐‐‐‐‐‐‐‐‐‐‐‐‐‐‐‐‐‐‐‐‐‐‐‐‐‐‐‐‐‐‐‐‐‐‐‐‐‐‐‐‐‐‐‐‐‐‐‐‐‐‐‐‐‐‐‐‐‐‐‐‐‐‐‐‐‐‐‐‐‐‐‐‐‐‐‐‐‐‐‐‐‐‐‐‐‐‐‐‐‐‐‐‐‐ In this survey we will be asking you both about issues pertaining to science in general and to your scientific field or specialty. Most questions will be about science in general, and we will specify when we are particularly interested in your views about your specialty. ASK ALL: Q1 Would you say that this is generally a good time or a bad time for science?
2014 2009 52 Good time 76 48 Bad time 23 * No answer 1
ASK ALL: Q2 Would you say this is generally a good time or a bad time for YOUR SCIENTIFIC SPECIALTY?
2014 2009 62 Good time 73 37 Bad time 25 1 No answer 2
ASK ALL: Q3 Compared to other industrialized countries, how would you rate the United States with regard
to its overall scientific achievements?
2014 2009 45 Best in the world 49 47 Above average 45 6 Average 5 1 Below average 1 * No answer *

94
PEW RESEARCH CENTER
www.pewresearch.org
[RANDOMIZE QUESTIONS Q4a TO Q4e] ASK ALL: Q4a Compared with other industrialized countries, how would you rate the United States in the
following area ... medical treatment?
2014 25 Best in the world 39 Above average 22 Average 13 Below average * No answer
ASK ALL: Q4b Compared with other industrialized countries, how would you rate the United States in the
following area ... industry research & development (R&D) innovation?
2014 29 Best in the world 53 Above average 15 Average 3 Below average 1 No answer
ASK ALL: Q4c Compared with other industrialized countries, how would you rate the United States in the
following area ... doctoral training in science and technology?
2014 46 Best in the world 41 Above average 10 Average 2 Below average * No answer
ASK ALL: Q4d Compared with other industrialized countries, how would you rate the United States in the
following area ... science, technology, engineering and math education for grades K to 12?
2014 1 Best in the world 15 Above average 38 Average 46 Below average * No answer
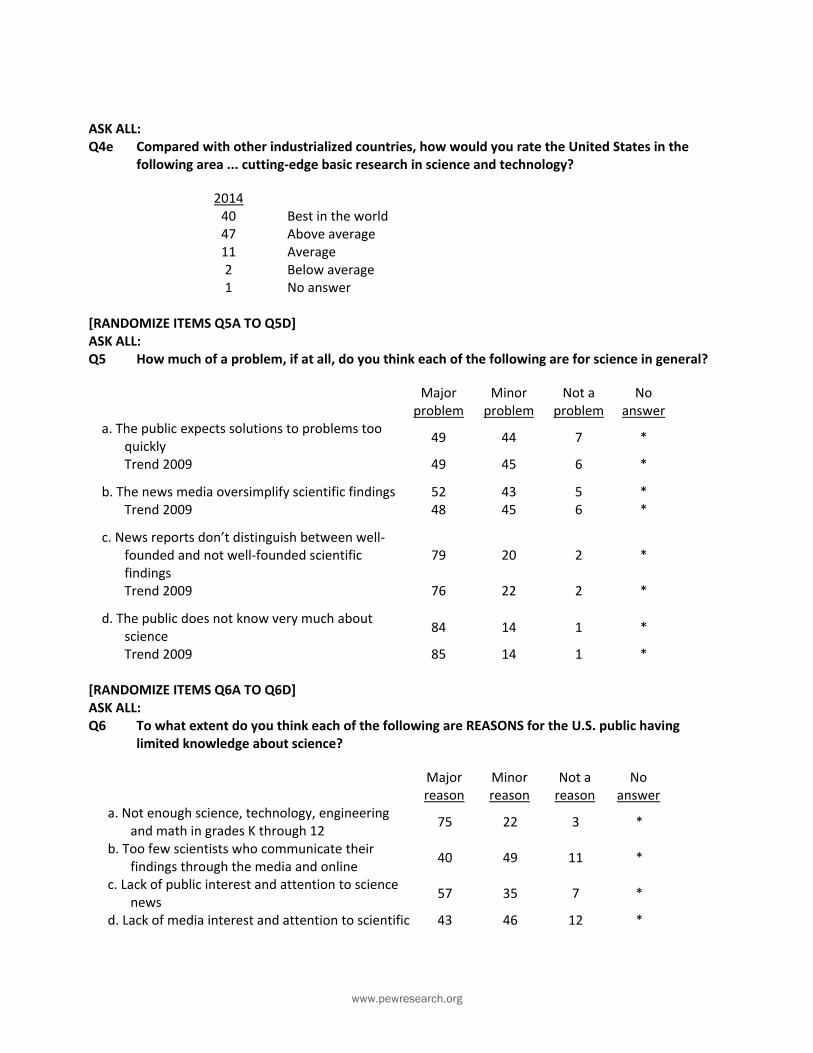
www.pewresearch.org
ASK ALL: Q4e Compared with other industrialized countries, how would you rate the United States in the
following area ... cutting‐edge basic research in science and technology?
2014 40 Best in the world 47 Above average 11 Average 2 Below average 1 No answer
[RANDOMIZE ITEMS Q5A TO Q5D] ASK ALL: Q5 How much of a problem, if at all, do you think each of the following are for science in general?
Major problem
Minor problem
Not a problem
No answer
a. The public expects solutions to problems too quickly
49 44 7 *
Trend 2009 49 45 6 *
b. The news media oversimplify scientific findings 52 43 5 * Trend 2009 48 45 6 *
c. News reports don’t distinguish between well‐founded and not well‐founded scientific findings
79 20 2 *
Trend 2009 76 22 2 *
d. The public does not know very much about science
84 14 1 *
Trend 2009 85 14 1 * [RANDOMIZE ITEMS Q6A TO Q6D] ASK ALL: Q6 To what extent do you think each of the following are REASONS for the U.S. public having
limited knowledge about science?
Major reason
Minor reason
Not a reason
No answer
a. Not enough science, technology, engineering and math in grades K through 12
75 22 3 *
b. Too few scientists who communicate their findings through the media and online
40 49 11 *
c. Lack of public interest and attention to science news
57 35 7 *
d. Lack of media interest and attention to scientific 43 46 12 *
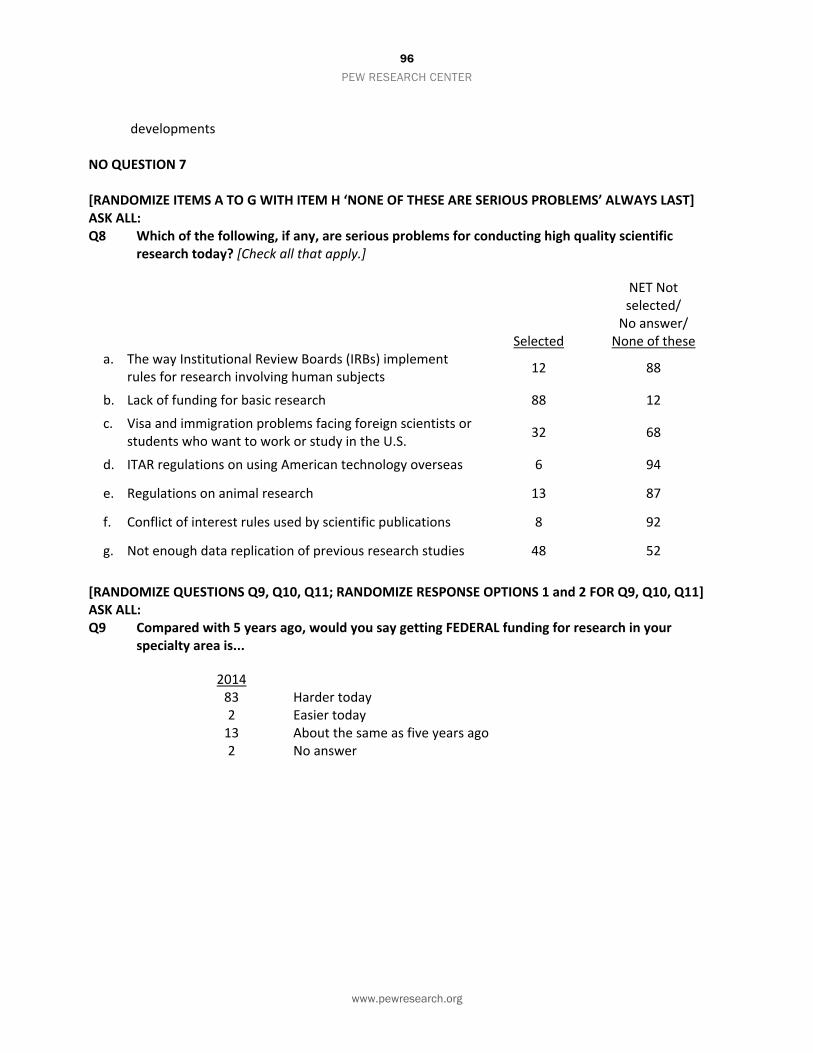
96
PEW RESEARCH CENTER
www.pewresearch.org
developments NO QUESTION 7 [RANDOMIZE ITEMS A TO G WITH ITEM H ‘NONE OF THESE ARE SERIOUS PROBLEMS’ ALWAYS LAST] ASK ALL: Q8 Which of the following, if any, are serious problems for conducting high quality scientific
research today? [Check all that apply.]
Selected
NET Not selected/ No answer/ None of these
a. The way Institutional Review Boards (IRBs) implement rules for research involving human subjects
12 88
b. Lack of funding for basic research 88 12
c. Visa and immigration problems facing foreign scientists or students who want to work or study in the U.S.
32 68
d. ITAR regulations on using American technology overseas 6 94
e. Regulations on animal research 13 87
f. Conflict of interest rules used by scientific publications 8 92
g. Not enough data replication of previous research studies 48 52
[RANDOMIZE QUESTIONS Q9, Q10, Q11; RANDOMIZE RESPONSE OPTIONS 1 and 2 FOR Q9, Q10, Q11] ASK ALL: Q9 Compared with 5 years ago, would you say getting FEDERAL funding for research in your
specialty area is...
2014 83 Harder today 2 Easier today 13 About the same as five years ago 2 No answer
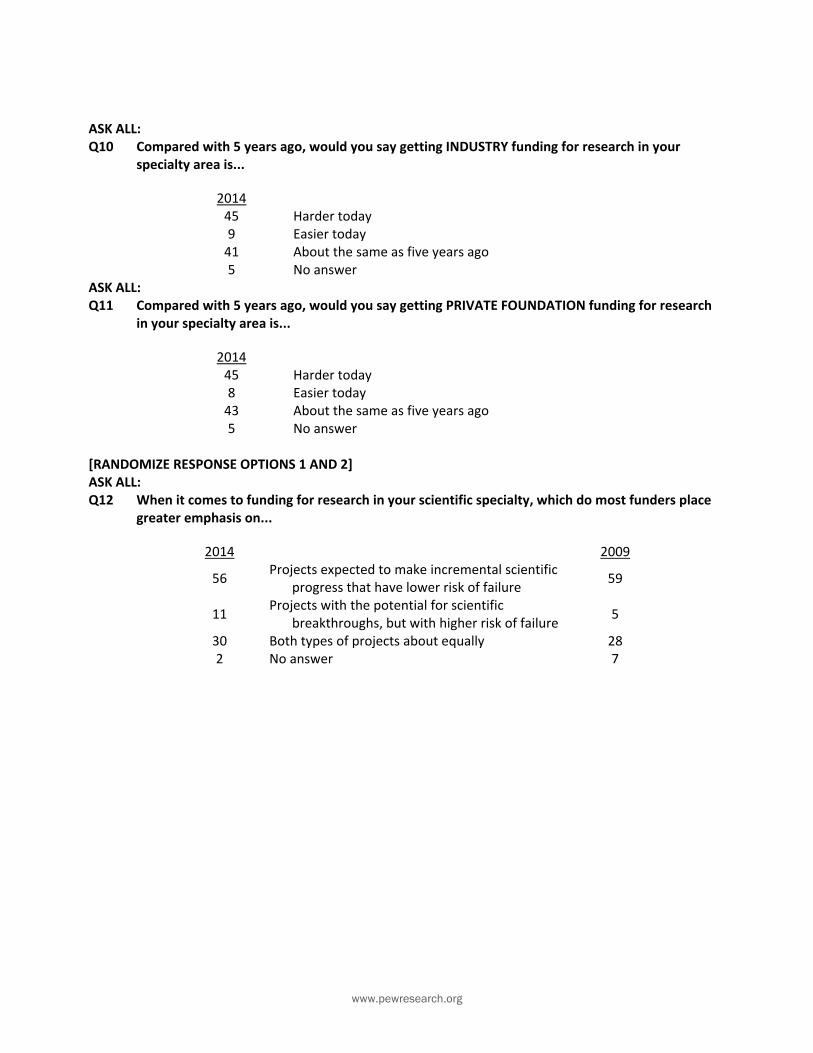
www.pewresearch.org
ASK ALL: Q10 Compared with 5 years ago, would you say getting INDUSTRY funding for research in your
specialty area is...
2014 45 Harder today 9 Easier today 41 About the same as five years ago 5 No answer
ASK ALL: Q11 Compared with 5 years ago, would you say getting PRIVATE FOUNDATION funding for research
in your specialty area is...
2014 45 Harder today 8 Easier today 43 About the same as five years ago 5 No answer
[RANDOMIZE RESPONSE OPTIONS 1 AND 2] ASK ALL: Q12 When it comes to funding for research in your scientific specialty, which do most funders place
greater emphasis on...
2014 2009
56 Projects expected to make incremental scientific
progress that have lower risk of failure 59
11 Projects with the potential for scientific
breakthroughs, but with higher risk of failure 5
30 Both types of projects about equally 28 2 No answer 7
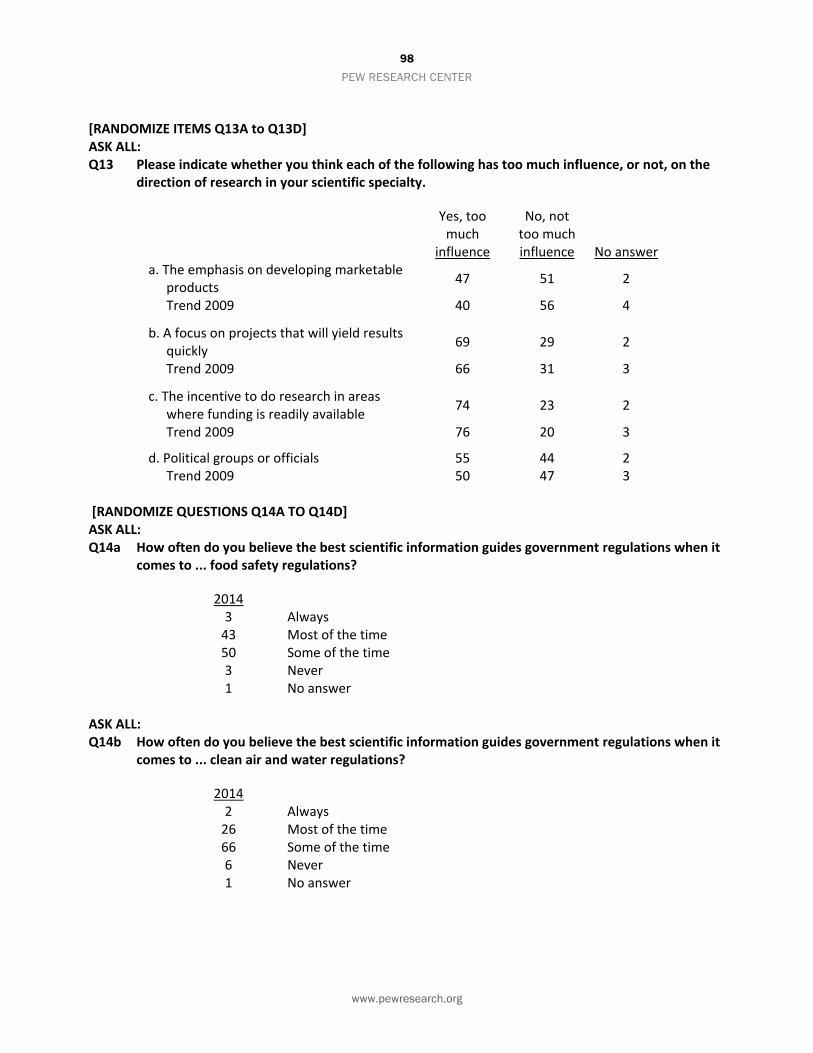
98
PEW RESEARCH CENTER
www.pewresearch.org
[RANDOMIZE ITEMS Q13A to Q13D] ASK ALL: Q13 Please indicate whether you think each of the following has too much influence, or not, on the
direction of research in your scientific specialty.
Yes, too much
influence
No, not too much influence No answer
a. The emphasis on developing marketable products
47 51 2
Trend 2009 40 56 4
b. A focus on projects that will yield results quickly
69 29 2
Trend 2009 66 31 3
c. The incentive to do research in areas where funding is readily available
74 23 2
Trend 2009 76 20 3
d. Political groups or officials 55 44 2 Trend 2009 50 47 3
[RANDOMIZE QUESTIONS Q14A TO Q14D] ASK ALL: Q14a How often do you believe the best scientific information guides government regulations when it
comes to ... food safety regulations?
2014 3 Always 43 Most of the time 50 Some of the time 3 Never 1 No answer
ASK ALL: Q14b How often do you believe the best scientific information guides government regulations when it
comes to ... clean air and water regulations?
2014 2 Always 26 Most of the time 66 Some of the time 6 Never 1 No answer

www.pewresearch.org
ASK ALL: Q14c How often do you believe the best scientific information guides government regulations when it
comes to ... new drug and medical treatment regulations?
2014 4 Always 54 Most of the time 40 Some of the time 1 Never 1 No answer
ASK ALL: Q14d How often do you believe the best scientific information guides government regulations when it
comes to ... land use regulations?
2014 1 Always 14 Most of the time 75 Some of the time 9 Never 1 No answer
QUESTION 15 HELD FOR FUTURE RELEASE

100
PEW RESEARCH CENTER
www.pewresearch.org
[RANDOMIZE Q16‐Q17 BLOCK WITH Q18‐Q19 BLOCK] [DISPLAY FOR ALL WITH FIRST QUESTION IN SET:] Next, a few questions about issues being debated by the public. ASK ALL: Q16 Which comes closer to your view: [RANDOMIZE RESPONSE OPTIONS: Humans and other living
things have evolved over time; Humans and other living things have existed in their present form since the beginning of time]
ASK IF EVOLVED (Q16=1): Q17 Do you think that... [RANDOMIZE RESPONSE OPTIONS: Humans and over living things have evolved due to natural processes such as natural selection; A supreme being guided the evolution of living things for the purpose of creating humans and other life in the form it exists today] 201460 2009 98 Humans and other living things have evolved over time 97
90 Humans and other living things have evolved due to natural processes such as natural selection
87
8 A supreme being guided the evolution of living things for the purpose of creating humans and other life in the form it exists today
8
1 No answer Q17 2
2 Humans and other living things have existed in their present form since the beginning of time
2
* No answer Q16 1 [RANDOMIZE Q16‐Q17 BLOCK WITH Q18‐Q19 BLOCK] ASK ALL: Q18 From what you’ve read and heard, do you think... [RANDOMIZE RESPONSE OPTIONS 1 AND 2]:
2014 200961
9 The earth is getting warmer mostly because of natural patterns in
the earth’s environment 10
87 The earth is getting warmer mostly because of human activity
such as burning fossil fuels 84
3 There is no solid evidence that the earth is getting warmer 4 1 No answer 2
60 The nested Q17 responses do not sum to the net of 98% on Q16 due to rounding. 61In the 2009 survey, one of the response options was worded differently. It read, “the earth is getting warmer mostly because of natural changes in the atmosphere.”
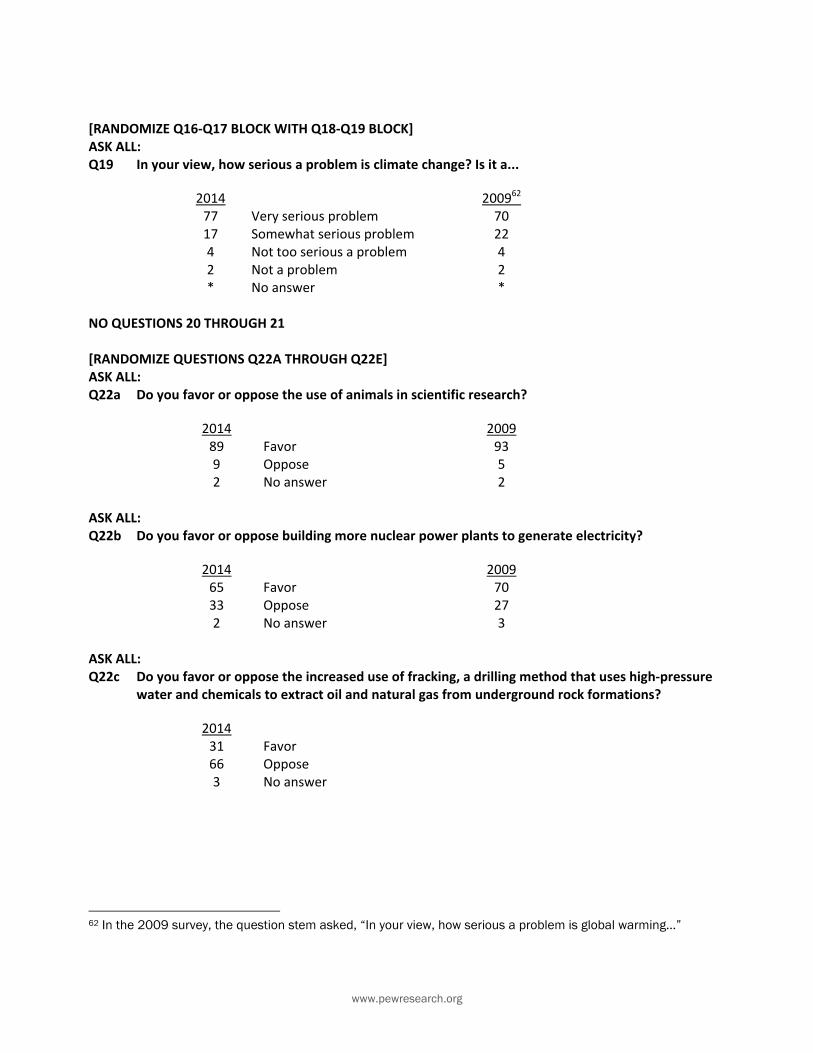
www.pewresearch.org
[RANDOMIZE Q16‐Q17 BLOCK WITH Q18‐Q19 BLOCK] ASK ALL: Q19 In your view, how serious a problem is climate change? Is it a...
2014 200962 77 Very serious problem 70 17 Somewhat serious problem 22 4 Not too serious a problem 4 2 Not a problem 2 * No answer *
NO QUESTIONS 20 THROUGH 21 [RANDOMIZE QUESTIONS Q22A THROUGH Q22E] ASK ALL: Q22a Do you favor or oppose the use of animals in scientific research?
2014 2009 89 Favor 93 9 Oppose 5 2 No answer 2
ASK ALL: Q22b Do you favor or oppose building more nuclear power plants to generate electricity?
2014 2009 65 Favor 70 33 Oppose 27 2 No answer 3
ASK ALL: Q22c Do you favor or oppose the increased use of fracking, a drilling method that uses high‐pressure
water and chemicals to extract oil and natural gas from underground rock formations?
2014 31 Favor 66 Oppose 3 No answer
62 In the 2009 survey, the question stem asked, “In your view, how serious a problem is global warming…”
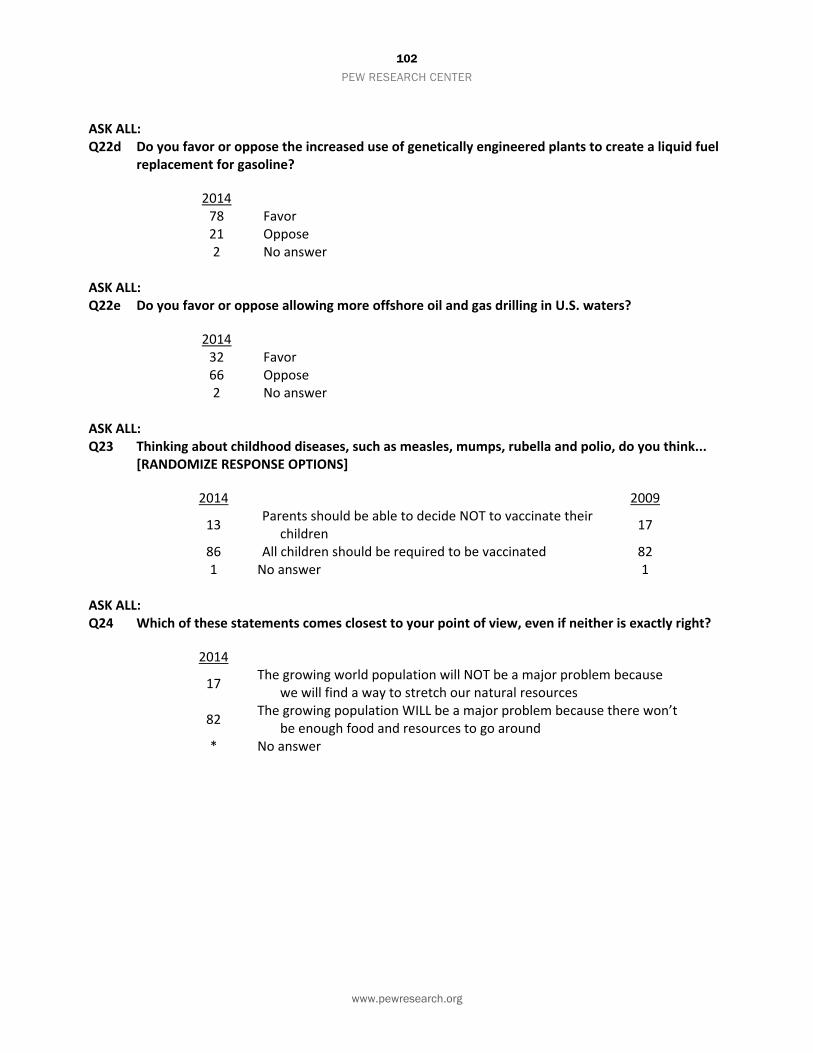
102
PEW RESEARCH CENTER
www.pewresearch.org
ASK ALL: Q22d Do you favor or oppose the increased use of genetically engineered plants to create a liquid fuel
replacement for gasoline?
2014 78 Favor 21 Oppose 2 No answer
ASK ALL: Q22e Do you favor or oppose allowing more offshore oil and gas drilling in U.S. waters?
2014 32 Favor 66 Oppose 2 No answer
ASK ALL: Q23 Thinking about childhood diseases, such as measles, mumps, rubella and polio, do you think...
[RANDOMIZE RESPONSE OPTIONS]
2014 2009
13 Parents should be able to decide NOT to vaccinate their
children 17
86 All children should be required to be vaccinated 82 1 No answer 1
ASK ALL: Q24 Which of these statements comes closest to your point of view, even if neither is exactly right?
2014
17 The growing world population will NOT be a major problem because
we will find a way to stretch our natural resources
82 The growing population WILL be a major problem because there won’t
be enough food and resources to go around * No answer
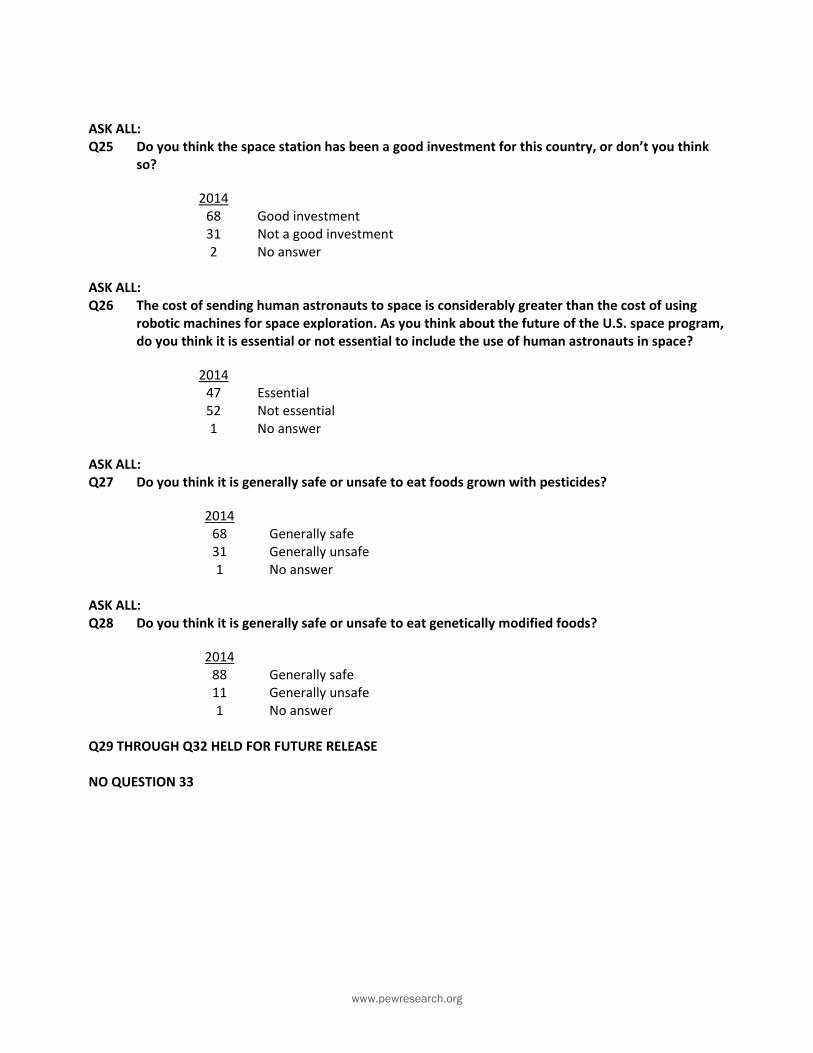
www.pewresearch.org
ASK ALL: Q25 Do you think the space station has been a good investment for this country, or don’t you think
so?
2014 68 Good investment 31 Not a good investment 2 No answer
ASK ALL: Q26 The cost of sending human astronauts to space is considerably greater than the cost of using
robotic machines for space exploration. As you think about the future of the U.S. space program, do you think it is essential or not essential to include the use of human astronauts in space?
2014 47 Essential 52 Not essential 1 No answer
ASK ALL: Q27 Do you think it is generally safe or unsafe to eat foods grown with pesticides?
2014 68 Generally safe 31 Generally unsafe 1 No answer
ASK ALL: Q28 Do you think it is generally safe or unsafe to eat genetically modified foods?
2014 88 Generally safe 11 Generally unsafe 1 No answer
Q29 THROUGH Q32 HELD FOR FUTURE RELEASE NO QUESTION 33

104
PEW RESEARCH CENTER
www.pewresearch.org
[DISPLAY FOR ALL:] A few questions about science as a career... ASK ALL: Q34 Overall, how would you characterize this as a time to begin a career in your scientific specialty
area? Would you say it is a...
2014 2009 15 Very good time 17 44 Good time 50 33 Bad time 27 7 Very bad time 5 1 No answer 1
ASK ALL: Q35 Compared with five years ago, would you say attracting the best young people to a science
career is...
2014 9 Easier today 58 Harder today 32 About the same as five years ago 1 No answer
[RANDOMIZE ITEMS A TO F WITH ITEM G ‘NONE OF THESE ARE SERIOUS PROBLEMS FOR PEOPLE ENTERING A CAREER AS A RESEARCH SCIENTIST THESE DAYS’ ALWAYS LAST] ASK ALL: Q36 Which of the following, if any, are serious problems for people entering a career as a research
scientist these days? [Check all that apply.]
Selected
NET Not selected/ No answer/ None of these
a. Lack of adequate funding for research needs 85 15 b. Salaries below market competition 50 50 c. Too few job openings for tenure‐track positions 73 27 d. Graduate training that doesn’t meet today’s needs 31 69 e. The long hours needed to succeed in a research career 46 54 f. Too few job openings in industry research & development
(R&D) positions 54 46

www.pewresearch.org
Q37 THROUGH Q38 HELD FOR FUTURE RELEASE ASK ALL: Q39 Thinking about any scientific research that you have been involved with during the past five
years, do you think of your work as PRIMARILY addressing... [RANDOMIZE RESPONSE OPTIONS]
2014 2009 48 Basic knowledge questions 49 50 Applied research questions 46 2 No answer 5
NO QUESTION 40 ASK ALL: Q41 What were the one or two most significant experiences influencing your decision to become a
scientist? [Please type your response in the box.]
OPEN END RESPONSES CATEGORIZED AS FOLLOWS; MULTIPLE RESPONSES ALLOWED 2014 30 Intellectually challenging, lifelong curiosity, love of science or nature 8 To make a difference, contribute to society, help others, teach 4 Ability to do well, good at it 24 Mentors, Professors, Teachers (at any level) 6 High school or middle school courses, science magnet school 6 Other influential courses or teaching experience when it “clicked” 13 Lab experience, fieldwork, internships, science fairs 8 Other personal experiences in jobs, including some leading to new direction 8 Childhood experiences with natural parks, science museums, star gazing, chemistry sets 12 Family encouragement or inspiration 1 Kindred spirit with scientists/students 7 Influence of books, movies, TV on science e.g., Cosmos/Sagan, biographies of scientists, and
science fiction 1 Influence of specific scientists either through personal experience or admired e.g., Curie, Goodall,
Einstein, Ehrlich, Salk, Feynman 4 The space race, NASA, International Space programs 1 Other scientific discoveries e.g. Human Genome Project, Manhattan Project, Cloning, Gene
Therapy * Environmental issues of the 1970s 4 Practical issues: funding, job availability 13 No answer
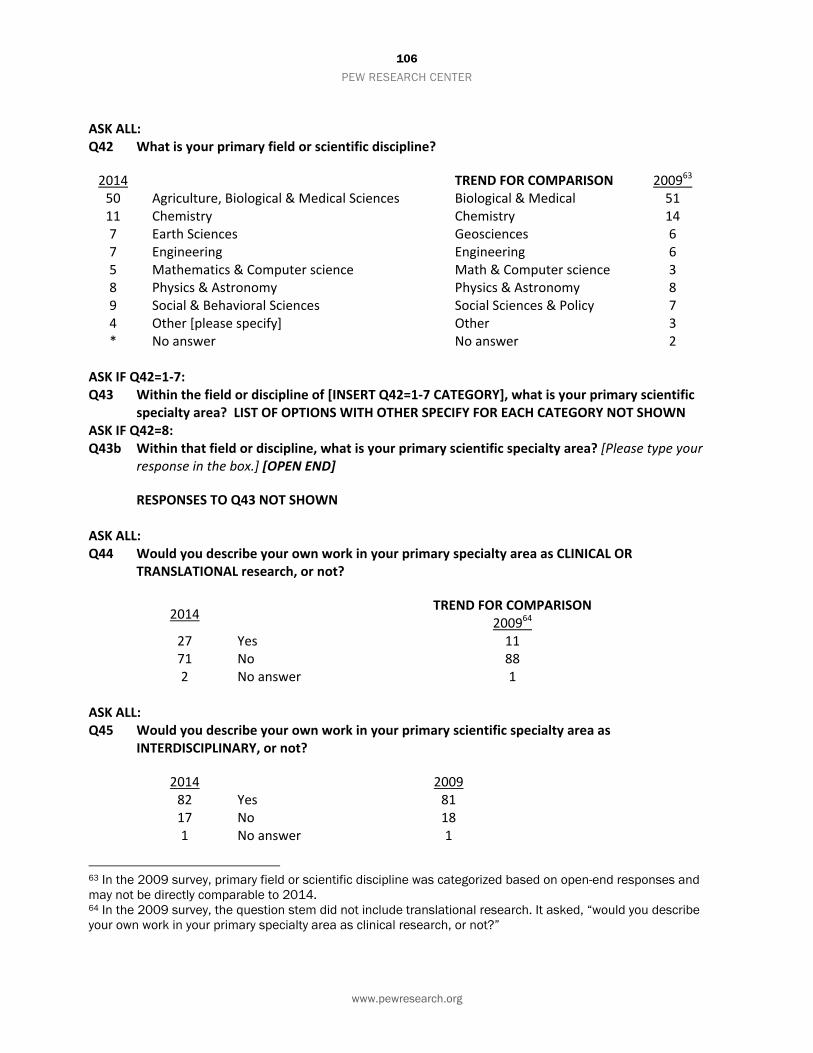
106
PEW RESEARCH CENTER
www.pewresearch.org
ASK ALL: Q42 What is your primary field or scientific discipline?
2014 TREND FOR COMPARISON 200963 50 Agriculture, Biological & Medical Sciences Biological & Medical 51 11 Chemistry Chemistry 14 7 Earth Sciences Geosciences 6 7 Engineering Engineering 6 5 Mathematics & Computer science Math & Computer science 3 8 Physics & Astronomy Physics & Astronomy 8 9 Social & Behavioral Sciences Social Sciences & Policy 7 4 Other [please specify] Other 3 * No answer No answer 2
ASK IF Q42=1‐7: Q43 Within the field or discipline of [INSERT Q42=1‐7 CATEGORY], what is your primary scientific
specialty area? LIST OF OPTIONS WITH OTHER SPECIFY FOR EACH CATEGORY NOT SHOWN ASK IF Q42=8: Q43b Within that field or discipline, what is your primary scientific specialty area? [Please type your
response in the box.] [OPEN END]
RESPONSES TO Q43 NOT SHOWN ASK ALL: Q44 Would you describe your own work in your primary specialty area as CLINICAL OR
TRANSLATIONAL research, or not?
2014 TREND FOR COMPARISON
200964 27 Yes 11 71 No 88 2 No answer 1
ASK ALL: Q45 Would you describe your own work in your primary scientific specialty area as
INTERDISCIPLINARY, or not?
2014 2009 82 Yes 81 17 No 18 1 No answer 1
63 In the 2009 survey, primary field or scientific discipline was categorized based on open-end responses and may not be directly comparable to 2014. 64 In the 2009 survey, the question stem did not include translational research. It asked, “would you describe your own work in your primary specialty area as clinical research, or not?”

www.pewresearch.org
[RANDOMIZE ITEMS A TO E WITH ITEM F ‘NONE OF THESE’ ALWAYS LAST] ASK ALL: Q46 Which, if any, of the following have you done? [Check all that apply.]
Selected
NET Not selected/ No answer/ None of these
a. Completed graduate or postdoctoral training in TWO or more primary fields
30 70
b. Published a research study with a multidisciplinary team 57 43 c. Read a scientific journal article in fields outside of your
primary specialty area in the past 12 months 92 8
d. Taught a course that drew material from TWO or more primary fields
47 53
e. Held a university research position in TWO or more disciplines
20 80
Q47 THROUGH Q51 HELD FOR FUTURE RELEASE NO QUESTIONS 52 THROUGH 54 ASK ALL: Q55 Within the last five years, have you worked on a research project that used animals?
2014 2009 32 Yes 35 67 No 64 1 No answer 1
ASK ALL: Q56 Within the last five years, have you worked on a research project that used human subjects?
2014 2009 29 Yes 24 70 No 74 1 No answer 2
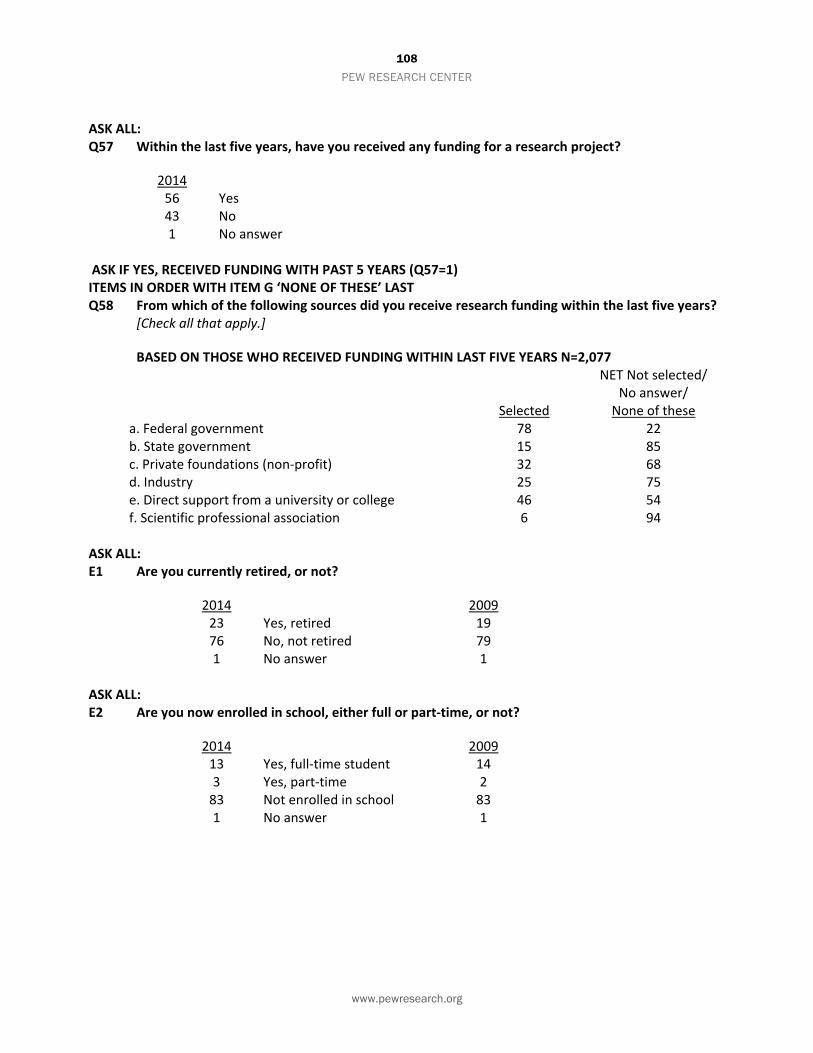
108
PEW RESEARCH CENTER
www.pewresearch.org
ASK ALL: Q57 Within the last five years, have you received any funding for a research project?
2014 56 Yes 43 No 1 No answer
ASK IF YES, RECEIVED FUNDING WITH PAST 5 YEARS (Q57=1) ITEMS IN ORDER WITH ITEM G ‘NONE OF THESE’ LAST Q58 From which of the following sources did you receive research funding within the last five years?
[Check all that apply.]
BASED ON THOSE WHO RECEIVED FUNDING WITHIN LAST FIVE YEARS N=2,077
Selected
NET Not selected/No answer/ None of these
a. Federal government 78 22 b. State government 15 85 c. Private foundations (non‐profit) 32 68 d. Industry 25 75 e. Direct support from a university or college 46 54 f. Scientific professional association 6 94
ASK ALL: E1 Are you currently retired, or not?
2014 2009 23 Yes, retired 19 76 No, not retired 79 1 No answer 1
ASK ALL: E2 Are you now enrolled in school, either full or part‐time, or not?
2014 2009 13 Yes, full‐time student 14 3 Yes, part‐time 2 83 Not enrolled in school 83 1 No answer 1
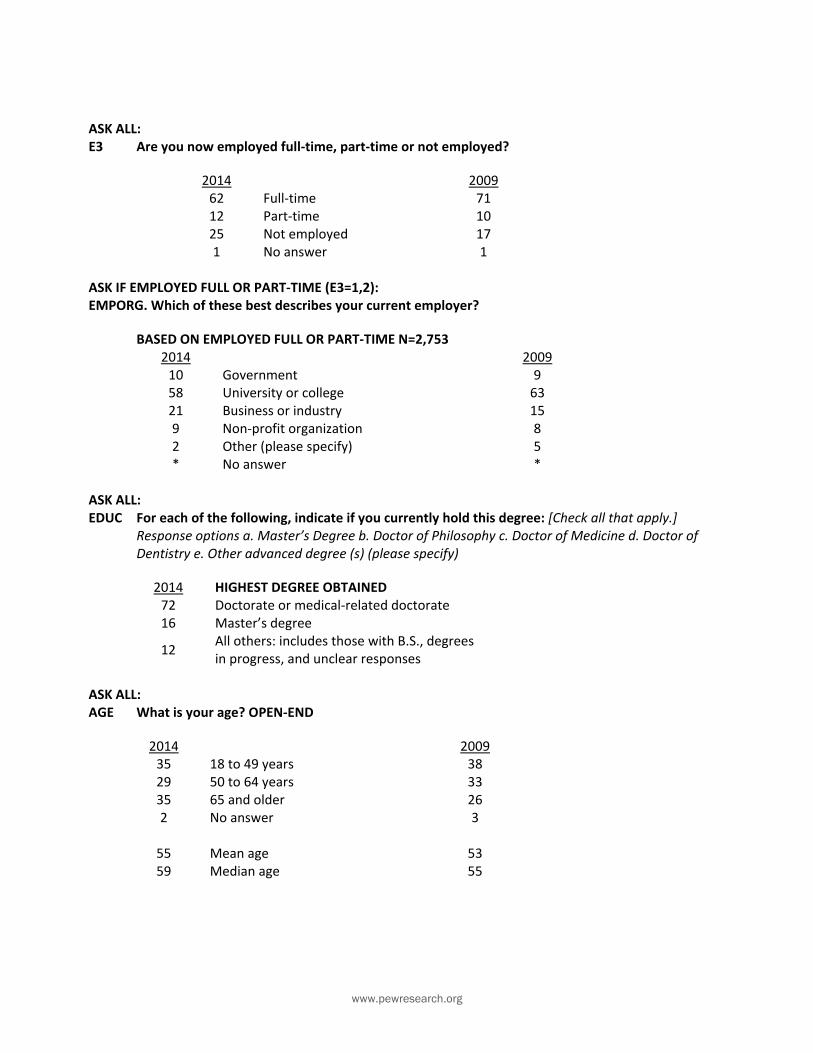
www.pewresearch.org
ASK ALL: E3 Are you now employed full‐time, part‐time or not employed?
2014 2009 62 Full‐time 71 12 Part‐time 10 25 Not employed 17 1 No answer 1
ASK IF EMPLOYED FULL OR PART‐TIME (E3=1,2): EMPORG. Which of these best describes your current employer?
BASED ON EMPLOYED FULL OR PART‐TIME N=2,753 2014 2009 10 Government 9 58 University or college 63 21 Business or industry 15 9 Non‐profit organization 8 2 Other (please specify) 5 * No answer *
ASK ALL: EDUC For each of the following, indicate if you currently hold this degree: [Check all that apply.]
Response options a. Master’s Degree b. Doctor of Philosophy c. Doctor of Medicine d. Doctor of Dentistry e. Other advanced degree (s) (please specify)
2014 HIGHEST DEGREE OBTAINED 72 Doctorate or medical‐related doctorate 16 Master’s degree
12 All others: includes those with B.S., degrees in progress, and unclear responses
ASK ALL: AGE What is your age? OPEN‐END
2014 2009 35 18 to 49 years 38 29 50 to 64 years 33 35 65 and older 26 2 No answer 3
55 Mean age 53 59 Median age 55

110
PEW RESEARCH CENTER
www.pewresearch.org
ASK ALL: RSEX Are you male or female?
2014 2009 71 Male 72 29 Female 26 * No answer 2
ASK ALL: RACE1 What is your race or origin? Select as many as apply.[Check all that apply.]
Response options: White; Hispanic, Latino or Spanish origin; Black or African American; Asian or Asian‐American; American Indian or Alaska Native; Native Hawaiian or Other Pacific Islander; Some other race or origin (please specify)
2014 SUMMARY OF RACE, ETHNICITY 83 White, non‐Hispanic65 1 African American, non‐Hispanic 4 Hispanic 7 Asian or Asian‐American, non‐Hispanic 2 Other, Mixed, non‐Hispanic 3 No answer/Refused
ASK ALL: USBORN. Were you born in the United States, in Puerto Rico or another U.S. territory, or in another
country?
2014 83 Born in the U.S.66 1 Born in Puerto Rico or a U.S. territory 16 Born in another country * No answer
65 For comparison, a similar question on the 2009 survey found 81% of AAAS scientists were non-Hispanic whites. 66 For comparison, a similar question on the 2009 survey found 81% of AAAS scientists were born in the U.S., 18% said they were not born in the U.S. Nine-in-ten were either born in the U.S. or naturalized citizens.
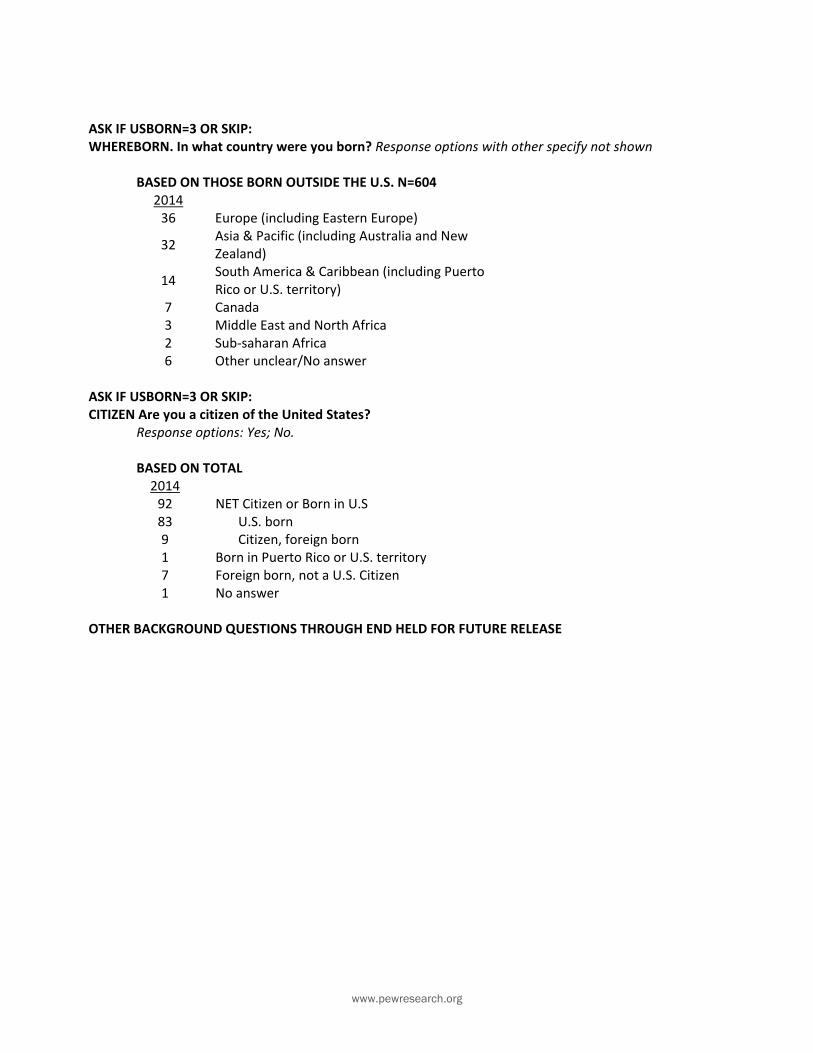
www.pewresearch.org
ASK IF USBORN=3 OR SKIP: WHEREBORN. In what country were you born? Response options with other specify not shown
BASED ON THOSE BORN OUTSIDE THE U.S. N=604
2014 36 Europe (including Eastern Europe)
32 Asia & Pacific (including Australia and New Zealand)
14 South America & Caribbean (including Puerto Rico or U.S. territory)
7 Canada 3 Middle East and North Africa 2 Sub‐saharan Africa 6 Other unclear/No answer
ASK IF USBORN=3 OR SKIP: CITIZEN Are you a citizen of the United States?
Response options: Yes; No.
BASED ON TOTAL 2014 92 NET Citizen or Born in U.S 83 U.S. born 9 Citizen, foreign born 1 Born in Puerto Rico or U.S. territory 7 Foreign born, not a U.S. Citizen 1 No answer
OTHER BACKGROUND QUESTIONS THROUGH END HELD FOR FUTURE RELEASE