ABSTRACT Title of Dissertation: A PETROLOGIC, GEOCHEMICAL ...

Petrologic insights from the spectra of the unbrecciated eucrites: Implications for
Vesta and basaltic asteroids
Rhiannon G. MAYNE1*, Jessica M. SUNSHINE2, Harry Y. MCSWEEN3, Timothy J. MCCOY4,Catherine M. CORRIGAN4, and Allison GALE5
1Department of Geology, Texas Christian University, TCU Box 298830, Fort Worth, Texas 76109, USA2Department of Astronomy, University of Maryland, College Park, Maryland 20742–2421, USA
3Department of Earth and Planetary Sciences, 1412 Circle Drive, University of Tennessee, Knoxville,Tennessee 37996–1410, USA
4Department of Mineral Sciences, Smithsonian Institution, National Museum of Natural History, Washington,
District of Columbia 20560–0119, USA5Department of Earth and Planetary Sciences, Harvard University, 20 Oxford Street, Cambridge, Massachusetts 02138, USA
*Corresponding author. E-mail: [email protected]
(Received 20 July 2009; revision accepted 19 March 2010)
Abstract–We investigate the relationship between the petrology and visible–near infraredspectra of the unbrecciated eucrites and synthetic pyroxene–plagioclase mixtures todetermine how spectra obtained by the Dawn mission could distinguish between severalmodels that have been suggested for the petrogenesis of Vesta’s crust (e.g., partial meltingand magma ocean). Here, we study the spectra of petrologically characterized unbrecciatedeucrites to establish spectral observables, which can be used to yield mineral abundancesand compositions consistent with petrologic observations. No information about plagioclasecould be extracted from the eucrite spectra. In contrast, pyroxene dominates the spectra ofthe eucrites and absorption band modeling provides a good estimate of the relativeproportions of low- and high-Ca pyroxene present. Cr is a compatible element in eucritepyroxene and is enriched in samples from primitive melts. An absorption at 0.6 lm resultingfrom Cr3+ in the pyroxene structure can be used to distinguish these primitive eucrites. Thespectral differences present among the eucrites may allow Dawn to distinguish between thetwo main competing models proposed for the petrogenesis of Vesta (magma ocean andpartial melting). These models predict different crustal structures and scales ofheterogeneity, which can be observed spectrally. The formation of eucrite Allan Hills (ALH)A81001, which is primitive (Cr-rich) and relatively unmetamorphosed, is hard to explain inthe magma ocean model. It could only have been formed as a quench crust. If the magmaocean model is correct, then ALHA81001-like material should be abundant on the surfaceof Vesta and the Vestoids.
INTRODUCTION
The upcoming Dawn mission to asteroids Vesta andCeres has fueled renewed interest into the formation ofdifferentiated asteroids. McCord et al. (1970) were thefirst to note the spectral similarities between thespectrum of Vesta and those of the igneous howardites,eucrites, and diogenites (HEDs), collectively the mostabundant group of achondritic meteorites. While thespectral match between Vesta and certain HEDs was
tantalizing, the proposed link suffered from lack of amechanism to deliver meteorites from Vesta to Earth.The link was markedly strengthened with the discoveryof Vesta-like asteroids (vestoids) bridging the gapbetween it and the 3:1 resonance with Jupiter (Binzeland Xu 1993), which is thought to be a zone fordynamically favorable meteorite delivery to Earth. Ifthis proposed relationship is correct then the HEDsenable us to collect detailed mineralogical, petrological,and geochemical information about Vesta and the
� The Meteoritical Society, 2010.1
Meteoritics & Planetary Science 1–19 (2010)
doi: 10.1111/j.1945-5100.2010.01090.x
Vestoids. This is particularly important, as Vesta is thelargest intact asteroid which appears to havedifferentiated to form a core, mantle, and crust. Inmany ways, Vesta serves as an endmember in ourunderstanding of asteroid differentiation (McCoy et al.2006), but even the origin of this asteroid isincompletely understood (Mittlefehldt and Lindstrom2003). The importance of differentiation and formationof basaltic crusts on asteroids was highlighted by thediscovery of a basaltic surface for asteroid 1459Magnya (Lazzaro et al. 2000; Hardersen et al. 2004)and work by Sunshine et al. (2004b) that identified thepresence of high-calcium pyroxene (HCP) on severalS-type asteroids, indicative of a basaltic crust.
The instrumentation on board the Dawn spacecraftwas designed primarily to provide information about thesurface morphology and composition of the two asteroidsit will visit, with one of the science goals being to providea geologic context for the HEDs (Russell et al. 2004,2006). Mineralogic information will be derived primarilyfrom the visible–infrared (VIR) spectrometer, which hasdetectors both in the visible (0.25–1.0 lm) and infrared(0.95–5.0 lm) wavelengths (Russell et al. 2004, 2006). Tointerpret the resulting spectra, we must understand therelationship between spectra and petrology. This can beachieved with combined petrologic and spectral studies ofthe meteorites believed to originate from Vesta.
This study examines whether the competing modelsfor the formation of Vesta’s crust can be distinguishedthrough spectroscopy. As a first step, we examine therelationship between petrology and spectra and attemptto model the spectra to yield petrologically reasonableestimates of mineral abundances and composition.Sample selection is particularly critical as most eucritesare polymict breccias and their spectra sample a mixtureof lithologies, complicating spectral interpretations. Theunbrecciated eucrites are key as direct comparisons canbe made between the petrologic characteristics andspectral features of the same material.
BACKGROUND
The Petrogenesis of Vesta
The two models originally proposed for theformation of Vesta are those of partial melting (Stolper1977) and fractional crystallization (Mason 1962).Stolper (1977) observed that the noncumulate eucriteshad bulk compositions that clustered around thepseduoperitectic in the silica-olivine-anorthite phasediagram. He suggested, therefore, that they are primaryliquids derived from differing amounts of partial melt ofan olivine-pigeonite-plagioclase-spinel-metal source.Mason (1962), on the other hand, proposed a fractional
crystallization sequence, with the eucrites representingthe residual liquids produced after diogenitecrystallization from a chondritic source. However,neither model can completely explain the formation ofthe HEDs. Partial melting models are unable to matchthe siderophile element abundances of the eucrites(Mittlefehldt and Lindstrom 2003). Partial meltingwould predict a relatively constant W value due to metalbuffering in the source region and a La value that wouldvary depending on the degree of melting (Newsom andDrake 1982; Mittlefehldt and Lindstrom 2003). Theopposite of this is observed in the eucrites as theycontain varying W contents, with relatively constantLa (Palme and Rammensee 1981; Newsom andDrake 1982; Mittlefehldt and Lindstrom 2003). On theother hand, fractional crystallization models cannotreproduce all the geochemical groups found withinthe eucrites (Ruzicka et al. 1997; Mittlefehldt andLindstrom 2003).
More recently, the idea of a magma ocean on Vestahas been suggested (e.g., Righter and Drake 1997;Ruzicka et al. 1997). Ruzicka et al. (1997) suggestedthat the diogenites formed by crystal accumulation in amagma ocean cumulate pile, with the eucrites being theresult of fractional crystallization of the resultingresidual melts. Although such a model can explain themajority of the HEDs, it still evokes fractionalcrystallization and therefore cannot produce thegeochemical groups in the eucrites. Righter and Drake(1997) also envisaged a magma ocean formation modelfor Vesta. Their model differed from that of Ruzickaet al. (1997) as they proposed equilibrium crystallizationin a convecting magma ocean. As convection starts toslow toward the end of crystallization, there is a changein regime as equilibrium crystallization can no longeroccur. Residual magmas are extruded and theseundergo fractional crystallization. Although this modelappears able to explain the geochemical trends within theeucrites, it does not match what is seen in the diogenitesbecause equilibrium crystallization would produce littleto no variations in trace and incompatible elementcompositions within mineral grains (Mittlefehldt andLindstrom 2003), and the orthopyroxene in diogenitesshows large variations (Mittlefehldt 1994). In general, itappears that no single model proposed thus far is capableof producing the geochemical diversity present amongthe basaltic eucrites through a single crystallizationprocess (Mittlefehldt and Lindstrom 2003).
Eucrite Mineral Spectra
The eucrites are basalts and gabbros comprisedprimarily of plagioclase and pyroxenes. Pyroxenedominates the visible–near infrared (VNIR) spectra of
2 R. G. Mayne et al.
eucrites (Gaffey 1976), with distinctive absorptionfeatures near 1 and 2 lm (Adams 1974, 1975; Burns1993). The positions of the absorption bands aredirectly proportional to the cations in the octahedralsites, primarily Ca2+, Mg2+, and Fe2+, although otherless abundant cations such as Ti4+, Cr3+, and Al3+ mayalso have an effect (Adams 1974; Burns 1993). Both 1and 2 lm bands shift to longer wavelengths with anincrease in calcium content (Adams 1974, 1975; Cloutisand Gaffey 1991; Burns 1993). Fe2+ in the higherasymmetric M2 site results in a much stronger 1 lmfeature and is solely responsible for the 2 lm feature(Burns 1993). In low-calcium pyroxenes (LCP) Fe2+
occurs principally in the M2 site. In HCP, Ca2+
preferentially fills the M2, and Fe2+ is concentrated inthe M1 site (Burns 1993). In the relatively symmetricM1 site, Fe2+ causes a weak absorption in the 1 lmregion (more symmetry leads to a weaker absorptionfeature) and a second feature centered at 1.2 lm (Burns1993). Cr3+, which is present in eucrite pyroxenes,results in an absorption feature around 0.6 lm when itis located in the M1 site (Rossman 1980; Burns 1993;Cloutis 2002).
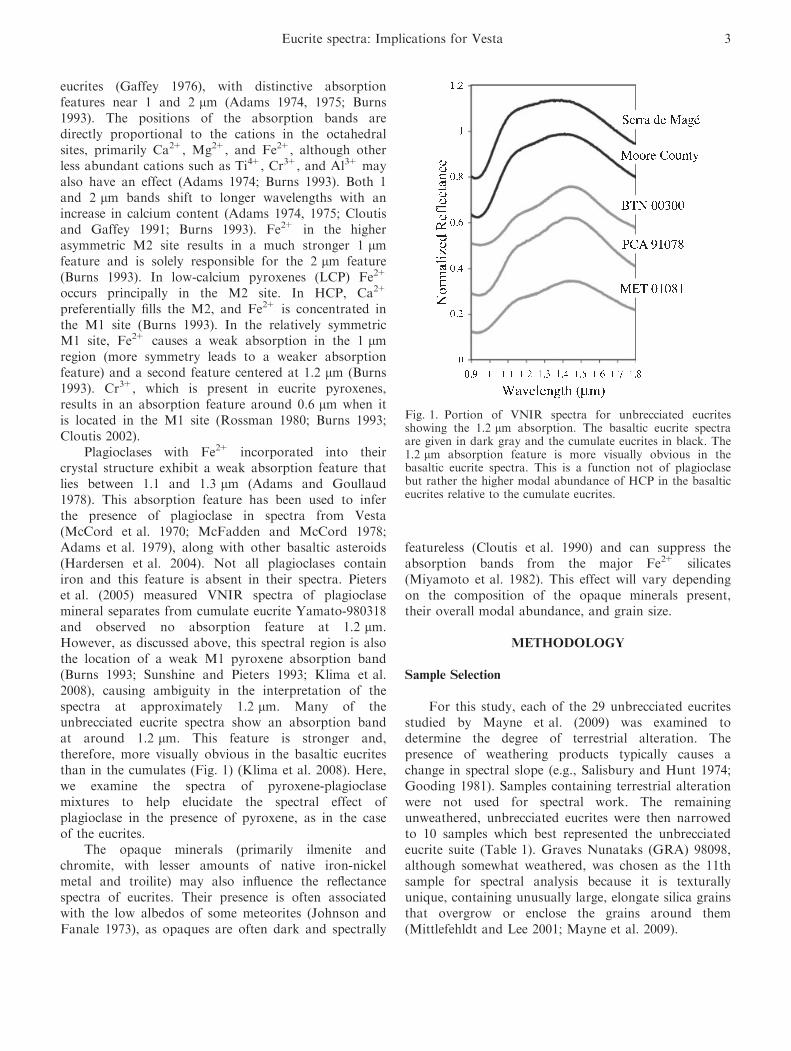
Plagioclases with Fe2+ incorporated into theircrystal structure exhibit a weak absorption feature thatlies between 1.1 and 1.3 lm (Adams and Goullaud1978). This absorption feature has been used to inferthe presence of plagioclase in spectra from Vesta(McCord et al. 1970; McFadden and McCord 1978;Adams et al. 1979), along with other basaltic asteroids(Hardersen et al. 2004). Not all plagioclases containiron and this feature is absent in their spectra. Pieterset al. (2005) measured VNIR spectra of plagioclasemineral separates from cumulate eucrite Yamato-980318and observed no absorption feature at 1.2 lm.However, as discussed above, this spectral region is alsothe location of a weak M1 pyroxene absorption band(Burns 1993; Sunshine and Pieters 1993; Klima et al.2008), causing ambiguity in the interpretation of thespectra at approximately 1.2 lm. Many of theunbrecciated eucrite spectra show an absorption bandat around 1.2 lm. This feature is stronger and,therefore, more visually obvious in the basaltic eucritesthan in the cumulates (Fig. 1) (Klima et al. 2008). Here,we examine the spectra of pyroxene-plagioclasemixtures to help elucidate the spectral effect ofplagioclase in the presence of pyroxene, as in the caseof the eucrites.
The opaque minerals (primarily ilmenite andchromite, with lesser amounts of native iron-nickelmetal and troilite) may also influence the reflectancespectra of eucrites. Their presence is often associatedwith the low albedos of some meteorites (Johnson andFanale 1973), as opaques are often dark and spectrally
featureless (Cloutis et al. 1990) and can suppress theabsorption bands from the major Fe2+ silicates(Miyamoto et al. 1982). This effect will vary dependingon the composition of the opaque minerals present,their overall modal abundance, and grain size.
METHODOLOGY
Sample Selection
For this study, each of the 29 unbrecciated eucritesstudied by Mayne et al. (2009) was examined todetermine the degree of terrestrial alteration. Thepresence of weathering products typically causes achange in spectral slope (e.g., Salisbury and Hunt 1974;Gooding 1981). Samples containing terrestrial alterationwere not used for spectral work. The remainingunweathered, unbrecciated eucrites were then narrowedto 10 samples which best represented the unbrecciatedeucrite suite (Table 1). Graves Nunataks (GRA) 98098,although somewhat weathered, was chosen as the 11thsample for spectral analysis because it is texturallyunique, containing unusually large, elongate silica grainsthat overgrow or enclose the grains around them(Mittlefehldt and Lee 2001; Mayne et al. 2009).
Fig. 1. Portion of VNIR spectra for unbrecciated eucritesshowing the 1.2 lm absorption. The basaltic eucrite spectraare given in dark gray and the cumulate eucrites in black. The1.2 lm absorption feature is more visually obvious in thebasaltic eucrite spectra. This is a function not of plagioclasebut rather the higher modal abundance of HCP in the basalticeucrites relative to the cumulate eucrites.
Eucrite spectra: Implications for Vesta 3
Pyroxene Characterization
Chemical analyses of pyroxene were made using theCameca SX-50 electron microprobe (EMP) at theUniversity of Tennessee, Knoxville. Analytical conditionswere: 15 kV, 30 nA, and 1 lm beam size.
Low-resolution mineral maps of all 29 unbrecciatedeucrites studied by Mayne et al. (2009) and high-resolution elemental X-ray maps of the eucrites studiedhere were collected using the JOEL JSM-840 scanningelectron microscope (SEM) in the Department ofMineral Sciences at the Smithsonian Institution.Elemental X-ray maps of Ca, Si, and Al were combinedto distinguish LCP and HCP and the relativeproportions of each were calculated. This is importantas the LCP:HCP ratio is one of the key features thatcan be estimated from spectra (Sunshine and Pieters1993).
Visible and Near-Infrared Data and Modeling
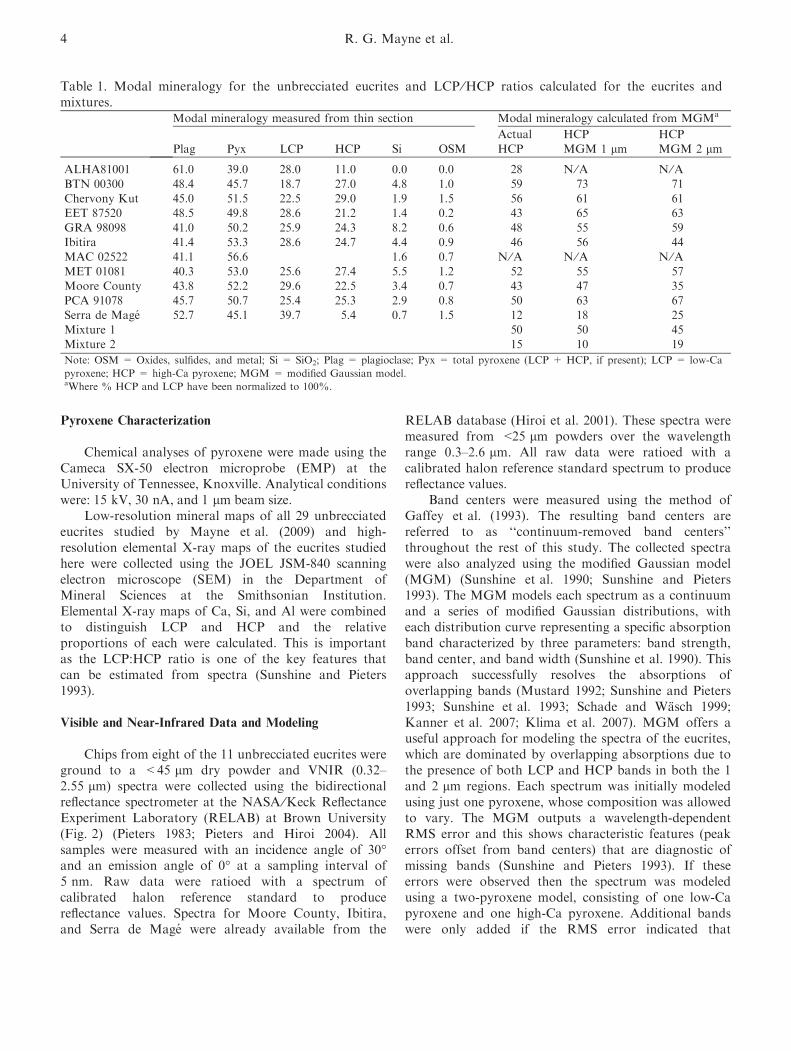
Chips from eight of the 11 unbrecciated eucrites wereground to a <45 lm dry powder and VNIR (0.32–2.55 lm) spectra were collected using the bidirectionalreflectance spectrometer at the NASA ⁄Keck ReflectanceExperiment Laboratory (RELAB) at Brown University(Fig. 2) (Pieters 1983; Pieters and Hiroi 2004). Allsamples were measured with an incidence angle of 30�and an emission angle of 0� at a sampling interval of5 nm. Raw data were ratioed with a spectrum ofcalibrated halon reference standard to producereflectance values. Spectra for Moore County, Ibitira,and Serra de Mage were already available from the
RELAB database (Hiroi et al. 2001). These spectra weremeasured from <25 lm powders over the wavelengthrange 0.3–2.6 lm. All raw data were ratioed with acalibrated halon reference standard spectrum to producereflectance values.
Band centers were measured using the method ofGaffey et al. (1993). The resulting band centers arereferred to as ‘‘continuum-removed band centers’’throughout the rest of this study. The collected spectrawere also analyzed using the modified Gaussian model(MGM) (Sunshine et al. 1990; Sunshine and Pieters1993). The MGM models each spectrum as a continuumand a series of modified Gaussian distributions, witheach distribution curve representing a specific absorptionband characterized by three parameters: band strength,band center, and band width (Sunshine et al. 1990). Thisapproach successfully resolves the absorptions ofoverlapping bands (Mustard 1992; Sunshine and Pieters1993; Sunshine et al. 1993; Schade and Wasch 1999;Kanner et al. 2007; Klima et al. 2007). MGM offers auseful approach for modeling the spectra of the eucrites,which are dominated by overlapping absorptions due tothe presence of both LCP and HCP bands in both the 1and 2 lm regions. Each spectrum was initially modeledusing just one pyroxene, whose composition was allowedto vary. The MGM outputs a wavelength-dependentRMS error and this shows characteristic features (peakerrors offset from band centers) that are diagnostic ofmissing bands (Sunshine and Pieters 1993). If theseerrors were observed then the spectrum was modeledusing a two-pyroxene model, consisting of one low-Capyroxene and one high-Ca pyroxene. Additional bandswere only added if the RMS error indicated that
Table 1. Modal mineralogy for the unbrecciated eucrites and LCP ⁄HCP ratios calculated for the eucrites andmixtures.
Modal mineralogy measured from thin section Modal mineralogy calculated from MGMa
Plag Pyx LCP HCP Si OSM
Actual
HCP
HCP
MGM 1 lmHCP
MGM 2 lm
ALHA81001 61.0 39.0 28.0 11.0 0.0 0.0 28 N ⁄A N ⁄ABTN 00300 48.4 45.7 18.7 27.0 4.8 1.0 59 73 71Chervony Kut 45.0 51.5 22.5 29.0 1.9 1.5 56 61 61EET 87520 48.5 49.8 28.6 21.2 1.4 0.2 43 65 63
GRA 98098 41.0 50.2 25.9 24.3 8.2 0.6 48 55 59Ibitira 41.4 53.3 28.6 24.7 4.4 0.9 46 56 44MAC 02522 41.1 56.6 1.6 0.7 N ⁄A N ⁄A N ⁄AMET 01081 40.3 53.0 25.6 27.4 5.5 1.2 52 55 57Moore County 43.8 52.2 29.6 22.5 3.4 0.7 43 47 35PCA 91078 45.7 50.7 25.4 25.3 2.9 0.8 50 63 67Serra de Mage 52.7 45.1 39.7 5.4 0.7 1.5 12 18 25
Mixture 1 50 50 45Mixture 2 15 10 19
Note: OSM = Oxides, sulfides, and metal; Si = SiO2; Plag = plagioclase; Pyx = total pyroxene (LCP + HCP, if present); LCP = low-Ca
pyroxene; HCP = high-Ca pyroxene; MGM = modified Gaussian model.aWhere % HCP and LCP have been normalized to 100%.
4 R. G. Mayne et al.

they were required. All band centers derived from theMGM are referred to here as ‘‘MGM-derived bandcenters.’’
As part of a broader study of spectral mixtures(McCoy et al. 2007; Corrigan et al. 2007), two sets ofpowder mixtures were produced containing LCP, HCP,and plagioclase, with one set having an LCP:HCP ratioof 50:50, and the other 85:15. For each of the two sets,a sequence of mixtures was prepared with differentproportions of plagioclase, ranging from 10% to 50%for 85:15 and from 10% to 60% for 50:50, increasing inincrements of 10%. The standards used within themixtures were Johnstown hypersthene from theJohnstown meteorite, the terrestrial Kakanui augite,and Lake County plagioclase (Table 2a) (Jarosewichet al. 1979). These samples were chosen as they are partof the Smithsonian Microprobe Standard ReferenceCollection and have been chemically well characterizedand are in common use as mineralogical standards. Theeucrites are predominantly LCP, HCP, and plagioclasemixtures and, therefore, the mixtures lend themselveswell to comparisons with eucrite spectra.
All the standards were ground and sieved to<45 lm powders. Spectra were collected of both themixtures and the individual standards that composethem using the same method as described for theeucrites. Continuum-removed band centers and MGM-derived band centers were calculated as describedabove.
RESULTS
Pyroxene-Plagioclase Mixtures
Individual spectra of the pyroxene and plagioclasestandards used to construct the mixtures were collected(Fig. 3a) (McCoy et al. 2007; Corrigan et al. 2007) andMGM was applied to the two pyroxene spectra (Fig 3;Table 2b). The Lake County plagioclase spectrum shows
Table 2a. Compositional data for endmembers used inthe pyroxene-plagioclase mixtures.
Johnstownhypersthene
Kakanuiaugite
Lake Co.plagioclase
SiO2 54.09 50.73 51.25Al2O3 1.23 8.73 30.91Fe2O3 1.08 0.34
FeO 15.22 5.37 0.15MgO 26.79 16.65 0.14CaO 1.52 15.82 13.64
Na2O <0.05 1.27 3.45K2O <0.05 0.00 0.18TiO2 0.16 0.74 0.05
P2O5
MnO 0.49 0.13 0.01Cr2O3 0.75H2O 0.00 0.04 0.05
Total 100.25 100.56 100.17Wo 3.00 36.01En 73.56 52.72
Fs 23.44 11.27An 80.86Ab 18.51
Or 0.64
Note: The compositional data given here are from Jarosewich et al.
(1979).
Table 2b. MGM results for Johnstown hyperstheneand Kaknui augite.
Johnstown Kaknui
MGM band centers (lm)
Additional M1 0.85 0.771 lm band 0.94 1.001.2 feature 1.14 1.21
2 lm band 1.88 2.26MGM band strengths (log reflectance)Additional M1 )0.48 )0.191 lm band )1.16 )0.841.2 feature )0.15 )0.252 lm band )0.96 )0.45
MGM band widths (lm)Additional M1 0.161 lm band 0.18 0.221.2 feature 0.27 0.34
2 lm band 0.64 0.64
Note: MGM = modified Gaussian model.
Fig. 2. VNIR spectra collected of the unbrecciated eucrites.Variations in band centers, absorption depths, and spectralcontrast can be seen between the spectra.
Eucrite spectra: Implications for Vesta 5

a broad absorption feature between 1.2 and 1.3 lm, dueto Fe2+ in this plagioclase. This feature is not found in allplagioclases and is particularly strong in the Lake Countyspectrum. The spectra of Kakanui augite and Johnstownhypersthene also have a 1.2 lm absorption feature as aresult of Fe2+ in the M1 site. This 1.2 lm feature inpyroxene is only visually apparent in Kakanui augite, butMGM confirms its presence in Johnstown (and mostLCPs) (Fig. 4) (Sunshine and Pieters 1993).
As expected, Kakanui augite (HCP) has band centersat significantly longer wavelengths than Johnstownhypersthene (LCP), due to the greater Ca content inKakanui. Both endmember pyroxene spectra required theaddition of an additional weak approximately 1 lm band(0.87–0.88 lm) in the MGM fit. This band results fromFe2+ in the M1 octahedral site and is predicted by theory(Burns 1993), but often masked by the larger M2 band inthe same wavelength region. This band is much strongerin Johnstown, reflecting its higher iron content (Fs23versus Fs11) (Jarosewich et al. 1979). HCP from theMartian meteorite Nakhla also required the additional1 lm M1 band (at 0.92 lm) to achieve a good fit(Sunshine et al. 2004a). Nakhla pyroxenes are also FeO-rich with predominantly augite cores of iron compositionapproximately Fs26, increasing to Fs44 at the rim (e.g.,Treiman 1990; Harvey and McSween 1992; McSween andTreiman 1998).
The pyroxene–plagioclase mixture spectra were all fitwith the same two-pyroxene model. The startingparameters for this model are given in Table 4a. All themixture spectra are dominated by the two pyroxenes andto the naked eye there is no discernable feature around1.2 lm (Figs. 3b and 3c). Neither set of mixture spectrashows a significant shift in continuum-removed bandcenters with the addition of extra plagioclase (Table 3).Overall reflectance increases with increasing plagioclaseabundance, and the 85:15 mixtures have higherreflectance than the 50:50. The mixtures were all modeledusing MGM (Fig. 5). Each spectrum required twopyroxenes and the addition of the weak approximately1 lm M1 band (0.87–0.88 lm) that results from Fe2+ inthe M1 octahedral site. The need for the extra 1 lm M1band is not unexpected as both the endmemberpyroxenes required it in their individual models.LCP:HCP ratios (the ratio of the relative strength of theLCP band to the relative strength of the HCP band)calculated using MGM can be used to predict the relativeabundance of HCP in each sample (Table 1) (Sunshineet al. 1993). The predicted values of HCP in the mixtureswere within ±5% of the actual values (Table 1).
Despite the addition of up to 60% plagioclase inthe mixtures none of the spectra required an additional
Fig. 3. Reflectance spectra of (a) mineral standards used inthe mixtures, (b) 50:50 LCP:HCP mixtures with increasingplagioclase abundance, (c) 85:15 LCP:HCP mixtures withincreasing plagioclase abundance. The spectrum for LakeCounty plagioclase has an absorption feature at 1.2 lm.However, this absorption cannot be visually distinguished inthe mixture spectra. The mixtures show increased absolutereflectance with increasing plagioclase contents, but no otherchanges in the spectra are observed.
6 R. G. Mayne et al.

band in the 1.2 lm region to account for the presenceof plagioclase. Band widths remain constant withincreasing plagioclase abundance, as do the MGM-derived band centers for the separate LCP and HCPbands and the relative strengths of the two bands(LCP ⁄HCP at 1 and 2 lm) (Table 3). To examinechanges in the 1.2 lm region that may be attributed toplagioclase, we calculated the strength of the 1.2 lmband relative to the combined strengths of the 1.2 and2 lm HCP band (Fig. 6). This should minimize theeffects of pyroxene in this region as with increasingplagioclase you might expect the 1.2 lm feature tostrengthen and the 2 lm HCP band to remain constant.Yet, very minimal change in the calculated ratio wasobserved (Fig. 6). GRA 98098 and Serra de Mage havesimilar LCP:HCP ratios to the mixture sets, 52:48 and
88:12, respectively. When you compare their plagioclasecontent and ratio—Strength (1.2 ⁄ [1.2 + 2 lm HCP])—to those of the mixtures it can be seen that they do notfall on the line that corresponds to their LCP ⁄HCPratios (Fig. 6).
The results here strongly indicate that the 1.2 lmabsorption is not a result of the plagioclase content ofthe sample. Instead, as discussed above, it is due toFe2+ in the M1 site of pyroxene, resulting in a weakabsorption in the 1 lm region and a second featurecentered at 1.2 lm (Burns 1993).
Eucrite Pyroxene Chemistry and Modal Mineralogy
The pyroxenes in the 11 eucrites are plotted withrespect to their quadrilateral compositions and theirminor elements (Fig. 7). A full discussion of pyroxenecompositional differences within the unbrecciatedeucrites can be found in Mayne et al. (2009).
The modal mineralogy for all 11 unbrecciatedeucrites calculated from a combination of previouslyreported SEM mineral maps and the high-resolutionpyroxene mapping is given in Table 1. The LCP:HCPratios for Chervony Kut, Moore County, and Serra deMage were found to be in close agreement with thosecollected by Delaney and Prinz (1984) using EMPanalyses.
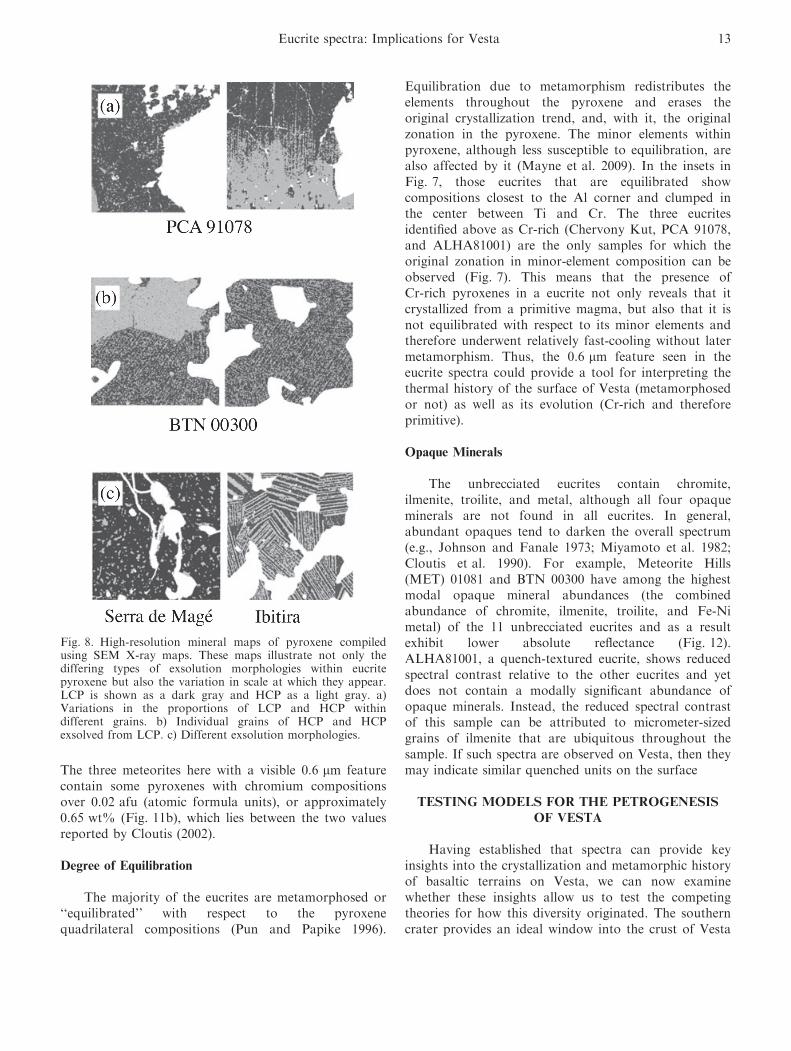
Examples of mapped tiles that show the range ofexsolution textures within eucrite pyroxenes are given inFig. 8. The percentage of HCP varies from grain tograin (Fig. 8a) with HCP as both exsolution within LCPand as individual grains (Fig. 8b). Different exsolutionmorphologies are also present within and betweenindividual meteorites as some contain HCP blebs andothers more elongate lamellae (Fig. 8c). The modalabundance of pyroxene (LCP + HCP) ranges from39.0% to 56.6%. Total HCP varies from 5.4% to29.0% (Table 1) and does not covary with the totalmodal percentage of pyroxene. Overall, the cumulateeucrite Serra de Mage has the lowest percentage ofHCP and this percentage did not vary greatly fromgrain to grain within the thin section. Allan Hills(ALH) A81001 is the only unbrecciated eucrite studiedthat contains phenocrysts. The phenocrysts have anLCP composition (Wo1–2) while the pyroxene in the restof the sample has a higher Ca content (Wo>20) (Mayneet al. 2009). This meteorite has the second lowest modalpercentage of HCP (11%).
Modeling of the Unbrecciated Eucrites
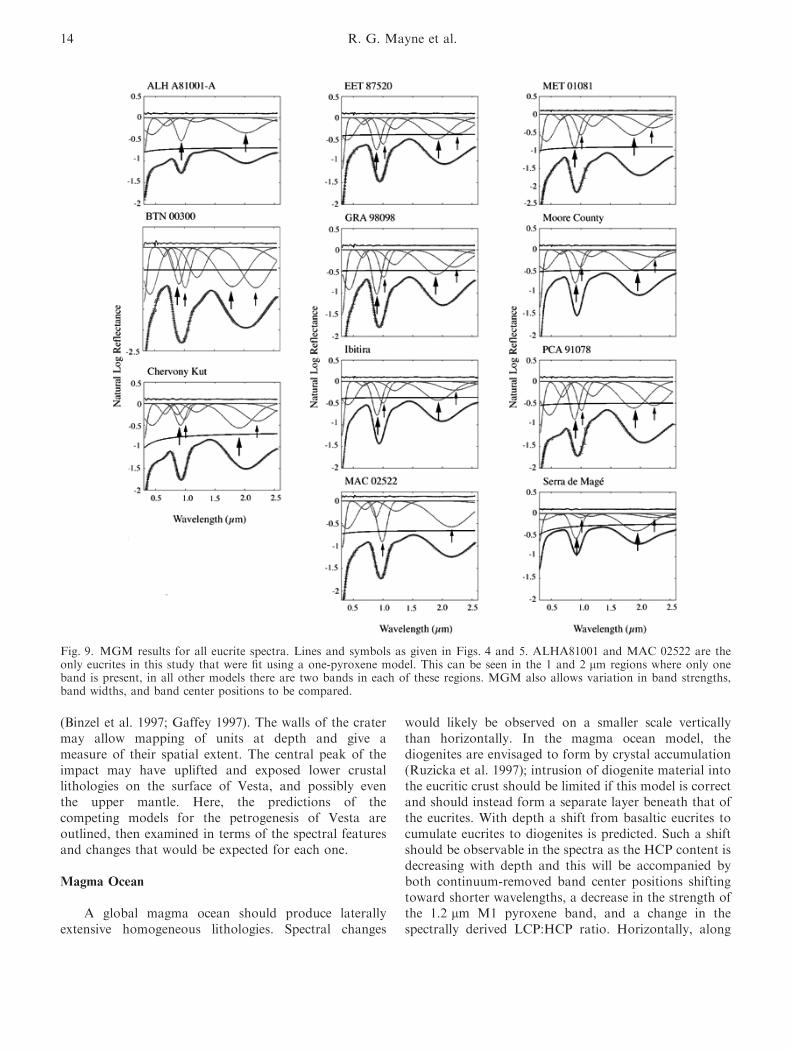
As with the mixtures, initial modeling of all 11eucrite spectra revealed that none required an additionalband for plagioclase (Fig. 9). Six of the unbrecciated
Fig. 4. MGM results for endmember pyroxenes, Johnstownhypersthene, and Kakanui augite. The individual absorptionbands modeled by modified Gaussians are shown in darkgray. The upper black line represents the residual error of themodel; the lower black line represents the continuum. Themeasured spectrum is plotted with gray +s, and the black isthe modeled value. The Kakanui augite can be seen to have adeeper 1.2 lm band absorption than the Johnstownhypersthene. The 1.2 lm feature is often more prominent inHCP-like Kakanui augite as there is more Fe2+ in the M1 site(the cause of the absorption) due to Ca2+ preferentially fillingthe M2 site.
Eucrite spectra: Implications for Vesta 7

eucrites were well-fit using a two-pyroxene, nine-bandmodel (Table 4b). Both Bates Nunataks (BTN) 00300and Chervony Kut required the addition of the weakFe2+ M1 band in the 1 lm region (at 0.83 and 0.87 lm,
respectively) for a good fit, as with the pyroxenemixtures. These two samples have the lowest LCP:HCPratio (Table 1) and it is most likely that it is the high-Ca content of the pyroxenes, which results in the M11 lm band being required in the model for thesesamples. Ca2+ preferentially fills the M2 site, pushingFe2+ into the M1 (Burns 1993), resulting in a strongerM1 band in the 1 lm region. Increased Ca-compositionwithin pyroxene also pushes the band 1 and band 2centers to longer wavelengths (Adams 1974, 1975;Cloutis and Gaffey 1991), which may act to furtherdistinguish the M1 band. MGM-derived band centersand relative strengths for the unbrecciated eucrites aregiven in Table 5. The separate MGM-derived LCP andHCP band centers are compared to the continuum-removed band centers for pyroxenes in Fig. 10.
MacAlpine Hills (MAC) 02522 is the only eucritehere that contains zoned pyroxene. This meteorite waswell-fit by one HCP, with a broad band in the 2 lmregion (0.7 lm compared to <0.6 lm for all othersamples) (Table 5). Anomalously wide bands are acharacteristic of continuous zoning and rapid cooling(Sunshine and Pieters 1993). The additional Fe2+ M11 lm band was again needed (at 0.88 lm) due to the
Table 3. MGM results for plagioclase–pyroxene mixtures.
% Plagioclase
50–50 (LCP–HCP) 85–15 (LCP–HCP)
0 10 20 30 40 50 60 0 10 20 30 40 50
Continuum-removed band centers (lm)
Band 1 0.94 0.94 0.94 0.94 0.94 0.94 0.94 0.92 0.92 0.92 0.92 0.92 0.92Band 2 1.92 1.92 1.92 1.93 1.93 1.92 1.93 1.89 1.89 1.89 1.89 1.89 1.89
MGM band centers (lm)Additional M1 0.87 0.87 0.87 0.87 0.87 0.87 0.88 0.88 0.88 0.88 0.88 0.88 0.88
LCP at 1 0.92 0.92 0.92 0.92 0.92 0.92 0.92 0.92 0.93 0.93 0.92 0.92 0.92HCP at 1 1.02 1.01 1.02 1.02 1.01 1.01 1.01 1.01 1.01 1.01 1.01 1.01 1.011.2 feature 1.16 1.17 1.17 1.17 1.17 1.18 1.18 1.14 1.14 1.14 1.14 1.14 1.14
LCP at 2 1.88 1.88 1.88 1.88 1.88 1.88 1.89 1.87 1.87 1.87 1.87 1.87 1.87HCP at 2 2.32 2.32 2.33 2.32 2.31 2.30 2.30 2.23 2.23 2.23 2.23 2.23 2.23
MGM band strengths (log reflectance)
Additional M1 )0.20 )0.19 )0.16 )0.13 )0.13 )0.10 )0.08 )0.14 )0.20 )0.18 )0.10 )0.08 )0.05LCP at 1 )0.55 )0.52 )0.47 )0.43 )0.39 )0.33 )0.28 )0.85 )0.80 )0.76 )0.69 )0.62 )0.60HCP at 1 )0.27 )0.30 )0.26 )0.22 )0.21 )0.19 )0.17 )0.04 )0.04 )0.04 )0.04 )0.03 )0.031.2 feature )0.13 )0.13 )0.11 )0.10 )0.09 )0.09 )0.07 )0.10 )0.10 )0.09 )0.08 )0.07 )0.06LCP at 2 )0.43 )0.41 )0.37 )0.32 )0.30 )0.26 )0.23 )0.58 )0.58 )0.55 )0.47 )0.42 )0.39HCP at 2 )0.20 )0.20 )0.18 )0.15 )0.14 )0.13 )0.10 )0.10 )0.10 )0.09 )0.08 )0.07 )0.06LCP ⁄HCP at 1 2.03 1.74 1.83 1.91 1.83 1.72 1.71 19.41 18.91 21.60 16.94 18.12 21.47
LCP ⁄HCP at 2 2.20 2.06 1.99 2.07 2.15 2.10 2.32 5.76 5.76 6.37 6.17 6.35 6.94MGM band widths (lm)Additional M1 0.19 0.19 0.19 0.19 0.19 0.19 0.19 0.19 0.19 0.19 0.19 0.19 0.19
LCP at 1 0.19 0.19 0.19 0.19 0.19 0.19 0.19 0.19 0.19 0.19 0.19 0.19 0.19HCP at 1 0.20 0.20 0.20 0.20 0.20 0.20 0.20 0.20 0.20 0.20 0.20 0.20 0.201.2 feature 0.28 0.28 0.28 0.28 0.28 0.28 0.28 0.28 0.28 0.28 0.28 0.28 0.28
LCP at 2 0.54 0.54 0.54 0.54 0.54 0.54 0.54 0.56 0.56 0.56 0.55 0.55 0.55HCP at 2 0.57 0.57 0.57 0.57 0.57 0.57 0.57 0.57 0.57 0.57 0.57 0.57 0.57
Note: MGM = modified Gaussian model; LCP = low-Ca pyroxene; HCP = high-Ca pyroxene.
Table 4a. Model parameters of absorption bands inthe MGM fits for the pyroxene–plagioclase mixtures.Continuum offset
Continuum slope
0.47)1.25E-06
Absorption
Bandcenter(lm)
Bandwidth(lm)
Bandstrength
Band 1 Charge transfer 0.284 0.095 )1.046Band 2 Charge transfer 0.403 0.328 )0.48Band 3 Cr3+ 0.662 0.145 )0.102Band 4 Additional M1 0.878 0.188 )0.156Band 5 LCP 1 lm 0.908 0.188 )0.156Band 6 HCP 1 lm 1.014 0.193 )0.551Band 7 1.2 lm 1.148 0.278 )0.068Band 8 LCP 2 lm 1.832 0.56 )0.137Band 9 HCP 2 lm 2.266 0.563 )0.449Band 10 Adsorbed
water band2.666 0.563 )0.449
Note: MGM = modified Gaussian model; LCP = low-Ca
pyroxene; HCP = high-Ca pyroxene.
8 R. G. Mayne et al.

high iron content of the pyroxenes in MAC 02522(�Fs55). The ALHA81001 spectrum was modeled wellusing a seven-band, one-pyroxene model (Fig. 9),although it actually contains two pyroxenes.ALHA81001 is the finest grained eucrite studied hereand although it contains petrologically distinct LCP andHCP it appears that the spectral model yields onepyroxene with a composition representing an average ofthe two.
Chervony Kut, GRA 98098, Moore County, andSerra de Mage all show a nonrandom residual error inthe 1 lm region of the MGM model. The peak erroroccurs at the same point as the MGM-derived bandcenter. This may indicate band saturation, as errorsarising from missing absorption bands tend to be offsetand much larger (Sunshine and Pieters 1993). However,we are only examining major absorption features hereand it is possible that the addition of extra bands, suchas those that represent spin-forbidden pyroxenefeatures, may also improve upon this error (Burns 1993;Klima et al. 2007).
The MGM-derived LCP band center for BTN00300 in the 2 lm region is at much shorterwavelengths than the other eucrites. There are nocompositional differences between BTN 00300 and theother eucrites that would explain the difference in theMGM-derived band centers. BTN 00300 spectrum hasthe deepest, strongest bands of all the eucrites. BTN00300 also contains the highest HCP content and isrelatively rich in opaque minerals. In this case, spectralmodeling is not consistent with the observed petrology.It is possible that we are not seeing enough of the 2 lmband to achieve a good MGM fit. Site occupancieswithin the pyroxenes can also affect their spectra.
Mossbauer spectroscopy was performed on BTN 00300along with Elephant Moraine (EET) 87520 and MAC02522, which had simpler spectra to model. All threeMossbauer spectra are dominated by Fe2+ in pyroxeneand show approximately the same M1:M2 area ratiosuggesting that they have very similar site occupancies.This indicates that the differences in the BTN 00300spectra are not due to site occupancy and instead aremore likely related to its differing modal mineralogy.
WHAT CAN WE LEARN ABOUT PETROLOGY
FROM SPECTRA?
Asteroidal differentiation and crust formation canbe conceptually understood as the crystallization ofbasaltic to ultramafic melts with the composition of themelt and the extent of crystallization determining theminerals formed, their abundances and compositions.Cooling and metamorphism of the crust have thepotential to further alter the minerals present and theircompositions through diffusion, including exsolution. Inthis section, we examine whether we can accuratelymodel the spectra of petrologically characterizedeucrites studied by Mayne et al. (2009) to predicttheir mineralogy, mineral abundances, and mineralcompositions.
Modal Mineralogy
Low-Calcium to High-Calcium Pyroxene RatioHigh-calcium pyroxene can be used as a tracer of
igneous history as it is one of the key spectrallyobservable minerals formed during differentiation of achondritic asteroid (Sunshine et al. 2004b). We know
Table 4b. Bands required in MGM for each of the unbrecciated eucrite spectra.
AbsorptionALHA81001
BTN00300
ChervonyKut
EET87520
GRA98098 Ibitira
MAC02522
MET01081
MooreCounty
PCA91078
Serrade Mage
Band 1 Charge transfer Y Y Y Y Y Y Y Y Y Y YBand 2 Charge transfer Y Y Y Y Y Y Y Y Y Y Y
Band 3 Cr3+ Y Y Y Y Y Y Y Y Y Y YBand 4 Additional M1 N Y Y N N N Y N N N NBand 5 LCP 1 lm N ⁄A* Y Y Y Y Y N ⁄A* Y Y Y YBand 6 HCP 1 lm N ⁄A* Y Y Y Y Y N ⁄A* Y Y Y Y
Band 7 1.2 lm Y Y Y Y Y Y Y Y Y Y YBand 8 LCP 2 lm N ⁄A* Y Y Y Y Y N ⁄A* Y Y Y YBand 9 HCP 2 lm N ⁄A* Y Y Y Y Y N ⁄A* Y Y Y Y
Band 10 Adsorbedwater band
Y Y Y Y Y Y Y Y Y Y Y
Note: MGM = modified Gaussian model; LCP = low-Ca pyroxene; HCP = high-Ca pyroxene.
N ⁄A* for band numbers 5, 6 and 8, 9 denotes eucrites that only needed one pyroxene in the model and, therefore, did not have separate LCP
and HCP bands in these regions.
All the unbrecciated eucrite spectra require bands at 0.6 lm (Cr3+) and 1.2 lm for good MGM fits. However, these two features are not
observable in the overall spectrum of all of the eucrites (see the Primitive Versus Evolved Magmas section for more details on the 0.6 lmfeature).
Eucrite spectra: Implications for Vesta 9

Fig. 5. MGM results for all mixture spectra. The individual absorption bands modeled by modified Gaussian curves are shownin dark gray. Lines and symbols as given in Fig. 4. A large arrow is used to denote the LCP band in the 1 and 2 lm region, anda small arrow for HCP. The HCP bands are stronger in the 50:50 mixture set because they have a higher abundance of HCP.The strength of the 1.2 lm band does not appear to visually increase with increasing plagioclase content.
10 R. G. Mayne et al.

that the eucrites formed as a result of differentiation oftheir parent body and, as such, they contain relativelyabundant HCP (5.4–29%). MGM has been used in thepast as a tool for modeling the relative proportions ofLCP and HCP from spectra. Sunshine et al. (1993) usedMGM to model the spectra of the dual lithologieswithin Martian meteorite EETA79001 and found thatthey were able to predict the relative modal abundanceof LCP and HCP within ±5–10% of those obtainedfrom petrographic methods. More recently, Kanneret al. (2007) used MGM to model laboratory data forMartian pyroxenes and were also able to estimate therelative modal abundance of LCP and HCP within±10%.
The eucrites represent more complex mixtures ofLCP-HCP-plagioclase-opaque minerals. Calculatedrelative HCP abundances (i.e., where modal abundanceof HCP and LCP have been normalized to 100%) fromMGM (Table 1) are typically higher than thosemeasured petrologically. The predicted relative modalabundances for HCP have a 1r value of ±9% for the2 lm band and ±6% for the 1 lm region (Table 1).The original calibration study by Sunshine and Pieters(1993) did not use pyroxenes with iron compositionsequivalent to the eucrites, which probably accounts forthe larger error in predicting the relative amounts ofLCP and HCP. The fact that the relative abundances ofHCP and LCP in the mixtures, which contain Fe-poor
pyroxenes relative to the eucrites, were estimated towithin ±5% supports this conclusion.
Basaltic versus Cumulate Eucrites
The simplest classification of the eucrites subdividesthem according to their petrology into basaltic andcumulate eucrites. The cumulate eucrites tend to becoarser grained and contain pyroxenes that are Fe-poorrelative to the basaltic eucrites, as well as less HCPoverall. The cumulate eucrites have continuum-removedband centers at shorter wavelengths than their basalticcounterparts (Fig. 10), which are most likely a result oftheir lower modal HCP component. If the FeO-contentof the pyroxenes were driving the continuum-removedcenters to shorter wavelengths, then this same trendwould be expected in the MGM-derived band centerstoo. The MGM-derived band centers for both LCP andHCP for basaltic and cumulate eucrites are very similar(Fig. 10), suggesting that the LCP:HCP ratio is theprincipal spectral variable here.
Primitive versus Evolved Magmas
The above data have shown that eucrite spectra aredominated by pyroxene. As a result, differences betweeneucrite spectra are driven by differences in pyroxenechemistry between samples, which in turn is influencedby the crystallization history of the eucrite studied.Major-element pyroxene chemistry (Mg, Fe, and Ca)can be used to divide the eucrites into basaltic andcumulate groups but little variation is then seen withinthese groupings. Mayne et al. (2009) noted thatvariation is present within the minor elements ofpyroxene (Al, Ti, and Cr) for the basaltic eucrites. Inthe eucrite, basaltic melt chromium behaved as acompatible element in pyroxene, meaning thatpyroxenes crystallized from a primitive melt wereCr-rich. As crystallization of pyroxene proceeded andthe melt evolved, the amount of chromium in the meltdecreased, driving the pyroxene to more Al-richcompositions (Pun and Papike 1996). Once plagioclasereaches the solidus it competes for the Al and pyroxenesbecome richer in Ti (Pun and Papike 1996).
Of the 11 unbrecciated eucrites studied hereALHA81001, Pecora Escarpment (PCA) 91078, andChervony Kut contain pyroxene rich in Cr (Fig. 7) and,therefore, probably crystallized from a primitivemagma. This interpretation is supported byALHA81001 as it not only contains Cr-rich pyroxenes,but is also the most Mg-rich member of the Stannerntrend (a geochemical grouping used to subdivide theeucrites), and, as such, is considered to be the mostprimitive (Mittlefehldt, personal communication). If
Fig. 6. The relative strength of the 1.2 lm band againstplagioclase abundance for the pyroxene–plagioclase mixtures.The strength of 1.2 lm band is normalized to the strength ofthe 2 lm HCP band (1.2 ⁄ [1.2 + 2 HCP]). If the presence ofplagioclase were contributing to the 1.2 lm absorption feature,then we would expect this ratio to increase markedly withincreasing plagioclase content, which is not observed. GRA98098 and Serra de Mage, eucrites of a known composition,have LCP:HCP ratios similar to those of the mixtures: 52:48(GRA 98098) and 88:12 (Serra de Mage). If the amount ofplagioclase was affecting the ratio used in this figure thenGRA 98098 and Serra de Mage should plot on the linesdictated by the mixtures and they do not. For example, Serrade Mage plots with the 50:50 mixtures, despite having acomposition similar to the 85:15.
Eucrite spectra: Implications for Vesta 11

such differences in eucrite pyroxene minor elementchemistry can be detected spectrally, then conclusionscan be drawn regarding the magmatic evolution of thesamples.
Cr3+ in octahedral coordination in the pyroxeneM1 site is known to have absorption feature around0.6 lm (Rossman 1980; Burns 1993; Cloutis 2002). Alleucrites require this band in their MGM modelsirrespective of their pyroxene Cr-content (Table 4b);however, in most cases it is not a visible component oftheir spectra, which indicates a low Cr-content. If this
feature is visible within any of the unbrecciated eucritespectra, indicating pyroxenes with a high Cr-content, itcould be used as a proxy for the relative magmaticevolution of the unbrecciated eucrites. The 0.6 lmregion for the three unbrecciated eucrites that containCr-rich pyroxenes is shown in Fig. 11a and all threespectra show an observable feature at this wavelengththat is not seen within the other eucrite spectra. Cloutis(2002) calculated that the amount of Cr3+ presentwithin a pyroxene for this absorption to appear wasbetween 0.38 and 0.9 wt% (LCP and HCP, respectively).
Fig. 7. Unbrecciated eucrite pyroxene compositions obtained by EMP analysis. Major-element pyroxene compositions (Fe, Mg,and Ca) are shown in the quadrilaterals and minor-element compositions (Ti, Al, and Cr) are overlain in the form of ternaryplots. All ternary compositional diagrams in this article were plotted using the freeware program Dplot (John 2004). Themajority of the eucrites show equilibrated quadrilateral compositions, apart from MAC 02522, which contains one zonedpyroxene. Some eucrites have not undergone metamorphic re-equilibration within the minor elements in pyroxene, e.g.,Chervony Kut.
12 R. G. Mayne et al.
The three meteorites here with a visible 0.6 lm featurecontain some pyroxenes with chromium compositionsover 0.02 afu (atomic formula units), or approximately0.65 wt% (Fig. 11b), which lies between the two valuesreported by Cloutis (2002).
Degree of Equilibration
The majority of the eucrites are metamorphosed or‘‘equilibrated’’ with respect to the pyroxenequadrilateral compositions (Pun and Papike 1996).
Equilibration due to metamorphism redistributes theelements throughout the pyroxene and erases theoriginal crystallization trend, and, with it, the originalzonation in the pyroxene. The minor elements withinpyroxene, although less susceptible to equilibration, arealso affected by it (Mayne et al. 2009). In the insets inFig. 7, those eucrites that are equilibrated showcompositions closest to the Al corner and clumped inthe center between Ti and Cr. The three eucritesidentified above as Cr-rich (Chervony Kut, PCA 91078,and ALHA81001) are the only samples for which theoriginal zonation in minor-element composition can beobserved (Fig. 7). This means that the presence ofCr-rich pyroxenes in a eucrite not only reveals that itcrystallized from a primitive magma, but also that it isnot equilibrated with respect to its minor elements andtherefore underwent relatively fast-cooling without latermetamorphism. Thus, the 0.6 lm feature seen in theeucrite spectra could provide a tool for interpreting thethermal history of the surface of Vesta (metamorphosedor not) as well as its evolution (Cr-rich and thereforeprimitive).
Opaque Minerals
The unbrecciated eucrites contain chromite,ilmenite, troilite, and metal, although all four opaqueminerals are not found in all eucrites. In general,abundant opaques tend to darken the overall spectrum(e.g., Johnson and Fanale 1973; Miyamoto et al. 1982;Cloutis et al. 1990). For example, Meteorite Hills(MET) 01081 and BTN 00300 have among the highestmodal opaque mineral abundances (the combinedabundance of chromite, ilmenite, troilite, and Fe-Nimetal) of the 11 unbrecciated eucrites and as a resultexhibit lower absolute reflectance (Fig. 12).ALHA81001, a quench-textured eucrite, shows reducedspectral contrast relative to the other eucrites and yetdoes not contain a modally significant abundance ofopaque minerals. Instead, the reduced spectral contrastof this sample can be attributed to micrometer-sizedgrains of ilmenite that are ubiquitous throughout thesample. If such spectra are observed on Vesta, then theymay indicate similar quenched units on the surface
TESTING MODELS FOR THE PETROGENESIS
OF VESTA
Having established that spectra can provide keyinsights into the crystallization and metamorphic historyof basaltic terrains on Vesta, we can now examinewhether these insights allow us to test the competingtheories for how this diversity originated. The southerncrater provides an ideal window into the crust of Vesta
Fig. 8. High-resolution mineral maps of pyroxene compiledusing SEM X-ray maps. These maps illustrate not only thediffering types of exsolution morphologies within eucritepyroxene but also the variation in scale at which they appear.LCP is shown as a dark gray and HCP as a light gray. a)Variations in the proportions of LCP and HCP withindifferent grains. b) Individual grains of HCP and HCPexsolved from LCP. c) Different exsolution morphologies.
Eucrite spectra: Implications for Vesta 13
(Binzel et al. 1997; Gaffey 1997). The walls of the cratermay allow mapping of units at depth and give ameasure of their spatial extent. The central peak of theimpact may have uplifted and exposed lower crustallithologies on the surface of Vesta, and possibly eventhe upper mantle. Here, the predictions of thecompeting models for the petrogenesis of Vesta areoutlined, then examined in terms of the spectral featuresand changes that would be expected for each one.
Magma Ocean
A global magma ocean should produce laterallyextensive homogeneous lithologies. Spectral changes
would likely be observed on a smaller scale verticallythan horizontally. In the magma ocean model, thediogenites are envisaged to form by crystal accumulation(Ruzicka et al. 1997); intrusion of diogenite material intothe eucritic crust should be limited if this model is correctand should instead form a separate layer beneath that ofthe eucrites. With depth a shift from basaltic eucrites tocumulate eucrites to diogenites is predicted. Such a shiftshould be observable in the spectra as the HCP content isdecreasing with depth and this will be accompanied byboth continuum-removed band center positions shiftingtoward shorter wavelengths, a decrease in the strength ofthe 1.2 lm M1 pyroxene band, and a change in thespectrally derived LCP:HCP ratio. Horizontally, along
Fig. 9. MGM results for all eucrite spectra. Lines and symbols as given in Figs. 4 and 5. ALHA81001 and MAC 02522 are theonly eucrites in this study that were fit using a one-pyroxene model. This can be seen in the 1 and 2 lm regions where only oneband is present, in all other models there are two bands in each of these regions. MGM also allows variation in band strengths,band widths, and band center positions to be compared.
14 R. G. Mayne et al.
the crater walls it may then be possible to map the spatialextent of each spectrally distinct unit.
Partial Melting and Serial Magmatism
While the widespread metamorphism seen in theeucrites supports the serial magmatism theory putforward by Yamaguchi et al. (1996), the history ofVesta’s crust is, in reality, far more complex (Mayneet al. 2009). Partial melting would produce a layeredcrust on a much smaller scale relative to the magmaocean model. Different eucrite lava flows would bestacked up upon one another, producing lithologic, andtherefore spectral, variation on a small scale bothvertically and horizontally.
In this model, the cumulate eucrites are formed aslater intrusions into the basaltic crust. This would bebest tested by using MGM predicted LCP:HCP ratios,the depth of the 1.2 lm M1 pyroxene band, and theposition of continuum-removed band centers as all ofthese are affected by changing HCP content. Cumulateeucrites (lower HCP content, shallower 1.2 lm bandthat is often not visually apparent, shorter continuum-removed band centers) would be seen to crosscut
different basaltic eucrite layers with depth but be on asmaller lithologic scale horizontally.
Assessing Current Models for Vesta’s Formation Using
ALHA81001
ALHA81001 is a quench-textured eucrite thatcooled quickly on its parent body. It contains Cr-richpyroxenes, suggesting that it crystallized from aprimitive magma. The fact that ALHA81001 retainssome of the original compositional crystallization trendswithin its pyroxenes indicates that it did not experiencethe same high level of metamorphism so commonwithin the eucrites as a whole. Any model put forwardfor the petrogenesis of Vesta must also be able toexplain all the features seen within ALHA81001.
In a partial melting model, the suggested globalmetamorphism of the eucrites is explained by successivelava flows on the surface insulating those flows beneath,resulting in a slower cooling rate (e.g., Takeda andGraham 1991; Yamaguchi et al. 1996). The fact thatALHA81001 does not appear to have been affected bythis is best explained by its formation late in Vesta’shistory, as one of the last melts to crystallize. Its
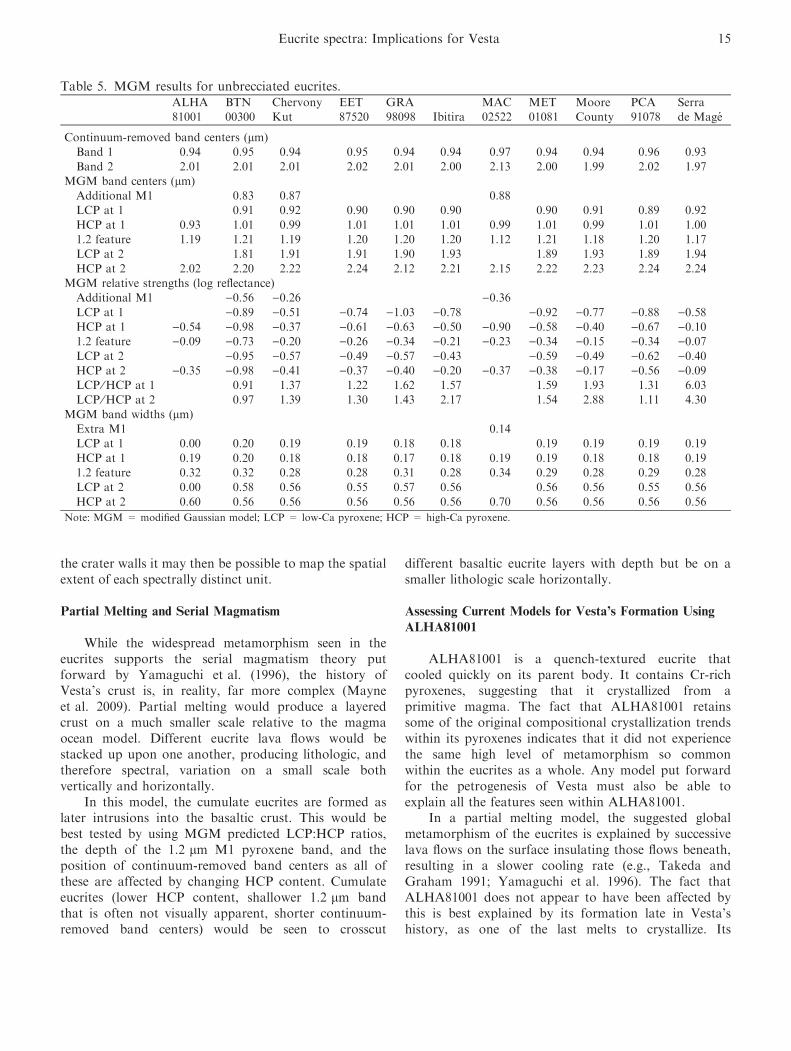
Table 5. MGM results for unbrecciated eucrites.ALHA81001
BTN00300
ChervonyKut
EET87520
GRA98098 Ibitira
MAC02522
MET01081
MooreCounty
PCA91078
Serrade Mage
Continuum-removed band centers (lm)Band 1 0.94 0.95 0.94 0.95 0.94 0.94 0.97 0.94 0.94 0.96 0.93
Band 2 2.01 2.01 2.01 2.02 2.01 2.00 2.13 2.00 1.99 2.02 1.97MGM band centers (lm)Additional M1 0.83 0.87 0.88LCP at 1 0.91 0.92 0.90 0.90 0.90 0.90 0.91 0.89 0.92
HCP at 1 0.93 1.01 0.99 1.01 1.01 1.01 0.99 1.01 0.99 1.01 1.001.2 feature 1.19 1.21 1.19 1.20 1.20 1.20 1.12 1.21 1.18 1.20 1.17LCP at 2 1.81 1.91 1.91 1.90 1.93 1.89 1.93 1.89 1.94
HCP at 2 2.02 2.20 2.22 2.24 2.12 2.21 2.15 2.22 2.23 2.24 2.24MGM relative strengths (log reflectance)Additional M1 )0.56 )0.26 )0.36LCP at 1 )0.89 )0.51 )0.74 )1.03 )0.78 )0.92 )0.77 )0.88 )0.58HCP at 1 )0.54 )0.98 )0.37 )0.61 )0.63 )0.50 )0.90 )0.58 )0.40 )0.67 )0.101.2 feature )0.09 )0.73 )0.20 )0.26 )0.34 )0.21 )0.23 )0.34 )0.15 )0.34 )0.07LCP at 2 )0.95 )0.57 )0.49 )0.57 )0.43 )0.59 )0.49 )0.62 )0.40HCP at 2 )0.35 )0.98 )0.41 )0.37 )0.40 )0.20 )0.37 )0.38 )0.17 )0.56 )0.09LCP ⁄HCP at 1 0.91 1.37 1.22 1.62 1.57 1.59 1.93 1.31 6.03LCP ⁄HCP at 2 0.97 1.39 1.30 1.43 2.17 1.54 2.88 1.11 4.30
MGM band widths (lm)Extra M1 0.14LCP at 1 0.00 0.20 0.19 0.19 0.18 0.18 0.19 0.19 0.19 0.19
HCP at 1 0.19 0.20 0.18 0.18 0.17 0.18 0.19 0.19 0.18 0.18 0.191.2 feature 0.32 0.32 0.28 0.28 0.31 0.28 0.34 0.29 0.28 0.29 0.28LCP at 2 0.00 0.58 0.56 0.55 0.57 0.56 0.56 0.56 0.55 0.56
HCP at 2 0.60 0.56 0.56 0.56 0.56 0.56 0.70 0.56 0.56 0.56 0.56
Note: MGM = modified Gaussian model; LCP = low-Ca pyroxene; HCP = high-Ca pyroxene.
Eucrite spectra: Implications for Vesta 15

quenched nature means that it probably formed eitheron the surface or as the quench margin on an ascendinglate-stage partial melt from primitive mantle materialthat intruded into cold country rock. Recent work byBarrat et al. (2007) suggests such a late-stage partialmelt origin for the Stannern trend eucrites.
It is much more difficult to envisage the formationof ALHA81001 in a magma ocean environment.Pyroxenes rich in compatibles, such as Cr, would haveto crystallize out of the magma ocean early. This wouldexplain the composition of ALHA81001, but it seemsimpossible for such early formed samples to then avoidbeing highly metamorphosed during the following stagesof the magma ocean’s history. One possibleenvironment where a primitive (early formed), yetunmetamorphosed eucrite could form would be thequench crust, or convective lid of the magma ocean.This would mean that the entire surface of Vesta wasinitially covered with ALHA81001-like material,whereas the contrasting partial melting model predictsthis only on a small scale. The paucity of eucritessimilar to ALHA81001 could be used to argue for thelatter model, but the true test is to look at Vesta itself.
We have shown here that rapidly cooled units withCr-rich pyroxenes like ALHA81001 can be identifiedspectrally on the surface of Vesta by the presence of avisible 0.6 lm feature and their reduced spectralcontrast, a result of widespread fine-grained opaqueminerals formed during quenching. The extent to whicha visible 0.6 lm feature is observed over Vesta’s surfacewill be key to deciphering its formation history. BeforeDawn arrives at Vesta this idea is being tested on theVestoids, a group of asteroids believed to originate fromVesta (Mayne et al., in preparation). If a visible 0.6 lmfeature is common in Vestoid spectra, then it is
Fig. 10. Eucrite continuum-removed and MGM-derived bandcenters. The unbrecciated eucrite band centers divided intocumulate (filled symbols) and basaltic (open symbols).Continuum-removed values are shown as squares and trianglesrepresent MGM-derived band centers. The cumulate eucriteshave continuum-removed band centers at the shortestwavelengths due to their lower modal abundance of HCP. TheMGM-derived band centers for the eucrite all cluster together,reflecting the similar major-element chemistry of both LCPand HCP within these meteorites. The continuum-removedband centers for MAC 02522 lie at much longer wavelengthsthan the other eucrites. This is most likely due to the high ironcontent of the pyroxene in MAC 02522 relative to the averageof the other eucrite pyroxenes. MGM requires only one-pyroxene model to fit MAC 02522 and allows us to identify itas a zoned pyroxene from the anomalously wide bands used inthe model (Sunshine and Pieters 1993). ALHA81001 also onlyrequired a one-pyroxene model and, therefore, does not haveseparate LCP and HCP MGM-derived band centers.
Fig. 11. Presence of the 0.6 lm Cr3+ feature in the spectra ofthe unbrecciated eucrites. a) Portion of VNIR spectra for theunbrecciated eucrites showing the 0.6 lm absorption. TheSerra de Mage spectrum is illustrated as an example of aspectrum with no absorption visually present. b) Plot of Caversus Cr in atomic formula units for the pyroxenes in theunbrecciated eucrites. Ca is used here for illustrative purposesand not to indicate some relationship between Cr and Cacontent. The detection limit of Cr2O3 on the electronmicroprobe is around 0.03 wt%, which translates to 0.001–0.002 afu. All samples with a Cr-content >0.02 afu in theirpyroxenes exhibit a visually obvious 0.6 lm absorptionfeature.
16 R. G. Mayne et al.

reasonable to assume Cr-rich pyroxenes are abundanton the surface of Vesta itself.
CONCLUSIONS
In this study, we have investigated the relationshipbetween the petrology and spectra of the unbrecciatedeucrites, to determine how spectroscopy can be used asa tool to understand the petrogenesis of Vesta.
• The pyroxene chemistry of the eucrites dominatestheir spectra.
• A good estimate of the pyroxene modal mineralogyof the eucrites can be obtained from their spectra(i.e., LCP:HCP). However, no informationregarding the abundance of plagioclase can bededuced from these spectra.
• A Cr-feature is visible at 0.6 lm. Cr-rich pyroxenescrystallized from primitive magmas, which mayallow mapping of the evolution of units on thesurface of Vesta.
• Most of the eucrites are metamorphosed and, as aresult, have equilibrated mineral compositions.Those samples that preserve their Cr-rich pyroxenesdid not experience the same high level ofmetamorphism and their identification on Vesta
would aid in interpreting the thermal history of thesurface.
• The models proposed for the formation of Vestapredict different crustal structures and lithologicvariety on different scales. The data presented herehave shown that these predictions can be testedusing spectroscopy.
• The eucrite ALHA81001 is a Cr-rich, quench-textured, unmetamorphosed eucrite, which suggeststhat it crystallized close to, or on the surface of itsparent body, but it was not affected by themetamorphism that affected the majority of theeucrites. This limits the possible environments inwhich ALHA81001 could have formed. It is hard toenvisage the formation of ALHA81001 in themagma ocean model. ALHA81001 would have torepresent the quench crust on the surface and itwould be an abundant unit on the surface of Vesta.Conversely, if the partial melting model is correctthen ALHA81001 could represent a late-stageprimitive melt. Therefore, the geologic context ofunits akin to ALHA81001 on the surface of Vestamay prove key in determining which model best fitsthe observations of Dawn at Vesta.
Acknowledgments—This work was supported by PGGgrant NNX06AH69G to J. M. S. and NASACosmochemistry grant NNG06GG36G and UCLAsubcontract 2090-S-JB694 for Dawn to H. Y. M. Allmeteorite spectra were collected at Brown University’sKECK ⁄NASA Reflectance Experiment Laboratory(RELAB). Thanks go to M. Darby Dyar for thecollection of Mossbauer spectra.
Editorial Handling—Dr. Beth Ellen Clark
REFERENCES
Adams J. B. 1974. Uniqueness of visible and near-infrareddiffuse reflectance spectra of pyroxenes and other rock-forming minerals. Journal of Geophysical Research79:4829–4836.
Adams J. B. 1975. Interpretation of visible and near-infrareddiffuse reflectance spectra of pyroxenes and other rock-forming minerals. In Infrared and Raman spectroscopy oflunar and terrestrial materials, edited by Karr C. Jr. NewYork: Academic Press. pp. 91–116.
Adams J. B. and Goullaud L. H. 1978. Plagioclase feldspars:Visible and near infrared diffuse reflectance spectra asapplied to remote sensing. Proceedings, 9th Lunar andPlanetary Science Conference. pp. 2901–2909.
Adams J. B., Horz F., and Gibbons R. V. 1979. Effects ofshock-loading on the reflectance spectra of plagioclase,pyroxene, and glass (abstract). 30th Lunar and PlanetaryScience Conference. pp. 1–3.
Barrat J. A., Yamaguchi A., Greenwood R. C., Bohn M.,Cotton J., Benoit M., and Franchi I. A. 2007. TheStannern trend eucrites: Contamination of main group
Fig. 12. VNIR reflectance spectra of six unbrecciated eucritesshowing the difference in reflectance values and spectralcontrast between samples. BTN 00300, MET 01081, andALHA81001 (dotted lines) can be seen to have a lowerspectral contrast than the other eucrites shown. BTN 00300and MET 01081 are rich in opaque phases (chromite, ilmenite,sulfides, and metal), which are known to darken the overallspectrum (Johnson and Fanale 1973). However, the reducedcontrast seen in ALHA81001 does not reflect a high modalabundance of opaques, instead this eucrite contains very fine-grained ilmenite scattered throughout the sample. This is aresult of its fast-cooling rate.
Eucrite spectra: Implications for Vesta 17

eucritic magmas by crustal partial melts. Geochimica etCosmochimica Acta 71:4108–4124.
Binzel R. P. and Xu S. 1993. Chips off asteroid 4 Vesta:Evidence for the parent body of basaltic achondritemeteorites. Science 260:186–191.
Binzel R. P., Gaffey M. J., Thomas P. T., Zellner B. H.,Storrs A. D., and Wells E. N. 1997. Geologic mapping ofVesta from 1994 Hubble Space Telescope images. Icarus128:95–103.
Burns R. G. 1993. Mineralogical applications of crystal fieldtheory, 2nd ed. New York: Cambridge University Press.551 p.
Cloutis E. A. 2002. Pyroxene reflectance spectra: Minorabsorption bands and effects of elemental substitutions.Journal of Geophysical Research 107:E6, doi:10.1029/2001/JE001590.
Cloutis E. A. and Gaffey M. J. 1991. Pyroxene spectroscopyrevisited: Spectral-compositional correlations andrelationship to geothermometry. Journal of GeophysicalResearch 96:22,809–22,826.
Cloutis E. A., Gaffey M. J., Smith D. G. W., and Lambert R.St. J. 1990. Reflectance spectra of mafic silicate-opaqueassemblages with applications to meteorite spectra. Icarus84:315–333.
Corrigan C. M., McCoy T. J., Sunshine J. M., Bus S. J., andGale A. 2007. Does spectroscopy provide evidence forwidespread partial melting of asteroids? I: Mafic mineralabundances (abstract #1463). 37th Lunar and PlanetaryScience Conference. CD-ROM.
Delaney J. S. and Prinz M. 1984. The polymict eucrites.Journal of Geophysical Research 89:C251–C288.
Gaffey M. J. 1976. Spectral reflectance characteristics of themeteorite classes. Journal of Geophysical Research 81:905–920.
Gaffey M. J. 1997. Surface lithologic heterogeneity of asteroid4 Vesta. Icarus 127:130–157.
Gaffey M. J., Bell J. F., Brown R. H., Burbine T. H., Piatek J. L.,Reed K. L., and Chaky D. A. 1993. Mineralogic variationswithin the S-type asteroid class. Icarus 106:573–602.
Gooding J. L. 1981. Mineralogic changes during terrestrialweathering of Antarctic chondrites. Proceedings, 12thLunar and Planetary Science Conference. pp. 1105–1122.
Hardersen P. S., Gaffey M. J., and Abell P. A. 2004.Mineralogy of asteroid 1459 Magnya and implications forits origin. Icarus 167:170–177.
Harvey R. P. and McSween H. Y. 1992. The petrogenesis ofthe nakhlites: Evidence from cumulate mineral zoning.Geochimica et Cosmochimica Acta 56:1655–1663.
Hiroi T., Pieters C. M., Vilas F., Sasaki S., Hamabe Y.,and Kurahashi E. 2001. The mystery of 506.5 nm featureof reflectance spectra of Vesta and Vestoids: Evidencefor space weathering? Earth, Planets and Space 53:1071–1075.
Jarosewich E., Nelen J., and Norberg J. 1979. Electronmicroprobe reference samples for mineral analysis.Smithsonian Institution Contributions to the Earth Sciences22:68–72.
John C. M. 2004. Plotting and analyzing data trends internary diagrams made easy. EOS Transactions AmericanGeophysical Union 85(16), doi:10.1029/2004EO160004.
Johnson T. V. and Fanale F. P. 1973. Optical properties ofcarbonaceous chondrites and their relationship toasteroids. Journal of Geophysical Research 78:8507–8518.
Kanner L. C., Mustard J. F., and Gendrin A. 2007. Assessingthe limits of the Modified Gaussian Modal for remotespectroscopic studies of pyroxenes on Mars. Icarus187:442–456.
Klima R. L., Pieters C. M., and Dyar M. D. 2007.Spectroscopy of synthetic Mg-Fe pyroxenes I: Spin-allowed and spin-forbidden crystal field bands in thevisible and near-infrared. Meteoritics & Planetary Science42:235–253.
Klima R. L., Pieters C. M., and Dyar M. D. 2008.Characterization of the 1.2 lm M1 pyroxene band:Extracting cooling history from near-IR spectra ofpyroxenes and pyroxene-dominated rocks. Meteoritics &Planetary Science 43:1591–1604.
Lazzaro D., Michtchenko T., Carvano J. M., Binzel R. P.,Bus S. J., Burbine T. H., Mothe-Diniz T., Florczak M.,Angeli C. A., and Harris A. W. 2000. Discovery of abasaltic asteroid in the outer main belt. Science 288:2033–2035.
Mason B. 1962. Meteorites. New York: J. Wiley and Sons.Mayne R. G., McSween H. Y., McCoy T. J., and Gale A.
2009. Petrology of the unbrecciated eucrites. Geochimica etCosmochimica Acta 73:794–819.
McCord T. B., Adams J. B., and Johnson T. V. 1970.Asteroid Vesta: Spectral reflectivity and compositionalimplications. Science 168:1445–1447.
McCoy T. J., Corrigan C. M., Sunshine J. M., Bus S. J., andGale A. 2007. Does spectroscopy provide evidence forwidespread partial melting of asteroids? II: Pyroxenecompositions (abstract #1631). 37th Lunar and PlanetaryScience Conference. CD-ROM.
McCoy T. J., Mittlefehldt D. W., and Wilson L. 2006.Asteroid differentiation. In Meteorites and the early solarsystem II, edited by Lauretta D. S. and McSween H. Y.Jr. Tucson, AZ: The University of Arizona Press. pp. 733–746.
McFadden L. A. and McCord M. J. 1978. Prospecting forplagioclase on Vesta. Bulletin of the American AstronomicalSociety 10:601.
McSween H. Y. and Treiman A. H. 1998. Martian meteorites.In Planetary materials, edited by Papike J. J. Reviews inMineralogy, vol. 36. Washington, D.C.: MineralogicalSociety of America. pp. 6:1–53.
Mittlefehldt D. W. 1994. The genesis of diogenites and HEDparent body petrogenesis. Geochimica et CosmochimicaActa 58:1537–1552.
Mittlefehldt D. W. and Lee M. T. 2001. Petrology andgeochemistry of unusual eucrite GRA 98098 (abstract).Meteoritics & Planetary Science 36:A136.
Mittlefehldt D. W. and Lindstrom M. M. 2003. Geochemistryof basaltic eucrites, and Hf and Ta as petrogeneticindicators for altered Antarctic eucrites. Geochimica etCosmochimica Acta 67:1911–1935.
Miyamoto M., Mito A., and Takano Y. 1982. An attempt toreduce the effects of black materials from the spectralreflectance of meteorites and asteroids. Memoirs of theNational Institute of Polar Research Special Issue 20:345–361.
Mustard J. F. 1992. Chemical analysis of actinolite fromreflectance spectra. American Mineralogist 77:345–358.
Palme H. and Rammensee W. 1981. The significance of W inplanetary differentiation processes: Evidence from newdata on eucrites. Proceedings, 12th Lunar and PlanetaryScience Conference. pp. 949–964.
18 R. G. Mayne et al.

Pieters C. M. 1983. Strength of mineral absorption features inthe transmitted component of near-infrared reflected light:First results from RELAB. Journal of GeophysicalResearch 88:9534–9544.
Pieters C. M. and Hiroi T. 2004. RELAB (ReflectanceExperiment Laboratory): A NASA multi-user spectroscopyfacility (abstract #1720). 35th Lunar and Planetary ScienceConference. CD-ROM.
Pieters C. M., Binzel R. P., Bogard D., Hiroi T., MittlefehldtD. W., Nyquist L., Rivkin A., and Takeda H. 2005.Asteroid-meteorite links: The Vesta conundrum(s).Asteroids, Comets, Meteors Proceedings, IAU Symposium229:273–288.
Pun A. and Papike J. J. 1996. Unequilibrated eucrites and theequilibrated Juvinas eucrite: Pyroxene REE systematicsand major, minor, and trace element zoning. AmericanMineralogist 81:1438–1451.
Righter K. and Drake M. J. 1997. A magma ocean on Vesta:Core formation and petrogenesis of eucrites anddiogenites. Meteoritics & Planetary Science 32:929–944.
Rossman G. R. 1980. Pyroxene spectroscopy. In Pyroxenes,edited by Prewitt C. Reviews of Mineralogy, vol. 7.Washington, D.C.: Mineralogical Society of America. pp.95–115.
Russell C. T., Coradini A., Christensen U., De Sanctis M. C.,Feldman W. C., Jaumann R., Keller H. U., Konopliv A.,McCord T. B., McFadden L. A., McSween H. Y.,Mottola S., Neukum G., Pieters C. M., Prettyman T. H.,Raymond C. A., Smith D. E., Sykes M. V., Williams B.,Wise J., and Zuber M. T. 2004. Dawn: A journey in spaceand time. Planetary and Space Science 52:465–489.
Russell C. T., Capaccioni F., Coradini A., Christensen U., DeSanctis M. C., Feldman W. C., Jaumann R., Keller H. U.,Konopliv A., McCord T. B., McFadden L. A., McSweenH. Y., Mottola S., Neukum G., Pieters C. M., PrettymanT. H., Raymond C. A., Smith D. E., Sykes M. V.,Williams B., and Zuber M. T. 2006. Dawn discoverymission to Vesta and Ceres: Present status. Advances inSpace Research 38:2043–2048.
Ruzicka A., Synder G. A., and Taylor L. A. 1997. Vesta asthe howardite, eucrite, and diogenite parent body:
Implications for the size of a core and for large-scaledifferentiation. Meteoritics & Planetary Science 32:825–840.
Salisbury J. W. and Hunt G. R. 1974. Meteorite spectra andweathering. Journal of Geophysical Research 79:4439–4441.
Schade U. and Wasch R. 1999. Near-infrared reflectancespectra from bulk samples of the two SNC meteoritesZagami and Nakhla. Meteoritics & Planetary Science34:417–424.
Stolper E. 1977. Experimental petrology of eucritic meteorites.Geochimica et Cosmochimica Acta 41:587–611.
Sunshine J. M. and Pieters C. M. 1993. Estimating modalabundances from the spectra of natural and laboratorypyroxene mixtures using the Modified Gaussian Model.Journal of Geophysical Research 98:9075–9087.
Sunshine J. M., Pieters C. M., and Pratt S. F. 1990.Deconvolution of mineral absorption bands: An improvedapproach. Journal of Geophysical Research 95:6955–6966.
Sunshine J. M., McFadden L. A., and Pieters C. M. 1993.Reflectance spectra of the Elephant Moraine A79001meteorite: Implications for remote sensing of planetarybodies. Icarus 105:79–91.
Sunshine J. M., Bishop J., Dyar M. D., Hiroi T., Klima R.,and Pieters C. M. 2004a. Near-infrared spectra of Martianpyroxene separates: First results from Mars SpectroscopyConsortium (abstract #1636). 35th Lunar and PlanetaryScience Conference. CD-ROM.
Sunshine J. M., Bus S. J., McCoy T. J., Burbine T. H.,Corrigan C. M., and Binzel R. P. 2004b. High-calciumpyroxene as an indicator of differentiation in asteroids andmeteorites. Meteoritics & Planetary Science 39:1343–1357.
Takeda H. and Graham A. L. 1991. Degree of equilibrationof eucritic pyroxenes and thermal metamorphism of theearliest planetary crust. Meteoritics 26:129–134.
Treiman A. L. 1990. Complex petrogenesis of the Nakhla(SNC) meteorite: Evidence from petrography and mineralchemistry. Proceedings, 20th Lunar and Planetary ScienceConference. pp. 273–280.
Yamaguchi A., Taylor G. J., and Keil K. 1996. Global crustalmetamorphism of the eucrite parent body. Icarus 124:97–112.
Eucrite spectra: Implications for Vesta 19