Petroleum Resources Classification Reserves Estimation · Reserves Estimation Developed Areas...
25
Petroleum Resources Classification & Reserves Estimation Petroleum Resources Classification & Reserves Estimation
Transcript of Petroleum Resources Classification Reserves Estimation · Reserves Estimation Developed Areas...

Petroleum Resources Classification
&
Reserves Estimation
Petroleum Resources Classification
&
Reserves Estimation
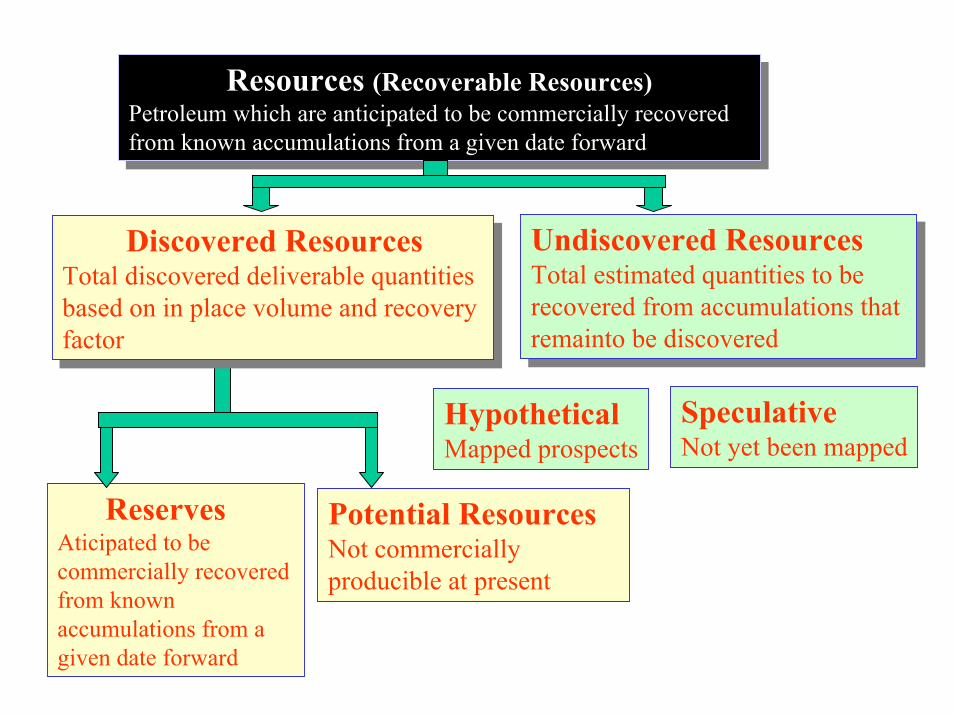
Resources (Recoverable Resources)Petroleum which are anticipated to be commercially recovered from known accumulations from a given date forward
Resources (Recoverable Resources)Petroleum which are anticipated to be commercially recovered from known accumulations from a given date forward
Undiscovered ResourcesTotal estimated quantities to be recovered from accumulations thatremainto be discovered
Undiscovered ResourcesTotal estimated quantities to be recovered from accumulations thatremainto be discovered
ReservesAticipated to be commercially recovered from known accumulations from a given date forward
Potential ResourcesNot commercially producible at present
HypotheticalMapped prospects
Discovered ResourcesTotal discovered deliverable quantitiesbased on in place volume and recovery factor
Discovered ResourcesTotal discovered deliverable quantitiesbased on in place volume and recovery factor
SpeculativeNot yet been mapped
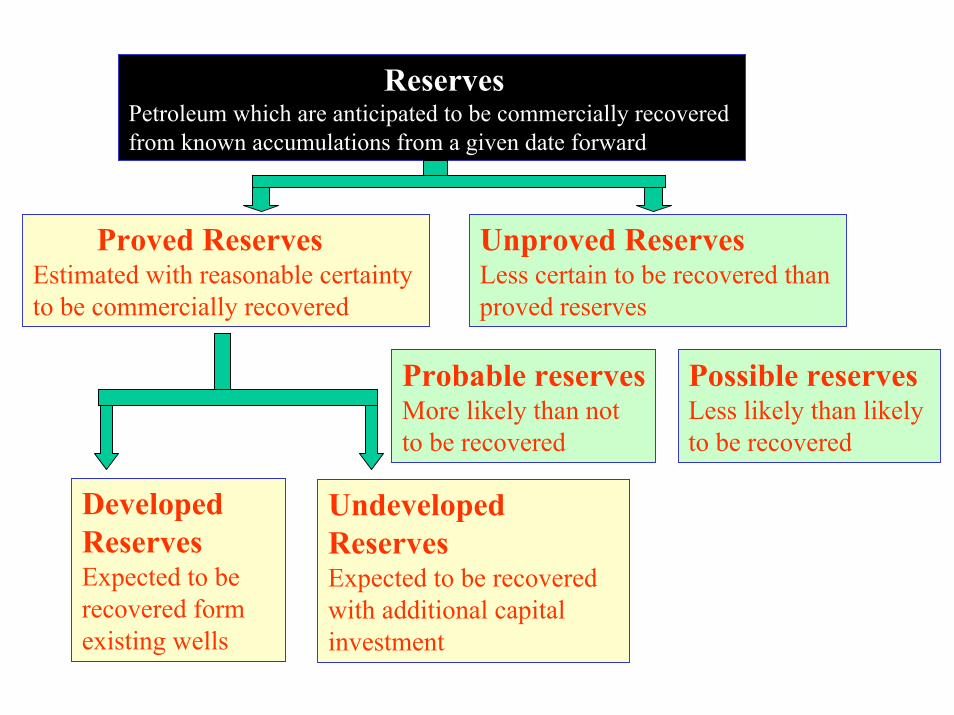
ReservesPetroleum which are anticipated to be commercially recovered from known accumulations from a given date forward
Proved ReservesEstimated with reasonable certainty to be commercially recovered
Unproved ReservesLess certain to be recovered than proved reserves
Probable reservesMore likely than notto be recovered
Possible reservesLess likely than likely to be recovered
Developed ReservesExpected to be recovered form existing wells
Undeveloped ReservesExpected to be recoveredwith additional capital investment

Reserves Estimation
Existing Producing WellsDeveloped AreasInfill WellsBooster Compression
Undeveloped Areas Primary WellsInfill WellsBooster Compression
Unproved Areas Primary WellsInfill WellsBooster Compression

Reserves Estimation
Calculation Parameters
• Performance Reserves
• Volumetric Reserves
Method
• Deterministic
• Probabilistic
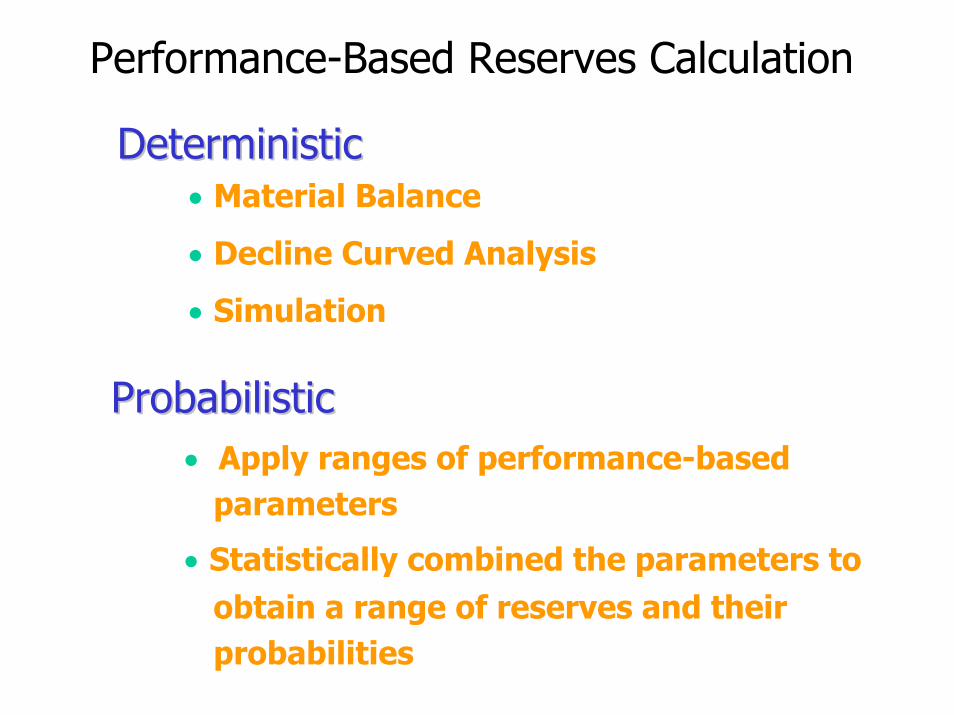
Performance-Based Reserves Calculation
DeterministicDeterministic• Material Balance
• Decline Curved Analysis
• Simulation
ProbabilisticProbabilistic• Apply ranges of performance-based
parameters
• Statistically combined the parameters to obtain a range of reserves and theirprobabilities

Volumetric Reserves Calculation
DeterministicDeterministic
Vol (std. cond.) = Area * Thickness * 0 * (1Vol (std. cond.) = Area * Thickness * 0 * (1--Sw) * RFSw) * RFFVFFVF
RF = Recovery Factor ; 40-70 % for gas5-25 % for oil
FVF = Formation Volume Factor
ProbabilisticProbabilisticSame formula
Apply range of parameters
Obtain ranges of possible outcomes and their associatedprobabilities
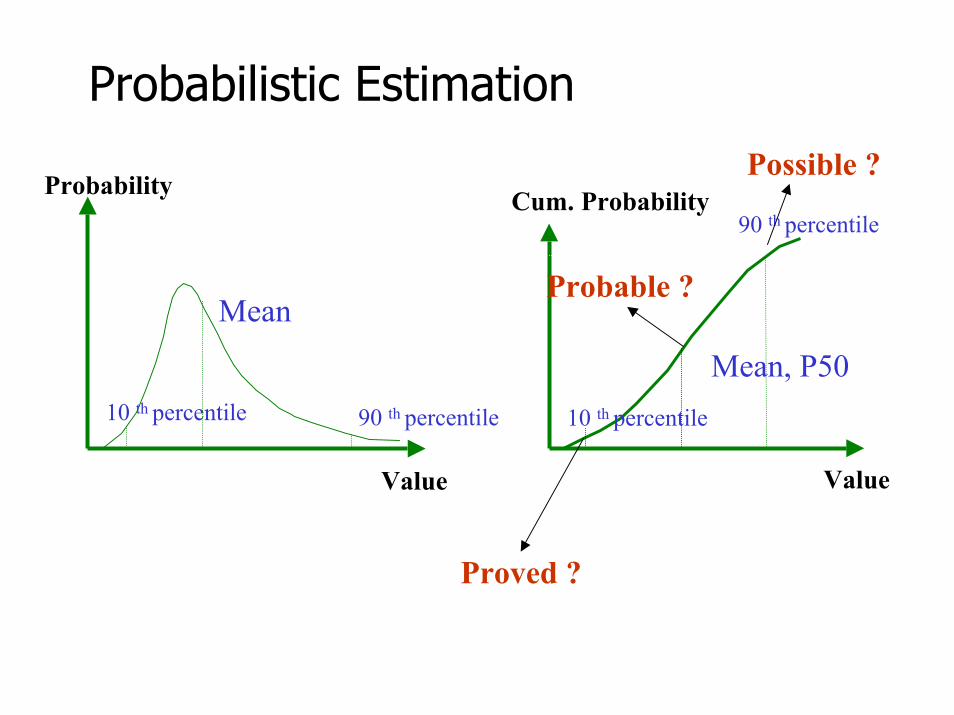
Probabilistic Estimation
Probability
90 th percentile10 th percentile
Mean
90 th percentile
10 th percentile
Mean, P50
Proved ?
Probable ?
Possible ?Cum. Probability
ValueValue
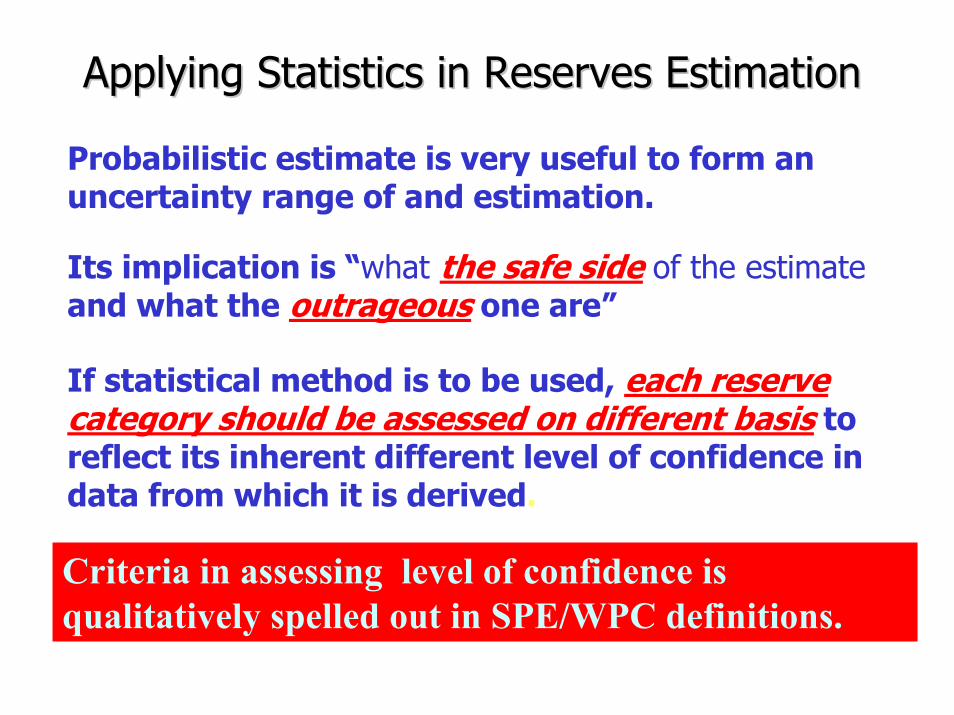
Applying Statistics in Reserves EstimationApplying Statistics in Reserves Estimation
Probabilistic estimate is very useful to form an uncertainty range of and estimation.
Its implication is “what the safe side of the estimateand what the outrageous one are”
If statistical method is to be used, each reserve category should be assessed on different basis to reflect its inherent different level of confidence in data from which it is derived.
Criteria in assessing level of confidence is qualitatively spelled out in SPE/WPC definitions.
Reserves Estimation Methods
Existing Producing WellsExisting Producing Wells
• Performance Reserves–– Material Balance Material Balance –– Decline Curve AnalysisDecline Curve Analysis
• Volumetric Calculation–– PerformancedPerformanced--basedbased

Reserves Estimation MethodsExample: Chevron Offshore Thailand
Undeveloped areasUndeveloped areasP5/50/95• Area• Col Height• net pay• Porosity• Saturation
Subsuface Data• Seismic• Core• Log• RFT
3 Point OGOP/OOIP
Benchamas Total Oil Reserves
0.00
0.10
0.20
0.30
0.40
0.50
0.60
0.70
0.80
0.90
1.00
0.0 20.0 40.0 60.0 80.0 100.0 120.0 140.0 160.0
MMBO
Primary Total Benchamas
Waterflood Total Benchamas
Primary Developed BenchamasP1 Developed P1 Total
P2+P1
P3+P2+P1 P10/50/90•Condensate Yield•Primary Recovery•Secondary Recovery•Geologic Risk
In-house Software
(Crystal Ball)

Example Probabilistic Reserves
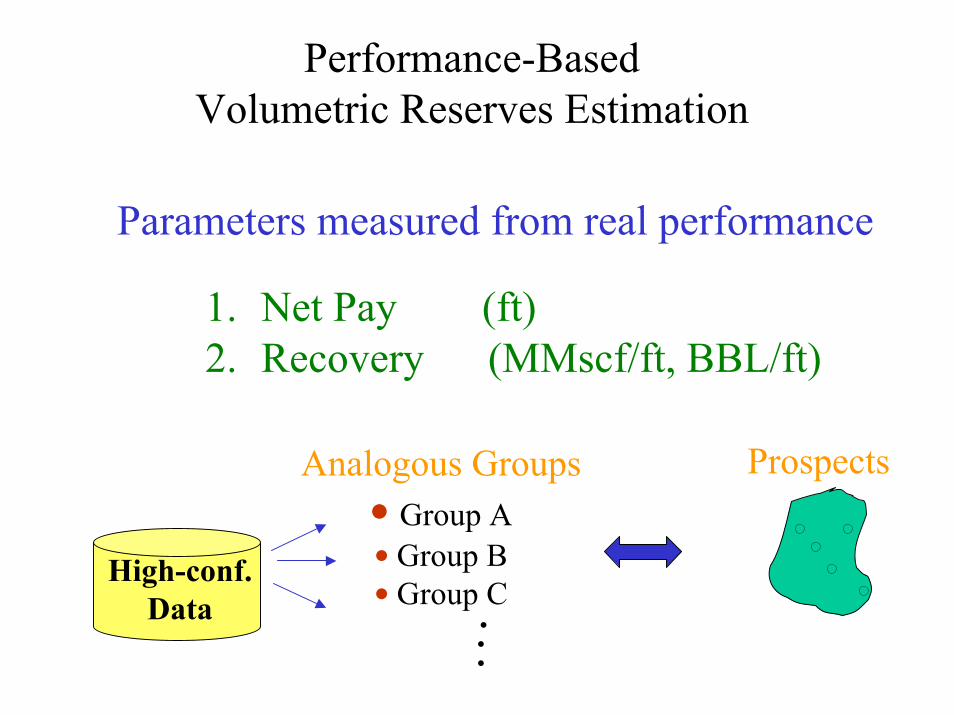
Performance-Based Volumetric Reserves Estimation
Parameters measured from real performance
1. Net Pay (ft)2. Recovery (MMscf/ft, BBL/ft)
ProspectsAnalogous Groups• Group A• Group B• Group C...
High-conf. Data

Performance-Based Volumetric Reserves Estimation
Example: Unocal Thailand
Calculated Areas
Mean of Inferred Areas Based on
Geologic Analogies
Volumetric Reserves
Calculation
Change from Volumetric to Performance Control
High Confidence Recoveries
AcquirePerformanceData
SignificantDepletion
Normalized to line Pressure
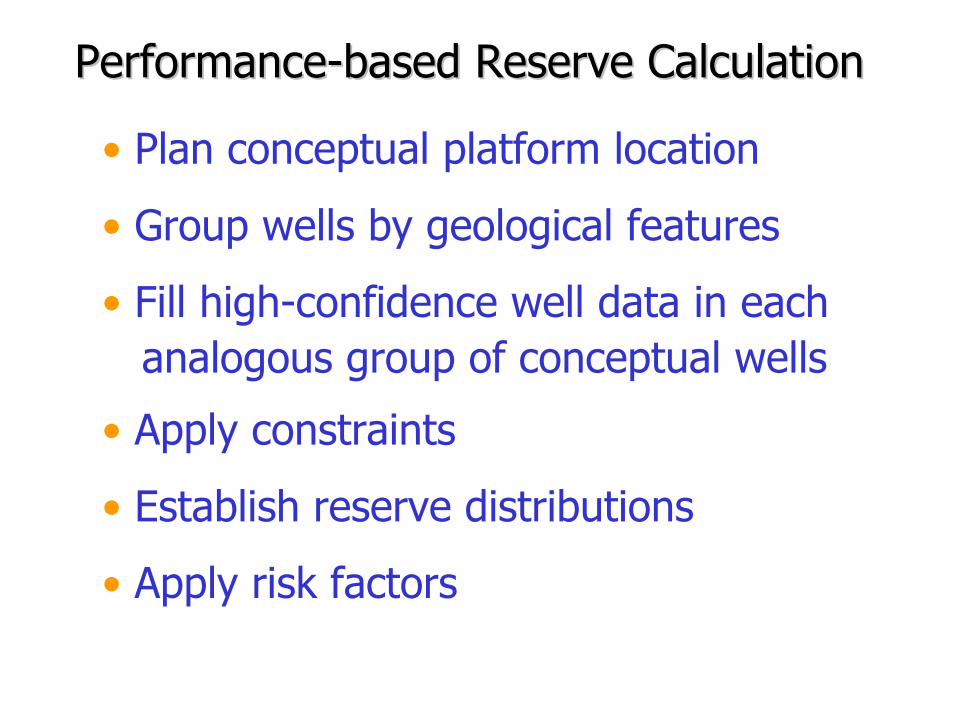
PerformancePerformance--based Reserve Calculationbased Reserve Calculation
• Plan conceptual platform location
• Group wells by geological features
• Fill high-confidence well data in eachanalogous group of conceptual wells
• Apply constraints
• Establish reserve distributions
• Apply risk factors

Well Dist . Pay Distribution (FT) Rec. Distribution (MMCF/FT PAY) Reserves (IN BCF) Risk Risked Ref. to Map (First
Well Del . Well for
UPR/UPO Plats .)
Grp.*
P10 P18 P50 P82 P90 Swn.'sMean
P10 P18 P50 P82 P90 Swn.'s Mean
P10 P50 P90 Swn.'sMean
Trap Resvr. Source Mig. Seal Other POS
Reserves (Bcf)
1 Red 57 71 126 222 279 151 16.2 18.8 27.3 39.8 46.2 29.7 1.34 3.44 8.83 4.43 0.95 1.00 1.00 0.90 1.00 1.00 0.86 3.792 Red 57 71 126 222 279 151 16.2 18.8 27.3 39.8 46.2 29.7 1.34 3.44 8.83 4.43 0.95 1.
Well Dist . Pay Distribution (FT) Rec. Distribution (MMCF/FT PAY) Reserves (IN BCF) Risk Risked Ref. to Map (First
Well Del . Well for
UPR/UPO Plats .)
Grp.*
P10 P18 P50 P82 P90 Swn.'sMean
P10 P18 P50 P82 P90 Swn.'s Mean
P10 P50 P90 Swn.'sMean
Trap Resvr. Source Mig. Seal Other POS
Reserves (Bcf)
1 Red 57 71 126 222 279 151 16.2 18.8 27.3 39.8 46.2 29.7 1.34 3.44 8.83 4.43 0.95 1.00 1.00 0.90 1.00 1.00 0.86 3.792 Red 57 71 126 222 279 151 16.2 18.8 27.3 39.8 46.2 29.7 1.34 3.44 8.83 4.43 0.95 1.00 1.00 0.90 1.00 1.00 0.86 3.793 Orange 44 55 101 183 232 123 7.7 9.7 17.1 30.0 37.7 20.4 0.54 1.72 5.49 2.50 0.85 1.00 1.00 0.85 1.00 1.00 0.72 1.804 Orange 44 55 101 183 232 123 7.7 9.7 17.1 30.0 37.7 20.4 0.54 1.72 5.49 2.50 0.85 1.00 1.00 0.85 1.00 1.00 0.72 1.805 Orange 44 55 101 183 232 123 7.7 9.7 17.1 30.0 37.7 20.4 0.54 1.72 5.49 2.50 0.85 1.00 1.00 0.90 1.00 1.00 0.77 1.916 Green 56 65 95 139 162 103 8.9 10.7 17.0 27.0 32.5 19.2 0.69 1.61 3.76 1.98 0.65 1.00 1.00 0.85 1.00 1.00 0.55 1.097 Green 56 65 95 139 162 103 8.9 10.7 17.0 27.0 32.5 19.2 0.69 1.61 3.76 1.98 0.70 1.00 1.00 0.90 1.00 1.00 0.63 1.25
Pay Distribution
RecoveryRecovery DistributionDistributionReserves Distribution
Mean * Risk = Risked Reserves

Pay DistributionPay Distribution
LogNormal Probability Distribution
1 2 5 10 20 30 40 50 60 70 80 90 95 98 99
P10
P50
P90
Swansons
10.00
100.00
1000.00
Probability %
Valu
es
ValuesProbability %KeypointsExtraKeysSwansonsMean
kas
Swanson = 150.97Mean = 152.20Slope = 0.27P10 = 56.85P50 = 125.84

696 Wells drilled in B696 Wells drilled in B--10, 11, 12, 13, 12/27 10, 11, 12, 13, 12/27 Net Pay drilled
700
600
500
300
400
feet
feet
200
100
0
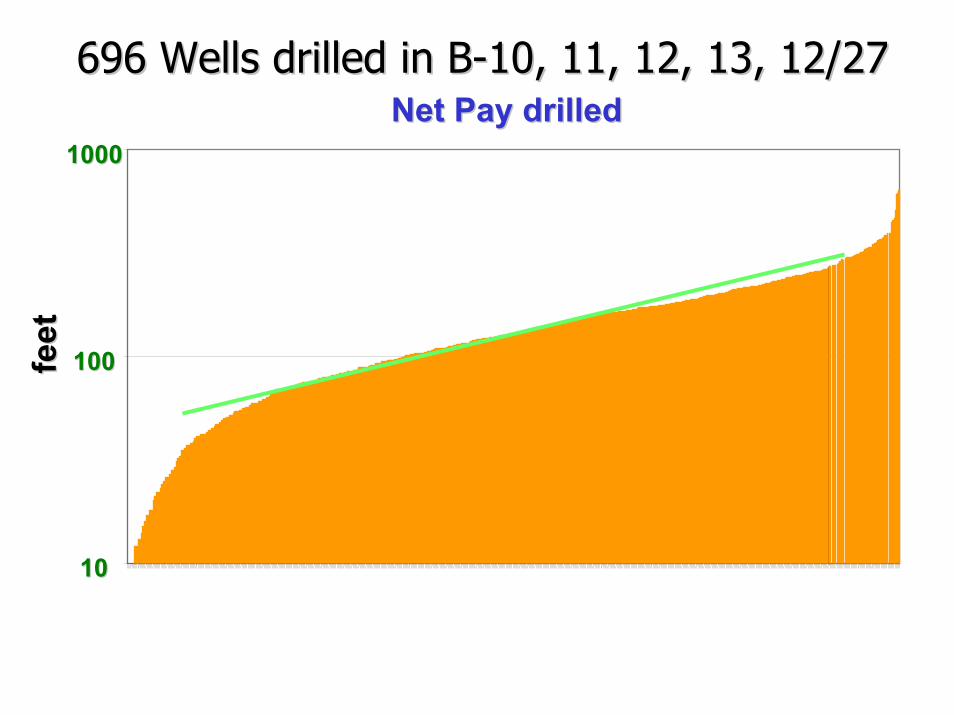
696 Wells drilled in B696 Wells drilled in B--10, 11, 12, 13, 12/27 10, 11, 12, 13, 12/27 Net Pay drilled Net Pay drilled
100100
10001000
feet
feet
1010
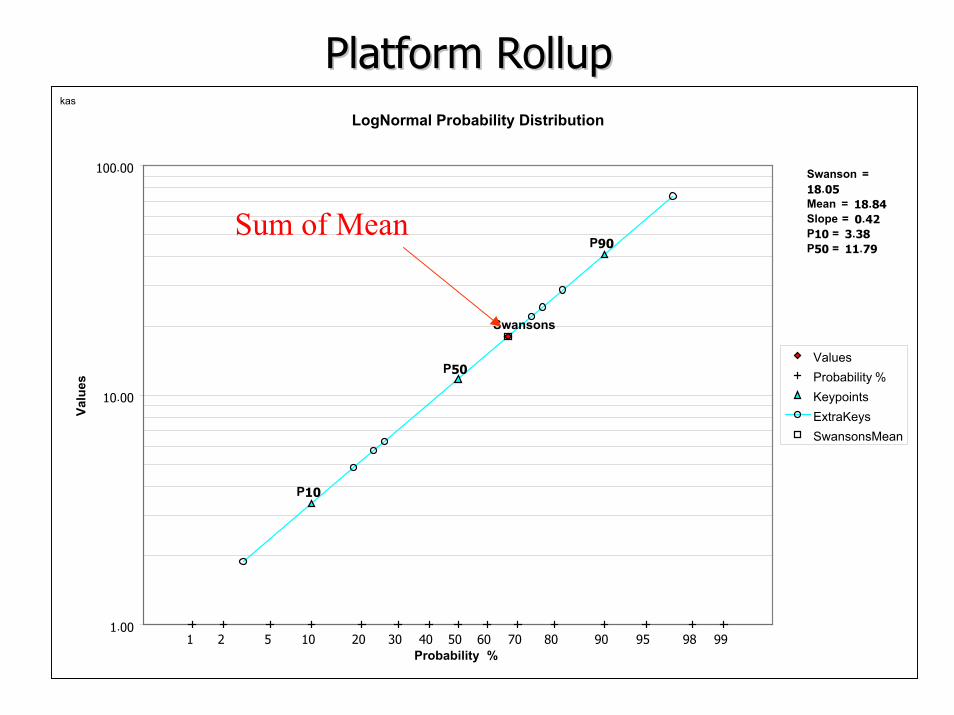
Platform RollupPlatform RollupLogNormal Probability Distribution
1 2 5 10 20 30 40 50 60 70 80 90 95 98 99
P10
P50
P90
Swansons
1.00
10.00
100.00
Probability %
Valu
es
ValuesProbability %KeypointsExtraKeysSwansonsMean
kas
Swanson = 18.05Mean = 18.84Slope = 0.42P10 = 3.38P50 = 11.79
Sum of Mean
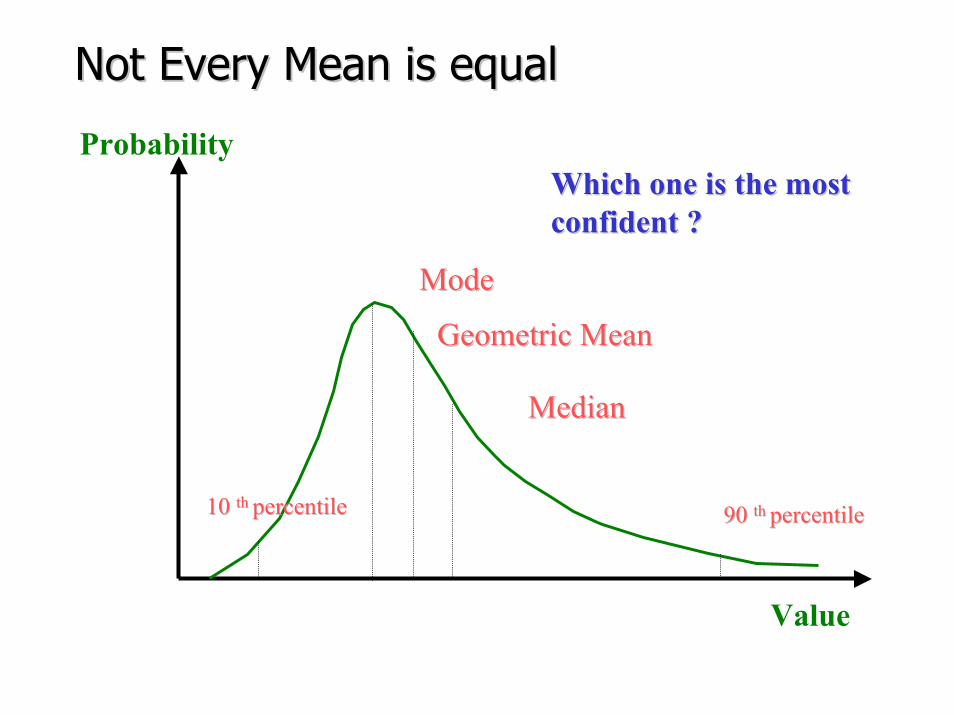
Not Every Mean is equalNot Every Mean is equal
Probability
90 90 th th percentilepercentile10 10 th th percentilepercentile
Geometric MeanGeometric Mean
MedianMedian
Which one is the most Which one is the most confident ?confident ?
ModeMode
Value

Not Every Mean is equalNot Every Mean is equalExample from 696 Well Drilled
GeometricGeometric 115.18115.18
P50P50 115.18115.18
MedianMedian 128.00128.00
ArithmeticArithmetic 139.91139.91 21.5 % over P5021.5 % over P50
Swanson’s Rule
Mean = 0.3*P10 + 0.4*P50 + 0.3*P90When P50/P10 < 5
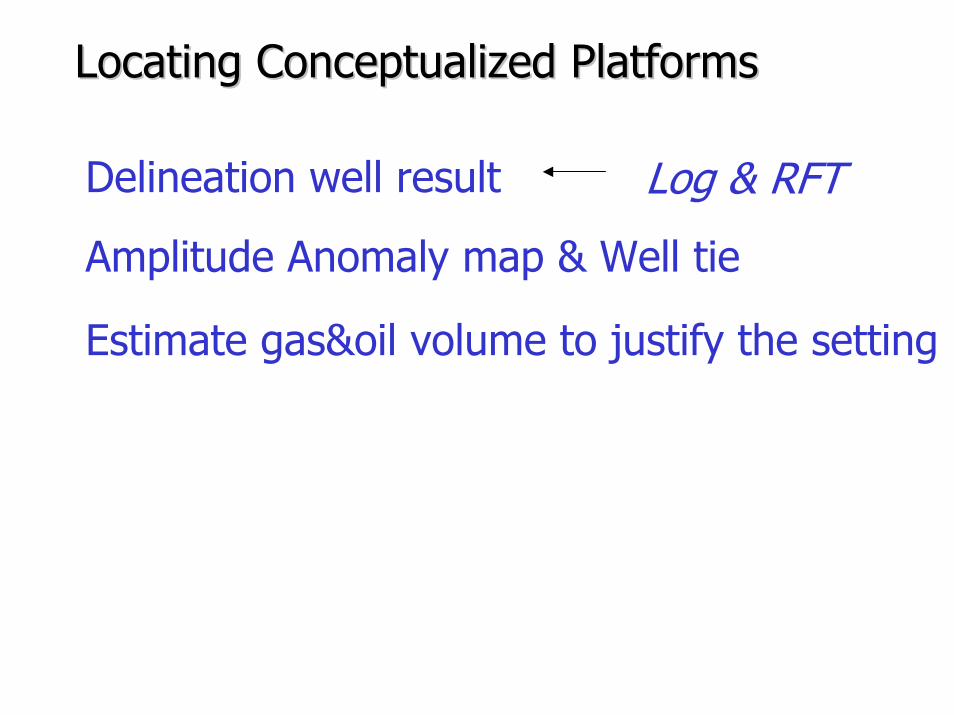
Locating Conceptualized PlatformsLocating Conceptualized Platforms
Delineation well result Log & RFT
Amplitude Anomaly map & Well tie
Estimate gas&oil volume to justify the setting

Analogous Well DataAnalogous Well DatasourcemigrationtrapreservoirSeal
Constraints• Anomaly map• Infill well• Specific Geological Elements
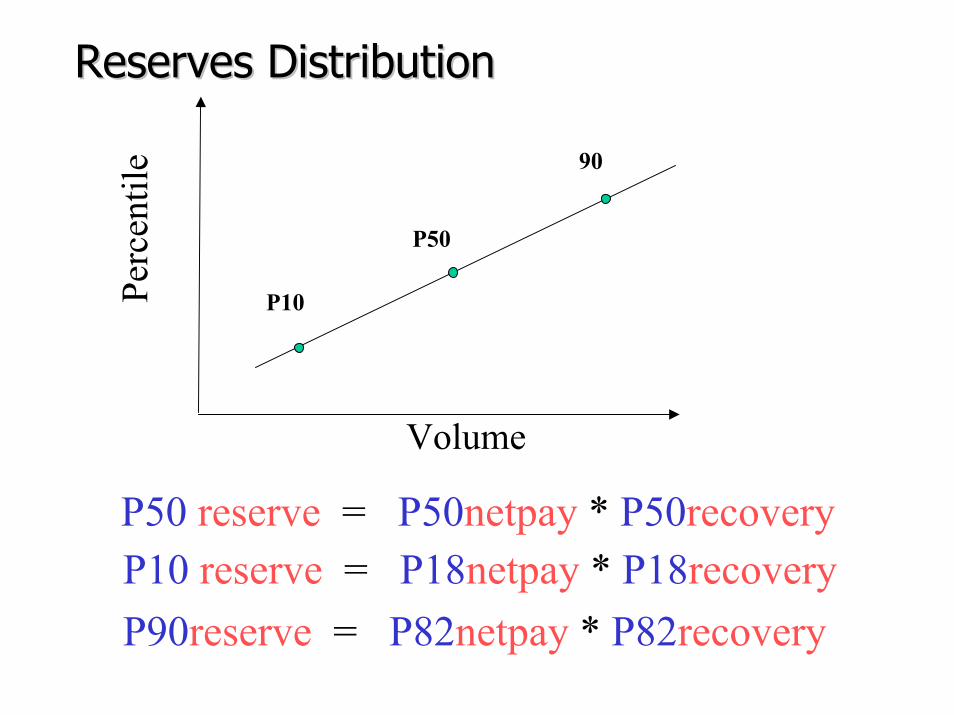
Reserves DistributionReserves Distribution
P10
P50
90Pe
rcen
tile
Volume
P50 reserve = P50netpay * P50recoveryP10 reserve = P18netpay * P18recoveryP90reserve = P82netpay * P82recovery