Petroleum Processing
78
1 Chapter 1 PETROLEUM PROCESSING OVERVIEW Paul R. Robinson PQ Optimization Services, Inc. 3418 Clearwater park Drive, Katy, Texas, 77450 1. INTRODUCTION The ground begins to rumble, then shake. The hero of the film – a lean ex- cowboy with a square jaw under his hat and a gorgeous brunette on his arm – reaches out to brace himself against his horse. A smile creases his face as the rumbling grows louder. Suddenly, a gush of black goo spurts into the air and splashes down on him, his side-kick and his best gal. They dance with ecstasy until the music swells and the credits start to roll. Why is our hero so happy? Because he’s rich! After years of drilling dry holes in every county between the Red River and the Rio Grande, he finally struck oil. 1.1 History of Petroleum Production So why is he rich? What makes oil so valuable? Actually, crude oil straight from the ground has some value, but not a lot. Table 1 shows the history of petroleum before 1861. Before 1859, oil that was mined or that simply seeped up out of the ground was used to water-proof ships, as an adhesive in construction, for flaming projectiles, and in a wide variety of ointments. 1-4 After 1859, petroleum became more and more important to the world’s economy, so important that today, without a steady flow of oil, most human activities on this planet would grind to a halt. Petroleum accounts for 60% of the world’s shipping on a tonnage basis. 3 It provides fuels and lubricants for our trucks, trains, airplanes, and automobiles. Ships are powered by fuel oil roads and provide coke for the steel industry. Together with natural gas, derived from petroleum. Bottom-of-the-barrel petroleum derivatives pave our
-
Upload
amey-perry -
Category
Career
-
view
2.072 -
download
10
description
Transcript of Petroleum Processing

1
Chapter 1
PETROLEUM PROCESSING OVERVIEW
Paul R. Robinson PQ Optimization Services, Inc. 3418 Clearwater park Drive, Katy, Texas, 77450
1. INTRODUCTION
The ground begins to rumble, then shake. The hero of the film – a lean ex-cowboy with a square jaw under his hat and a gorgeous brunette on his arm – reaches out to brace himself against his horse. A smile creases his face as the rumbling grows louder. Suddenly, a gush of black goo spurts into the air and splashes down on him, his side-kick and his best gal. They dance with ecstasy until the music swells and the credits start to roll.
Why is our hero so happy? Because he’s rich! After years of drilling dry holes in every county between the Red River and the Rio Grande, he finally struck oil.
1.1 History of Petroleum Production
So why is he rich? What makes oil so valuable? Actually, crude oil straight from the ground has some value, but not a lot.
Table 1 shows the history of petroleum before 1861. Before 1859, oil that was mined or that simply seeped up out of the ground was used to water-proof ships, as an adhesive in construction, for flaming projectiles, and in a wide variety of ointments.1-4
After 1859, petroleum became more and more important to the world’s economy, so important that today, without a steady flow of oil, most human activities on this planet would grind to a halt. Petroleum accounts for 60% of the world’s shipping on a tonnage basis.3 It provides fuels and lubricants for our trucks, trains, airplanes, and automobiles. Ships are powered by fuel oil
roads and provide coke for the steel industry. Together with natural gas, derived from petroleum. Bottom-of-the-barrel petroleum derivatives pave our

Robinson
petroleum provides precursors for the world’s petrochemical industries. At the end of 2003, the world was consuming 78 million barrels of oil per day.5
Table 1. History of Petroleum Before 1861 Date Description
3000 BC Sumerians use asphalt as an adhesive for making mosaics. Mesopotamians use bitumen to line water canals, seal boats, and build roads. Egyptians use pitch to grease chariot wheels, and asphalt to embalm mummies.
1500 BC The Chinese use petroleum for lamps and for heating homes. 600 BC Confucius writes about the drilling of 100-foot (30-meter) natural gas
wells in China. The Chinese build pipelines for oil using bamboo poles. 600-500 BC Arab and Persian chemists mix petroleum with quicklime to make Greek
fire, the napalm of its day. 1200-1300 AD The Persians mine seep oil near Baku (now in Azerbaijan). 1500-1600 AD Seep oil from the Carpathian Mountains is used in Polish street lamps.
The Chinese dig oil wells more than 2000 feet (600 meters) deep. 1735 AD Oil is extracted from oil sands in Alsace, France.
Early 1800s Oil is produced in United States from brine wells in Pennsylvania. 1847 James Oakes builds a “rock oil” refinery in Jacksdale, England.6 The unit
processes 300 gallons per day to make “paraffin oil” for lamps. James Young builds a coal-oil refinery in Whitburn, Scotland.7
1848 F.N. Semyenov drills the first “modern” oil well near Baku. 1849 Canadian geologist Abraham Gesner distills kerosene from crude oil. 1854 Ignacy Lukasiewicz drills oil wells up to 150 feet (50 meters) deep at
Bóbrka, Poland. 1857 Michael Dietz invents a flat-wick kerosene lamp (Patent issued in 1859). 1858 Ignacy Lukasiewicz builds a crude oil distillery in Ulaszowice, Poland.8
The first oil well in North America is drilled near Petrolia, Ontario, Canada.
1859 Colonel Edwin L. Drake triggers the Pennsylvania oil boom by drilling a well near Titusville, Pennsylvania that was 69-feet deep and produced 35 barrels-per-day.
1859 An oil refinery is built in Baku (now in Azerbaijan). 1860-61 Oil refineries are built near Oil Creek, Pennsylvania; Petrolia, Ontario,
Canada; and Union County, Arkansas. So what happened in 1859? What began the transformation of petroleum
from a convenience into the world’s primary source of energy? As often is the case with major socioeconomic shifts, the move toward oil was instigated not by just a single event, but by the juxtaposition of several: • In the 1850s, most home-based lamps burned whale oil or other animal
fats. Historically, whale-oil prices had always fluctuated wildly, but they peaked in the mid-1850s due to the over-hunting of whales; by some estimates, in 1860 several species were almost extinct. Whale oil sold for an average price of US$1.77 per gallon between 1845 and 1855. In contrast, lard oil sold for about US$0.90 per gallon.9,10 Lard oil was more abundant, but it burned with a smoky, smelly flame.
2
In August 2005, that volume of petroleum was worth $4.6 billion per day,or $1.7 trillion per year.
• Michael Dietz invented a flat-wick kerosene lamp in 1857. The Dietz
lamp was arguably the most successful of several devices designed to burn something other than animal fats.
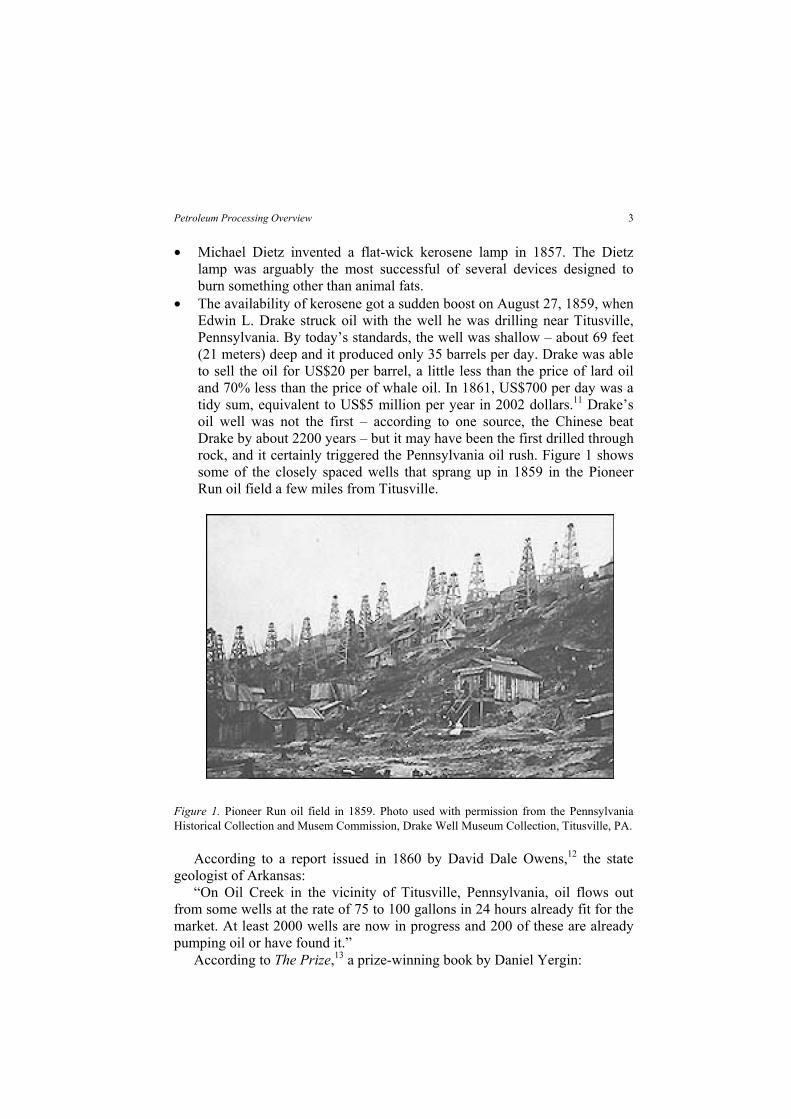
• The availability of kerosene got a sudden boost on August 27, 1859, when Edwin L. Drake struck oil with the well he was drilling near Titusville, Pennsylvania. By today’s standards, the well was shallow – about 69 feet (21 meters) deep and it produced only 35 barrels per day. Drake was able to sell the oil for US$20 per barrel, a little less than the price of lard oil and 70% less than the price of whale oil. In 1861, US$700 per day was a tidy sum, equivalent to US$5 million per year in 2002 dollars.11 Drake’s oil well was not the first – according to one source, the Chinese beat Drake by about 2200 years – but it may have been the first drilled through rock, and it certainly triggered the Pennsylvania oil rush. Figure 1 shows some of the closely spaced wells that sprang up in 1859 in the Pioneer Run oil field a few miles from Titusville.
Figure 1. Pioneer Run oil field in 1859. Photo used with permission from the Pennsylvania Historical Collection and Musem Commission, Drake Well Museum Collection, Titusville, PA.
According to a report issued in 1860 by David Dale Owens,12 the state geologist of Arkansas:
“On Oil Creek in the vicinity of Titusville, Pennsylvania, oil flows out from some wells at the rate of 75 to 100 gallons in 24 hours already fit for the market. At least 2000 wells are now in progress and 200 of these are already pumping oil or have found it.”
According to The Prize,13 a prize-winning book by Daniel Yergin:
3Petroleum Processing Overview

“When oil first started flowing out of the wells in western Pennsylvania in the 1860’s, desperate oil men ransacked farmhouses, barns, cellars, stores, and trash yards for any kind of barrel – molasses, beer, whiskey, cider, turpentine, sale, fish, and whatever else was handy. But as coopers began to make barrels especially for the oil trade, one standard size emerged, and that size continues to be the norm to the present. It is 42 gallons.
“The number was borrowed from England, where a statute in 1482 under King Edward IV established 42 gallons as the standard size barrel for herring in order to end skullduggery and “divers deceits” in the packing of fish. At the time, herring fishing was the biggest business in the North Sea. By 1866, seven years after Colonel Drake drilled his well, Pennsylvania producers confirmed the 42-gallon barrel as their standard, as opposed to, say, the 31½ gallon wine barrel or the 32 gallon London ale barrel or the 36 gallon London beer barrel.”
In sharp contrast to the situation today, in 1870 America was the world’s leading oil producer, and oil was America’s 2nd biggest export.4 Agricultural products were first, accounting for 79% of exports that were worth, on average, US$573 million per year from 1870 to 1879.14 Despite the ravages of the U.S. Civil War, the main agricultural export was still “King Cotton.”
1.2 What Is Petroleum?
Before we go on to talk about petroleum processing, it is important to know something about petroleum itself. Petroleum is called a fossil fuel because it is formed from the bodies of ancient organisms – primarily one-celled plants and animals (see Chapter 2). Contrary to modern myth, only a tiny fraction (if any) of the molecules in crude oil are from dinosaurs. When these creatures died, their remains accumulated at bottoms of ancient lakes or seas, along with sand and other sediments. Over time, a combination of pressure, heat, and bacterial action transformed the deposits into sedimentary rock. The incorporated organic matter was transformed into simpler chemicals, such as hydrocarbons, water, carbon dioxide, hydrogen sulfide, and others.
The chemicals didn’t always stay put. If the surrounding rock was porous, liquids and gases could migrate, either up to the surface or into a reservoir (Figure 2) that was capped by impermeable rock or a dome of salt. Today, when petroleum geologists look for oil, they actually are looking for structures that might be traps for liquid hydrocarbons.
4 Robinson
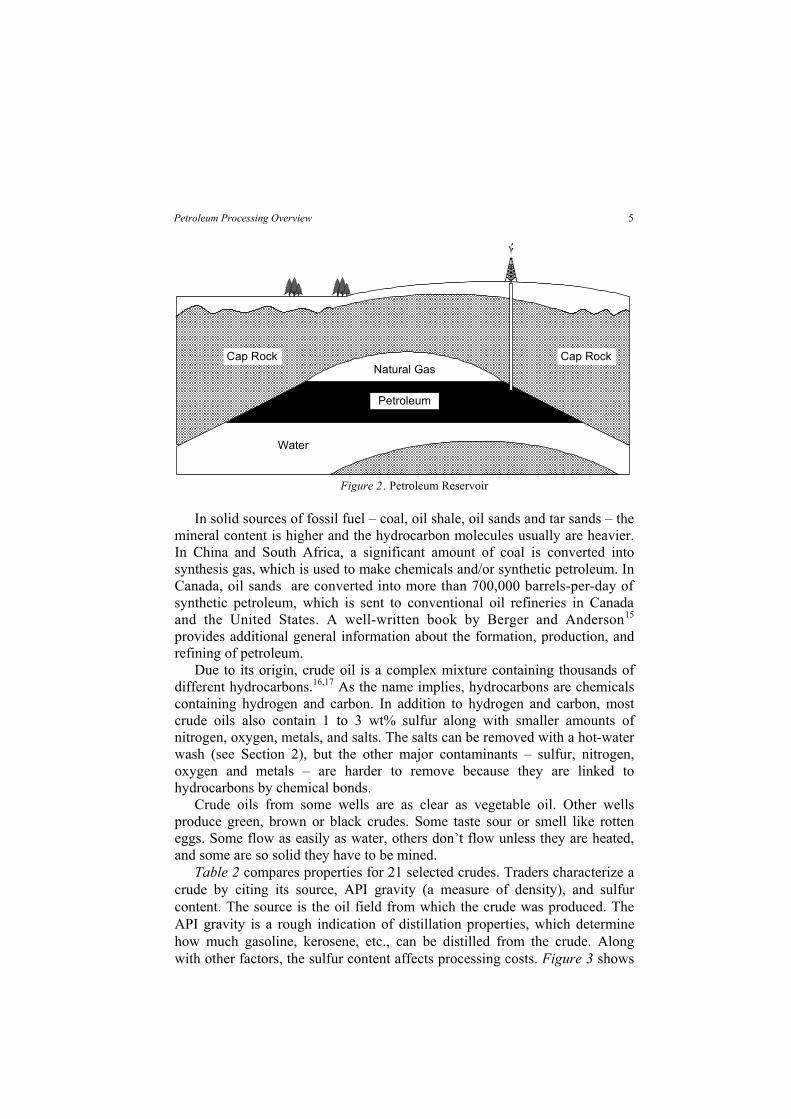
Natural Gas
Water
Cap Rock
Petroleum
Cap Rock
Figure 2 . Petroleum Reservoir
In solid sources of fossil fuel – coal, oil shale, oil sands and tar sands – the
mineral content is higher and the hydrocarbon molecules usually are heavier. In China and South Africa, a significant amount of coal is converted into synthesis gas, which is used to make chemicals and/or synthetic petroleum. In
15 provides additional general information about the formation, production, and refining of petroleum.
Due to its origin, crude oil is a complex mixture containing thousands of different hydrocarbons.16,17 As the name implies, hydrocarbons are chemicals containing hydrogen and carbon. In addition to hydrogen and carbon, most crude oils also contain 1 to 3 wt% sulfur along with smaller amounts of nitrogen, oxygen, metals, and salts. The salts can be removed with a hot-water wash (see Section 2), but the other major contaminants – sulfur, nitrogen, oxygen and metals – are harder to remove because they are linked to hydrocarbons by chemical bonds.
Crude oils from some wells are as clear as vegetable oil. Other wells produce green, brown or black crudes. Some taste sour or smell like rotten eggs. Some flow as easily as water, others don’t flow unless they are heated, and some are so solid they have to be mined.
Table 2 compares properties for 21 selected crudes. Traders characterize a crude by citing its source, API gravity (a measure of density), and sulfur content. The source is the oil field from which the crude was produced. The API gravity is a rough indication of distillation properties, which determine how much gasoline, kerosene, etc., can be distilled from the crude. Along with other factors, the sulfur content affects processing costs. Figure 3 shows
5Petroleum Processing Overview
Canada, oil sands are converted into more than 700,000 barrels-per-day ofsynthetic petroleum, which is sent to conventional oil refineries in Canadaand the United States. A well-written book by Berger and Anderson

that light crudes (those with high API gravities) often contain less sulfur and nitrogen than heavy crudes, but not always.
Table 2. Properties of 21 Selected Crude Oils
Crude Oil API Gravity† Specific Gravity
Sulfur (wt%)
Nitrogen (wt%)
Alaska North Slope 26.2 0.8973 1.1 0.2 Arabian Light 33.8 0.8560 1.8 0.07 Arabian Medium 30.4 0.8740 2.6 0.09 Arabian Heavy 28.0 0.8871 2.8 0.15 Athabasca (Canada) 8 1.0143 4.8 0.4 Beta (California) 16.2 0.9580 3.6 0.81 Brent (North Sea) 38.3 0.8333 0.37 0.10 Bonny Light (Nigeria) 35.4 0.8478 0.14 0.10 Boscan (Venezuela) 10.2 0.9986 5.3 0.65 Ekofisk (Norway) 37.7 0.8363 0.25 0.10 Henan (China) 16.4 0.9567 0.32 0.74 Hondo Blend (California) 20.8 0.9291 4.3 0.62 Kern (California) 13.6 0.9752 1.1 0.7 Kuwait Export 31.4 0.8686 2.5 0.21 Liaohi (China)\ 17.9 0.9471 0.26 0.41 Maya (Mexico) 22.2 0.9206 3.4 0.32 Shengli (China) 13.8 0.9738 0.82 0.72 Tapis Blend (Malaysia) 45.9 0.7976 0.03 nil West Hackberry Sweet* 37.3 0.8383 0.32 0.10 West Texas Intermediate 39.6 0.8270 0.34 0.08 Xinjiang (China) 20.5 0.9309 0.15 0.35 * Produced from a storage cavern in the U.S. Strategic Petroleum Reserve † API Gravity is related to specific gravity by the formula: °API = 141.5 ÷ (specific gravity @ 60°F) – 131.5
Figure 3. Sulfur and nitrogen versus API gravity for selected crude oils
6 Robinson

1.2.1 The Chemicals in Petroleum
Carbon is present in almost all of the chemical compounds in petroleum. If you’ve ever taken a chemistry class, you know that carbon, more than any other element, binds to itself to form straight chains, branched chains, rings, and complex three-dimensional structures. The most complex molecules are biological – proteins, carbohydrates, fats and nucleic acids, which are present in every living thing, from the smallest bacterium to the largest tree. This is significant here because (as stated above) petroleum was formed from ancient organisms, and its molecules retain certain structural characteristics of the organic compounds from which it formed.
1.2.1.1 Paraffins
The lightest paraffin is methane (CH4) which is the major constituent of natural gas. Paraffins have the general formula CnH2n+2. The carbon chains in paraffins can be straight or branched. Compounds with the same formula but different structures are called isomers. Straight-chain paraffins are “normal,” while branched paraffins with the same chemical formula are called “iso.”
C8H18
isooctane
CH3
CCH2
CHCH3
CH3CH3
CH3
C8H18
n-octane
CH3
CH2CH2
CH2CH2
CH2CH2
CH3
C5H12
neopentane
CH3 C CH3
CH3
CH3
C4H10
n-butane
CH3
CH2CH2
CH3
C5H12
isopentane
CH CH2
CH3
CH3
CH3
C3H8
propane
CH3
CH2CH3
C5H12
n-pentane
CH3
CH2CH2
CH2CH3
C2H6
ethane
CH4
methane
C4H10
isobutane
CH3CH
CH3
CH3
Figure 4. Isomers of selected light paraffins
7Petroleum Processing Overview
Tables 3 and 4 show that isomers have different physical properties.18 They also can have significantly different chemical properties. For gasoline, one of the most important chemical properties is octane number. The research octane number (RON) for n-octane is -27 compared to a RON of 100 (by definition) for isooctane (2,2,3-trimethylpentane). For heptane isomers, RON values range from 45 for 2-methyl-hexane to >100 for 2,2,3-trimethylbutane, compared to zero (by definition) for n-heptane. Octane numbers are discussed in more detail in Section 8.2.
Table 3. Boiling Points of Selected Light Paraffins Name Formula Boiling Point (°F) Boiling Point (°C) Methane CH4 -259.9 -162.2 Ethane C2H6 -127.4 -88.6 Propane C3H8 -43.7 -42.1 n-Butane C4H10 31.7 -0.1 Isobutane C4H10 11.9 -11.2 n-Pentane C5H12 96.9 36.1 Isopentane C5H12 82.3 28.0 Neopentane C5H12 49.0 9.5 n-Octane C8H18 258.0 125.6 Isooctane C8H18 210.7 99.3
The melting points of paraffin isomers also can differ significantly. As
shown in Table 5, long-chain n-paraffins melt at relatively high temperatures, while their branched-chain isomers melt at lower temperatures. This explains their different behaviours as lubricants. Long-chain normal paraffins are waxy, so as lubricants they are terrible. Conversely, iso-paraffins with the same number of carbons are excellent lube base stocks.
Table 4. Fusion Points for Selected C16 Paraffins. Name Formula Melting Point (°F) Melting Point (°C) Hexadecane C16H34 64.1 17.9 5-Methylpentadecane C16H34 -29.5 -34.2 7,8-Dimethyltetradecane C16H34 -123.1 -86.2
1.2.1.2 Aromatics and Naphthenes
Aromatics and naphthenes are also found in petroleum. Aromatics contain one or more unsaturated 5 to 6-carbon rings. In naphthenes, carbon rings are saturated with hydrogen.
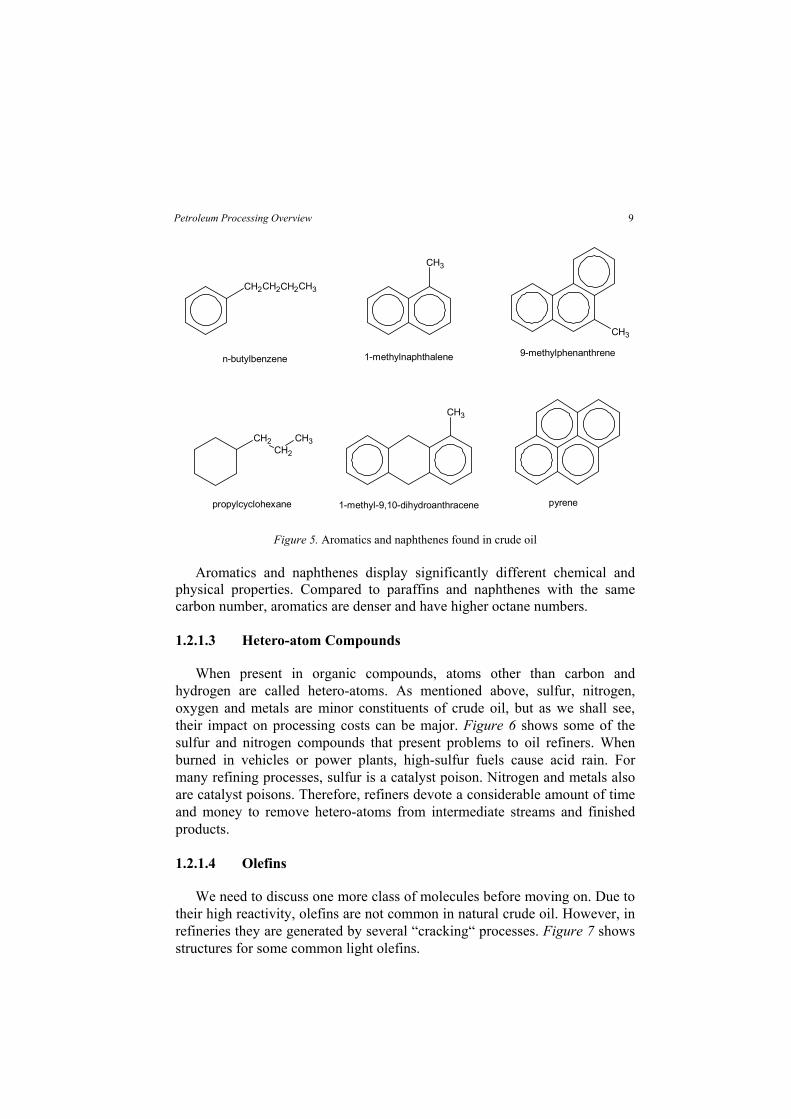
Figure 5 shows structures for a few of the aromatics and naphthenes that have been found in crude oils. For aromatics with one six-carbon ring, the general formula is CnH2n-6, and for naphthenes with one ring, the general formula is CnH2n.
8 Robinson
CH2CH2CH2CH3
CH3
CH2CH2
CH3
propylcyclohexane
1-methylnaphthalene
CH3
9-methylphenanthrene
CH3
1-methyl-9,10-dihydroanthracene
Figure 5. Aromatics and naphthenes found in crude oil
Aromatics and naphthenes display significantly different chemical and physical properties. Compared to paraffins and naphthenes with the same carbon number, aromatics are denser and have higher octane numbers.
1.2.1.3 Hetero-atom Compounds
When present in organic compounds, atoms other than carbon and hydrogen are called hetero-atoms. As mentioned above, sulfur, nitrogen, oxygen and metals are minor constituents of crude oil, but as we shall see, their impact on processing costs can be major. Figure 6 shows some of the sulfur and nitrogen compounds that present problems to oil refiners. When burned in vehicles or power plants, high-sulfur fuels cause acid rain. For many refining processes, sulfur is a catalyst poison. Nitrogen and metals also are catalyst poisons. Therefore, refiners devote a considerable amount of time and money to remove hetero-atoms from intermediate streams and finished products.
1.2.1.4 Olefins
We need to discuss one more class of molecules before moving on. Due to their high reactivity, olefins are not common in natural crude oil. However, in refineries they are generated by several “cracking“ processes. Figure 7 shows structures for some common light olefins.
n-butylbenzene
pyrene
9Petroleum Processing Overview

quinoline
dibenzothiophenemethy propyl sulfide 3-methylthiacyclohexane
carbazole
N
CH3
SCH2
CH2CH3 S
CH3
S
NH
NH
O
2(1H) quinolin-one
V
NN
N N
CH3 R
CH3 CH3
CH3
C2H5
C2H5
C2H5
O
O
Vanadium-containing porphyrinR = -CH3, -C2H5, etc.
Figure 6. Hetero-atom compounds found in crude oil
C4H8
trans-2-butene
C4H8
isobutene
C5H10
trans-2-pentene
C5H10
isopentene
CH3
CHCH
CH3
CH3
CHCH
CH2CH3
C CH
CH3
CH3
CH3
CH2C
CH3
CH3
C2H4
ethyleneC3H6
propylene
CH2 CH2 CH2
CHCH3
Figure 7. Selected light olefins
10 Robinson

1.3 History of Petroleum Processing
These days, it’s extremely rare for oil to flow out of a well already fit for the market as it did in the 1860s near Oil Creek, Pennsylvania.12 Crudes from the Tapis field in Malaysia are almost good enough for direct use in diesel engines, but even these high-quality “boutique crudes” are sent to refineries for separation into higher-value components.
As mentioned in Section 1.1, in the 1860s the most valuable crude-oil fraction was kerosene. From the first crude distillation units – which truly were crude, comprising cast-iron kettles, water-cooled coils and wooden product-collection vats – part of the lightest fraction (naphtha) was sold as a solvent, but most of it was burned off. Distillates heavier than kerosene (gas oils) found some use as lubricants, but the undistilled residues were discarded.
1.3.1 Demand for Conversion
The demand for petroleum remained relatively flat throughout the last half of the 19th Century. In 1878, thanks to the inventions of Thomas Edison, electric lighting slowly but surely began to displace kerosene as a preferred illuminant. (Table 5)
But the biggest blow to kerosene came from the gasoline-powered automobile. Developed in 1889 by Gottlieb Daimler, Wilhelm Maybach, and (separately) by Karl Benz, the motor car was a curiosity until 1901, when Ransom Eli Olds started assembly-line production of the Curved Dash Oldsmobile Runabout.19
Henry Ford built his first gasoline-powered car in 1896 and founded the Ford Motor Company in 1903. In 1908 he began selling Model T s for the low, low price of US$950. The resulting boom in automobile sales triggered tremendous growth in petroleum demand, which continued unabated until the Arab Oil Embargo of 1973. Over 15 million Model T Fords were sold in the United States alone between 1908 and 1917, with prices as low as US$280 per unit.19
In addition to increasing the overall demand for petroleum, the advent of the automobile increased the relative demand for naphtha (from which gasoline is derived) versus kerosene. In response, refiners developed conversion processes. The first of these was the thermal cracking process patented by William Burton and Robert Humphreys, who were working for Standard Oil of Indiana. The Burton-Humphreys process doubled the yield of gasoline from crude oil, and it is credited for averting a gasoline shortage during World War I. Moreover, gasoline from thermal crackers performed better in automobiles than straight-run products distilled from crude petroleum.
11Petroleum Processing Overview
’

Table 5. Significant Events in Petroleum Processing, 1861 – 2000 Date Description 1878 Thomas Edison invents the light bulb. The use of kerosene lamps starts to decline. 1889 Gottlieb Daimler, Wilhelm Mayback and (separately) Karl Benz build gasoline-
powered automobiles. 1901 Ransom E. Olds begins assembly-line production of the Curved Dash Oldsmobile. 1908 Ford Motor Company offers Model T‘s for US$950 each. 1912 William Burton and Robert Humphreys develop thermal cracking. 1913 Gulf Oil builds the world’s first drive-in filling station in Pittsburgh, Pennsylvania. 1919 1929 Standard Oil of Indiana (now BP) commercializes the Burton process for delayed
coking at Whiting, Indiana. 1933 UOP introduces the catalytic polymerization of olefins to form gasoline. 1934 Eugene Houdry, working for Sun Oil, patents Houdry Catalytic Cracking (HCC). 1938 A consortium of refiners develops sulfuric acid alkylation, which is first
commercialized at the Humble (now ExxonMobil) refinery in Baytown, Texas. 1940 Phillips develops HF alkylation. 1942 Standard Oil of New Jersey (now ExxonMobil) commercializes the FCC process at
Baton Rouge, Louisiana. 1949 Old Dutch Refining in Muskegon, Michigan starts the world’s first catalytic reformer
based on the UOP Platforming processes. 1950 Catalytic hydrotreating is patented by Raymond Fleck and Paul Nahin of Union Oil. 1960s UOP introduces C4 and C5/C6 isomerization processes. 1961 Standard Oil of California (now Chevron) introduces catalytic hydrocracking. 1970 The world celebrates Earth Day. The newly created U.S. Environmental Protection
Agency passes the Clean Air Act, which requires a 90% reduction in auto emissions by 1975. The European Union issues similar requirements.
1972 Mobil invents ZSM-5. During the next three decades, this shape-selective catalyst finds uses in numerous processes, including FCC, catalytic dewaxing, and the conversion of methanol to gasoline.
1975 The catalytic converter goes commercial. The phase-out of tetraethyl lead begins. 1990 The U.S. Congress issues the Clean Air Act Amendments of 1990, which lay the
framework for reformulated gasoline and low-sulfur diesel. 1990s Several processes are developed to remove sulfur from gasoline. These include
SCANfining (Exxon), OCTGAIN (Mobil), Prime G (Axens), and S Zorb (Phillips). 1993 Chevron commercializes Isodewaxing for converting waxy paraffins into high-quality
lube base stock. 2000 The European Commission issues the Auto Oil II report, which includes a timetable
for low-sulfur gasoline and ultra-low-sulfur diesel. In 1914, Jesse A. Dubbs and J. Ogden Armour founded the National
Hydrocarbon Company, which later became Universal Oil Products (UOP).20 UOP grew to become the world’s largest licensor of process technology for the oil refining industry. In 1919, UOP commercialized the Dubbs process, which solved some of the problems associated with the Burton-Humphreys process. The Dubbs process produced fewer coke deposits, it could process heavier petroleum fractions, and it ran longer between shutdowns.
Standard Oil of Indiana commercialized the delayed coking process at Whiting, Indiana in 1929. In 1933, UOP commercialized the conversion of olefins to gasoline via catalytic polymerization. Later in the 1930s, refiners began using tetraethyl lead to boost the octane of gasoline. A consortium of
12 Robinson
UOP commercializes the Dubbs thermal cracking process.

refining companies – Anglo-Iranian, Humble, Shell Oil, Standard Oil, and Texaco – developed sulfuric acid alkylation, which was commercialized in 1938 at the Humble (now ExxonMobil) refinery in Baytown, Texas. In 1940, Phillips Petroleum (now ConocoPhillips) developed HF alkylation.
Eugene Houdry patented the Houdry Catalytic Cracking (HCC) process in 1934. HCC was commercialized in 1937. With amazing foresight, Houdry also invented the catalytic converter, which started appearing on automobiles in the 1970s.
In 1942, Standard Oil of New Jersey (now ExxonMobil) commercialized
refiner’s ability to convert heavy gas oils into gasoline. The four inventors of this process, which still produces more than half of the world’s gasoline, were Donald L. Campbell, Homer Z. Martin, Eger V. Murphree, and Charles W. Tyson. During 1942-45, several FCC-based refineries were built in the United
After 1945, the development of new refining processes was stimulated by a continuing increase in demand for petroleum products, coupled with the increased availability of oil from the Middle East and elsewhere. The quality of gasoline got a large boost from catalytic reforming, which first appeared in 1949 at the Old Dutch refinery in Muskegon, Michigan. The unit was based on technology developed by UOP, which employed a platinum-based catalyst invented by Vladimir N. Ipatieff.
In 1961, hydrocracking was introduced to convert gas oil into naphthene-rich heavy naphtha, which is a superb feed for a catalytic reformer. The first unit used the Isocracking process developed by Standard Oil of California
1.3.2 Demand for a Clean Environment
In 1970, President Richard M. Nixon established the U.S. Environmental Protection Agency (EPA) and the U.S. Congress passed the Clean Air Act (CAA). The CAA required a 90% reduction in auto emissions by 1975. The scope and timing of this requirement presented a challenge to the automobile industry.21 After reviewing several alternatives, auto makers focused on developing catalytic converters to remove carbon monoxide and hydrocarbons from automobile exhaust. Also in 1970, the European Union issued directive 70/220/EEC, which specified similar emission limits for passenger cars.
Lead poisons the active metal (platinum) in catalytic converters, so in 1975 EPA promulgated a phase-out plan to remove lead from gasoline.
In the 1990s and 2000s, the California Air Resources Board (CARB), the U.S. EPA and the European Commission promulgated requirements for reformulated gasoline, low-sulfur diesel, low-sulfur gasoline and ultra-low-sulfur diesel (ULSD). ULSD will enable the use of advanced emission
13Petroleum Processing Overview
States to produce automotive and aviation gasoline during World War II.
(now Chevron Texaco).
the fluidized catalytic cracking (FCC) process, which dramatically increased a

controls (including catalytic converters) on diesel-powered cars and trucks. Refiners are responding by installing additional hydrotreating capacity.
1.4 Modern Petroleum Processing
All refineries are different. They have different histories, locations, and market drivers. Therefore, no single illustration can capture all of the possible combinations and permutations of the processes that fit together to comprise an oil refinery. But despite their differences, most refineries perform the seven basic operations named in Table 6.
Table 6. Seven Basic Operations in Petroleum Processing Separation Combination
• Distillation • Catalytic polymerization • Solvent refining • Alkylation
Conversion Treating, finishing, blending • Carbon removal • Gasoline, kerosene and diesel • Hydrogen addition • Lubes and waxes
Reforming • Asphalt • Catalytic reforming Protecting the Environment • Steam/hydrocarbon reforming • Waste water treatment
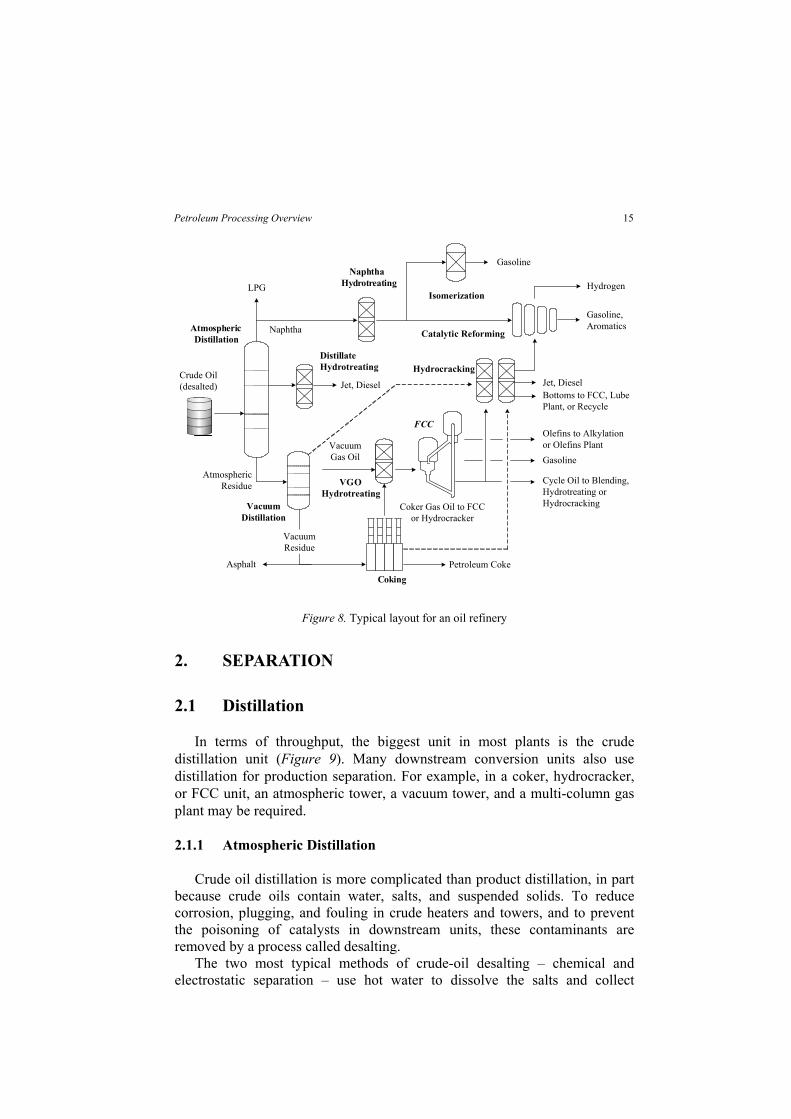
Rearrangement • Disposal of solids • Isomerization • Sulfur recovery Figure 8 shows a simplified layout for a high-conversion refinery in the
United States. The diagram doesn’t show product blending and sulfur recovery units, but these are almost always present. Lube-oil processing and hydrogen production units also may be present.
The depicted plant is configured for maximum fuels production. In a typical European refinery, the coker would be replaced with a visbreaker. In many Asian refineries, where diesel demand is higher than gasoline demand, the coker would be replaced by a visbreaker and the FCC by a hydrocacker.
The rest of this chapter provides a brief overview of the processes shown or mentioned above. The chapters that follow provide detailed process descriptions, with emphasis on recent developments. General information on refining technology can be found in the excellent books by E.I. Shaheen,22 and W.L. Leffler,23 and in a manual published by the U.S. Occupational Safety and Health Administration.24 Each year, Hydrocarbon Processing compiles a widely read refining process handbook, which gives descriptions of about 120 licensed processes offered by engineering contractors, oil companies, and of course process licensors.25
14 Robinson
Gasoline,AromaticsAtmospheric
Distillation
FCC
Crude Oil(desalted)
Hydrogen
Jet, DieselJet, Diesel
Gasoline
Cycle Oil to Blending,Hydrotreating orHydrocracking
Petroleum Coke
Naphtha
VacuumDistillation
Naphtha
Distillate
Olefins to Alkylationor Olefins Plant
Isomerization
Gasoline
Asphalt
LPG
VacuumGas Oil
VacuumResidue
AtmosphericResidue
Coker Gas Oil to FCCor Hydrocracker
Bottoms to FCC, LubePlant, or Recycle
Figure 8. Typical layout for an oil refinery
2. SEPARATION
2.1 Distillation
In terms of throughput, the biggest unit in most plants is the crude distillation unit (Figure 9). Many downstream conversion units also use distillation for production separation. For example, in a coker, hydrocracker, or FCC unit, an atmospheric tower, a vacuum tower, and a multi-column gas plant may be required.
2.1.1 Atmospheric Distillation
Crude oil distillation is more complicated than product distillation, in part because crude oils contain water, salts, and suspended solids. To reduce corrosion, plugging, and fouling in crude heaters and towers, and to prevent the poisoning of catalysts in downstream units, these contaminants are removed by a process called desalting.
The two most typical methods of crude-oil desalting – chemical and electrostatic separation – use hot water to dissolve the salts and collect
Hydrotreating
Hydrotreating
15Petroleum Processing Overview
HydrocrackingHydrotreating
Catalytic Reforming
Coking
VGO

suspended solids. In chemical desalting, water and surfactants are added to the crude, heated to dissolve salts and other impurities, and then sent to a settling tank where the water and oil separate. In electrostatic desalting, chemicals are replaced with a strong electrostatic charge, which drives the separation of water from oil.
Figure 9. Crude distillation
Modern crude distillation towers can process 200,000 barrels of oil per day. They can be up to 150 feet (50 meters) tall and contain 20 to 40 fractionation trays spaced at regular intervals. In some towers, the trays in the top section are replaced with structured packing.
Before reaching the tower, desalted oil goes through a network of pre-heat exchangers to a fired heater, which brings the temperature up to about 650°F (343°C). If the oil gets much hotter that this, it starts to crack and deposit carbon inside the pipes and equipment through which it flows. The hot crude enters the distillation tower just above the bottom. Steam is added to enhance separation; it does so largely by decreasing vapor pressure in the column.
When hot oil enters the tower, most of it vaporizes. Unvaporized heavy fuel oil and/or asphalt residue drops to the bottom of the tower, where it is drawn off. The vapors rise through the distillation trays, which contain perforations and bubble caps (Figure 10). Each tray permits vapors from below to bubble through the cooler, condensed liquid on top of the tray. This
16 Robinson
kramesh
Rectangle

provides excellent vapor/liquid contacting. Condensed liquid flows down through a pipe to the hotter tray below, where the higher temperature causes re-evaporation. A given molecule evaporates and condenses many times before finally leaving the tower.
Products are collected from the top, bottom and side of the column. Side-draw products are taken from trays at which the temperature corresponds to the cutpoint for a desired product. In modern towers, a portion of each side-draw stream is returned to the tower to control tray temperatures and further enhance separation. Part of the top product is also returned; this “reflux” flow plays a major role in controlling temperature at the top of the tower.
Bottom ProductReboiler Heater
Vapor fromReboiler
Hot Feed
OverheadVapor
Condenser
Reflux Top Product
Side-draw Product
Vapors
Liquids
Figure 10. Distillation column with bubble-cap trays
After leaving the tower, product streams go to holding tanks or directly to downstream process units. As shown in Figure 9 and Table 7, products can include heavy fuel oil, heating oil, kerosene, gasoline, and uncondensed gases.
17Petroleum Processing Overview

Table 7. Destinations for Straight-Run Distillates Approx. Boiling Range Next Ultimate Fraction °C °F Destination Product(s) LPG -40 to 0 -40 to 31 Sweetener Propane fuel Light Naphtha 39 - 85 80 - 185 Hydrotreater Gasoline Heavy Naphtha 85 - 200 185 - 390 Cat. Reformer Gasoline, aromatics Kerosene 170 - 270 340 - 515 Hydrotreater Jet fuel, No. 1 diesel Gas Oil 180 - 340 350 - 650 Hydrotreater Heating Oil, No. 2 diesel Vacuum Gas Oil 340 - 566 650 - 1050 FCC Gasoline, LCO, gases Hydrotreater Fuel oil, FCC feed Lube Plant Lube basestock Hydrocracker Gasoline, jet, diesel, FCC
feed, lube basestock Vacuum Residue >540 >1000 Coker Coke, coker gas oil Visbreaker Visbreaker gas oil, resid Asphalt Unit Deasphalted oil, asphalt Hydrotreater FCC feed
Table 8 shows that straight-run yields from various crude oils can differ
substantially. The naphtha content of Brent is twice as high as Ratawi, and its vacuum residue content is 60% lower. Bonny Light yields the most middle distillate and the least vacuum residue.
Table 8. Typical Straight-run Yields from Various Crudes26,27 Source field Brent Bonny Lt. Green Canyon Ratawi Country Norway Nigeria USA Mid East API gravity 38.3 35.4 30.1 24.6 Specific gravity 0.8333 0.8478 0.8752 0.9065 Sulfur, wt% 0.37 0.14 2.00 3.90
Yields, wt% feed Light ends 2.3 1.5 1.5 1.1 Light naphtha 6.3 3.9 2.8 2.8 Medium naphtha 14.4 14.4 8.5 8.0 Heavy naphtha 9.4 9.4 5.6 5.0 Kerosene 9.9 12.5 8.5 7.4 Atmospheric gas oil 15.1 21.6 14.1 10.6 Light VGO 17.6 20.7 18.3 17.2 Heavy VGO 12.7 10.5 14.6 15.0 Vacuum residue 12.3 5.5 26.1 32.9 Total naphtha 30.1 27.7 16.9 15.8 Total middle distillate 25.0 34.1 22.6 18.0
Atmospheric distillation of the best crudes yields about 60% naphtha plus
middle distillates (kerosene and gas oil), but the average is closer to 40%. In contrast, Table 9 shows that during 1991-2003, the United States consumed, on average, 70% of its petroleum as gasoline and middle distillates. This
18 Robinson

leaves a gap of about 30%, which is satisfied by converting residual oils into lighter products (Section 3). Table 9. Average U.S. Consumption of Petroleum Products, 1991-200328
Product Consumption (barrels/day) Percent of Total
Gasoline 8,032 43.6% Jet Fuel 1,576 8.6% Total Distillates 3,440 18.7% Residual Fuel Oil 867 4.8% Other Oils 4,501 24.4% Total Consumption 18,416 100% Sum of Gasoline, Jet, Distillates 13,048 70.8%
2.1.2 Vacuum Distillation
The residue from an atmospheric distillation tower can be sent to a vacuum distillation tower, which recovers additional liquid at 0.7 to 1.5 psia (4.8 to 10.3 kPa). The vacuum, which is created by a vacuum pump or steam ejector, is pulled from the top of the tower. Relative to atmospheric columns, vacuum columns have larger diameters and their internals are simpler. Often, instead of trays, random packing and demister pads are used.
The overhead stream – light vacuum gas oil – can be used as a lube base stock, heavy fuel oil, or as feed to a conversion unit. Heavy vacuum gas oil is pulled from a side draw. The vacuum residue can be use to make asphalt, or it can be sent to a coker or visbreaker unit for further processing.
2.2 Solvent Refining
Distillation splits a mixture into fractions according to the boiling points of the mixture constituents. In contrast, solvent refining segregates compounds
2.2.1 Solvent Deasphalting
19Petroleum Processing Overview
with similar compound types, such as paraffins and aromatics. The three maintypes of solvent refining are solvent deasphalting, solvent extraction, and solvent dewaxing.
com
used to precipitate asphaltenes from residual oils. Deasphalted oil (DAO) is sent to hydrotreaters, FCC units, hydrocrackers, or fuel-oil blending. In hydrocrackers and FCC units, DAO is easier to process than straight-run residual oils. This is because asphaltenes easily form coke and often contain catalyst poisons such as nickel and vanadium, and the asphaltene content of DAO is (by definition) almost zero.
Solvent deasphalting takes advantage of the fact that aromatic -pounds are insoluble in paraffins. Propane deasphalting is commonly

In traditional solvent deasphalting, residual oil and propane are pumped to an extraction tower at 150 to 250°F (65 to 120°C) and 350 to 600 psig (2514 to 4240 kPa). Separation occurs in a tower, which may have a rotating disc contactor (Figure 11). Liquid products are evaporated and steam stripped to recover the propane solvent, which is recycled.
An advanced version of solvent deasphalting is “residuum oil supercritical extraction,” or ROSE. The ROSETM Process was developed by the Kerr-McGee Corporation and now is offered for license by KBR Engineering and Construction, a subsidiary of Halliburton. In this process, the oil and solvent are mixed and heated to above the critical temperature of the solvent, where the oil is almost totally insoluble. Advantages include higher recovery of deasphalted liquids, lower operating costs due to improved solvent recovery, and improved energy efficiency. The ROSE process can employ three different solvents, the choice of which depends upon process objectives:
Propane: Preparation of lube base stocks Butane : Asphalt production Pentane: Maximum recovery of liquid
2.2.2 Solvent Extraction
Solvent extraction is used to remove aromatics and other impurities from lube and grease stocks. The feedstock is dried, then contacted with the solvent in a counter-current or rotating disk extraction unit (Figure 11). The solvent is separated from the product stream by heating, evaporation, or fractionation. Remaining traces of solvent are removed from the raffinate by steam stripping or flashing. Electrostatic precipitators may be used to enhance separation of inorganic compounds. The solvent is then regenerated and recycled.
Feed
Raffinate(lube oil)
Extractedaromatics
Extract andSolvent
Solvent Solvent
Rotating DiskExtractor
SolventEvaporator
SolventEvaporator
Heater
Heater
Figure 11. Rotating-disk solvent extraction
20 Robinson

Today, phenol, furfural, and cresylic acid are widely used as solvents. In
the past, some refiners installed the Edeleanu process, in which the solvent is liquid sulfur dioxide, but the hazards of potential leaks made it undesirable. Chlorinated ethers and nitrobenzene also have been used.
2.2.3 Solvent Dewaxing, Wax Deoiling
Solvent dewaxing removes wax (normal paraffins) from deasphalted lube base stocks. The main process steps include mixing the feedstock with the solvent, chilling the mixture to crystallize wax, and recovering the solvent. Commonly used solvents include toluene and methyl ethyl ketone (MEK). Methyl isobutyl ketone (MIBK) is used in a wax deoiling process to prepare food-grade wax.
3. CONVERSION
As mentioned in Section 1.1, the decreased use of kerosene lamps (thanks to Thomas Edison) coupled with rising demand for automotive gasoline provided incentives to convert kerosene and other heavier fractions into gasoline.
Table 10 illustrates the fundamental principle behind conversion. For a given class of hydrocarbons, “lighter” means lower molecular weight, lower boiling point, lower density, and higher hydrogen-to-carbon ratios (H/C). Methane, the lightest hydrocarbon, has an H/C of 4.0. Benzopyrene has an H/C of 0.6. The H/C of commonly used crude oils ranges from 1.5 to 2.0, and the H/C for asphaltenes is 1.15.
Table 10. Molecular Weight, H/C and Boiling Point for Selected Hydrocarbons Molecular Boiling Point
Compound Weight Formula H/C °C °F Paraffins
Methane 16.04 CH4 4.0 -164 -263.2 Ethane 30.07 C2H6 3.0 -88.6 -127.5 Propane 44.10 C3H8 2.67 -42.1 -43.7 Butane (iso) 58.12 C4H10 2.50 -6.9 19.6 Octane (iso) 114.23 C8H18 2.25 99.2 210.6 Cetane (normal) 226.44 C16H34 2.13 287 548.6
Aromatics Benzene 78.11 C6H6 1.0 80.1 176.2 Naphthalene 128.17 C10H8 0.8 218 424.4 Benzopyrene 252.32 C20H12 0.6 – –
Most conversion processes – FCC, thermal cracking, and deasphalting –
increase the H/C by rejecting carbon. A few processes – hydrotreating to a small extent and hydrocracking to a great extent – increase the H/C by adding hydrogen. In this context, “rejecting carbon” does not mean that a little bit of
21Petroleum Processing Overview

carbon is removed from every molecule. Rather, it means that heavy molecules are split (“cracked”) into a smaller molecule with a higher H/C and another smaller molecule with a lower H/C. Molecules with low H/C – polyaromatic hydrocarbons (PAH) – can condense to form coke (Figure 12). Condensation reactions release hydrogen, lowering H/C even more.
3.1 Visbreaking
Visbreaking is a mild form of thermal cracking that achieves about 15% conversion of atmospheric residue to gas oils and naphtha. At the same time, a low-viscosity residual fuel is produced.
Visbreaking comes in two basic flavors – “short-contact” and “soaker.” In short-contact visbreaking, the feed is heated to about 900°F (480°C) and sent to a “soaking zone” (reactor) at 140 to 300 psig (1067 to 2170 kPa). The elevated pressure allows cracking to occur while restricting coke formation. To avoid over-cracking, the residence time in the soaking zone is short – several minutes compared to several hours in a delayed coker – and the hot oil is quenched with cold gas oil to inhibit further cracking and sent to a vacuum tower for product separation. “Soaker” visbreaking keeps the hot oil at elevated temperature for a longer time to increase the yield of middle distillates. The low-viscosity visbreaker gas oil can be sent to an FCC unit or hydrocracker for further processing, or used as heavy fuel oil.
3.2 Coking
Coking processes come in two basic forms – delayed coking, which is a semi-batch process, and fluid-bed coking, which is continuous.
3.2.1 Delayed Coking
In a delayed coker, vacuum residue feed is heated to about 900 to 970°F (487 to 520°C) and sent to a large coke drum. Cracking begins immediately, generating coke and cracked, vaporized products. Coke stays behind in the drum while the vapors rise to the top and flow to the product fractionator.
Liquid products include coker naphtha, light coker gas oil (LCGO), and heavy coker gas oil (HCGO). All of these require further processing due to
direct blending into finished products. The coker naphtha and LCGO are hydrotreated. The HCGO can go either to an FCC unit or a hydrocracker.
22 Robinson
their high olefins content, which makes them unstable and poorly suited for

2
propane
+ C3H82
cv cv
cv cv
cv
CH3
CH3
C14H16
n-butylnaphthalene
C22H16
dimethylbenzo(a)pyrene(coke precursor)
CH2CH2
CH2CH3
Figure 12. Representative thermal-cracking reaction. The reaction shown here is the sum of a condensation reaction, which generates hydrogen, and dealkylation, which consumes hydrogen.
Meanwhile, hot residue keeps flowing into the drum until it is filled with solid coke. To remove the coke, the top and bottom heads of the drum are removed. A rotating cutting tool uses high-pressure jets of water to drill a hole through the center of the coke from top to bottom. In addition to cutting the hole, the water also cools the coke, forming steam as it does so. The cutter is then raised, step by step, cutting the coke into lumps, which fall out the bottom of the drum. Typically, coke drums operate on 18- to 24-hour cycles, which include preheating the drum, filling it with hot oil, allowing coke and liquid products to form, cooling the drum, and decoking.
Coke can account for up to 30 wt% of the product. It can be shipped by rail, truck, or conveyor belt to a calciner, which converts green coke fresh from the drum into various grades of petroleum coke. Green coke can also be used for fuel.
Sponge Coke. Sponge coke is named for its sponge-like appearance. It is produced from feeds that have low-to-moderate asphaltene concentrations. If sponge coke meets certain specifications, it can be used to make carbon anodes for the aluminum industry. Otherwise, it is used for fuel. “Green” sponge coke must be calcined before it can be used for anodes. Fuel coke may not require calcination.
Needle Coke. Needle coke, named for its needle-like structure, is made from feeds that contain nil asphaltenes, such as hydrotreated FCC decant oils. Needle coke is a high-value product used to make graphite electrodes for electric-arc furnaces in the steel industry. At present (April 2004), needle coke fetches more than US$500 per ton, which is significantly greater than the US$40 to US$45 per ton price for metallurgical coke exported from the United States.
Shot Coke. Shot coke is an undesirable product because it is inconsistent and in some cases dangerous. It is produced when the concentration of feedstock asphaltenes and/or coke-drum temperatures are too high. Excessive feedstock oxygen content can also induce its formation.
Shot coke begins to form as the oil flows into the coke drum. As light ends flash away, small globules of heavy tar are left behind. These globs of tar
23Petroleum Processing Overview
H2
coke rapidly grow due to the heat produced by asphaltene polymerization, producing discrete mini-balls 0.1 to 0.2 inches (2 to 5 mm) in diameter. In the center of the drum, the mini-balls can stick together to form clusters as large as 10 inches (25 cm). On occasion, a cluster breaks apart when the coke drum is opened, spraying a volley of hot mini-balls in every direction. Adding aromatic feeds, such as FCC decant oil, can eliminate shot coke formation. Other methods of eliminating shot coke – decreasing temperature, increasing drum pressure, increasing the amount of product recycle – decrease liquid yields, which is not desired.
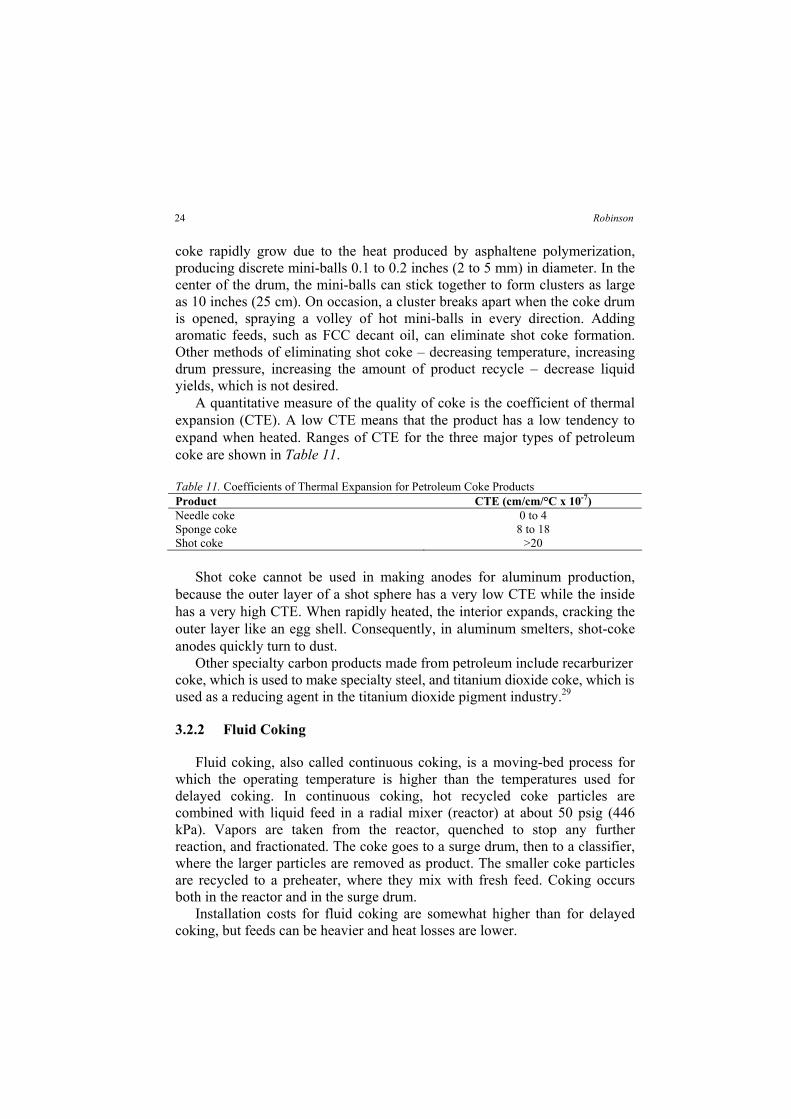
A quantitative measure of the quality of coke is the coefficient of thermal expansion (CTE). A low CTE means that the product has a low tendency to expand when heated. Ranges of CTE for the three major types of petroleum coke are shown in Table 11.
Table 11. Coefficients of Thermal Expansion for Petroleum Coke Products Product CTE (cm/cm/°C x 10-7) Needle coke 0 to 4 Sponge coke 8 to 18 Shot coke >20
Shot coke cannot be used in making anodes for aluminum production,
because the outer layer of a shot sphere has a very low CTE while the inside has a very high CTE. When rapidly heated, the interior expands, cracking the outer layer like an egg shell. Consequently, in aluminum smelters, shot-coke anodes quickly turn to dust.
used as a reducing agent in the titanium dioxide pigment industry.29
3.2.2 Fluid Coking
Fluid coking, also called continuous coking, is a moving-bed process for which the operating temperature is higher than the temperatures used for delayed coking. In continuous coking, hot recycled coke particles are combined with liquid feed in a radial mixer (reactor) at about 50 psig (446 kPa). Vapors are taken from the reactor, quenched to stop any further reaction, and fractionated. The coke goes to a surge drum, then to a classifier, where the larger particles are removed as product. The smaller coke particles are recycled to a preheater, where they mix with fresh feed. Coking occurs both in the reactor and in the surge drum.
Installation costs for fluid coking are somewhat higher than for delayed coking, but feeds can be heavier and heat losses are lower.
24 Robinson
Other specialty carbon products made from petroleum include recarburizer coke, which is used to make specialty steel, and titanium dioxide coke, which is

3.3 Fluid Catalytic Cracking
Fluid catalytic cracking (FCC) produces more that half the world’s gasoline. A typical FCC unit comprises three major sections – riser/reactor, regenerator, and fractionation. Table 12 provides important details on FCC.
Table 12. FCC in a Nutshell Purpose Convert heavy oils into gasoline and/or light olefins Licensors Axens (IFP) ExxonMobil
KBR Stone & Webster UOP
Catalysts and Additives Zeolite (highly acidic, catalyzes cracking) Rare-earth oxide (increases catalyst stability) ZSM-5 (increases octane and production of light olefins) Pt (promotes combustion of CO to CO2 in regenerator) Desox (transfers SOx from regenerator to riser/reactor)
Feeds Atmospheric gas oil Vacuum gas oil Coker gas oil Deasphalted oil Lube extracts Vacuum resid (up to 20 vol%)
Typical Feed Properties Nitrogen <3000 wppm Carbon residue <5.0 wt% Nickel + Vanadium <50 wppm 90% boiling point <1300°F (704°C)
Typical Process Conditions Feed temperature 300 – 700°F (150 – 370°C) Reactor temperature 920 – 1020°F (493 – 550°C) Regenerator temperature Catalyst/Oil ratio 4.0 – 10.0 Reactor pressure 10 – 35 psig (170 – 343 kPa)
Typical Product Yields Conversion 70 – 84 vol% H2, H2S, methane, ethane 3.0 – 3.5 wt% Propane and propylene 4.5 – 6.5 wt% Butanes and butenes 9.0 – 12.0 wt% Gasoline 44 – 56 wt% LCO 13 – 20 wt% Slurry oil 4 – 12 wt% Coke 5 – 6 wt% Total C3-plus 106 – 112 vol%
3.3.1 FCC Process Flow
Figure 13 shows a sketch for the riser/reactor section of an FCC unit. In the reaction section, preheated oil is mixed with hot, regenerated catalyst. The mixture acts as a fluid because the catalyst particles are small – about the size of sifted flour. The hot catalyst vaporizes the oil, and the vaporized oil carries the catalyst up the riser/reactor. A book by Magee and Dolbear30 provides
25Petroleum Processing Overview
1200 – 1350°F (650 – 732°C)

specific information on the manufacture and use of catalysts used for FCC and other refining processes.
The cracking reaction is very fast. It produces light gases, high-octane gasoline, and heavier products called light cycle oil (LCO), heavy cycle oil (HCO), slurry oil, and decant oil. It also leaves a layer of coke on the catalyst particles, making them inactive.
At the top of the riser, the temperature can reach 900 to 1020°F (482 to 549°C). The temperature at the riser outlet is a key factor in determining conversion and product selectivity, so FCC operators control it as tightly as possible. Higher temperatures favor production of olefin-rich light gas at the expense of gasoline, moderate temperatures favor gasoline production, and at lower temperatures gasoline yields decrease in favor of middle distillates.
In the disengaging section, steam is used to help separate the now-deactivated catalyst from the reaction products. The catalyst goes to the regenerator, where the coke is burned away by fluidized combustion in the presence of air. The hot catalyst at temperatures up to 1350°F (732°C) returns to the riser/reactor, where the cycle begins again.
In a 60,000 barrels-per-day unit processing a typical mixture of vacuum gas oils, the total catalyst in the unit (the “inventory”) is 400 to 500 tons. To maintain activity, about 0.5 to 1 wt% of the inventory is replaced each day. If the feed to the unit contains significant amounts of residue, the replacement rate is higher. The discharged catalyst is cooled and shipped either to a land fill for disposal or to another refiner, which may have a particular use for “conditioned” FCC catalyst.
3.3.2 Heat Balance
FCC units must be heat-balanced, or they won’t run. Understanding heat balance is the key to understanding how FCC variables interact. The burning of coke in the regenerator provides all of the heat required by the process. Table 13 gives a representative breakdown of FCC heat requirements.
Table 13. Breakdown of FCC Heat Requirements Heat-Consuming Event Percent of Total Heat up and vaporize fresh feed 40-50% Heat recycled oil 0-10% Heat of reaction (endothermic) 15-30% Heat steam 2-8% Heat losses 2-5% Heat air to regenerator temperature 15-25% Heat coke from the reactor to regenerator temperature 1-2% Total Heat Duty 500-1000 Btu/lb 1160-2325 kJ/kg
26 Robinson
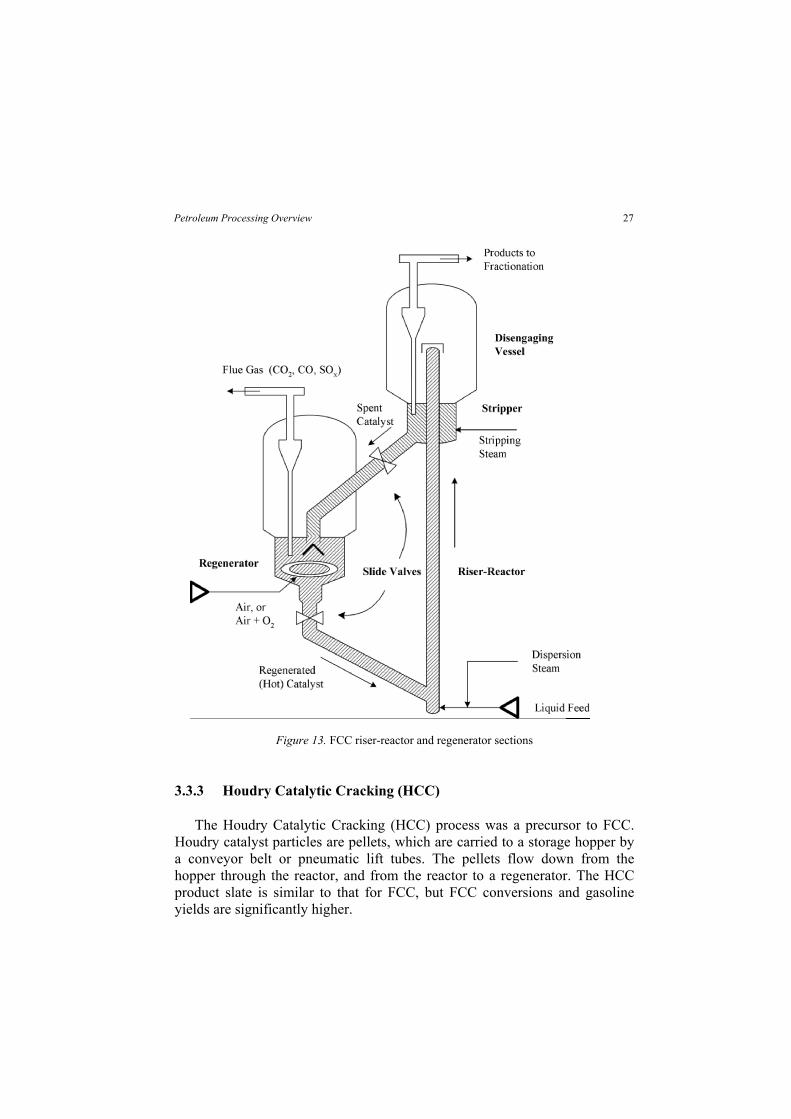
Figure 13. FCC riser-reactor and regenerator sections
3.3.3 Houdry Catalytic Cracking (HCC)
The Houdry Catalytic Cracking (HCC) process was a precursor to FCC. Houdry catalyst particles are pellets, which are carried to a storage hopper by a conveyor belt or pneumatic lift tubes. The pellets flow down from the hopper through the reactor, and from the reactor to a regenerator. The HCC product slate is similar to that for FCC, but FCC conversions and gasoline yields are significantly higher.
27Petroleum Processing Overview

3.3.4 Residue FCC
Many modern FCC units are designed to process significant amounts of vacuum residue. These units use catalyst coolers (e.g., steam coils) in the regenerator or a second regeneration zone to remove excess heat from the unit. This is because vacuum residue generates substantially more coke than conventional FCC feeds, and excess heat is generated when the extra coke is burned away from catalyst.
In vacuum residue, the metals content can be very high – sometimes more than 200 wppm nickel-plus-vanadium. In an FCC unit, these metals are bad news. Nickel increases coke formation and decreases liquid yields. Vanadium reduces conversion, decreases liquid yields, and destroys the catalyst. For these reasons, refiners pretreat the residue in a hydrotreater before sending it on to the FCC.
In addition to removing most of the Ni and V, the pretreater decreases the concentration of sulfur, nitrogen, and aromatics. In the FCC, part of the feed sulfur ends up in liquid products and part ends up as sulfur oxides (SOx) in the flue gas, so removing sulfur from the feed is beneficial. Removing nitrogen is beneficial because feed nitrogen suppresses FCC catalyst activity. Saturating feed aromatics increases FCC conversion by as much as 10 vol%. This alone can justify the cost of building the pretreater.
3.4 Hydrotreating and Hydrocracking
A modern petroleum refinery may have four or more hydrotreating units. Strictly speaking, hydrotreaters are not conversion units because the breaking of carbon-to-carbon bonds is minimal. However, it is convenient to discuss hydrotreating together with hydrocracking and mild hydrocracking because they employ similar catalysts and process flow schemes.
The key differences are presented in Table 14. Hydrocrackers tend to operate at higher pressure, using different catalysts, and with lower linear hourly space velocity (LHSV). LHSV is equal to the volume of feed per hour divided by the catalyst volume. A lower required LHSV means that a given volume of feed requires more catalyst. In terms of process conditions and conversion, mild hydrocracking lies somewhere between hydrotreating and full-conversion hydrocracking.
28 Robinson

Table 14. Comparison of Hydroteating, Hydrocracking and Mild Hydrocracking
H2 Partial Pressure Process, Feedstock Types psig kPa Conversion Hydroteating
Naphtha 250 – 300 1825 – 2170 0 – 5% LGO (Kerosene) 250 – 600 1825 – 4238 0 – 5% HGO (Diesel), LCO 600 – 800 4238 – 5617 5 -15% VGO, VBGO, CGO, HCO 800 – 2000 5617 – 13,890 5 -15% Residual Oil 2000 – 3000 13,890 – 20,786 5 -15%
Mild Hydrocracking VGO, VBGO, CGO, LCO, HCO 800 – 1500 5617 – 10,443 20 – 40%
Hydrocracking VGO, VBGO, CGO, LCO, HCO 1500 – 2000 10,443 – 13,890 60 – 99% Residual Oil 2000 – 3000 13,890 – 20,786 15 – 25% LGO = Light Gas Oil HGO = heavy Gas Oil LCO = FCC Light Cycle Oil HCO = FCC Heavy Cycle Oil VGO = Vacuum Gas Oil VBGO = Visbreaker Gas Oil CGO = Coker Gas Oil
3.4.1 Chemistry of Hydrotreating and Hydrocracking
To one extent or another, all of the chemical reactions listed in Table 15 occur in hydrotreaters and hydrocrackers. The reactions are discussed in
Table 15. List of Hydroteating and Hydrocracking Reactions Hydrotreating Hydrocracking (C-C bond breaking is minimal) (C-C bond breaking is significant) Hydrodesulfurization (HDS) Dealkylation of aromatic rings Hydrodenitrogenation (HDN) Opening of naphthene rings Hydrodemetallation (HDM) Hydrocracking of paraffins Saturation of aromatics Saturation of olefins Isomerization
3.4.2 Hydrotreating Process Flow
Figure 14 illustrates the process flow for a fixed-bed hydrotreater. At moderate-to-high pressure – 300 to 1800 psig (2170 to 12,512 kPa) – mixtures of preheated oil and hydrogen pass down over fixed beds of catalyst, in which the desired reactions occur.
29Petroleum Processing Overview
greater detail in Chapters 7-9.

Hydrotreating is exothermic (heat-releasing), so many commercial units comprise several catalyst beds separated by quench zones. In a quench zone, hot process fluids from the preceding bed are mixed with relatively cold, hydrogen-rich quench gas before passing to the next bed.
High-PressureSeparator
Low-PressureSeparator
Feed NH4SH(aq)
Make-UpHydrogen
H2S
To Stripper,Fractionator
High-PressureAmine Absorber
Air Cooler
To Gas Plant
Heater
Recycle GasCompressor
Wash Water
QuenchGas
Purge
Make-upCompressor
Figure 14. Gas-oil hydrotreating and once-through hydrocracking
HDS and HDN reactions produce H2S and NH3, respectively. Wash water is injected into the effluent from the last reactor to remove ammonia, which goes into the aqueous phase as ammonium bisulfide, NH4HS(aq). The NH4HS(aq) is rejected from the unit as sour water in downstream flash drums.
In the high-pressure flash drum, liquid products are separated from the hydrogen-rich gas, which is recycled to the reactors. In most hydrotreaters designed for deep desulfurization, H2S is removed from the recycle gas with a high-pressure amine absorber. The liquids go to a stripping column, which removes entrained H2S and other light gases. These go to a low-pressure amine absorber and then to either a gas plant or the refinery fuel-gas system.
Reactor
F/E HeatExchange
30 Robinson

The destination of the liquid is unit-specific. In some hydrotreaters, the
stripped liquid goes directly to product blending. In others, it goes to one or more fractionation towers.
Naphtha Hydrotreating. Heavy naphthas generally have low octane numbers, often less than 60 RON. To raise the octane, refiners use catalytic reforming units. Alternatively, heavy naphtha can go to an isomerization unit, which also makes high-octane products. In both reforming and isomerization, the catalysts are sulfur-sensitive, so a naphtha hydrotreater is used to lower the feed sulfur content, usually to <1 wppm. Some nitrogen is removed, too, which also is beneficial.
Table 16 provides additional details on hydrotreating.
Table 16. Hydrotreating in a Nutshell Purpose Sulfur removal (HDS) Nitrogen removal (HDN)
Olefin saturation Aromatic saturation (HDA) Metals removal
Licensors Axens (IFP) CDTECH Chevron Lummus (CLG) ExxonMobil Haldor-Topsoe KBR Shell Global Solutions UOP
Catalysts CoMo on γ-alumina for HDS NiMo or NiW on γ-alumina for HDS, HDN, aromatic saturation
Feeds Naphtha Kesosene Heavy gas oil Vacuum gas oil Coker gas oil Residual oils
Typical Process Conditions Reactor temperature 600 – 800°F (315 – 425°C) Reactor pressure 250 – 2000 psig (1825 – 13,890 kPa)
3.4.3 Hydrotreating Objectives
Catalytic hydrotreating removes contaminants from liquid petroleum fractions. It also saturates most olefins and many aromatic compounds. Sulfur, nitrogen, oxygen, and metals are the most troublesome impurities. If not removed, they can deactivate catalysts, contaminate finished products, and accelerate corrosion in downstream equipment.
Gasoline Hydrotreating. In the context of post-treating gasoline to meet recent sulfur specifications, Section 8.2.5 discusses gasoline hydrotreating. Temperatures and pressures are relatively mild, but the leading processes use multiple catalysts, multiple catalyst beds, and/or pre-fractionation to minimize loss of gasoline octane.
Kerosene Hydrotreating. Straight-run kerosene streams may not meet
31Petroleum Processing Overview
specifications for jet-fuel. By using mild hydrodearomatization (HDA) to convert some aromatic compounds into cleaner-burning naphthenes, low-severity
sulfur kerosene is used for home heating. In those regions, straight-run kerosene and other light gas oils usually must be hydrotreated.
hydrotreating can convert kerosene into jet fuel. In many parts of the world, low-

Diesel Hydrotreating. From 1991 in Sweden, 1995 in California, and 1998 in the rest of the U.S., hydrotreating was used to make diesel containing <500 wppm sulfur. Generally, diesel hydrotreaters operate at higher pressures than naphtha and kerosene units, and they often use different catalysts. These days, under pressure to make ULSD by the end of 2006, most U.S. refiners either have or will be (a) building new diesel hydrotreaters, (b) revamping existing units by changing catalysts, modifying reactor internals, adding a high-pressure H2S absorber, and/or adding a new reactor, or (c) converting other units to diesel service.
FCC Feed Pretreating: VGO, CGO, and VBGO. For hydrotreaters that prepare feed for conventional FCC units, removing nitrogen (HDN) from the feed is beneficial, because organic nitrogen (especially basic nitrogen) inhibits cracking by binding to the highly acidic active sites in FCC catalysts. The removal of sulfur (HDS) can reduce the size of, or eliminate the need for, FCC gasoline post-treating units. By converting aromatics to naphthenes (HDA), FCC feed pretreaters increase feed “crackability.” In FCC and other thermal cracking units, naphthenes convert to lighter products. But except for losing side chains, aromatics are rather inert. If anything, they tend to form polyaromatic hydrocarbons (PAH) and coke. Pretreaters also benefit FCC units by removing metals (primarily nickel and vanadium) and Conradson carbon (CCR). CCR correlates strongly with the tendency of a feed to form coke in a delayed coking unit. It also correlates with coke-formation in an FCC unit. By reducing feed CCR, a pretreater allows an FCC to operate at higher feed rates and/or higher conversion. If the feed rate stays constant, the conversion can increase by 10 to 20 vol%. The extent of the increase depends upon the properties of the raw feed and the conditions under which the feed is hydrotreated.
FCC Feed Pretreating: Residue. Originally, residue hydrotreaters were built to reduce the sulfur content of heavy fuel oil. These days, a large percentage of residue hydrotreaters are used to pretreat FCC feeds. Residue hydrotreating requires higher pressure, lower LHSV, and at least one hot flash drum after the reactors. Another main difference is the need to use one or more HDM catalysts to protect the HDS catalyst from metals such as nickel and vanadium. If not removed, Ni and V accelerate deactivation and the buildup of pressure-drop. In the Resid Unionfining process offered by UOP, HDM catalyst is loaded into a guard reactor upstream from the main reactors. In the RDS process offered by Chevron Lummus Global, an OCR (“onstream catalyst replacement”) or UFR (“up-flow reactor”) unit removes metals from the RDS feed. With OCR, a refiner can process residues containing 400 wppm metals (Ni + V).
Lube Hydrotreating. The mild hydrotreating (“hydrofinishing”) of lube oils improves color, odor, and stability by removing olefins, sulfides and mercaptans. Severe hydrotreating also removes aromatics, nitrogen, and refractory sulfur compounds.
32 Robinson

3.4.4 Hydrocracking
As shown in Table 14, the major difference between hydrotreating, hydrocracking, and mild hydrocracking is the extent to which conversion occurs. In a hydrocracking unit designed for high conversion of vacuum gas oil, the process flow is more complex. The unit probably operates at a much higher pressure. It may include an additional reactor, a hot high-pressure separator, and a multiple-column fractionation section. To achieve near-total conversion of fresh feed, unconverted oil may be recycled. Some details about hydrocracking are given in Table 17.
3.4.5 Hydrocracking Objectives
For a given hydrocracker, process objectives can include: • Maximum production of naphtha • Maximum production of middle distillate fuels • Flexibility to swing between production of naphtha and middle distillates • Production of ultra-clean lube base stocks • Production of olefin plant feeds.
3.4.6 Hydrocracker Feeds
Liquid feeds can be atmospheric or vacuum gas oils from crude distillation units; gas oils (light and heavy) from delayed cokers, fluid cokers, or visbreakers; and cycle oils (light and heavy) from FCC units.
3.4.7 Hydrocracking Process Flow
The process flow scheme in Figure 14 can describe a gas-oil hydrotreater, a mild hydrocracking, or a once-through high-conversion hydrocracker. In a hydrocracker, the first few beds are likely to contain hydrotreating catalyst while subsequent beds contain hydrocracking catalyst. In some hydrocrackers designed for maximum production of diesel fuel, all catalyst beds contain hydrocracking catalyst. Other hydrocracking process flow schemes are described in Chapters 7 and 8.
33Petroleum Processing Overview
Pyrolysis Gasoline Hydrotreating. Hydrotreating improves the qualityof pyrolysis gasoline (pygas), a by-product from olefins plants. In the past,due to its high octane, some pygas was blended into gasoline. Pygas containsdiolefins, which react with air to form gums. Mild hydrotreating convertsdiolefins into mono-olefins. This improves the stability of pygas.

3.4.8 Hydrocracker Products
Middle distillates (jet and diesel) from high-conversion hydrocrackers meet or exceed finished product specifications. The heavy naphtha, however, usually goes to a catalytic reformer for octane improvement. The fractionator bottoms from partial conversion units can be sent to an FCC unit, an olefins plant, or a lube plant.
Due to the fact that products from a hydrocracker are less dense than the feeds, the total volume of liquid products is greater than the feed volume by 10 to 30 vol%. This phenomenon is called volume swell.
Table 17. Hydrocracking in a Nutshell Purpose Convert heavy hydrocarbons into lighter hydrocarbons Uses for Unconverted Oil
FCC feed Lube base stock Olefin plant feed Recycle to extinction
Other Reactions Sulfur removal (HDS) Nitrogen removal (HDN) Olefin saturation Aromatic saturation
Licensors Axens (IFP) (IFP) Chevron Lummus ExxonMobil KBR Shell Global Solutions UOP
Catalysts NiMo on γ-alumina (HDS, HDN, aromatic saturation) NiMo or NiW on zeolite (hydrocracking) NiMo or NiW on amorphous silica-alumina (hydrocracking) Pd on zeolite (hydrocracking)
Feeds Heavy gas oil Vacuum gas oil Coker gas oil Residual oils
Typical Process Conditions Reactor temperature 600 – 800°F (315 – 425°C) Reactor pressure 1200 – 2500 psig (8375 – 17,338 kPa)
Range of Product Yields Conversion (once-through) 20 – 90 vol% Conversion (with recycle) 90 – 99 vol% fresh feed C4-plus naphtha Up to 120 vol% fresh feed Middle distillates Up to 90 vol% fresh feed Hydrogen consumption 1000 to 3000 scf/bbl 175 to 525 Nm3/m3
3.5 Ebullated Bed Units
In fixed-bed hydrocrackers designed to process VGO, residual oils in the feed can reduce catalyst cycle life if they contain even trace amounts of salts, asphaltenes, refractory carbon, trace metals (Fe, Ni, V), or particulate matter. As mentioned in Section 3.4.2, fixed-bed units designed to process residue remove metals and other contaminants with upstream guard beds or onstream catalyst replacement technology. In contrast, ebullated bed hydrocrackers can and do process significant amounts of residual oils. This is because fresh
34 Robinson

catalyst is added and spent catalyst is removed continuously. Consequently, catalyst life does not impose limitations on feed selection or conversion.
Ebullated bed processes are offered for license by Axens (IFP) ABB Lummus. In ebullated bed reactors, hydrogen-rich recycle gas bubbles up through a mixture of oil and catalyst particles to provide three-phase turbulent mixing. The reaction environment can be nearly isothermal, which improves product selectivity. At the top of the reactor, catalyst particles are disengaged from the process fluids, which are separated in downstream flash drums. Most of the catalyst goes back to the reactor. Some is withdrawn and replaced with fresh catalyst.
4. UPGRADING NAPHTHA
Gasoline is produced by blending several different refinery streams – butanes, straight-run gasoline, reformate, alkylate, isomerate, FCC gasoline, oxygenates, and others. This section gives an overview of the processes that either upgrade or generate gasoline blend stocks.
4.1 Catalytic Reforming
4.1.1 Catalytic Reforming Objectives
Catalytic reforming converts low-octane heavy naphtha into a high-octane product (reformate) that is an excellent gasoline blend stock. Reformate has a high content of BTX (benzene-toluene-xylene), so it also serves as a great source of aromatics for petrochemical plants.
In addition to making aromatic compounds, catalytic reformers produce hydrogen, which is used in hydrotreaters, hydrocrackers, and other hydrogen-addition processes.
4.1.2 Chemistry of Catalytic Reforming
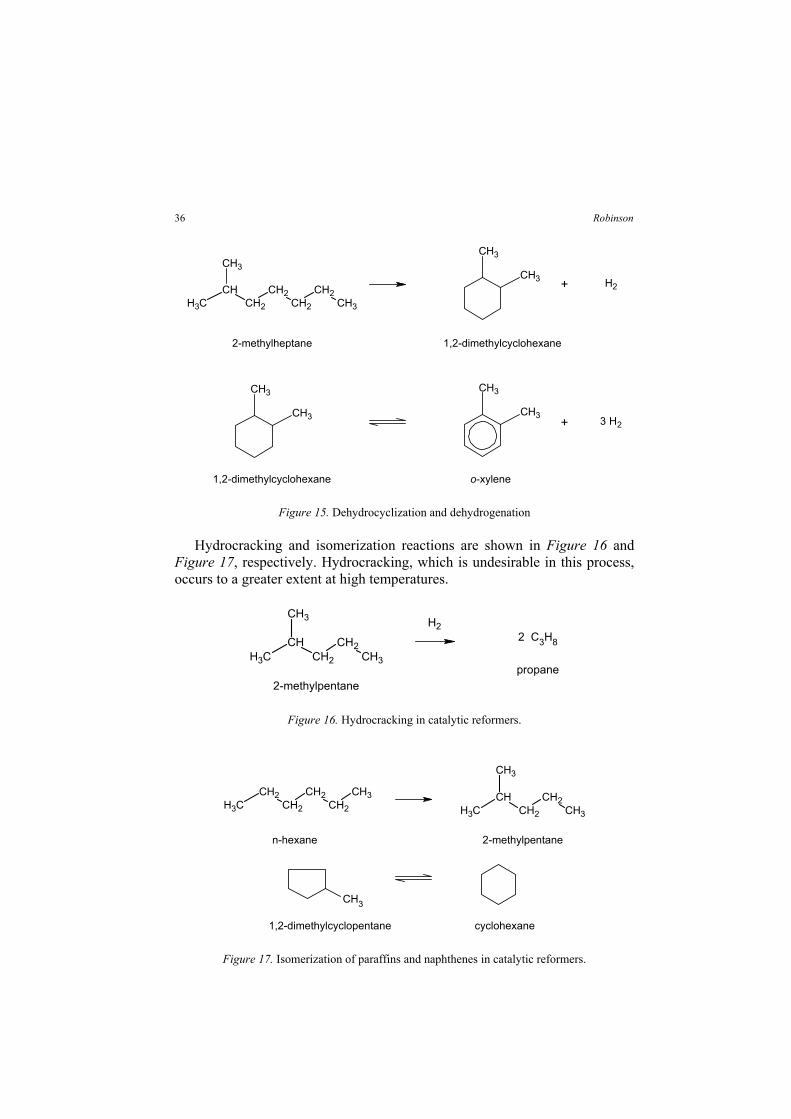
The chemistry of catalytic reforming includes the reactions listed in Table 18. All are desirable except hydrocracking, which converts valuable C5-plus molecules into light gases. The conversion of naphthenes to aromatics and the isomerization of normal paraffins provide a huge boost in octane. H2 is produced by dehydrocyclization of paraffins and naphthene dehydrogenation, which are shown in Figure 15.
Table 18. List of Catalytic Reforming Reactions Naphthene Reactions Paraffin Reactions Dehydrogenation to form aromatics Dehydrocyclization to form aromatics Isomerization to form different naphthenes Isomerization to form other paraffins Hydrocracking to form C4-minus
35Petroleum Processing Overview
2-methylheptane 1,2-dimethylcyclohexane
3
o-xylene
+ H2
+ 3 H2
1,2-dimethylcyclohexane
CH2
CH2CH3CH3
CHCH2
CH2
CH3
CH3
CH3
CH3
CH
CH3
CH3
Figure 15. Dehydrocyclization and dehydrogenation
Hydrocracking and isomerization reactions are shown in Figure 16 and Figure 17, respectively. Hydrocracking, which is undesirable in this process, occurs to a greater extent at high temperatures.
2-methylpentanepropane
CH3CH3
CHCH2
CH2
CH3
2 C3H8
H2
Figure 16. Hydrocracking in catalytic reformers.
2-methylpentanen-hexane
1,2-dimethylcyclopentane cyclohexane
CH2
CH3CH3
CH2CH2
CH2
CH3CH3
CHCH2
CH2
CH3
CH3
Figure 17. Isomerization of paraffins and naphthenes in catalytic reformers.
36 Robinson

Additional details about catalytic reforming are given in Table 19.
Table 19. Catalytic Reforming in a Nutshell Purpose Increase heavy-naphtha octane Other Produce aromatics (BTX) for petrochemical plants
Produce hydrogen Licensors Axens (IFP) BP
ExxonMobil UOP Catalysts Pt on γ-alumina Pt-Re on γ-alumina
Pt-Re-Sn on γ-alumina Promoters HCl Feeds Hydrotreated heavy naphtha, 40 to 62 RON Typical Process Conditions
H2/HC ratio Up to 6.0 Reactor inlet temperature 900 – 970°F (482 – 521°C) Pressure (Semi-regen., Cyclic) 200 – 500 psig (1480 – 3549 kPa) Pressure (CCR) 100 – 150 psig (791 – 1136 kPa)
Typical Product Yields and Properties Total C5-plus 84 to 85 vol% H2 production 650 – 1100 scf/bbl (115 – 195 Nm3/m3) RONC (Semi-regen., Cyclic) 85 to 95 RONC (CCR) Up to 105
4.1.3 Catalytic Reforming Catalysts
Catalytic reforming catalysts contain highly dispersed platinum (Pt), the activity of which is inhibited by sulfur. Therefore, an upstream hydrotreater lowers the sulfur content of reformer feeds to <1 wppm. In addition to Pt, modern multi-metallic catalysts contain highly dispersed rhenium (Re) and in some cases tin (Sn).
4.1.4 Process Flows
There are three major process flows for catalytic reforming: • Semi-regenerative • Cyclic • Continuous catalyst regeneration (CCR)
Figure 18 shows a semi-regenerative reformer, a fixed-bed unit in which catalyst cycles last from 6 to 12 months. A catalyst cycle ends when the unit is unable to meet its process objectives – typically octane and overall C5-plus yields. At the end of a cycle, the entire unit is brought down and catalyst is regenerated. In a cyclic reformer, catalyst cycles are shorter – 20 to 40 hours – but they are staggered so that only one reactor goes down at a time. In a CCR unit, the catalyst is slowly but constantly moving from the reactor to the regenerator and back again.
37Petroleum Processing Overview

In a semi-regenerative unit, desulfurized naphtha is mixed with hydrogen, heated to >900°F (>480°C) and passed through a series of fixed-bed reactors. The major chemical reactions – dehydrogenation and dehydrocyclization – are endothermic (heat absorbing), and the reactors themselves are essentially adiabatic. This means that heat can’t enter or leave except by the cooling or heating of reaction fluids. Consequently, the temperature drops as reactants flow through a reactor. Between reactors, fired heaters bring the process fluids back to desired reactor inlet temperatures.
RecycleGas
Make Gas
ReformateProduct
Feed
Figure 18. Semi-regenerative catalytic reforming
Some catalytic reformers operate at low pressure (100 psig, 791 kPa), while others operate at >500 psig (3549 kPa). Low operating pressure improves yields of aromatics and hydrogen, but it accelerates catalyst deactivation by increasing the rate at which coke forms on the catalyst. In a CCR reformer, the catalyst always is being regenerated, so increased coking is less problematic. Therefore, CCR units can operate at very low pressures. In most reformers, the feed is spiked with an organic chloride, which converts to hydrogen chloride (HCl) in the reactors. The HCl increases catalyst acidity and helps to minimize catalyst coking.
The effluent from the last reactor is cooled and sent to a separator, from which hydrogen-rich gas is removed and recycled to the reactors. The liquid product flows to a stabilizer column, where entrained gases are removed, before going to the gasoline blender or aromatics plant.
Heaters, Reactors
Naphtha
H2 - Rich Recycle GasCompressor
SeparatorHigh-Pressure
Stabilizer
38 Robinson

In a CCR unit (Figure 19), the hydrotreated feed mixes with recycle hydrogen and goes to series of adiabatic, radial-flow reactors arranged in a vertical stack. Catalyst flows down the stack, while the reaction fluids flow radially across the annular catalyst beds. The predominant reforming reactions are endothermic, so heaters are used between reactors to reheat the charge to reaction temperature. Flue gas from the fired heaters is typically used to generate steam.
Figure 19. CCR catalytic reforming
The effluent from the last reactor is cooled and sent to a separator. Part of the vapor is compressed and recycled to the reactors. The rest is compressed, combined with separator liquids, and sent to the product recovery section. Liquids from the recovery section go to a stabilizer, where light saturates are removed from the C6-plus aromatic products.
Partly deactivated catalyst is continually withdrawn from the bottom of the reactor stack and sent to the regenerator. As the catalyst flows down through the regenerator, the coke is burned away. Regenerated catalyst is lifted by hydro-gen to the top of the reactor stack. Because the reactor and regenerator sections are separate, each operates at its own optimum conditions. The regeneration section can be temporarily shut down for maintenance without affecting the operation of the reactor and product recovery sections.
39Petroleum Processing Overview
Regenerator Reactors Heater
Separator

4.2 Isomerization
4.2.1 Isomerization Objectives
As we have seen, isomerization occurs as a side-reaction in all conversion processes. But in refining, when we say “isomerization process,” we are referring specifically to the on-purpose isomerization of n-butane, n-pentane, and n-hexane. The main purpose of n-paraffin isomerization is to produce iso-paraffins with substantially higher octane numbers. An isomerization reaction for normal hexane was shown in Figure 17.
Some details about paraffin isomerization processes are given in Table 20.
Table 20. Isomerization in a Nutshell Purpose Convert n-butane to isobutane Convert n-pentane and n-hexane to branched isomers Licensor (C4) ABB Lummus Global BP UOP Licensors(C5C6) Axens (IFP) BP UOP Catalysts(C4) Pt on γ-alumina, HCl promoter Pt on zeolite Catalysts(C5C6) Pt on γ-alumina, HCl promoter Pt on zeolite Feeds(C4) dry n-butane Feeds(C5) Light straight-run, end point <160°F (71°C) Light reformate Light hydrocrackate Natural gasoline Light aromatics raffinate Process Conditions (Pt on alumina, chlorided) Reactor temperature 250 – 300°F (121 – 149°C) Reactor pressure 400 – 450 psig (2859 – 3204 kPa) Process Conditions (Pt on zeolite) Reactor temperature 445 – 545°F (230 – 285°C) Reactor pressure 190 – 440 psig (1411 – 3135 kPa) Conversion and Product Properties (C5C6) Conversion (with recycle) up to 97% RON 85 to 90
Section 8.2.1 lists octane numbers for heavy naphtha and some normal and
iso-paraffins. N-butane has a high octane number (92), so refiners blend as much of it as possible into gasoline. But n-butane also evaporates easily, which means that tighter restrictions on the RVP (volatility) of gasoline limit its C4 content (see Section 8.2.2). In many locales, this creates an excess of n-butane. By converting it into isobutane, which is consumed in alkylation units, refiners can reduce or eliminate this excess of n-butane.
40 Robinson

4.2.2 Isomerization Catalysts
The most common catalyst for isomerising n-butane is platinum (Pt) on alumina promoted by chloride. The high activity of this catalyst allows operation at relatively low temperature. This is beneficial because the reaction is controlled by equilibrium; at low temperature, equilibrium favors isobutane. Pt/alumina catalysts can’t be regenerated, and they are highly sensitive to water and other contaminants.
In units that isomerize n-pentane and n-hexane, the reactions are catalyzed either by Pt/alumina or Pt on zeolite. The zeolite catalysts require higher temperatures, but they are less sensitive to water. As with butane isomerization, the reactions are controlled by equilibrium, so lower reaction temperatures favor branched isomers. The high temperatures required by zeolite catalysts reduce the octane of the product relative to products made at lower temperatures with chlorided alumina catalysts.
4.2.3 Process Flow: C4 Isomerization
The feed to a butane (C4) isomerization unit should contain maximum amounts of n-butane and only small amounts of isobutane, pentanes, and heavier material. The feed is dried, combined with dry makeup hydrogen, and charged to the reactor section at 230 to 340° F (110 to 170°C) and 200 to 300 psig (1480 to 2170 kPa). H2 is not consumed by isomerization reactions, but it suppresses polymerization of the olefin intermediates that are formed during the reaction. A small amount of organic chloride promoter, which is added to maintain catalyst activity, converts completely to HCl in the reactors.
Often, two reactors in series are used to increase on-stream efficiency. The catalyst in one reactor can be replaced while the other continues to operate. The reactor effluent (isomerate) flows to a stabilizer. A caustic scrubber removes HCl from the separated light gases. The stabilized liquid product comprises a near-equilibrium mixture of n-butane and isobutanes, plus a small amount of heavier hydrocarbons. Losses due to cracking are less than 1 wt%.
The isomerate can be blended directly into gasoline or sent to an alkylation unit. N-butane from an alkylation unit can be recycled to a butane isomerization unit to achieve nearly total conversion of n-butane into isobutane or alkylate.
4.2.4 Process Flow: C5C6 Isomerization
Pentane/hexane (C5C6) isomerization processes increase the octane of light gasoline. In a typical unit, dried, hydrotreated feed is mixed with a small amount of organic chloride and recycled hydrogen, then heated to reaction temperature.
41Petroleum Processing Overview
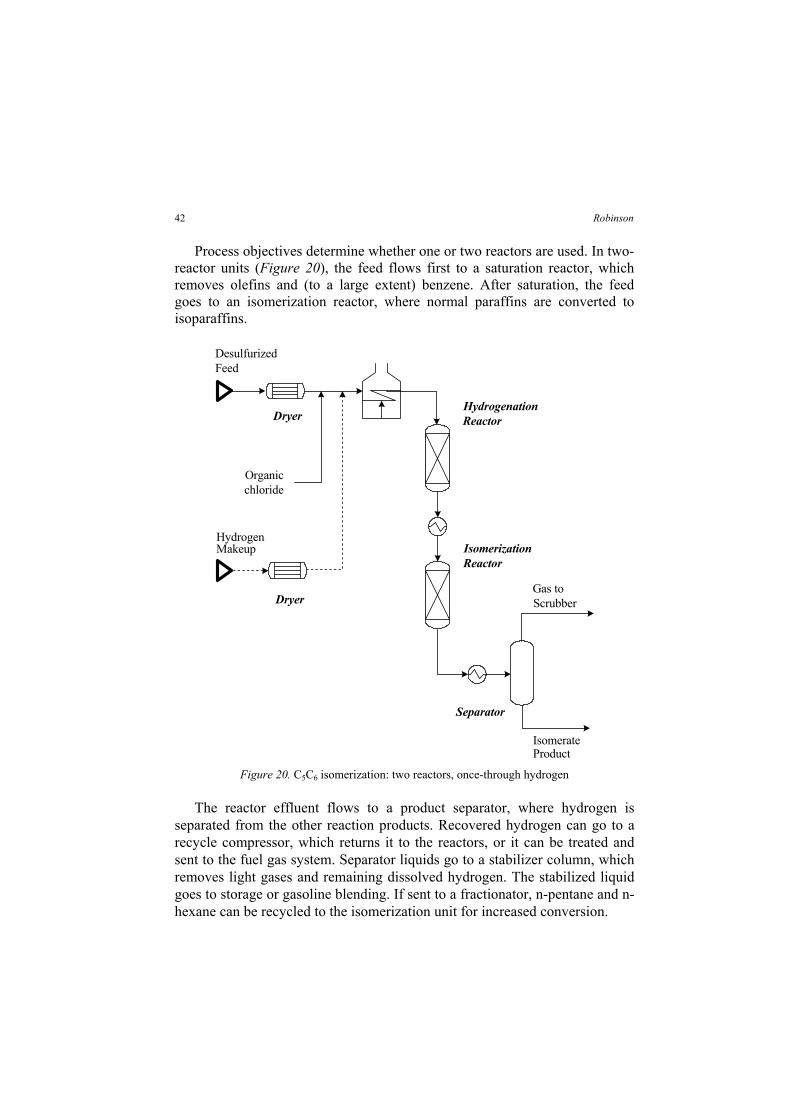
Process objectives determine whether one or two reactors are used. In two-reactor units (Figure 20), the feed flows first to a saturation reactor, which removes olefins and (to a large extent) benzene. After saturation, the feed goes to an isomerization reactor, where normal paraffins are converted to isoparaffins.
DesulfurizedFeed
Organicchloride
Hydrogen
HydrogenationReactor
IsomerizationReactor
Dryer
Separator
Dryer Scrubber
Figure 20. C5C6 isomerization: two reactors, once-through hydrogen
The reactor effluent flows to a product separator, where hydrogen is separated from the other reaction products. Recovered hydrogen can go to a recycle compressor, which returns it to the reactors, or it can be treated and sent to the fuel gas system. Separator liquids go to a stabilizer column, which removes light gases and remaining dissolved hydrogen. The stabilized liquid goes to storage or gasoline blending. If sent to a fractionator, n-pentane and n-hexane can be recycled to the isomerization unit for increased conversion.
42 Robinson
Gas to
Makeup
ProductIsomerate

4.3 Catalytic Oligomerization
4.3.1 Catalytic Oligomerization Objectives
Catalytic oligomerization also is called catalytic polymerization, catpoly, and catalytic condensation. The process converts C3 and C4 olefins into C6 to
9
6 8and 2,2,4-trimethylpentenes are greater than 97.
Variations on the process make higher olefins and aromatics such as cumeme for petrochemical applications. Figure 21 shows the main chemical reaction for the dimerization of isobutylene.
2
C4H8
isobutylene
CH3C
CH2
CH2
CHCH3
CH3
CH3C
CH3
CH2
C8H16
di-isobutylene
Figure 21. Dimerization of isobutylene
4.3.2 Catalysts
Sulfuric acid, phosphoric acid, and solid phosphoric acid on kieselguhr pellets (SPA) are used as catalysts. The SPA catalyst is non-corrosive, so it can be used in less-expensive carbon-steel reactors.
4.3.3 Process Flow
Figure 22 presents a sketch for a unit designed to use SPA catalysts. After pre-treatment to remove sulfur and other undesirable compounds, the olefin-rich feed is sent to the reactor. The reaction is exothermic, so temperatures are controlled by diluting the feed with product and by injecting relatively cold feedstock (quench) between beds in the reactor. Temperatures range from 300 to 450°F (150 to 230°F) and pressures range from 200 to 1,200 psig (1480 to 8375 kPa).
Reaction products go to stabilization and/or fractionator systems to separate gases – saturated and unsaturated C3-C4 compounds – from the liquid product. The gases are recycled to the reactor, and the liquid product goes to gasoline blending.
43Petroleum Processing Overview
C olefins, which are excellent gasoline blend stocks. Per Table 22, theresearch octane numbers for C and C olefins such as methyl-2-pentenes

Quench
Cat-PolyGasoline
Propane,ButaneRecycle Recycle
Propylene,ButyleneFeed
Figure 22. Catalytic oligomerization of olefins
4.4 Alkylation
4.4.1 Alkylation Objectives
Alkylation processes combine light olefins (primarily propylene and butylene) with isobutane in the presence of a highly acidic catalyst, either sulfuric acid or hydrofluoric acid. The product (alkylate) contains a mixture of high-octane, branched-chain paraffinic hydrocarbons. Figure 23 illustrates the reaction between isobutane and trans-2-butene. Alkylate is a highly desirable gasoline blend stock because, in addition to its high octane, it has a low vapor pressure. The octane of the product depends on the operating condition and the kinds of olefins used.
C4H8
trans-2-butene
CH3
CHCH
CH3
C4H10
isobutane
CH3CH
CH3
CH3
C8H18
isooctane
CH3
CCH2
CHCH3
CH3CH3
CH3
+
Figure 23. Alkylation of trans-2-butene
4.4.2 Process Flow: Sulfuric Acid Alkylation
In sulfuric acid (H2SO4) alkylation units, the feeds – propylene, butylene,
Reactor
Flash
Stabilizer
Drum
44 Robinson
amylene, and fresh isobutane – enter the reactor and contact sulfuric acid
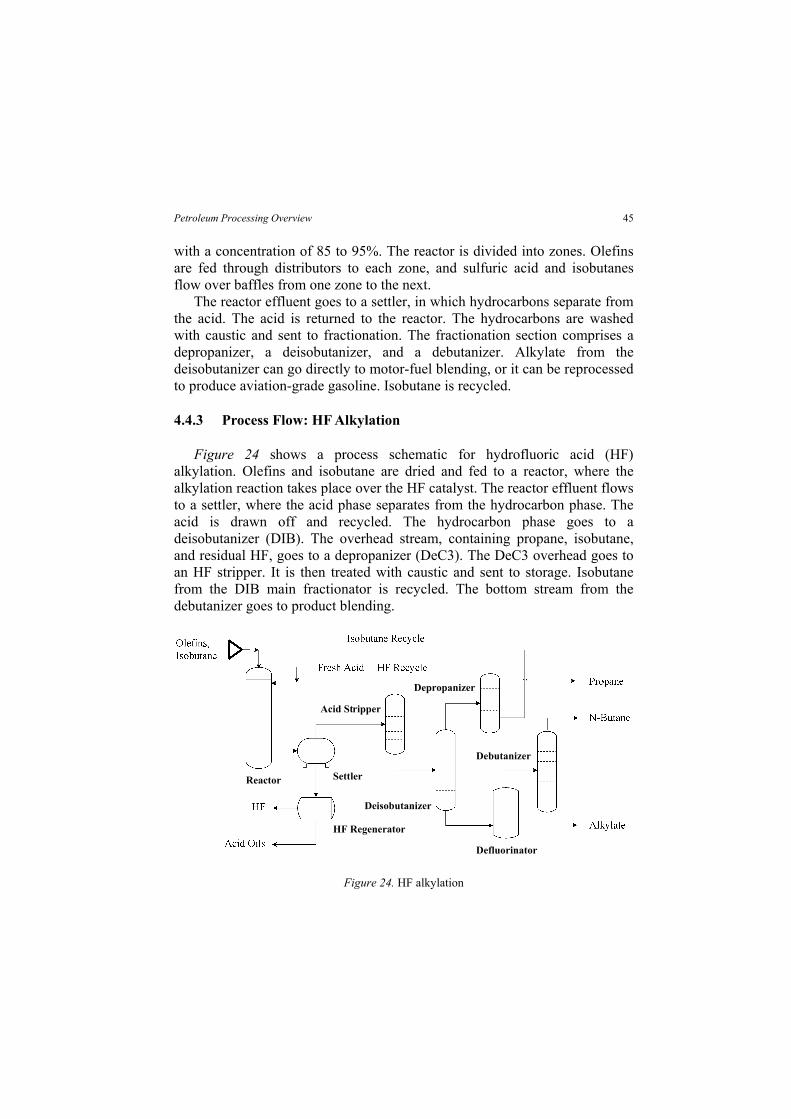
with a concentration of 85 to 95%. The reactor is divided into zones. Olefins are fed through distributors to each zone, and sulfuric acid and isobutanes flow over baffles from one zone to the next.
The reactor effluent goes to a settler, in which hydrocarbons separate from the acid. The acid is returned to the reactor. The hydrocarbons are washed with caustic and sent to fractionation. The fractionation section comprises a depropanizer, a deisobutanizer, and a debutanizer. Alkylate from the deisobutanizer can go directly to motor-fuel blending, or it can be reprocessed to produce aviation-grade gasoline. Isobutane is recycled.
4.4.3 Process Flow: HF Alkylation
Figure 24 shows a process schematic for hydrofluoric acid (HF) alkylation. Olefins and isobutane are dried and fed to a reactor, where the alkylation reaction takes place over the HF catalyst. The reactor effluent flows to a settler, where the acid phase separates from the hydrocarbon phase. The acid is drawn off and recycled. The hydrocarbon phase goes to a deisobutanizer (DIB). The overhead stream, containing propane, isobutane, and residual HF, goes to a depropanizer (DeC3). The DeC3 overhead goes to an HF stripper. It is then treated with caustic and sent to storage. Isobutane from the DIB main fractionator is recycled. The bottom stream from the debutanizer goes to product blending.
Figure 24. HF alkylation
45Petroleum Processing Overview
Acid Stripper
Depropanizer
Reactor
Deisobutanizer
HF Regenerator
Defluorinator
Debutanizer
Settler

5. LUBES, WAXES AND GREASES
“Bottom of the barrel” fractions – atmospheric and vacuum residues – can be converted by the processes described in Sections 2 and 3, or they can be used to make lubes, waxes and greases.
5.1 Lube Base Stocks
Refiners prepare lube base stocks from residual oils by removing asphaltenes, aromatics, and waxes. Lube base stocks are hydrofinished, blended with other distillate streams for viscosity adjustment, and compounded with additives to produce finished lubricants.
Solvent-based processes for removing asphaltenes, aromatics and waxes were discussed in Section 2.2. The next few paragraphs give a quick overview of catalytic dewaxing.
5.1.1 Catalytic dewaxing
process employs a shape-selective zeolite called ZSM-5, which selectively converts waxy n-paraffins into lighter hydrocarbons.
The Isodewaxing Process, commercialized in 1993 by ChevronTexaco, catalytically isomerizes n-paraffins into iso-paraffins. This decreases the wax content and increases the concentration low-viscosity hydrocarbons, both of which are desirable. Isodewaxing also removes sulfur and nitrogen, and it saturates aromatics. Products have a high viscosity index (VI), low pour point, and excellent response to additives.
Catalytic dewaxing and Isodewaxing are discussed in more detail in the second volume of this book.
5.2 Waxes
The raffinate from the solvent extraction unit in a traditional lube plant contains a considerable amount of wax. To recover the wax, the raffinate is mixed with a solvent, usually propane, and cooled in a series of heat exchangers. Further cooling is provided by the evaporation of propane in the chiller and filter feed tanks. The wax forms crystals, which are continuously removed, filtered, and washed with cold solvent. The solvent is recovered by flashing and steam stripping. The wax is purified by heating with hot solvent, after which it is re-chilled, re-filtered and given a final wash.
Paraffin waxes are used to make candles and coated papers for use as bread wrappers, cold-drink cups, and beverage cartons. They are also used in
46 Robinson
Catalytic dewaxing (CDW) was developed by Exxon Mobil in the 1980s. The

building materials. The market for packaging is declining, but other uses are on the rise, especially in construction.31
5.3 Greases
Greases are made by blending salts of long-chained fatty acids into lubricating oils at temperatures of 400 to 600°F (204 to 315°C). Antioxidants are added to provide stability. Some greases are batch-produced, while others are made continuously. The characteristics of a grease depend to a great extent on the counter-ion (calcium, sodium, aluminum, lithium, etc.) in the fatty-acid salt.
6. ASPHALT PRODUCTION
Asphalt can be produced directly from vacuum residue or by solvent deasphalting (see Section 2.2).
Road-Tar Asphalt. Vacuum residue is used to make road-tar asphalt. To
In road-paving, the petroleum residue serves as a binder for aggregate, which can include stone, sand, or gravel. The aggregate comprises about 95% of the final mixture. Polymers are added to the binder to improve strength and durability.
The recommended material for paving highways in the United States is Superpave32 hot-mix asphalt. Superpave was developed in 1987-93 during a US$50 million research project sponsored by the Federal Highway Administration.
Roofing Asphalt. Roofing asphalt is produced by blowing, which involves the oxidation of asphalt flux by bubbling air through liquid asphalt at 260°C (500°F) for 1 to 10 hours. During this process, organic sulfur is converted to H2S and SO2. Catalytic salts such as ferric chloride (FeCl3) may be used to adjust product properties and increase the rates of the blowing reactions, which are exothermic. To provide cooling, water is sprayed into the top of the blowing vessel, creating a blanket of steam that captures sulfur-containing gases, light hydrocarbons, and other gaseous contaminants. These are recovered downstream. Cooling water may also by sprayed on the outside of the vessel.
The length of the blow depends on desired product properties, such as softening temperature and penetration rate. A typical plant blows four to six batches of asphalt per 24-hour day. There are two primary substrates for roofing asphalt – organic (paper felt) and fiberglass. The production of felt-based roofing shingles consists of:
47Petroleum Processing Overview
drive off remaining light ends, it is heated to about 750°F (400°C) and charged to a column where a vacuum is applied.

• Saturating the paper felt with asphalt • Coating the saturated felt with filled asphalt • Pressing granules of sand, talc or mica into the coating • Cooling with water, drying, cutting and trimming, and packaging
If fiberglass is used as the base instead of paper felt, the saturation step is eliminated.
7. DRYING, SWEETENING, AND TREATING Drying, sweetening and treating are not as glamorous as extraction and
conversion, or even distillation, but they are essential to the performance and safety of finished products. In lubricating oils, traces of olefins and sulfur compounds can form gums and accelerate degradation. At high altitude, excess water in jet fuel can freeze and plug fuel lines. Traces of mercaptans and disulfides in “sour” gasoline can react with water in storage tanks to produce toxic levels of hydrogen sulfide.
7.1 Drying and Sweetening
Light gas streams produced by various refinery units are collected and piped to treating plants, where: • Propane is recovered for LPG • Propylene is removed for use in petrochemical plants • Butanes and butenes are removed for use as alkylation feeds • Heavier components are recovered and sent to gasoline blending
Knock-out drums collect easy-to-condense liquids, but if necessary drying agents – alumina, silica, or molecular sieves – are used to remove the final traces of water. Some processes use beds of molecular sieves to dry and sweeten at the same time.
Gases containing hydrogen sulfide are scrubbed in trayed contactors with aqueous amines such as diethanolamine (DEA). Hydrogen sulfide is stripped
operating unit, the sweetened gas contains <10 wppm H2S.
7.2 Treating
Treating improves the odor, color, and stability of straight-run liquids and conversion-unit products. Sulfuric acid treating removes olefins, sulfur, nitrogen, oxygen compounds, and other contaminants. Clay/lime treating of acid-treated oil removes any residual traces of asphaltenes. Caustic treating
48 Robinson
from the “rich” amine with steam and recycled to the contactor. In a properly

with sodium (or potassium) hydroxide removes naphthenic acids, phenols, mercaptans, and H2S.
If the concentration of organic sulfur exceeds the capacity of a caustic or acid treater, the stream must be sent to a hydrotreater.
8. PRODUCT BLENDING
8.1 Product Specifications
Liquid products from modern refineries comprise several individual streams, which are blended to meet desired specifications. Product specifications developed by ASTM – the American Society for Testing and Materials – are widely used throughout the world. Table 21 lists some common refinery products along with their ASTM designations.
Table 21. ASTM Specification Numbers for Hydrocarbon Fuels
Product ASTM
Specification Last
Updated Description Gasoline D4814 2003 Standard Specification for Automotive Spark-
Ignition Engine Fuel Jet D1655 2003 Standard Specification for Aviation Turbine Fuels Kerosene D3699 2003 Standard Specification for Kerosene Diesel D975 2004 Standard Specification for Diesel Fuel Oils Fuel Oil D396 1998 Standard Specification for Fuel Oils
Analogous institutions in other countries – for example, the Japanese
Industrial Standards Committee (JISC) and the British Standards Institution (BSI) – serve similar functions. BSI developed the ISO9000 series of standards for managing manufacturing processes.
In addition to setting specifications, these institutions develop and publish test methods used to analyze a wide variety of materials. ASTM and its international cousins cooperate with each other, and they work closely with government regulators. For example, recent low-sulfur gasoline and diesel directives from the U.S. Environmental Protection Agency are incorporated into D975-04 and D4814-03a, respectively.
Other widely used tests and specifications are defined by licensors. For example, UOP‘s Laboratory Test Methods, distributed by ASTM, defines several hundred procedures for analyzing catalysts, chemicals and fuels. Axens (IFP), ChevronTexaco, ExxonMobil and other licensors also distribute test methods to process licensees.
Additives are an essential component of finished fuels. They increase stability, improve flow properties and enhance performance. For example, cetane-improvers are routinely added to diesel fuel, and additives that prevent intake-valve deposits are now required in all grades of gasoline in the United States.
49Petroleum Processing Overview

8.2 Gasoline Blending
Forty years ago, making gasoline was a relatively simple task. If a mixture of components met specifications for volatility and octane, it could be shipped to retail outlets and sold as-was. If the octane was low, the problem could be fixed by adding a little tetraethyl lead. Butanes could be added as needed to adjust volatility.
In fact, volatility and octane are still the two most important properties of gasoline. The volatility must be high enough to vaporize during cold weather; otherwise, engines won’t start. And octane is still one of the best predictors of performance in a spark-ignition gasoline engine.
8.2.1 Octane Numbers for Hydrocarbons
In a spark-ignition engine, some compounds start to burn before they reach the spark plug. This premature ignition causes knocking, which reduces the power of the engine, increases engine wear, and in some cases causes serious damage.
Octane number is a measure of the propensity of fuels to knock in gasoline engines. It is based on an arbitrary scale in which the octane number of n-heptane is zero and the octane number of isooctane (2,2,4-trimethylpentane) is 100. When a fuel is tested in a standard single-cylinder engine, mixtures of isooctane and n-heptane are used as standards. ASTM D2699 and ASTM D2700 describe methods for measuring research octane number (RON) and motor octane number (MON), respectively. The engine speed for the RON test is 600 rpm, while 900 rpm is used for the MON test. RONC and MONC are sometimes used instead to RON and MON. The “C” stands for clear, which means that the fuel does not contain lead or manganese additives.
Table 22 presents RON and MON values for several pure compounds. Aromatics, olefins, and branched isomers have higher octane numbers than straight-chain isomers with similar carbon numbers. Octane numbers for naphthenes are substantially lower than those for aromatics.
Octane numbers do not blend linearly. For example, while the RON for pure 4-methyl-2-pentene is 99, its blended RON is 130.
In North America, the pump octane of gasoline is the average of RON and MON: (R+M)/2. This is the number displayed on pumps at filling stations.
Typical grades are “regular” with a pump octane of 87, “mid-grade” with a pump octane of 89, and “premium” with a pump octane of 91 to 93. In some locales, customers can dial in any octane they want between 87 and 93.
50 Robinson

Cyclopentane Naphthene C5H10 101 85 2-Methylbutane i-Paraffin C5H12 92 90 2-Methyl-2-butene Olefin C5H10 97 85 n-Hexane n-Paraffin C6H14 25 26 Methylcyclopentane Naphthene C6H12 91 80 2,2-Dimethylbutane i-Paraffin C6H14 92 93 3-Methyl-2-pentene Olefin C6H12 97 81 4-Methyl-2-pentene Olefin C6H12 99 84 Benzene Aromatic C6H6 >100 106 n-Heptane n-Paraffin C7H16 -27 0 Methylcyclohexane Naphthene C7H14 75 71 2-Methylhexane i-Paraffin C7H16 42 46 2,2-Dimethylpentane i-Paraffin C7H16 93 96 2,2,3-Trimethylbutane i-Paraffin C7H16 116 101 Toluene Aromatic C7H8 >100 109 n-Octane n-Paraffin C8H18 <0 <0 Isooctane n-Paraffin C8H18 100 100 2,2,4-Trimethyl-1-pentene Olefin C8H16 >100 86 2,2,4-Trimethyl-2-pentene Olefin C8H16 >100 86 o-, m-, and p-Xylene Aromatic C8H10 >100 100 Ethylbenzene Aromatic C8H10 >100 98
Many refinery streams have the right vapor pressure, boiling range, and octane to end up in the gasoline pool. Table 23 shows properties for stocks recently used to make gasoline in a European refinery. The raffinate came from an aromatics extraction unit, and the pyrolysis gasoline came from a nearby ethylene plant.
Table 23. Gasoline Blend Stock Properties: Example Density RVP Boiling Range
Component (kg/m3) (bar) °C °F RON MON Butanes 0.575 3.6 -12 to -0.5 10.4 – 31 97 95 Straight-run Gasoline 0.64 1.15 27 – 80 81 – 176 80.2 76.6 Reformate 0.815 0.08 78 – 197 172 – 387 100.5 89.5 Raffinate 0.685 0.3 65 – 112 149 – 234 60.3 54.5 Hvy FCC Gasoline 0.76 0.2 43 – 185 109 – 365 90.5 79.5 Light FCC Gasoline 0.66 1.3 25 – 89 77 – 192 94.5 81.5 Pyrolysis Gasoline 0.845 0.3 47 – 180 117 – 356 101.5 86.5 Alkylate 0.705 0.3 39 – 195 102 – 383 98 93.5 MTBE 0.746 0.5 48 – 62 118 – 144 115 97
8.2.2 Reformulated Gasoline (RFG)
In 1970, gasoline blending became more complex. The U.S. Clean Air Act required the phase-out of tetraethyl lead, so refiners had to find other ways to provide octane. In 1990, the Clean Air Act was amended. It empowered EPA
51Petroleum Processing Overview
Table 22. Octane Numbers for Selected Pure Compounds Compound Type Formula RON MON n-Butane n-Paraffin C4H10 92 93 n-Pentane n-Paraffin C5H12 62 62

Phase I RFG regulations (Table 24) required a minimum amount of chemically bound oxygen, imposed upper limits on benzene and Reid Vapor Pressure (RVP), and ordered a 15% reduction in volatile organic compounds (VOC) and air toxics. VOC react with atmospheric NOx to produce ground-level ozone. Air toxics include 1,3-butadiene, acetaldehyde, benzene, and formaldehyde.
Oxygen can be supplied as ethanol or C5 to C7 ethers. The ethers (Table 25) have excellent blending octanes and low vapor pressures. This makes them highly desirable gasoline blend stocks. Due to the detection of MTBE in
blend stock.33
Table 24. Simple Model RFG Specifications Property Specification Oxygen, wt% 2.0 max Benzene, vol% 1.0 max RVP, Summer Class B (psi) 7.2 max Class B (kPa) 50 max Class C (psi) 8.1 max Class C (kPa) 56 max VOC (summer) 15% reduction Air toxics 15% reduction Sulfur Same as 1990 T90*, olefins, aromatics Same as 1990
*T90 is the temperature at which 90% of a gasoline blend evaporates. RFG was implemented in two phases. The Phase I program started in 1995
and mandated RFG for 10 large metropolitan areas. Several other cities and four entire states joined the program voluntarily. In the year 2000, about 35% of the gasoline in the United States was reformulated.
The regulations for Phase II, which took force in January 2000, are based on the EPA Complex Model, which estimates exhaust emissions for a region
Table 25. Blending octane and RVP of ethers and alcohols
Ether or Alcohol Blending Octane
(RON) Blending RVP
(psi) Blending RVP
(kPa) Methanol 133 58-62 400-427 Ethanol 130 18-22 124-152 Methyl-t-butyl ether (MTBE) 118 8-10 55-69 Ethyl-t-butyl ether (ETBE) 118 3-5 21-34 t-Amyl methyl ether (TAME) 111 1-2 7-14
52 Robinson
to impose emissions limits on automobiles and to require reformulated gasoline (RFG).
ground water, the future for MTBE is questionable, especially since 1999, whenthe Governor of California issued an executive order requiring the phase-outof MTBE as a component of gasoline. But in Finland and many otherEuropean countries, MTBE is still considered a premium, relatively safe

By intent, Phase II is a regulation based on emissions instead of a formula.
Table 26. Example of Product Property Ranges Calculated by the Phase II Complex Model Reformulated gasoline Conventional gasoline
Property Low end High end Low end High end Oxygen 0 3.7 0 3.7 Sulfur 0 500 0 1000 RVP 6.4 10 6.4 11 E200 30 70 30 70 E300 70 95 70 100 Aromatics 10 50 0 55 Olefins 0 25 0 30 Benzene 0 2 0 4.9 MTBE 0 3.7 0 3.7 ETBE 0 3.7 0 3.7 Ethanol 0 3.7 0 3.7 TAME 0 3.7 0 3.7
In practice, blending under the complex model can be less restrictive than blending to a recipe, because changing the amount of one blend-stock (for examples, due to a sudden increase or decrease in availability) can be offset by changes in others.
8.2.3 Gasoline Additives
Table 27 lists the kinds of additives used to prepare finished gasoline. Additive packages vary from season-to-season, region-to-region, and retailer
usually are more concentrated. They are packaged so that they can be added by consumers to the fuel tanks of individual automobiles.
Table 27. Additives Used in Gasoline Additive Type Function Anti-oxidation Minimize oxidation and gum formation during storage Metal passivation Deactivate trace metals that can accelerate oxidation Corrosion inhibition Minimize rust throughout the gasoline supply chain Anti-icing Minimize ice in carburetors during cold weather IVD control (detergent) Control deposition of carbon on intake valves CCD control Control deposition of carbon in combustion chambers Anti-knock Methylcyclopentadienyl manganese tricarbonyl (MMT)
53Petroleum Processing Overview
blend. Instead, they can use EPA‘s computer model – called MOBILE6 – to calculate emissions. By law, complex-model calculations are just as valid asdynamometer tests with vehicles.
based on geography, time of year, mix of vehicle types, and – most important to refiners – fuel properties (Table 26).
to retailer. “After-market” additives contain similar types of ingredients and
But refiners don’t have to measure the tail-pipe emissions of every gasoline
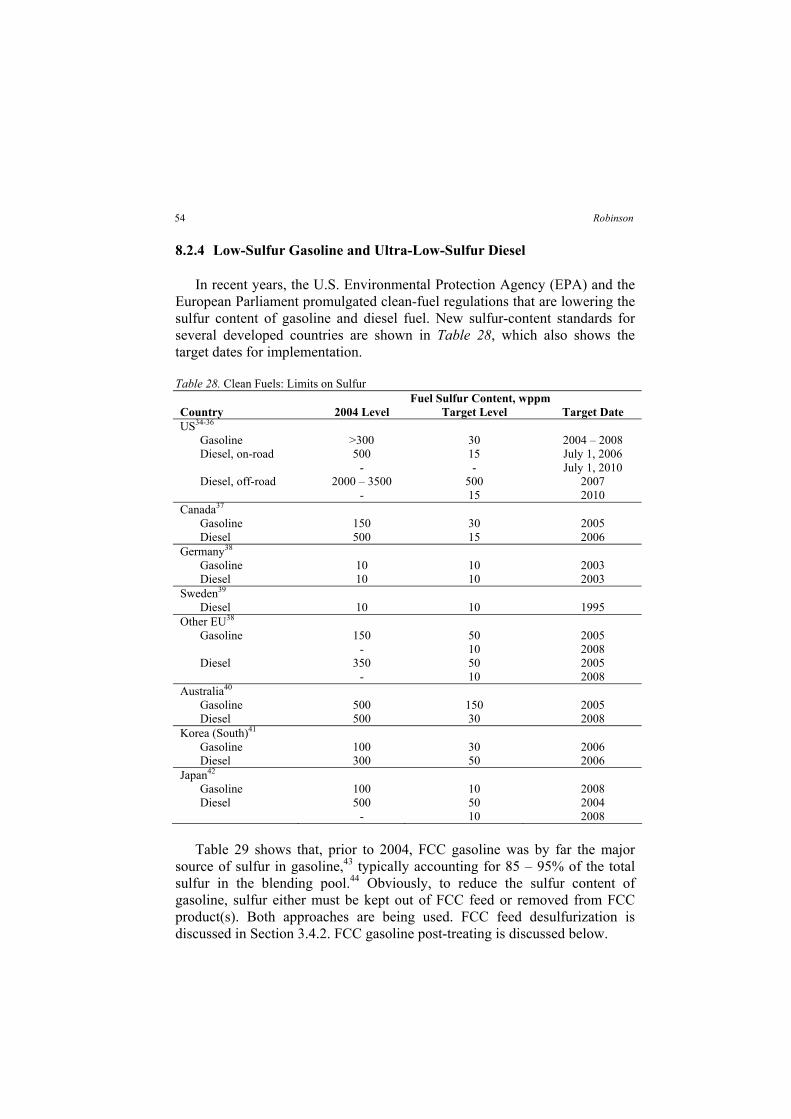
8.2.4 Low-Sulfur Gasoline and Ultra-Low-Sulfur Diesel
In recent years, the U.S. Environmental Protection Agency (EPA) and the European Parliament promulgated clean-fuel regulations that are lowering the sulfur content of gasoline and diesel fuel. New sulfur-content standards for several developed countries are shown in Table 28, which also shows the target dates for implementation.
Table 28. Clean Fuels: Limits on Sulfur Fuel Sulfur Content, wppm
Country 2004 Level Target Level Target Date US34-36
Gasoline >300 30 2004 – 2008 Diesel, on-road 500 15 July 1, 2006 - - July 1, 2010 Diesel, off-road 2000 – 3500 500 2007 - 15 2010
Canada37 Gasoline 150 30 2005 Diesel 500 15 2006
Germany38 Gasoline 10 10 2003 Diesel 10 10 2003
Sweden39 Diesel 10 10 1995
Other EU38 Gasoline 150 50 2005 - 10 2008 Diesel 350 50 2005 - 10 2008
Australia40 Gasoline 500 150 2005 Diesel 500 30 2008
Korea (South)41 Gasoline 100 30 2006 Diesel 300 50 2006
Japan42 Gasoline 100 10 2008 Diesel 500 50 2004 - 10 2008
Table 29 shows that, prior to 2004, FCC gasoline was by far the major
source of sulfur in gasoline,43 typically accounting for 85 – 95% of the total sulfur in the blending pool.44 Obviously, to reduce the sulfur content of gasoline, sulfur either must be kept out of FCC feed or removed from FCC product(s). Both approaches are being used. FCC feed desulfurization is discussed in Section 3.4.2. FCC gasoline post-treating is discussed below.
54 Robinson

Table 29. Sources of Sulfur in Gasoline (before 2004)
Component Contribution to the
Gasoline Pool (vol%) Contribution to Sulfur in
the Pool (%) Alkylate 12 0 Coker naphtha 1 1 Hydrocracker naphtha 2 0 FCC gasoline 36 98 Isomerate 5 0 Light straight-run naphtha 3 1 Butanes 5 0 MTBE 2 0 Reformate 34 0 Total 100 100
8.2.5 FCC Gasoline Post-Treating
Hydrotreating FCC Gasoline. Conventional hydrotreating does a good job of removing sulfur from FCC gasoline. Unfortunately, it also does a good job of reducing octane by saturating C6-C10 olefins. In recent years, the industry has developed several processes to remove sulfur at minimum octane loss. Licensors include Axens (IFP), CDTECH, ExxonMobil, and UOP.
Sulfur Removal by Selective Adsorption. The ConocoPhillips S Zorb process uses selective adsorption to remove sulfur from FCC gasoline.44 The feed is combined with a small amount of hydrogen, heated, and injected into an expanded fluid-bed reactor, where a proprietary sorbent removes sulfur from the feed. A disengaging zone in the reactor removes suspended sorbent from the vapor, which exits the reactor as a low-sulfur stock suitable for gasoline blending.
The sorbent is withdrawn continuously from the reactor and sent to the regenerator section, where the sulfur is removed as SO2 and sent to a sulfur recovery unit. The clean sorbent is reconditioned and returned to the reactor. The rate of sorbent circulation is controlled to help maintain the desired sulfur concentration in the product.
8.3 Kerosene and Jet Fuel
Kerosene, jet fuel, and turbine fuel have similar boiling ranges. The key product properties are:
• Flash point • Freezing point • Sulfur content • Smoke point
55Petroleum Processing Overview

The flash point is the lowest temperature at which a liquid gives off enough vapor to ignite when an ignition source is present. The freezing point is especially important for jet aircraft, which fly at high altitudes where the outside temperature is very low. Sulfur content is a measure of corrosiveness.
The measurement of smoke point goes back to the days when the primary use for kerosene was to fuel lamps. To get more light from a kerosene lamp, you could turn a little knob to adjust the wick. But if the flame got too high, it gave off smoke. Even today, per ASTM D1322, smoke point is the maximum height of flame that can be achieved with calibrated wick-fed lamp, using a wick “of woven solid circular cotton of ordinary quality.”
The smoke point of a test fuel is compared to reference blends. A standard 40%/60% (volume/volume) mixture of toluene with 2,2,4-trimethylpentane has a smoke point of 14.7, while pure 2,2,4-trimethylpentane has a smoke point of 42.8. Clearly, isoparaffins have better smoke points than aromatics.
Table 30 shows specifications for five grades of jet fuel, otherwise known as aviation turbine fuel. The JP fuels are for military aircraft.
Table 30. Specifications for Aviation Turbine Fuels Specification Jet A Jet B JP-4 JP-5 JP-8 Flash point, °C (min) 38 - - 60 38 Freeze point, °C (max) -40 (Jet A) -50 -58 -46 -47 -47 (Jet A-1) API Gravity 37 – 51 45 – 57 45 – 57 36 – 48 37 – 51 Distillation, °C 10% max 205 - 205 205 20% max - 145 145 - - 50% max - 190 190 - - 90% max - 245 245 - - EP 300 - 270 290 300 Sulfur, wt% max 0.3 0.3 0.4 0.4 0.3 Aromatics, vol% max 22 22 25 25 25 Olefins, vol% max - - 5 5 5
8.4 Diesel Blending
Diesel blending is simpler than gasoline blending because the limitations are fewer. Only sulfur, cetane number, and (in some countries) aromatics and density are regulated for environmental reasons. Sulfur contributes heavily to particulate emissions from diesel engines, and cetane number is a measure of burning quality in a diesel engine. As with octane number, cetane number measures the tendency of fuels to auto-ignite in a standard test engine. It is easier to start a diesel engine when the cetane number of the fuel is high.
The reference fuels for ASTM D613, which describes the test method for cetane number, are n-cetane, α-methylnaphthalene, and heptamethylnonane,
Table 31 shows cetane numbers for selected pure compounds.45
56 Robinson
for which cetane numbers are defined to be 100, 0, and 15, respectively.

Cetane index, as defined by ASTM D976, is not a measurement, but the result of a calculation based on density and mid-boiling point. It is nearly the same the as cetane number for diesel fuels comprised mostly of straight-run gas oils blended with lesser amounts of cracked stocks. Diesel index is a simpler calculation based on density and aniline point. The streams listed in Table 32 are typical candidates for making diesel fuel.
Table 31. Cetane Numbers for Selected Pure Compounds Compound Type Carbons Formula Cetane No. n-Decane Paraffin 10 C10H22 76 Decalin Naphthene 10 C10H18 48 α-Methylnaphthalene Aromatic 11 C11H10 0* n-Pentylbenzene Aromatic 11 C11H16 8 3-Ethyldecane Paraffin (iso) 12 C12H26 48 4,5-Diethyloctane Paraffin (iso) 12 C12H26 20 3-Cyclohexylhexane Naphthene 12 C12H24 36 Biphenyl Aromatic 12 C12H10 21 α –Butylnaphthalene Aromatic 14 C14H16 6 n-Pentadecane Paraffin 15 C15H32 95 n-Nonylbenzene Aromatic 15 C15H24 50 n-Hexadecane (cetane) Paraffin 16 C16H34 100* 2-Methyl-3-cyclohexylnonane Naphthene 16 C16H34 70 Heptamethylnonane Paraffin (iso) 16 C16H34 15* 8-Propylpentadecane Paraffin (iso) 18 C18H38 48 7,8-Diethyltetradecane Paraffin (iso) 18 C18H38 67 2-Octylnaphthalene Aromatic 18 C18H24 18 n-Eicosane Paraffin 20 C20H42 110 9,10-Dimethyloctane Paraffin (iso) 20 C20H42 59 2-Cyclohexyltetradecane Naphthene 20 C20H40 57 * Used as a standard for ASTM D976
Table 33 presents clean-diesel specifications for the European community, which were based on two extensive research programs – Auto Oil I and Auto Oil II. Automobile manufacturers, oil refining companies, and government agencies participated in both programs. Auto Oil I lasted four years, from 1992 to 96. Auto Oil II was launched in 1997, and the final report was issued in October 2000. The purpose of the programs was to find ways to reduce
health, technology and economics.
Table 32. Properties of U.S. Diesel Blend Stocks, Year 2000 (California Excluded)46
Blend Stock Percent of
Total U.S. Pool Sulfur (wt%)
API Gravity
Cetane (no additives)
Straight-run gas oil 12.4 0.222 30.3 – 42.2 40.3 – 45.0 Hydrotreated straight-run 51.9 0.036 29.9 – 42.9 44.5 – 50.4 FCC light cycle oil 3.1 0.532 22.3 – 33.1 <<30 Hydrotreated light cycle oil 19.4 0.087 30.7 – 45.0 42.7 – 44.1 Coker gas oil 1.0 0.342 32.3 – 42.4 <<30 Hydrotreated coker gas oil 8.2 0.026 29.9 – 34.8 36.1 – 45.3 Hydrocrackate 4.0 0.008 32.9 – 41.8 50.2
57Petroleum Processing Overview
emissions from gasoline and diesel-powered vehicles, considering public

Table 33. EU Specifications for Automotive Diesel Specification Units Year 2000 Limits Possible Future Limits Cetane number 51 (min) 55 (min) Cetane index No spec 52 (min) Density @ 15°C g/cm3 0.845 (max) 0.84 Distillation 90% boiling point °F no spec 608 (max) 95% boiling point °F 680 (max) 644 (max) Final boiling point °F no spec 662 (max) 90% boiling point °C no spec 320 (max) 95% boiling point °C 360 (max) 340 (max) Final boiling point °C no spec 350 (max) Polyaromatic hydrocarbons (PAH) wt% 11 (max) 2 (max) Total aromatics wt% no spec 15 (max) Sulfur wppm 350 (max)* 10 (max) • As discussed elsewhere, diesel sulfur will be limited to 50 wppm in 2005.
lead poisons the converter catalyst. Similarly, sulfur poisons catalysts that may be used on future vehicles. Hence, the reduction of sulfur in gasoline and diesel fuel to ultra-low levels is a key requirement of Auto Oil II.
Around the world, the transportation and fungibility of ultra-clean fuels is a major concern. For common-carrier pipelines, which transport various products made by different refiners, cross-contamination is a major concern. The interface layer between shipments is called “trans mix.” If a shipment of gasoline containing 30 wppm of sulfur follows a batch of diesel containing 500 wppm of sulfur, the sulfur-contaminated trans mix could comprise more than 20% of the gasoline. Consequently, several pipeline companies have announced that in the future they will not transport any high-sulfur material.
Other important diesel-fuel properties include flash point, cloud point, pour point, kinematic viscosity, and lubricity. Cloud point and pour point indicate the temperature at which the fuel tends to thicken and then gel in cold weather. In addition to providing energy, diesel fuel also serves as a lubricant for fuel pumps and injectors, which prolongs the life of the engine. Viscosity measures the tendency of a fluid to flow. In a diesel engine, viscosity indicates how well a fuel atomizes in spray injectors. It also measures its quality as a lubricant for the fuel system. Lubricity measures the fuel’s ability to reduce friction between solid surfaces in relative motion. It indicates how the engine will perform when loaded.
8.4.1 Diesel Additives
Chemical additives improve the performance and extend the tank-life of diesel fuels. Typical types of additives are shown in Table 34.
58 Robinson
Catalytic converters led to the elimination of lead from gasoline, because
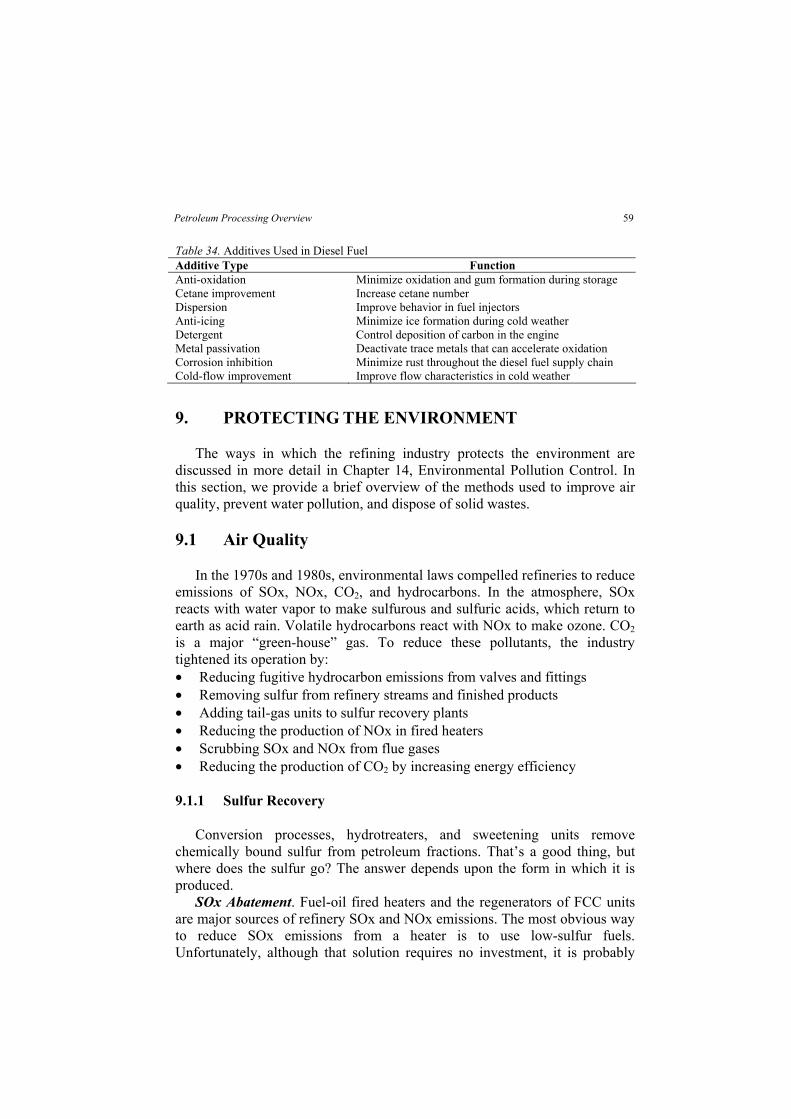
Table 34. Additives Used in Diesel Fuel Additive Type Function Anti-oxidation Minimize oxidation and gum formation during storage Cetane improvement Increase cetane number Dispersion Improve behavior in fuel injectors Anti-icing Minimize ice formation during cold weather Detergent Control deposition of carbon in the engine Metal passivation Deactivate trace metals that can accelerate oxidation Corrosion inhibition Minimize rust throughout the diesel fuel supply chain Cold-flow improvement Improve flow characteristics in cold weather
9. PROTECTING THE ENVIRONMENT
The ways in which the refining industry protects the environment are
this section, we provide a brief overview of the methods used to improve air quality, prevent water pollution, and dispose of solid wastes.
9.1 Air Quality
In the 1970s and 1980s, environmental laws compelled refineries to reduce 2
reacts with water vapor to make sulfurous and sulfuric acids, which return to earth as acid rain. Volatile hydrocarbons react with NOx to make ozone. CO2 is a major “green-house” gas. To reduce these pollutants, the industry tightened its operation by: • Reducing fugitive hydrocarbon emissions from valves and fittings • Removing sulfur from refinery streams and finished products • Adding tail-gas units to sulfur recovery plants • Reducing the production of NOx in fired heaters • • Reducing the production of CO2 by increasing energy efficiency
9.1.1 Sulfur Recovery
Conversion processes, hydrotreaters, and sweetening units remove chemically bound sulfur from petroleum fractions. That’s a good thing, but where does the sulfur go? The answer depends upon the form in which it is
SOx Abatement. Fuel-oil fired heaters and the regenerators of FCC units are major sources of refinery SOx and NOx emissions. The most obvious way to reduce SOx emissions from a heater is to use low-sulfur fuels. Unfortunately, although that solution requires no investment, it is probably
59Petroleum Processing Overview
discussed in more detail in Chapter 14, Environmental Pollution Control. In
emissions of SOx, NOx, CO , and hydrocarbons. In the atmosphere, SOx
Scrubbing SOx and NOx from flue gases
produced.

the most expensive due to the relatively high cost of buying low-sulfur fuel oil or hydrotreating high-sulfur fuel oil.
A large fraction of the sulfur in the feed to an FCC unit ends up in coke on the catalyst. SOx is formed in the regenerator when the coke is burned away. Therefore, removing sulfur from the feed decreases SOx emissions.
As stated in Section 3.4.2, using a hydrotreater or hydrocracker for feed HDS eliminates or minimizes the cost of post-FCC desulfurization equipment. Removing basic nitrogen decreases deactivation of acid sites on the FCC catalyst, which allows the FCC to reach a given conversion at lower temperatures. The saturation of aromatics in the feed pretreater provides the biggest benefit, because it converts hard-to-crack aromatics into easier-to-crack naphthenes. This alone can justify the installation of an FCC feed pretreater. Therefore, in addition to abating SOx, hydrotreating the feed to an FCC can generate a substantial return.43
2 2 2 2 3 y x
2 3 y x 2 4
4 2 2 2
Figure 25. Mechanism of SOx transfer in FCC units.
SOx Transfer Additives. Arguably, SOx transfer additives are the most cost-effective way to lower SOx emissions in an FCC unit. These materials, first developed by Davison Chemical, react with SOx in the FCC regenerator to form sulfates (Figure 25). When the sulfated additive circulates to the riser/reactor section, the sulfate is reduced to H2S, which is recovered by amine absorption and sent to the sulfur plant. In some units, these additives reduce FCC SOx emissions by more than 70%. Consequently, if a pre-treater or post-treater still must be installed, its size can be reduced.
Flue-Gas (Stack-Gas) Scrubbing. Flue-gas scrubbing is a refiner’s last chance to keep NOx and SOx out of the air. In wet flue-gas desulfurization, gas streams containing SOx react with an aqueous slurry containing calcium hydroxide Ca(OH)2 and calcium carbonate CaCO3. Reaction products include calcium sulfite (CaSO3) and calcium sulfate (CaSO4), which precipitate from the solution.
NOx removal is more difficult. Wet flue-gas scrubbing removes about 20% of the NOx from a typical FCC flue gas. To remove the rest, chemical reducing agents are used. In the Selective Catalytic Reduction (SCR) process, anhydrous ammonia is injected into the flue gas as it passes through a bed of
60 Robinson
FCC Regenerator (Oxidizing Environment)
Coke on catalyst (solid) + O + H O → CO + SO , SO , H SO (gas)
SO , SO , H SO (gas) + M (solid) + O → M.SO (solid)
FCC Riser/Reactor (Reducing Environment)
M.SO (solid) + 5 H → M (solid) + H S (gas) + 4 H O

catalyst at 500 to 950°F (260 to 510°C). The chemical reaction between NOx and ammonia produces N2 and H2O.
Hydrogen Sulfide Removal. When sulfur-containing feeds pass through hydrotreaters or conversion units, some or most of the sulfur is converted into H2S, which eventually ends up in off-gas streams. Amine absorbers remove the H2S, leaving only 10 to 20 wppm in the treated gas streams. H2S is steam-stripped from the amines, which are returned to the absorbers. The H2S goes to the refinery sulfur plant.
2 H2S + O2 → SO2 + 2 H2O
2 H2S + SO2 3 S + 2 H2O
CHX + SO2 COS, CS2 + H2O
2 NH3 + 3 O2 → N2 + 3 H2O
Figure 26. Claus reactions.
Claus Sulfur Recovery Process. At the sulfur plant, H2S is combined with sour-water stripper off-gas and sent to a Claus unit. Invented in 1881 by Carl Freidrich Claus,47 almost every refinery in the world uses some version of this process to convert H2S into elemental sulfur. A simplified version of Claus-reaction chemistry is shown in Figure 26.
Figure 27 shows a process schematic for a Claus unit. H2S and a carefully controlled amount of air are mixed and sent to a burner, where about 33% of the H2S is converted to SO2 and water. From the burner, the hot gases go to a reaction chamber, where the reactions shown in Figure 26 reach equilibrium. In several units, the air is enriched with oxygen to increase plant capacity.
Figure 27. Claus process.
61Petroleum Processing Overview
→ → →
→ →
As shown, elemental sulfur is produced by the reversible reaction between SO2 and H2S. COS and CS2 appear in small amounts, but even traces of these compounds are hard to remove in tail-gas treating units. Ammonia comes in with the sour-water stripper off-gas. In the Claus process, it is thermally decomposed into nitrogen and water.
In the Claus burner, combustion temperatures reach 2200°F (1200°C). Needless to say, this generates a tremendous amount of heat. Much of the heat is recovered in a waste-heat boiler, which generates steam as it drops the temperature to 700°F (370°C).
Next, the process gas goes to a condenser, where it is cooled to about 450°F (232°C). At this temperature, sulfur vapors condense, and the resulting molten sulfur flows through a drain to a heated sulfur-collection pit. At the bottom of the drain, a seal leg maintains system pressure and keeps unconverted gases out of the pit.
Uncondensed sulfur and other gases flow to a series of catalyst beds, which recover additional sulfur by promoting the reaction between left-over H2S and SO2. With fresh catalyst and a stoichiometric gas composition, the cumulative recovery of sulfur after the four condensers is about 50%, 80%, 95%, and 96-98%, respectively.
Tail-gas treating units (TGTU) bring the total sulfur recovery up to >99.9%. Most tail-gas treating processes send the tail gas to a hydrotreater, which converts all sulfur-containing compounds (SO2, SO3, COS, CS2 and Sx) into H2S. In the SCOT process, offered by Shell Global Solutions, the H2S is aborbed by an amine and returned to the front of the Claus furnace. In the LO-CAT® process, offered by Merichem, H2S is air-oxidized to sulfur in an aqueous solution containing a chelated iron catalyst.
For all tail-gas treatment processes, the last traces of unrecovered sulfur go to an incinerator, where they are converted into SO2 and dispersed into the atmosphere.
9.2 Waste Water Treatment
Waste water treatment is used to purify process water, runoff, and sewage. As much as possible, purified waste-water steams are re-used in the refinery. Wastewater streams may contain suspended solids, dissolved salts, phenols, ammonia, sulfides, and other compounds. The streams come from just about every process unit, especially those that use wash water, condensate, stripping water, caustic, or neutralization acids.
9.2.1 Primary Treatment
Primary treatment uses a settling pond to allow most hydrocarbons and suspended solids to separate from the wastewater. The solids drift to the
62 Robinson

bottom of the pond, hydrocarbons are skimmed off the top, and oily sludge is removed. Difficult oil-in-water emulsions are heated to expedite separation.
Acidic wastewater is neutralized with ammonia, lime, or sodium carbonate. Alkaline wastewater is treated with sulfuric acid, hydrochloric acid, carbon dioxide-rich flue gas, or sulfur.
9.2.2 Secondary Treatment
Some suspended solids remain in the water after primary treatment. These are removed by filtration, sedimentation or air flotation. Flocculation agents may be added to consolidate the solids, making them easier to remove by sedimentation or filtration. Activated sludge is used to digest water-soluble organic compounds, either in aerated or anaerobic lagoons. Steam-stripping is used to remove sulfides and/or ammonia, and solvent extraction is used to remove phenols.
9.2.3 Tertiary Treatment
Tertiary treatment processes remove specific pollutants, including traces of benzene and other partially soluble hydrocarbons. Tertiary water treatment can include ion exchange, chlorination, ozonation, reverse osmosis, or adsorption onto activated carbon. Compressed oxygen may be used to enhance oxidation. Spraying the water into the air or bubbling air through the water removes remaining traces of volatile chemicals such as phenol and ammonia.
9.3 Solid Waste
Refinery solid wastes may include the following materials: • Spent catalyst and catalyst fines • Acid sludge from alkylation units • Miscellaneous oil-contaminated solids
All oil-contaminated solids are treated as hazardous and sent to sanitary landfills. Recently, super-critical extraction with carbon dioxide has been used with great success to remove oil from contaminated dirt.
10. POWER, STEAM, HYDROGEN, AND CO2
Utilities are a critical ingredient in petroleum processing. After excluding the cost of crude oil and other raw materials, power and steam account for almost half of a refinery’s operating costs.
63Petroleum Processing Overview
Due to clean-fuel regulations, many refineries are implementing hydrogen recovery/purification projects and/or installing steam/hydrocarbon reformers to generate on-purpose hydrogen.
10.1 Power
Refineries purchase electricity from outside sources, but they also produce much of their own power with steam turbines or gas engines. Electrical substations distribute power throughout the facility. For safety reasons, substations are located far away from sources of combustible vapors.
10.2 Steam
Steam production and distribution systems are quite complex, involving 3 to 4 different steam qualities and hundreds of pipes and valves. Cooling towers and evaporators are used to dispose of unused steam.
Steam is generated by boilers and heat-producing process units. FCC units, Claus units, and steam/hydrocarbon reformers (hydrogen plants) are major sources of refinery steam.
Steam boilers are fired with refinery fuel gas, natural gas, and/or fuel oil. Fuel oil is a blend of residual oils with flow-improving cutter stocks. Usually, it is pumped through a series of strainers before being burned.
Refinery fuel gas is collected from process units, sweetened in amine absorbers, and sent to a balance drum. Natural gas and LPG may be used to augment the fuel gas supply, and to replace it when needed. The balance drum stabilizes system pressure and calorific content. It also provides a place for suspended liquids to separate from the gas.
Boiler feedwater (BFW) is used for steam generation. BFW must be free of contaminants, because salts and dissolved gases, particularly CO2 and O2, can cause extensive corrosion.
10.3 Hydrogen and CO2
Due to the extra hydrotreating required by clean-fuel regulations, refiners are looking for additional sources of hydrogen, which can be recovered from
Hallale, Ian Moore and Dennis Vauk describes a methodology for optimizing hydrogen recovery from existing refinery hydrogen networks. For new hydrogen plants, steam-hydrocarbon reforming is used. This process is
The feed gas for a steam-hydrocarbon reformer can be natural gas, refinery off-gas, or a mixture of the two. The feed gas is desulfurized, mixed with
64 Robinson
off-gas streams or generated by new hydrogen plants. Chapter 26 by Nick
described in detail in Chapter 25 by Andrew Crews and Gregory Shumake and in the Chapter 24 by Milo Meixell. A brief overview is given in this section.

superheated steam and sent through tubes packed with a nickel-based catalyst. Reaction temperatures are very high – 1100 to 1600°F (593 to 871°C).
The reformed gas, which contains water vapor, H2, CO, and CO2, is sent through a high-temperature shift (HTS) converter. In the HTS converter, carbon monoxide reacts with steam over an iron-based catalyst to form additional CO2 and hydrogen.
In modern units, the CO2 and residual CO and CH4 are removed by pressure-swing adsorption (PSA). As an option, residual CO is converted to methane in a hydrotreater.
In older units, CO2 is removed with an absorber containing an amine, Sulfinol®, Rectisol® or by the BenfieldTM process, which uses hot potassium carbonate. Recovered CO2 can be sold as a product.
11. REFINING ECONOMICS
11.1 Costs
The purchase of crude oil and external blend stocks accounts for about 85% of a refinery’s operating costs. About half of the remaining 15% is due to energy in the form of fuel and electrical power. Table 35 shows a typical breakdown of plant-wide operating costs. For the refining industry, labor costs are about 2.3% of sales compared to 7.6% for making automobile bodies, 8.3% for plastics, and 12.7% for computers.48
About half of the energy used by a refinery is generated from crude oil. In Table 35, crude oil used for energy production is included with “Crude oil and blend stocks.” Corporate overhead, interest payments, taxes, and capital depreciation are not included in this analysis.
Table 35. Typical breakdown of refinery operating costs. Item Percent of “Other” Percent of Total Crude oil and blend stocks – 85 Other operating costs
Fuel oil, fuel gas 40.7 6.1 Electrical power 5.3 0.8 Maintenance 23.3 3.5 Operations 18 2.7 Catalysts and chemicals 12.7 1.9
Totals 100 100
Ultimately, prices for crude oil are set by members of the Organization of
Petroleum Exporting Countries (OPEC), which are listed in Table 36. The members of OPEC supply about 40% of the world’s oil production and own
65Petroleum Processing Overview

about 75% of the world’s proven oil reserves; consumption within OPEC is very low, so almost all of the produced oil is exported.
Table 36. OPEC Oil Reserves and Production49
Country Daily Production, 2002
(million barrels) Proven Reserves, 2003
(billion barrels) Algeria 1.58 9.2 Indonesia 1.35 5.0 Iran 3.53 89.7 Iraq 2.04 112.5 Kuwait 2.02 96.5 Libya 1.38 29.5 Nigeria 2.12 24.0 Qatar 0.84 15.2 Saudi Arabia 8.71 261.8 United Arab Emirates 2.38 97.8 Venezuela 2.91 77.8
Figure 28 illustrates how oil prices have changed since 1861.50 The
bottom trend shows the actual historical prices. The top trend converts the historical prices into 2002 dollars. The big spikes in 1973 and 1978-81 correspond to actions taken by the OPEC cartel. In 1973, the first Arab Oil Embargo caused the average price of oil to rise from about US$4 per barrel to more than US$10 per barrel. In 1978, the revolution in Iran triggered another steep increase in prices, which peaked in 1981 at about US$38 per barrel.
1860's 1870's 1880's 1890's 1900's 1910's 1920's 1930's 1940's 1950's 1960's 1970's 1980's 1990's
1861 - 1944 US average price1945 - 1985 Arabian Light posted price1986 - 2002 Brent spot price
$ 2000
$ money of the day
100
90
80
70
60
50
40
30
20
10
0
Figure 28. Oil Prices Since 1861 ($US)
In response to these severe price increases, major oil-consuming countries developed alternatives and implemented energy conservation measures. The member countries of OEDC (Organization for Economic Co-operation and Development) decreased oil demand from 44 million b/d in 1979 to 37
66 Robinson

million b/d in 1985. Significantly, France now gets more than 75% of its electricity from nuclear power plants, and most of the rest is hydroelectric.
Figure 29. Worldwide Petroleum Processing Capacity Since 1973
“Everybody wants power, but nobody wants a power plant in his yard.”
11.2 Revenues
The economics of some important conversion units are summarized in Table 37. In each case, one major contributor accounts for most of the operating costs. Hydrotreating is an “enabling” process with low margins, but it is essential to the proper functioning of many other units in a refinery.
67Petroleum Processing Overview
refining capacity, especially in North America.
Slowly but steadily, oil consumption rose from 58 million b/d in 1983 to 75 million b/d in 2002. Most of the rise came from developing countries (Figure 29). The price run-up in 2003-05 was caused by increased rates of rising demand in China and India, whose economies were booming. At the same time, there was an (apparent) inability of exporters to keep pace with demand and a lack of spare
to obtain permits for a new plant of significant size.
Sudden changes in consumption, either up or down, are unlikely due to the long lead-time needed to increase population, build new refining capacity, build plants that produce energy from alternative sources, or implement energy conservation measures. It takes 18 to 24 months to design and install a new crude distillation unit. Alternative energy production plants take a lot longer, especially in the United States, where it takes years
In contrast, supply can change overnight – at least in the minds of oil traders.

Table 37. Economics for Selected Conversion Units.
Process Operating Costs
(US$ per bbl) Major Cost
Factor Percent of Total Cost
Net margin ($US per bbl)
FCC 2.0 – 2.2 Fuel 70 4.0 to 5.0 Cat. Reforming 3.0 Utilities 90 2.0 to 2.5 Alkylation 4.8 – 5.5 Utilities 65 to 75 3.5 to 4.5 Hydrotreating 1.7 Hydrogen 60 to 70 0.5 Hydrocracking 4.0 to 4.5 Hydrogen 75 to 80 1.5 to 3.0
11.3 Margins
and product prices. A good indicator of margins is the “crack spread” – the
11.3.1 Location, Location, Location
A well-located refinery has lower operating costs and increased operating flexibility. When located near other refineries and petrochemical plants in a coastal industrial basin such as Rotterdam, the Houston Ship Channel, etc., it has access to a wide variety of crudes, blend stocks, transportation options, additives, supplies, and services. This enhances its ability to cope with upsets and to react aggressively to sudden changes in price differentials.
In a basin, the infrastructure – seaports, pipelines, laboratories, waste-handling facilities – is extensive. Often, a single large supplier provides utilities and commodities such as hydrogen to several different customers, reducing costs for all concerned. This is because, due to economies of scale, production and distribution costs for a large plant are lower than those for multiple smaller plants with equivalent total capacity.
As long as space is available, industrial basins tend to grow. They also attract and support large pools of operators and engineers. Contractors, who perform as-needed engineering, maintenance, and other important service work, also are attracted by “basin gravitation.”
Lest we leave you with the idea that non-basin facilities are inherently handicapped, we should emphasize that other locations also can have advantages. For example, the ConocoPhillips refinery in Borger, Texas was built in 1932 in an area that still produces large quantities of natural-gas liquids. Except for a few nearby chemical plants, the Borger refinery seems isolated. However, it is connected by pipelines to the U.S. Gulf Coast and to the mammoth hub of pipelines in Cushing, Oklahoma. Through these various pipelines, the Borger complex receives crude oil from the Texas Gulf Coast and supplies products to Houston, Denver, Kansas City, and beyond. Also, in
68 Robinson
Refinery margins depend on location, size, automation, complexity, and crude
difference in price between crude oil and refined products.

addition to gasoline and other fuels, it produces a large number of ultra-pure chemicals, some of which are not manufactured in quantity anywhere else in the United States.
11.3.2 Size
Size isn’t everything, but it certainly helps. On a per-ton basis, it costs less to design and build large process units. Engineering costs are essentially capacity-independent. This economy of scale translates into higher returns on investments, faster paybacks, and/or reduced interest payments as percentages of total project costs.
11.3.3 Conversion Capability and Complexity
The most profitable refineries tend to be more complex. In the 1960s, W.L. Nelson developed an index for calculating the relative costs of refineries based on complexity.51 Table 38 presents complexity indices for individual
Table 38. Nelson Complexity Indices for Individual Process Units Process Unit Complexity Index Crude distillation 1 Vacuum distillation 2 Visbreaking 2.75 Delayed and fluid coking 6 FCC 6 Catalytic reforming 5 Hydrotreating 2-3 Hydrocracking 6 Alkylation, polymerization 10 Aromatics, isomerization 15 Lubes 10 Asphalt 1.5 Hydrogen production 1
To compute the Nelson Index for a given refinery or regions, the
complexity factors for each individual unit is multiplied by the percentage of the incoming crude that it processes. The individual unit results are summed to give a total plant complexity rating.
69Petroleum Processing Overview
fixed costs, especially labor, are nearly size-independent.
road and to lift them with available cranes.
processes, and Table 39 compares of the world.
Similarly, bigger plants have lower per-barrel operating costs because many
Size and weight determine the maximum size of for the vessels in large process units. High-pressure reactors can only be built in a few special factories in Italy and Japan. They can weigh more than 2200 tons and their diameters may exceed 15 feet (5 meters), but it must be possible to move them over existing
complexity in different parts

Table 39. Nelson Complexity Indices for Selected Regions
Region Refineries Throughput
(million bpcd) Complexity Index C.I.S. 58 10.0 3.8 Latin America 80 6.3 4.7 Asia 135 14.7 4.9 Europe 116 14.5 6.5 Canada 23 1.8 7.1 United States 153 15.3 9.5
In short: The petroleum refining business is highly capital-intensive and
competition is fierce. The predominant cost – purchase of crude oil – is beyond a refiner’s control, due to the fact that crude-oil costs are, for the most part, determined by OPEC. Even so, large, well-located, high-conversion refineries can be very profitable, especially during spikes in product prices. In
of the United States and >$20 per barrel in California.
11.3.4 Automation
optimization (RTO) can improve the profitability of a major conversion unit by 5 to 10%. Refinery-wide, benefits from MPC and RTO can exceed US$0.40 per barrel, or $US30 million per year for a high-conversion 200,000 b/d refinery.
12. SAFETY, RELIABILITY, AND MAINTENANCE
This section could have been a part of Section 11: Refining Economics, because the most profitable refineries are also the safest and most reliable. Just consider this: For a 200,000 barrels-per-day refinery, a minor accident that shuts down the plant for just one week can cost US$3 to 6 million in lost revenue. An accident that damages a major conversion unit can cost between US$80 and US$120 million in lost revenue during the 12-18 months required for reconstruction, plus US$20 to 50 million (or more) in reconstruction expenses. These estimates don’t include the cost of repairing damage to the surrounding community. To settle lawsuits and pay penalties for a “minor” incident that occurred in 1994, a California refiner paid more than US$83 million.52
12.1 Refinery Staffing
Figure 30 shows a typical refinery organization chart.
70 Robinson
2005, crack spreads reached all-time highs, exceeding $15 per barrel in most
As discussed in Chapter 22, model-predictive control (MPC) and real-time

Plant
Manager
Operations
TechnicalSupport
Maintenance
Health, SafetyManager
PlanningManager
Control andInstrumentation
FinanceManager
TechnicalManager
Purchasing
Long-TermPlanning
Short-TermPlanning
Fire Control
SafetyTraining
EnvironmentalProtection
Inventories
Crude, ProductTrading
Sales andMarketing
Laboratory
CommunityRelationsLegal Advisor
Figure 30. Refinery Organization Chart
More than anything else, safety and reliability depend on people who work in a plant. A typical U.S. or Canadian refinery employs 500 to 750 people. About half of these are operators and 20 to 25% are engineers.
12.2 Safety
“Safety first!” “Safety is a state of mind.” “All accidents are preventable.” In safely operated plants, these maxims are emphasized over and over
again to each and every employee. Industry studies show that safe plants share the following characteristics: • Top managers demonstrate personal commitment to safety. • Safety goals are aggressive. A perfect example of an aggressive goal is
“Zero Lost-Time Accidents.” • Safe performance is rewarded. For achieving aggressive safety goals,
individual workers can receive thousands of dollars per year. • Safety takes priority over (false) economics. In safety-first plants,
operators are encouraged to shut a unit down at the first sign of serious trouble. Historically, far too many incidents are caused (or aggravated) by someone who decides to keep running a unit despite indications that something is wrong.52
71Petroleum Processing Overview
• Protective clothing is required. Anyone in an operations area must wear fire-proof coveralls, a helmet, and safety goggles. Hearing protection and steel-toed shoes may also be required.
• Safety equipment is well-maintained and readily available. Safety equipment includes alarms, intercoms, sprinkler systems, self-contained breathing units, and first-aid kits.
• Safety training is rigorous and continuous. Training topics include: o Safety regulations. In the United States, safety regulations are issued
and enforced by the Occupational Safety and Health Administration (OSHA). Per OSHA requirements, for every chemical in the plant, a Material Safety Data Sheet (MSDS) must be available. An MSDS describes the substance, classifies its danger, if any, and describes proper storage and handling.
o Emergency procedures, including where to go and what to do when they hear different alarms. Usually, there are at least two kinds of alarm sounds – a fire alarm and a toxic-release alarm. Possible toxic releases include H2S, which is actually more poisonous than hydrogen cyanide, and carbon monoxide.
o Maintenance safety. Historically, most refinery accidents occurred during maintenance. Now, all proposed maintenance work is reviewed and pre-approved by operations, engineering, craftspeople and management. Lock-out, tag-out procedures prevent unsuspecting employees from trying to start equipment that shouldn’t be started.
• Contractors must be trained, too. Before they can enter the plant, all contractors are required to complete safety training.
Safety programs work! For example, a report by ChevronTexaco claims that, between 1990-91 and 2000-01, safety programs reduced injuries by 90%
53 In 2003, Valero s Paulsboro refinery had no lost-time injuries and a total recorded injury rate of 0.7, which is three times better than the industry average. For this and other
(VPP). In addition, the plant earned four national safety awards from the National Petroleum Refiners Association (NPRA). “Our successful VPP efforts have taken the commitment of every person in this refinery, and I’m proud of how everybody has worked together as a team to make it a safety leader,” said Mike Pesch, vice president and manager of the refinery.54
12.3 Reliability and Maintenance
Most refinery maintenance takes place during scheduled shut-downs, when refinery personnel, often with help from contractors, clean, inspect, maintain and (if necessary) repair equipment.
72 Robinson
’at its large refinery in Pascagoula, Mississippi.
honored as “Star Site” within OSHA’s Voluntary Protection Program achievements, the refinery was one of only 13 in the United States to be
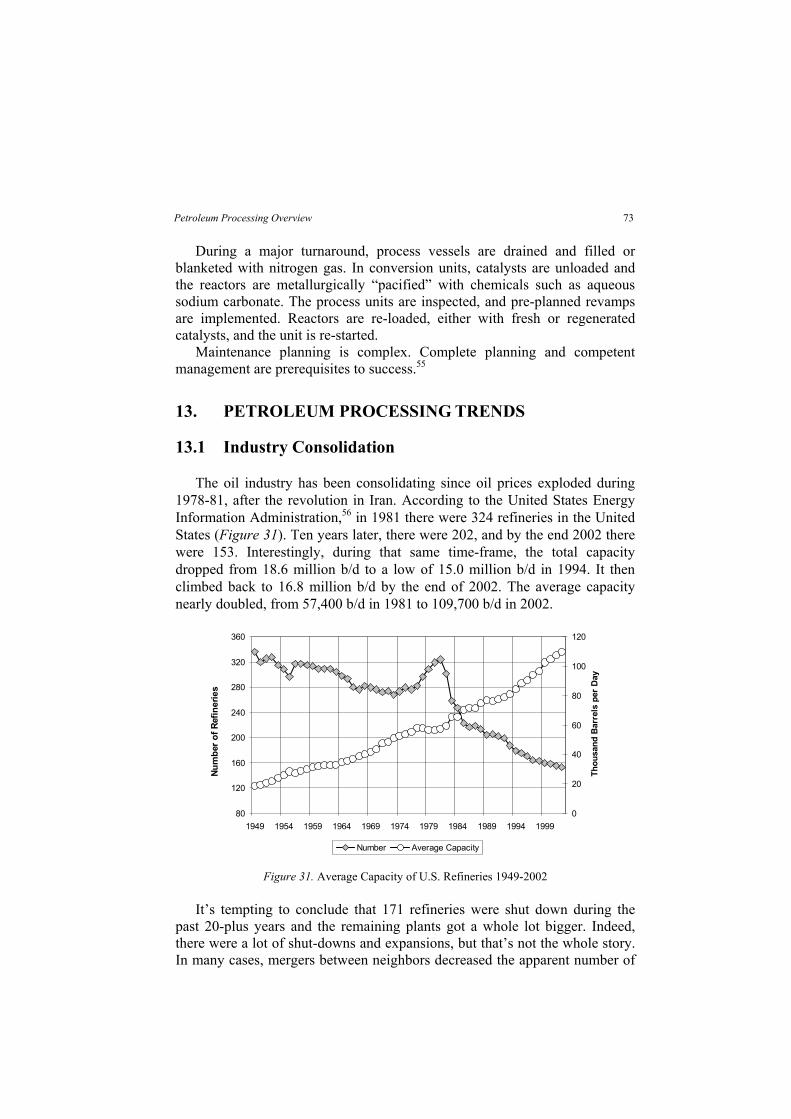
During a major turnaround, process vessels are drained and filled or
blanketed with nitrogen gas. In conversion units, catalysts are unloaded and the reactors are metallurgically “pacified” with chemicals such as aqueous sodium carbonate. The process units are inspected, and pre-planned revamps are implemented. Reactors are re-loaded, either with fresh or regenerated catalysts, and the unit is re-started.
Maintenance planning is complex. Complete planning and competent management are prerequisites to success.55
13. PETROLEUM PROCESSING TRENDS
13.1 Industry Consolidation
The oil industry has been consolidating since oil prices exploded during 1978-81, after the revolution in Iran. According to the United States Energy Information Administration,56 in 1981 there were 324 refineries in the United States (Figure 31). Ten years later, there were 202, and by the end 2002 there were 153. Interestingly, during that same time-frame, the total capacity dropped from 18.6 million b/d to a low of 15.0 million b/d in 1994. It then climbed back to 16.8 million b/d by the end of 2002. The average capacity nearly doubled, from 57,400 b/d in 1981 to 109,700 b/d in 2002.
80
120
160
200
240
280
320
360
1949 1954 1959 1964 1969 1974 1979 1984 1989 1994 19990
20
40
60
80
100
120
Thou
sand
Bar
rels
per
Da y
Number Average Capacity
Num
ber o
f Ref
iner
ies
Figure 31. Average Capacity of U.S. Refineries 1949-2002
It’s tempting to conclude that 171 refineries were shut down during the past 20-plus years and the remaining plants got a whole lot bigger. Indeed, there were a lot of shut-downs and expansions, but that’s not the whole story. In many cases, mergers between neighbors decreased the apparent number of
73Petroleum Processing Overview

plants without affecting capacity, because equipment from both predecessors continues to run at full rate. For example, the 300,000 b/d Flint Hills refinery in Corpus Christi, Texas used to be three separate plants owned by Koch Refining, Gulf States and Kerr-McGee.
Trends are similar in Western Europe. Total capacity has levelled off, but the number of refineries has decreased, in part due to mergers. Plants owned by BP and Texaco were merged to form the 380,000 b/d Netherlands Refining Company (NeRefCo). MiRO, a 283,000 b/d refinery in Karlsruhe, Germany, was created by a merger between refineries owned by Esso and by the by the four OMW partners – DEA, Conoco, Veba, and Petroleos de Venezuela.
In recent years, consolidation has evolved from relatively small mergers between neighboring refineries into mega-mergers between fully integrated oil corporations. Many of these are listed in Table 40.
Table 40. Large Mergers and Acquisitions in the Oil Industry Present Name Component Parts
BP BP, Amoco, Arco, Castrol, Veba ChevronTexaco Chevron, Texaco, Gulf ConocoPhillips Conoco, Phillips, Tosco, Unocal ExxonMobil Exxon, Mobil Total Total, Fina, Elf Valero
13.2 Environmental Regulations
A second main trend in petroleum processing – tightening environmental regulations – started in 1970 and accelerated in recent years. Major areas of improvement include: • Reduced fugitive emissions. This requires modification or replacement of
valves and compressor seals, along with more-vigilant maintenance. • Reduced particulate emissions. To reduce emission of particulates, better
cyclones and high-efficiency electrostatic precipitators are being added to FCC units. At delayed coking units, enclosed coke conveyors and storage systems have been installed.
• Reduced CO, SOx, and NOx emissions. Reduction of carbon monoxide emissions requires improved efficiency in the CO boilers of FCC units. SOx emissions from FCC units are being reduced by the hydrotreating of feedstocks, the use of SOx-transfer additives, and the addition of flue-gas scrubbing. At some plants, limitations on NOx may require the addition of post-combustion NOx-removal on boilers and heaters.
• Heat-efficiency, CO2. Energy is the largest controllable cost for a refinery. Therefore, the drive to increase heat efficiency is ever-present, especially in crude distillation units and other major energy consumers. In countries honoring the Kyoto protocol, decreased energy consumption also
74 Robinson
*Valero acquired its Paulsboro refinery from Mobil and its Benicia refinery from Exxon Valero, Phibro, Diamond Shamrock, Premcor, Ultramar*
decreases CO2 emissions. Therefore, refineries in some of these countries are receiving tax credits for energy conservation projects.
• Clean water. Regulations in OECD countries require that the quality of water leaving a refinery must be at least as good as the water that enters. Tertiary treatment technology is being installed to remove lingering traces of benzene, phenols, nitrates, ammonia, and other undesirable chemicals.
• Reformulated gasoline. The need for higher octane and lower RVP in reformulated gasoline is increasing the need for alkylate and isomerate. In some catalytic reformers, severity is being reduced. Others are being converted to BTX service. More recently, MTBE units are being used for alternative purposes, such as alkylate production.
• Low-sulfur fuels. Recent rules limiting the sulfur content of gasoline and diesel fuel are stimulating hydrotreater revamps and the installation of a large number of new hydrotreaters. This in turn is requiring an increase in sulfur recovery and hydrogen-production capacity. From a process-development standpoint, the need to produce low-sulfur fuels has driven the development of new processes – SCANfining, OCTGAIN, S Zorb Prime-G, and others – for post-treating gasoline. To prevent the contamination of ultra-clean products, storage tanks and pipelines are being re-rated.
13.3 Residue Upgrading
the start of the industry. Year by year the density and sulfur content of available crudes has slowly but surely been rising. Perhaps the discovery of some new oil field will change this trend, but for now, if refiners wish to continue meeting the demand for light products, they’ll have to be able to process heavier feeds.
Several residue upgrading processes were mentioned in previous sections, and are described in the following chapters. The main processes are: • Delayed coking • Fluid-bed coking (FLEXIcoking) • Residue hydrotreating (RDS, OCR/UFR, Resid Unionfining) • • Solvent deasphalting (ROSE® process)
13.4 Increased Oil Consumption in Developing Countries
The trends in Figure 29 show that consumption of oil in OECD countries has stabilized, but consumption in the non-OECD world continues to increase. According to an article by Jeffrey Brown of FACTS Inc.,57 China led the way
75Petroleum Processing Overview
The need for more and more heavy oil processing has been a trend since
Residue FCC (RFCC)

with 451,000 b/d of growth in 2003. Overall, Asia accounted for 664,000 b/d of the 1.6 million b/d of global incremental demand growth in 2003.
China will continue to drive consumption growth and affect regional product trade, prices, and refining margins. India is also likely to return to higher growth, and the region’s midsized markets, such as Thailand and Indonesia, will post strong growth. In 2004, FACTS Inc. expects demand growth of 386,000 b/d in China, 22,000 b/d in South Korea, and 31,000 b/d in India. After 2004, average worldwide petroleum demand will increase by 2.5 to 3.0% per year, with Asia accounting for about half of the growth.
13.5 Automation
Advanced process control (APC) and model-predictive control (MPC) are widely used in the industry. Real-time optimization (RTO) is rather new, but
APC, MPC and RTO require modern instrumentation, which includes actuator valves, distributed control systems (DCS), high-flux data highways, analyzers, and dedicated computers. They also require trained support staff, which at this writing is in short supply.
14. SUMMARY
Modern petroleum processing started in 1860. During the past 14 decades, it has grown in response to market drivers, particularly the demand for transportation fuels. In recent years, in response to economic drivers and pressure from environmental regulations, the industry has been changing.
We sincerely hope this book is a help to people who wish to gain a better understanding of the industry today.
15. REFERENCES
1. Energy in the United States, 1635-2000, Energy Information Administration, U.S. Department of Energy: Washington, D.C., 2003
2. Moldauer, B. (ed.) All About Petroleum, American Petroleum Institute: Washington, D.C., 1998
3. Weinkauf, K. “The Many Uses of Petroleum from Discovery to Present,” Desk and Derrick Club of Tulsa: Tulsa, Oklahoma, 2003
4. Significant Events in the History of Energy, Energy Information Administration, U.S. Department of Energy: Washington, D.C., 2003
5. “World Oil Balance Data” International Petroleum Monthly, 2004 (2) Table 2.1 6. Scotese, D. “Jacksdale and the Surrounding Neighborhood” A Village Remembered, from
the Ironville Post Office, Number 1 Market Street: Ironville, Nottingham, UK 7. “Oil Shale” Wikipedia, The Free Encyclopedia, 2004 (http://en.wikipedia.org) 8. “Major Developments in the History of the Polish Oil Industry” Polish Oil and Gas
Company: Warsaw, 2003 (http://www.pgnig.pl/en/pgnig/firma/histria/przemysl)
76 Robinson
its acceptance is growing Chapter 22.

9. Robbins, J.S. How Capitalism Saved the Whales, Foundation for Economic Education, Irvington-on-Hudson, New York, 1997
10. Pees, S.T. “Whale Oil Versus the Others” Oil History, Samuel T. Pees, Meadville, Pennsylvania, 2004
11. McCusker, J.J. How Much Is That in Real Money? A Historical Commodity Price Index for Use as a Deflator of Money Values in the Economy of the United States (2nd Ed.), American Antiquarian Society: Worcester, MA, 2001
12. Spencer, A.L. “Arkansas’ First Oil Refinery“ Arkansas Historical Quarterly 1957 (16), 335
13. Yergin, D. The Prize:The Epic Quest for Oil, Money and Power, The Free Press: New York, 1993
14. Economic Research Service “A History of American Agriculture, 1776-1990,” United States Department of Agriculture, Washington, D.C., 2004
15. Berger, B.D.; Anderson, K.E. Modern Petroleum: A Basic Primer of the Industry (2nd ed.) PennWell: Tulsa, 1981
16. Robbins, W.K.; Hsu, C.S. “Composition,” in the Kirk-Othmer Encyclopedia of Chemical Technology (4th ed.) John Wiley & Sons: New York, 1996
17. Altgelt, K.H.; Boduszynski, M.M. Composition and Analysis of Heavy Petroleum Fractions, Marcel Dekker: New York, 1994.
18. NIST Standard Reference Database, No. 69, National Institute of Standards and Technology: Boulder, Colorado, 2003
19. Coffey, F., Layden, J., Allerton, C. (ed.) America on Wheels: The First 100 Years, General Publishing Group: Santa Monica, California, 1996
20. “UOP‘s History” About UOP, UOP LLC: Des Plaines, Illinois, 2003 21. Palucka, T. “Doing the Impossible” Invention & Technology 2004 (3), 22 22. E.I. Shaheen Catalytic Processing in Petroleum Refining, PennWell: Tulsa, Oklahoma,
1983 23. Leffler, W.L. Petroleum Refining for the Non-Technical Person (2nd ed.), PennWell:
Tulsa, Oklahoma, 1979, 1985 24. “Petroleum Refining Processes” OSHA Technical Manual (Section IV: Ch. 2),
Occupational Health and Safety Administration: Washington, D.C., 2001 25. “Refining Processes” Hydrocarbon Processing 2002 (1), 85-148 26. CVX crude marketing web page, http://www.chevrontexaco.com/crudemarketing, 2004 27. Yields for Green Canyon crude were taken from the following reference and adjusted to
match the boiling ranges used for the other 3 assays: “BP Assays Field in Gulf of Mexico” Oil & Gas Journal, February 17, 2003
28. “Weekly Production by Product,” Energy Information Administration, U.S. Department of Energy: Washington, D.C., 2004
29. “Types of Petroleum Coke” Products and Services: Global Carbon, ConocoPhillips: Houston, Texas, 2004 (http://www.conoco.com/products/global_carbon/types.asp)
30. Magee, J.S.; Dolbear, G.E. Petroleum Catalysis in Nontechnical Language, PennWell: Tulsa, Oklahoma, 1998
31. “Wax Facts” National Petroleum Refiners Association: Washington, D.C., 2003 32. For more information, refer to: http://www.utexas.edu/research/superpave/index.html 33. “MTBE Questions and Answers” Fortum Corporation, www.fortum.com, 2004 34. EPA‘s Program for Cleaner Vehicles and Cleaner Gasoline, Document No. EPA420-F-
99-051, U.S. Environmental Protection Agency: Washington, D.C., 1999 35. Heavy-Duty Engine and Vehicle Standards and Highway Diesel Fuel Sulfur Control
Requirements, Document No. EPA 420-F-00-057, U.S. Environmental Protection Agency: Washington, D.C., 2000
36. Reducing Nonroad Diesel Emissions: Low Emission Program Summary, Document No. EPA420-F-03-008, U.S. Environmental Protection Agency: Washington, D.C., 2003
37. Final Report of the Government Working Group in Sulfur in Gasoline and Diesel Fuel, Summary and Recommendations, Environment Canada: Ottawa, 1999
77Petroleum Processing Overview
38. Hanson, R.; Lee, C.K..; Rost, K-D.; Herold, R.; Chou, T-S. “German Refiner Produces Ultra-Low Sulfur Diesel” Oil & Gas Journal, 6/2/03
39. “Sweden Natur Vards Verket: Input from Swedish Experts to the European Auto-Oil Programme” Directive on Fuel Quality, European Commission: Brussels, 1995
40. Setting National Fuel Standards. Paper 3. Proposed Model for Standards Implementation, Environment Australia: Canberra, 2000
41. Walsh, M.P. Car Lines, 2000 (4) 42. Motor Vehicle Environmental Pollution Control in Japan, Environment Agency of Japan,
Automotive Pollution Control Division: Tokyo, 1999 43. Shorey, S.W.: Lomas, D.A.: Keesom, W.H. “Improve Refinery Margins and Produce
Low-Sulfur Fuels,” World Refining Special Edition, 1999 (Summer), p. 41 44. Stynes, P.C.; Shepherd, T.; Thompson, M.; Kidd, D. “Innovation Key to New Technology
Project Success: Phillips S Zorb Becomes Low Sulfur Gasoline Solution,” AM-01-43 National Petroleum Refiners Association, Washington. D.C., 2001
45. Bacha, J., et al. Diesel Fuels Technical Review (FTR-2), Chevron Products Company: Richmond, California, 1998
46. Heavy-Duty Standards / Diesel Fuel RIA, Document No. EPA 420-R-00-026, Table IV.A-1, U.S. Environmental Protection Agency, Washington, D.C., 2000
47. Claus, C.F. German Patent DE 17399, August 26, 1881 48. Markum, J. “Refiners Urged to Capture, Defend Prosperity, Oil & Gas Journal,
November 10, 1977 49. International Energy Annual 2002, U.S. Energy Information Administration: Washington,
D.C., 2004 50. Statistical Review of World Energy (52nd Ed.), BP plc: London, 2003. 51. Johnston, D. “Refining Report: Complexity Index Indicates Refinery Capability, Value,”
Oil & Gas Journal, May 18, 1996 52. Flournoy, C. “Refinery Accidents, Anxiety Increase,” Dallas Morning News, October 1,
2000 53. http://www.chevron.com/about/pascagoula/safeoperations/ 54. “Valero‘s Paulsboro Refinery Honored with OSHA’s Highest Safety Recognition,” Valero
Energy Corporation, San Antonio, Texas, July 28, 2004 55. Oliver, R. “Complete Planning for Maintenance Turnarounds Will Ensure Success” Oil &
Gas Journal, April 29, 2002 56. Annual Energy Review 2002, U.S. Energy Information Administration: Washington, D.C.,
2004. 57. Brown, J. “China will continue leading product demand growth in Asia-Pacific,” Oil &
Gas Journal, May 17, 2004.
78 Robinson