
Petroleum & Petrochemical Engineering Journal · PDF filethermodynamic data. Using Aspen...
11
Petroleum & Petrochemical Engineering Journal Pinch Analysis in Optimising Energy Consumption on a Naphtha Hydrotreating Unit in a Refinery Pet Petro Chem Eng J Pinch Analysis in Optimising Energy Consumption on a Naphtha Hydrotreating Unit in a Refinery Paiko II 1 , Azeez OS 2 , Makwashi N 3 and Zhao D 3 * 1 Department of Chemical Engineering, Federal Polytechnic Bida, Nigeria 2 Department of Chemical Engineering, Federal University of Technology, Nigeria 3 Division of Chemical and Petroleum Engineering, London South Bank University, UK *Corresponding author: Donglin Zhao, Division of Chemical and Petroleum Engineering, London South Bank University, UK, Tel: 02078157917; Email: [email protected] Abstract Energy consumption plays a significant role in process profitability. This is particularly important for energy intensive business such as petrochemical industries, cement factories, oil refineries and other plants that involve thermos-chemical processes. One of the efficient ways to reduce energy consumption is through energy integration, especially for the process where numerous heat sources and sinks exist. Pinch analysis is one of globally recognized and well-proven methods in identifying the most economical ways of maximizing heat recovery and minimising the demand for external utilities (e.g., steam and cooling water). This paper discusses the application of pinch analysis in optimising energy consumption of a heat exchanger network based on a Naphtha Hydrotreating Unit (NHU) in a refinery based in Nigeria. Realistic process streams data were used as input in the NHU simulation using Aspen Plus to extract necessary thermodynamic data. Using Aspen Pinch, the Heat Exchanger Network (HEN) for the NHU plant was designed, followed by strict application of pinch analysis and its principle to the process plant. The minimum temperature approach was optimised to obtain the optimum ∆ of 15 ℃ for the minimum total annualised cost. The final heat exchanger network designed, based on this optimum ∆ , is also presented along with its composite curve, grand composite curve and total annualized cost. With the analysis of the NHU plant, an improved heat exchanger network (HEN) was obtained. Nineteen heat exchangers with the surface area of 2113.6m 2 were used to obtain a minimum annual capital cost (ACC) of $17,301.46/yr, annual operating cost (AOC) of $561,994.20/yr and total annualized cost (TAC) of $579,295.66/yr. Keywords: Pinch analysis; Heat exchanger network; Naphtha Hydrotreating Unit (NHU); Aspen Pinch Introduction Energy consumption plays a vital role in process industries. This is particularly important for energy intensive business such as petrochemical industries, cement factories, oil refineries and other plants that involve thermos-chemical processes. Excessive energy usage inevitably results in penalty on process profit. It can Research Article Volume 1 Issue 5 Received Date: September 06, 2017 Published Date: October 02, 2017
Transcript of Petroleum & Petrochemical Engineering Journal · PDF filethermodynamic data. Using Aspen...
Petroleum & Petrochemical Engineering Journal
Pinch Analysis in Optimising Energy Consumption on a Naphtha Hydrotreating Unit in a Refinery Pet Petro Chem Eng J
Pinch Analysis in Optimising Energy Consumption on a
Naphtha Hydrotreating Unit in a Refinery
Paiko II1, Azeez OS2, Makwashi N3 and Zhao D3*
1Department of Chemical Engineering, Federal Polytechnic Bida, Nigeria
2Department of Chemical Engineering, Federal University of Technology, Nigeria
3Division of Chemical and Petroleum Engineering, London South Bank University, UK
*Corresponding author: Donglin Zhao, Division of Chemical and Petroleum Engineering, London South Bank University,
UK, Tel: 02078157917; Email: [email protected]
Abstract
Energy consumption plays a significant role in process profitability. This is particularly important for energy intensive
business such as petrochemical industries, cement factories, oil refineries and other plants that involve thermos-chemical
processes. One of the efficient ways to reduce energy consumption is through energy integration, especially for the
process where numerous heat sources and sinks exist. Pinch analysis is one of globally recognized and well-proven
methods in identifying the most economical ways of maximizing heat recovery and minimising the demand for external
utilities (e.g., steam and cooling water). This paper discusses the application of pinch analysis in optimising energy
consumption of a heat exchanger network based on a Naphtha Hydrotreating Unit (NHU) in a refinery based in Nigeria.
Realistic process streams data were used as input in the NHU simulation using Aspen Plus to extract necessary
thermodynamic data. Using Aspen Pinch, the Heat Exchanger Network (HEN) for the NHU plant was designed, followed
by strict application of pinch analysis and its principle to the process plant. The minimum temperature approach was
optimised to obtain the optimum ∆𝑇𝑚𝑖𝑛 of 15 ℃ for the minimum total annualised cost. The final heat exchanger network
designed, based on this optimum ∆𝑇𝑚𝑖𝑛 , is also presented along with its composite curve, grand composite curve and total
annualized cost. With the analysis of the NHU plant, an improved heat exchanger network (HEN) was obtained. Nineteen
heat exchangers with the surface area of 2113.6m2 were used to obtain a minimum annual capital cost (ACC) of
$17,301.46/yr, annual operating cost (AOC) of $561,994.20/yr and total annualized cost (TAC) of $579,295.66/yr.
Keywords: Pinch analysis; Heat exchanger network; Naphtha Hydrotreating Unit (NHU); Aspen Pinch
Introduction
Energy consumption plays a vital role in process industries. This is particularly important for energy
intensive business such as petrochemical industries, cement factories, oil refineries and other plants that involve thermos-chemical processes. Excessive energy usage inevitably results in penalty on process profit. It can
Research Article
Volume 1 Issue 5
Received Date: September 06, 2017
Published Date: October 02, 2017

Petroleum & Petrochemical Engineering Journal
Zhao D, et al. Pinch Analysis in Optimising Energy Consumption on a Naphtha Hydrotreating Unit in a Refinery. Pet Petro Chem Eng J 2017, 1(5): 000126.
Copyright© Zhao D, et al, et al.
2
also generate negative impact to the environment and cause energy crisis and global warming. Process engineers therefore always aim to design energy efficient processes. One of the best ways to achieve this is through energy integration. Energy integration can be defined as systematic methods for generating integrated energy recovery systems [1]. It involves minimizing the consumption of external utilities thus leading to an increased system efficiency of a process [2]. Heat integration is a branch of energy integration where only heat effects (temperature considerations) are taken into account [3]. Pinch analysis is one of globally recognised and well-proven methods in identifying the most economical ways of maximizing heat recovery and minimising the demand for external utilities (e.g., steam and cooling water). In a pinch analysis all streams are defined on the basis of their start and targettemperatures (T), heating value (Cp) and mass flow (F) and are divided into either hot or cold streams [4]. A hot stream is defined as a stream which needs to be cooled to reach its target temperature. A cold stream needs to be heated to reach its targettemperature [5]. Pinch technology is used to determine the minimum requirements of both hot and cold utilities in a process line. On rigorous thermodynamic principles, Pinch technology matches cold streams that need to be heated with hot streams which need to be cooled, causing a high degree of energy recovery. The process pinch point refers to the energy optimum point in the process design, the temperature level above this point acting as heatsink, and the one below as heat source [6,7]. Comprehensive review of pich technolog are contained in [6,8]. In the literature, there is little research on the
application of pinch analysis to hydrotreating unit in refinery plant. This paper discusses how to use pinch analysis in optimising energy consumption of a heat exchanger network for a Naphtha Hydrotreating Unit (NHU) in a refinery based in Nigeria. The aim of this research is to design a heat exchanger network with a high degree of energy recovery and minimise total annual cost (TAC). Aspens Engineering Suite (AES) was used to simulate the refinery process and Aspen pinch is employed for energy integration.
Methodology
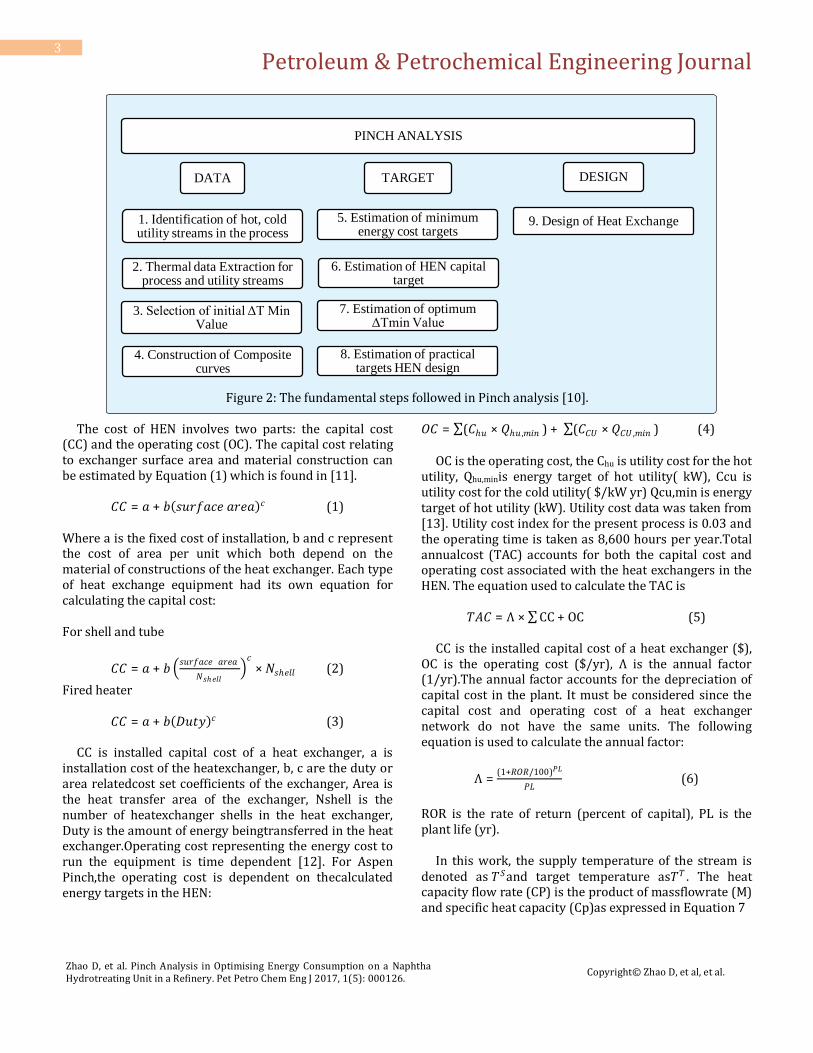
Naphtha hydrotreating is an essential step for gasoline production. It is located after the crude oil distillation and before isomerization and catalytic reforming units [9]. The purpose of this unit is to produce clean desulfurized naphtha cut for isomerization and reforming units as the catalysts involve in these units are very sensitive to impurities such as sulphur, nitrogen, water, halogen, diolefins, olefins, arsenic, mercury and other metals. The high performances of isomerization and reforming units are very much dependent upon the efficiency of the naphtha pretreating. A simple process flow diagram of the Naphtha Hydrotreating Unit is shown in Figure 1. The unit has a total of seventeen process streams comprising of five cold and twelve hot streams. The stream parameters such as temperature, pressure, composition and enthalpy can be extracted from the simulation. Once the process data extracted, Aspen Pinch is applied to generate heat exchanger network (HEN) with the minimise cost for the process. The fundamental steps that are followed in pinch analysis are outlined in Figure 2. Results are evaluated by the relative amount of the cost saved and investment needed.
Figure 1: Process flow diagram of the Naphtha Hydrotreating Unit.
Petroleum & Petrochemical Engineering Journal
Zhao D, et al. Pinch Analysis in Optimising Energy Consumption on a Naphtha Hydrotreating Unit in a Refinery. Pet Petro Chem Eng J 2017, 1(5): 000126.
Copyright© Zhao D, et al, et al.
3
Figure 2: The fundamental steps followed in Pinch analysis [10]. The cost of HEN involves two parts: the capital cost (CC) and the operating cost (OC). The capital cost relating to exchanger surface area and material construction can be estimated by Equation (1) which is found in [11].
𝐶𝐶 = 𝑎 + 𝑏 𝑠𝑢𝑟𝑓𝑎𝑐𝑒 𝑎𝑟𝑒𝑎 𝑐 (1) Where a is the fixed cost of installation, b and c represent the cost of area per unit which both depend on the material of constructions of the heat exchanger. Each type of heat exchange equipment had its own equation for calculating the capital cost: For shell and tube
𝐶𝐶 = 𝑎 + 𝑏 𝑠𝑢𝑟𝑓𝑎𝑐𝑒 𝑎𝑟𝑒𝑎
𝑁𝑠ℎ𝑒𝑙𝑙 𝑐
× 𝑁𝑠ℎ𝑒𝑙𝑙 (2)
Fired heater
𝐶𝐶 = 𝑎 + 𝑏 𝐷𝑢𝑡𝑦 𝑐 (3) CC is installed capital cost of a heat exchanger, a is installation cost of the heatexchanger, b, c are the duty or area relatedcost set coefficients of the exchanger, Area is the heat transfer area of the exchanger, Nshell is the number of heatexchanger shells in the heat exchanger, Duty is the amount of energy beingtransferred in the heat exchanger.Operating cost representing the energy cost to run the equipment is time dependent [12]. For Aspen Pinch,the operating cost is dependent on thecalculated energy targets in the HEN:
𝑂𝐶 = (𝐶ℎ𝑢 × 𝑄ℎ𝑢 ,𝑚𝑖𝑛 ) + (𝐶𝐶𝑈 × 𝑄𝐶𝑈 ,𝑚𝑖𝑛 ) (4) (4) OC is the operating cost, the Chu is utility cost for the hot utility, Qhu,minis energy target of hot utility( kW), Ccu is utility cost for the cold utility( $/kW yr) Qcu,min is energy target of hot utility (kW). Utility cost data was taken from [13]. Utility cost index for the present process is 0.03 and the operating time is taken as 8,600 hours per year.Total annualcost (TAC) accounts for both the capital cost and operating cost associated with the heat exchangers in the HEN. The equation used to calculate the TAC is
𝑇𝐴𝐶 = Ʌ × CC + OC (5) CC is the installed capital cost of a heat exchanger ($), OC is the operating cost ($/yr), Ʌ is the annual factor (1/yr).The annual factor accounts for the depreciation of capital cost in the plant. It must be considered since the capital cost and operating cost of a heat exchanger network do not have the same units. The following equation is used to calculate the annual factor:
Λ =(1+𝑅𝑂𝑅/100)𝑃𝐿
𝑃𝐿 (6)
ROR is the rate of return (percent of capital), PL is the plant life (yr). In this work, the supply temperature of the stream is denoted as 𝑇𝑆and target temperature as𝑇𝑇 . The heat capacity flow rate (CP) is the product of massflowrate (M) and specific heat capacity (Cp)as expressed in Equation 7
PINCH ANALYSIS
DATA
1. Identification of hot, cold utility streams in the process
2. Thermal data Extraction for process and utility streams
3. Selection of initial ΔT Min Value
4. Construction of Composite curves
TARGET
5. Estimation of minimum energy cost targets
6. Estimation of HEN capital target
7. Estimation of optimum ΔTmin Value
8. Estimation of practical targets HEN design
DESIGN
9. Design of Heat Exchange

Petroleum & Petrochemical Engineering Journal
Zhao D, et al. Pinch Analysis in Optimising Energy Consumption on a Naphtha Hydrotreating Unit in a Refinery. Pet Petro Chem Eng J 2017, 1(5): 000126.
Copyright© Zhao D, et al, et al.
4
𝐶𝑃 = 𝐶𝑝 × 𝑀 (7) Where CP is heat capacity flow rate (kW/oC),Cp is the specific heat capacity of the stream and M is the mass flow rate (Kg/s). The CP of a stream is measured as enthalpy change per unit temperature (KW/ºC) or equivalent unit. Enthalpy change H can be calculated using Equation 8
H = CP (TS − TT) (8) Where TS is Supply temperature,i.e,the temperature which the stream is available whileTT is the Target temperature, i.e, the temperature the stream must be taken to. Note that Equations (1) through (8) contained in Aspen pinch as stated above are similar to other pich techniqes based work.
Base Case Hen Analysis
Heat integration studies are performed for the process flow diagram of a Nigerian based Naphtha hydrotreating unit. In the first step of the analysis, data is extracted from
the steady state process flow diagram afteridentification of streams in the processandthe grid diagram is developed andshown in Figure 3. In the next step, an alternative design for the base case was developed and it is shown in Figure 4. When designing a heat exchanger network there are three rules that are very important to keep in mind. These are; do not cool above the pinch; do not heat below the pinch and do not transfer heat through the pinch. Violations of any of these rules results in unnecessary heating or cooling demand in the process, Cooling above the pinch implies that heat is extracted from a system which has a deficit of heat and the same amount of heat must be added by an external heater. Heating below the pinch results in heating in a place that already has excess of heat and the same amount of heat must be cooled with external coolers. Heat transfer through the pinch imply more heat added above the pinch than needed, the heat follows through the whole system and in the end has to be cooled away below the pinch. These rules form the basis of the network design procedure for heat exchangers synthesis.
Figure 3: NHU case grid diagram showing the above and below pinch Segments.

Petroleum & Petrochemical Engineering Journal
Zhao D, et al. Pinch Analysis in Optimising Energy Consumption on a Naphtha Hydrotreating Unit in a Refinery. Pet Petro Chem Eng J 2017, 1(5): 000126.
Copyright© Zhao D, et al, et al.
5
Figure 4: The Below pinch stream matching of NHU heat exchange between process streams is not practical or economically viable.
Results are explained withcomposite curve as shown in Figure 5 and grand composite curve in Figure 6. HEN for the current process is represented as grid diagram and is shown in Figure 3. This grid represents the countercurrent nature of the heat exchange that makes it easier to check exchanger temperature feasibility. Hot streams are represented by thick red color lines in the upper portion of the grid diagram and the cold streams are represented by blue thick lines in the lower portion. The base case has seven exchangers betweenprocess streams. Hot and cold composite curves are combined and are shown as acomposite curve in Figure 5. The composite curve represents heating and cooling demand of the
process corresponding to the temperature range. The quantity of maximum energy recovery can be calculated from the composite curve. The close gap in the diagram shows the ∆Tmin, which means the minimum temperature difference allowedbetween streams that exchange heat. The smaller ∆Tmin the more heat can betransferred in the heat exchanger, but this will also lead to larger heat exchanger areawhich is costly. Hence,∆Tmin should be selected based on economic considerationsand experience.For the present study, ∆Tmin is identified as 15 ºC.The pinch point is the point where the two curves approach closest and the temperature difference of two composite curves is ∆Tmin.
Figure 5: Combined Temperature Composite Curve for Naphtha Hydrotreating Unit.
Case: NHUcompleted
HOT COLD
ENTHALPY X103 kW
TE
MP
ER
ATU
RE
°C
0.0 10.0 20.0 30.0 40.0 50.0 60.0 0.0
50.0
100.0
150.0
200.0
250.0
300.0
350.0
400.0 DTMIN =15.00 Heat Balance
TEMPERATURE COMPOSITES (Real T, No Utils)
Hot Composite Curve
Cold Composite Curve
Petroleum & Petrochemical Engineering Journal
Zhao D, et al. Pinch Analysis in Optimising Energy Consumption on a Naphtha Hydrotreating Unit in a Refinery. Pet Petro Chem Eng J 2017, 1(5): 000126.
Copyright© Zhao D, et al, et al.
6
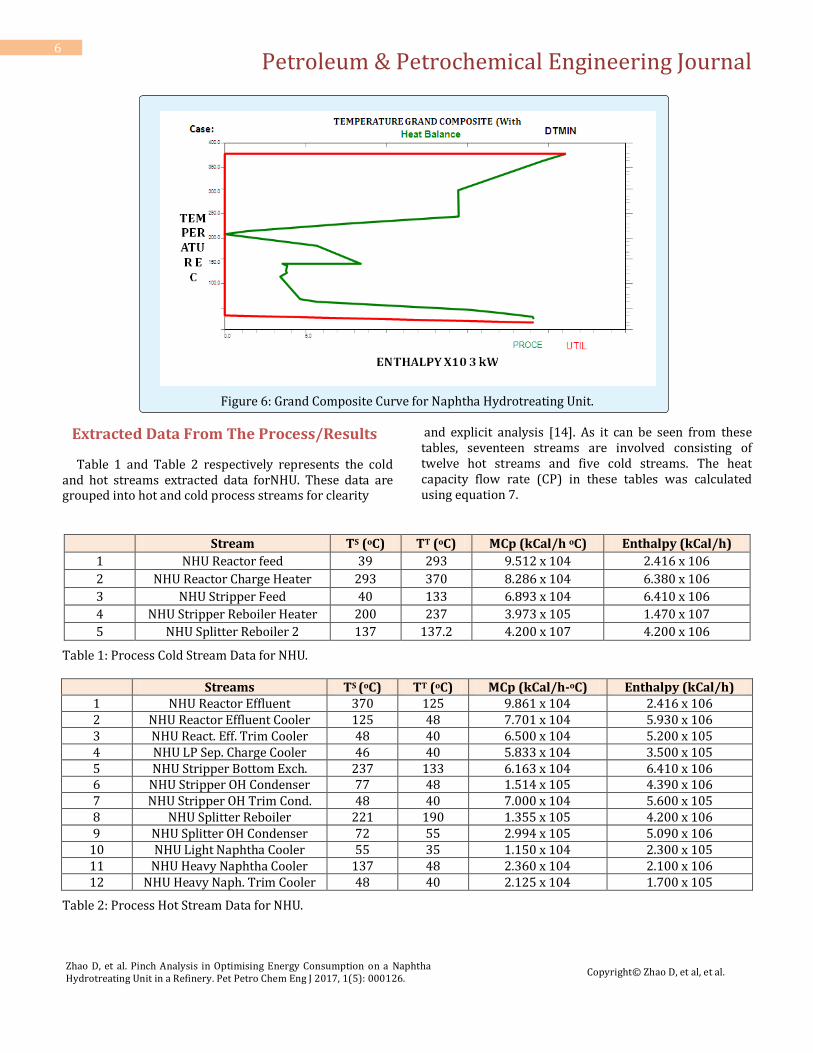
Figure 6: Grand Composite Curve for Naphtha Hydrotreating Unit.
Extracted Data From The Process/Results
Table 1 and Table 2 respectively represents the cold and hot streams extracted data forNHU. These data are grouped into hot and cold process streams for clearity
and explicit analysis [14]. As it can be seen from these tables, seventeen streams are involved consisting of twelve hot streams and five cold streams. The heat capacity flow rate (CP) in these tables was calculated using equation 7.
Stream TS (oC) TT (oC) MCp (kCal/h oC) Enthalpy (kCal/h)
1 NHU Reactor feed 39 293 9.512 x 10⁴ 2.416 x 10⁶
2 NHU Reactor Charge Heater 293 370 8.286 x 10⁴ 6.380 x 10⁶
3 NHU Stripper Feed 40 133 6.893 x 10⁴ 6.410 x 10⁶
4 NHU Stripper Reboiler Heater 200 237 3.973 x 10⁵ 1.470 x 10⁷
5 NHU Splitter Reboiler 2 137 137.2 4.200 x 10⁷ 4.200 x 10⁶
Table 1: Process Cold Stream Data for NHU.
Streams TS (oC) TT (oC) MCp (kCal/h-oC) Enthalpy (kCal/h)
1 NHU Reactor Effluent 370 125 9.861 x 10⁴ 2.416 x 10⁶ 2 NHU Reactor Effluent Cooler 125 48 7.701 x 10⁴ 5.930 x 10⁶ 3 NHU React. Eff. Trim Cooler 48 40 6.500 x 10⁴ 5.200 x 10⁵ 4 NHU LP Sep. Charge Cooler 46 40 5.833 x 10⁴ 3.500 x 10⁵ 5 NHU Stripper Bottom Exch. 237 133 6.163 x 10⁴ 6.410 x 10⁶ 6 NHU Stripper OH Condenser 77 48 1.514 x 10⁵ 4.390 x 10⁶ 7 NHU Stripper OH Trim Cond. 48 40 7.000 x 10⁴ 5.600 x 10⁵ 8 NHU Splitter Reboiler 221 190 1.355 x 10⁵ 4.200 x 10⁶ 9 NHU Splitter OH Condenser 72 55 2.994 x 10⁵ 5.090 x 10⁶
10 NHU Light Naphtha Cooler 55 35 1.150 x 10⁴ 2.300 x 10⁵ 11 NHU Heavy Naphtha Cooler 137 48 2.360 x 10⁴ 2.100 x 10⁶ 12 NHU Heavy Naph. Trim Cooler 48 40 2.125 x 10⁴ 1.700 x 10⁵
Table 2: Process Hot Stream Data for NHU.
Petroleum & Petrochemical Engineering Journal
Zhao D, et al. Pinch Analysis in Optimising Energy Consumption on a Naphtha Hydrotreating Unit in a Refinery. Pet Petro Chem Eng J 2017, 1(5): 000126.
Copyright© Zhao D, et al, et al.
7
Composite Curves (CC)
Composite Curves consist of temperature (T) - Enthalpy (H) Profile of heat availability in the process (the Hot Composite Curve) and heat demand in the process (the cold Composite curve) together in a graphical representation as seen in Figure 5. This curve consists of a series of connected straight lines with different slopes
representing the changes in overall hot stream capacity flow rates (CP). The combined Composite Curves are used to predict targets for Minimum Energy (Both hot and cold) required, Minimum Network Area required and Minimum Number of Exchanger Units required. Table 3 shows the detailed results obtained from the composite curves in Figure 5.
Minimum Utility Temperature Minimum
Hot (kW) Cold (kW) ΔTmin (°C) Pinch Temp. (°C) Total Area (m2) No. of Unit No. of Shells
21226.1 19205.4 15 207.5 2156.2 21 25
Table 3: Targeted Results for NHU Design.
Grand Composite Curve (GCC)
The Grand composite curves (GCC) help in the selection of the Utility by minimizing the use of expensive utility level [15]. It shows the variation of heat supply and demands within the process. Figure 6 shows the grand composite curve (GCC) for the Naphtha Hydrotreating Unit. The thick red and green curves show the utility and the process curves respectively.
Design of Heat Exchanger Network for NHU
Analysis of the extracted data in Table 1 and 2 from Problem Table and combined composite curve revealedthat the minimum requirement of utility is 21226.1 kW for heating and 19205.4 kW for cooling. The pinch occurs where the hot streams are at 215oC and the cold at 200oC. The grid structure for this problem is shown in Figure 3 with the pinch represented as a vertical continuous black line. The design of the NHU is divided into two independent segments i.e. above and below pinch design. This segmentation is done to yield effective and reliable design as recommended by Linnhoff and Flower.
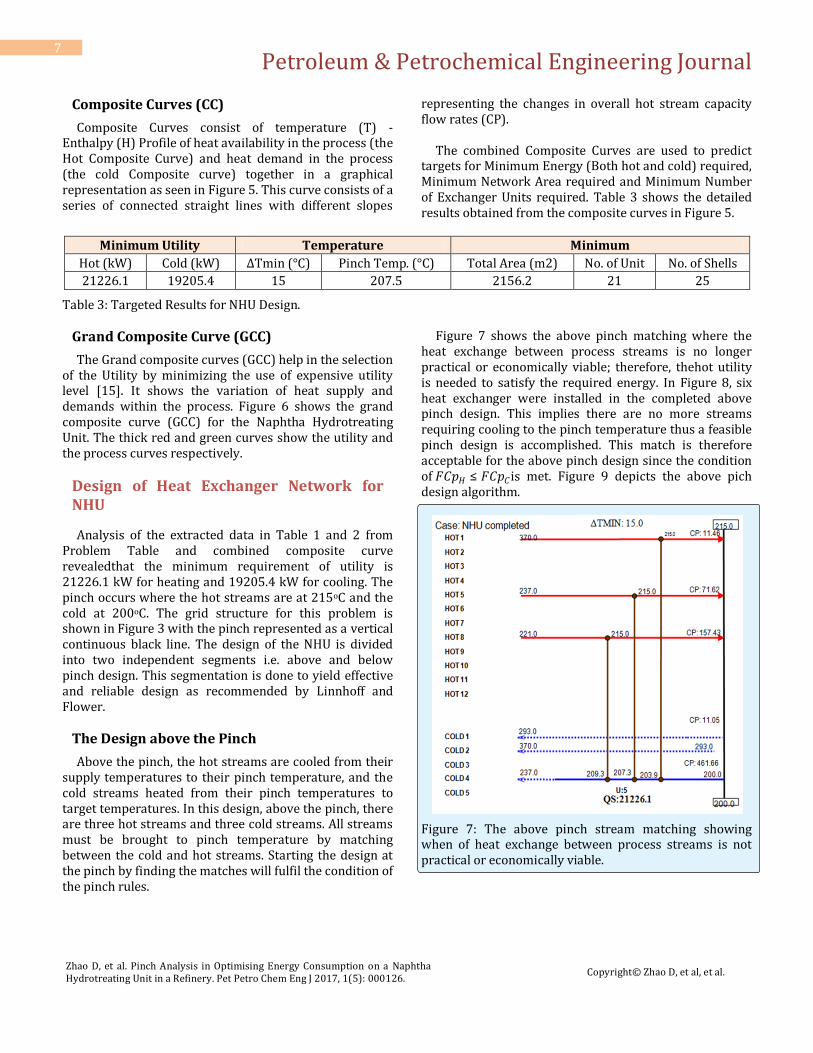
The Design above the Pinch
Above the pinch, the hot streams are cooled from their supply temperatures to their pinch temperature, and the cold streams heated from their pinch temperatures to target temperatures. In this design, above the pinch, there are three hot streams and three cold streams. All streams must be brought to pinch temperature by matching between the cold and hot streams. Starting the design at the pinch by finding the matches will fulfil the condition of the pinch rules.
Figure 7 shows the above pinch matching where the heat exchange between process streams is no longer practical or economically viable; therefore, thehot utility is needed to satisfy the required energy. In Figure 8, six heat exchanger were installed in the completed above pinch design. This implies there are no more streams requiring cooling to the pinch temperature thus a feasible pinch design is accomplished. This match is therefore acceptable for the above pinch design since the condition of 𝐹𝐶𝑝𝐻 ≤ 𝐹𝐶𝑝𝐶is met. Figure 9 depicts the above pich design algorithm.
Figure 7: The above pinch stream matching showing when of heat exchange between process streams is not practical or economically viable.

Petroleum & Petrochemical Engineering Journal
Zhao D, et al. Pinch Analysis in Optimising Energy Consumption on a Naphtha Hydrotreating Unit in a Refinery. Pet Petro Chem Eng J 2017, 1(5): 000126.
Copyright© Zhao D, et al, et al.
8
Figure 8: Completed acceptable above pinch design for NHU with Hot.
Figure 9: Complete Procedure for Above the Pinch Design.
The Design below the Pinch
This design steps follows the same philosophy as that of the above pinch only with the design criterion that mirrors those for the above pinch design. It is expected to bring the cold streams to pinch temperature by interchanging with hot streams. When the match between process streams is not practical or economically viable, the utility is employed. As it can be seen in Figure 4, onlystreams six were successefully matched satisfying the energy requirment for the cold streams. In Figure 10, thecold utility is introduced to meet up with the required energy of the hot streams and Thirteen units of the heat exchanger were sufficient to complete the below pinch design. Immidiately below the pinch, the necessary criterion is 𝐹𝐶𝑝𝐻 ≥ 𝐹𝐶𝑝𝐶 which is inverseof the criterion for design immidiately above the pinch. Figure 11 shows the below pinch design algorithm.
Figure10: Completed acceptable Below Pinch design for theNHU with cold Utility.

Petroleum & Petrochemical Engineering Journal
Zhao D, et al. Pinch Analysis in Optimising Energy Consumption on a Naphtha Hydrotreating Unit in a Refinery. Pet Petro Chem Eng J 2017, 1(5): 000126.
Copyright© Zhao D, et al, et al.
9
Figure 11: Complete Procedure for Below the Pinch Design.
Complete Design
Putting the ‘’hot end’’ and ‘’cold end’’ of the above and below pinch design together gives the completed design in Figure 12. It achieves the best energy performance for a ΔTMIN of 15 OC incorporating nineteen heat exchangers with total annual cost (TAC) of $579,295.66.
Figure 12: Completed Heat Exchanger Network Design for NHU featuring nineteen units with a TAC of $579,295.66/Year.
kW US$/Yr US$/Yr US$/Yr
Total Hot Utility Energy Usage 21226.1 319,999.49
Total Cold Utility Energy Usage 22473.2 241,994.70
Annualized Energy cost (∑H&CUTYEnergy))
561,994.20
Annualized Capital cost
17,301.46
Total Annualized Cost (∑AECandACC)
579,295.66
Table 4: Summary of Cost and Quantity of Energy Incurred/Consumed in the Design of NHU.
The cost implications and energy consumedin form of utility areshowned Table 4. For the completed NHU design21226.1 kW worth of hot utility energy is used at a cost $319,999.49/Yr and 22473.2 kW at $241,994.70/Yrof cold utility were alsoincurred. Thecost summation for the hot and cold energy used yield the annualized energy cost i.e. annual operating cost (AOC) of $561,994.20/Yr while the annualized capital costwas $17,301.46/Yr. In this design, the total annual cost (TAC),
the sum of Annualized Energy cost (AOC) and Annualized Capital cost (ACC) was $579,295.66/yr.
Comparison of Used to Targets
Table 5 shows the comparisons between the designed and the predicted/targeted values. As shown from the table, the variationis not significante, except for the cold utility load and the number of heat exchanger shells. The targeted value of the cold utility load is19205.4 kW while

Petroleum & Petrochemical Engineering Journal
Zhao D, et al. Pinch Analysis in Optimising Energy Consumption on a Naphtha Hydrotreating Unit in a Refinery. Pet Petro Chem Eng J 2017, 1(5): 000126.
Copyright© Zhao D, et al, et al.
10
the designed value is 22473.2 kW, returning a difference of 3267.83 kW. This is due to a large amount of hot duty that needs to be cold in the below pinch design resulting
in the usage of cold utility to satisfy the energy requirement of the heat exchanger network (HEN) as shown in Figure 12.
Utility Energy Targets Shell and Area Ratio Utility Area Target Based
on Units Utility Area Target Based
on Shall
Used Target Diff.
Used (m2)
Target (m2)
Ratio
Used (m2) Target (m2)
Ratio
Used (m2)
Target (m2)
Ratio
Number of Units
19 21 2 Unit Area
2156.3 2113.6 1.02 CW 1050.9 955.4 1.1 CW 1050.9 962.2 1.09
Number of Shells
19 25 6 No. of Shell
2156.3 2154.2 1 HU 382.1 348.7 1.1 HU 382.1 348.7 1.1
Hot Utility Load (kW)
21226.1 21226.1 0.01
Cold Utility Load (kW)
22473.2 19205.4 3268
Table 5: Comparison between Used to Targeted values.
Conclusion
Pinch analysis was successfully applied to study the energy and economic conservation of Naphtha hydro treating unit (NHU) using Aspen pinch 11.1 Software. The work relied on real NHU process data which were extracted using Aspen plus for subsequent use in HEN design in Aspen pinch environment. The pinch analysis of the NHU plant shows that although the cooling and heating loads were almost the same, a restriction was placed on heat exchange by the fewer cold process streams than hot process streams. The HEN uses nineteen heat exchangers, most of which are coolers, to remove heat from many heat sources that outweigh the heat sinks. It can be seen from this study that by developing an energy integrated system using pinch technology as tool,a large amount of energy can be saved.
References
1. El-Halwagi MM (2006) Process System Engineering. Process Integration 7: 1-398.
2. Rahul A (2011) Energy Efficiency in Process Plants with emphasison Heat Exchanger Networks Optimization, Thermodynamics and Insight. Department of Energy and Process Engineering Norwegian University of Science and Technology pp: 1-209.
3. Russell FD, El-Halwagi MM (2003) Review Process integration technology review: background and applications in the chemical process industry. J Chem Technol Biotechnol 78: 1011-1021.
4. Yee TF, Grossmann IE (1990) Simultaneous optimization models for heat integration. II. Heat exchanger network synthesis. Computer Chem Eng 14(10): 1165-1990.
5. Ian C Kemp (2007) Pinch Analysis and Process Integration. A User Guide on Process Integration for the Efficient Use of Energy. 2nd (edn), IchemE pp: 1-415.
6. Linnhoff B, Hindmarsh, E (1983) The pinch design method for heat exchanger networks. Chem Eng Sci 38(5): 745-763.
7. Cerda J, Westerberg AW, Mason D, Linnhoff B (1983) Minimum utility usage inheat exchanger network synthesis. Chem Eng Sci 38(3): 373-387.
8. Linnhoff B, Flower JR (1982) A user guide on process integration for the efficient use of energy. The institution of Chemical Engineers, Rugby, UK, 247.
9. Faustine C (2008) Environmental Review Of Petroleum Industry Effluents Analysis. Master of Science Thesis, Royal Institute of Technology. Part B, pp: 17-40.
10. Velazquez M (2005) Introducing process integration for environmental control in engineering curricula. Network pinch analysis module 12. Texas A & M University college station, pp: 1-311.
11. Shenoy UV (1995) Heat Exchanger Network Synthesis.Process Optimisation by Energy and Resource Analysis. Gulf publishing company, Houston, Texas.

Petroleum & Petrochemical Engineering Journal
Zhao D, et al. Pinch Analysis in Optimising Energy Consumption on a Naphtha Hydrotreating Unit in a Refinery. Pet Petro Chem Eng J 2017, 1(5): 000126.
Copyright© Zhao D, et al, et al.
11
12. Rao KN, Reddy GK, Prasad PR, Sujatha V (2015) Design and Pinch Analysis of Methyl Acetate Production Process using Aspen Plus and Aspen Energy Analyzer. International J Chemical Engineering and Processing 1(1): 31-40.
13. Azeez OS, Isafiade AJ, Fraser DM (2012) Supply and target based superstructure synthesis of heat and mass exchanger networks. Chemical Engineering Research and Design 90(2): 266-287.
14. Sangia R, Hosseinizadeha B, Amidpoura M (2012) A Simple Method for Grouping Streams in Heat Exchanger Networks Including Match Constraints 1(7): 1-6.
15. Paiko II (2016) Pinch Analysis of Naphtha Hydrotreating Unit of A Nigeria Based Refinery And Petrochemical Company, Msc. Thesis Federal University of Technology Minna, Nigeria.