Fundamentals of Petroleum and Petrochemical Engineering - Copia
Petroleum & Petrochemical Engineering Journal
Effects of Pt/Al2O3 Catalyst Load on Upgrading of Pyrolytic Bio-oil by Hydrodeoxygenation in a Fixed Bed Reactor Pet Petro Chem Eng J
Effects of Pt/Al2O3 Catalyst Load on Upgrading of Pyrolytic Bio-
oil by Hydrodeoxygenation in a Fixed Bed Reactor
Gollakota ARK, Subramanyam MD and Kishore N*
Department of Chemical Engineering, Indian Institute of Technology, Guwahati, India
*Corresponding author: Nanda Kishore, Department of Chemical Engineering, Indian
Institute of Technology, Guwahati, Assam – 781039, India, Tel: +91-361-2582276; Email:
Abstract
This study deals with the numerical modelling and simulations of catalytic upgrading of bio-oil in a fixed bed reactor
using Pt/Al2O3 catalyst (of load 20 g – 100 g) in the range of weight hourly space velocity (WHSV = 1 h-1 – 2 h-1),
temperature (T = 623 K – 673 K) and pressure (P = 10443 kPa – 13889 kPa). The model equations of complex multiphase
turbulent flow combined with a lumped kinetic model are solved using a computational fluid dynamics based commercial
solver, ANSYS Fluent 14.5.In the solver, Gidaspow and Schillar-Naumann models for drag relations in order to account for
the interactions between fluid and solid phases respectively are adopted. Similarly, Ranz-Marshall model and Gunn model
are adopted for treating the fluid-fluid and fluid-solid heat interactions respectively. The reactions kinetics used in the
solver are the lumped kinetic model on the basis of an experimental study available in the literature. Thoroughly
validated model is used to produce new results on hydrodynamics of various phases in the reactor, volume and mass
fractions of lumped components and yields of desired components over wide range of pertinent operating conditions.
Some results indicate that the maximum yields of desired alkanes and aromatics are obtained at a catalyst load of 60g
when WHSV = 1h-1, P = 13889 kPa and T = 673 K.
Keywords: Hydrodeoxygenation; Upgrading bio-oil; Catalyst load; Packed bed; CFD
Introduction
The threshold level of global energy consumption alarmed to find alternate sources of conventional fuel for the sustainment of energy consumption. The alternate form of energy should be equally compatible with the conventional fossil fuels in terms of sustainability; and reduced CO2 emissions thereby reduce the environmental impacts. In this prospective an alternative found for the proposed replacement of conventional energy sources is
the fuel obtained from biomass. Biomass refers to plant based materials like crop residues, bagasse, rice hulls, rice straw, waste paper, wood chips, saw dust, forestry residues, municipal waste, agricultural wastes, organic wastes, etc. The possible option available in this scenario to produce advanced or second generation bio-fuels is the co-processing of biomass to bio-oil and then upgrading it to use as transportation fuel. Bio-oils are complex natured with a mixture of several hundred compounds with an appreciable proportion of water from both the original
Research Article
Volume 2 Issue 4
Received Date: May 11, 2018
Published Date: June 01, 2018
Petroleum & Petrochemical Engineering Journal
Kishore N, et al. Effects of Pt/Al2O3 Catalyst Load on Upgrading of Pyrolytic Bio-oil by Hydrodeoxygenation in a Fixed Bed Reactor. Pet Petro Chem Eng J 2018, 2(4): 000158.
Copyright© Kishore N, et al.
2
moisture from biomass and reaction product, and including char content. These second generation bio-fuels from pyrolysis process are incompatible with the conventional fuels mainly due to their higher oxygen content, high solids content, high viscosity, high moisture content, unstable chemical nature and higher contents of char. Hence upgrading the bio-oil obtained from the pyrolysis process is in demand. Among the various techniques of upgradation processes the hydrodeoxygenation (HDO) is found to be promising technique to overcome the aforementioned drawbacks of unprocessed bio-oil. In general, these unprocessed bio-oils consist of hundreds of components; and during their HDO they undergo various types of complex reactions when the H2 gas introduced in the reactor in the presence of a catalyst. The product formed after these complex reactions by HDO is an upgraded bio-oil again consists of hundreds of components. Obtaining detailed reaction kinetics of these hundreds of reactions by experiments is next to impossible. Further even if kinetics of those reactions is known by other means, incorporating them in numerical models and to develop a solution methodology is highly cumbersome and computationally not feasible due to various inherent reasons. Thus these components (both unprocessed and hydrotreated) can be grouped into a few lumped groups such as heavy non-volatiles (HNV), low non-volatiles (LNV), phenols, alkanes and aromatics, etc. The composition of these components in unprocessed bio-oil depends on the nature of the biomass and the method to produce the bio-oil. Thus obtained bio-oils usually have large fractions of HNV and LNV and lower fractions of alkanes and aromatics, whereas, phenols are intermediates which are produced from HNV and LNV and subsequently converted to alkanes and aromatics. On the basis of lumped models approach, Sheu et al [1] have developed a lumped kinetic model for the upgrading of pyrolysis bio-oil [1]. They have provided reaction paths for these lumped species and the respective rate constants have also been reported. However, they have not provided information on model components of their lumped species. This work deals with the numerical investigation on effects of catalyst load on the upgrading of pine pyrolytic oil by using lumped kinetic model due to Sheu et al [1]. The catalytic hydrodeoxygenation process in an upflow fixed bed reactor is chosen for the upgrading of bio-oil. In order to find the effects of Pt/Al2O3 catalyst load, 20g, 60g and 100g of catalyst is considered. The ranges of other operating conditions are as follows: temperature (623 K ≤ T ≤ 673 K), pressure (10443 kPa ≤
P ≤ 13889 kPa) and weight hourly space velocity (1 h-1≤ WHSV ≤ 2 h-1).
Literature Review
Several review articles are available on various aspects of upgradation of bio-oil; and a couple of recent reviews are due to Bu, et al. and Gollakota et al [3] hence only a glimpse of a few of the relevant works are presented herein [2,3]. The research on the bio-oil upgradation process started in early 1970’s by Weisser and Landa [4] followed by comprehensive reviews due to Furimsky [5-7] based on various feed stocks and different reaction kinetic mechanisms of furan and tetrahydrofuran. The studies of Ternan and Brown [8] on HDO of coal distillate liquids with high oxygen content observed higher conversion rates of reactants to products by the reaction of smaller oxygenated compounds (phenols). Later, Elliott and Baker [9] performed HDO for upgrading the biomass liquefaction products in the presence of CO at a pressure of 138 bar and at temperatures ranging between 350°C-450°C in a batch reactor. Johnson, et al. investigated the conversion of lignin into phenols and hydrocarbons by mild HDO process [10]. Train and Klein developed Monte-Carlo simulations of HDO of lignin using the kinetics obtained from the experimental results [11]. Elliott performed two stage catalytic hydrotreatment in the absence of hydrogen gas and in the presence of Co/Mo supported alumina catalyst [12]. The reaction results are significant and further confirmed by Baker and Elliott [13]. The two stages are combined to a single stage non-isothermal process with a yield of 33% of lighter hydrocarbons and high gas formation. Sheu performed experimental studies on the upgrading of pine pyrolytic oil by HDO process in a trickle bed reactor [1]. The authors developed two models, one for the overall oxygen removal and the other for the compositional changes in hydro-treated oil. Piskorz [14] confirmed the findings of Elliott [9] particularly the necessity of high hydrogen gas pressure. Baldauf performed hydro-processing of flash pyrolysis oil using the conventional Co-Mo, Ni-Mo catalysts in which the major yield of about 60% is the moisture content with high deoxygenation rates [15]. However bio-oil contains many other kinds of oxygenated chemical groups like aldehydes, ketones, carboxylic acids, esters, aliphatic and aromatic alcohols [16]. Elliott reviewed the insights and achievements of HDO process in the past twenty five years [12]. The important aspect in HDO process is the hydrogen consumption. Recent results of Mercader [17] and Venderbosch [18] indicate that stabilization of pyrolysis oil by low severity HDO is sufficient for upgradation process and reduce the
Petroleum & Petrochemical Engineering Journal
Kishore N, et al. Effects of Pt/Al2O3 Catalyst Load on Upgrading of Pyrolytic Bio-oil by Hydrodeoxygenation in a Fixed Bed Reactor. Pet Petro Chem Eng J 2018, 2(4): 000158.
Copyright© Kishore N, et al.
3
hydrogen consumption. Xu proposed two step catalytic hydrodeoxygenation of fast pyrolysis oil to hydrocarbon liquid fuels [19]. In the first step organic solvents were employed to reduce the coke formation and promote higher rates of HDO process. In the second step conventional reaction mechanism of reactants to products in the presence of catalyst along with hydrogen gas is performed to obtain hydrocarbon fuel. Parapati mentioned that the customary practice of using two stage hydro-processing units at moderate temperatures also yield approximately similar to the single stage reactor [20]. Hence, in order to increase the through put and decrease the extra financial commitments a single stage hydro-processing unit is sufficient. Gollakota [21] made an attempt to numerically simulate the hydrodeoxygenation of bio-oil in an ebullated bed reactor and observed that the higher yields of the alkanes and aromatics are possible in the case of Co-Mo/Al2O3 catalyst as compared to Pt/Al2O3 catalyst and Ni-Mo/Al2O3 catalyst. Later Subramanyam [22] extended this work for the case of upflow fixed bed reactor in the presence of Pt/Al2O3 catalysts and found that the performance of HDO of pine oil in fixed bed reactor is superior compared to the case of ebullated bed reactor under identical conditions. More updates on upgrading bio-oil can be found in review articles due to Oasmaa and Czernik [23] and Bu, et al. [2]. Recently Gollakota [3] have thoroughly reviewed the literature available till date on various possible techniques for upgrading pyrolysis bio-oil. On the basis of aforementioned literature review, it is clear that the HDO process has been extensively used for upgrading bio-oils; however, optimized operating conditions are not available. Though, the catalyst load plays a significant role in reactions, it has not been taken into consideration so far. From the literature, it is also evident that researches in the field of upgrading bio-oils have been confined to experimental studies except the recent numerical studies [21,22]. Therefore, in this work we make use of CFD solver (ANSYS Fluent) to numerically investigate the optimum Pt/Al2O3 catalyst load for upgrading the pyrolytic pine oil using hydrodeoxygentation process in an upflow fixed bed reactor over the range of conditions: 1 h-1≤ 𝑊𝐻𝑆𝑉 ≤2 h-1 , 10443 kPa≤ 𝑃 13889 kPa, and 623 K ≤ 𝑇 ≤ 673 K.
Problem Statement
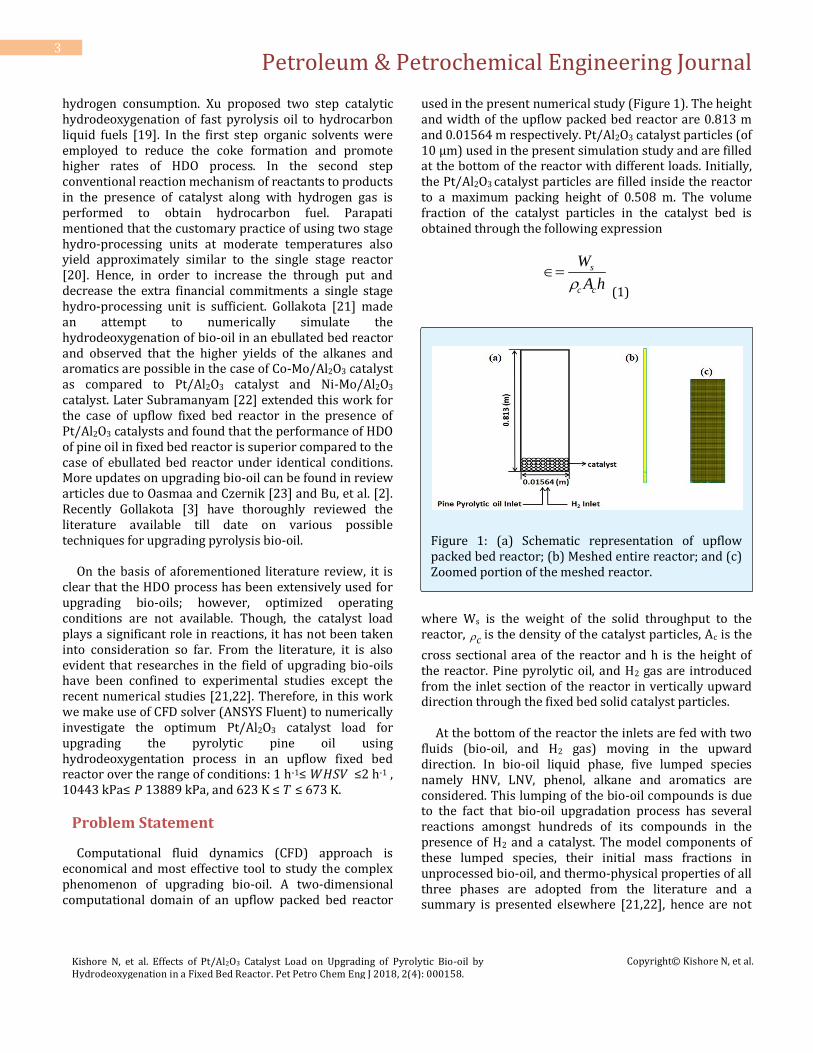
Computational fluid dynamics (CFD) approach is economical and most effective tool to study the complex phenomenon of upgrading bio-oil. A two-dimensional computational domain of an upflow packed bed reactor
used in the present numerical study (Figure 1). The height and width of the upflow packed bed reactor are 0.813 m and 0.01564 m respectively. Pt/Al2O3 catalyst particles (of 10 μm) used in the present simulation study and are filled at the bottom of the reactor with different loads. Initially, the Pt/Al2O3 catalyst particles are filled inside the reactor to a maximum packing height of 0.508 m. The volume fraction of the catalyst particles in the catalyst bed is obtained through the following expression
s
c c
W
A h
(1)
Figure 1: (a) Schematic representation of upflow packed bed reactor; (b) Meshed entire reactor; and (c) Zoomed portion of the meshed reactor.
where Ws is the weight of the solid throughput to the reactor, c is the density of the catalyst particles, Ac is the
cross sectional area of the reactor and h is the height of the reactor. Pine pyrolytic oil, and H2 gas are introduced from the inlet section of the reactor in vertically upward direction through the fixed bed solid catalyst particles. At the bottom of the reactor the inlets are fed with two fluids (bio-oil, and H2 gas) moving in the upward direction. In bio-oil liquid phase, five lumped species namely HNV, LNV, phenol, alkane and aromatics are considered. This lumping of the bio-oil compounds is due to the fact that bio-oil upgradation process has several reactions amongst hundreds of its compounds in the presence of H2 and a catalyst. The model components of these lumped species, their initial mass fractions in unprocessed bio-oil, and thermo-physical properties of all three phases are adopted from the literature and a summary is presented elsewhere [21,22], hence are not
Petroleum & Petrochemical Engineering Journal
Kishore N, et al. Effects of Pt/Al2O3 Catalyst Load on Upgrading of Pyrolytic Bio-oil by Hydrodeoxygenation in a Fixed Bed Reactor. Pet Petro Chem Eng J 2018, 2(4): 000158.
Copyright© Kishore N, et al.
4
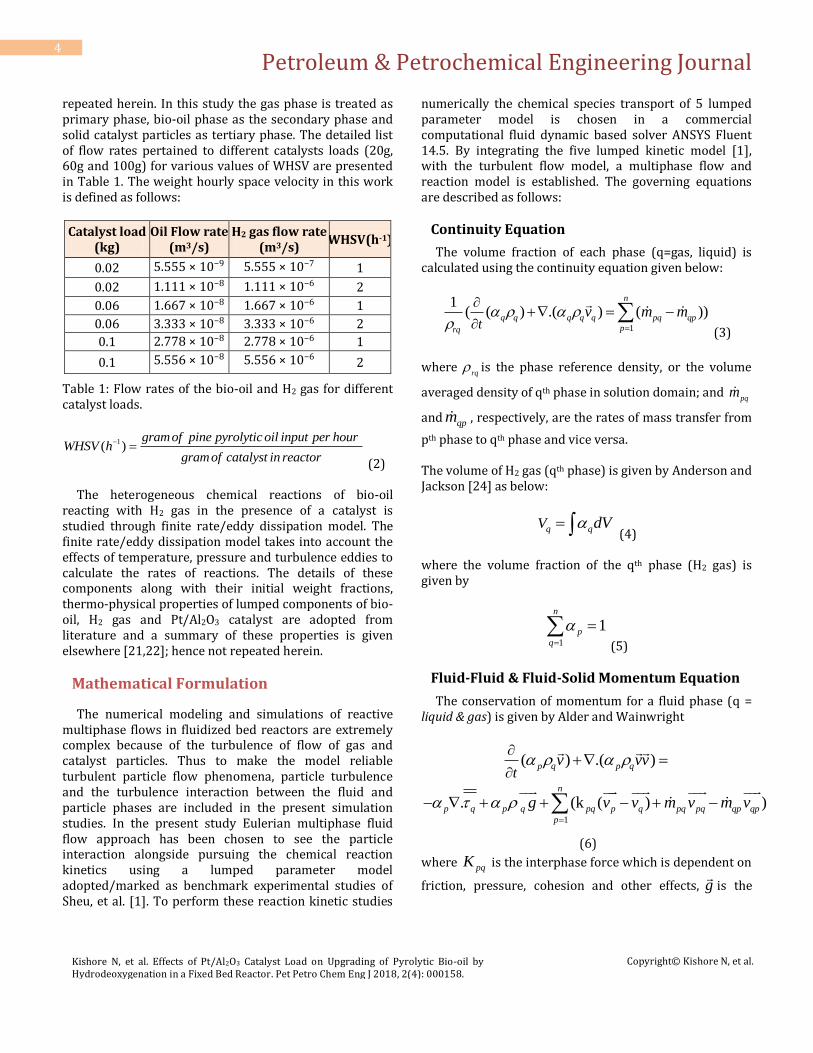
repeated herein. In this study the gas phase is treated as primary phase, bio-oil phase as the secondary phase and solid catalyst particles as tertiary phase. The detailed list of flow rates pertained to different catalysts loads (20g, 60g and 100g) for various values of WHSV are presented in Table 1. The weight hourly space velocity in this work is defined as follows:
Catalyst load (kg)
Oil Flow rate (m3/s)
H2 gas flow rate (m3/s)
WHSV(h-1)
0.02 5.555 × 10⁻⁹
5.555 × 10⁻⁷
1
0.02 1.111 × 10⁻⁸
1.111 × 10⁻⁶
2
0.06 1.667 × 10⁻⁸
1.667 × 10⁻⁶
1
0.06 3.333 × 10⁻⁸
3.333 × 10⁻⁶
2
0.1 2.778 × 10⁻⁸
2.778 × 10⁻⁶
1
0.1 5.556 × 10⁻⁸
5.556 × 10⁻⁶
2
Table 1: Flow rates of the bio-oil and H2 gas for different catalyst loads.
1( )
gramof pine pyrolytic oil input per hourWHSV h
gramof catalyst in reactor
(2)
The heterogeneous chemical reactions of bio-oil reacting with H2 gas in the presence of a catalyst is studied through finite rate/eddy dissipation model. The finite rate/eddy dissipation model takes into account the effects of temperature, pressure and turbulence eddies to calculate the rates of reactions. The details of these components along with their initial weight fractions, thermo-physical properties of lumped components of bio-oil, H2 gas and Pt/Al2O3 catalyst are adopted from literature and a summary of these properties is given elsewhere [21,22]; hence not repeated herein.
Mathematical Formulation
The numerical modeling and simulations of reactive multiphase flows in fluidized bed reactors are extremely complex because of the turbulence of flow of gas and catalyst particles. Thus to make the model reliable turbulent particle flow phenomena, particle turbulence and the turbulence interaction between the fluid and particle phases are included in the present simulation studies. In the present study Eulerian multiphase fluid flow approach has been chosen to see the particle interaction alongside pursuing the chemical reaction kinetics using a lumped parameter model adopted/marked as benchmark experimental studies of Sheu, et al. [1]. To perform these reaction kinetic studies
numerically the chemical species transport of 5 lumped parameter model is chosen in a commercial computational fluid dynamic based solver ANSYS Fluent 14.5. By integrating the five lumped kinetic model [1], with the turbulent flow model, a multiphase flow and reaction model is established. The governing equations are described as follows:
Continuity Equation
The volume fraction of each phase (q=gas, liquid) is calculated using the continuity equation given below:
1
1( ( ) .( ) ( ))
n
q q q q q pq qp
prq tv m m
(3)
where rq
is the phase reference density, or the volume
averaged density of qth phase in solution domain; and pq
m
and qpm , respectively, are the rates of mass transfer from
pth phase to qth phase and vice versa. The volume of H2 gas (qth phase) is given by Anderson and Jackson [24] as below:
q qV dV (4)
where the volume fraction of the qth phase (H2 gas) is given by
1
1n
p
q
(5)
Fluid-Fluid & Fluid-Solid Momentum Equation
The conservation of momentum for a fluid phase (q = liquid & gas) is given by Alder and Wainwright
( ) .( )p q p qt
v vv
1
. (k ( ) )n
p q p q pq p q pq pq qp qp
p
g v v m v m v
(6)
where pqK is the interphase force which is dependent on
friction, pressure, cohesion and other effects, g
is the
Petroleum & Petrochemical Engineering Journal
Kishore N, et al. Effects of Pt/Al2O3 Catalyst Load on Upgrading of Pyrolytic Bio-oil by Hydrodeoxygenation in a Fixed Bed Reactor. Pet Petro Chem Eng J 2018, 2(4): 000158.
Copyright© Kishore N, et al.
5
acceleration due to gravity, pqv is the interphase velocity
defined by the following conditions. If pqm > 0 (i.e., the
mass of phase p being transferred to phase q) then
pq pv v
, if pqm < 0 (i.e., the phase q is transferred to
phase p) then pq qv v
. Likewise if qpm > 0 (i.e., the mass
of phase q being transferred to phase p) then qp qv v
and if qpm < 0 (i.e., the mass of phase p being transferred
to phase q) then qp pv v
. Here pv and qv are the
velocities of phases p and q, respectively. The momentum exchange between the phases is based on the value of fluid-fluid exchange coefficient which is defined as
p q pf
pq
p
k
(7)
pqK is the interphase momentum exchange coefficient,
f is the drag force (defined differently for the different
exchange coefficient models), q , p are the densities of
phases p and q, respectively, and q is the volume
fraction of phase q. The stress-strain tensor for qth phase is given as:
2( ) ( ) .
3
T
q p q q q q q q qv v v I
(8)
q is the qth phase stress-strain tensor, q is the shear
viscosity of the gas phase, q is the volume fraction of the
gas phase, and q is the bulk viscosity of the gas phase.
SchillarNaumann [25] drag equation can be written as
Re
24
dcf
(9) where
dc =0.44 for Re>1000 (10)
where Re is the relative Reynolds number for the primary and the secondary phase obtained
q p q p
qp
q
v v dRe
(11)
The conservation of momentum for the fluid solid phases is
( ) .( )s s s s s s s
v v vt
1
. ( ( ) )n
ls sls s s s s ls l s ls sl
l
p p g k v v m v m v
(12)
The Ergun [26] derived an equation for a dense bed which relates the drag to the pressure drop through porous media
2.6530.8
4
s ls p p
ls d p p
s
v vk C for
d
(13)
where sd is the particle diameter, dC is the drag
coefficient of a single particle in a stagnant liquid
Energy Equation & Reaction Kinetics Model
To describe the conservation of energy in Eulerian multiphase flows, the enthalpy equation of any phases is written as
( ) .( )p q q p q q q
h ht
1
: . ( )pq
n
pq
q q q q q pq pq qp qp
p
q S Q m h m ht
(14)
where hq is the specific enthalpy of qth phase, qq is the
heat flux, qS is the source term that includes the sources
of enthalpy (e.g., due to chemical reaction or radiation),
and pqQ is the intensity of heat exchange between pth and
qth phase and is given by
Petroleum & Petrochemical Engineering Journal
Kishore N, et al. Effects of Pt/Al2O3 Catalyst Load on Upgrading of Pyrolytic Bio-oil by Hydrodeoxygenation in a Fixed Bed Reactor. Pet Petro Chem Eng J 2018, 2(4): 000158.
Copyright© Kishore N, et al.
6
( )pq pq p qQ h T T (15)
where pT ,
qT are the temperatures of p and q phases
respectively, and pqh is the heat transfer coefficient
between p and q phases.
2
6 q p q p
pq
p
k Nh
d
(16)
qk is the thermal conductivity of qth phase, and ,p q are
the volume fractions of p and q phases. pNu is the Nusselt
number of pth phase and pd is the diameter of the particle
(catalyst) From the correlations of Ranz and Marshall [27], Nusselt number of pth phase is given by
1/2 1/32.0 0.6p pN Re P (17)
where Re p is relative Reynolds number of pth phase and
is the Prandtl number of qth phase is given by:
qp q
r
q
CP
k
(18)
where pqC is the specific heat capacity of qth is phase,
and q is the viscosity of qth phase. Nusselt number of
solid phase is given by Gunn [28]:
2 0.2 1/3(7 10 5 )(1 0.7Re P )s q q sNu
2 0.7 1/3(1.33 2.4 1.2 )Re Pq q s (19)
Kinetic Theory of Granular Flow
The granular temperature of the sth solid phase is proportional to the kinetic energy of the random motion of particles. The transport equation derived from kinetic theory takes the following form as given by Ding and Gidaspow [29] and Gidaspow [30] which is a combined model of Ergun [26] and Wen and Yu [31]:
3( .( )
2s s s s s s sv
t
( ) : .(k )ss s s s lsP I T v
(20)
where :s svIp T
indicates the generation of
energy by solid stress tensor; Θ Θs sK represents the
diffusion of energy Θ( )s
K is the diffusion coefficient;
Θs represents collisional dissipation energy; ls is the
energy exchange between fluid and solid phase; lsK is the
exchange coefficient between fluid and solid phase; s is
the density of the solid, s is the volume fraction of the
solid, and sv
is the relative velocity of the solid particles.
The solids pressure is given by
2
0,2 (1 )s s s s s ss s ss sP e g (21)
The collision dissipation energy is given by
22 3/20.12(1 )
s
ss sss s s
s
e g
d
(22) The energy exchange between solid and fluid phases is
3ls ls sk (23)
The diffusion coefficient can be written as
2
2
0, 0,
0,
150 61 (1 ) 2 (1 )
384(1 ) 5
s s s s
s ss ss s s s s ss ss
ss ss
dK e g d g e
e g
(24)
where s is the density of the solid phase, sse is the
coefficient of restitution due to particle collisions and the
default value used is 0.9, 0,ssg is the radial distribution
function that governs the transition from the
compressible condition with ,maxs with a default
value of ,maxs = 0.63 and Θs is the granular
temperature, and sd is the diameter of solid phase
Petroleum & Petrochemical Engineering Journal
Kishore N, et al. Effects of Pt/Al2O3 Catalyst Load on Upgrading of Pyrolytic Bio-oil by Hydrodeoxygenation in a Fixed Bed Reactor. Pet Petro Chem Eng J 2018, 2(4): 000158.
Copyright© Kishore N, et al.
7
k-ε Turbulence Model
The model developed and proposed by Launder and Spalding [32] is used to simulate the mean flow characteristics for turbulent flow conditions. It is a two equation model which gives the general description of turbulence by means of two transport equations. The first transported variable determines the energy in the
turbulence and is called turbulent kinetic energy ( k ). The second transported variable is the turbulent dissipation ( ) which determines the rate of dissipation of the turbulent kinetic energy. The underlying assumption of this model is that the turbulent viscosity is isotropic, in other words, the ratio between Reynolds stress and mean rate of deformations are small in all directions. Transport equations for these two parameters are given by:
( k) ( k )i
i
ut x
( )tk b M k
j k j
kG G Y S
x x
(25)
( ) ( )i
i
ut x
2
1 3 2( ) ( )tk b p
j j
C G C G C sx x k
(26)
Production of turbulence kinetic energy Gk is given by
' ' j
k l j
i
uG
x
(27)
To evaluate Gk in a manner consistent with Boussinesq hypothesis
2
k tG S (28)
where S is the modulus of the mean rate-of-strain tensor and is given by
2 ij jiS S S (29)
and t is turbulent/eddy viscosity given by
2
t u
kC
(30) The rate of change of turbulent kinetic energy and convection equals the sum of transport by diffusion, rate of production and destruction of kinetic energy and
dissipation. M
Y is the fluctuation dilation, andk
S , S are
the source terms. Here1
C , 2 3
,C C are the constants
with values of 1.44, 1.92, 0.09; , k
are the turbulent
Prandtl number for ,k with values 1.0 and 1.3
respectively. Gk and Gb represent of generation of turbulent kinetic energy due to mean velocity gradients and buoyancy.
Finite Rate/Eddy Dissipation Model
The finite rate/eddy dissipation model is used to study reaction kinetic of HDO of pyrolysis bio-oil. This model helps in computing both the Arrhenius rate and mixing rate. The ith species transport equation is
( ) ( ) ( )ii j i i i i
j j j
yY u Y D R S
t x x x
(31)
where i
Y is the mass fraction of chemical species i, i
D is
the diffusion coefficient, i
R is the reaction source term
and Si is other source term. Since there are many species present in both pine pyrolytic oil and its hydrotreated products, the lumping of their constituents together with similar functional groups is a useful approach for studying reaction kinetics. Also lumped kinetic models give a useful insights and clear understanding in order to quantify the effects of process variables on product yields. In this work, a lumped kinetic model for hydrodeoxygenation of pyrolytic bio-oil proposed by Sheu [1] is used. The kinetic parameters and reaction pathway of this model are presented in their original work and a summary of the same is presented elsewhere [21,22], hence are not repeated herein.
Numerical Methodology
The governing differential equations (as presented in the previous section) are solved using commercial computational fluid dynamics based software ANSYS
Petroleum & Petrochemical Engineering Journal
Kishore N, et al. Effects of Pt/Al2O3 Catalyst Load on Upgrading of Pyrolytic Bio-oil by Hydrodeoxygenation in a Fixed Bed Reactor. Pet Petro Chem Eng J 2018, 2(4): 000158.
Copyright© Kishore N, et al.
8
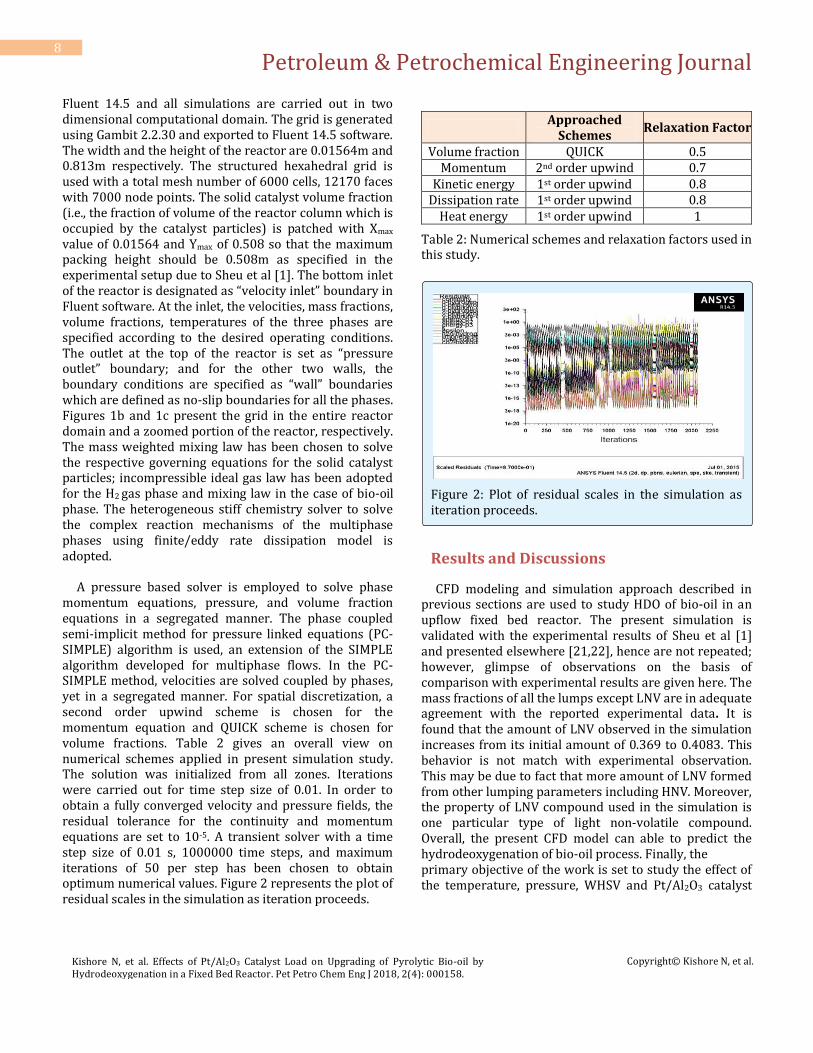
Fluent 14.5 and all simulations are carried out in two dimensional computational domain. The grid is generated using Gambit 2.2.30 and exported to Fluent 14.5 software. The width and the height of the reactor are 0.01564m and 0.813m respectively. The structured hexahedral grid is used with a total mesh number of 6000 cells, 12170 faces with 7000 node points. The solid catalyst volume fraction (i.e., the fraction of volume of the reactor column which is occupied by the catalyst particles) is patched with Xmax value of 0.01564 and Ymax of 0.508 so that the maximum packing height should be 0.508m as specified in the experimental setup due to Sheu et al [1]. The bottom inlet of the reactor is designated as “velocity inlet” boundary in Fluent software. At the inlet, the velocities, mass fractions, volume fractions, temperatures of the three phases are specified according to the desired operating conditions. The outlet at the top of the reactor is set as “pressure outlet” boundary; and for the other two walls, the boundary conditions are specified as “wall” boundaries which are defined as no-slip boundaries for all the phases. Figures 1b and 1c present the grid in the entire reactor domain and a zoomed portion of the reactor, respectively. The mass weighted mixing law has been chosen to solve the respective governing equations for the solid catalyst particles; incompressible ideal gas law has been adopted for the H2 gas phase and mixing law in the case of bio-oil phase. The heterogeneous stiff chemistry solver to solve the complex reaction mechanisms of the multiphase phases using finite/eddy rate dissipation model is adopted. A pressure based solver is employed to solve phase momentum equations, pressure, and volume fraction equations in a segregated manner. The phase coupled semi-implicit method for pressure linked equations (PC-SIMPLE) algorithm is used, an extension of the SIMPLE algorithm developed for multiphase flows. In the PC- SIMPLE method, velocities are solved coupled by phases, yet in a segregated manner. For spatial discretization, a second order upwind scheme is chosen for the momentum equation and QUICK scheme is chosen for volume fractions. Table 2 gives an overall view on numerical schemes applied in present simulation study. The solution was initialized from all zones. Iterations were carried out for time step size of 0.01. In order to obtain a fully converged velocity and pressure fields, the residual tolerance for the continuity and momentum equations are set to 10-5. A transient solver with a time step size of 0.01 s, 1000000 time steps, and maximum iterations of 50 per step has been chosen to obtain optimum numerical values. Figure 2 represents the plot of residual scales in the simulation as iteration proceeds.
Approached
Schemes Relaxation Factor
Volume fraction QUICK 0.5 Momentum 2nd order upwind 0.7
Kinetic energy 1st order upwind 0.8 Dissipation rate 1st order upwind 0.8
Heat energy 1st order upwind 1
Table 2: Numerical schemes and relaxation factors used in this study.
Figure 2: Plot of residual scales in the simulation as iteration proceeds.
Results and Discussions
CFD modeling and simulation approach described in previous sections are used to study HDO of bio-oil in an upflow fixed bed reactor. The present simulation is validated with the experimental results of Sheu et al [1] and presented elsewhere [21,22], hence are not repeated; however, glimpse of observations on the basis of comparison with experimental results are given here. The mass fractions of all the lumps except LNV are in adequate agreement with the reported experimental data. It is found that the amount of LNV observed in the simulation increases from its initial amount of 0.369 to 0.4083. This behavior is not match with experimental observation. This may be due to fact that more amount of LNV formed from other lumping parameters including HNV. Moreover, the property of LNV compound used in the simulation is one particular type of light non-volatile compound. Overall, the present CFD model can able to predict the hydrodeoxygenation of bio-oil process. Finally, the primary objective of the work is set to study the effect of the temperature, pressure, WHSV and Pt/Al2O3 catalyst
Petroleum & Petrochemical Engineering Journal
Kishore N, et al. Effects of Pt/Al2O3 Catalyst Load on Upgrading of Pyrolytic Bio-oil by Hydrodeoxygenation in a Fixed Bed Reactor. Pet Petro Chem Eng J 2018, 2(4): 000158.
Copyright© Kishore N, et al.
9
load on the mixing between the phases and in particular, the mass fractions of lumped species.
Dynamics of Phases
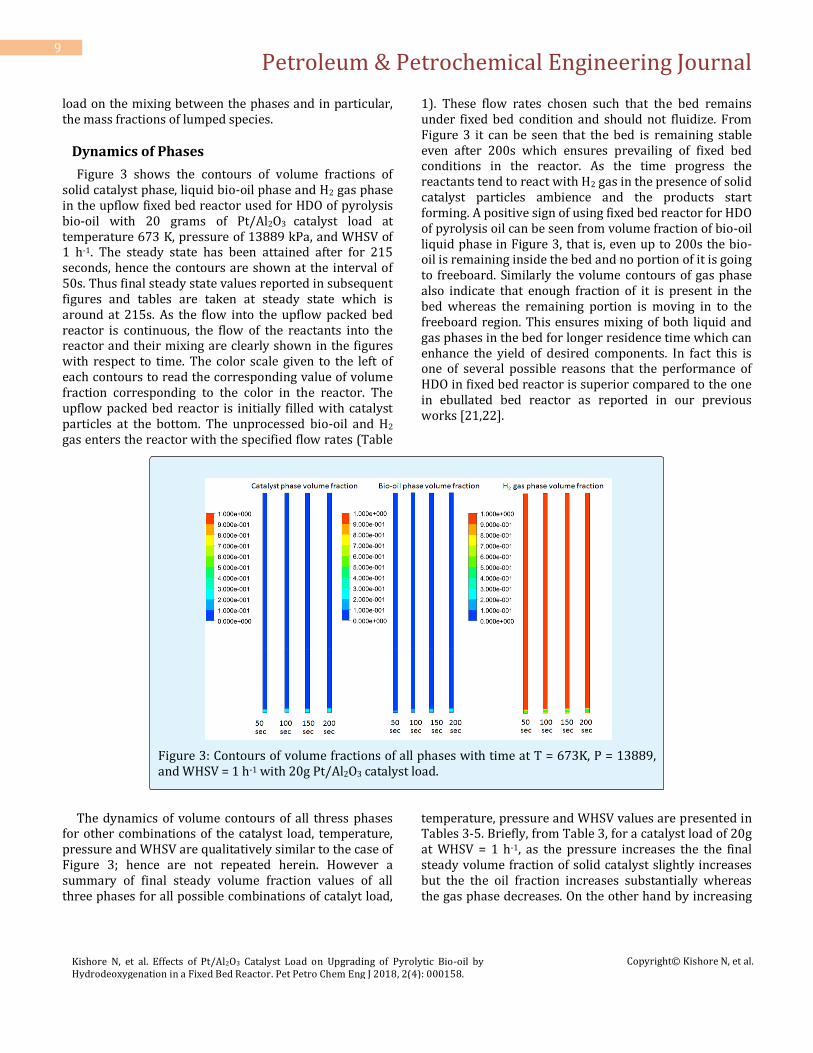
Figure 3 shows the contours of volume fractions of solid catalyst phase, liquid bio-oil phase and H2 gas phase in the upflow fixed bed reactor used for HDO of pyrolysis bio-oil with 20 grams of Pt/Al2O3 catalyst load at temperature 673 K, pressure of 13889 kPa, and WHSV of 1 h-1. The steady state has been attained after for 215 seconds, hence the contours are shown at the interval of 50s. Thus final steady state values reported in subsequent figures and tables are taken at steady state which is around at 215s. As the flow into the upflow packed bed reactor is continuous, the flow of the reactants into the reactor and their mixing are clearly shown in the figures with respect to time. The color scale given to the left of each contours to read the corresponding value of volume fraction corresponding to the color in the reactor. The upflow packed bed reactor is initially filled with catalyst particles at the bottom. The unprocessed bio-oil and H2 gas enters the reactor with the specified flow rates (Table
1). These flow rates chosen such that the bed remains under fixed bed condition and should not fluidize. From Figure 3 it can be seen that the bed is remaining stable even after 200s which ensures prevailing of fixed bed conditions in the reactor. As the time progress the reactants tend to react with H2 gas in the presence of solid catalyst particles ambience and the products start forming. A positive sign of using fixed bed reactor for HDO of pyrolysis oil can be seen from volume fraction of bio-oil liquid phase in Figure 3, that is, even up to 200s the bio-oil is remaining inside the bed and no portion of it is going to freeboard. Similarly the volume contours of gas phase also indicate that enough fraction of it is present in the bed whereas the remaining portion is moving in to the freeboard region. This ensures mixing of both liquid and gas phases in the bed for longer residence time which can enhance the yield of desired components. In fact this is one of several possible reasons that the performance of HDO in fixed bed reactor is superior compared to the one in ebullated bed reactor as reported in our previous works [21,22].
Figure 3: Contours of volume fractions of all phases with time at T = 673K, P = 13889, and WHSV = 1 h-1 with 20g Pt/Al2O3 catalyst load.
The dynamics of volume contours of all thress phases for other combinations of the catalyst load, temperature, pressure and WHSV are qualitatively similar to the case of Figure 3; hence are not repeated herein. However a summary of final steady volume fraction values of all three phases for all possible combinations of catalyt load,
temperature, pressure and WHSV values are presented in Tables 3-5. Briefly, from Table 3, for a catalyst load of 20g at WHSV = 1 h-1, as the pressure increases the the final steady volume fraction of solid catalyst slightly increases but the the oil fraction increases substantially whereas the gas phase decreases. On the other hand by increasing
Petroleum & Petrochemical Engineering Journal
Kishore N, et al. Effects of Pt/Al2O3 Catalyst Load on Upgrading of Pyrolytic Bio-oil by Hydrodeoxygenation in a Fixed Bed Reactor. Pet Petro Chem Eng J 2018, 2(4): 000158.
Copyright© Kishore N, et al.
10
the temperature the corresponding values of solid catalyst phase increases regardless of the values of the pressure whereas the other two phases display mixed trends with the increasing temperature and pressure for WHSV = 1 h-1. On the other hand, for the same load of 20g at WHSV = 2h-1, the corresponding volume fraction values of catalyst and gas phases are unaffected by the increase in pressure but those of oil phase increases with increasing pressure for T = 673K. At WHSV = 2h-1 with load of 20g, for all values of the pressure, the volume
fractions of catalyst and gas phases show increases as temperature increases from 623K to 648K but it again decreases as temperature further increases to 673K, but those of oil phase decreases with the increasing temperature for all values of the pressure. Qualitatively similar insights can be gained for other values of catalyst, i.e., 60g (Table 4) and 100g (Table 5); however, more observations can be made from Figures 4-6 which present the overall trends of all three phases as functions of catalyst load, temperature, pressure and WHSV values.
Phase WHSV=1h-1 WHSV=2h-1
P=10443 kPa
T=623K T=648K T=673K T=623K T=648K T=673K
Catalyst 0.1989 0.2071 0.3395 0.1022 0.1355 0.2483
Gas 0.5413 0.5162 0.568 0.5845 0.6452 0.5922
Oil 0.2597 0.2766 0.0924 0.3132 0.2292 0.1594
P=12166 kPa
Catalyst 0.1995 0.2072 0.3484 0.1027 0.1341 0.2181
Gas 0.5304 0.5324 0.5845 0.5838 0.6416 0.6241
Oil 0.2701 0.2602 0.0669 0.313 0.2342 0.1576
P=13889 kPa
Catalyst 0.2009 0.2091 0.3543 0.1051 0.1387 0.222
Gas 0.5075 0.5311 0.5678 0.5819 0.6496 0.602
Oil 0.2915 0.2091 0.0778 0.3169 0.2356 0.1758
Table 3: Final steady volume fractions of all phases when 20g of Pt/Al2O3 catalyst used.
Phase WHSV=1h-1 WHSV=2h-1
P=10443 kPa
T=623K T=648K T=673K T=623K T=648K T=673K
Catalyst 0.14 0.1404 0.2689 0.0529 0.0685 0.171
Gas 0.6375 0.6362 0.6695 0.7795 0.781 0.749
Oil 0.2224 0.2233 0.0615 0.1674 0.1503 0.0797
P=12166 kPa
Catalyst 0.1404 0.1579 0.2952 0.0532 0.069 0.1693
Gas 0.6464 0.6495 0.6639 0.7794 0.7815 0.7451
Oil 0.1974 0.1924 0.0407 0.1672 0.1486 0.0855
P=13889 kPa
Catalyst 0.1489 0.1601 0.2808 0.0535 0.0695 0.1553
Gas 0.6695 0.6534 0.6838 0.7793 0.783 0.752
Oil 0.1815 0.1863 0.0352 0.1671 0.1476 0.0926
Table 4: Final steady volume fractions of all phases when 60g of Pt/Al2O3 catalyst used.
Petroleum & Petrochemical Engineering Journal
Kishore N, et al. Effects of Pt/Al2O3 Catalyst Load on Upgrading of Pyrolytic Bio-oil by Hydrodeoxygenation in a Fixed Bed Reactor. Pet Petro Chem Eng J 2018, 2(4): 000158.
Copyright© Kishore N, et al.
11
Phase WHSV=1h-1 WHSV=2h-1 P=10443 kPa
T=623K T=648K T=673K T=623K T=648K T=673K
Catalyst 0.1501 0.1547 0.1653 0.0548 0.0569 0.0719 Gas 0.6882 0.6909 0.6934 0.821 0.8274 0.8167 Oil 0.1619 0.1534 0.1411 0.1241 0.1165 0.1112
P=12166 kPa Catalyst 0.1464 0.1511 0.1628 0.0569 0.0565 0.0717
Gas 0.6869 0.6899 0.7015 0.8223 0.8272 0.8149
Oil 0.1665 0.1588 0.1355 0.1231 0.1162 0.1092 P=13889 kPa
Catalyst 0.1502 0.1513 0.1639 0.0545 0.0562 0.0716 Gas 0.686 0.6901 0.7029 0.8222 0.8275 0.8206 Oil 0.1636 0.1587 0.133 0.1231 0.1161 0.1077
Table 5: Final steady volume fractions of all phases when 100g of Pt/Al2O3 catalyst used.
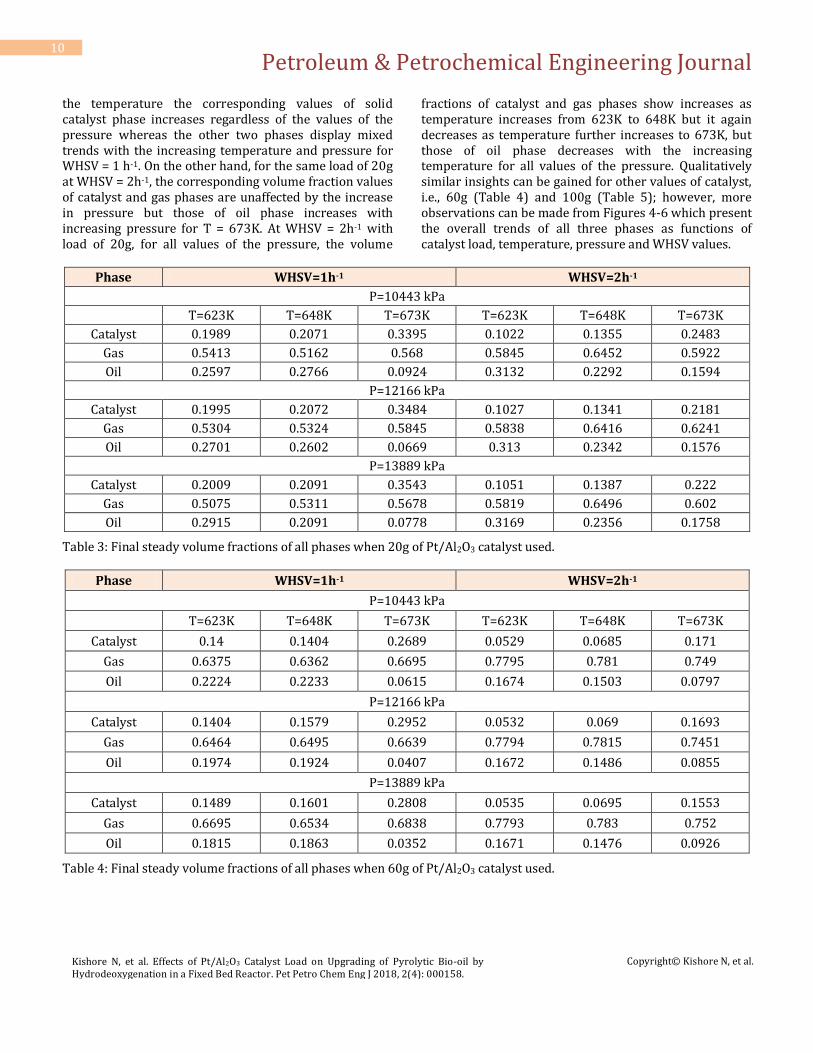
Figure 4: Final steady volume fractions of catalyst phase as function of catalyst load, WHSV, temperatures and pressures.
Figure 5: Final steady volume fractions of gas phase as function of catalyst load, WHSV, temperatures and pressures.
Petroleum & Petrochemical Engineering Journal
Kishore N, et al. Effects of Pt/Al2O3 Catalyst Load on Upgrading of Pyrolytic Bio-oil by Hydrodeoxygenation in a Fixed Bed Reactor. Pet Petro Chem Eng J 2018, 2(4): 000158.
Copyright© Kishore N, et al.
12
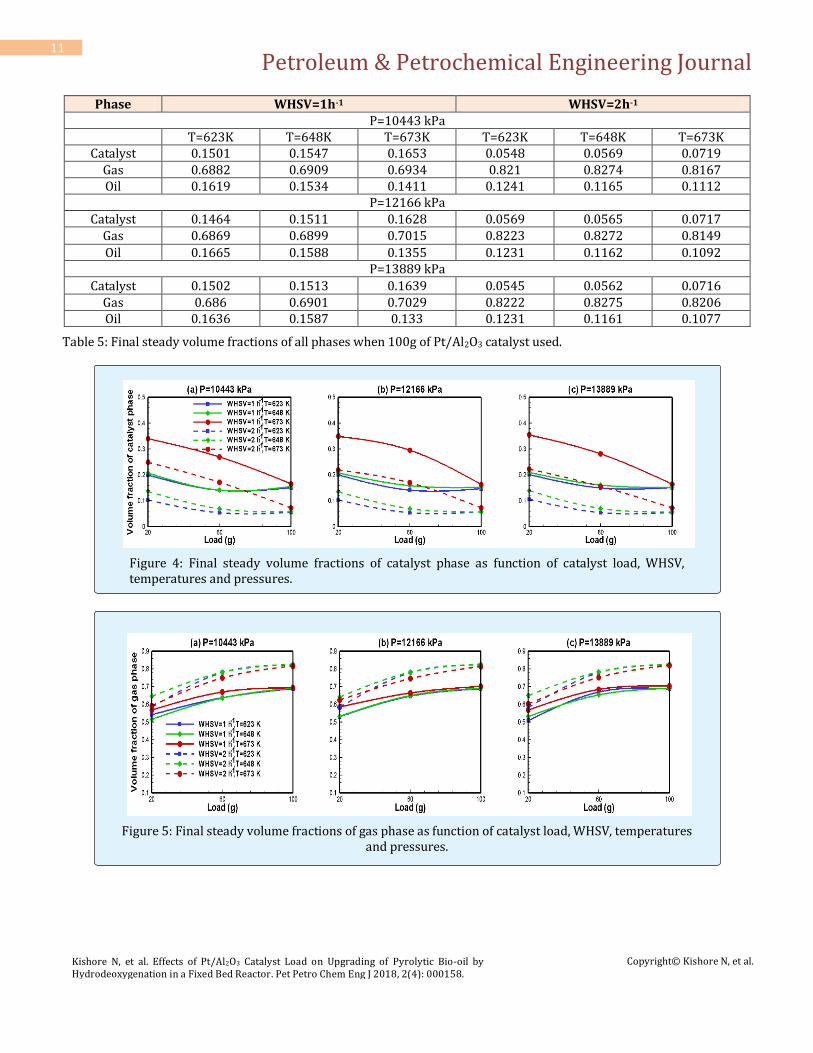
Figure 6: Final steady volume fractions of catalyst phase as function of catalyst load, WHSV, temperatures and pressures.
Mass Fractions of Various Phases and Lumped Species
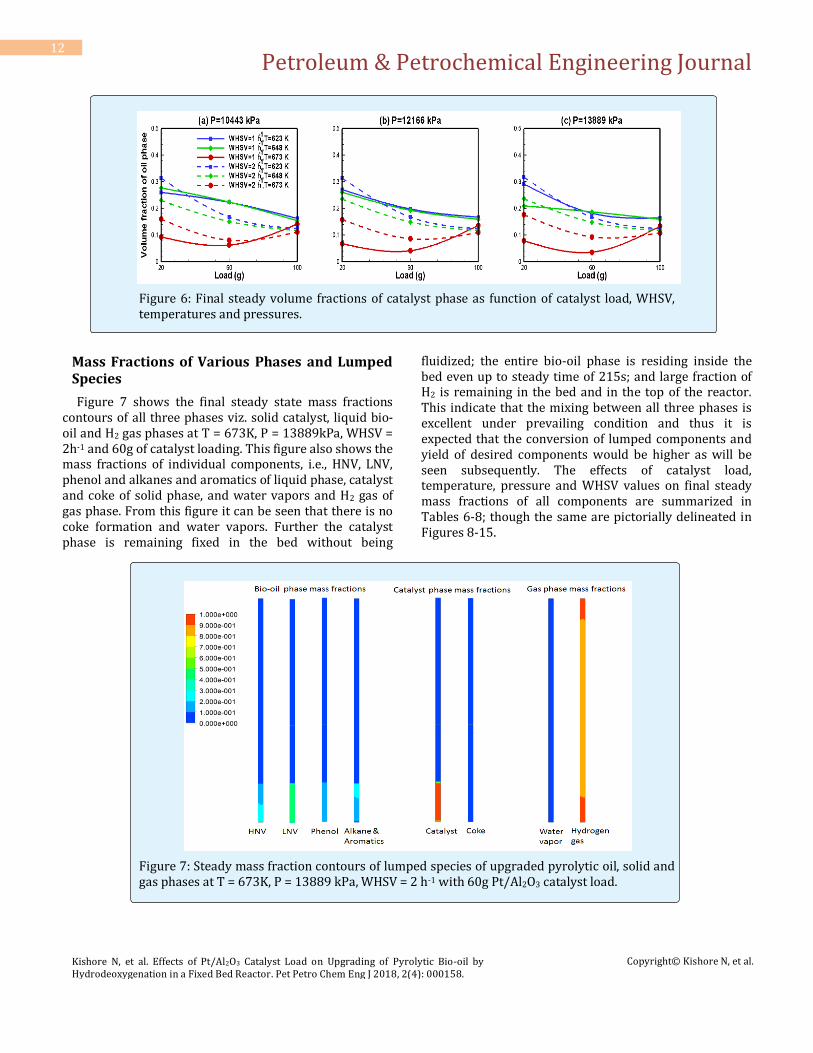
Figure 7 shows the final steady state mass fractions contours of all three phases viz. solid catalyst, liquid bio-oil and H2 gas phases at T = 673K, P = 13889kPa, WHSV = 2h-1 and 60g of catalyst loading. This figure also shows the mass fractions of individual components, i.e., HNV, LNV, phenol and alkanes and aromatics of liquid phase, catalyst and coke of solid phase, and water vapors and H2 gas of gas phase. From this figure it can be seen that there is no coke formation and water vapors. Further the catalyst phase is remaining fixed in the bed without being
fluidized; the entire bio-oil phase is residing inside the bed even up to steady time of 215s; and large fraction of H2 is remaining in the bed and in the top of the reactor. This indicate that the mixing between all three phases is excellent under prevailing condition and thus it is expected that the conversion of lumped components and yield of desired components would be higher as will be seen subsequently. The effects of catalyst load, temperature, pressure and WHSV values on final steady mass fractions of all components are summarized in Tables 6-8; though the same are pictorially delineated in Figures 8-15.
Figure 7: Steady mass fraction contours of lumped species of upgraded pyrolytic oil, solid and gas phases at T = 673K, P = 13889 kPa, WHSV = 2 h-1 with 60g Pt/Al2O3 catalyst load.

Petroleum & Petrochemical Engineering Journal
Kishore N, et al. Effects of Pt/Al2O3 Catalyst Load on Upgrading of Pyrolytic Bio-oil by Hydrodeoxygenation in a Fixed Bed Reactor. Pet Petro Chem Eng J 2018, 2(4): 000158.
Copyright© Kishore N, et al.
13
Species WHSV=1h-1 WHSV=2h-1 P=10443 kPa
T=623K T=648K T=673K T=623K T=648K T=673K
HNV 0.2882 0.1649 0.0713 0.2762 0.1372 0.2302 LNV 0.4462 0.4676 0.4687 0.4529 0.4562 0.4233
Phenol 0.1283 0.1742 0.2191 0.1316 0.2574 0.1709 Alkane and Aromatics 0.1315 0.1932 0.2508 0.1391 0.159 0.1754
P=12166 kPa HNV 0.2869 0.1684 0.0772 0.2753 0.1343 0.2404 LNV 0.4497 0.4655 0.4652 0.453 0.4507 0.4272
Phenol 0.1296 0.1737 0.2177 0.1319 0.2626 0.164 Alkane and Aromatics 0.1336 0.1922 0.2596 0.1396 0.1521 0.1682
P=13889 kPa HNV 0.2888 0.1624 0.0748 0.2749 0.1794 0.2439 LNV 0.4494 0.4654 0.4633 0.4531 0.4605 0.4313
Phenol 0.1291 0.1768 0.2194 0.1322 0.2219 0.1599 Alkane and Aromatics 0.1326 0.1952 0.2622 0.1424 0.1483 0.1647
Table 6: Final steady mass fractions of all components when 20g of Pt/Al2O3 catalyst used.
Species WHSV=1h-1 WHSV=2h-1 P=10443 kPa
T=623K T=648K T=673K T=623K T=648K T=673K
HNV 0.2776 0.1544 0.0301 0.2804 0.1548 0.1646 LNV 0.4533 0.4636 0.4734 0.4516 0.4458 0.3883
Phenol 0.1305 0.1819 0.2373 0.1307 0.1975 0.2216 Alkane and Aromatics 0.1345 0.1985 0.2623 0.137 0.2016 0.2253
P=12166 kPa HNV 0.2839 0.1407 0.0201 0.2801 0.1598 0.1776 LNV 0.4507 0.4612 0.4001 0.4517 0.4461 0.3944
Phenol 0.1295 0.1918 0.2904 0.1308 0.1958 0.2116 Alkane and Aromatics 0.1357 0.2061 0.2893 0.1372 0.2009 0.2162
P=13889 kPa HNV 0.2822 0.1263 0.1151 0.2797 0.1602 0.1845 LNV 0.4511 0.4558 0.3322 0.4518 0.4467 0.4021
Phenol 0.1299 0.2037 0.2433 0.1309 0.1937 0.2039 Alkane and Aromatics 0.1365 0.2139 0.3025 0.1374 0.1992 0.2093
Table 7: Final steady mass fractions of all components when 60g of Pt/Al2O3 catalyst used.
Species WHSV=1h-1 WHSV=2h-1 P=10443 kPa
T=623K T=648K T=673K T=623K T=648K T=673K
HNV 0.3551 0.2758 0.161 0.3454 0.2542 0.1727 LNV 0.423 0.4445 0.4513 0.4271 0.4512 0.446
Phenol 0.1207 0.1378 0.1875 0.1215 0.1438 0.1868 Alkane and Aromatics 0.1008 0.1418 0.1996 0.1059 0.1518 0.1943
P=12166 kPa HNV 0.3479 0.2611 0.1521 0.3447 0.2535 0.1728 LNV 0.4261 0.4485 0.4494 0.4273 0.45 0.4451
Phenol 0.1212 0.1415 0.1936 0.1216 0.1442 0.1872
Petroleum & Petrochemical Engineering Journal
Kishore N, et al. Effects of Pt/Al2O3 Catalyst Load on Upgrading of Pyrolytic Bio-oil by Hydrodeoxygenation in a Fixed Bed Reactor. Pet Petro Chem Eng J 2018, 2(4): 000158.
Copyright© Kishore N, et al.
14
Alkane and Aromatics 0.1046 0.1486 0.2048 0.106 0.1521 0.1946 P=13889 kPa
HNV 0.3531 0.2587 0.1473 0.3448 0.2532 0.1727 LNV 0.424 0.449 0.4464 0.4273 0.4503 0.4444
Phenol 0.1209 0.1423 0.1985 0.1262 0.1459 0.1878 Alkane and Aromatics 0.1019 0.1498 0.2076 0.1062 0.1529 0.1949
Table 8: Final steady mass fractions of all components when 100g of Pt/Al2O3 catalyst used.
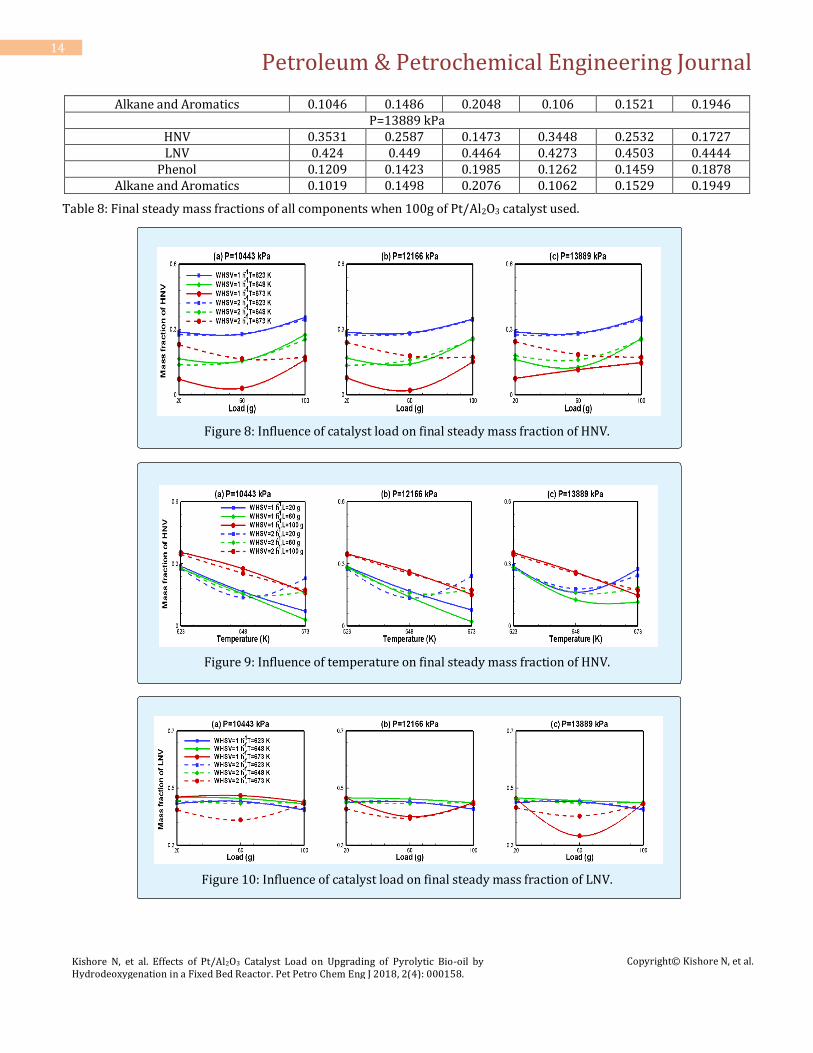
Figure 8: Influence of catalyst load on final steady mass fraction of HNV.
Figure 9: Influence of temperature on final steady mass fraction of HNV.
Figure 10: Influence of catalyst load on final steady mass fraction of LNV.
Petroleum & Petrochemical Engineering Journal
Kishore N, et al. Effects of Pt/Al2O3 Catalyst Load on Upgrading of Pyrolytic Bio-oil by Hydrodeoxygenation in a Fixed Bed Reactor. Pet Petro Chem Eng J 2018, 2(4): 000158.
Copyright© Kishore N, et al.
15
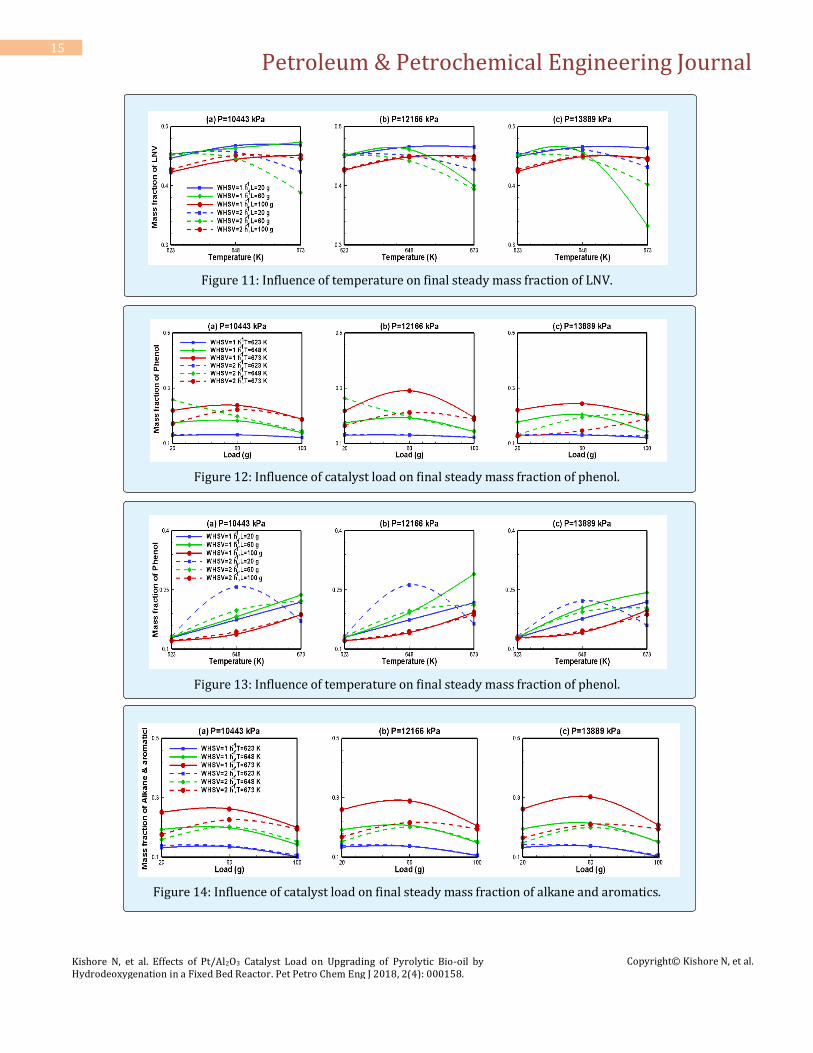
Figure 11: Influence of temperature on final steady mass fraction of LNV.
Figure 12: Influence of catalyst load on final steady mass fraction of phenol.
Figure 13: Influence of temperature on final steady mass fraction of phenol.
Figure 14: Influence of catalyst load on final steady mass fraction of alkane and aromatics.
Petroleum & Petrochemical Engineering Journal
Kishore N, et al. Effects of Pt/Al2O3 Catalyst Load on Upgrading of Pyrolytic Bio-oil by Hydrodeoxygenation in a Fixed Bed Reactor. Pet Petro Chem Eng J 2018, 2(4): 000158.
Copyright© Kishore N, et al.
16
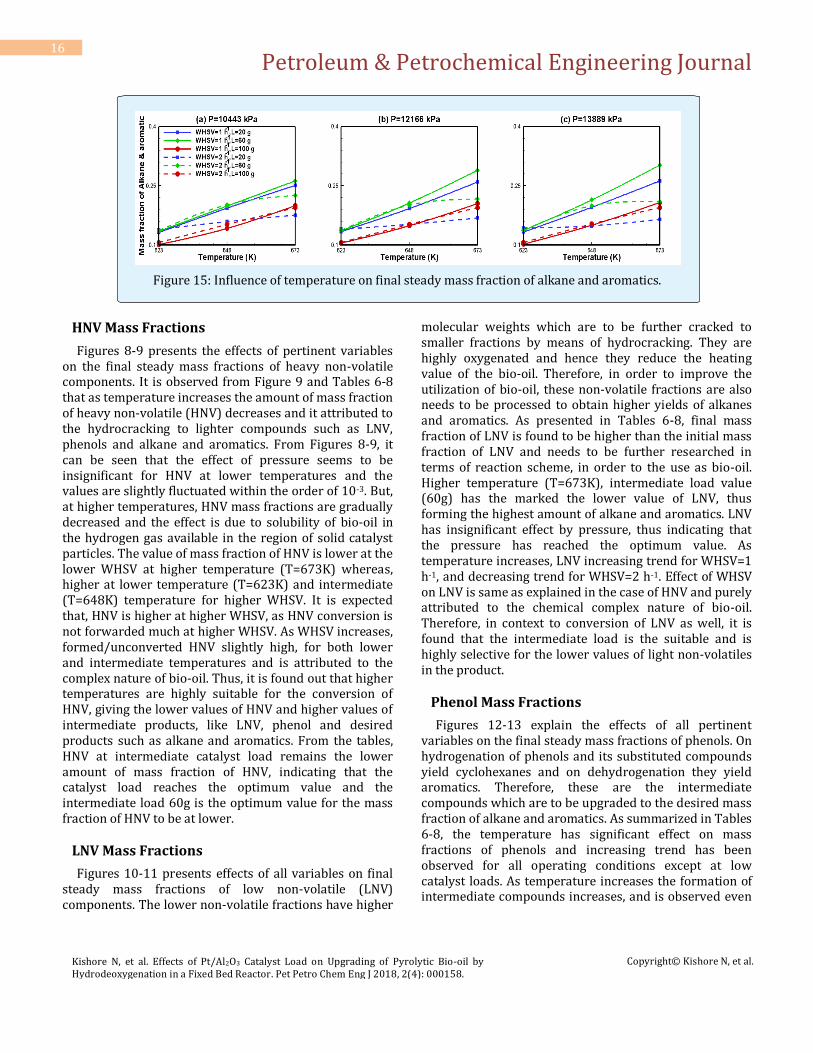
Figure 15: Influence of temperature on final steady mass fraction of alkane and aromatics.
HNV Mass Fractions
Figures 8-9 presents the effects of pertinent variables on the final steady mass fractions of heavy non-volatile components. It is observed from Figure 9 and Tables 6-8 that as temperature increases the amount of mass fraction of heavy non-volatile (HNV) decreases and it attributed to the hydrocracking to lighter compounds such as LNV, phenols and alkane and aromatics. From Figures 8-9, it can be seen that the effect of pressure seems to be insignificant for HNV at lower temperatures and the values are slightly fluctuated within the order of 10-3. But, at higher temperatures, HNV mass fractions are gradually decreased and the effect is due to solubility of bio-oil in the hydrogen gas available in the region of solid catalyst particles. The value of mass fraction of HNV is lower at the lower WHSV at higher temperature (T=673K) whereas, higher at lower temperature (T=623K) and intermediate (T=648K) temperature for higher WHSV. It is expected that, HNV is higher at higher WHSV, as HNV conversion is not forwarded much at higher WHSV. As WHSV increases, formed/unconverted HNV slightly high, for both lower and intermediate temperatures and is attributed to the complex nature of bio-oil. Thus, it is found out that higher temperatures are highly suitable for the conversion of HNV, giving the lower values of HNV and higher values of intermediate products, like LNV, phenol and desired products such as alkane and aromatics. From the tables, HNV at intermediate catalyst load remains the lower amount of mass fraction of HNV, indicating that the catalyst load reaches the optimum value and the intermediate load 60g is the optimum value for the mass fraction of HNV to be at lower.
LNV Mass Fractions
Figures 10-11 presents effects of all variables on final steady mass fractions of low non-volatile (LNV) components. The lower non-volatile fractions have higher
molecular weights which are to be further cracked to smaller fractions by means of hydrocracking. They are highly oxygenated and hence they reduce the heating value of the bio-oil. Therefore, in order to improve the utilization of bio-oil, these non-volatile fractions are also needs to be processed to obtain higher yields of alkanes and aromatics. As presented in Tables 6-8, final mass fraction of LNV is found to be higher than the initial mass fraction of LNV and needs to be further researched in terms of reaction scheme, in order to the use as bio-oil. Higher temperature (T=673K), intermediate load value (60g) has the marked the lower value of LNV, thus forming the highest amount of alkane and aromatics. LNV has insignificant effect by pressure, thus indicating that the pressure has reached the optimum value. As temperature increases, LNV increasing trend for WHSV=1 h-1, and decreasing trend for WHSV=2 h-1. Effect of WHSV on LNV is same as explained in the case of HNV and purely attributed to the chemical complex nature of bio-oil. Therefore, in context to conversion of LNV as well, it is found that the intermediate load is the suitable and is highly selective for the lower values of light non-volatiles in the product.
Phenol Mass Fractions
Figures 12-13 explain the effects of all pertinent variables on the final steady mass fractions of phenols. On hydrogenation of phenols and its substituted compounds yield cyclohexanes and on dehydrogenation they yield aromatics. Therefore, these are the intermediate compounds which are to be upgraded to the desired mass fraction of alkane and aromatics. As summarized in Tables 6-8, the temperature has significant effect on mass fractions of phenols and increasing trend has been observed for all operating conditions except at low catalyst loads. As temperature increases the formation of intermediate compounds increases, and is observed even
Petroleum & Petrochemical Engineering Journal
Kishore N, et al. Effects of Pt/Al2O3 Catalyst Load on Upgrading of Pyrolytic Bio-oil by Hydrodeoxygenation in a Fixed Bed Reactor. Pet Petro Chem Eng J 2018, 2(4): 000158.
Copyright© Kishore N, et al.
17
at lower WHSV’s. But, at the WHSV=2 h-1 due to the less residence time and lower catalyst availability, the phenol’s mass fractions are at considerably low. As discussed earlier, the pressure has insignificant effect and fluctuations are observed at increasing trend specifies that the solubility of bio-oil in H2 gas to react under catalyst conditions, making the phenol to enhance. WHSV has lower effect on phenol mass fractions at lower temperatures and higher effect at intermediate and higher temperatures. It is due to the fact that at lower temperature the rate of reaction is low; by increasing temperature reaction rate increases and thus the value of mass fraction of phenols increases. The load has insignificant effect on the phenols mass fractions and has slightly fluctuated infinitesimally.
Alkane and Aromatics Mass Fractions
Figures 14-15 presents the effects of catalyst load, temperature, pressure and WHSV values on the final steady mass fractions of alkane and aromatics in the upflow fixed bed reactor. At constant pressure P = 10443 kPa it is observed that, as temperature increases, amount of alkane and aromatics increases, as the reaction rate increases. It is also attributed to the activity of the catalyst. The mass fractions are linearly varied with the temperature and as observed, the intermediate load has higher amount of aromatics, followed by 20g and then 100g. But at WHSV = 2h-1, aromatics are seen higher in intermediate load 60g, followed by 100g, followed by lower load at higher temperature. Optimum amount of catalyst is crucial to ensure optimum yield of desired products. If catalyst load is further increased (i.e., higher than the optimum value) the catalyst is used for secondary cracking reactions such as formation of LNV species from HNV lumped species). It is observed from Tables 6-8 that the value of alkane and aromatics are seen higher when 60g of catalyst was loaded in the reactor. The pressure has insignificant effect on the alkane and aromatics at any load conditions. At WHSV = 1h-1, mass fraction of alkane and aromatics is higher at intermediate level followed by 20g and 100g of catalyst. But at higher WHSV = 2 h-1, the mass fraction of alkane and aromatics is higher for the lower load followed by 60g and 100g. These effects are all attributed to the optimum loading of catalyst into the reactor. In summary, the pressure has insignificant effect of mass fractions of alkanes and aromatics regardless of the values of the WHSV and temperaure; and it is found that the for all values of the WHSV, temperature and pressures, a load of 60g is optimum in terms of the final steady mass fractions of the alkanes and aromatics.
Conclusions
Under the present range of oil and hydrogen gas flow rates, the bed remains fixed regardless the values of the pressure, temperature and catalyst load. The mixing amongst all three phases is excellent as the much of the bio oil and sufficient large fractions of H2 are remaining inside the bed even when the steady state is established at large time of 215s. In much of the analysis it is found that the present range of pressure has insignificant effect on the overall performance of HDO of pyrolysis oil in upflow fixed bed reactor. According to final steady mass fractions of HNV and LNV, a catalyst load of 60g is found to be suitable for their conversion into phenols and alkanes and aromatics subsequently. The highest yields of alkane and aromatics are obtained at intermediate load of 60g of catalyst load, at higher pressures P=13889 kPa, and at higher temperatures T=673 K, at WHSV= 1 h-1. The suitable operating conditions for maximum amount of alkane and aromatics are found to be higher temperature (623K < 648K < 673K), intermediate in load (100g < 20g < 60g), higher in pressure (10443 kPa <12166 kPa <13889 kPa) and lower WHSV (1h-1).
Nomenclature
Symbol (Units) Description
𝐹𝑞 (N) external forces
𝜏𝑞 (Pa) stress-strain tensor
∅𝑙𝑠 (kJ) energy exchange 𝑒𝑠𝑠 coefficient of restitution for particle collisions 𝑔 (m2/s) gravitational force 𝛾𝜃𝑠 (kg/ms3) collision dissipation energy 𝜎𝑘 Turbulent Prandtl numbers A (min-1) Arrhenius constant Al2O3 alumina b buoyancy Cd drag coefficient CFD computational fluid dynamics CO carbon-monoxide CO2 carbon-dioxide Co-Mo cobalt-molybdenum oxide D (m2/s) diffusion coefficient of species D (m) diameter (m) E (kJ/mol) activation energy Fr friction G (kJ) generation of energy H (kJ) specific enthalpy HDO hydrodeoxygenation HNV heavy non volatiles i,j components
Petroleum & Petrochemical Engineering Journal
Kishore N, et al. Effects of Pt/Al2O3 Catalyst Load on Upgrading of Pyrolytic Bio-oil by Hydrodeoxygenation in a Fixed Bed Reactor. Pet Petro Chem Eng J 2018, 2(4): 000158.
Copyright© Kishore N, et al.
18
K (dimensionless) interface exchange coefficient k mean velocity gradients l liquid phase LNV light non volatiles Nu (dimensionless) Nusselt number P (Pa) pressure Pr (dimensionless) Prandtl number Pt platinum q fluid phase (primary phase) qh (J/s) heat flux r (mol/l s) rate of reaction Re (dimensionless) Reynolds number s solid phase S source term T (K) temperature WHSV (hr-1) weightily hour space velocity Y (dimensionless) local mass fraction of species Greek letters α volume fraction ε (m2/s3) rate of dissipation ρ (kg/m3) density 𝑣 (m/s) velocity 𝜇 (Pa.s) viscosity
References
1. Sheu EYH, Rayford GA, Soltes EDJ (1988) Kinetic studies of upgrading pine pyrolytic oil by hydrotreatment. Fuel Process Technol 19(1): 31-50.
2. Bu Q, Lei H, Zacher AH, Wang L, Ren S et, al. (2012) A review of catalytic hydrodeoxygenation of lignin-derived phenols from biomass pyrolysis. Bioresour Technol 124: 470-477.
3. Gollakota ARK, Reddy M, Subramanyam MD, Kishore N (2015b) A review on the upgradation techniques of pyrolysis oil. Renew Sust Energy Rev 58: 1543-1568.
4. Weisser O, Landa S (1973) Sulphide catalysts: Their Properties and Applications. 1st (Edn.), Pergamon, Academia publishing house, Prague.
5. Furimsky E (1978) Catalytic deoxygenation of heavy gas oil. Fuel 57(8): 494-496.
6. Furimsky E (1979) Catalytic removal of sulfur, nitrogen, and oxygen from heavy gas oil. AIChE J 25(2): 306-311.
7. Furimsky E (1983) Chemistry of catalytic hydrodeoxygenation. Catal Rev Sci Eng 25(3): 421-458.
8. Ternan M, Brown JR (1982) Hydrotreating a distillate liquid derived from sub-bituminous coal using a sulfide CoO-MoO3/Al2O3 catalyst. Fuel 61: 110-118.
9. Elliott DC, Baker EG (1984) Upgrading biomass liquefaction products through hydrodeoxygenation. Biotechnol. Bioeng Symp 14: 159-174.
10. Johnson DK, Ratcliff MA, Posey FL, Maholland MA, Cowley SW et al. (1988) Hydrodeoxygenation of a lignin model compound. In: Bridgwater AV, Kuester JL (Ed.), Research in Thermochemical Biomass Conversion, Elsevier Science Publishers, England, pp: 941-955.
11. Train PM, Klein MT (1986) Chemical and stochastic modeling of lignin hydrodeoxygenation. Department of Chemical Engineering, University of Delaware 32: 240-248.
12. Elliot DC (2007) Historic developments in hydroprocessing bio-oils. Energy Fuels 21(3): 1792-1815.
13. Baker EG, Elliott DC (1988) Catalytic upgrading of biomass pyrolysis oils. Research in Thermochemical Biomass Conversion, Elsevier Science Publishers, pp: 883-895.
14. Piskorz J, Scott DS, Radlein D (1988) Composition of oils obtained by fast pyrolysis in different woods. Soltes EJ, Milne TA (Ed.), pyrolysis oils from biomass. ACS Symp Ser 376: 167-178.
15. Baldauf W, Balfanz U, Ruppa M (1994) Upgrading of flash pyrolysis oil and utilization in refineries. Biomass Bioenergy 7(1-6): 237-244.
16. Horne PA, Williams PT (1996) Reactions of oxygenated biomass pyrolysis model compounds over a ZSM-5 catalyst. Renewable Energy 7(2): 131-144.
17. Mercader DMF, Groeneveld MJ, Kersten SRA, Schavaerien NWJ, Hogendoorn JA (2010) Production of advanced bio-fuels: Co-processing of upgraded pyrolysis oil in standard refinery units. Appl Catal B: Environmental 96(1-2): 57-66.
18. Venderbosch RH, Ardityanti AR, Wildschut J, Oasmaa A, Heeres HJ (2010) Stabilization of biomass derived pyrolysis oils. J Chem Technol Biotechnol 85(5): 674-686.
Petroleum & Petrochemical Engineering Journal
Kishore N, et al. Effects of Pt/Al2O3 Catalyst Load on Upgrading of Pyrolytic Bio-oil by Hydrodeoxygenation in a Fixed Bed Reactor. Pet Petro Chem Eng J 2018, 2(4): 000158.
Copyright© Kishore N, et al.
19
19. Xu X, Zhang C, Liu Y (2013) Two-step catalytic hydrodeoxygenation of fast pyrolysis oil to hydrocarbon liquid fuels. Chemosphere 93(4): 652-660.
20. Parapati DR, Vamshi KG, Venkata PK, Phillip SH, Satish TK (2014) Single stage hydroprocessing of pyrolysis oil in a continuous packed bed reactor. Environmental Progress & Sustainable Energy 33(3): 726-731.
21. Gollakota ARK, Subramanyam MD, Kishore N, Gu S (2015a) CFD simulations on the effect of catalysts on the hydrodeoxygenation of bio-oil. RSC Adv 5: 41855-41866.
22. Subramanyam MD, Gollakota ARK, Kishore N (2015) CFD simulations of catalytic hydrodeoxygenation of bio-oil using Pt/Al2O3 in a fixed bed reactor. RSC Adv 5: 90354-90366.
23. Oasmaa A, Czernik S (1999) Fuel oil quality of biomass pyrolysis oils-state of art for end users. Energy Fuels 13(4): 914-921.
24. Anderson TB, Jackson R (1967) Fluid Mechanical Description of Fluidized Beds. Equations of Motion. Industrial & Engineering Chemistry Fundamentals 6(4): 527-539.
25. Schiller L, Naumann A (1933) Uber die grundegendenberch-nungenbei der schwerkraftaufbereitung. Z Ver Dtsch Ing 77: 318-320.
26. Ergun S (1952) Fluid flow through packed columns. Chem Eng Prog 48(2): 88-94.
27. Ranz WE, Marshall WR (1952) Evaporation of drops, Part 1. Chem Eng Prog 48: 141-146.
28. Gunn DJ (1978) Transfer of heat or mass to particles in fixed and fluidized beds. Int J Heat Mass Transfer 21(4): 467-476.
29. Ding J, Gidaspow D (1990) A bubbling fluidization model using kinetic theory of granular flow. AIChE J 36(4): 523-538.
30. Gidaspow D, Bezburuah R, Ding J (1992) Hydrodynamics of circulating fluidized beds, Kinetic theory approach. 7th international conference on fluidization, Australia, pp: 75-82.
31. Wen CY, Yu YH (1966) Mechanics of fluidization. Chem Eng Prog Symp Ser 62: 100-111.
32. Launder BE, Spalding DB (1972) Lectures in mathematical models of turbulence. London; New York: Academic Press, pp: 157-162.