Sedimentology, petrography, and tectonic significance of ...
Petrography, geochemistry and sedimentology of
sandstones from the Central Tertiary Basin of
Svalbard – implications for diagenesis and
temperature history
Master Thesis in Basin and Reservoir Studies
Elisabeth Osaland
Department of Earth Science
University of Bergen
September 2019

I
Abstract
Svalbard, representing an uplifted area of the north-western Barents Sea Shelf, provides a
unique opportunity for studying on-shore outcrops of the shelf. The present study focuses on
Paleocene-Eocene deposits of the Central Tertiary Basin (CTB), located in central-southern
parts of Spitsbergen. Despite the large number of studies concerning diagenetic alteration of
sedimentary rocks, parameters controlling the types and distribution of authigenic minerals are
still not fully understood. Here, I systematically relate the early diagenetic minerals of the
Firkanten, Grumantbyen and Aspelintoppen formations to sandstone composition and
depositional environment. The identification of these diagenetic minerals integrates
petrographic observations obtained from thin section analyses (optical microscopy and SEM)
and XRD-analysis. Sedimentological analysis is supplemented by geochemical data, providing
a better understanding of large- and small-scale variations in lithology and, thus, depositional
environment.
The different authigenic mineral assemblages of the sandstones of the Firkanten, Grumantbyen
and Aspelintoppen formations are related to their different detrital compositions and
depositional environment. The generally higher porosity values of the Grumantbyen Formation
sandstones may be ascribed to the occurrence of grain coating chlorite, preventing precipitation
of quartz cement at great burial depths. The relatively homogenous nature of these sandstones
provides conditions favourable for precipitation of early berthierine rims. At temperatures of
about 90oC (i.e. subsequent to the onset of quartz cementation) berthierine is altered into
chlorite, suggesting that early diagenetic berthierine-rims, rather than later burial grain-coating
chlorite, is responsible for preventing quartz cementation. The occurrence of glauconite in the
lowermost part of the Firkanten Formation (Todalen Member), accompanied by abundant
framboidal pyrite, may indicate the onset of transgressive conditions and deposition of the
overlying marine Endalen Member. Burial diagenesis is largely influenced by the presence of
early diagenetic products, in which they affect a variety of diagenetic processes. Burial
diagenetic minerals, usually indicating a specific burial depth and minimum-temperature, can
be used to cross-check temperatures derived from organic maturity indicators (e.g. vitrinite
reflectance). The burial diagenetic signatures of the studied formations (e.g. quartz, Fe-chlorite,
ankerite), suggest maximum temperatures of at least 100-110oC. Extensive quartz cementation
in sandstone samples from the Firkanten and Grumantbyen formations, however, may support
higher temperatures, as suggested by vitrinite reflectance measurements of coals.

II

III
Acknowledgements
This thesis was conducted at the Department of Earth Science at the University of Bergen and,
in part, at the University Centre in Svalbard. I would like to acknowledge several people for
their contribution and encouragement – this research project would not have been possible
without you.
First, I would like to express my sincerest gratitude to my supervisor Helge Hellevang (UiO)
for his guidance, encouragement and support. A big thanks to my co-supervisors William
Helland-Hansen (UiB), Malte Jochmann (UNIS), Snorre Olaussen (UNIS) and Maria Jensen
(UNIS) for their feedback and interesting discussions. A special thanks to Malte for taking good
care of me at UNIS and for helping me to collecting the cores in Endalen. Thanks to Helge for
going all the way to Svalbard with me this winter for XRF-analysis of the cores. I would also
like to express my appreciation to Beyene Girma Haile (UiO) for performing XRD-analysis of
selected core-samples.
Furthermore, I would like to thank Store Norske Spitsbergen Kullkompani (SNSK) for giving
me access to their core storage in Endalen and UNIS for letting me store more than 200 meters
of cores at Logistics. A big thanks to the Department of Earth Science at the University of
Bergen for generously funding parts of this research, and to the Department of Geosciences at
the University of Oslo for thin section preparations.
Thanks to my fellow students and friends at the University of Bergen for five indelible years.
A special thanks to the people at “Hovedkvarteret” and “Grotten”, and to my Svalbard-friends
for making my stay at UNIS unforgettable. Last but not least, I would like to thank Anne-Brit
and Malin for their encouragement and support, and for always believing in me. A big thanks
to my fellow student May Britt for proof reading and good advices.
Elisabeth Osaland
Bergen, 2nd of September 2019

IV
V
Table of Contents
1 INTRODUCTION .............................................................................................................................................. 1
1.1 AIM OF STUDY .............................................................................................................................................. 1 1.2 DATA BACKGROUND .................................................................................................................................... 3
2 GEOLOGICAL FRAMEWORK ..................................................................................................................... 5
2.1 INTRODUCTION ............................................................................................................................................ 5 2.2 THE CENOZOIC SEDIMENTARY SYSTEM ...................................................................................................... 6 2.3 BASIN FILL OF THE CENTRAL TERTIARY BASIN ......................................................................................... 8
2.3.1 The transgressive phase of basin infilling – Firkanten and Basilika formations ............................. 9 2.3.2 The first regressive phase of basin infilling – Grumantbyen and Hollenderdalen formations ....... 10 2.3.3 The second regressive phase of basin infilling – Frysjaodden, Battfjellet and Aspelintoppen
formations ................................................................................................................................................... 11 2.4 THE CENOZOIC CLIMATE .......................................................................................................................... 12
3 THEORETICAL BACKGROUND ................................................................................................................ 13
3.1 INTRODUCTION .......................................................................................................................................... 13 3.2 FACTORS CONTROLLING DIAGENESIS ....................................................................................................... 13 3.3 EARLY DIAGENESIS .................................................................................................................................... 14 3.4 MECHANICAL COMPACTION ...................................................................................................................... 15 3.5 SANDSTONES BURIED TO INTERMEDIATE DEPTHS (2.0-3.5 KM, 50-120OC) .............................................. 17 3.6 SANDSTONES BURIED TO GREAT DEPTHS (>3.5-4 KM, >120OC) ................................................................ 17
4 METHODS ....................................................................................................................................................... 19
4.1 INTRODUCTION .......................................................................................................................................... 19 4.2 SEDIMENTARY LOGGING ........................................................................................................................... 19 4.3 SAMPLING AND CUTTING OF SEDIMENT CORES ........................................................................................ 19 4.4 PETROGRAPHIC ANALYSES ........................................................................................................................ 20 4.5 X-RAY FLUORESCENCE (XRF) ANALYSIS ................................................................................................. 22
5 RESULTS ......................................................................................................................................................... 23
5.1 SEDIMENTOLOGICAL ANALYSIS ................................................................................................................ 23 5.1.1 Introduction ....................................................................................................................................... 23 5.1.2 Firkanten Formation (core 7-2006) .................................................................................................. 24 5.1.3 Grumantbyen Formation (cores 7-2006 and 11-2003) ..................................................................... 35 5.1.4 Aspelintoppen Formation (core 11-2003) ......................................................................................... 40
5.2 GEOCHEMICAL TRENDS ............................................................................................................................. 46 5.2.1 Introduction ....................................................................................................................................... 46 5.2.2 Firkanten Formation ......................................................................................................................... 46 5.2.3 Grumantbyen Formation ................................................................................................................... 49 5.2.4 Aspelintoppen Formation .................................................................................................................. 51 5.2.5 Authigenic minerals ........................................................................................................................... 53
5.3 PETROGRAPHIC ANALYSES ........................................................................................................................ 54 5.3.1 Introduction ....................................................................................................................................... 54 5.3.2 Firkanten Formation ......................................................................................................................... 55 5.3.3 Grumantbyen Formation ................................................................................................................... 61 5.3.4 Aspelintoppen Formation .................................................................................................................. 65
6 DISCUSSION ................................................................................................................................................... 69
6.1 INTRODUCTION .......................................................................................................................................... 69 6.2 TRENDS IN GEOCHEMICAL DATA (XRF-ANALYSIS) .................................................................................. 69 6.3 LINKING DIAGENESIS TO DEPOSITIONAL ENVIRONMENT ......................................................................... 70
6.3.1 Firkanten Formation ......................................................................................................................... 71 6.3.2 Upper part of Grumantbyen Formation ............................................................................................ 74 6.3.3 Aspelintoppen Formation .................................................................................................................. 75 6.3.4 Compaction ........................................................................................................................................ 76
6.4 USE OF AUTHIGENIC MINERALS AS A PALEOTHERMOMETER ................................................................... 78 6.4.1 Burial diagenetic signatures .............................................................................................................. 78

VI
6.4.2 Vitrinite reflectance studies of coals ................................................................................................. 80 6.4.3 Are VR measurements consistent with authigenic signatures? ....................................................... 83
7 CONCLUSIONS AND FURTHER WORK .................................................................................................. 85
7.1 CONCLUSIONS ............................................................................................................................................ 85 7.2 SUGGESTIONS FOR FURTHER WORK .......................................................................................................... 86
REFERENCES .................................................................................................................................................... 87
APPENDIX I: SAMPLING INTERVALS.......................................................................................................... 93
APPENDIX II: PETROGRAPHIC ANALYSES ................................................................................................ 96
APPENDIX III: OPTICAL MICROGRAPHS ................................................................................................. 117
Chapter 1 Introduction
1
1 Introduction
1.1 Aim of study
Temperature, being a crucial factor controlling diagenesis in sedimentary rocks, is important
for assessing a range of different parameters, including fluid flow, petroleum generation,
chemical compaction, and estimations of the amount uplift and erosion (Haile et al., 2018b).
Constraining the thermal history of sedimentary basins is thus essential in forecasting the
quality of reservoir rocks. Svalbard, representing an uplifted area of the north-western Barents
Sea Shelf, provides a unique opportunity for studying on-shore outcrops of the shelf.
Reconstructions of the thermal history of the Central Tertiary Basin (CTB), however, are
chiefly restricted to vitrinite reflectance (VR) studies of coals (Manum and Throndsen, 1978;
Throndsen, 1982) . Organic maturity indicators (i.e. VR) provide a direct measure of thermally
induced changes rather than a direct measure of paleotemperatures. Temperatures derived from
organic maturity indicators are thus calculated indirectly using various models or empirical
regression equations, suggesting that it may be difficult to obtain accurate temperature estimates
(Haile et al., 2018b). Diagenetic processes in sedimentary rocks, however, are strongly linked
to a specific burial depth and temperature, suggesting that authigenic minerals usually indicate
a specific burial depth and minimum-temperature or temperature interval (Worden and Burley,
2003; Bjørlykke and Jahren, 2015) .
Diagenetic processes (i.e. mechanical/chemical compaction and cementation) are largely
influenced by the detrital composition of sandstones (Bjørlykke, 2001; Morad et al., 2012). The
detrital composition of sandstones, in turn, is a function of depositional environment, transport
and provenance. Common diagenetic processes, including mechanical compaction, grain
dissolution (e.g. feldspar), formation of kaolinite and growth of pore-lining minerals (e.g. grain
coating chlorite), can thus be linked to depositional facies and depositional environment (Morad
et al., 2010). Depositional facies and depositional environment control a variety of parameters,
including initial porosity and permeability, sand/mud ratio and sand-body geometry, which, in
turn, affect the rate and path-ways of fluid flow (Morad et al., 2010). The amount and
distribution of eogenetic alterations in sandstones is largely influenced by the rate and path-
ways of fluid flow, whereas burial diagenesis is controlled by the amount of fluid flow through
the remaining porosity and the presence of early diagenetic products. Early diagenetic products
Chapter 1 Introduction
2
affect, for instance, clay mineral transformations and precipitation of quartz cement, in which
the latter is of great importance to reservoir quality (Morad et al., 2010).
Diagenetic alteration of reservoir rocks has frequently been studied in the Barents Sea region
(e.g. Riis et al., 2008; Mørk, 2013). Nevertheless, paleotemperature estimates of the rocks are
based on vitrinite reflectance studies of coals, Rock-Eval pyrolysis and fission track analyses
rather than diagenetic signatures (e.g. Abay et al. cited in Haile et al., 2018b). Haile et al.
(2018b), however, recently presented an integrated approach of thermal history reconstruction,
utilising the middle to upper Triassic strata of Edgeøya, Svalbard. Paleotemperatures of the
sedimentary sequence were estimated using Rock Eval pyrolysis parameters, fluid inclusions
in diagenetic quartz and inorganic diagenetic signatures of sandstones. Furthermore, the study
of Dörr et al. (2018) provides a basin model based on low-temperature thermochronology data,
vitrinite reflectance measurements and clay mineralogy. The diagenetic signatures (clay
minerals) seem to be consistent with vitrinite data, suggesting maximum temperatures of 90-
100oC for the Eocene coals and 120-130oC for the Paleocene coals. Furthermore, Dörr et al.
(2018) argued that nearly 4000 m of sediments have been removed from the Central Tertiary
Basin since the Early Eocene. The present estimate is considerably higher than previous
estimates, ranging from 1000 m to approximately 3500 m (Manum and Throndsen, 1978;
Blythe and Kleinspehn, 1998; Marshall et al., 2015).
Despite the large number of studies concerning diagenetic alteration of sedimentary rocks, the
parameters controlling their spatial and temporal distribution are still not fully understood
(Morad et al., 2012). The study of Mørk (2013), however, discussing the diagenetic alteration
of reservoir sandstones of the Upper Triassic-Middle Jurassic De Geerdalen and Knorringfjellet
formations (Svalbard), demonstrates that diagenesis and distribution of quartz cement is
strongly controlled by lithofacies and detrital composition. Furthermore, Haile et. al (2018a)
provides a detailed study of the diagenetic alteration of the middle to late Triassic sandstones
of Edgeøya, Svalbard, aiming to link diagenesis and reservoir quality to depositional facies.
The study suggests that the variability of diagenetic signatures is a function of depositional
facies, and that the diagenetic alteration variability between depositional facies results from
differences in the quality of grain-coating chlorite, the extent and distribution of porefilling
clays, quartz and carbonate cements, sorting, and distribution of grain sizes.
Chapter 1 Introduction
3
Initially, the main purpose of the present thesis was to investigate if authigenic minerals can be
used to estimate the maximum temperature of reservoirs, requiring that the reservoir has
experienced temperatures not higher than 130oC and not lower than 60oC. Authigenic minerals
can thus be used to support previous estimates of paleotemperatures based on vitrinite
reflectance and/or be used unattended where coal or other paleotemperature indicators are
absent. The deep burial of the CTB and high degree of mechanical and chemical compaction,
however, complicated the use of authigenic minerals as a paleothermometer. The main focus
of this thesis was thus rather to investigate the importance of depositional environment to
diagenesis in sandstones. The data was obtained from sedimentological and petrographic
analyses of the Firkanten, upper part of Grumantbyen and Aspelintoppen formations,
constituting the lower, lower-middle and upper part of the Van Mijenfjorden Group,
respectively (often referred to as the Central Tertiary Basin). The sub-objectives of this thesis
were to:
1. Discuss factors controlling the types and distribution of authigenic minerals
2. Identify geochemical trends in the sediment cores and to investigate whether these can
be correlated to the sedimentary logs
3. Discuss the consistency between authigenic signatures and vitrinite reflectance
measurements of coals/organic matter – do they tell the same temperature history?
1.2 Data background
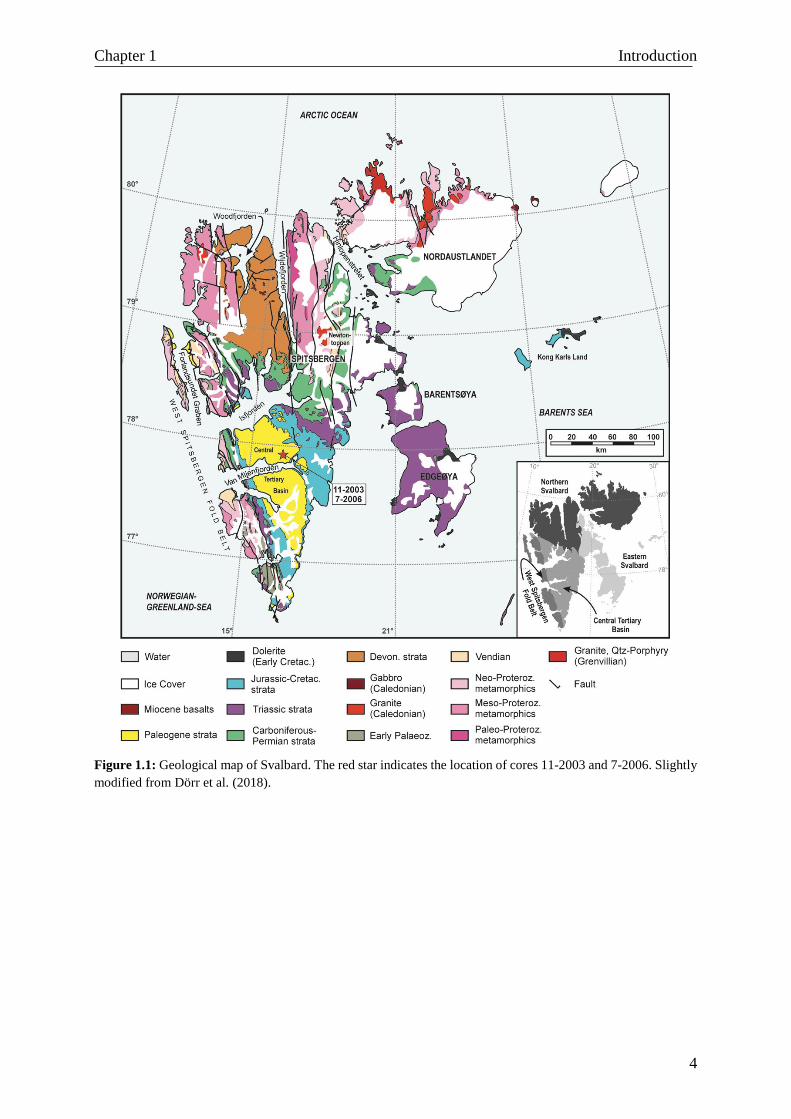
Spitsbergen – the largest island of the Svalbard archipelago – is situated in the north-western
corner of the Barents Shelf. The Central Tertiary Basin covers the central and southern parts of
Spitsbergen, extending from north of Isfjorden to the Sørkapp area, and from near the east coast
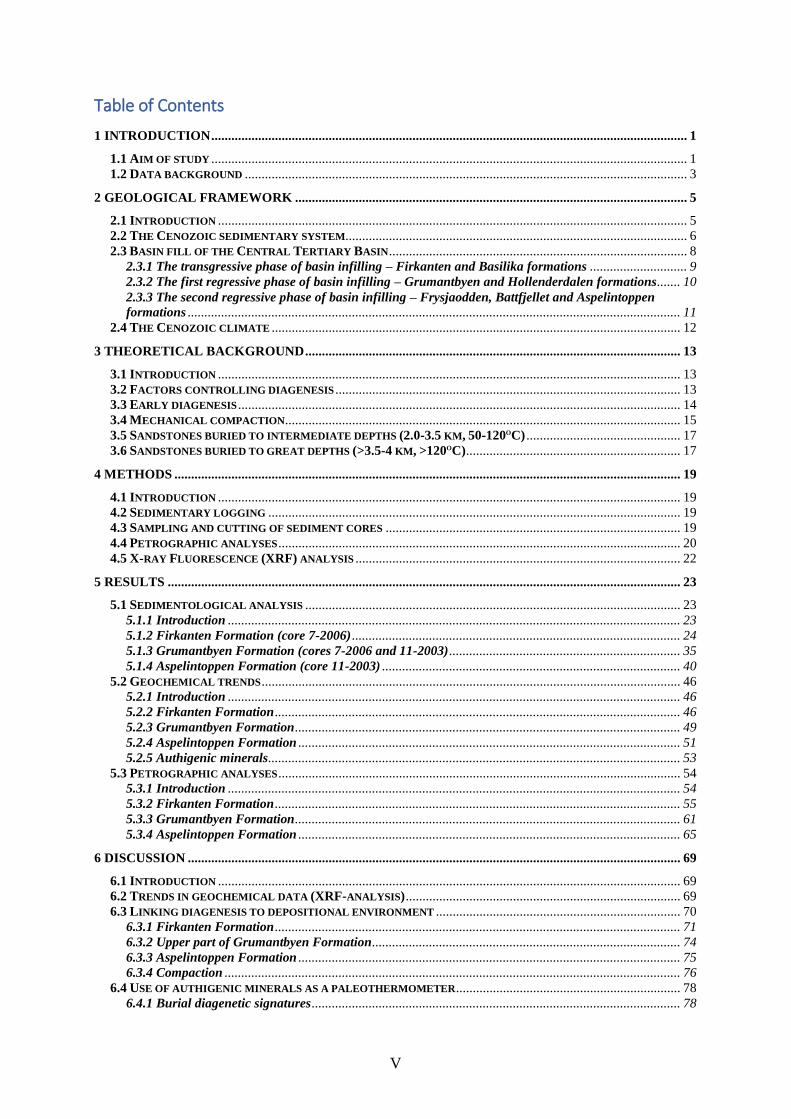
to the eastern front of the West Spitsbergen Fold and Thrust Belt (Fig. 1.1). The present thesis
is based on data from drill cores of the Store Norske Spitsbergen Kullkompani (SNSK) wells
7-2006 and 11-2003, utilising the coal-bearing Firkanten Formation (7-2006), the upper part of
Grumantbyen Formation (7-2006 and 11-2003) and the Aspelintoppen Formation (11-2003).
The wells, located between Van Mijenfjorden and Isfjorden in the northern part of the Central
Tertiary Basin, were drilled as a part of SNSKs coal-exploration (Fig. 1.1). The excellent-
exposed outcrops of the Svalbard archipelago and abundance of extensive coal deposits,
allowing comparison of results with vitrinite data, justify the choice of study area.
Chapter 1 Introduction
4
Figure 1.1: Geological map of Svalbard. The red star indicates the location of cores 11-2003 and 7-2006. Slightly
modified from Dörr et al. (2018).
Chapter 2 Geological framework
5
2 Geological framework
2.1 Introduction
The Svalbard archipelago comprises all islands between 74-81°N and 10-35°E, covering a land-
area of more than 60 000 km2. Svalbard, representing an uplifted area of the north-western
Barents Sea Shelf, provides a unique opportunity for studying on-shore outcrops of the shelf,
including Cenozoic deposits (Central Tertiary Basin). The geological record of Svalbard is
well-preserved, ranging in age from Late Precambrian to Paleogene. Precambrian to Early
Silurian metamorphic rocks are present in northern and western parts of Svalbard, Devonian
grabens in the north, Late Paleozoic and Mesozoic platform sediments in the central and eastern
parts, and Paleogene sediments in the central and southern parts of Spitsbergen. The geological
record shows evidence of multiple tectonic events, in which the most prominent are the
Grenvillian (Precambrian), Caledonian (Ordovician-Silurian) and the West Spitsbergen
orogeny (Paleogene) (Dallmann, 1999). The late Paleozoic to Cenozoic record of Svalbard
reflects the northwards movement of Svalbard from equatorial regions in the Devonian-Early
Carboniferous to its current high-latitude position (Worsley, 2008).
The focus of the present thesis it the Paleocene-Eocene Central Tertiary Basin, reflecting the
opening of the Norwegian-Greenland Sea and accompanying formation of the West Spitsbergen
Fold and Thrust Belt.
Chapter 2 Geological framework
6
2.2 The Cenozoic sedimentary system
The Central Tertiary Basin (CTB) – the focus of the present thesis – formed in response to the
opening of the Norwegian Greenland Sea and formation of the West Spitsbergen Fold and
Thrust Belt (Steel and Worsley, 1984). The CTB occupies an area of 200 x 60 km, extending
from north of Isfjorden to the Sørkapp area, and from near the eastern coast of Spitsbergen to
the eastern front of the West Spitsbergen Fold and Thrust Belt. The Paleogene sediment fill of
the CTB, composing sandstones, siltstones, shales and subordinate coals and conglomerates, is
called the Van Mijenfjorden Group. A Paleocene-Eocene age is generally accepted for the Van
Mijenfjorden Group (Harland, 1969), although Livsic (cited in Steel and Worsley, 1984)
suggested, in part, an Oligocene age for the succession. Vitrinite reflectance measurements of
coals suggest that 1500-3000 m of sediments were removed by post-Oligocene erosion (Manum
and Throndsen, 1978; Throndsen, 1982).
The formation of the CTB is firmly related to the large-scale Cenozoic Eurekan orogeny (Dörr
et al., 2018). The concurrent spreading in the Baffin Bay-Labrador Sea and Norwegian-
Greenland Sea, resulted in a northeast movement of Greenland from c. 55 Ma onwards. The
latter caused compression along the western parts of Spitsbergen, resulting in extensive
basement uplift and growth of a 300 km long NNW-SSE trending fold and thrust belt, referred
to as the West Spitsbergen Fold and Thrust Belt (WSFTB) (Piepjohn et al., 2016). Furthermore,
subsidence east of the WSFTB resulted in formation of a 60 km wide NNW-SSE trending
trough – the Central Tertiary Basin (Steel et al., 1981; Grundvåg et al., 2014). The Eurekan
deformation and accompanying northward movement of Greenland peaked at c. 50 Ma. At c.
49 Ma, however, changing spreading directions in the Baffin Bay-Labrador Sea caused
Greenland to move northwestward, resulting in a change in the deformation regime from
compression to dextral transpression in the west (Piepjohn et al., 2016; Dörr et al., 2018).
Finally, at c. 36 Ma, seafloor spreading in the Baffin Bay-Labrador Sea terminated, eventually
resulting in extension between Svalbard and Greenland.
The sediment fill of the CTB – the Van Mijenfjorden Group – can tectono-stratigraphically be
divided into two parts: (1) a lower mainly Paleocene part and (2) an upper mainly Eocene part
(Fig. 2.1). The succession composes wave- and tidal influenced deltaic deposits, showing a
large scale landward-stepping-basinward-stepping depositional pattern (Bruhn and Steel,
2003). The succession thickens from 1500 m in the northeast to 2500 m in the southwestern
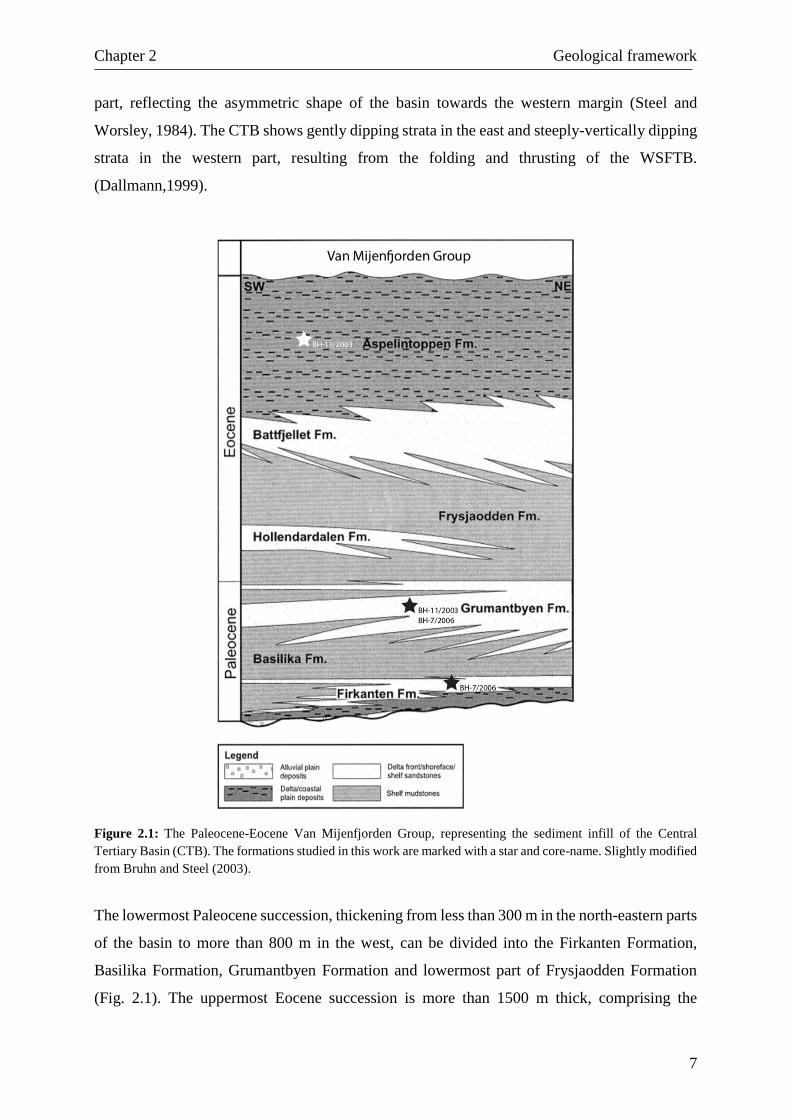
Chapter 2 Geological framework
7
part, reflecting the asymmetric shape of the basin towards the western margin (Steel and
Worsley, 1984). The CTB shows gently dipping strata in the east and steeply-vertically dipping
strata in the western part, resulting from the folding and thrusting of the WSFTB.
(Dallmann,1999).
Figure 2.1: The Paleocene-Eocene Van Mijenfjorden Group, representing the sediment infill of the Central
Tertiary Basin (CTB). The formations studied in this work are marked with a star and core-name. Slightly modified
from Bruhn and Steel (2003).
The lowermost Paleocene succession, thickening from less than 300 m in the north-eastern parts
of the basin to more than 800 m in the west, can be divided into the Firkanten Formation,
Basilika Formation, Grumantbyen Formation and lowermost part of Frysjaodden Formation
(Fig. 2.1). The uppermost Eocene succession is more than 1500 m thick, comprising the
Chapter 2 Geological framework
8
Frysjaodden Formation, Hollenderdalen Formation, Battfjellet Formation and Aspelintoppen
Formation (Fig. 2.1). The Frysjaodden Formation reflects the change in sediment supply from
a probably eastern source area to the fold and thrust belt in the west (Steel et al., 1985). The
lowermost Paleocene succession shows an overall landward-stepping (i.e. transgressive), east-
migrating depositional pattern whereas the uppermost Eocene succession shows an overall
basinward-stepping (i.e. regressive), east-migrating depositional pattern, reflecting the main
infilling of the CTB (Bruhn and Steel, 2003). Shelf paleo water-depths of the CTB have been
estimated to be less than 20 metre on the continental shelf and hundreds of meters across the
shelf edge (Helland-Hansen, 2010; Mellere et al., 2002).
A westerly source is generally accepted for the Eocene-succession, reflecting the growth of the
WSFTB (Petersen et al., 2016). The source area for the Paleocene-succession, however, is still
not fully understood; both the WSFTB and a so-called peripheral bulge east of the basin (see
section 2.3) have been suggested (Petersen et al., 2016). However, the occurrence of
Cretaceous-aged zircon in the Paleocene Firkanten Formation indicate (at least in part) an
easterly source for the Paleocene-succession, in which Cretaceous igneous rocks are
exclusively occurring in the eastern and northeastern Svalbard (i.e. indicate sourcing from the
east) (Petersen et al., 2016). Furthermore, the absence of Cretaceous-aged zircon in the Eocene
Battfjellet Formation confirm a westerly source for the Eocene-succession.
2.3 Basin fill of the Central Tertiary Basin
The sedimentary succession of the Central Tertiary Basin provides an important record of the
tectonic events associated with the opening of the Norwegian-Greenland Sea. Two general
models have been established for the CTB formation: (1) Steel et al. (1981) suggested a two-
step transtension-transpression scenario (Fig. 2.2), whereas Bruhn and Steel (2003) proposed a
single, compressional foreland-basin scenario. The two-step transtension-transpression
scenario presumes formation of several coal-forming basins, resulting from Late Cretaceous-
Early Paleocene strike-slip movements along the Greenland-Svalbard plate boundary. Finally,
Late Paleocene-Early Eocene transpression and thrust loading combined the basins into a single
foreland basin. The model of Bruhn and Steel (2003) rather assumes formation of a flexural
trough in front of the thrust wedge of the WSFTB. Furthermore, lithospheric loading resulted
in formation of a peripheral bulge east of the WSFTB. The fold and thrust belt in the west
(WSFTB), syndepositional tilting of the basin towards the orogen and later incorporation of the
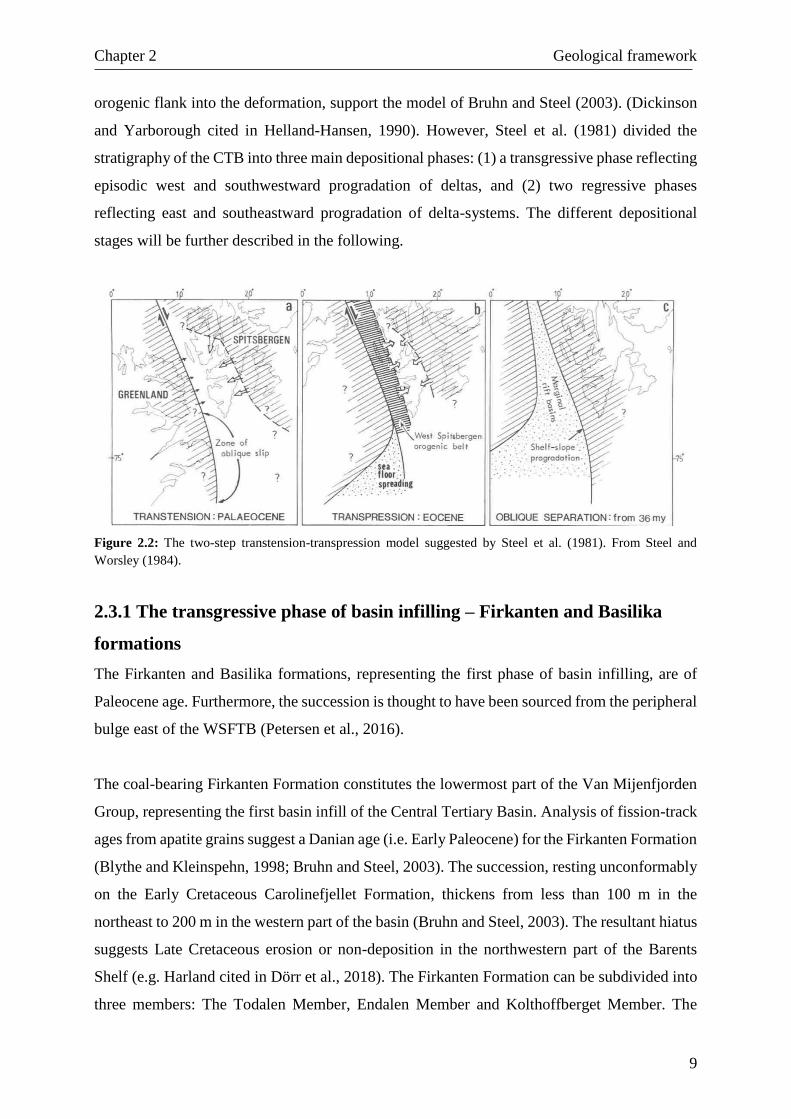
Chapter 2 Geological framework
9
orogenic flank into the deformation, support the model of Bruhn and Steel (2003). (Dickinson
and Yarborough cited in Helland-Hansen, 1990). However, Steel et al. (1981) divided the
stratigraphy of the CTB into three main depositional phases: (1) a transgressive phase reflecting
episodic west and southwestward progradation of deltas, and (2) two regressive phases
reflecting east and southeastward progradation of delta-systems. The different depositional
stages will be further described in the following.
Figure 2.2: The two-step transtension-transpression model suggested by Steel et al. (1981). From Steel and
Worsley (1984).
2.3.1 The transgressive phase of basin infilling – Firkanten and Basilika
formations
The Firkanten and Basilika formations, representing the first phase of basin infilling, are of
Paleocene age. Furthermore, the succession is thought to have been sourced from the peripheral
bulge east of the WSFTB (Petersen et al., 2016).
The coal-bearing Firkanten Formation constitutes the lowermost part of the Van Mijenfjorden
Group, representing the first basin infill of the Central Tertiary Basin. Analysis of fission-track
ages from apatite grains suggest a Danian age (i.e. Early Paleocene) for the Firkanten Formation
(Blythe and Kleinspehn, 1998; Bruhn and Steel, 2003). The succession, resting unconformably
on the Early Cretaceous Carolinefjellet Formation, thickens from less than 100 m in the
northeast to 200 m in the western part of the basin (Bruhn and Steel, 2003). The resultant hiatus
suggests Late Cretaceous erosion or non-deposition in the northwestern part of the Barents
Shelf (e.g. Harland cited in Dörr et al., 2018). The Firkanten Formation can be subdivided into
three members: The Todalen Member, Endalen Member and Kolthoffberget Member. The
Chapter 2 Geological framework
10
lowermost Todalen Member (less than 60 m thick), composes alternating mudstones, coal-beds,
siltstones and fine-grained sandstones, representing fluvial-dominated delta deposits (Bruhn
and Steel, 2003). Lüthje (2008), however, interpreted the lowermost part of the Firkanten
Formation (i.e. Todalen Member) to represent wave-dominated coastal plain deposits of minor
fluvial input. The overlying marine Endalen Member thickens from 40 m in the northeast to
100 m in the south and southwest. The succession composes shoreface deposits, reflecting the
landward migration of the coastline. The mudstones of the Kolthoffberget Member, present in
the western and southern parts of the Central Tertiary Basin, form the deep-marine equivalent
to the Endalen Member (Steel et al., 1981). Despite the overall transgressive nature of the
succession, several smaller-scale regressive units occur (Steel et al., 1981).
The overlying Basilika Formation composes black and grey shales, siltstones and interbedded
very fine sandstones, representing outer shelf to deep marine deposits. The succession ranges
in thickness from 430 m in the western part of the basin to about 30 m in the north and northeast
(Steel et al., 1981). The lower part of the Basilika Formation composes mudstones and
siltstones, showing fining- and deepening-upwards, whereas the upper part of the succession is
composed of upwards-coarsening packages, each 2-15 m thick (Steel et al., 1981; Bruhn and
Steel, 2003). Studies of foraminifera in the lower-middle part of the succession suggest a late
Paleocene age for the Basilika Formation (Nagy et al., 2001) .
2.3.2 The first regressive phase of basin infilling – Grumantbyen and
Hollenderdalen formations
The Grumantbyen and Hollenderdalen formations constitute the second phase of basin infilling.
The regressive depositional pattern of the succession implies that sediment supply outpaced
rates of subsidence, although the high degree of bioturbation of the Grumantbyen Formation
sandstones indicates relatively low sediment supply.
The Grumantbyen Formation, constituting the lower part of the second phase of basin infilling,
composes greenish-grey intensively bioturbated sandstones. The greenish colour of the
sandstones reflects the high glauconite-content of the formation (Steel et al., 1981). The
succession thickens from 200 m in the southwestern part of the basin to approximately 450 m
in the northeast (Dallmann, 1999). Although the Grumantbyen Formation is poorly understood,
Steel et al. (1985) suggested an offshore origin of the formation, probably representing offshore
Chapter 2 Geological framework
11
bar deposits. The succeeding Hollenderdalen Formation, predominantly composing sandstones,
is suggested to represent tide-influenced delta deposits (Dalland, 1976). The succession is up
to 150 m thick in the west, pinching out into the marine shales of the Frysjaodden Formation in
the north-eastern part of the basin (Dalland, 1976).
2.3.3 The second regressive phase of basin infilling – Frysjaodden,
Battfjellet and Aspelintoppen formations
The Frysjaodden, Battfjellet and Aspelintoppen formations represent the third and final phase
of basin infilling. The succession shows a total thickness of 1500 m, ranging in age from late
Paleocene to Eocene.
The Frysjaodden Formation constitutes the lowermost part of the third phase of basin infilling.
The succession reflects the long-term eastward migration of the basin depocenter and change
in sediment supply from the source areas in the east to the fold and thrust belt in the west (Steel
et al., 1985). The succession composes deep-marine shales, occasionally interbedded with
turbiditic sandstones (Crabaugh and Steel, 2004). The succession is absent in the south-eastern
parts of the basin and up to 150 m thick in the north-west (Steel et al., 1981).
The Battfjellet Formation, ranging in thickness from 60 m in the northeast to 200 meters in the
southwestern part of the basin, composes upwards-coarsening packages of siltstones and
sandstones. Steel (1977) interpreted the succession to represent prograding wave-dominated
deltaic and barrier coastlines. The large-scale eastward prograding clinothems of the Battfjellet
Formation reflects the high sediment influx from the WSFTB in the west.
The Aspelintoppen Formation, constituting the uppermost and thickest succession of the Van
Mijenfjorden Group, represents the final basin infill of the Central Tertiary Basin. The
formation is more than 1000 m thick south of Van Mijenfjorden; north of the Van Mijenfjorden,
only thinner deposits are preserved (Steel et al., 1981). The succession, composing poorly
sorted sandstones, siltstones and subordinate coal-layers, overlies and interfingers the marine
Battfjellet Formation. Steel et al. (1981) interpreted the Aspelintoppen Formation to be of delta
plain origin, predominantly composing flood plain and lacustrine deposits. Furthermore, high
degree of soft-sediment deformation is a diagnostic feature of the formation, reflecting high
Chapter 2 Geological framework
12
sediment supply and frequent earthquakes (Steel et al., 1981). The abundant soft sediment
deformation often makes it difficult to distinguish the sedimentary structures during logging.
2.4 The Cenozoic climate
Climate, being a crucial factor controlling erosion and weathering, is important for the detrital
mineral composition of sedimentary rocks. The mineral composition, in turn, is important for
the types and distribution of diagenetic processes in sediments. Paleomagnetic data suggests a
paleo-latitude of 71-72oN for Svalbard in the Eocene (Dalland, 1976). The Paleogene climate
was warm-temperate or moderately temperate (Golovneva, 2000). Based on analysis of
conifers, Schweitzer (1980) suggested an annual mean temperature of 15-18oC. The
paleotemperature estimates of Schweitzer (1980) is consistent with more recently estimates;
Golovneva (2000) suggested an annual temperature-range of about 13-19oC. Schweitzer (1980)
argued that precipitation was moderate to absent in the winter and heavy in the summer. The
study of Golovneva (2000), however, suggests high precipitation equally distributed over the
year. Compared to the present-day mean temperature for similar latitudes, e.g. Troms in
Norway, the Paleocene-Eocene climate was considerably warmer (Dypvik et al., 2011). The
relatively warm and humid Paleocene-Eocene climate, reflecting the PETM (Paleocene-Eocene
Thermal Maximum), implies high degree of erosion and weathering. The study of Dypvik et al.
(2011) shows a distinct decrease in feldspar content and accompanying increase in the relative
amounts of kaolinite, reflecting higher temperatures and resultant increase in precipitation.
Chapter 3 Theoretical background
13
3 Theoretical background
3.1 Introduction
Diagenesis comprises all the chemical, physical and biologic processes occurring in a sediment
after its initial deposition (Bjørlykke and Jahren, 2015). The primary composition of
sandstones, which is a function of provenance, transport and depositional environment, is the
starting point for diagenetic processes. The primary composition is thus an important factor
controlling diagenetic alteration of sandstones (Bjørlykke and Jahren, 2015). In addition, the
properties of sandstones are largely dependent on their temperature and stress history during
burial; prolonged exposure to high temperatures and stresses results in a variety of diagenetic
processes. The main diagenetic processes, however, are (1) near surface diagenesis, (2)
mechanical compaction, (3) chemical compaction and (4) precipitation of cements and
formation of authigenic minerals (Bjørlykke and Jahren, 2015). Mechanical compaction is the
most important factor reducing porosity at shallow burial depths; at greater depths, chemical
compaction (e.g. precipitation of quartz cement) prevents further mechanical compaction of the
sandstone. In the literature, near surface diagenesis and burial diagenesis are often referred to
as eogenesis and mesogenesis, respectively.
3.2 Factors controlling diagenesis
The distribution of diagenetic alterations in sandstones is largely controlled by detrital
composition, texture (grain size, sorting, form), porewater chemistry and burial history. Other
factors of importance to diagenesis include depositional environment, sequence stratigraphy
and paleoclimatic conditions (Bjørlykke, 2001; Al-Ramadan et al., 2012). Changes in either
porewater chemistry, temperature or stress results in diagenetic reactions and accompanying
alteration of the sediment (Worden and Burley, 2003).
The detrital composition of sandstones is crucial for the types and distribution of diagenetic
processes (Bjørlykke, 2001; Morad et al., 2012). Furthermore, the sandstone composition
largely controls their mechanical- and chemical properties, in which sandstones composing
ductile grains (e.g. mud intraclasts, low-grade metamorphic rock fragments) experience higher
degree of mechanical compaction than sandstones rich in rigid grains (quartz and felspar). In
addition, the degree of compaction, both mechanical and chemical, is dependent on grain size,
Chapter 3 Theoretical background
14
sorting and form, which, in turn, is dependent on depositional environment and transport. The
abundance of quartz cement is, in part, a function of grain surfaces available for quartz
precipitation; the more quartz grains and the bigger the surface area, the more quartz cement is
precipitated. Assuming that the sand is well-sorted, the latter implies that fine-grained sand
contains more quartz cement than coarser-grained sand (Bjørlykke, 2001).
Changes in the relative sea-level, resulting from changes in the eustatic sea level and/or tectonic
uplift/subsidence and rate of sediment supply, controls the sequence stratigraphic framework
and distribution of facies in siliciclastic deposits (Al-Ramadan et al., 2012). Factors controlling
diagenesis, including detrital composition, porewater chemistry and residence time, is largely
influenced by relative sea-level changes, suggesting that diagenesis can be systematically
linked to sequence stratigraphy. Types of diagenetic reactions are often characteristic for
specific systems tracts and boundaries, e.g. authigenic kaolinite is typical for sandstones
localized immediately below erosional surfaces. The importance of porewater chemistry
(meteoric water) and burial history will be further discussed in the following sections.
3.3 Early diagenesis
Early diagenetic reactions start to alter the detrital composition of sediments immediately after
deposition. The ability of sediments to react with the atmosphere or water, either by fluid flow
or diffusion, is highest at shallow burial depths (<1-10 m), suggesting that the potential for
sediments to change their post-deposition composition is higher at shallow depths than greater
burial depths (Bjørlykke and Jahren, 2015). The most important early diagenetic processes are
(1) formation of biogenic carbonates and silica, (2) precipitation of authigenic minerals, e.g.
carbonates, glauconite and iron minerals, and (3) flushing of meteoric water, resulting in
leaching of unstable minerals and accompanying precipitation of more stable minerals (e.g.
precipitation of kaolinite at the expense of feldspar).
Chapter 3 Theoretical background
15
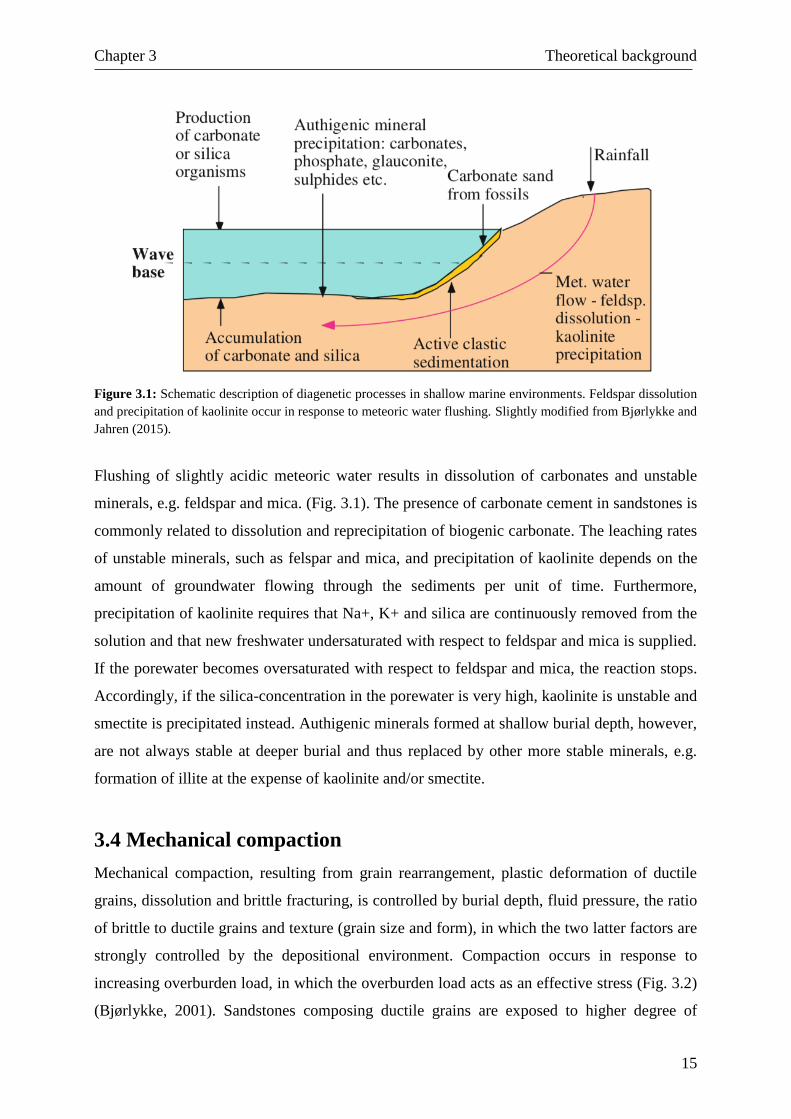
Figure 3.1: Schematic description of diagenetic processes in shallow marine environments. Feldspar dissolution
and precipitation of kaolinite occur in response to meteoric water flushing. Slightly modified from Bjørlykke and
Jahren (2015).
Flushing of slightly acidic meteoric water results in dissolution of carbonates and unstable
minerals, e.g. feldspar and mica. (Fig. 3.1). The presence of carbonate cement in sandstones is
commonly related to dissolution and reprecipitation of biogenic carbonate. The leaching rates
of unstable minerals, such as felspar and mica, and precipitation of kaolinite depends on the
amount of groundwater flowing through the sediments per unit of time. Furthermore,
precipitation of kaolinite requires that Na+, K+ and silica are continuously removed from the
solution and that new freshwater undersaturated with respect to feldspar and mica is supplied.
If the porewater becomes oversaturated with respect to feldspar and mica, the reaction stops.
Accordingly, if the silica-concentration in the porewater is very high, kaolinite is unstable and
smectite is precipitated instead. Authigenic minerals formed at shallow burial depth, however,
are not always stable at deeper burial and thus replaced by other more stable minerals, e.g.
formation of illite at the expense of kaolinite and/or smectite.
3.4 Mechanical compaction
Mechanical compaction, resulting from grain rearrangement, plastic deformation of ductile
grains, dissolution and brittle fracturing, is controlled by burial depth, fluid pressure, the ratio
of brittle to ductile grains and texture (grain size and form), in which the two latter factors are
strongly controlled by the depositional environment. Compaction occurs in response to
increasing overburden load, in which the overburden load acts as an effective stress (Fig. 3.2)
(Bjørlykke, 2001). Sandstones composing ductile grains are exposed to higher degree of
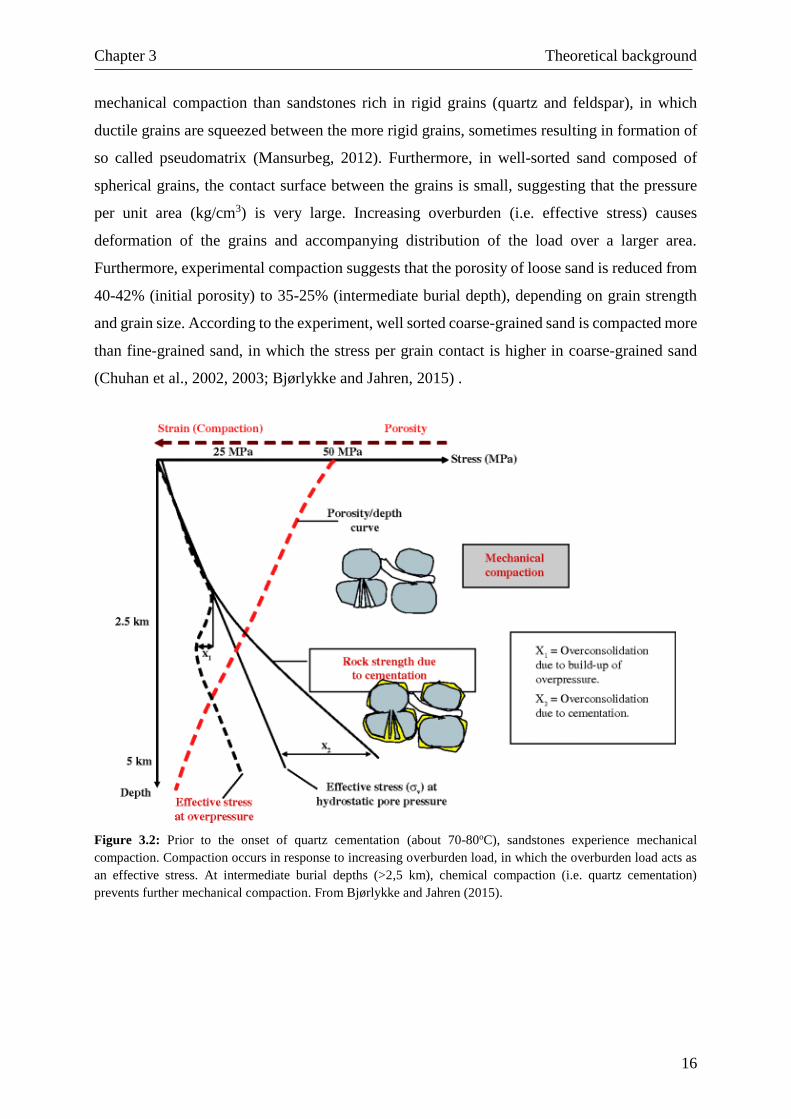
Chapter 3 Theoretical background
16
mechanical compaction than sandstones rich in rigid grains (quartz and feldspar), in which
ductile grains are squeezed between the more rigid grains, sometimes resulting in formation of
so called pseudomatrix (Mansurbeg, 2012). Furthermore, in well-sorted sand composed of
spherical grains, the contact surface between the grains is small, suggesting that the pressure
per unit area (kg/cm3) is very large. Increasing overburden (i.e. effective stress) causes
deformation of the grains and accompanying distribution of the load over a larger area.
Furthermore, experimental compaction suggests that the porosity of loose sand is reduced from
40-42% (initial porosity) to 35-25% (intermediate burial depth), depending on grain strength
and grain size. According to the experiment, well sorted coarse-grained sand is compacted more
than fine-grained sand, in which the stress per grain contact is higher in coarse-grained sand
(Chuhan et al., 2002, 2003; Bjørlykke and Jahren, 2015) .
Figure 3.2: Prior to the onset of quartz cementation (about 70-80oC), sandstones experience mechanical
compaction. Compaction occurs in response to increasing overburden load, in which the overburden load acts as
an effective stress. At intermediate burial depths (>2,5 km), chemical compaction (i.e. quartz cementation)
prevents further mechanical compaction. From Bjørlykke and Jahren (2015).
Chapter 3 Theoretical background
17
3.5 Sandstones buried to intermediate depths (2.0-3.5 km, 50-
120oC)
At intermediate burial depths (>2 km), chemical compaction (i.e. quartz cementation) prevents
further mechanical compaction, in which only 2-4% quartz cement is required to stop
mechanical compaction (Fig. 3.2). Compaction and porosity loss at greater burial depths is thus
controlled by the rate of mineral dissolution and precipitation (i.e. chemical compaction). In
well-sorted quartz- and feldspar-rich sandstones, precipitation of quartz cement is an important
factor destroying porosity. The solubility of quartz is controlled by temperature and time; the
higher the temperature and the slower the subsidence rates, the higher the solubility (Worden
and Burley, 2003). In addition, precipitation of quartz is dependent on grain size, grain surfaces
available for quartz precipitation and presence/absence of grain coatings (Mansurbeg, 2012).
Grain coatings (e.g. grain coating chlorite) are suggested to retard precipitation of quartz and is
thus of great importance to preservation of porosity and permeability at great burial depths
(Bjørlykke, 2001). Furthermore, recrystallisation of detrital and/or eogenetic minerals is an
important diagenetic process at burial depths. At temperatures higher than 100-120oC and 70-
80oC, kaolinite is recrystallised to dickite and smectite is dissolved and replaced by illite,
respectively. Furthermore, at depths greater than 3 km, K-feldspar and/or plagioclase are
replaced by albite (i.e. albitisation). The replacement of feldspar is related to removal of
potassium and accompanying increase in the relative amounts of Na+, suggesting that albite is
more stable than feldspar.
3.6 Sandstones buried to great depths (>3.5-4 km, >120oC)
Sandstones exposed to temperatures >120oC (120-160oC), corresponding to burial depths of 3-
3.5 km to 4-4.5 km, generally show strong reduction in porosity and permeability (Bjørlykke
and Jahren, 2015). The reduction in porosity and permeability is largely related to precipitation
of quartz cement (i.e. quartz overgrowth) and authigenic illite. Quartz cementation is not shut
down until nearly all the porosity is lost, or the temperature drops below 70-80oC (Bjørlykke
and Jahren, 2015). At temperatures >90oC, kaolinite is replaced by illite, requiring that K-
feldspar is present in the sediment. Pervasive precipitation of illite, however, occurs at
temperatures >120 oC. The characteristic fibrous crystal shape of illite reduces the permeability
of sandstones significantly and is thus of great importance to reservoir quality.

18
Chapter 4 Methods
19
4 Methods
4.1 Introduction
The present study is based on observations and interpretations obtained from sedimentological
and petrographic analyses of cores 7-2006 and 11-2003, focusing on the Firkanten Formation
(core 7-2006), upper part of Grumantbyen Formation (cores 7-2006 and 11-2003) and
Aspelintoppen Formation (11-2003). The upper part of the Grumantbyen Formation was
studied in both cores in order to identify any differences in burial history. The studied intervals
of the upper part of Grumantbyen Formation is hereinafter referred to as the “Grumantbyen
Formation”. The sediment cores, provided by Store Norske Spitsbergen Kullkompani (SNSK),
were collected in Endalen and brought to the University Centre in Svalbard (UNIS) for
sedimentary logging and sampling. Mineralogical and petrographic data was obtained from
optical thin section-, SEM- and XRD-analyses. XRD-analysis was performed by Beyene Girma
Haile (University of Oslo). In addition, a handheld XRF-analyser was used for elemental
analysis of the sediment cores.
4.2 Sedimentary logging
Logging of the sediment cores was performed in order to (1) get an overview of the lithology
and depositional environment of the Firkanten, Grumantbyen and Aspelintoppen formations
and (2) choose sampling intervals for mineralogical and petrographic analyses. Core logging
was performed in 1:20 scale, focusing on lithology, grain size, sedimentary structures, colour,
bioturbation intensity and trace fossils. Formation boundaries were identified prior to collection
of the cores, based on the paper of Dörr et al. (2018) and SNSK’s pictures of cores 7-2006 and
11-2003. Grain size was determined using a grain-size identification sheet and hand lens.
Furthermore, every 20 cm of the cores was acid tested in order to detect possible carbonate
cement. The sedimentary logs were redrawn digitally in Adobe Illustrator CC.
4.3 Sampling and cutting of sediment cores
Based on the core logging, a total of 44 selected rock-samples were taken; 28 from the Firkanten
Formation, 6 from the Grumantbyen Formation (3 from each core) and 10 from the
Aspelintoppen Formation (Appendix I). Sampling intervals were chosen based on lithology,
Chapter 4 Methods
20
mineral composition and facies associations. Two different types of “key”-rocks were sampled:
(1) quartz-rich sandstones in order to identify possible authigenic quartz cement and (2)
sandstones rich in carbonate in order to investigate the types and distribution of carbonate
cement. Furthermore, the sandstone samples represent different facies associations, allowing
linkage of diagenesis and depositional environment. Prior to cutting, the samples were marked
with numbers and top/bottom. A mobile saw was used to cut the sediment cores and split the
samples into two pieces, in which one half was sampled for petrographic analysis and the other
half was put back in the core-box. The samples, each approximately 4 cm in diameter, were put
in small plastic bags, sealed and sent to the University of Oslo (UiO) for thin section
preparations. The sampling intervals are displayed in Fig. 5.2, Fig. 5.6 and Fig. 5.9 (sedimentary
logs).
4.4 Petrographic analyses
Optical microscopy
The collected sandstone-samples from the Firkanten, Grumantbyen and Aspelintoppen
formations were sent to the University of Oslo for thin section preparations. The samples were
polished to a thickness of 30 microns and stained blue to highlight porosity. The thin sections
were analysed using an optical microscope. Petrographic properties, including mineralogy,
grain-sizes, sorting and roundness, were analysed in both plane-polarized light (PPL) and cross-
polarized light (XPL).
Scanning Electron Microscopy (SEM)
A total of eight thin sections were chosen for SEM backscattered electron (BSE) imaging and
energy dispersive (EDS) analysis. SEM-analysis aimed to help fill in gaps in data obtained from
optical microscopy and thus get a better understanding of the detrital- and authigenic mineral
compositions of the Firkanten, Grumantbyen and Aspelintoppen formations. Using a focused
beam of high-energy electrons, various signals are generated at the surface of the analysed
sample, including BSE and EDS, revealing information regarding texture and elemental
composition (Fig. 4.1) (Swapp, 2017). Prior to SEM-analysis, the thin sections were covered
with a thin layer of carbon in order to prevent accumulation of charge.
Electron-sample interactions produce elastic and inelastic collisions between electrons and
atoms in the sample. Backscattered electrons (BSE) – elastically scattered incident electrons –
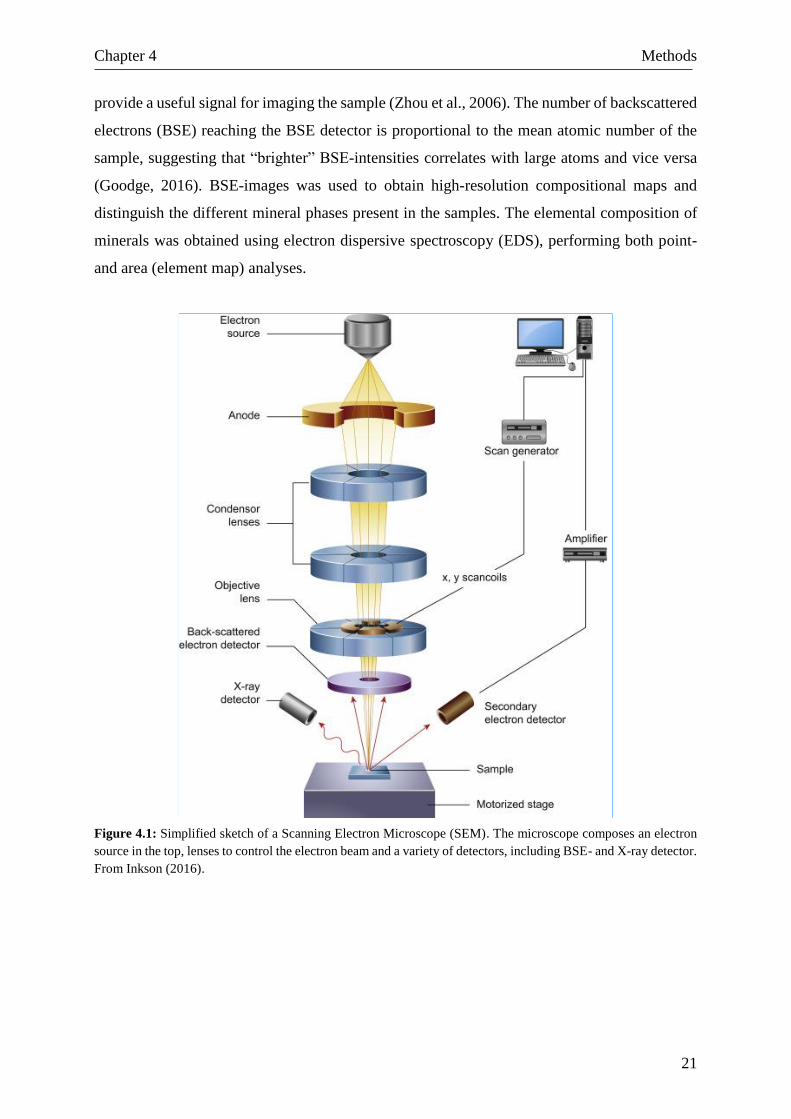
Chapter 4 Methods
21
provide a useful signal for imaging the sample (Zhou et al., 2006). The number of backscattered
electrons (BSE) reaching the BSE detector is proportional to the mean atomic number of the
sample, suggesting that “brighter” BSE-intensities correlates with large atoms and vice versa
(Goodge, 2016). BSE-images was used to obtain high-resolution compositional maps and
distinguish the different mineral phases present in the samples. The elemental composition of
minerals was obtained using electron dispersive spectroscopy (EDS), performing both point-
and area (element map) analyses.
Figure 4.1: Simplified sketch of a Scanning Electron Microscope (SEM). The microscope composes an electron
source in the top, lenses to control the electron beam and a variety of detectors, including BSE- and X-ray detector.
From Inkson (2016).
Chapter 4 Methods
22
4.5 X-ray Fluorescence (XRF) analysis
A handheld X-Ray Fluorescence (XRF) spectrometer – Thermo NITON XL5 – provided by
Holger Hartmann AS, was used to determine the elemental composition of cores 7-2006 and
11-2003. The XRF-analysis aimed to (1) identify geochemical trends in the sediment cores and
(2) investigate whether these can be correlated to the sedimentary logs (i.e. changes in lithology,
sand/mud ratio). The geochemical data can thus be used to support sedimentological
interpretations and/or help fill in gaps in the sedimentary logs (i.e. trends that cannot be seen
during logging, e.g. in heavy bioturbated intervals).
XRF spectrometry is an efficient and non-destructive analytical technique used to quantify the
elemental composition of materials (e.g. sediment cores) (Thermo Fisher Scientific, 2019).
Depending on specific instrument configurations, the XRF analyser is capable of quantifying a
range of elements. Fluorescent (or secondary) X-rays emitted from an excited sample is used
to determine its chemical composition. The sample is irradiated with high-energy X-rays,
causing each of the elements present in the sample to produce a set of fluorescent X-rays
(Thermo Fisher Scientific, 2019). The emitted sets of X-rays, each being characteristic for a
specific element, are detected by a detector and amplified. Handheld XRF spectrometers,
however, analyse groups of elements simultaneously in order to efficiently determine the
elements present in the sample and their relative concentrations. Prior to analysis, the XRF-
spectrometer was set up for maximum counts of light elements, such as calcium, potassium,
silica and aluminium. XRF was performed for every core-metre, each analysis running for
approximately three minutes. Elemental concentrations were presented in parts per million
(ppm).
Chapter 5 Results
23
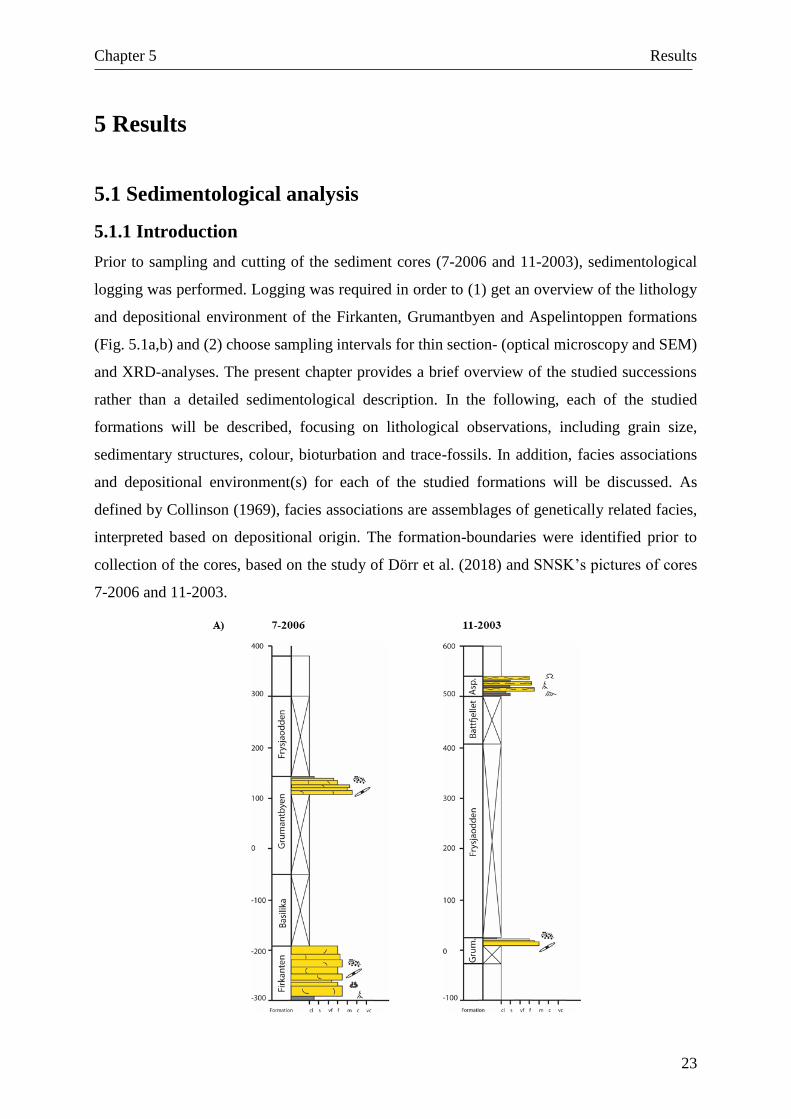
5 Results
5.1 Sedimentological analysis
5.1.1 Introduction
Prior to sampling and cutting of the sediment cores (7-2006 and 11-2003), sedimentological
logging was performed. Logging was required in order to (1) get an overview of the lithology
and depositional environment of the Firkanten, Grumantbyen and Aspelintoppen formations
(Fig. 5.1a,b) and (2) choose sampling intervals for thin section- (optical microscopy and SEM)
and XRD-analyses. The present chapter provides a brief overview of the studied successions
rather than a detailed sedimentological description. In the following, each of the studied
formations will be described, focusing on lithological observations, including grain size,
sedimentary structures, colour, bioturbation and trace-fossils. In addition, facies associations
and depositional environment(s) for each of the studied formations will be discussed. As
defined by Collinson (1969), facies associations are assemblages of genetically related facies,
interpreted based on depositional origin. The formation-boundaries were identified prior to
collection of the cores, based on the study of Dörr et al. (2018) and SNSK’s pictures of cores
7-2006 and 11-2003.
Chapter 5 Results
24
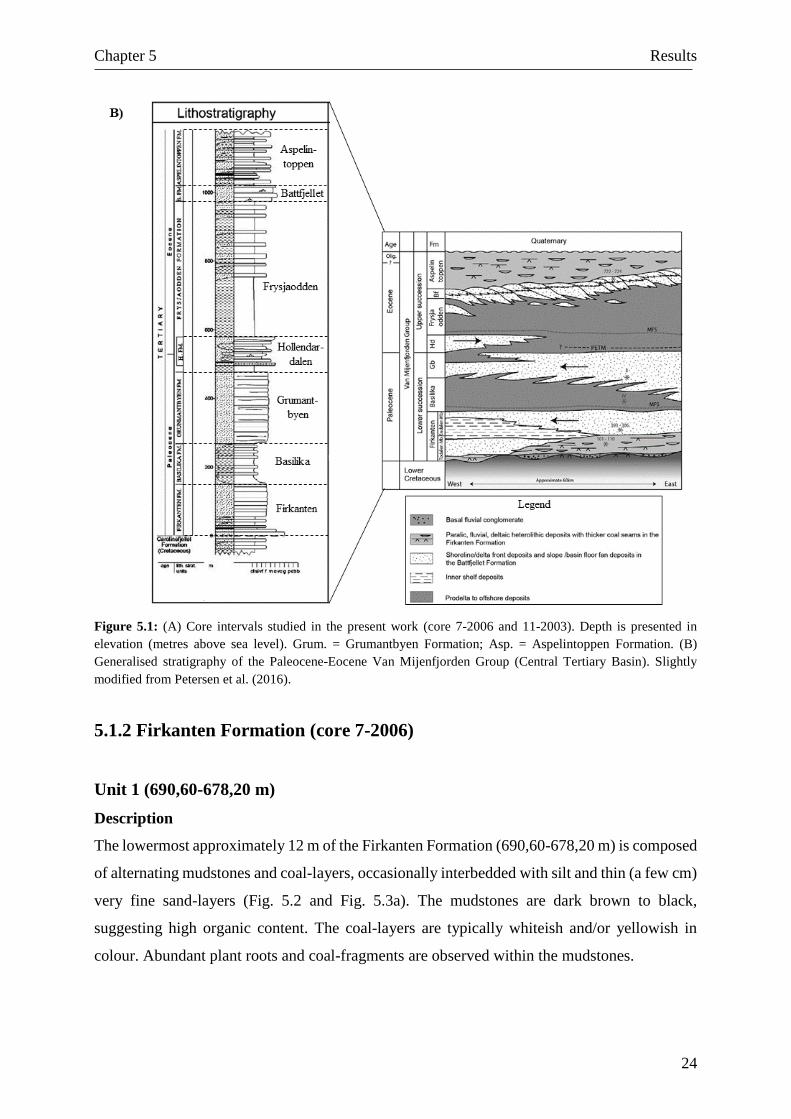
Figure 5.1: (A) Core intervals studied in the present work (core 7-2006 and 11-2003). Depth is presented in
elevation (metres above sea level). Grum. = Grumantbyen Formation; Asp. = Aspelintoppen Formation. (B)
Generalised stratigraphy of the Paleocene-Eocene Van Mijenfjorden Group (Central Tertiary Basin). Slightly
modified from Petersen et al. (2016).
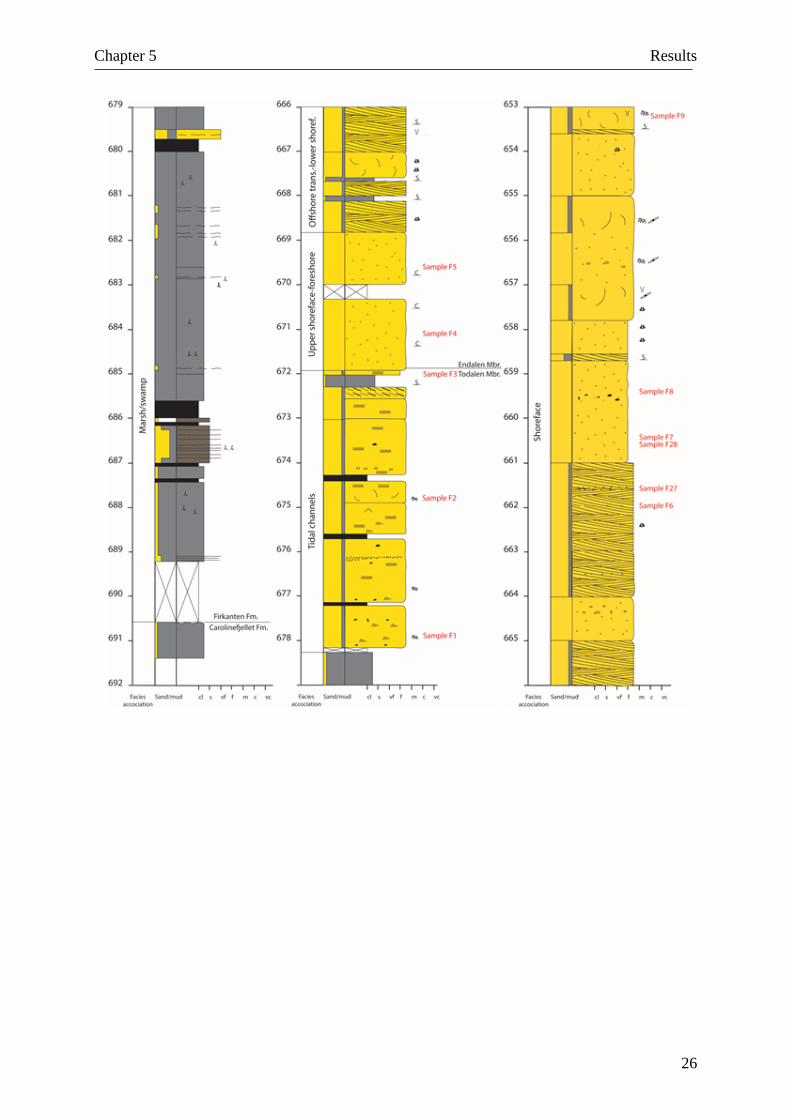
5.1.2 Firkanten Formation (core 7-2006)
Unit 1 (690,60-678,20 m)
Description
The lowermost approximately 12 m of the Firkanten Formation (690,60-678,20 m) is composed
of alternating mudstones and coal-layers, occasionally interbedded with silt and thin (a few cm)
very fine sand-layers (Fig. 5.2 and Fig. 5.3a). The mudstones are dark brown to black,
suggesting high organic content. The coal-layers are typically whiteish and/or yellowish in
colour. Abundant plant roots and coal-fragments are observed within the mudstones.
Chapter 5 Results
25
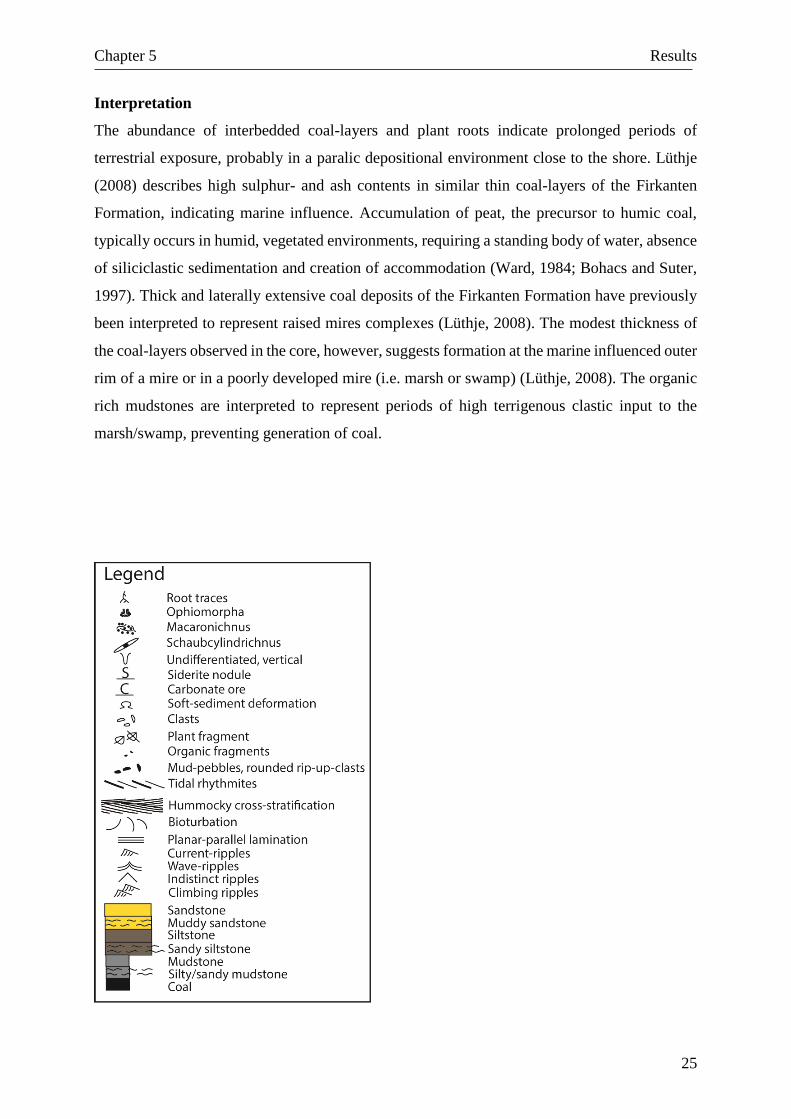
Interpretation
The abundance of interbedded coal-layers and plant roots indicate prolonged periods of
terrestrial exposure, probably in a paralic depositional environment close to the shore. Lüthje
(2008) describes high sulphur- and ash contents in similar thin coal-layers of the Firkanten
Formation, indicating marine influence. Accumulation of peat, the precursor to humic coal,
typically occurs in humid, vegetated environments, requiring a standing body of water, absence
of siliciclastic sedimentation and creation of accommodation (Ward, 1984; Bohacs and Suter,
1997). Thick and laterally extensive coal deposits of the Firkanten Formation have previously
been interpreted to represent raised mires complexes (Lüthje, 2008). The modest thickness of
the coal-layers observed in the core, however, suggests formation at the marine influenced outer
rim of a mire or in a poorly developed mire (i.e. marsh or swamp) (Lüthje, 2008). The organic
rich mudstones are interpreted to represent periods of high terrigenous clastic input to the
marsh/swamp, preventing generation of coal.
Chapter 5 Results
26
Chapter 5 Results
27
Chapter 5 Results
28
Figure 5.2: Sedimentary log of the Firkanten Formation (1:20 scale). The change in facies association, from tidal
channels to upper shoreface-foreshore deposits (c. 671,90 m), is interpreted to represent the transition between the
paralic Todalen Member and the overlying marine Endalen Member.
Unit 2 (678,20-668,80 m)
Description
An interval of muddy fine-medium grained sandstones, each separated by a thin coal-layer,
overlies the alternating mudstones and coal-layers (678,20-671,90 m; Fig. 5.2 and Fig. 5.3a).
The three lowermost sandstone-bodies (678,20-674,40 m; Fig. 5.3a) are greenish-grey in
colour, showing evidence of weak lamination. The form of the lamination indicates presence
of ripple and planar lamination and mud-drapes (Fig. 5.3b). Rip-up mud-clasts and pebbles are
observed sporadically throughout the interval. Furthermore, Macaronichnus occurs in clusters
Chapter 5 Results
29
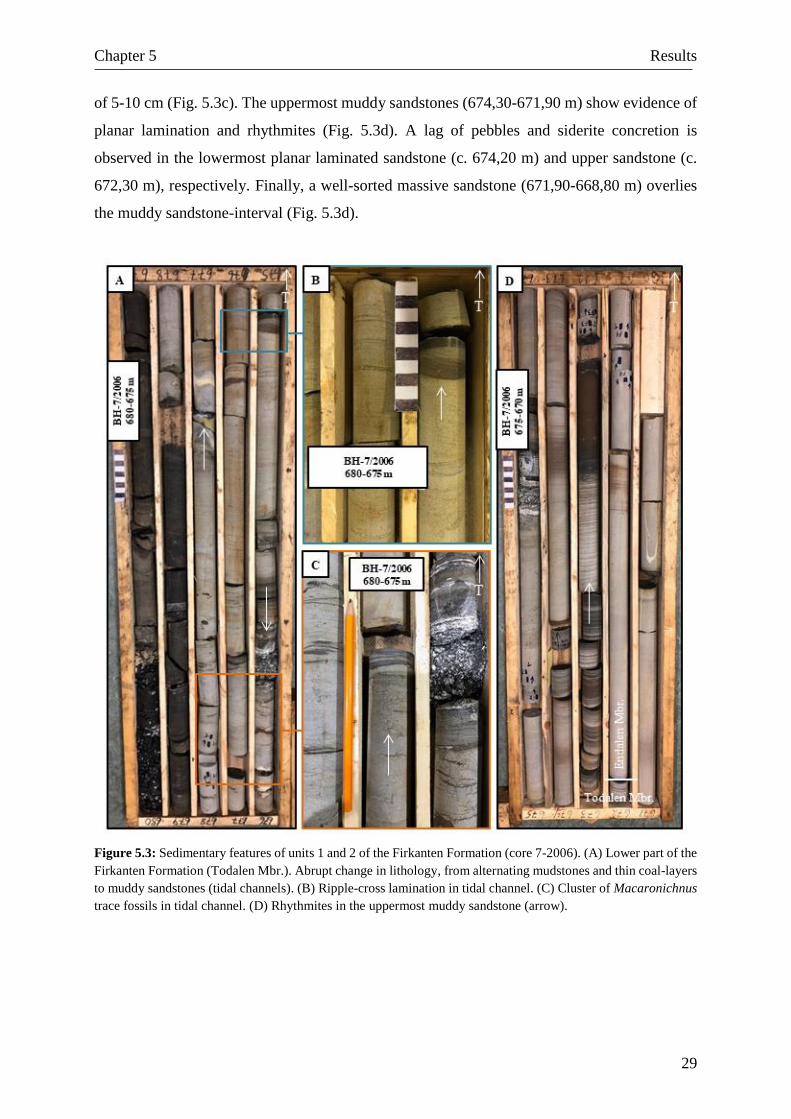
of 5-10 cm (Fig. 5.3c). The uppermost muddy sandstones (674,30-671,90 m) show evidence of
planar lamination and rhythmites (Fig. 5.3d). A lag of pebbles and siderite concretion is
observed in the lowermost planar laminated sandstone (c. 674,20 m) and upper sandstone (c.
672,30 m), respectively. Finally, a well-sorted massive sandstone (671,90-668,80 m) overlies
the muddy sandstone-interval (Fig. 5.3d).
Figure 5.3: Sedimentary features of units 1 and 2 of the Firkanten Formation (core 7-2006). (A) Lower part of the
Firkanten Formation (Todalen Mbr.). Abrupt change in lithology, from alternating mudstones and thin coal-layers
to muddy sandstones (tidal channels). (B) Ripple-cross lamination in tidal channel. (C) Cluster of Macaronichnus
trace fossils in tidal channel. (D) Rhythmites in the uppermost muddy sandstone (arrow).
Chapter 5 Results
30
Interpretation
The muddy sandstones of unit 2 are interpreted to represent tidal channels. The sharp boundary
to the underlying mudstone-coal interval, rip-up mud-clasts, marine/brackish trace fossils
(Macaronichnus), mud drapes and rhythmites support the present interpretation. The thin coal-
layers probably indicate abandonment of the channels. The well-sorted and massive nature of
the overlying sandstone implies deposition in a moderate to high energy shallow marine
environment. The apparent absence of sedimentary structures is typical for foreshore and upper
shoreface (Walker and Plint, 1992; Reading and Collinson, 1996). The change in facies
association, from tidal channels to foreshore-upper shoreface deposits (c. 671,90 m), is
interpreted to represent the transition between the paralic Todalen Member and the overlying
marine Endalen Member (Fig. 5.3d).
Unit 3 (668,80-653,40 m)
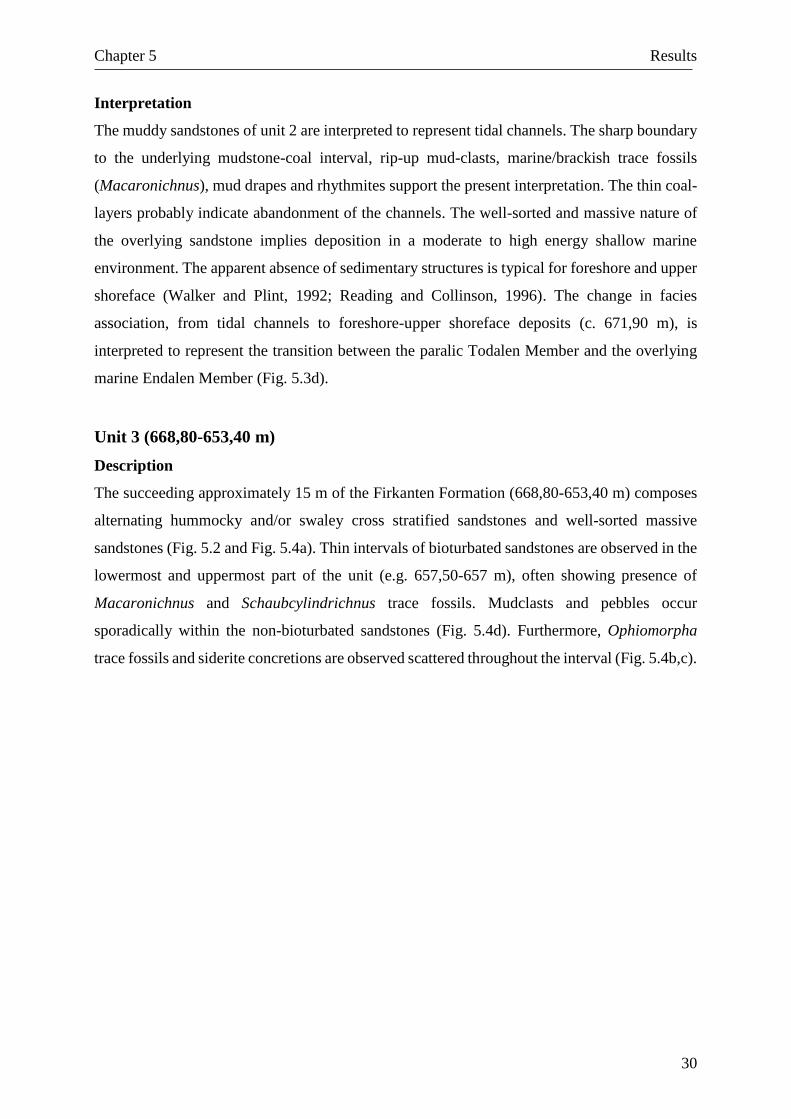
Description
The succeeding approximately 15 m of the Firkanten Formation (668,80-653,40 m) composes
alternating hummocky and/or swaley cross stratified sandstones and well-sorted massive
sandstones (Fig. 5.2 and Fig. 5.4a). Thin intervals of bioturbated sandstones are observed in the
lowermost and uppermost part of the unit (e.g. 657,50-657 m), often showing presence of
Macaronichnus and Schaubcylindrichnus trace fossils. Mudclasts and pebbles occur
sporadically within the non-bioturbated sandstones (Fig. 5.4d). Furthermore, Ophiomorpha
trace fossils and siderite concretions are observed scattered throughout the interval (Fig. 5.4b,c).
Chapter 5 Results
31
Figure 5.4: Sedimentary features of unit 3 of the Firkanten Formation (core 7-2006). (A) Hummocky and/or
swaley cross-stratified sandstone (arrow). (B) Hummocky and/or swaley cross-stratification (arrow) and
Ophiomorpha trace fossil (right). (C) Ophiomorpha trace fossil. (D) Lag of pebbles (storm deposits).
Interpretation
The hummocky and/or swaley cross-stratified sandstones are interpreted to represent storm-
influenced offshore-transition to lower shoreface deposits (Walker and Plint, 1992). Plint and
Norris (cited in Lüthje, 2008), however, considered similar deposits to be of middle-upper
shoreface origin. The presence of Ophiomorpha, typical for moderate to high energy shallow
marine environments, supports the present interpretation (Knaust, 2017). The well-sorted
massive sandstones resemble foreshore-upper shoreface deposits (see unit 2). The mudclasts
and pebbles probably represent laminated storm deposits, reflecting storm-induced erosion of
the sea-floor (Reineck and Singh, 1972). The bioturbated intervals are suggested to represent
periods of low sedimentation rates, allowing biogenic activity.
Chapter 5 Results
32
Unit 4 (653,40-580)
Description
The middle and upper part of the Firkanten Formation (653,40-580 m) is composed of highly
bioturbated sandstones, leaving only weak indications of the initial lamination. The bioturbated
sandstones, however, are sometimes interspersed with less bioturbated and/or weakly laminated
sandstones (Fig. 5.5c). The lamination resembles hummocky- and/or swaley cross-
stratification. Trace fossils occur frequently throughout the interval, in which Macaronichnus
and Schaubcylindrichnus are most prominent (Fig. 5.5b). Mud-clasts and pebbles are observed
sporadically. The interval shows several shallowing-upwards sequences, from dark mud-rich
and less bioturbated sandstones to light grey-grey coarser-grained and heavily bioturbated
sandstones (e.g. 600-590 m; Fig. 5.5a). Generally, the degree of bioturbation seems to slightly
decrease towards the top of the core.
In the uppermost approximately 8 m of the core, however, a grey-brownish sandstone showing
evidence of mottling occurs (Fig. 5.5e). Furthermore, a coalified piece of wood and ripple-cross
lamination are observed (Fig. 5.5d).
Chapter 5 Results
33
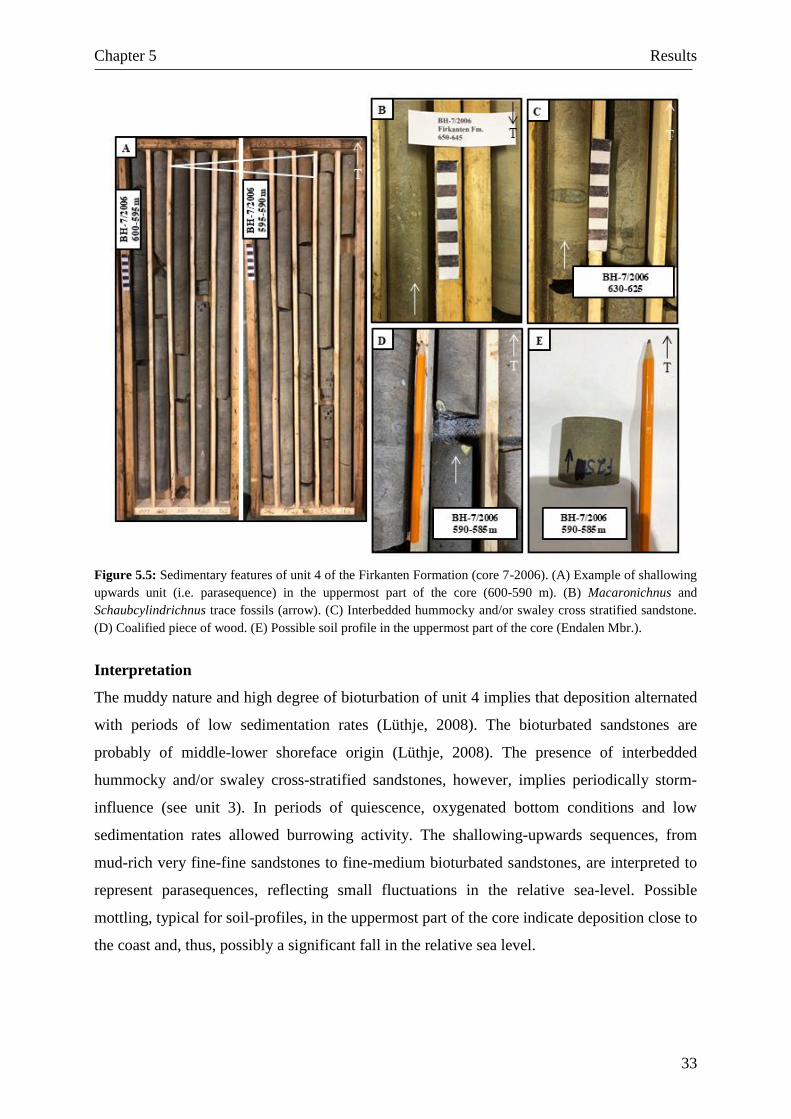
Figure 5.5: Sedimentary features of unit 4 of the Firkanten Formation (core 7-2006). (A) Example of shallowing
upwards unit (i.e. parasequence) in the uppermost part of the core (600-590 m). (B) Macaronichnus and
Schaubcylindrichnus trace fossils (arrow). (C) Interbedded hummocky and/or swaley cross stratified sandstone.
(D) Coalified piece of wood. (E) Possible soil profile in the uppermost part of the core (Endalen Mbr.).
Interpretation
The muddy nature and high degree of bioturbation of unit 4 implies that deposition alternated
with periods of low sedimentation rates (Lüthje, 2008). The bioturbated sandstones are
probably of middle-lower shoreface origin (Lüthje, 2008). The presence of interbedded
hummocky and/or swaley cross-stratified sandstones, however, implies periodically storm-
influence (see unit 3). In periods of quiescence, oxygenated bottom conditions and low
sedimentation rates allowed burrowing activity. The shallowing-upwards sequences, from
mud-rich very fine-fine sandstones to fine-medium bioturbated sandstones, are interpreted to
represent parasequences, reflecting small fluctuations in the relative sea-level. Possible
mottling, typical for soil-profiles, in the uppermost part of the core indicate deposition close to
the coast and, thus, possibly a significant fall in the relative sea level.
Chapter 5 Results
34
Depositional environment
The interpretations of unit 1-4 are consistent with previous studies of the Firkanten Formation
(e.g. Lüthje, 2008), suggesting a coastal plain (Todalen Member) to shallow marine (Endalen
Member) depositional environment for the formation.
Chapter 5 Results
35
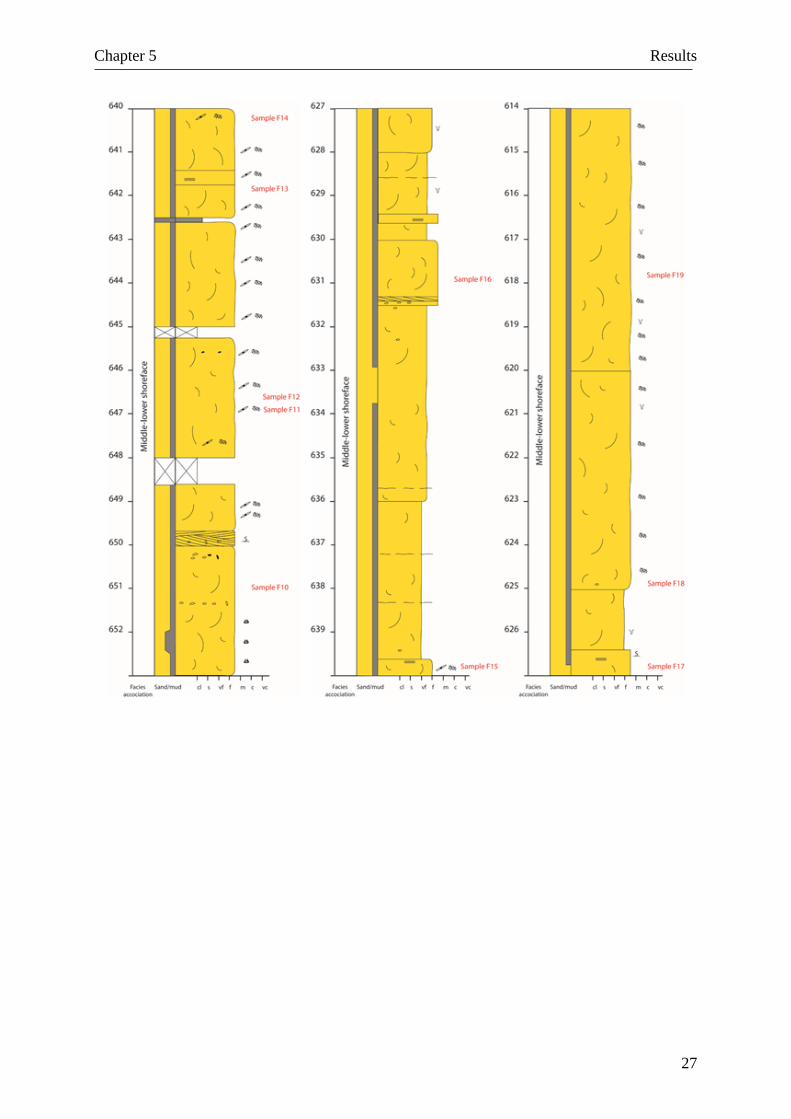
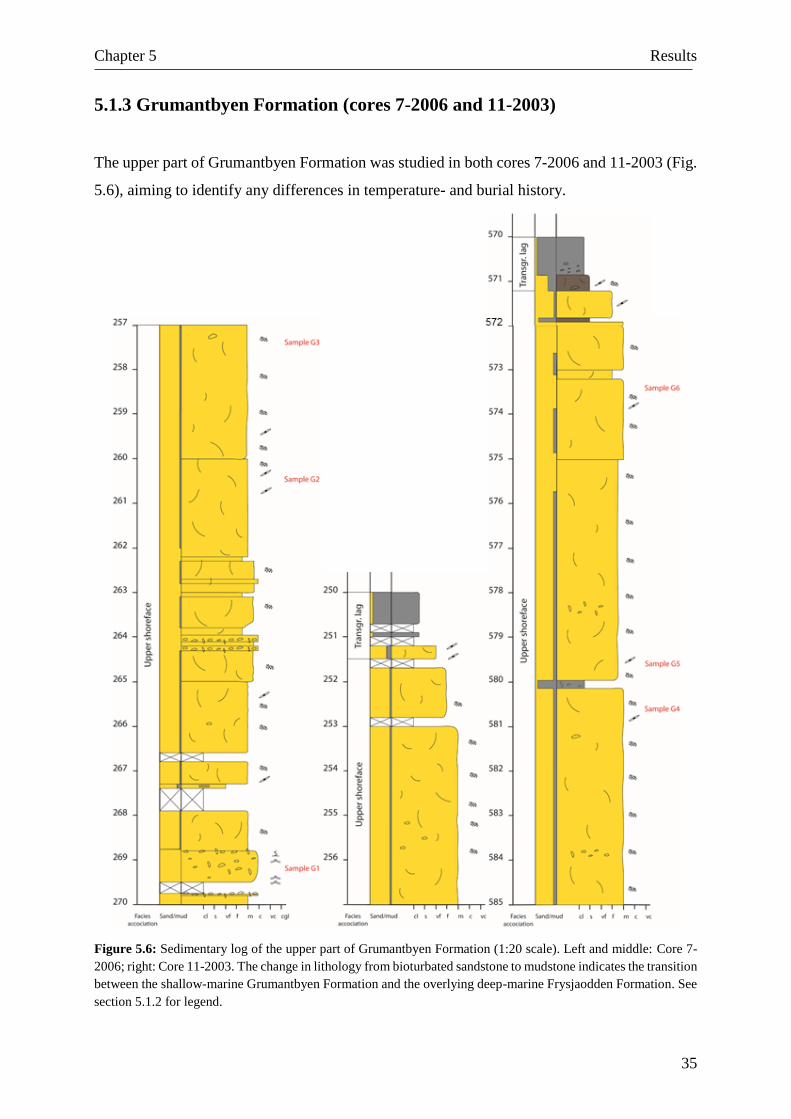
5.1.3 Grumantbyen Formation (cores 7-2006 and 11-2003)
The upper part of Grumantbyen Formation was studied in both cores 7-2006 and 11-2003 (Fig.
5.6), aiming to identify any differences in temperature- and burial history.
Figure 5.6: Sedimentary log of the upper part of Grumantbyen Formation (1:20 scale). Left and middle: Core 7-
2006; right: Core 11-2003. The change in lithology from bioturbated sandstone to mudstone indicates the transition
between the shallow-marine Grumantbyen Formation and the overlying deep-marine Frysjaodden Formation. See
section 5.1.2 for legend.
Chapter 5 Results
36
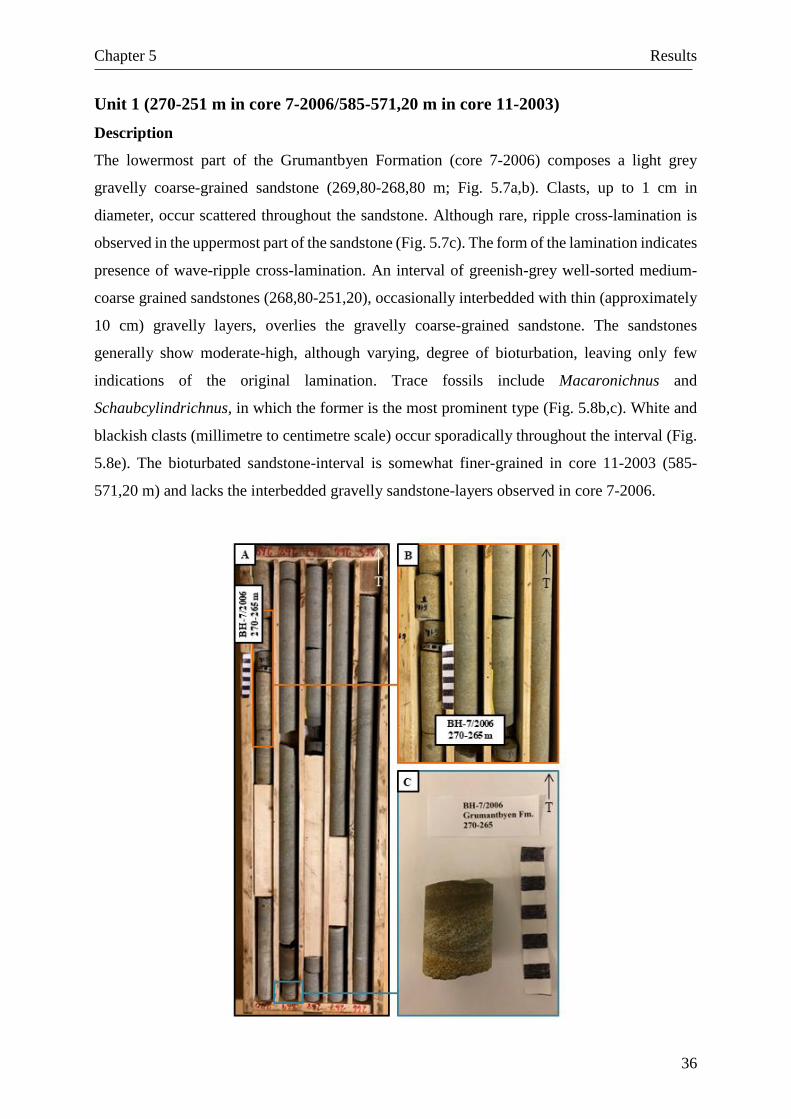
Unit 1 (270-251 m in core 7-2006/585-571,20 m in core 11-2003)
Description
The lowermost part of the Grumantbyen Formation (core 7-2006) composes a light grey
gravelly coarse-grained sandstone (269,80-268,80 m; Fig. 5.7a,b). Clasts, up to 1 cm in
diameter, occur scattered throughout the sandstone. Although rare, ripple cross-lamination is
observed in the uppermost part of the sandstone (Fig. 5.7c). The form of the lamination indicates
presence of wave-ripple cross-lamination. An interval of greenish-grey well-sorted medium-
coarse grained sandstones (268,80-251,20), occasionally interbedded with thin (approximately
10 cm) gravelly layers, overlies the gravelly coarse-grained sandstone. The sandstones
generally show moderate-high, although varying, degree of bioturbation, leaving only few
indications of the original lamination. Trace fossils include Macaronichnus and
Schaubcylindrichnus, in which the former is the most prominent type (Fig. 5.8b,c). White and
blackish clasts (millimetre to centimetre scale) occur sporadically throughout the interval (Fig.
5.8e). The bioturbated sandstone-interval is somewhat finer-grained in core 11-2003 (585-
571,20 m) and lacks the interbedded gravelly sandstone-layers observed in core 7-2006.
Chapter 5 Results
37
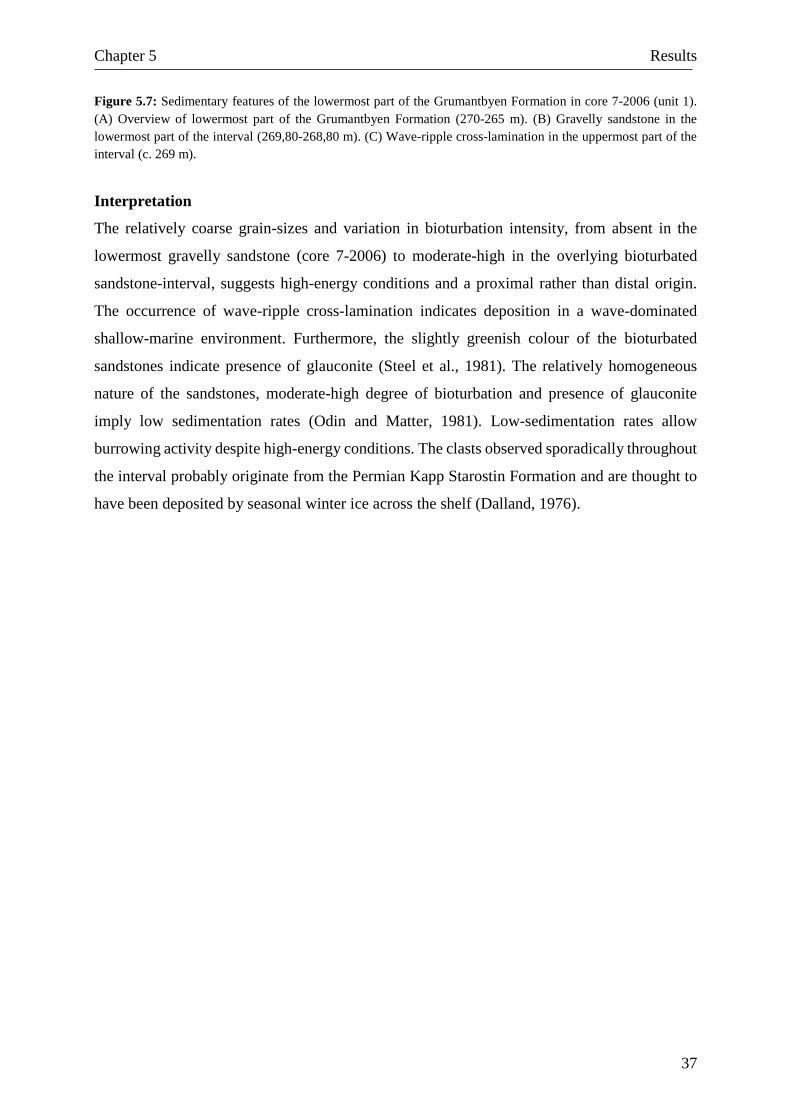
Figure 5.7: Sedimentary features of the lowermost part of the Grumantbyen Formation in core 7-2006 (unit 1).
(A) Overview of lowermost part of the Grumantbyen Formation (270-265 m). (B) Gravelly sandstone in the
lowermost part of the interval (269,80-268,80 m). (C) Wave-ripple cross-lamination in the uppermost part of the
interval (c. 269 m).
Interpretation
The relatively coarse grain-sizes and variation in bioturbation intensity, from absent in the
lowermost gravelly sandstone (core 7-2006) to moderate-high in the overlying bioturbated
sandstone-interval, suggests high-energy conditions and a proximal rather than distal origin.
The occurrence of wave-ripple cross-lamination indicates deposition in a wave-dominated
shallow-marine environment. Furthermore, the slightly greenish colour of the bioturbated
sandstones indicate presence of glauconite (Steel et al., 1981). The relatively homogeneous
nature of the sandstones, moderate-high degree of bioturbation and presence of glauconite
imply low sedimentation rates (Odin and Matter, 1981). Low-sedimentation rates allow
burrowing activity despite high-energy conditions. The clasts observed sporadically throughout
the interval probably originate from the Permian Kapp Starostin Formation and are thought to
have been deposited by seasonal winter ice across the shelf (Dalland, 1976).
Chapter 5 Results
38
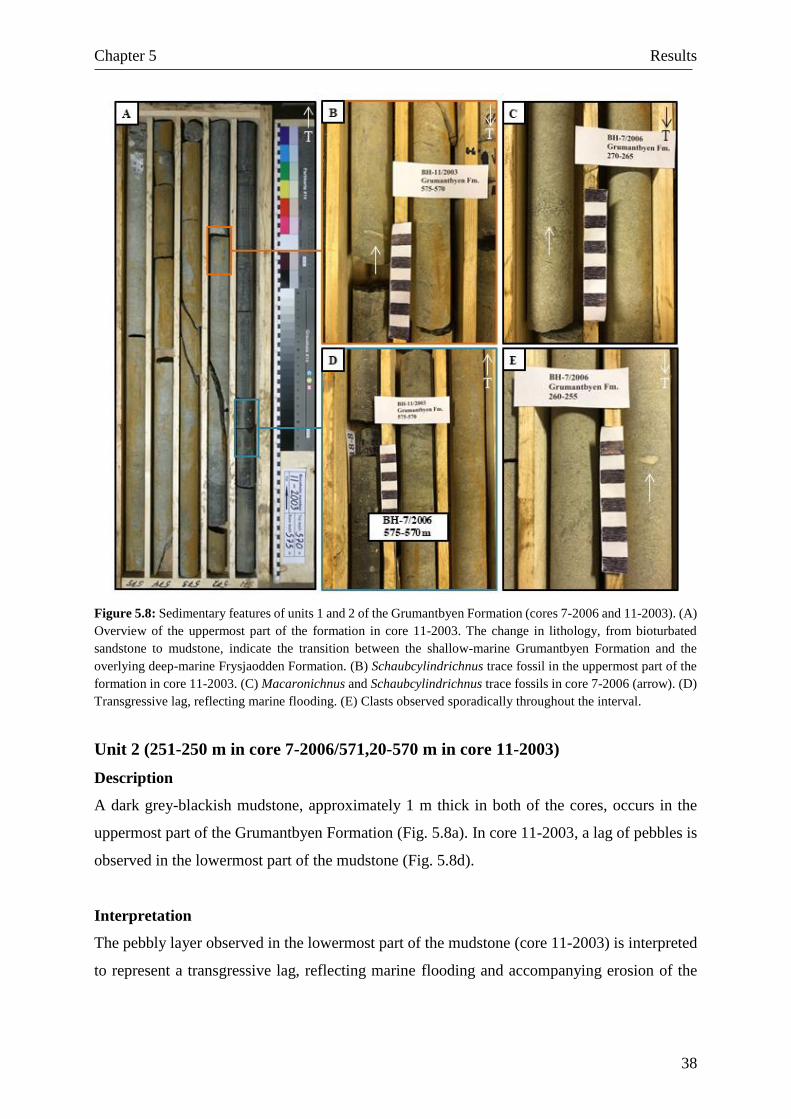
Figure 5.8: Sedimentary features of units 1 and 2 of the Grumantbyen Formation (cores 7-2006 and 11-2003). (A)
Overview of the uppermost part of the formation in core 11-2003. The change in lithology, from bioturbated
sandstone to mudstone, indicate the transition between the shallow-marine Grumantbyen Formation and the
overlying deep-marine Frysjaodden Formation. (B) Schaubcylindrichnus trace fossil in the uppermost part of the
formation in core 11-2003. (C) Macaronichnus and Schaubcylindrichnus trace fossils in core 7-2006 (arrow). (D)
Transgressive lag, reflecting marine flooding. (E) Clasts observed sporadically throughout the interval.
Unit 2 (251-250 m in core 7-2006/571,20-570 m in core 11-2003)
Description
A dark grey-blackish mudstone, approximately 1 m thick in both of the cores, occurs in the
uppermost part of the Grumantbyen Formation (Fig. 5.8a). In core 11-2003, a lag of pebbles is
observed in the lowermost part of the mudstone (Fig. 5.8d).
Interpretation
The pebbly layer observed in the lowermost part of the mudstone (core 11-2003) is interpreted
to represent a transgressive lag, reflecting marine flooding and accompanying erosion of the
Chapter 5 Results
39
sea-floor. This transgressive lag probably represents the transition between the shallow marine
Grumantbyen Formation and the overlying deep-marine Frysjaodden Formation.
Depositional environment
The high degree of bioturbation, leaving only few indications of the original lamination, makes
it difficult to precisely interpret the depositional environment of the upper part of Grumantbyen
Formation. However, the overall nature of the succession, including grain size and occurrence
of wave ripple cross-lamination, suggests deposition in a shallow-marine environment,
probably upper shoreface. The abundance of Macaronichnus, a characteristic shallow-marine
trace fossil often occurring in middle-upper shoreface and foreshore deposits, supports the
present interpretation (Clifton and Thompson, 1978; Knaust, 2017).
Chapter 5 Results
40
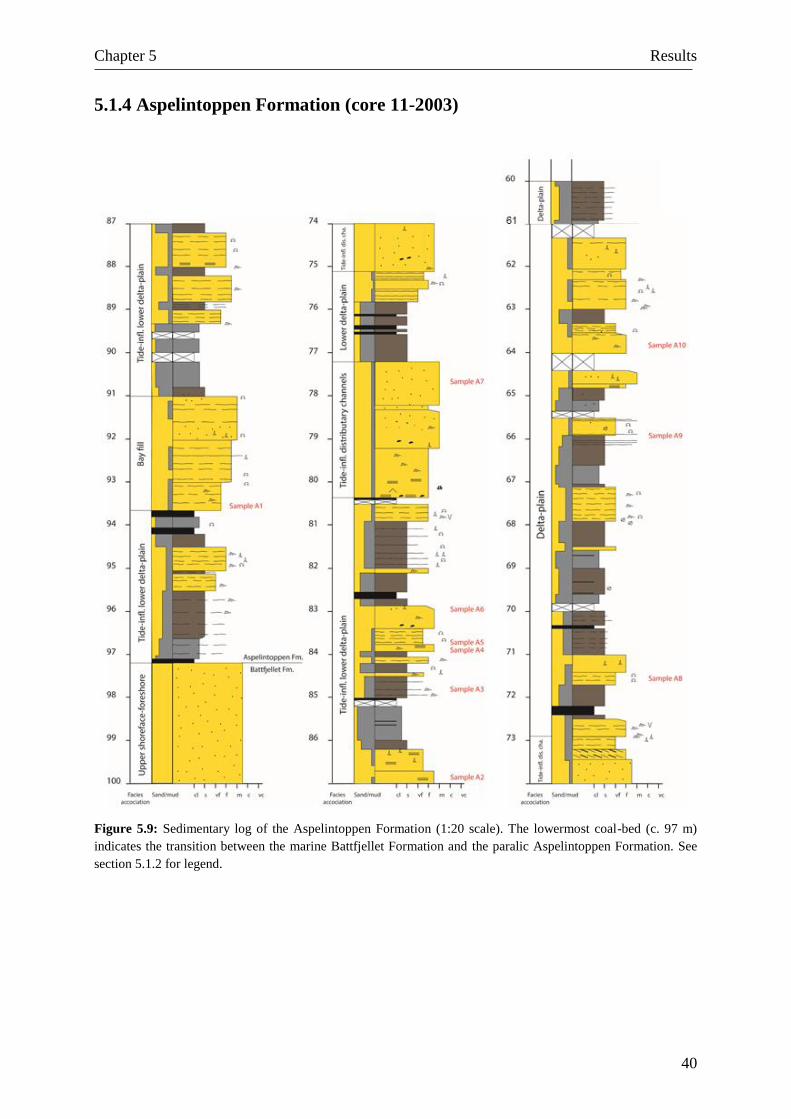
5.1.4 Aspelintoppen Formation (core 11-2003)
Figure 5.9: Sedimentary log of the Aspelintoppen Formation (1:20 scale). The lowermost coal-bed (c. 97 m)
indicates the transition between the marine Battfjellet Formation and the paralic Aspelintoppen Formation. See
section 5.1.2 for legend.
Chapter 5 Results
41
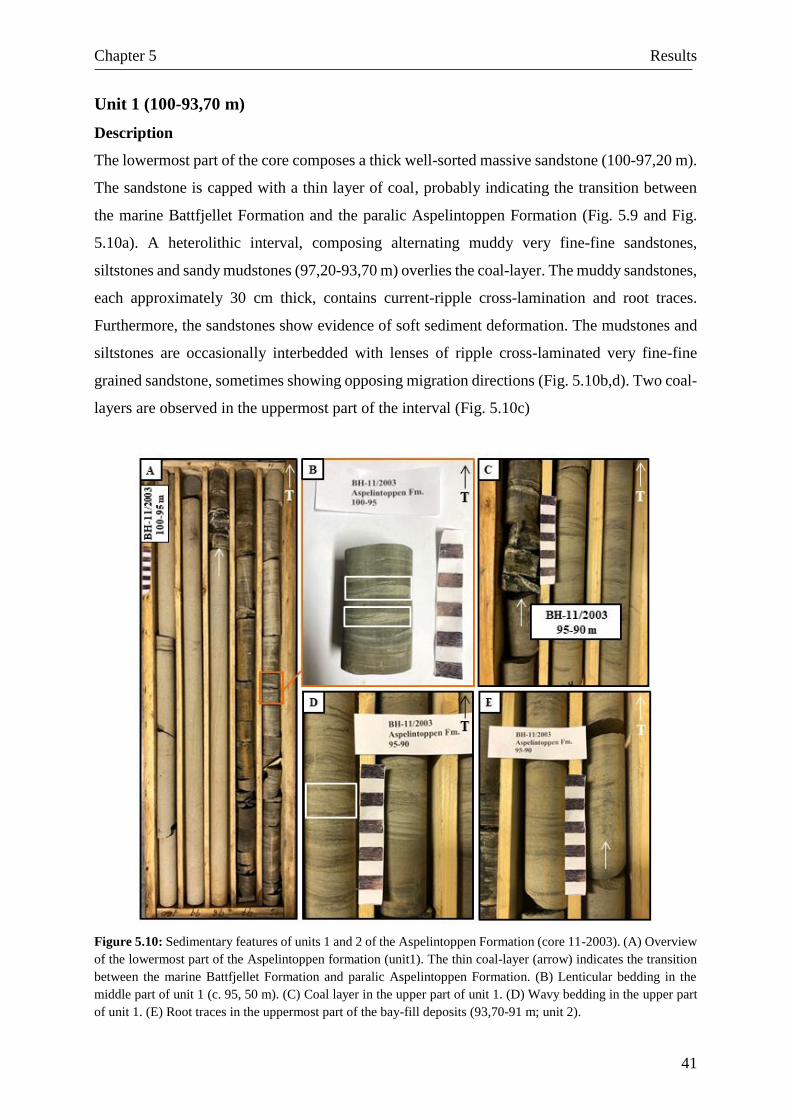
Unit 1 (100-93,70 m)
Description
The lowermost part of the core composes a thick well-sorted massive sandstone (100-97,20 m).
The sandstone is capped with a thin layer of coal, probably indicating the transition between
the marine Battfjellet Formation and the paralic Aspelintoppen Formation (Fig. 5.9 and Fig.
5.10a). A heterolithic interval, composing alternating muddy very fine-fine sandstones,
siltstones and sandy mudstones (97,20-93,70 m) overlies the coal-layer. The muddy sandstones,
each approximately 30 cm thick, contains current-ripple cross-lamination and root traces.
Furthermore, the sandstones show evidence of soft sediment deformation. The mudstones and
siltstones are occasionally interbedded with lenses of ripple cross-laminated very fine-fine
grained sandstone, sometimes showing opposing migration directions (Fig. 5.10b,d). Two coal-
layers are observed in the uppermost part of the interval (Fig. 5.10c)
Figure 5.10: Sedimentary features of units 1 and 2 of the Aspelintoppen Formation (core 11-2003). (A) Overview
of the lowermost part of the Aspelintoppen formation (unit1). The thin coal-layer (arrow) indicates the transition
between the marine Battfjellet Formation and paralic Aspelintoppen Formation. (B) Lenticular bedding in the
middle part of unit 1 (c. 95, 50 m). (C) Coal layer in the upper part of unit 1. (D) Wavy bedding in the upper part
of unit 1. (E) Root traces in the uppermost part of the bay-fill deposits (93,70-91 m; unit 2).
Chapter 5 Results
42
Interpretation
The well-sorted and mature character of the lowermost sandstone-body suggests deposition in
a moderate-high energy shallow marine environment. The apparent absence of sedimentary
structures is typical for foreshore and uppermost part of shoreface (Walker and Plint, 1992;
Reading and Collinson, 1996). The sandstone is interpreted to represent upper shoreface-
foreshore deposits of the uppermost part of the Battfjellet Formation. The overlying heterolithic
interval, composing alternating muddy sandstones, siltstones and sandy mudstones, are
interpreted to represent tidally induced lenticular-, wavy- and flaser bedding. The occurrence
of current ripple cross-lamination, sometimes showing opposing migration directions, supports
the latter interpretation. The coal-beds observed in the uppermost part of the interval is
suggested to represent prolonged periods of terrestrial exposure. Flaser, wavy and lenticular
bedding (typical for near-shore tidal deposits), however, are not exclusively occurring in tidal
zones; similar deposits are also occurring in overbank areas of episodic flooding (Reineck and
Singh, 1980). However, tide induced lenticular-, wavy- and flaser bedding is consistent with
previous studies of the Aspelintoppen Formation, suggesting tide-influence on the lower part
(Naurstad, 2014).
Unit 2 (93,70-80,30)
Description
The lowermost approximately three meters of unit 2 composes a mud-rich fine-medium grained
sandstone showing overall coarsening upwards (93,70-91 m; Fig. 5.9). Ripple cross-lamination
and root-traces are observed in the lowermost- and middle-upper part of the sandstone,
respectively (Fig. 5.10e). Furthermore, the sandstone generally shows high degree of soft
sediment deformation, leaving few indications of the original lamination. A thick interval of
alternating muddy sandstones, siltstones and mudstones (91-80,30 m) overlies the overall
coarsening upwards sandstone. The muddy sandstones are sometimes normal-graded and soft-
sediment deformed. Furthermore, current-ripple cross-lamination and root traces are observed
within the muddy sandstones and siltstones. Three thin coal-beds occur in the middle-upper
part of the interval (Fig. 5.9).
Interpretation
The muddy fine-medium grained sandstone, showing overall coarsening upwards, is interpreted
to represent tide-influenced bay fill deposits. The succeeding heterolithic interval resemble
tidally induced lenticular- and flaser bedding (see unit 1).
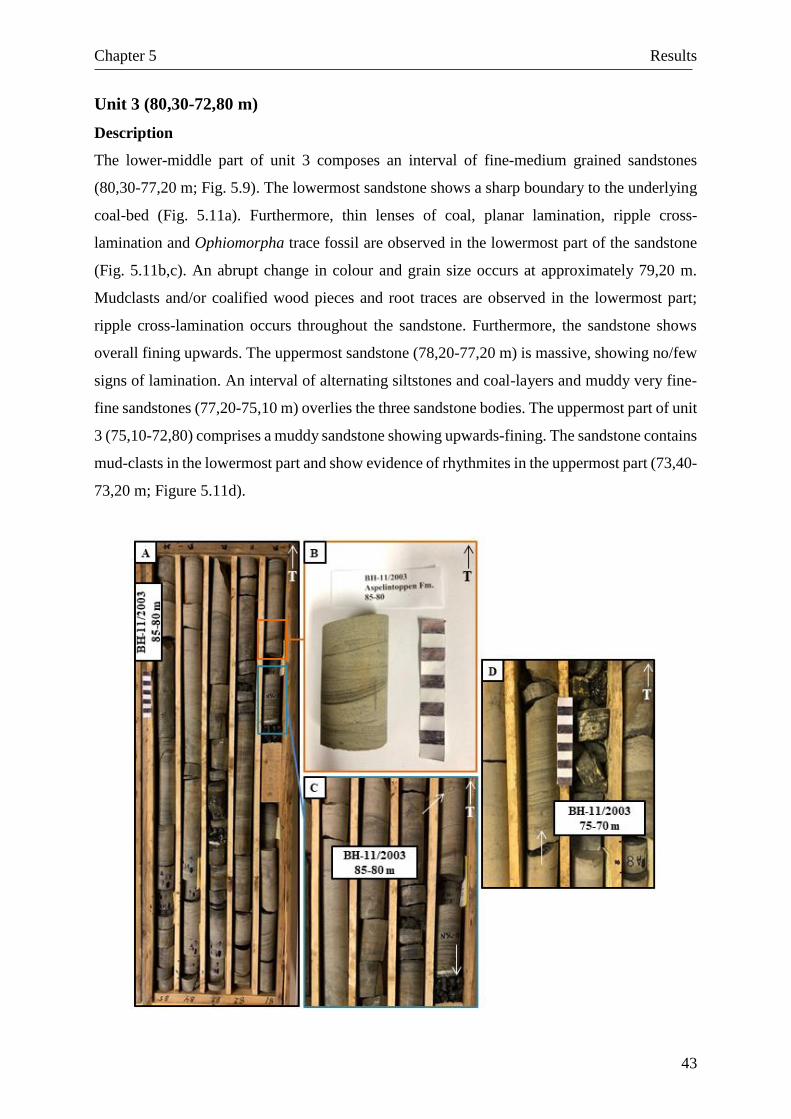
Chapter 5 Results
43
Unit 3 (80,30-72,80 m)
Description
The lower-middle part of unit 3 composes an interval of fine-medium grained sandstones
(80,30-77,20 m; Fig. 5.9). The lowermost sandstone shows a sharp boundary to the underlying
coal-bed (Fig. 5.11a). Furthermore, thin lenses of coal, planar lamination, ripple cross-
lamination and Ophiomorpha trace fossil are observed in the lowermost part of the sandstone
(Fig. 5.11b,c). An abrupt change in colour and grain size occurs at approximately 79,20 m.
Mudclasts and/or coalified wood pieces and root traces are observed in the lowermost part;
ripple cross-lamination occurs throughout the sandstone. Furthermore, the sandstone shows
overall fining upwards. The uppermost sandstone (78,20-77,20 m) is massive, showing no/few
signs of lamination. An interval of alternating siltstones and coal-layers and muddy very fine-
fine sandstones (77,20-75,10 m) overlies the three sandstone bodies. The uppermost part of unit
3 (75,10-72,80) comprises a muddy sandstone showing upwards-fining. The sandstone contains
mud-clasts in the lowermost part and show evidence of rhythmites in the uppermost part (73,40-
73,20 m; Figure 5.11d).
Chapter 5 Results
44
Figure 5.11: Sedimentary features of unit 3 of the Aspelintoppen Formation (core 11-2003). (A) Upper part of
unit 2 (85-80,50 m) and lower 0,5 m (80,50-80 m) of unit 3. (B) Ripple cross-lamination in the lowermost tide-
influenced distributary channel. (C) Sharp boundary between coal-layer and overlying laminated sandstone (lower
arrow). Ophiomorpha trace fossil in the lowermost tide-influenced distributary channel (upper arrow). (D)
Rhythmites in the uppermost part of unit 3 (73,40-73,20 m).
Interpretation
The muddy sandstones occurring in the lower-middle part of the unit are interpreted to represent
tide-influenced distributary channel fill deposits. The sharp boundary to the underlying coal-
layer and the observation of rip-up mudclasts, plane parallel lamination, ripple cross-lamination
and marine/brackish trace fossils (Ophiomorpha) support the present interpretation. The
overlying interval, composing siltstones, thin coal-layers and sandstones, probably represent
lower delta-plain deposits. The overall nature of the uppermost sandstone and the presence of
rhythmites suggests tide-influenced distributary channel fill deposits.
Unit 4 (72,80-60 m)
Description
The upper part of the core comprises alternating sandy mudstones, siltstones and muddy
sandstones, occasionally interbedded with thin coal-beds (72,80-60 m; Fig. 5.9). The
sandstones are relatively thin and sometimes show normal-grading. Furthermore, current-ripple
cross lamination, climbing ripples and root traces are observed within the sandstones (Fig.
5.12b). In addition, at least one reddish-brown soil profile is observed within the interval
(68,50-68,40 m). Well-preserved leaf prints occur within some of the muddy sandstones and
siltstones (Fig. 5.12a).
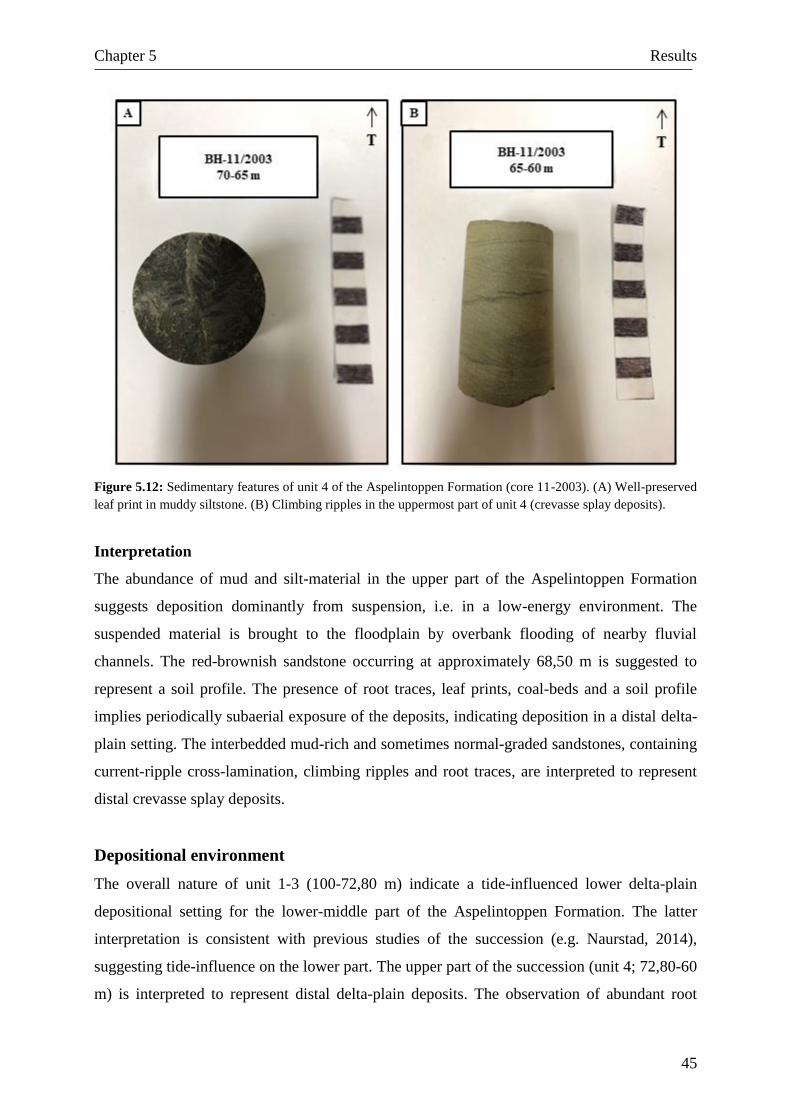
Chapter 5 Results
45
Figure 5.12: Sedimentary features of unit 4 of the Aspelintoppen Formation (core 11-2003). (A) Well-preserved
leaf print in muddy siltstone. (B) Climbing ripples in the uppermost part of unit 4 (crevasse splay deposits).
Interpretation
The abundance of mud and silt-material in the upper part of the Aspelintoppen Formation
suggests deposition dominantly from suspension, i.e. in a low-energy environment. The
suspended material is brought to the floodplain by overbank flooding of nearby fluvial
channels. The red-brownish sandstone occurring at approximately 68,50 m is suggested to
represent a soil profile. The presence of root traces, leaf prints, coal-beds and a soil profile
implies periodically subaerial exposure of the deposits, indicating deposition in a distal delta-
plain setting. The interbedded mud-rich and sometimes normal-graded sandstones, containing
current-ripple cross-lamination, climbing ripples and root traces, are interpreted to represent
distal crevasse splay deposits.
Depositional environment
The overall nature of unit 1-3 (100-72,80 m) indicate a tide-influenced lower delta-plain
depositional setting for the lower-middle part of the Aspelintoppen Formation. The latter
interpretation is consistent with previous studies of the succession (e.g. Naurstad, 2014),
suggesting tide-influence on the lower part. The upper part of the succession (unit 4; 72,80-60
m) is interpreted to represent distal delta-plain deposits. The observation of abundant root
Chapter 5 Results
46
traces, leaf prints and a soil profile, indicating periodically subaerial exposure of the deposits,
support the latter interpretation. Although no distinct tide-induced structures are observed in
unit 4, the presence of carbonate cement in sample A8 indicate some marine influence (see
section 5.3)
5.2 Geochemical trends
5.2.1 Introduction
A handheld XRF-analyser were used to measure the elemental composition of core 7-2006 and
11-2003, aiming to identify geochemical trends in the sediment cores and to investigate whether
these can be correlated to the sedimentary logs. Large- and small-scale geochemical trends can
thus be used to support sedimentological interpretations and to help fill in gaps in the
sedimentary logs (e.g. in heavy bioturbated intervals). In addition, the elemental composition
of the cores provides information regarding the mineral composition of the studied formations,
e.g. presence of feldspar, which, in turn, can be used to predict the formation of authigenic illite
at the expense of kaolinite at great burial depths. Geochemical data can thus be used to get a
better understanding of the types and distribution of authigenic minerals. However, combining
the geochemical signatures of the rocks with the sedimentary logs and thin section analyses,
provide a more complete “history” of the Firkanten, Grumantbyen and Aspelintoppen
formations. In the following, the geochemical signatures (i.e. trends, peaks, troughs) of the
studied formations will be discussed in detail, focusing on elements showing large and/or small-
scale geochemical trends. The red and green trend-lines (Fig. 5.13-5.15) are based on visual
inspection rather than scientific calculations, requiring at least three measurements on a (more
or less) straight line. Elemental concentrations are represented in parts per million (ppm). In
addition to Fig. 5.13-5.15, selected element plots are attached in Appendix II.
5.2.2 Firkanten Formation
The Firkanten Formation is interpreted to represent coastal plain- (Todalen Member) and
shallow marine deposits (Endalen Member), reflecting the early Paleocene large-scale
transgressive phase of basin infilling. The XRF-data reveals clear geochemical trends, both
large- and small-scale. The most prominent trends, representing the large-scale evolution of the
Firkanten Formation, are (1) a small decrease in silica (Si) concentration towards the top of the
core and (2) accompanying increase in aluminium (Al), barium (Ba), rubidium (Rb), potassium
Chapter 5 Results
47
(K), strontium (Sr) and yttrium (Y) concentrations (Fig. 5.13 and Appendix II). The decrease
in Si-content indicates a reduction in the relative amounts of quartz (i.e. sand), suggesting a
more distal depositional setting towards the top of the core. The increase in Al-, Ba-, Rb-, K-,
Sr- and Y-concentrations towards the top of the core, implying an increase in the amount of
clayey material, correlates well with the decreasing Si-concentration. In the uppermost part of
the core (c. 590 m), however, a distinct increase in the Si-content and accompanying decrease
in the Al-, Rb- and K-concentrations occur, disturbing the large-scale trends discussed above
(Fig. 5.13). Furthermore, the lowermost approximately 10 m of the core displays a cluster of
relatively low Si-concentrations and high Al-, Ba-, Rb-, K-, Sr- and Y-values. The latter
observation is consistent with the sedimentary log, showing an interval of alternating mudstones
and coal-beds.
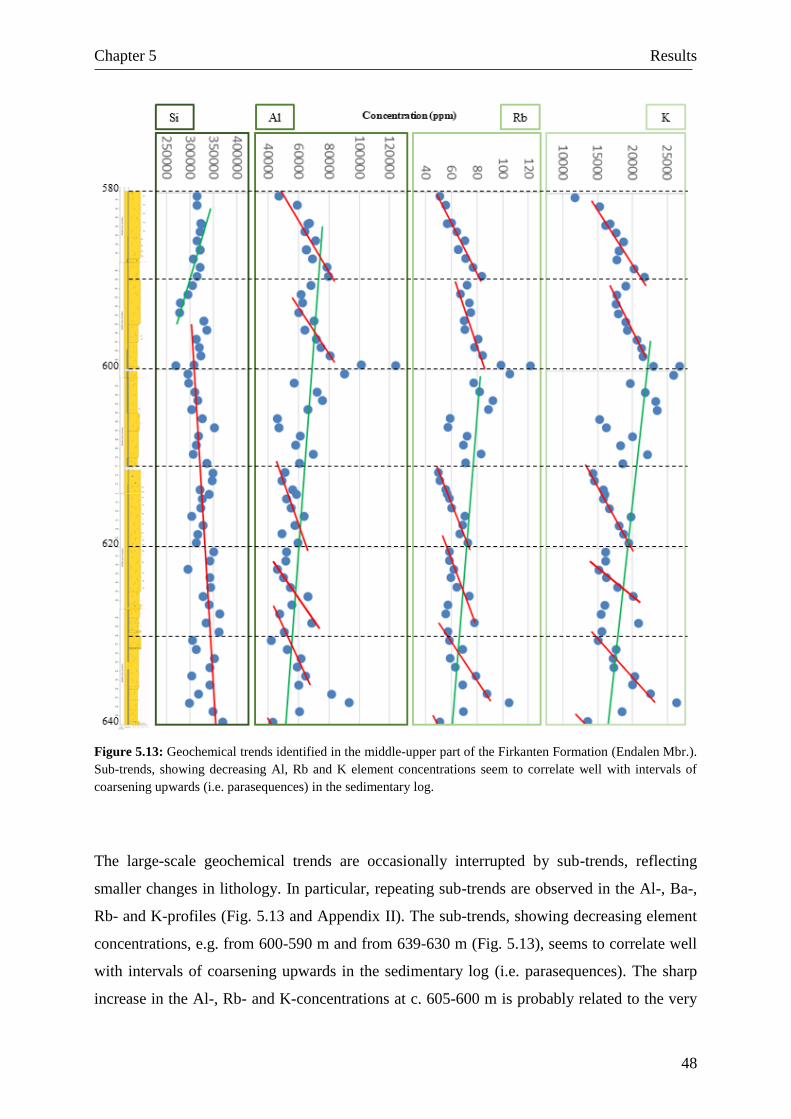
Chapter 5 Results
48
Figure 5.13: Geochemical trends identified in the middle-upper part of the Firkanten Formation (Endalen Mbr.).
Sub-trends, showing decreasing Al, Rb and K element concentrations seem to correlate well with intervals of
coarsening upwards (i.e. parasequences) in the sedimentary log.
The large-scale geochemical trends are occasionally interrupted by sub-trends, reflecting
smaller changes in lithology. In particular, repeating sub-trends are observed in the Al-, Ba-,
Rb- and K-profiles (Fig. 5.13 and Appendix II). The sub-trends, showing decreasing element
concentrations, e.g. from 600-590 m and from 639-630 m (Fig. 5.13), seems to correlate well
with intervals of coarsening upwards in the sedimentary log (i.e. parasequences). The sharp
increase in the Al-, Rb- and K-concentrations at c. 605-600 m is probably related to the very
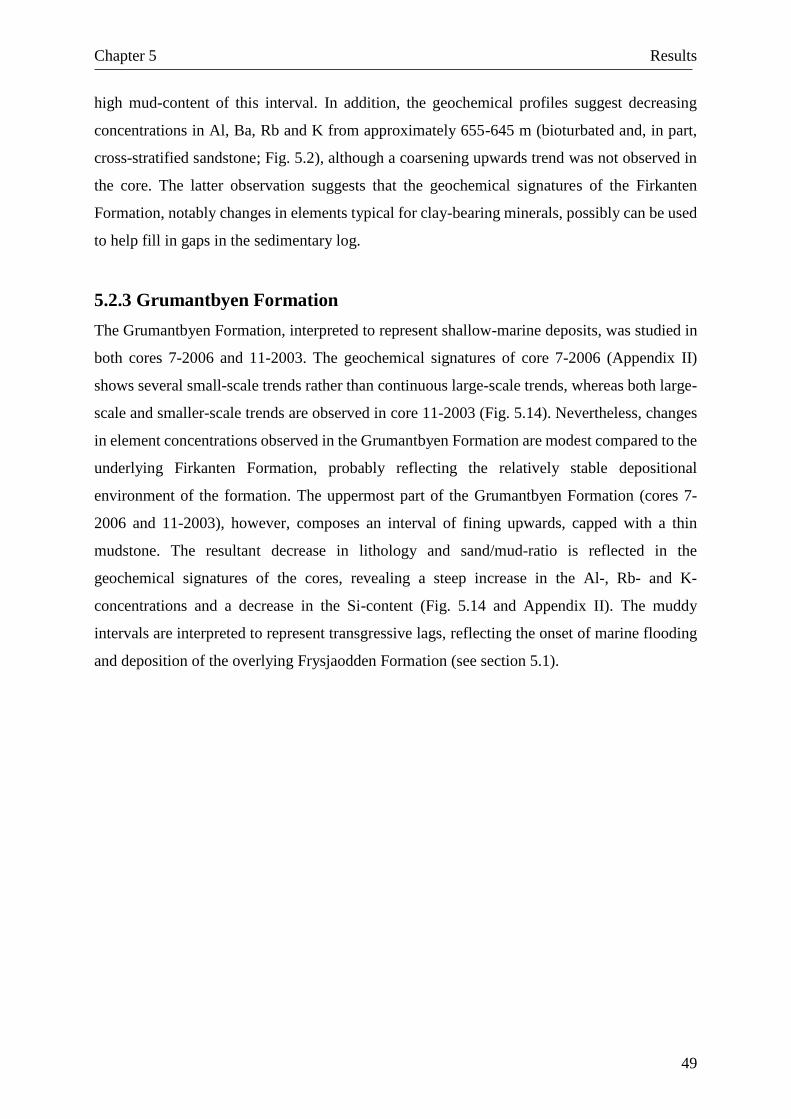
Chapter 5 Results
49
high mud-content of this interval. In addition, the geochemical profiles suggest decreasing
concentrations in Al, Ba, Rb and K from approximately 655-645 m (bioturbated and, in part,
cross-stratified sandstone; Fig. 5.2), although a coarsening upwards trend was not observed in
the core. The latter observation suggests that the geochemical signatures of the Firkanten
Formation, notably changes in elements typical for clay-bearing minerals, possibly can be used
to help fill in gaps in the sedimentary log.
5.2.3 Grumantbyen Formation
The Grumantbyen Formation, interpreted to represent shallow-marine deposits, was studied in
both cores 7-2006 and 11-2003. The geochemical signatures of core 7-2006 (Appendix II)
shows several small-scale trends rather than continuous large-scale trends, whereas both large-
scale and smaller-scale trends are observed in core 11-2003 (Fig. 5.14). Nevertheless, changes
in element concentrations observed in the Grumantbyen Formation are modest compared to the
underlying Firkanten Formation, probably reflecting the relatively stable depositional
environment of the formation. The uppermost part of the Grumantbyen Formation (cores 7-
2006 and 11-2003), however, composes an interval of fining upwards, capped with a thin
mudstone. The resultant decrease in lithology and sand/mud-ratio is reflected in the
geochemical signatures of the cores, revealing a steep increase in the Al-, Rb- and K-
concentrations and a decrease in the Si-content (Fig. 5.14 and Appendix II). The muddy
intervals are interpreted to represent transgressive lags, reflecting the onset of marine flooding
and deposition of the overlying Frysjaodden Formation (see section 5.1).
Chapter 5 Results
50
Figure 5.14: Geochemical trends identified in the Grumantbyen Formation (core 11-2003). The abrupt increase
in Al, Rb and K element concentrations indicate the transition between the shallow-marine Grumantbyen
Formation and overlying deep-marine Frysjaodden Formation.
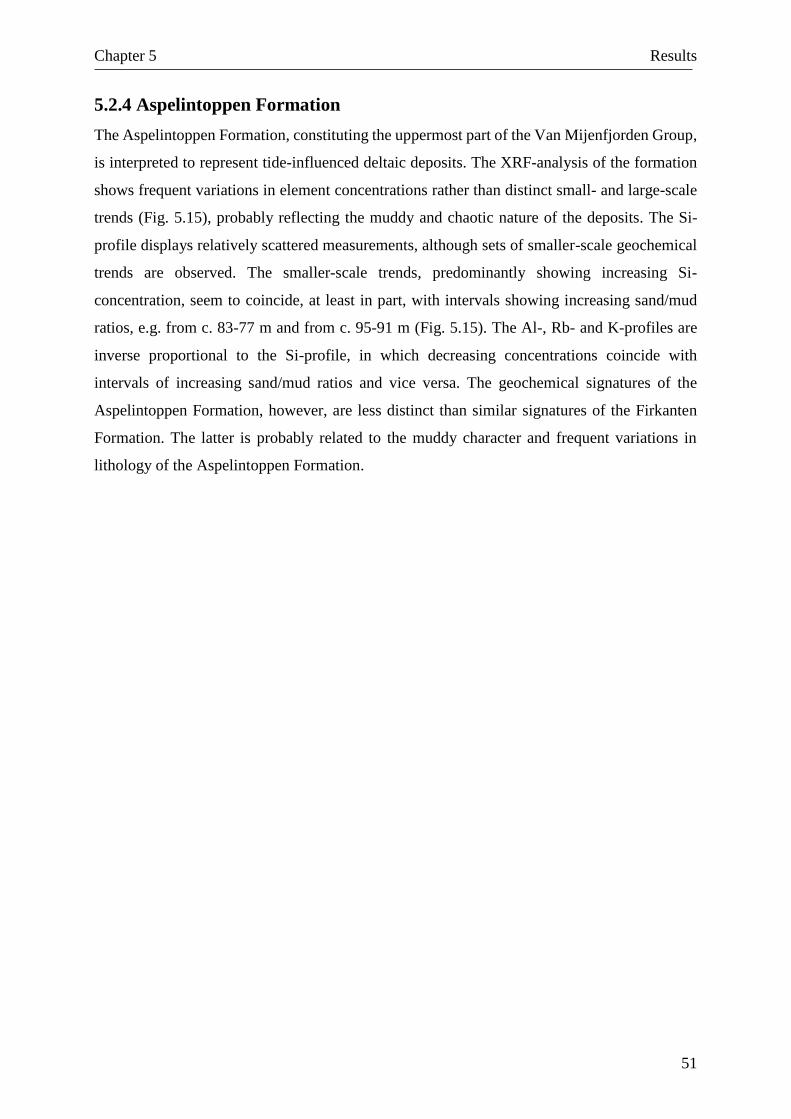
Chapter 5 Results
51
5.2.4 Aspelintoppen Formation
The Aspelintoppen Formation, constituting the uppermost part of the Van Mijenfjorden Group,
is interpreted to represent tide-influenced deltaic deposits. The XRF-analysis of the formation
shows frequent variations in element concentrations rather than distinct small- and large-scale
trends (Fig. 5.15), probably reflecting the muddy and chaotic nature of the deposits. The Si-
profile displays relatively scattered measurements, although sets of smaller-scale geochemical
trends are observed. The smaller-scale trends, predominantly showing increasing Si-
concentration, seem to coincide, at least in part, with intervals showing increasing sand/mud
ratios, e.g. from c. 83-77 m and from c. 95-91 m (Fig. 5.15). The Al-, Rb- and K-profiles are
inverse proportional to the Si-profile, in which decreasing concentrations coincide with
intervals of increasing sand/mud ratios and vice versa. The geochemical signatures of the
Aspelintoppen Formation, however, are less distinct than similar signatures of the Firkanten
Formation. The latter is probably related to the muddy character and frequent variations in
lithology of the Aspelintoppen Formation.
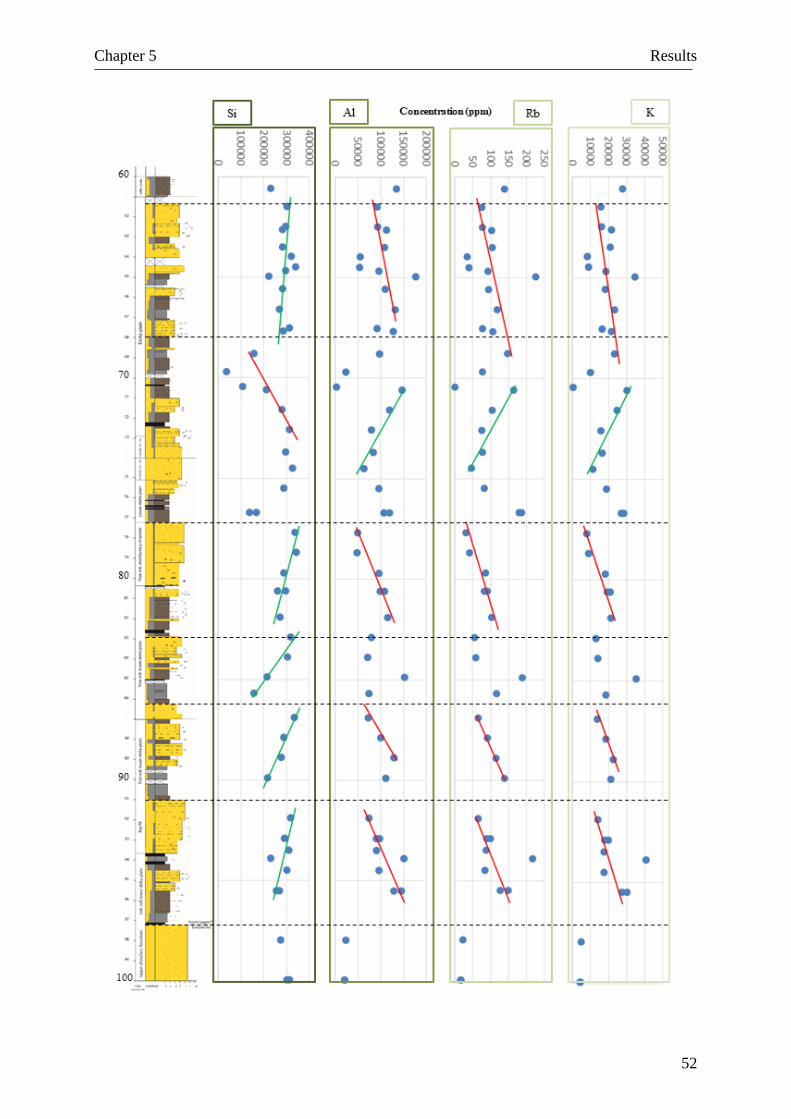
Chapter 5 Results
52
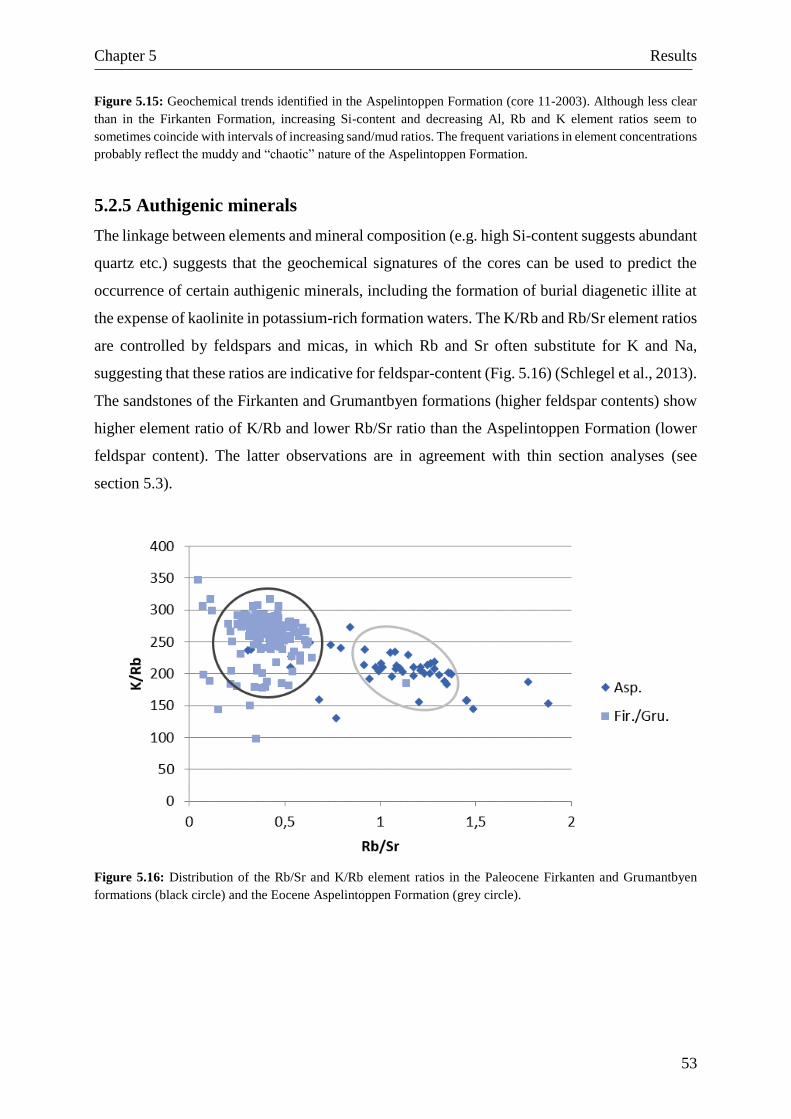
Chapter 5 Results
53
Figure 5.15: Geochemical trends identified in the Aspelintoppen Formation (core 11-2003). Although less clear
than in the Firkanten Formation, increasing Si-content and decreasing Al, Rb and K element ratios seem to
sometimes coincide with intervals of increasing sand/mud ratios. The frequent variations in element concentrations
probably reflect the muddy and “chaotic” nature of the Aspelintoppen Formation.
5.2.5 Authigenic minerals
The linkage between elements and mineral composition (e.g. high Si-content suggests abundant
quartz etc.) suggests that the geochemical signatures of the cores can be used to predict the
occurrence of certain authigenic minerals, including the formation of burial diagenetic illite at
the expense of kaolinite in potassium-rich formation waters. The K/Rb and Rb/Sr element ratios
are controlled by feldspars and micas, in which Rb and Sr often substitute for K and Na,
suggesting that these ratios are indicative for feldspar-content (Fig. 5.16) (Schlegel et al., 2013).
The sandstones of the Firkanten and Grumantbyen formations (higher feldspar contents) show
higher element ratio of K/Rb and lower Rb/Sr ratio than the Aspelintoppen Formation (lower
feldspar content). The latter observations are in agreement with thin section analyses (see
section 5.3).
Figure 5.16: Distribution of the Rb/Sr and K/Rb element ratios in the Paleocene Firkanten and Grumantbyen
formations (black circle) and the Eocene Aspelintoppen Formation (grey circle).
Chapter 5 Results
54
5.3 Petrographic analyses
5.3.1 Introduction
A total of 44 thin-sections, one from each sandstone-sample, were analysed using an optical
microscope. In addition, eight of the samples were selected for Scanning Electron Microscope
(SEM) and X-ray diffraction (XRD) analyses (Appendix I). The purpose of the thin section
analysis was to investigate the composition (i.e. texture, detrital minerals, authigenic phases,
cement and porosity) of the samples and thus get a better understanding of depositional
environment, diagenesis and temperature history of the Firkanten, Grumantbyen and
Aspelintoppen formations. Furthermore, SEM- and XRD-analyses aimed to help fill in gaps in
optical microscopy and to identify uncertain minerals. Schlegel et al. (2013) generally classified
sandstones of the Central Tertiary Basin (cores 7-2006 and 11-2003) as feldsphatic sandstones.
Detrital minerals – minerals present initially in sediments – were predominantly identified using
optical microscope, whereas authigenic minerals – minerals formed “in situ” subsequent to
deposition of detrital minerals – were identified using both optical microscope, SEM and XRD.
The most prevalent cement types in sandstones are quartz, carbonate and clay minerals,
although smaller amounts of pyrite, feldspar, hematite, apatite and Ti-rich minerals are locally
important (Worden and Burley, 2003). Grain sizes- and porosity values were roughly estimated
by visual inspection, using the scale appearing in the lower right/left corner of optical
micrographs and quantifying the blue spots (i.e. epoxy) present in the samples, respectively.
Optical micrographs (2,5x, PPL and close ups) of most samples are attached in Appendix III;
SEM- and XRD-analyses of selected samples are attached in Appendix II.
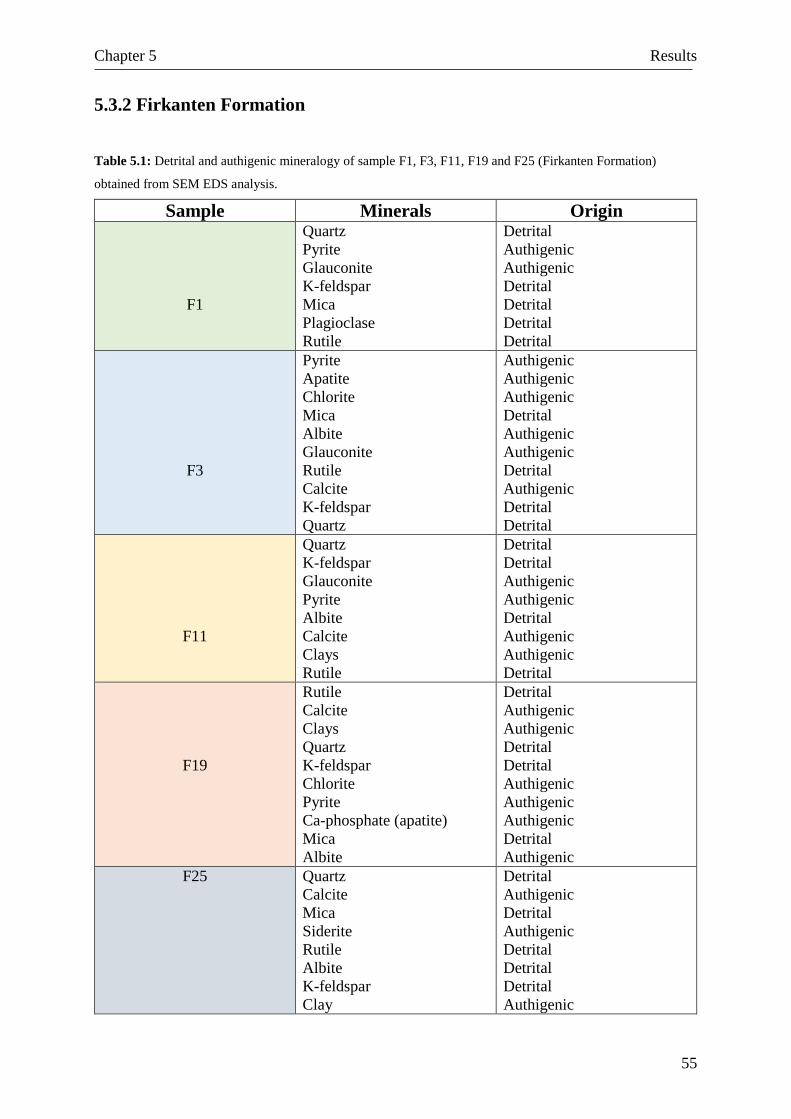
Chapter 5 Results
55
5.3.2 Firkanten Formation
Table 5.1: Detrital and authigenic mineralogy of sample F1, F3, F11, F19 and F25 (Firkanten Formation)
obtained from SEM EDS analysis.
Sample Minerals Origin
F1
Quartz
Pyrite
Glauconite
K-feldspar
Mica
Plagioclase
Rutile
Detrital
Authigenic
Authigenic
Detrital
Detrital
Detrital
Detrital
F3
Pyrite
Apatite
Chlorite
Mica
Albite
Glauconite
Rutile
Calcite
K-feldspar
Quartz
Authigenic
Authigenic
Authigenic
Detrital
Authigenic
Authigenic
Detrital
Authigenic
Detrital
Detrital
F11
Quartz
K-feldspar
Glauconite
Pyrite
Albite
Calcite
Clays
Rutile
Detrital
Detrital
Authigenic
Authigenic
Detrital
Authigenic
Authigenic
Detrital
F19
Rutile
Calcite
Clays
Quartz
K-feldspar
Chlorite
Pyrite
Ca-phosphate (apatite)
Mica
Albite
Detrital
Authigenic
Authigenic
Detrital
Detrital
Authigenic
Authigenic
Authigenic
Detrital
Authigenic
F25 Quartz
Calcite
Mica
Siderite
Rutile
Albite
K-feldspar
Clay
Detrital
Authigenic
Detrital
Authigenic
Detrital
Detrital
Detrital
Authigenic
Chapter 5 Results
56
Detrital sandstone composition
The analysed samples of the Firkanten Formation compose grain sizes ranging from very fine-
medium sand, in which the majority of the samples composes fine grain-sizes. Furthermore, the
thin section analysis suggests presence of several intervals of shallowing-upwards (i.e.
parasequences; Fig. 5.17). The latter observation is consistent with the sedimentary log (see
section 5.1.2) and XRF-analysis (see section 5.2.2). The sandstones are generally well-very
well sorted; the uppermost part of the core is moderately-well sorted. The quartz grains are
commonly subangular rounded, suggesting deposition close to the source area.
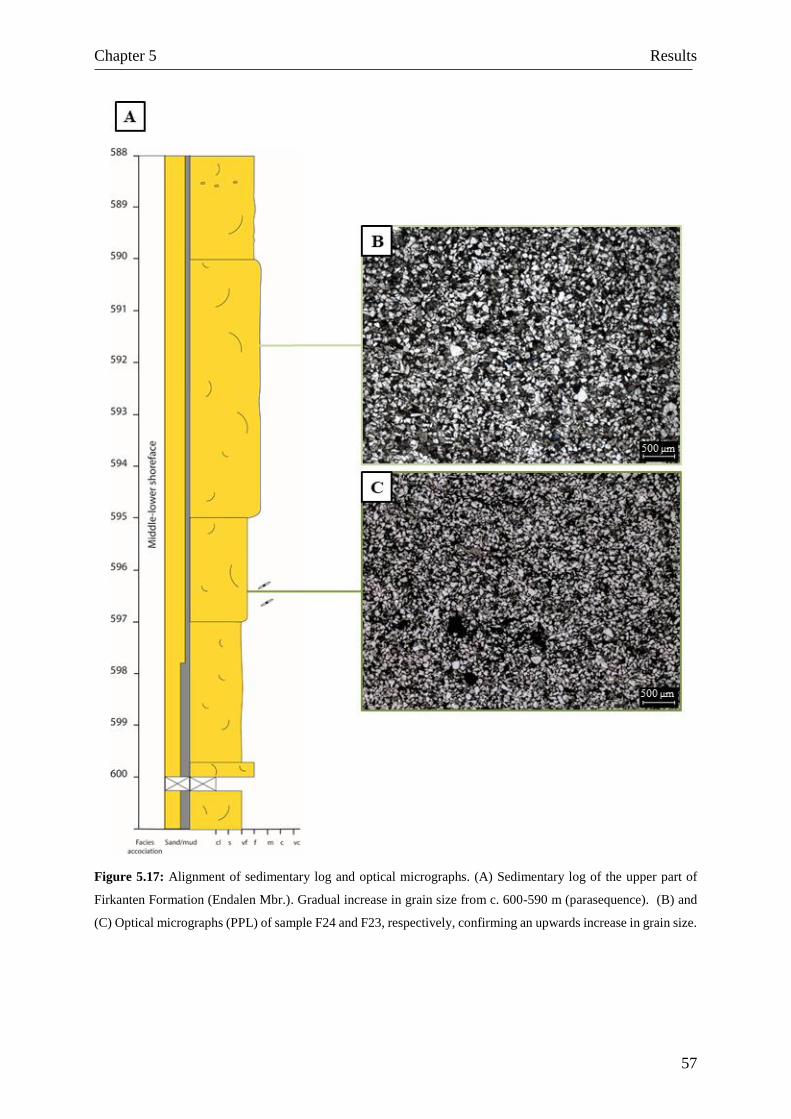
Chapter 5 Results
57
Figure 5.17: Alignment of sedimentary log and optical micrographs. (A) Sedimentary log of the upper part of
Firkanten Formation (Endalen Mbr.). Gradual increase in grain size from c. 600-590 m (parasequence). (B) and
(C) Optical micrographs (PPL) of sample F24 and F23, respectively, confirming an upwards increase in grain size.
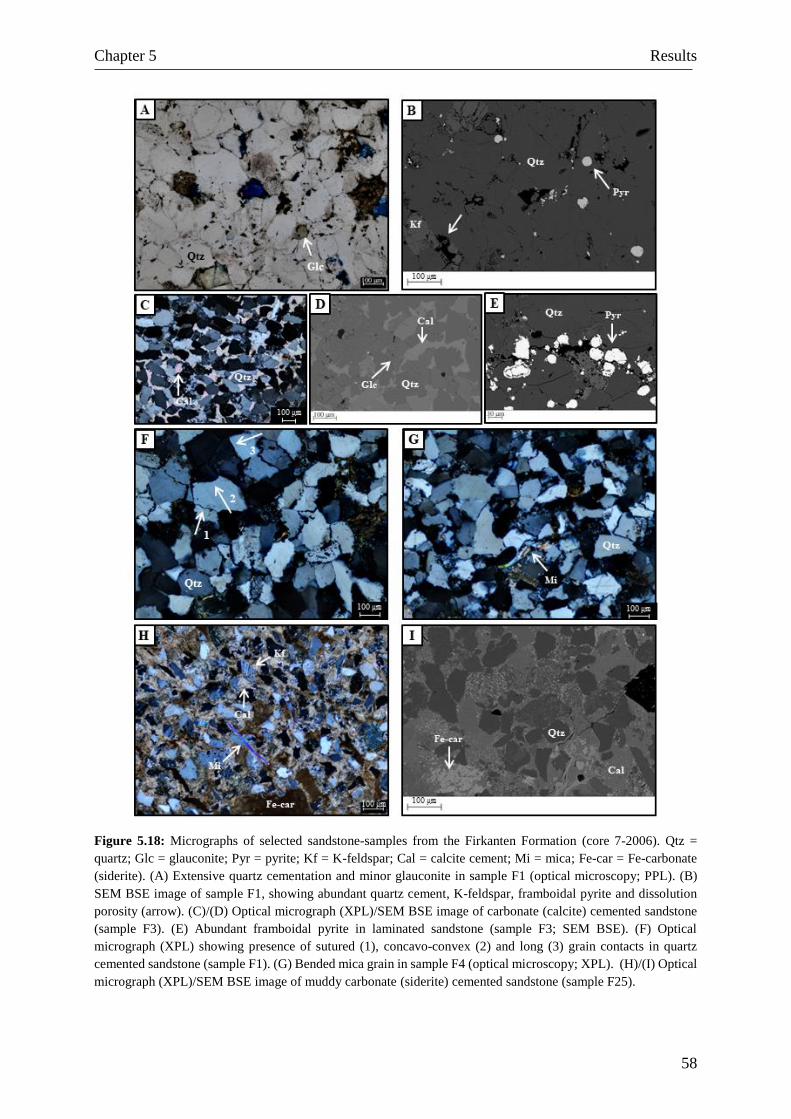
Chapter 5 Results
58
Figure 5.18: Micrographs of selected sandstone-samples from the Firkanten Formation (core 7-2006). Qtz =
quartz; Glc = glauconite; Pyr = pyrite; Kf = K-feldspar; Cal = calcite cement; Mi = mica; Fe-car = Fe-carbonate
(siderite). (A) Extensive quartz cementation and minor glauconite in sample F1 (optical microscopy; PPL). (B)
SEM BSE image of sample F1, showing abundant quartz cement, K-feldspar, framboidal pyrite and dissolution
porosity (arrow). (C)/(D) Optical micrograph (XPL)/SEM BSE image of carbonate (calcite) cemented sandstone
(sample F3). (E) Abundant framboidal pyrite in laminated sandstone (sample F3; SEM BSE). (F) Optical
micrograph (XPL) showing presence of sutured (1), concavo-convex (2) and long (3) grain contacts in quartz
cemented sandstone (sample F1). (G) Bended mica grain in sample F4 (optical microscopy; XPL). (H)/(I) Optical
micrograph (XPL)/SEM BSE image of muddy carbonate (siderite) cemented sandstone (sample F25).
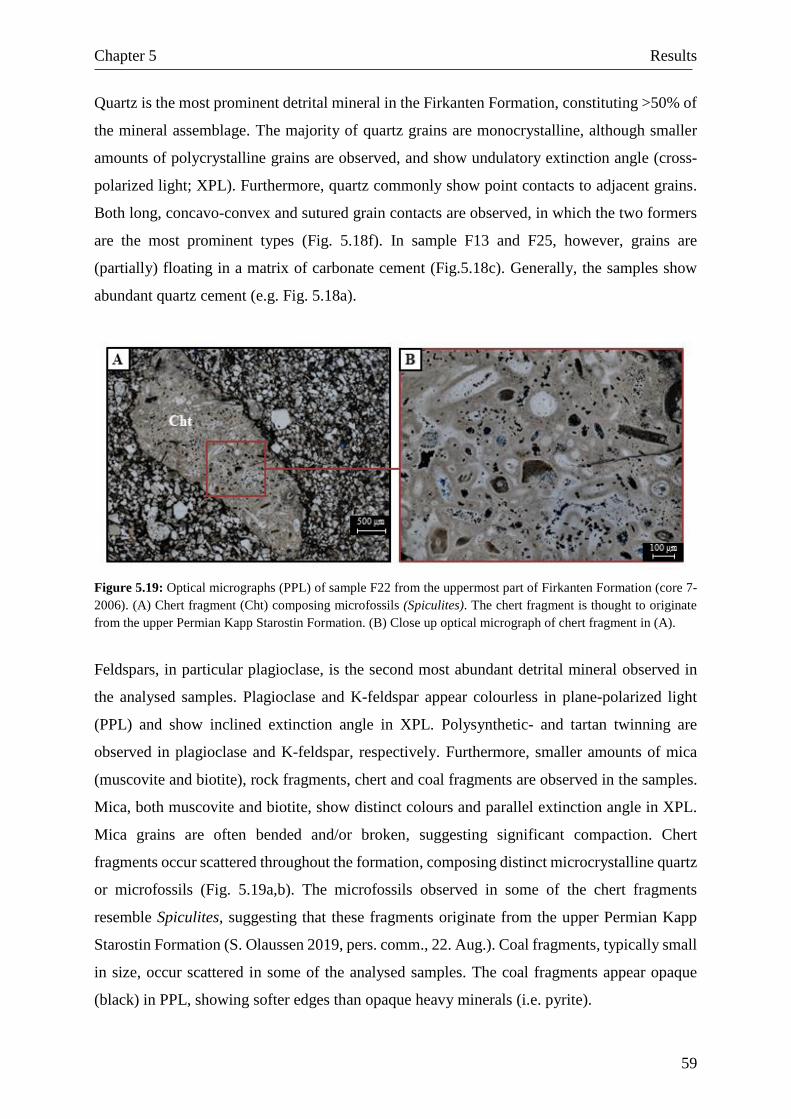
Chapter 5 Results
59
Quartz is the most prominent detrital mineral in the Firkanten Formation, constituting >50% of
the mineral assemblage. The majority of quartz grains are monocrystalline, although smaller
amounts of polycrystalline grains are observed, and show undulatory extinction angle (cross-
polarized light; XPL). Furthermore, quartz commonly show point contacts to adjacent grains.
Both long, concavo-convex and sutured grain contacts are observed, in which the two formers
are the most prominent types (Fig. 5.18f). In sample F13 and F25, however, grains are
(partially) floating in a matrix of carbonate cement (Fig.5.18c). Generally, the samples show
abundant quartz cement (e.g. Fig. 5.18a).
Figure 5.19: Optical micrographs (PPL) of sample F22 from the uppermost part of Firkanten Formation (core 7-
2006). (A) Chert fragment (Cht) composing microfossils (Spiculites). The chert fragment is thought to originate
from the upper Permian Kapp Starostin Formation. (B) Close up optical micrograph of chert fragment in (A).
Feldspars, in particular plagioclase, is the second most abundant detrital mineral observed in
the analysed samples. Plagioclase and K-feldspar appear colourless in plane-polarized light
(PPL) and show inclined extinction angle in XPL. Polysynthetic- and tartan twinning are
observed in plagioclase and K-feldspar, respectively. Furthermore, smaller amounts of mica
(muscovite and biotite), rock fragments, chert and coal fragments are observed in the samples.
Mica, both muscovite and biotite, show distinct colours and parallel extinction angle in XPL.
Mica grains are often bended and/or broken, suggesting significant compaction. Chert
fragments occur scattered throughout the formation, composing distinct microcrystalline quartz
or microfossils (Fig. 5.19a,b). The microfossils observed in some of the chert fragments
resemble Spiculites, suggesting that these fragments originate from the upper Permian Kapp
Starostin Formation (S. Olaussen 2019, pers. comm., 22. Aug.). Coal fragments, typically small
in size, occur scattered in some of the analysed samples. The coal fragments appear opaque
(black) in PPL, showing softer edges than opaque heavy minerals (i.e. pyrite).
Chapter 5 Results
60
Authigenic mineralogy
The sandstones of the Firkanten Formation, representing coastal plain to shallow-marine
deposits, are strongly influenced by compaction and cementation. Mechanical compaction,
evidenced by dense grain packing and bending/breakage of mica, resulted in low porosity
values, ranging from absent to approximately 5%. In addition, extensive quartz cementation
probably played an important role in destroying porosity. The highest porosity value
(approximately 5%) was estimated in sample F5, constituting upper shoreface-foreshore
deposits (Fig. 5.2).
Authigenic quartz and calcite are the most prominent cement types, although smaller amounts
of other authigenic minerals occur, including pyrite, glauconite, kaolinite and albite. Quartz
cement, forming syntaxial overgrowths on the detrital quartz grains, locally fills the pore spaces
between quartz and adjoining grains. Calcite occurs as extensive, continuous pore-filling
cement, varying from absent in some samples to abundant in other samples (e.g. sample F3;
Fig. 5.18c). Pyrite occurs as scattered euhedral grains or in clusters of euhedral and/or
framboidal pyrite (Fig. 5.18b,e). Furthermore, authigenic pyrite seems to be more abundant in
the lowermost part of the formation, although scattered grains are observed in most of the
samples (except for in sample F25). Minor glauconite, appearing greenish in PPL, are observed
in the lowermost part of the Firkanten Formation. Although a clear identification of glauconite
was difficult, the greenish colour of the mineral (PPL) indicates presence of glauconite.
Furthermore, Lüthje (2008) describes glauconite in the lowermost part of the Firkanten
Formation, supporting the latter interpretation. Dissolution porosity is sometimes observed in
K-feldspar grains (Fig. 5.18b).
SEM- (Table 5.1) and XRD-analyses (Appendix II) suggests presence of phosphate minerals,
including apatite, Al-phosphate and Ba-phosphate, and Ti-oxides (rutile). The shape of the
rutile grains, however, indicate a rather detrital origin. Phosphate is commonly observed within
other minerals, typically chert fragments and quartz. Furthermore, XRD-analysis indicate
presence of kaolinite, ankerite and illite/muscovite (Appendix II). Due to the small grain size
of illite (reffered to as “clays” in table 5.1), mixing with other phases and low-resolution images,
a clear identification of this mineral was not possible in SEM. Finally, SEM-analysis reveals
presence of possible siderite in the uppermost part of the formation (sample F25; Fig. 5.18i).
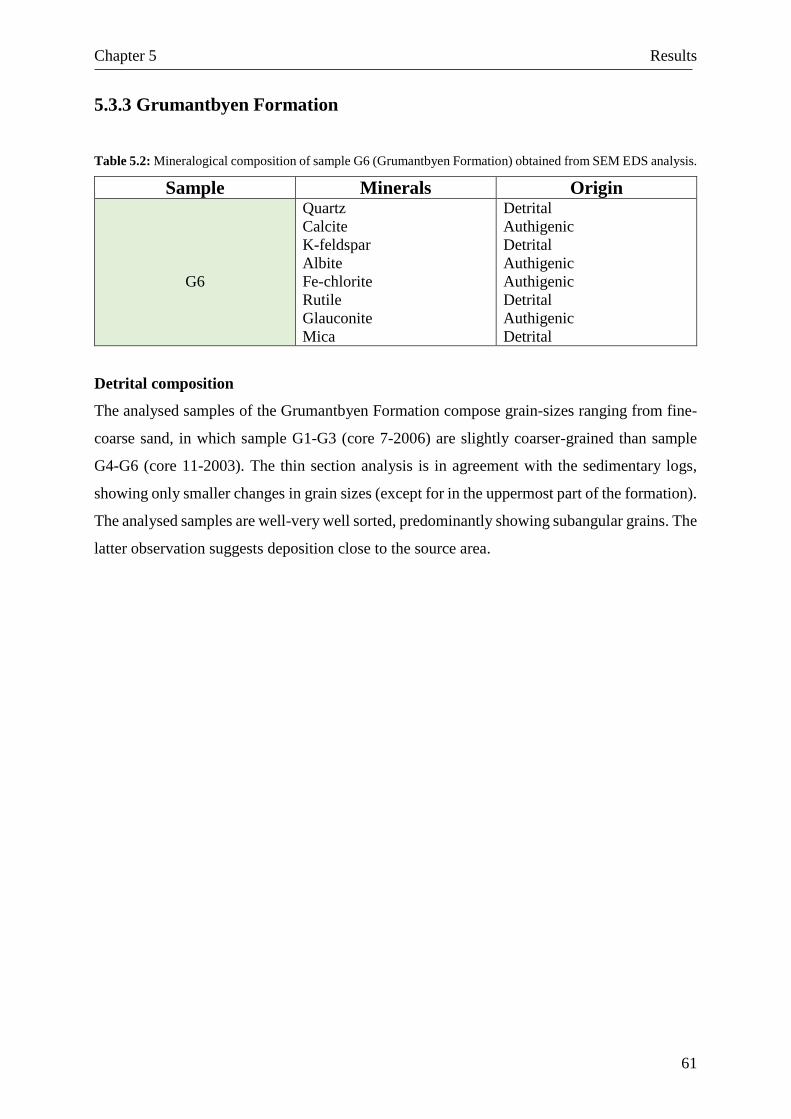
Chapter 5 Results
61
5.3.3 Grumantbyen Formation
Table 5.2: Mineralogical composition of sample G6 (Grumantbyen Formation) obtained from SEM EDS analysis.
Sample Minerals Origin
G6
Quartz
Calcite
K-feldspar
Albite
Fe-chlorite
Rutile
Glauconite
Mica
Detrital
Authigenic
Detrital
Authigenic
Authigenic
Detrital
Authigenic
Detrital
Detrital composition
The analysed samples of the Grumantbyen Formation compose grain-sizes ranging from fine-
coarse sand, in which sample G1-G3 (core 7-2006) are slightly coarser-grained than sample
G4-G6 (core 11-2003). The thin section analysis is in agreement with the sedimentary logs,
showing only smaller changes in grain sizes (except for in the uppermost part of the formation).
The analysed samples are well-very well sorted, predominantly showing subangular grains. The
latter observation suggests deposition close to the source area.
Chapter 5 Results
62
Figure 5.20: Micrographs of selected sandstone-samples of the Grumantbyen Formation (cores 7-2006 and 11-
2003). Qtz = quartz; PS = pore space; QO = quartz overgrowth; Chl = chlorite; Cal = calcite; Glc = glauconite; RF
= rock fragment; Mi = mica; Kf = K-feldspar; Ab = albite; Rt = rutile. (A) Optical micrograph (PPL) of gravelly
sandstone (sample G1; core 7-2006). The relatively high porosity-values of the sandstone may be ascribed to the
presence of grain-coating chlorite. (B) Optical micrograph (PPL) of discontinuous grain-coating chlorite in sample
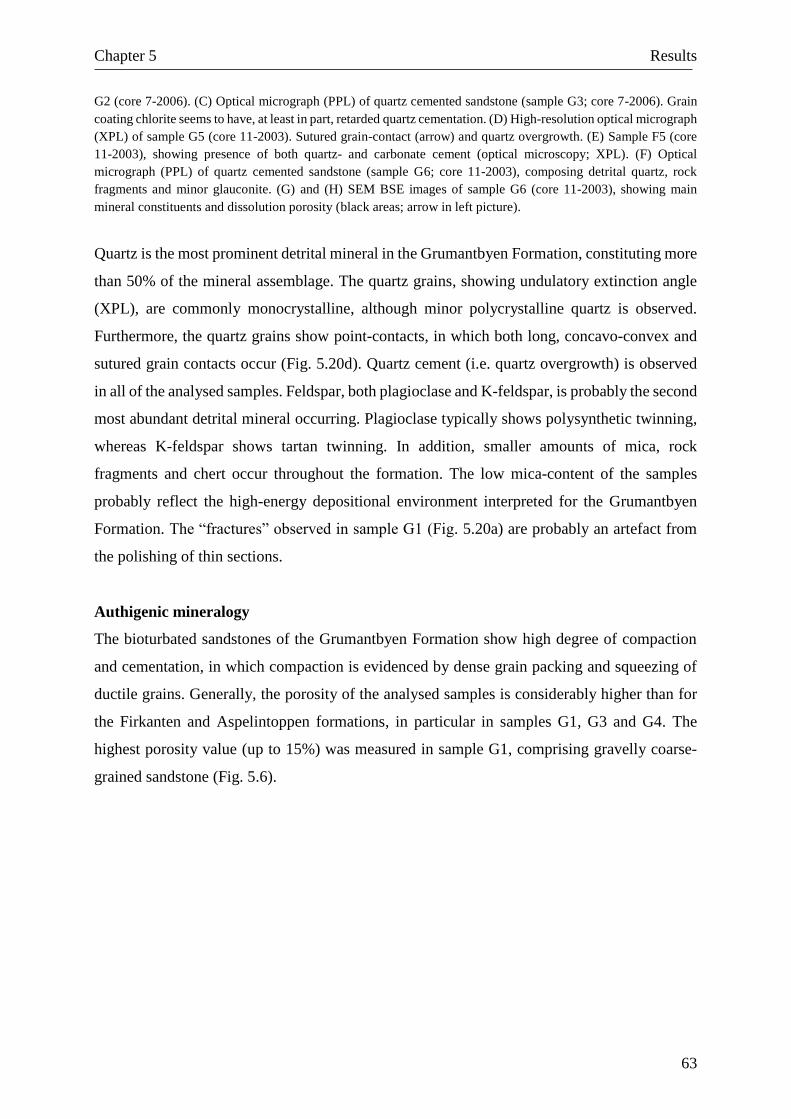
Chapter 5 Results
63
G2 (core 7-2006). (C) Optical micrograph (PPL) of quartz cemented sandstone (sample G3; core 7-2006). Grain
coating chlorite seems to have, at least in part, retarded quartz cementation. (D) High-resolution optical micrograph
(XPL) of sample G5 (core 11-2003). Sutured grain-contact (arrow) and quartz overgrowth. (E) Sample F5 (core
11-2003), showing presence of both quartz- and carbonate cement (optical microscopy; XPL). (F) Optical
micrograph (PPL) of quartz cemented sandstone (sample G6; core 11-2003), composing detrital quartz, rock
fragments and minor glauconite. (G) and (H) SEM BSE images of sample G6 (core 11-2003), showing main
mineral constituents and dissolution porosity (black areas; arrow in left picture).
Quartz is the most prominent detrital mineral in the Grumantbyen Formation, constituting more
than 50% of the mineral assemblage. The quartz grains, showing undulatory extinction angle
(XPL), are commonly monocrystalline, although minor polycrystalline quartz is observed.
Furthermore, the quartz grains show point-contacts, in which both long, concavo-convex and
sutured grain contacts occur (Fig. 5.20d). Quartz cement (i.e. quartz overgrowth) is observed
in all of the analysed samples. Feldspar, both plagioclase and K-feldspar, is probably the second
most abundant detrital mineral occurring. Plagioclase typically shows polysynthetic twinning,
whereas K-feldspar shows tartan twinning. In addition, smaller amounts of mica, rock
fragments and chert occur throughout the formation. The low mica-content of the samples
probably reflect the high-energy depositional environment interpreted for the Grumantbyen
Formation. The “fractures” observed in sample G1 (Fig. 5.20a) are probably an artefact from
the polishing of thin sections.
Authigenic mineralogy
The bioturbated sandstones of the Grumantbyen Formation show high degree of compaction
and cementation, in which compaction is evidenced by dense grain packing and squeezing of
ductile grains. Generally, the porosity of the analysed samples is considerably higher than for
the Firkanten and Aspelintoppen formations, in particular in samples G1, G3 and G4. The
highest porosity value (up to 15%) was measured in sample G1, comprising gravelly coarse-
grained sandstone (Fig. 5.6).
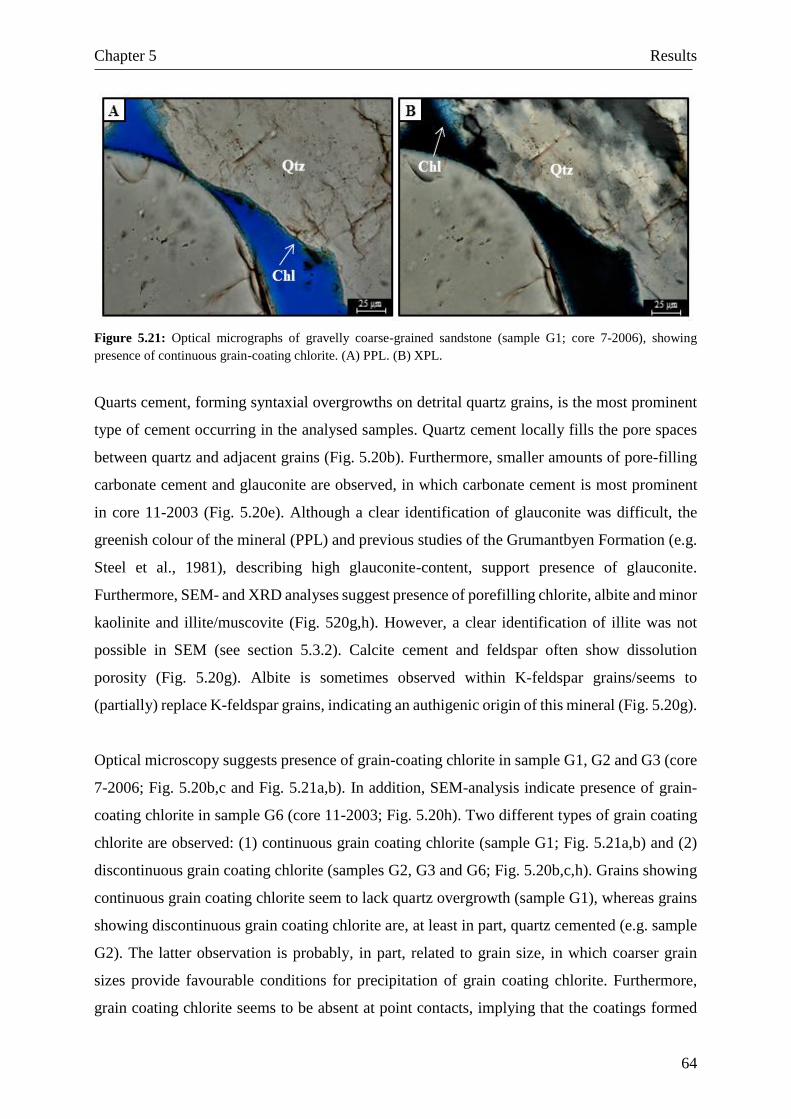
Chapter 5 Results
64
Figure 5.21: Optical micrographs of gravelly coarse-grained sandstone (sample G1; core 7-2006), showing
presence of continuous grain-coating chlorite. (A) PPL. (B) XPL.
Quarts cement, forming syntaxial overgrowths on detrital quartz grains, is the most prominent
type of cement occurring in the analysed samples. Quartz cement locally fills the pore spaces
between quartz and adjacent grains (Fig. 5.20b). Furthermore, smaller amounts of pore-filling
carbonate cement and glauconite are observed, in which carbonate cement is most prominent
in core 11-2003 (Fig. 5.20e). Although a clear identification of glauconite was difficult, the
greenish colour of the mineral (PPL) and previous studies of the Grumantbyen Formation (e.g.
Steel et al., 1981), describing high glauconite-content, support presence of glauconite.
Furthermore, SEM- and XRD analyses suggest presence of porefilling chlorite, albite and minor
kaolinite and illite/muscovite (Fig. 520g,h). However, a clear identification of illite was not
possible in SEM (see section 5.3.2). Calcite cement and feldspar often show dissolution
porosity (Fig. 5.20g). Albite is sometimes observed within K-feldspar grains/seems to
(partially) replace K-feldspar grains, indicating an authigenic origin of this mineral (Fig. 5.20g).
Optical microscopy suggests presence of grain-coating chlorite in sample G1, G2 and G3 (core
7-2006; Fig. 5.20b,c and Fig. 5.21a,b). In addition, SEM-analysis indicate presence of grain-
coating chlorite in sample G6 (core 11-2003; Fig. 5.20h). Two different types of grain coating
chlorite are observed: (1) continuous grain coating chlorite (sample G1; Fig. 5.21a,b) and (2)
discontinuous grain coating chlorite (samples G2, G3 and G6; Fig. 5.20b,c,h). Grains showing
continuous grain coating chlorite seem to lack quartz overgrowth (sample G1), whereas grains
showing discontinuous grain coating chlorite are, at least in part, quartz cemented (e.g. sample
G2). The latter observation is probably, in part, related to grain size, in which coarser grain
sizes provide favourable conditions for precipitation of grain coating chlorite. Furthermore,
grain coating chlorite seems to be absent at point contacts, implying that the coatings formed
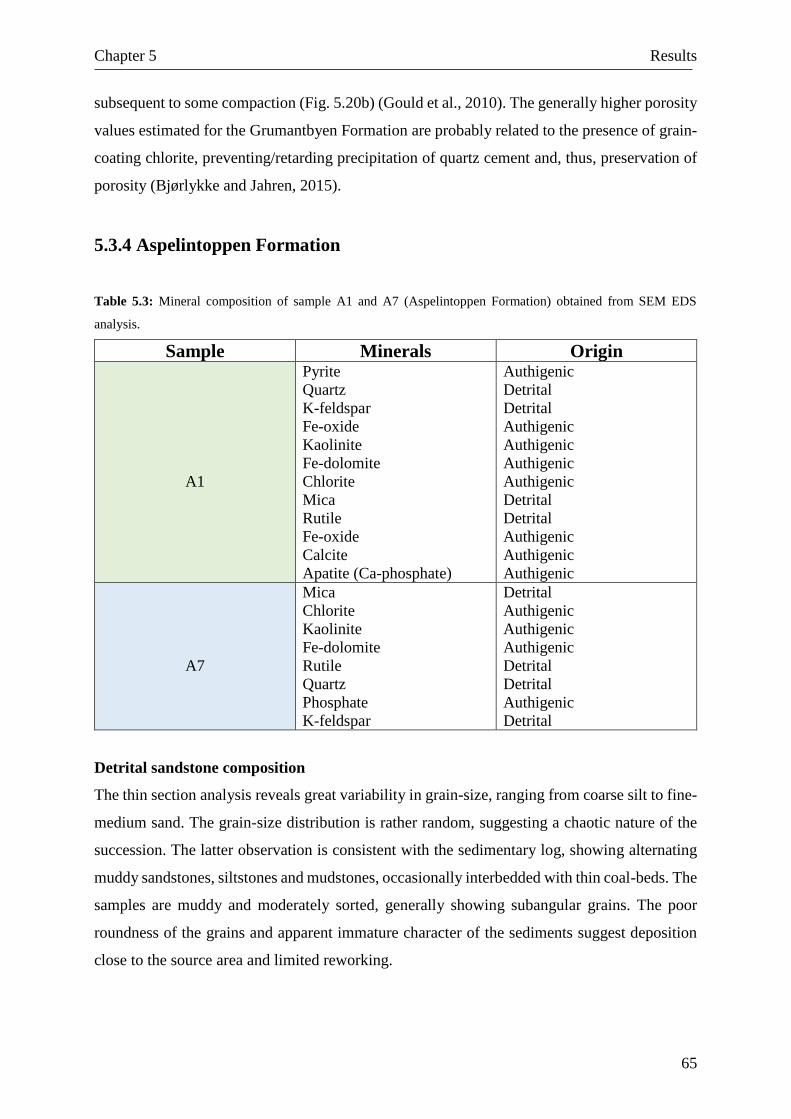
Chapter 5 Results
65
subsequent to some compaction (Fig. 5.20b) (Gould et al., 2010). The generally higher porosity
values estimated for the Grumantbyen Formation are probably related to the presence of grain-
coating chlorite, preventing/retarding precipitation of quartz cement and, thus, preservation of
porosity (Bjørlykke and Jahren, 2015).
5.3.4 Aspelintoppen Formation
Table 5.3: Mineral composition of sample A1 and A7 (Aspelintoppen Formation) obtained from SEM EDS
analysis.
Sample Minerals Origin
A1
Pyrite
Quartz
K-feldspar
Fe-oxide
Kaolinite
Fe-dolomite
Chlorite
Mica
Rutile
Fe-oxide
Calcite
Apatite (Ca-phosphate)
Authigenic
Detrital
Detrital
Authigenic
Authigenic
Authigenic
Authigenic
Detrital
Detrital
Authigenic
Authigenic
Authigenic
A7
Mica
Chlorite
Kaolinite
Fe-dolomite
Rutile
Quartz
Phosphate
K-feldspar
Detrital
Authigenic
Authigenic
Authigenic
Detrital
Detrital
Authigenic
Detrital
Detrital sandstone composition
The thin section analysis reveals great variability in grain-size, ranging from coarse silt to fine-
medium sand. The grain-size distribution is rather random, suggesting a chaotic nature of the
succession. The latter observation is consistent with the sedimentary log, showing alternating
muddy sandstones, siltstones and mudstones, occasionally interbedded with thin coal-beds. The
samples are muddy and moderately sorted, generally showing subangular grains. The poor
roundness of the grains and apparent immature character of the sediments suggest deposition
close to the source area and limited reworking.
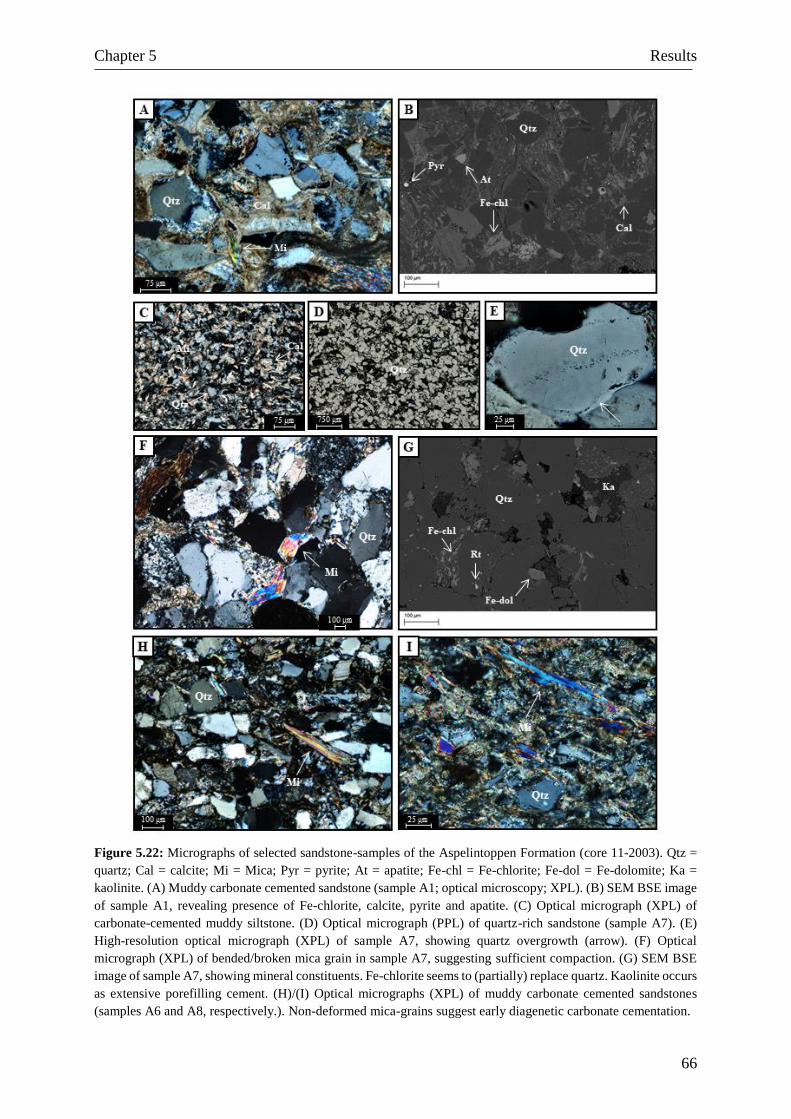
Chapter 5 Results
66
Figure 5.22: Micrographs of selected sandstone-samples of the Aspelintoppen Formation (core 11-2003). Qtz =
quartz; Cal = calcite; Mi = Mica; Pyr = pyrite; At = apatite; Fe-chl = Fe-chlorite; Fe-dol = Fe-dolomite; Ka =
kaolinite. (A) Muddy carbonate cemented sandstone (sample A1; optical microscopy; XPL). (B) SEM BSE image
of sample A1, revealing presence of Fe-chlorite, calcite, pyrite and apatite. (C) Optical micrograph (XPL) of
carbonate-cemented muddy siltstone. (D) Optical micrograph (PPL) of quartz-rich sandstone (sample A7). (E)
High-resolution optical micrograph (XPL) of sample A7, showing quartz overgrowth (arrow). (F) Optical
micrograph (XPL) of bended/broken mica grain in sample A7, suggesting sufficient compaction. (G) SEM BSE
image of sample A7, showing mineral constituents. Fe-chlorite seems to (partially) replace quartz. Kaolinite occurs
as extensive porefilling cement. (H)/(I) Optical micrographs (XPL) of muddy carbonate cemented sandstones
(samples A6 and A8, respectively.). Non-deformed mica-grains suggest early diagenetic carbonate cementation.
Chapter 5 Results
67
The amount of detrital quartz varies significantly throughout the formation, from very small
amounts in some samples (e.g. sample A8; Fig. 5.22i) to around 50% in other samples (e.g.
sample A7; Fig. 5.22d). The majority of grains are monocrystalline, although polycrystalline
quartz occurs, and show undulatory extinction angle in XPL. Quartz overgrowth is observed in
most of the samples, notably in the quartz-rich sandstones. Furthermore, varying amounts of
feldspar (both plagioclase and K-feldspar) occur. The feldspar-content, however, are generally
low compared to the underlying formations, notably the Firkanten Formation. The latter
observation may be related to the formation of early diagenetic kaolinite at the expense of k-
feldspar. Generally, the thin section analysis shows high mica-content throughout the
formation, reflecting the low-energy depositional setting interpreted for the Aspelintoppen
Formation. Most of the samples show point contacts; the muddiest samples and/or samples
showing abundant carbonate-cement are matrix supported or show a combination of point
contacts and floating grains (e.g. sample A8; Fig. 5.22i).
Figure 5.23: Optical micrographs of muddy, mica-rich sandstone (sample A4; core 11-2003). (A) PPL. (B)
Styolitisation (arrows), causing additional loss of volume and porosity (XPL).
Authigenic mineralogy
The muddy sandstones of the Aspelintoppen Formation show high degree of compaction and
cementation. Mechanical compaction is evidenced by dense grain packing and, sometimes,
bending of mica grains (Fig. 5.22f). The thin section analysis suggests extremely low porosity
values for the succession, ranging from absent to 1-2%. The highest porosity value
(approximately 2%) was estimated in sample A7, constituting moderately-well sorted fine-
medium grained sandstone.
Chapter 5 Results
68
Authigenic quartz, carbonate and kaolinite are the most prominent cement types occurring in
the Aspelintoppen Formation. Quartz cement, forming syntaxial overgrowths on the detrital
quartz grains, locally fills the pore spaces between quartz and adjacent grains. Although
observed in most of the analysed samples, quartz cement is more abundant in sandstones rich
in detrital quartz and/or showing little carbonate cement (e.g. sample A7; Fig. 5.22d,e).
Carbonate cement contains both Fe-dolomite and calcite, in which Fe-dolomite commonly
occurs as relatively large grains (Fig. 5.22g). In the very muddy sandstone-samples, calcite
cement seems to be (partially) “hidden” behind clayey material (e.g. Fig. 5.22i). Generally,
carbonate cement is abundant in all of the analysed samples, except for in sample A7. High
intergranular volumes in these samples suggest early diagenetic origin of the carbonate cement.
The presence of “non-deformed” mica grains support the latter assertion, in which early
diagenetic carbonate cement “stiffen” the sediment at shallow burial (Fig. 5.22h,i) (Worden and
Burley, 2003). Furthermore, muddy, mica-rich sandstones sometimes show evidence of
styolitisation (e.g. sample A4; Fig. 5.23a,b).
Porefilling kaolinite, appearing dark grey in SEM BSE, is probably an alteration product of
detrital K-feldspar (Fig. 5.22g). Furthermore, SEM- and XRD-analyses reveal presence of
chlorite and minor pyrite and apatite. Chlorite is observed either as (1) relatively large fibrous
grains occupying pore spaces (Fig. 5.22b) or (2) partially replacing detrital quartz grains (Fig.
5.22g). Pyrite occurs as scattered small spherical grains, filling pore spaces between grains,
whereas apatite typically occur within matrix and/or other grains (Fig. 5.22b).
Chapter 6 Discussion
69
6 Discussion
6.1 Introduction
The results obtained from sedimentological, petrographic and geochemical analyses are further
analysed and discussed in the present chapter, aiming to understand the importance of
depositional environment to diagenesis and evaluate the use of authigenic minerals as a
paleothermometer. Large- and small-scale trends in XRF geochemical signatures are assigned
to changes in the sedimentary logs and mineral composition, the authigenic mineralogy of the
Firkanten, Grumantbyen and Aspelintoppen formations are systematically linked to sandstone
composition and depositional environment, and, finally, burial diagenetic signatures are
compared to vitrinite reflectance measurements. Vitrinite reflectance measurements of coals
and organic material from wells 11-2003 and 7-2006 were obtained from the recently published
paper of Dörr et al. (2018).
6.2 Trends in geochemical data (XRF-analysis)
Although the Firkanten, Grumantbyen and Aspelintoppen formations are of different
depositional origin, the geochemical data shows similar large-and small-scale trends.
Generally, increasing Si-concentrations seem to correlate well with increasing sand/mud ratios
(i.e. increasing quartz and feldspar contents) in the sedimentary logs, whereas high Al, Rb and
K contents correlate well with mud-rich intervals. Al is often found as oxides and silicates,
constituting an important component of kaolinite and other clay minerals, whereas Si is mainly
incorporated in quartz and feldspar, justifying the use of these elements as proxies for changes
in lithology and sand/mud ratios.
The repetitive sub-trends in elemental concentrations (Al, Rb, K and Si) observed in the
Endalen Member. (Firkanten Formation) tend to coincide with intervals of shallowing upwards
in the sedimentary log, suggesting that the geochemical signatures of the core may be used to
identify parasequences (Fig. 5.13). The latter is particularly helpful in intensively bioturbated
sandstones such as in the Endalen Member. The geochemical signatures of the Grumantbyen
and Aspelintoppen formations, however, are less distinct and/or continuous than of the
Firkanten Formation. The latter is probably related to the muddy nature and frequent variations
in lithology, and the short interval of study in the Aspelintoppen Formation and Grumantbyen
Chapter 6 Discussion
70
Formation, respectively. Analysis of geochemical signatures is thus preferable for sedimentary
rocks showing rather gradual and continuous changes in lithology and sand/mud ratios.
The present observations and interpretations are in agreement with previous studies of
geochemical signatures in sediment cores (e.g. Schlegel et al., 2013), relating the distribution
of major and trace elements in sandstone- and shale samples to their general mineralogical
compositions. Schlegel et al. (2013) describes higher SiO2 and lower Al2O3 contents in
sandstone samples than shale samples, reflecting the abundance of quartz and feldspar in
sandstones, and aluminous clayey material and mica (muscovite and biotite) in shales,
respectively. Furthermore, the study suggests higher MgO, Fe2O3 and TiO2 values and higher
Cr, Ni, V and Rb contents in the shale-samples, resulting from abundant sheet silicates in the
shales. The higher Rb-content of the shales is consistent with the present study, in which
intervals of increasing sand/mud ratios in the Endalen Member show decreasing Rb values (Fig.
5.13). Finally, the study of Schlegel et al. (2013) relates comparable K2O content of the shales
and most of the sandstones to the incorporation of K in K-feldspar, muscovite and illite (i.e. not
exclusively in clay minerals). The present study, however, suggests that decreasing K-values
correlate well with increasing sand/mud ratios in the Firkanten and Aspelintoppen formations
(Fig. 5.13, Fig. 5.15).
The higher K/Rb element ratio and lower Rb/Sr ratio of the sandstone-samples from the
Firkanten and Grumantbyen formations than the Aspelintoppen Formation (Fig. 5.16) is
consistent with the thin section analysis, showing higher feldspar-contents in the Firkanten and
Grumantbyen formations (see section 5.2.5). Although significantly more abundant in the
Aspelintoppen Formation, XRD-analysis indicated presence of kaolinite also in the Firkanten
and Grumantbyen formations. Formation of illite at the expense of kaolinite at deep burial
depths can thus not be excluded.
6.3 Linking diagenesis to depositional environment
Diagenetic processes (i.e. mechanical/chemical compaction and cementation) are largely
controlled by the detrital composition of sandstones (Bjørlykke, 2001; Morad et al., 2012). The
detrital composition of sandstones, in turn, is a function of depositional environment, transport
and provenance (Bjørlykke and Jahren, 2015). Common diagenetic processes, including
mechanical compaction and formation of pseudomatrix, grain dissolution (e.g. feldspars),
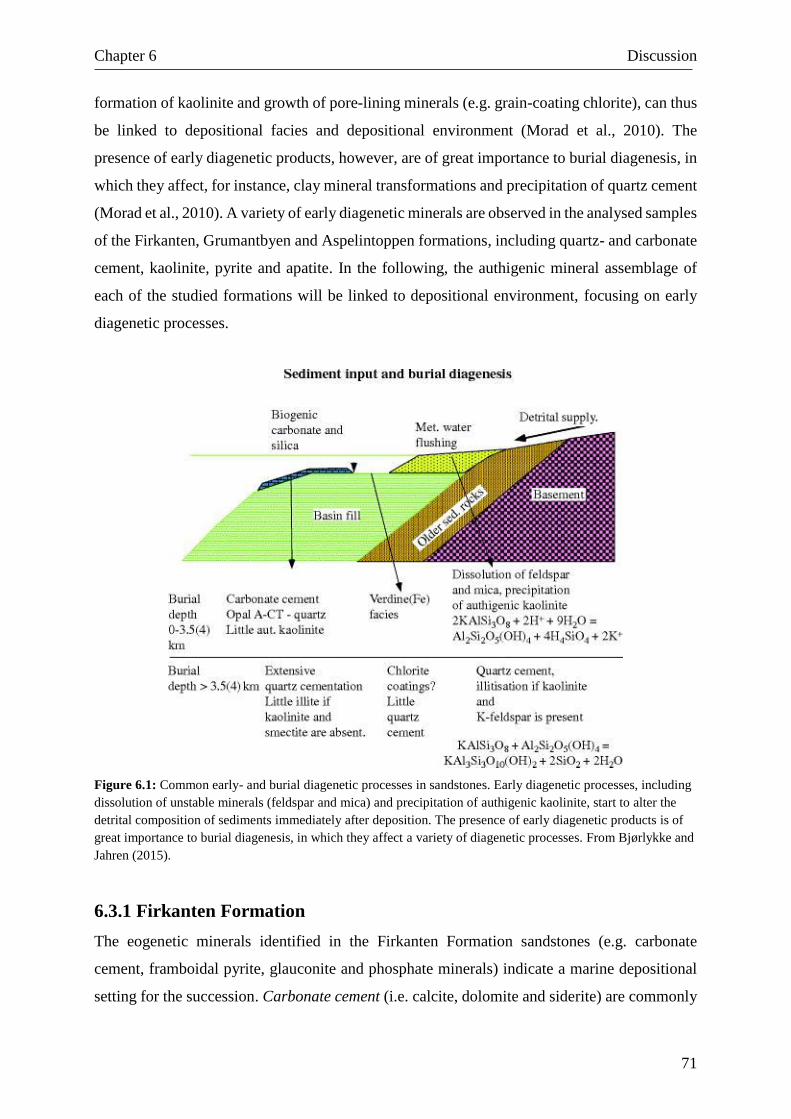
Chapter 6 Discussion
71
formation of kaolinite and growth of pore-lining minerals (e.g. grain-coating chlorite), can thus
be linked to depositional facies and depositional environment (Morad et al., 2010). The
presence of early diagenetic products, however, are of great importance to burial diagenesis, in
which they affect, for instance, clay mineral transformations and precipitation of quartz cement
(Morad et al., 2010). A variety of early diagenetic minerals are observed in the analysed samples
of the Firkanten, Grumantbyen and Aspelintoppen formations, including quartz- and carbonate
cement, kaolinite, pyrite and apatite. In the following, the authigenic mineral assemblage of
each of the studied formations will be linked to depositional environment, focusing on early
diagenetic processes.
Figure 6.1: Common early- and burial diagenetic processes in sandstones. Early diagenetic processes, including
dissolution of unstable minerals (feldspar and mica) and precipitation of authigenic kaolinite, start to alter the
detrital composition of sediments immediately after deposition. The presence of early diagenetic products is of
great importance to burial diagenesis, in which they affect a variety of diagenetic processes. From Bjørlykke and
Jahren (2015).
6.3.1 Firkanten Formation
The eogenetic minerals identified in the Firkanten Formation sandstones (e.g. carbonate
cement, framboidal pyrite, glauconite and phosphate minerals) indicate a marine depositional
setting for the succession. Carbonate cement (i.e. calcite, dolomite and siderite) are commonly
Chapter 6 Discussion
72
related to dissolution and reprecipitation of biogenic carbonate, typically in alkaline waters
(Bjørlykke and Jahren, 2015). Carbonate forms in both eogenetic and mesogenetic regimes, in
which the formation of burial diagenetic carbonate results from recrystallisation of eogenetic
calcite and dolomite in a ferroan form (Worden and Burley, 2003). Carbonate cement,
predominantly non-ferroan calcite, was found to be most prominent in the lowermost samples
(except for in sample F1 and F2), although sporadically occurring throughout the formation.
Early diagenetic calcite cement is not evenly distributed within sandstones; it is rather
concentrated in pore-systems capable of being completely filled (Bjørkum and Walderhaug,
1990). High intergranular volumes (i.e. porosity prior to chemical compaction) in the carbonate
cemented sandstones suggest that carbonate cementation occurred prior to mechanical
compaction (Worden and Burley, 2003).
Furthermore, the thin section analysis suggested presence of siderite in sample F25 (uppermost
part of the Firkanten Formation). Eogenetic siderite commonly forms in iron-rich, partially
reduced systems of minimal marine influence (Worden and Burley, 2003). The apparent lack
of pyrite in sample F25 supports presence of siderite, in which available Fe was, possibly,
incorporated into siderite. The latter indicate deposition in terrestrial/coastal environments
rather than shallow marine environments for the uppermost part of the Firkanten Formation.
The latter assertion is consistent with the sedimentological analysis, suggesting presence of
possible mottling, a coalified piece of wood and ripple-cross lamination (see section 5.1.2). The
relatively abrupt increase in Si-content and accompanying decrease in the Al-, Rb- and K-
concentrations (Fig. 5.13) can thus possibly be ascribed to changing depositional conditions.
Pyrite occurs in all of the analysed samples (except for in sample F25), either as clusters of
framboidal pyrite or scattered euhedral pyrite grains. Pyrite forms in both eogenetic and
mesogenetic regimes, in which burial diagenetic pyrite is coarser than early diagenetic (often
framboidal) pyrite (Worden and Burley, 2003). Pyrite formation, typical for anoxic
environments, is related to the reaction of detrital iron minerals with H2S (sulphide). The H2S,
in turn, originates from the bacterial reduction of dissolved sulphate, in which the bacteria use
organic matter present in the sediment as a reducing agent (Berner, 1984).
Despite the large number of studies, an exclusive model for framboidal pyrite formation is still
not established. Several previous studies (e.g. Wilkin and Barnes, 1997) relate pyrite framboid
formation to the replacement of early diagenetic greigite framboids. Butler and Rickard (2000),
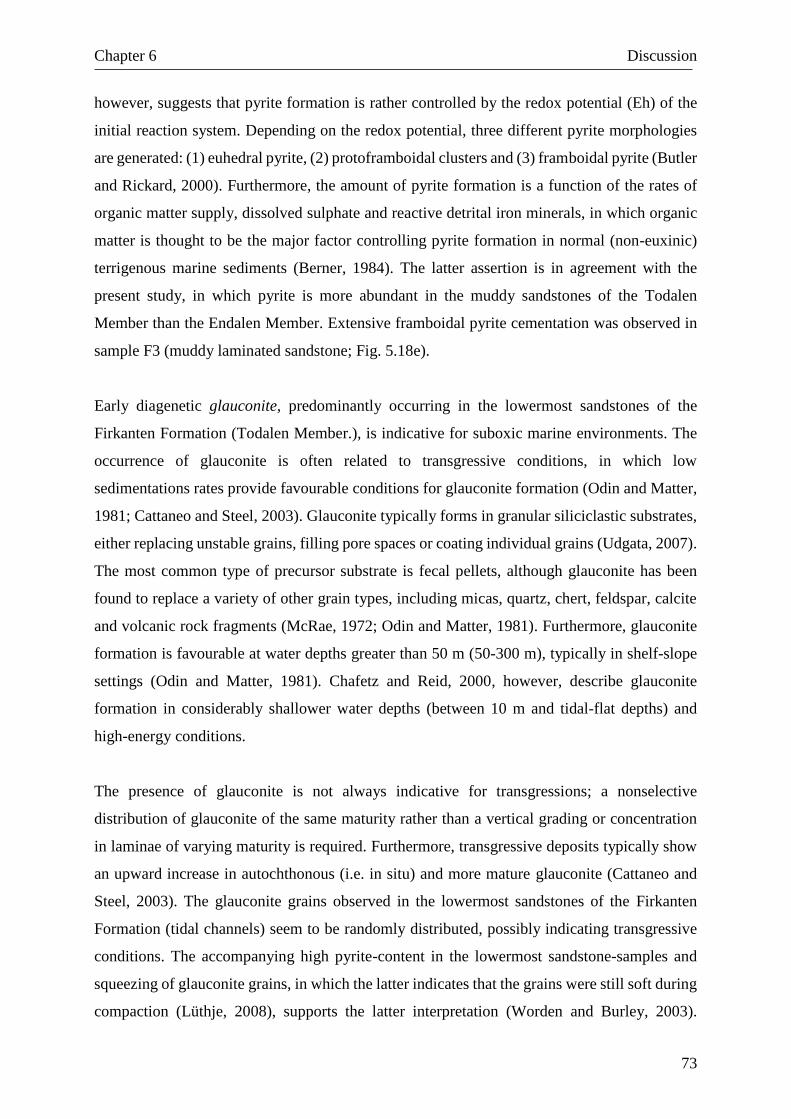
Chapter 6 Discussion
73
however, suggests that pyrite formation is rather controlled by the redox potential (Eh) of the
initial reaction system. Depending on the redox potential, three different pyrite morphologies
are generated: (1) euhedral pyrite, (2) protoframboidal clusters and (3) framboidal pyrite (Butler
and Rickard, 2000). Furthermore, the amount of pyrite formation is a function of the rates of
organic matter supply, dissolved sulphate and reactive detrital iron minerals, in which organic
matter is thought to be the major factor controlling pyrite formation in normal (non-euxinic)
terrigenous marine sediments (Berner, 1984). The latter assertion is in agreement with the
present study, in which pyrite is more abundant in the muddy sandstones of the Todalen
Member than the Endalen Member. Extensive framboidal pyrite cementation was observed in
sample F3 (muddy laminated sandstone; Fig. 5.18e).
Early diagenetic glauconite, predominantly occurring in the lowermost sandstones of the
Firkanten Formation (Todalen Member.), is indicative for suboxic marine environments. The
occurrence of glauconite is often related to transgressive conditions, in which low
sedimentations rates provide favourable conditions for glauconite formation (Odin and Matter,
1981; Cattaneo and Steel, 2003). Glauconite typically forms in granular siliciclastic substrates,
either replacing unstable grains, filling pore spaces or coating individual grains (Udgata, 2007).
The most common type of precursor substrate is fecal pellets, although glauconite has been
found to replace a variety of other grain types, including micas, quartz, chert, feldspar, calcite
and volcanic rock fragments (McRae, 1972; Odin and Matter, 1981). Furthermore, glauconite
formation is favourable at water depths greater than 50 m (50-300 m), typically in shelf-slope
settings (Odin and Matter, 1981). Chafetz and Reid, 2000, however, describe glauconite
formation in considerably shallower water depths (between 10 m and tidal-flat depths) and
high-energy conditions.
The presence of glauconite is not always indicative for transgressions; a nonselective
distribution of glauconite of the same maturity rather than a vertical grading or concentration
in laminae of varying maturity is required. Furthermore, transgressive deposits typically show
an upward increase in autochthonous (i.e. in situ) and more mature glauconite (Cattaneo and
Steel, 2003). The glauconite grains observed in the lowermost sandstones of the Firkanten
Formation (tidal channels) seem to be randomly distributed, possibly indicating transgressive
conditions. The accompanying high pyrite-content in the lowermost sandstone-samples and
squeezing of glauconite grains, in which the latter indicates that the grains were still soft during
compaction (Lüthje, 2008), supports the latter interpretation (Worden and Burley, 2003).
Chapter 6 Discussion
74
Although Chafetz and Reid (2000) describes glauconite formation in tide-influenced
environments, they may have been reworked from a contemporaneous marine environment and
incorporated into the tidal channel deposits (Lüthje, 2008).
6.3.2 Upper part of Grumantbyen Formation
The authigenic mineral assemblage (carbonate cement, glauconite and grain coating chlorite)
of the Grumantbyen Formation sandstones is indicative for marine depositional environments.
The Carbonate cement identified in the analysed samples predominantly composes non-ferroan
calcite, suggesting an early diagenetic origin. Calcite cement was found to be more abundant
in the sandstone samples from core 11-2003 than core 7-2006. Glauconite was observed
scattered throughout the Grumantbyen Formation in both of the cores. Glauconite formation,
however, have previously been discussed in section 6.3.1.
Authigenic chlorite was found to occur in all of the analysed samples, either as porefilling
cement or grain-coatings. Chlorite forms in both eogenetic and mesogenetic regimes, often in
reduced marine waters (Worden and Burley, 2003). Grain coating chlorite was observed in
sample G1, G2 and G3 (core 7-2006), constituting upper shoreface deposits. Chlorite coatings
are thought to retard or prevent later quartz cementation, sometimes resulting in abnormally
high porosity values in deeply buried sandstones. Formation of grain coating chlorite require
(1) a Fe-rich clay mineral precursor (e.g. odinite or berthierine) and (2) a threshold temperature
(90-120oC) (Aagaard et al., 2000; Gould et al., 2010). The formation of berthierine, in turn,
requires presence of labile Fe, for instance from tropical weathering (Ehrenberga et al., 1998)
or volcanic supply (Grigsby, 2001). The experiments of Aagaard et al. (2000) suggests that the
alteration of berthierine to chlorite occurs at about 90 oC, i.e. subsequent to the formation of
quartz overgrowth. The latter implies that early diagenetic berthierine-coatings, rather than
burial diagenetic grain-coating chlorite, are responsible for preventing quartz cementation
(Gould et al., 2010).
Chapter 6 Discussion
75
Figure 6.2: Schematic illustration of grain-coating chlorite. Early diagenetic berthierine-coating, rather than
burial diagenetic chlorite-coating, is responsible for preventing precipitation of quartz cement. The berthierine-
coating is replaced by chlorite at temperatures of 90-120oC, corresponding to intermediate burial depths. From
Bjørlykke and Jahren (2015).
Two different types of grain coating chlorite were observed in the Grumantbyen Formation: (1)
continuous (i.e. high-quality) grain coating chlorite and (2) discontinuous (i.e. low-quality)
grain coating chlorite. Grains showing continuous chlorite-coating seemed to lack quartz
overgrowth, whereas grains showing discontinuous chlorite-coating were found to be, at least
in part, quartz cemented. High-quality chlorite coatings were observed in the massive pebbly
sandstone (sample G1) in core 7-2006 (Fig. 5.20a and Fig. 5.21a,b), whereas low-quality
chlorite coatings were observed in the bioturbated medium-grained sandstones (sample G2, G3
and G6) in cores 7-2006 and 11-2003 (Fig. 5.20b,c,h). The latter observations are in agreement
with previous studies concerning formation of grain-coating chlorite (e.g. Gould et al., 2010),
suggesting that high-quality chlorite rims are restricted to “clean” sandstones, showing few or
no clay-rich laminae, mud drapes or muddy bioturbation. The high porosity and permeability
of “clean” sandstones, in which permeability is enhanced by coarse grain-sizes, provide
conditions favourable for precipitation of early diagenetic berthierine rims.
6.3.3 Aspelintoppen Formation
The early diagenetic minerals (i.e. kaolinite, calcite cement, pyrite, chlorite and apatite)
identified in the muddy sandstones of the Aspelintoppen Formation indicate a mixed terrestrial-
Chapter 6 Discussion
76
marine depositional environment for the formation. Carbonate cement, composing both early
diagenetic calcite and later burial Fe-dolomite, was found to occur in all of the analysed
samples, suggesting marine/brackish influence. Kaolinite formation will be discussed in the
following; the resisting authigenic minerals have previously been discussed in section 6.3.1 and
6.3.2.
Early diagenetic kaolinite, typically forming in warm, wet, low pH environments, is an
alteration product of unstable detrital minerals, often feldspars and micas (Worden and Burley,
2003). The replacement of feldspars and micas by kaolinite is commonly related to meteoric-
water flushing (Mansurbeg et al., 2012). SEM- and XRD analyses revealed presence of
kaolinite in sample A1, A6 and A7. The relatively low feldspar content of the Aspelintoppen
Formation sandstones, however, indicate that kaolinite is probably present throughout the
formation. Recent petrographic studies of cores 11-2003 and 7-2006 (Schlegel et al., 2013)
suggested that authigenic kaolinite is restricted to the Paleocene-Eocene sandstones of the
Battfjellet and Aspelintoppen formations, i.e. absent in the older Paleocene sandstones of the
Firkanten, Basilika and Grumantbyen formations. XRD-analysis performed in the present
study, nevertheless, suggested presence of minor kaolinite in both the Firkanten and
Grumantbyen formations. The lower kaolinite-content of the Firkanten and Grumantbyen
formations may be ascribed to alteration of kaolinite at deep burial depths and/or changing
climatic conditions.
6.3.4 Compaction
Compaction – reduction of volume and resultant pore-water expulsion within sediments –
occurs in response to grain rearrangement, plastic deformation of ductile grains, dissolution and
brittle fracturing, and is a crucial factor controlling the porosity of sandstones at greater burial
depths (Worden and Burley, 2003). The degree of compaction is controlled by burial depth,
fluid pressure and the ratio of brittle to ductile grains, in which the latter factor is strongly
influenced by depositional environment. The sandstones of the Firkanten, upper part of
Grumantbyen and Aspelintoppen formations were found to be strongly influenced by
compaction and cementation, in which compaction is evidenced by dense grain packing,
bending/breakage of mica and squeezing of ductile grains. Furthermore, both long, concavo-
convex and sutured grain contacts were observed in the analysed sandstone-samples, in which
the two formers are the most prominent types. Sutured contacts indicate diagenesis and deep
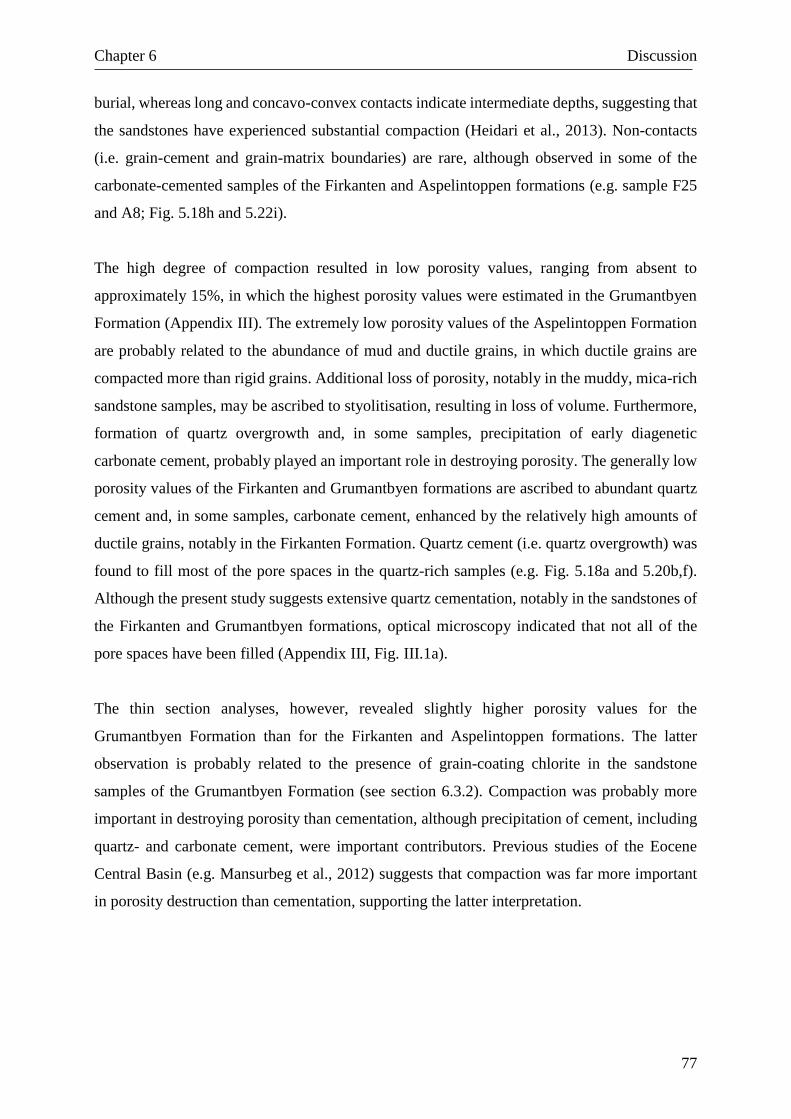
Chapter 6 Discussion
77
burial, whereas long and concavo-convex contacts indicate intermediate depths, suggesting that
the sandstones have experienced substantial compaction (Heidari et al., 2013). Non-contacts
(i.e. grain-cement and grain-matrix boundaries) are rare, although observed in some of the
carbonate-cemented samples of the Firkanten and Aspelintoppen formations (e.g. sample F25
and A8; Fig. 5.18h and 5.22i).
The high degree of compaction resulted in low porosity values, ranging from absent to
approximately 15%, in which the highest porosity values were estimated in the Grumantbyen
Formation (Appendix III). The extremely low porosity values of the Aspelintoppen Formation
are probably related to the abundance of mud and ductile grains, in which ductile grains are
compacted more than rigid grains. Additional loss of porosity, notably in the muddy, mica-rich
sandstone samples, may be ascribed to styolitisation, resulting in loss of volume. Furthermore,
formation of quartz overgrowth and, in some samples, precipitation of early diagenetic
carbonate cement, probably played an important role in destroying porosity. The generally low
porosity values of the Firkanten and Grumantbyen formations are ascribed to abundant quartz
cement and, in some samples, carbonate cement, enhanced by the relatively high amounts of
ductile grains, notably in the Firkanten Formation. Quartz cement (i.e. quartz overgrowth) was
found to fill most of the pore spaces in the quartz-rich samples (e.g. Fig. 5.18a and 5.20b,f).
Although the present study suggests extensive quartz cementation, notably in the sandstones of
the Firkanten and Grumantbyen formations, optical microscopy indicated that not all of the
pore spaces have been filled (Appendix III, Fig. III.1a).
The thin section analyses, however, revealed slightly higher porosity values for the
Grumantbyen Formation than for the Firkanten and Aspelintoppen formations. The latter
observation is probably related to the presence of grain-coating chlorite in the sandstone
samples of the Grumantbyen Formation (see section 6.3.2). Compaction was probably more
important in destroying porosity than cementation, although precipitation of cement, including
quartz- and carbonate cement, were important contributors. Previous studies of the Eocene
Central Basin (e.g. Mansurbeg et al., 2012) suggests that compaction was far more important
in porosity destruction than cementation, supporting the latter interpretation.
Chapter 6 Discussion
78
6.4 Use of authigenic minerals as a paleothermometer
Diagenetic processes in sedimentary rocks are strongly linked to a specific burial depth and
temperature, suggesting that authigenic minerals usually indicates a specific burial depth and
minimum-temperature or temperature interval (Worden and Burley, 2003; Bjørlykke and
Jahren, 2015). Authigenic minerals can thus be used to cross-check temperatures derived from
organic maturity indicators (e.g. vitrinite reflectance); are they telling the same temperature
history? A variety of diagenetic signatures are routinely used in reconstructions of the thermal
history of sedimentary basins, including (1) illite/smectite diagenesis, (2) formation of grain-
coating chlorite, (3) formation of quartz cements, (4) albitization of feldspars (plagioclase and
K-feldspar) and (5) ankerite cement formation, in which the three former are most frequently
used (Haile et al., 2018b).
6.4.1 Burial diagenetic signatures
The authigenic mineral assemblage, high degree of mechanical compaction and low porosity
of the Firkanten, Grumantbyen and Aspelintoppen formations suggests deep burial of the
succession. Burial diagenesis is largely influenced by the amount of fluid flow through the
remaining porosity and the presence of early diagenetic products, in which the latter affect, for
instance, clay mineral transformations and precipitation of quartz cement (Morad et al., 2010).
Quartz cement (i.e. quartz overgrowth) is the most prominent burial diagenetic mineral in the
studied formations, although smaller amounts of albite, grain coating chlorite, Fe-dolomite and
illite/muscovite were found to occur (Table 6.1).
Table 6.1: Burial diagenetic signatures of the Firkanten, Grumantbyen and Aspelintoppen formations.
Formation Burial diagenetic signature Aspelintoppen Quartz overgrowth
Fe-dolomite
Grumantbyen
Quartz overgrowth
Albite
Grain coating chlorite
Illite/muscovite
Firkanten
Quartz overgrowth
Albite
Ankerite
Illite/muscovite
Chapter 6 Discussion
79
The replacement of k-feldspar or plagioclase by diagenetic albite and the growth of grain-
coating chlorite occur at depths greater than 3 km, corresponding to temperatures of about 90-
100oC (Bjørlykke and Jahren, 2015). Clay mineral reactions remove potassium from the
solution, resulting in a relative increase in the Na+ concentration. Albite is thus more stable
than k-feldspar and plagioclase, favoring dissolution of k-feldspar and/or plagioclase and
precipitation of albite. Grain-coating chlorite is suggested to originate from Fe-rich clays,
primarily berthierine (see section 6.3.2).
Quartz cementation (i.e. quartz overgrowths) and formation of illite at the expense of kaolinite
occur at depths greater than 2-2,5 km, corresponding to temperatures of about 70-80oC.
Pervasive illite formation, however, occurs at temperatures greater than 130oC (3-3,5 km to 4-
4,5 km; Worden and Burley, 2003). Quartz cement is thought to originate from a variety of
silica sources, including biogenic silica, mineral transformations (e.g. smectite to illite
reactions) and pressure solution of detrital quartz grains at microstyolites (Xi et al., 2015). The
rate of quartz cementation is largely influenced by temperature; the higher the temperature, the
higher the rate of precipitation. Bjørlykke and Jahren (2015) estimated that the rate of quartz
cementation increases by a factor of 1,7 for every 10 oC temperature increase (Walderhaug,
1996). Quartz cementation does not cease until roughly all the porosity is lost, or the
temperature drops below 70-80oC (Bjørlykke and Jahren, 2015). Sandstones buried to depths
greater than about 3-3,5 km to 4-4,5 km, corresponding to temperatures of about 120 to 160 oC,
thus often show strong reduction in porosity and permeability.
SEM- and XRD-analysis indicated presence of illite in the sandstones of the Firkanten and
Grumantbyen formations, although a clear identification of this mineral was not possible. The
formation of illite at the expense of kaolinite (i.e. illitisation) requires a source of potassium,
commonly K-feldspar (Bjørlykke and Jahren, 2015). In potassium-depleted systems, kaolinite
remains stable at greater burial depths, preventing formation of illite. Illite in low-potassium
sandstones are thought to rather originate from smectite to illite reactions (Bjørlykke and
Jahren, 2015). Illitisation of smectite occurs at temperatures greater than 70-90oC (Worden and
Burley, 2003). However, optical microscopy suggested presence of K-feldspar in all of the
analysed samples, in which it is more abundant in the sandstones of the Firkanten and
Grumantbyen formations than the overlying Aspelintoppen Formation. Authigenic kaolinite,
replacing unstable feldspars and micas at shallow burial depths, predominantly occurs in the
Aspelintoppen Formation, although SEM- and XRD-analysis indicated presence of minor
Chapter 6 Discussion
80
kaolinite in the Firkanten and Grumantbyen formations. The latter observations are consistent
with the geochemical signatures of the formations, in which the sandstone samples of the
Firkanten and Grumantbyen formations (higher feldspar contents) show higher element ratio of
K/Rb and lower Rb/Sr ratio than the Aspelintoppen Formation (lower feldspar contents).
Furthermore, the lower K/Rb and higher Rb/Sr element ratios of the Aspelintoppen Formation
suggest that (1) the initial detrital feldspar-content of the Aspelintoppen Formation was lower
or (2) feldspars have been replaced by other diagenetic minerals (e.g. kaolinite). The abundance
of kaolinite in the Aspelintoppen Formation supports the latter assertion. Although thin section
analyses showed that plagioclase is slightly more abundant than K-feldspar, a source of
potassium, allowing illitisation of kaolinite at greater burial depths, cannot be excluded.
Carbonate cements grow over a wide range of diagenetic conditions. Burial diagenetic
carbonate, originating from recrystallisation of early diagenetic carbonate minerals, composes
coarser grained, locally pore-filling crystals, often of ferroan dolomite. Fe-dolomite grows at
similar or somewhat higher temperatures than illite and quartz cement (about 100oC). The Fe-
dolomite cement identified in the Aspelintoppen Formation resembles the latter description,
indicating a rather burial diagenetic origin of this mineral (Fig. 5.22g).
Although ankerite is a common burial diagenetic mineral in sandstones, it appears in relatively
small amounts (Hendry, 1978) . Ankerite formation is thought to occur at temperatures around
100-110oC (e.g. Morad et al. cited in Haile et al. 2018b). In subsurface Eocene Wilcox
sandstones, however, ankerite was found to occur at depths from 2560 m (125oC) to at least
4650 m (210oC) (Boles, 1978). Radiogenic 87Sr/86Sr values suggest that ankerite formation
occurs subsequent to a certain amount of silicate diagenesis. Furthermore, its formation has
previously been related to mobilization of Mg2+ and Fe2+ following illitisation of smectite and
thermal reduction of ferric oxides (Hendry, 1978).
6.4.2 Vitrinite reflectance studies of coals
Dörr et al. (2018) recently presented a reconstruction of the thermal and erosional history of the
Central Tertiary Basin, utilising core 11-2003 and 7-2006. The study, providing vitrinite
reflectance measurements of coals/organic material, allow comparison of the authigenic
minerals of the Firkanten, Grumantbyen and Aspelintoppen formations with vitrinite
reflectance measurements. The petrographic, chemical and physical properties of macerals (i.e.
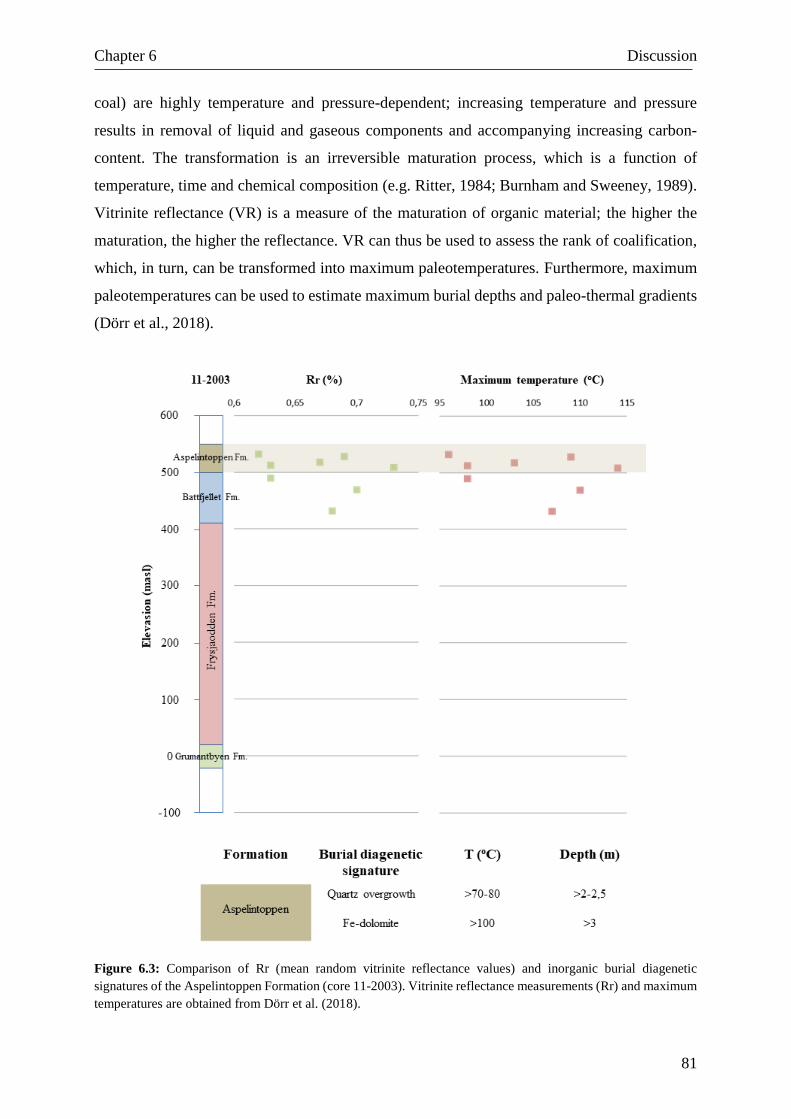
Chapter 6 Discussion
81
coal) are highly temperature and pressure-dependent; increasing temperature and pressure
results in removal of liquid and gaseous components and accompanying increasing carbon-
content. The transformation is an irreversible maturation process, which is a function of
temperature, time and chemical composition (e.g. Ritter, 1984; Burnham and Sweeney, 1989).
Vitrinite reflectance (VR) is a measure of the maturation of organic material; the higher the
maturation, the higher the reflectance. VR can thus be used to assess the rank of coalification,
which, in turn, can be transformed into maximum paleotemperatures. Furthermore, maximum
paleotemperatures can be used to estimate maximum burial depths and paleo-thermal gradients
(Dörr et al., 2018).
Figure 6.3: Comparison of Rr (mean random vitrinite reflectance values) and inorganic burial diagenetic
signatures of the Aspelintoppen Formation (core 11-2003). Vitrinite reflectance measurements (Rr) and maximum
temperatures are obtained from Dörr et al. (2018).
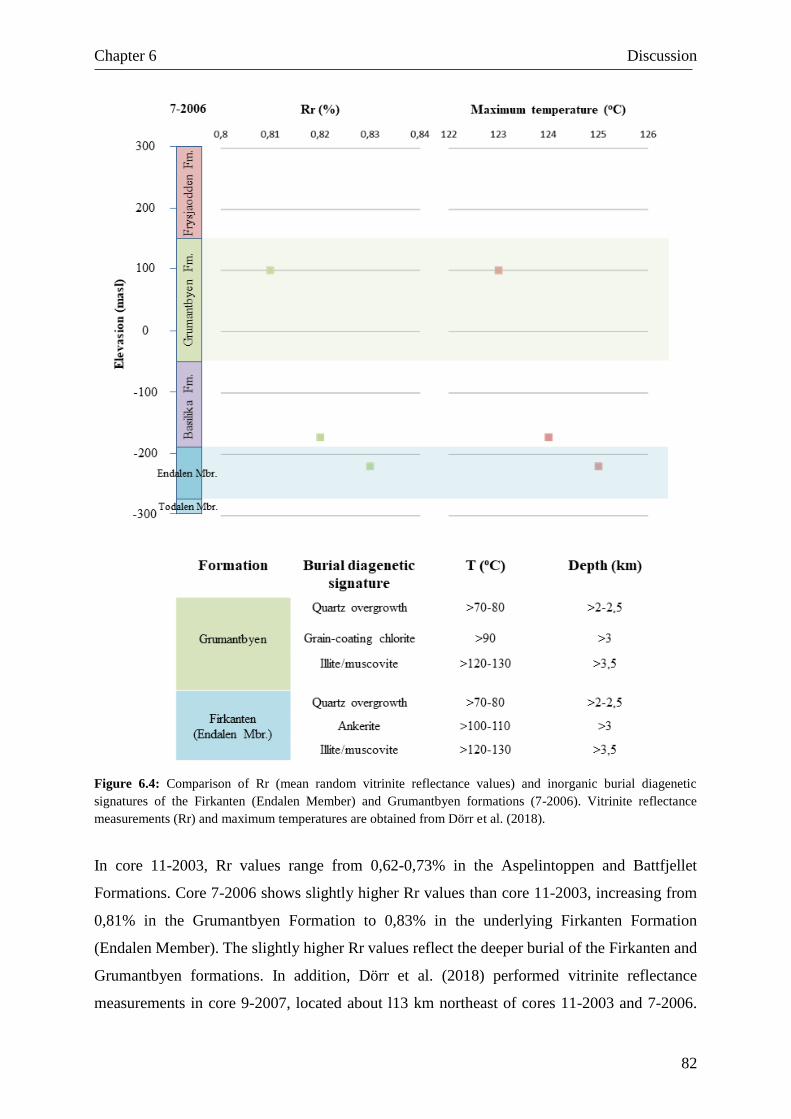
Chapter 6 Discussion
82
Figure 6.4: Comparison of Rr (mean random vitrinite reflectance values) and inorganic burial diagenetic
signatures of the Firkanten (Endalen Member) and Grumantbyen formations (7-2006). Vitrinite reflectance
measurements (Rr) and maximum temperatures are obtained from Dörr et al. (2018).
In core 11-2003, Rr values range from 0,62-0,73% in the Aspelintoppen and Battfjellet
Formations. Core 7-2006 shows slightly higher Rr values than core 11-2003, increasing from
0,81% in the Grumantbyen Formation to 0,83% in the underlying Firkanten Formation
(Endalen Member). The slightly higher Rr values reflect the deeper burial of the Firkanten and
Grumantbyen formations. In addition, Dörr et al. (2018) performed vitrinite reflectance
measurements in core 9-2007, located about l13 km northeast of cores 11-2003 and 7-2006.
Chapter 6 Discussion
83
The highest VR value (Rr = 0,76%) in core 9-2007 was measured in the Todalen Member
(Firkanten Formation). This value, however, is not consistent with Rr values measured in the
Endalen Member (0,40% and 0,35%), situated just c. 100 m above the Todalen sample.
Marshall et al. (2015), however, relates (unlikely) low Rr values for Tertiary Svalbard coals to
high bitumen content, causing suppression of vitrinite reflectance. However, Dörr et al. (2018)
suggests maximum temperatures of c. 90-110oC for the Eocene coals and c. 120-130oC for the
Paleocene coals.
6.4.3 Are VR measurements consistent with authigenic signatures?
Dörr et al. (2018) suggests maximum temperatures of 120-130oC for the CTB, corresponding
to burial depths of 4-4,5 (Fig. 6.5a). This is in agreement with the presence of grain-coating
chlorite, ankerite and illite, indicating intermediate-deep burial depths. The existence of
ankerite in the Firkanten Formation and grain-coating chlorite in the Grumantbyen Formation,
show that the CTB have been subjected to temperatures of at least 100-110oC (Fig. 6.4).
Although a clear identification of illite was not possible, formation of illite at the expense of
kaolinite, occurring at temperatures higher than 120-130oC, cannot be excluded. Extensive
quartz cementation in the sandstones of the Firkanten and Grumantbyen formations,
nevertheless, may support maximum temperatures of 120-130oC, in which the rate of quartz
cementation increases with increasing temperatures (Bjørlykke and Jahren, 2015). Furthermore,
the burial diagenetic mineral assemblage of the Grumantbyen Formation sandstones in (1) core
11-2003 and (2) core 7-2006 indicate a rather similar temperature/burial history for the
individual intervals. In the absence of high-resolution SEM BSE images and fluid inclusions,
nevertheless, any differences cannot be entirely excluded. The presence of Fe-dolomite in the
overlying Aspelintoppen Formation indicate temperatures of at least 100oC. This is in
agreement with vitrinite reflectance measurements, suggesting maximum temperatures of 90-
110oC for the Eocene coals (Fig. 6.3).
The estimated low porosity values of the Firkanten, Grumantbyen and Aspelintoppen
formations, nevertheless, may indicate deeper burial of the succession. The “Walderhaug
model” (Bjørkum et al.,1998) shows porosity values of 15-20% for Miocene sandstones buried
to 4 km depth, assuming a temperature gradient of 35oC (i.e. considerably higher than the
estimated porosity values in the present study). However, the abundance of clayey material and
ductile grains in the analysed samples (notably in the Aspelintoppen Formation sandstones)
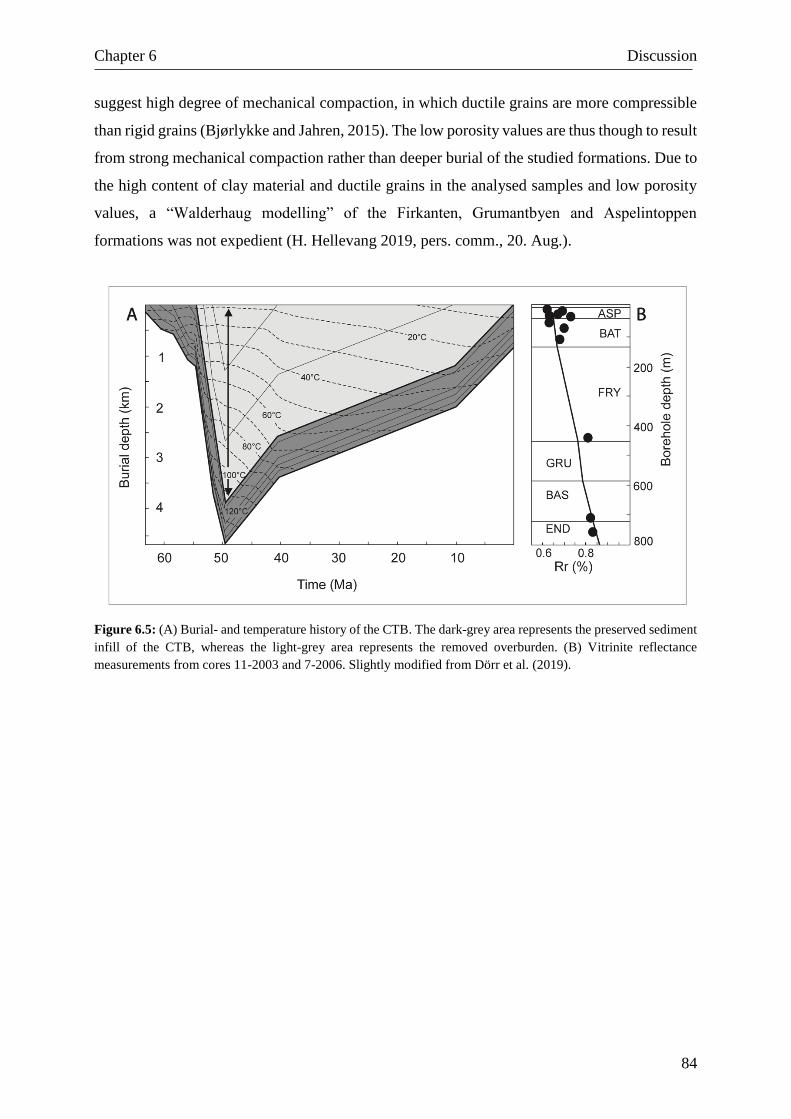
Chapter 6 Discussion
84
suggest high degree of mechanical compaction, in which ductile grains are more compressible
than rigid grains (Bjørlykke and Jahren, 2015). The low porosity values are thus though to result
from strong mechanical compaction rather than deeper burial of the studied formations. Due to
the high content of clay material and ductile grains in the analysed samples and low porosity
values, a “Walderhaug modelling” of the Firkanten, Grumantbyen and Aspelintoppen
formations was not expedient (H. Hellevang 2019, pers. comm., 20. Aug.).
Figure 6.5: (A) Burial- and temperature history of the CTB. The dark-grey area represents the preserved sediment
infill of the CTB, whereas the light-grey area represents the removed overburden. (B) Vitrinite reflectance
measurements from cores 11-2003 and 7-2006. Slightly modified from Dörr et al. (2019).
Chapter 7 Conclusions and further work
85
7 Conclusions and further work
7.1 Conclusions
The main objective of this thesis was to investigate the importance of depositional
environment to diagenesis in sandstones of the Firkanten, Grumantbyen and Aspelintoppen
formations. The sedimentological and petrographic observation, and geochemical data from
these sandstones allow the following conclusions:
The Firkanten Formation constitute coastal plain (Todalen Mbr.) to shallow marine
(Endalen Mbr.) deposits (1), the Grumantbyen Formation shallow marine deposits (2)
and the Aspelintoppen Formation tide-influenced deltaic deposits (3)
Geochemical trends in the sediment cores can, at least in part, be correlated to changes
in lithology and sand/mud ratios in the sedimentary logs. The repetitive sub-trends
observed in the Endalen Member. (upper Firkanten Formation) tend to coincide with
intervals of shallowing upwards (i.e. parasequences)
Use of geochemical signatures is preferable for sedimentary rocks showing gradual
and continuous changes in lithology and sand/mud ratios, rather than abrupt changes
The abundance of calcite cement in the Aspelintoppen Formation sandstones strongly
support marine influence, as suggested by sedimentological analysis
The presence of glauconite and abundant framboidal pyrite in the lowermost part of
the Firkanten Formation (Todalen Mbr.) may indicate transgressive conditions
The sandstones of the Firkanten, upper part of Grumantbyen and Aspelintoppen
formations is strongly influenced by compaction and cementation, in which
compaction is evidenced by dense grain packing, bending/breakage of mica and
squeezing of ductile grains.
The high degree of compaction resulted in low porosity values, ranging from absent to
approximately 10-15%. The significant low porosity values of the Aspelintoppen
Formation sandstones are ascribed to the abundance of clayey material and ductile
grains. The generally low porosity values of the Firkanten and Grumantbyen
formations resulted from extensive quartz cementation and, in some samples,
carbonate cement, enhanced by the presence of ductile grains
Chapter 7 Conclusions and further work
86
The considerably higher porosity values of the Grumantbyen Formation sandstones
may be ascribed to the presence of grain-coating chlorite, preventing further quartz
cementation at great burial depths. Variations in coating-quality is related to
sandstone-type, in which high-quality chlorite rims are restricted to “clean”
sandstones, showing few or no clay-rich laminae, mud drapes or muddy bioturbation.
The burial diagenetic signatures of the analysed sandstones are in agreement with
vitrinite reflectance measurements, suggesting temperatures of at least 100-110oC for
the Firkanten and Grumantbyen formations and temperatures of around 100oC for the
overlying Aspelintoppen Formation. However, extensive quartz cementation in the
sandstones of the Firkanten and Grumantbyen formations may support maximum
temperatures of 120-130oC, as suggested by vitrinite reflectance measurements.
7.2 Suggestions for further work
Based on the results obtained from the present study, these are my recommendations for
further work:
Study the Firkanten, Grumantbyen and Aspelintoppen formations in the field. In the
present study, sedimentological analysis was restricted to logging (and XRF-analysis)
of core 7-2006 and 11-2003. Fieldwork would possibly provide a more detailed
understanding of depositional environment/facies associations and, thus, a better
understanding of the types and distribution of authigenic minerals. Furthermore, it
would have been interesting to further investigate the upper part of the Endalen
Member (Firkanten Formation) – are there evidence of fluvial incision or other
terrestrial indicators in the field?
Perform fluid inclusion analysis of authigenic minerals (e.g. quartz cement) in order to
better constrain the thermal history of the CTB. In addition, higher-resolution SEM
BSE images of the sandstone-samples could possibly confirm presence of illite
References
87
References
Aagaard, P., Jahren, J. S., Harstad, A. O., Nilsen, O. & Ramm, M. 2000. Formation of grain-coating chlorite in sandstones. Laboratory synthesized vs. natural occurrences. Clay Minerals, 35, p. 261-269.
Al‐Ramadan, K., Morad, S. & Plink‐Bjørklund, P. 2012. Distribution of Diagenetic Alterations in Relationship to Depositional Facies and Sequence Stratigraphy of a Wave‐and Tide‐Dominated Siliciclastic Shoreline Complex: Upper Cretaceous Chimney Rock Sandstones, Wyoming and Utah, USA. In: Morad, S., Ketzer, J. M. & De Ros, L. F. (eds.) Linking Diagenesis to Sequence Stratigraphy. International Association of Sedimentologists Special Publication, p. 271-296.
Berner, R. A. 1984. Sedimentary pyrite formation: an update. Geochimica et cosmochimica Acta, 48, p. 605-615.
Bjørkum, P. A., Oelkers, E. H., Nadeau, P. H., Walderhaug, O. & Murphy, W. M. 1998. Porosity prediction in quartzose sandstones as a function of time, temperature, depth, stylolite frequency, and hydrocarbon saturation. AAPG Bulletin, 82, p. 637-648.
Bjørkum, P. A. & Walderhaug, O. 1990. Geometrical arrangement of calcite cementation within shallow marine sandstones. Earth-Science Reviews, 29, p. 145-161.
Bjørlykke, K. 2001. Sedimentologi og petroleumsgeologi 2nd ed. Oslo, Gyldendal yrkesopplæring.
Bjørlykke, K. & Jahren, J. 2015. Sandstones and sandstone reservoirs. In: Bjørlykke, K. (ed.) Petroleum Geoscience: From Sedimentary Environments to Rock Physics. Heidelberg: Springer, p. 113-140.
Blythe, A. E. & Kleinspehn, K. L. 1998. Tectonically versus climatically driven Cenozoic exhumation of the Eurasian plate margin, Svalbard: Fission track analyses. Tectonics, 17, p. 621-639.
Bohacs, K. & Suter, J. 1997. Sequence stratigraphic distribution of coaly rocks: fundamental controls and paralic examples. AAPG Bulletin, 81, p. 1612-1639.
Boles, J. R. 1978. Active ankerite cementation in the subsurface Eocene of southwest Texas. Contributions to Mineralogy and Petrology, 68, p. 13-22.
Bruhn, R. & Steel, R. 2003. High-resolution sequence stratigraphy of a clastic foredeep succession (Paleocene, Spitsbergen): An example of peripheral-bulge-controlled depositional architecture. Journal of Sedimentary Research, 73, p. 745-755.
Burnham, A. K. & Sweeney, J. J. 1989. A chemical kinetic model of vitrinite maturation and reflectance. Geochimica et Cosmochimica Acta, 53, p. 2649-2657.
Butler, I. B. & Rickard, D. 2000. Framboidal pyrite formation via the oxidation of iron (II) monosulfide by hydrogen sulphide. Geochimica et Cosmochimica Acta, 64, p. 2665-2672.
Cattaneo, A. & Steel, R. J. 2003. Transgressive deposits: a review of their variability. Earth-Science Reviews, 62, p. 187-228.
Chafetz, H. S. & Reid, A. 2000. Syndepositional shallow-water precipitation of glauconitic minerals. Sedimentary Geology, 136, p. 29-42.
Chuhan, F. A., Kjeldstad, A., Bjørlykke, K. & Høeg, K. 2002. Porosity loss in sand by grain crushing—Experimental evidence and relevance to reservoir quality. Marine and Petroleum Geology, 19, p. 39-53.
References
88
Chuhan, F. A., Kjeldstad, A., Bjørlykke, K. & Høeg, K. 2003. Experimental compression of loose sands: Relevance to porosity reduction during burial in sedimentary basins. Canadian Geotechnical Journal, 40, p. 995-1011.
Clifton, H. E. & Thompson, J. K. 1978. Macaronichnus segregatis; a feeding structure of shallow marine polychaetes. Journal of Sedimentary Research, 48, p. 1293-1302.
Collinson, J. D. 1969. The sedimentology of the Grindslow Shales and the Kinderscout Grit: a deltaic complex in the Namurian of northern England. Journal of Sedimentary Research, 39, p. 194-221.
Crabaugh, J. P. & Steel, R. J. 2004. Basin-floor fans of the Central Tertiary Basin, Spitsbergen: relationship of basin-floor sand-bodies to prograding clinoforms in a structurally active basin. Geological Society London Special Publication, 222, p. 187-208.
Dalland, A. 1976. Erratic clasts in the Lower Tertiary deposits of Svalbard - evidence of transport by winter ice. Norsk Polarinstitutt, Årbok 1976, p. 151-165.
Dallmann, W. K. 1999. Lithostratigraphic lexicon of Svalbard: review and recommendations for nomenclature use: Upper Palaeozoic to Quaternary bedrock. Tromsø, Norwegian Polar Institute, 318 p.
Dörr, N., Lisker, F., Jochmann, M., Rainer, T., Schlegel, A., Schubert, K. & Spiegel, C. 2018. Subsidence, rapid inversion and slow erosion of the Central Tertiary Basin of Svalbard: Evidence from the thermal evolution and basin modeling. In: Piepjohn, K., Strauss, J. V., Reinhardt, L. & Mcclelland, W. C. (eds.) Circum-Arctic Structural Events: Tectonic Evolution of the Arctic Margins and Trans-Arctic Links with Adjacent Orogens. Geological Society of America Special paper 541, p. 1-20.
Dypvik, H., Riber, L., Burca, F., Rüther, D., Jargvoll, D., Nagy, J. & Jochmann, M. 2011. The Paleocene–Eocene thermal maximum (PETM) in Svalbard—clay mineral and geochemical signals. Palaeogeography, Palaeoclimatology, Palaeoecology, 302, p. 156-169.
Ehrenberga, S. N., Dalland, A., Nadeau, P. H., Mearns, E. W. & Amundsen, E. F. 1998. Origin of chlorite enrichment and neodymium isotopic anomalies in Haltenbanken sandstones. Marine Petroleum Geology, 15, p. 403-425.
Golovneva, L. B. 2000. Palaeogene climates of Spitsbergen. GFF, 122, p. 62-63. Gould, K., Pe‐Piper, G. & Piper, D. J. W. 2010. Relationship of diagenetic chlorite rims to
depositional facies in Lower Cretaceous reservoir sandstones of the Scotian Basin. Sedimentology, 57, p. 587-610.
Grigsby, J. D. 2001. Origin and growth mechanism of authigenic chlorite in sandstones of the lower Vicksburg Formation, south Texas. Journal of Sedimentary Research, 71, p. 27-36.
Grundvåg, S. A., Helland‐Hansen, W., Johannessen, E. P., Olsen, A. H. & Stene, S. A. K. 2014. The depositional architecture and facies variability of shelf deltas in the Eocene Battfjellet Formation, Nathorst Land, Spitsbergen. Sedimentology, 61, p. 2172-2204.
Haile, B. G., Klausen, T. G., Czarniecka, U., Xi, K., Jahren, J. & Hellevang, H. 2018a. How are diagenesis and reservoir quality linked to depositional facies? A deltaic succession, Edgeøya, Svalbard. Marine and Petroleum Geology, 92, p. 519-546.
Haile, B. G., Klausen, T. G., Jahren, J., Braathen, A. & Hellevang, H. 2018b. Thermal history of a Triassic sedimentary sequence verified by a multi‐method approach: Edgeøya, Svalbard, Norway. Basin Research, 30, p. 1075-1097.
References
89
Harland, W. B. 1969. Contribution of Spitsbergen to Understanding of Tectonic Evolution of North Atlantic Region. In: Kay, M. (ed.) North Atlantic: Geology and Continental Drift. AAPG Memoir 12, p. 817-851.
Heidari, M., Momeni, A. A., Rafiei, B., Khodabakhsh, S. & Torabi-Kaveh, M. 2013. Relationship between petrographic characteristics and the engineering properties of Jurassic sandstones, Hamedan, Iran. Rock mechanics and rock engineering, 46, p. 1091-1101.
Helland-Hansen, W. 1990. Sedimentation in Paleogene Foreland Basin, Spitsbergen. The American Association of Petroleum Geologists Bulletin, 74, p. 260-272.
Helland-Hansen, W. 2010. Facies and stacking patterns of shelf‐deltas within the Palaeogene Battfjellet Formation, Nordenskiöld Land, Svalbard: implications for subsurface reservoir prediction. Sedimentology, 57, p. 190-208.
Hendry, J. P. 1978. Ankerite (in sediments). In: Fairbridge, R. W. (ed.) Sedimentology. Encyclopedia of Earth Science. Heidelberg: Springer.
Inkson, B. J. 2016. Scanning electron microscopy (SEM) and transmission electron microscopy (TEM) for materials characterization. In: Hübschen, G., Altpeter, I., Tschuncky, R. & Herrmann, H. G. (eds.) Materials Characterization Using Nondestructive Evaluation (NDE) Methods. Sheffield: Woodhead Publishing, p. 17-43.
Knaust, D. 2017. Atlas of Trace Fossils in Well Core: Appearance, Taxonomy and Interpretation. Springer.
Lüthje, C. J. 2008. Transgressive development of coal-bearing coastal plain to shallow marine setting in a flexural compressional basin, Paleocene, Svalbard, Arctic Norway. Ph.D., University Centre in Svalbard/University of Bergen.
Mansurbeg, H., Morad, S., Plink-Björklund, P., El-Ghali, M., Caja, M. & Marfil, R. 2012. Diagenetic alterations related to falling stage and lowstand systems tracts of shelf, slope and basin floor sandstones (Eocene Central Basin, Spitsbergen). International Association of Sedimentologists Special Publication, 45, p. 353-378.
Manum, S. B. & Throndsen, T. 1978. Rank of coal and dispersed organic matter and its geological bearing in the Spitsbergen Tertiary. Norsk Polarinstitutt, Årbok 1977, p. 159-177.
Marshall, C., Uguna, J., Large, D. J., Meredith, W., Jochmann, M., Friis, B., Vane, C., Spiro, B. F., Snape, C. E. & Orheim, A. 2015. Geochemistry and petrology of palaeocene coals from Spitzbergen - Part 2: Maturity variations and implications for local and regional burial models. International Journal of Coal Geology, 143, p. 1-10.
McRae, S. G. 1972. Glauconite. Earth-Science Reviews, 8, p. 397-440. Mellere, D., Plink‐Björklund, P. & Steel, R. 2002. Anatomy of shelf deltas at the edge of a
prograding Eocene shelf margin, Spitsbergen. Sedimentology, 49, p. 1181-1206. Morad, S., Al-Ramadan, K., Ketzer, J. M. & De Ros, L. 2010. The impact of diagenesis on the
heterogeneity of sandstone reservoirs: A review of the role of depositional facies and sequence stratigraphy. AAPG Bulletin, 94, p. 1267-1309.
Morad, S., Ketzer, J. M. & De Ros, L. F. 2012. Linking diagenesis to sequence stratigraphy: an integrated tool for understanding and predicting reservoir quality distribution. International Association of Sedimentologists, 45, p. 1-36.
Mørk, M. B. E. 2013. Diagenesis and quartz cement distribution of low-permeability Upper Triassic–Middle Jurassic reservoir sandstones, Longyearbyen CO2 lab well site in Svalbard, Norway. AAPG Bulletin, 97, p. 577-596.
References
90
Nagy, J., Kaminski, M., Kuhnt, W. & Bremer, M. A. 2001. Agglutinated foraminifera from neritic to bathyal facies in the Palaeogene of Spitsbergen and the Barents Sea. In: Hart, M., Kaminski, M. A. & Smart, C. (eds.) Proceedings of the Fifth International Workshop on Agglutinated Foraminifera. Plymouth, p. 333-361.
Naurstad, O. A. 2014. Sedimentology of the Aspelintoppen Formation (Eocene-Oligocene), Brogniartfjella, Svalbard. Master Thesis, University of Bergen
Odin, G. S. & Matter, A. 1981. De glauconiarum origine. Sedimentology, 28, p. 611-641. Petersen, T. G., Thomsen, T. B., Olaussen, S. & Stemmerik, L. 2016. Provenance shifts in an
evolving Eurekan foreland basin: the Tertiary Central Basin, Spitsbergen. Journal of the Geological Society, 173, p. 634-648.
Piepjohn, K., von Gosen, W. & Tessensohn, F. 2016. The Eurekan deformation in the Arctic: an outline. Journal of the Geological Society, 173, p. 1007-1024.
Reading, H. G. & Collinson, J. D. 1996. Clastic coasts. In: Reading, H. G. (ed.) Sedimentary Environments: Processes, Facies and Stratigraphy, 3rd ed. Oxford: Blackwell Science, p. 154-231.
Reineck, H. E. & Singh, I. B. 1972. Genesis of laminated sand and graded rhythmites in storm‐sand layers of shelf mud. Sedimentology, 18, p. 123-128.
Reineck, H. E. & Singh, I. B. 1980. Tidal flats. In: Reineck, H. E. & Singh, I. B. (eds.) Depositional sedimentary environments. Heidelberg: Springer, p. 430-456.
Riis, F., Lundschien, B. A., Høy, T., Mørk, A. & Mørk, M. B. E. 2008. Evolution of the Triassic shelf in the northern Barents Sea region. Polar Research, 27, p. 318-338.
Ritter, U. 1984. The influence of time and temperature on vitrinite reflectance. Organic Geochemistry, 6, p. 473-480.
Schlegel, A., Lisker, F., Dörr, N., Jochmann, M., Schubert, K. & Spiegel, C. 2013. Petrography and geochemistry of siliciclastic rocks from the Central Tertiary Basin of Svalbard - implications for provenance, tectonic setting and climate. German Journal of Geology, 164, p. 173-186.
Schweitzer, H. J. 1980. Environment and climate in the Early Tertiary of Spitsbergen. Palaeogeography, Palaeoclimatology, Palaeoecology, 30, p. 297-311.
Steel, R., Gjelberg, J., Helland-Hansen, W., Kleinspehn, K., Nøttvedt, A. & Rye-Larsen, M. 1985. The Tertiary strike-slip basins and orogenic belt of Spitsbergen. SEPM Special Publication, 37, p. 339-359.
Steel, R. J. 1977. Observations on some Cretaceous and Tertiary sandstone bodies in Nordenskiold Land, Svalbard. Norsk Polarinstitutt, Årbok 1976, p. 43-67.
Steel, R. J., Dalland, A., Kalgraff, K. & Larsen, V. 1981. The Central Tertiary Basin of Spitsbergen: sedimentary development of a sheared-margin basin. In: Kerr, J. W. & Ferguson, A. J. (eds.) Geology of the North Atlantic Borderland. Can. Soc. Petrol. Geol., p. 647-664.
Steel, R. J. & Worsley, D. 1984. Svalbard’s post-Caledonian strata - an atlas of sedimentational patterns and palaeogeographic evolution. In: Spencer, A. M. (ed.) Petroleum Geology of the North European Margin. Dordrecht: Springer, p. 109-135.
Throndsen, T. 1982. Vitrinite reflectance studies of coals and dispersed organic matter in Tertiary deposits in the Adventdalen area, Svalbard. Polar Research, 2, p. 77-91.
Udgata, D. 2007. Glauconite as an indicator of sequence stratigraphic packages in a lower Paleocene passive-margin shelf succession, Central Alabama. Master Thesis, Auburn University.
References
91
Walderhaug, O. 1996. Kinetic modeling of quartz cementation and porosity loss in deeply buried sandstone reservoirs. AAPG Bulletin, 80, p. 731-745.
Walker, R. G. & Plint, A. G. 1992. Wave- and storm-dominated shallow marine systems. In: Walker, R. G. & James, N. P. (eds.) Facies Models: response to sea level change. St Johns: Geological Association of Canada, p. 219-238.
Ward, C. R. 1984. Coal geology and coal technology. Oxford, Blackwell Scientific Publications, 345 p.
Wilkin, R. T. & Barnes, H. L. 1997. Formation processes of framboidal pyrite. Geochimica et Cosmochimica Acta, 61, p. 323-339.
Worden, R. H. & Burley, S. D. 2003. Sandstone diagenesis: the evolution of sand to stone. In: Burley, S. D. & Worden, R. H. (eds.) Sandstone diagenesis: Recent and ancient. Oxford: Blackwell Publishing Ltd., p. 3-44.
Worsley, D. 2008. The post-Caledonian development of Svalbard and the western Barents Sea. Polar Research, 27, p. 298-317.
Xi, K., Cao, Y., Jahren, J., Zhu, R., Bjørlykke, K., Zhang, X., Cai, L. & Hellevang, H. 2015. Quartz cement and its origin in tight sandstone reservoirs of the Cretaceous Quantou formation in the southern Songliao basin, China. Marine Petroleum Geology, 66, p. 748-763.
Zhou, W., Apkarian, R., Wang, Z. L. & Joy, D. 2006. Fundamentals of scanning electron microscopy (SEM). In: Zhou, W. & Wang, Z. L. (eds.) Scanning microscopy for nanotechnology. Springer, p. 1-40.
Electronic references Swapp, S. (2017). Scanning Electron Microscopy (SEM). Retrieved from
https://serc.carleton.edu/research_education/geochemsheets/techniques/SEM.html
[Accessed: 22.02.2019]
Goodge, J (2016). Back-scattered Electron Detector (BSE). Retrieved from
https://serc.carleton.edu/research_education/geochemsheets/bse.html
[Accessed: 22.02.2019]
Thermo Fisher Scientific (2019). XRF Technology. Retrieved from
https://www.thermofisher.com/no/en/home/industrial/spectroscopy-elemental-isotope-
analysis/spectroscopy-elemental-isotope-analysis-learning-center/elemental-analysis-
information/xrf-technology.html
[Accessed: 12.03.2019]

92
Appendix I Sampling intervals
93
APPENDIX I: Sampling intervals
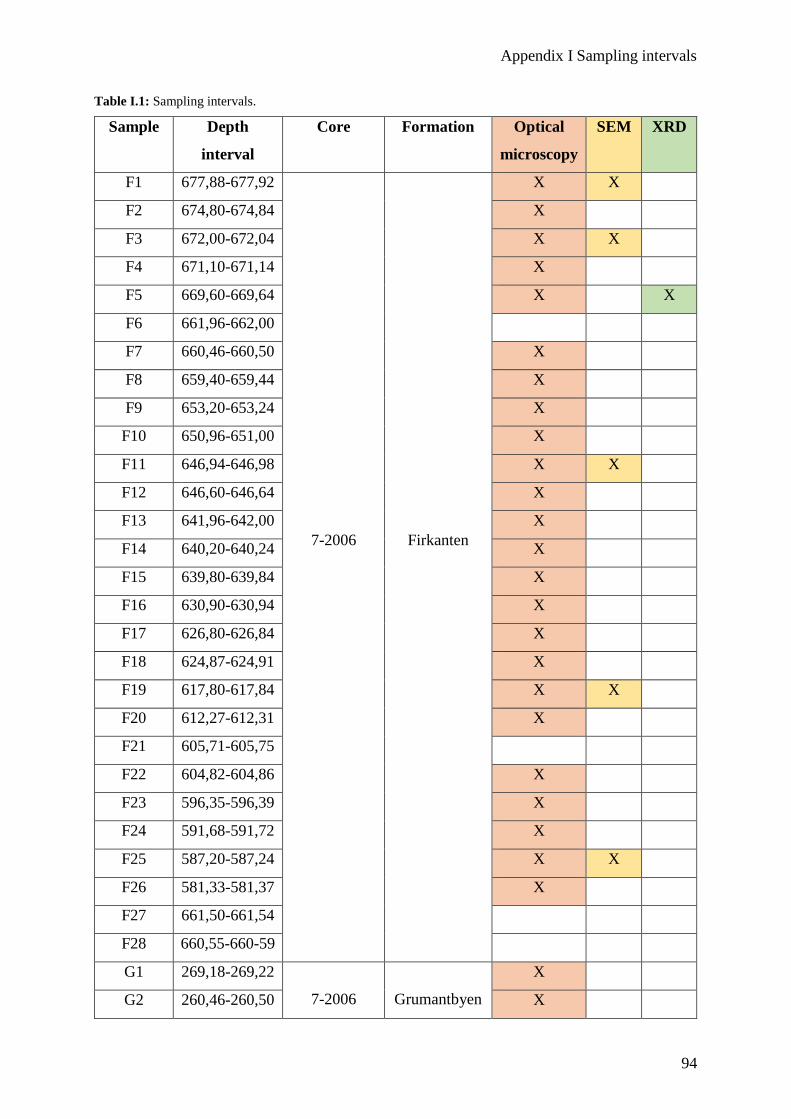
Appendix I Sampling intervals
94
Table I.1: Sampling intervals.
Sample Depth
interval
Core Formation Optical
microscopy
SEM XRD
F1 677,88-677,92
7-2006
Firkanten
X X
F2 674,80-674,84 X
F3 672,00-672,04 X X
F4 671,10-671,14 X
F5 669,60-669,64 X X
F6 661,96-662,00
F7 660,46-660,50 X
F8 659,40-659,44 X
F9 653,20-653,24 X
F10 650,96-651,00 X
F11 646,94-646,98 X X
F12 646,60-646,64 X
F13 641,96-642,00 X
F14 640,20-640,24 X
F15 639,80-639,84 X
F16 630,90-630,94 X
F17 626,80-626,84 X
F18 624,87-624,91 X
F19 617,80-617,84 X X
F20 612,27-612,31 X
F21 605,71-605,75
F22 604,82-604,86 X
F23 596,35-596,39 X
F24 591,68-591,72 X
F25 587,20-587,24 X X
F26 581,33-581,37 X
F27 661,50-661,54
F28 660,55-660-59
G1 269,18-269,22
7-2006
Grumantbyen
X
G2 260,46-260,50 X
Appendix I Sampling intervals
95
G3 257,37-257,41 X
G4 580,57-580,61
11-2003
Grumantbyen
X
G5 579,58-579,62 X X
G6 573,38-573,42 X X
A1 93,50-93,52
11-2003
Aspelintoppen
X X
A2 86,80-86,84 X
A3 84,76-84,80 X
A4 83,92-83,96 X
A5 83,74-83,78 X
A6 82,92-82,96 X X
A7 77,60-77,62 X X
A8 71,47-71,51 X
A9 65,84-65,88 X
A10 63,90-63,92 X
Appendix II Petrographic analyses
96
APPENDIX II: Petrographic analyses
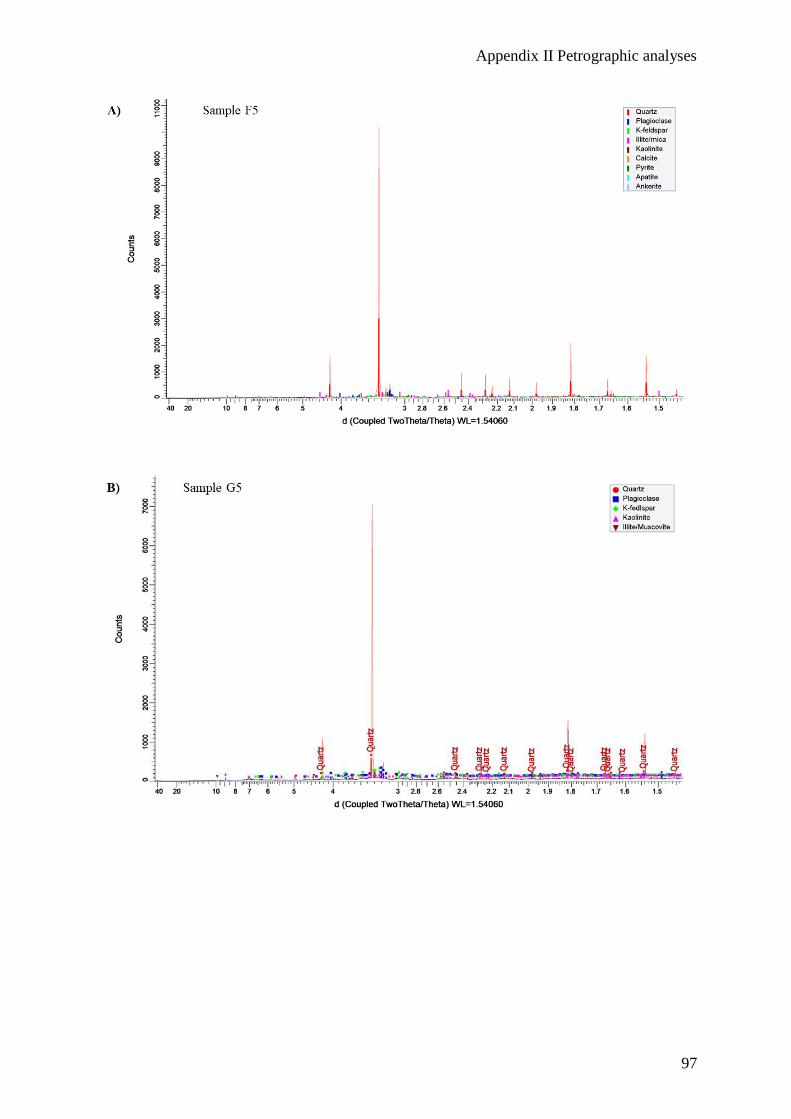
Appendix II Petrographic analyses
97
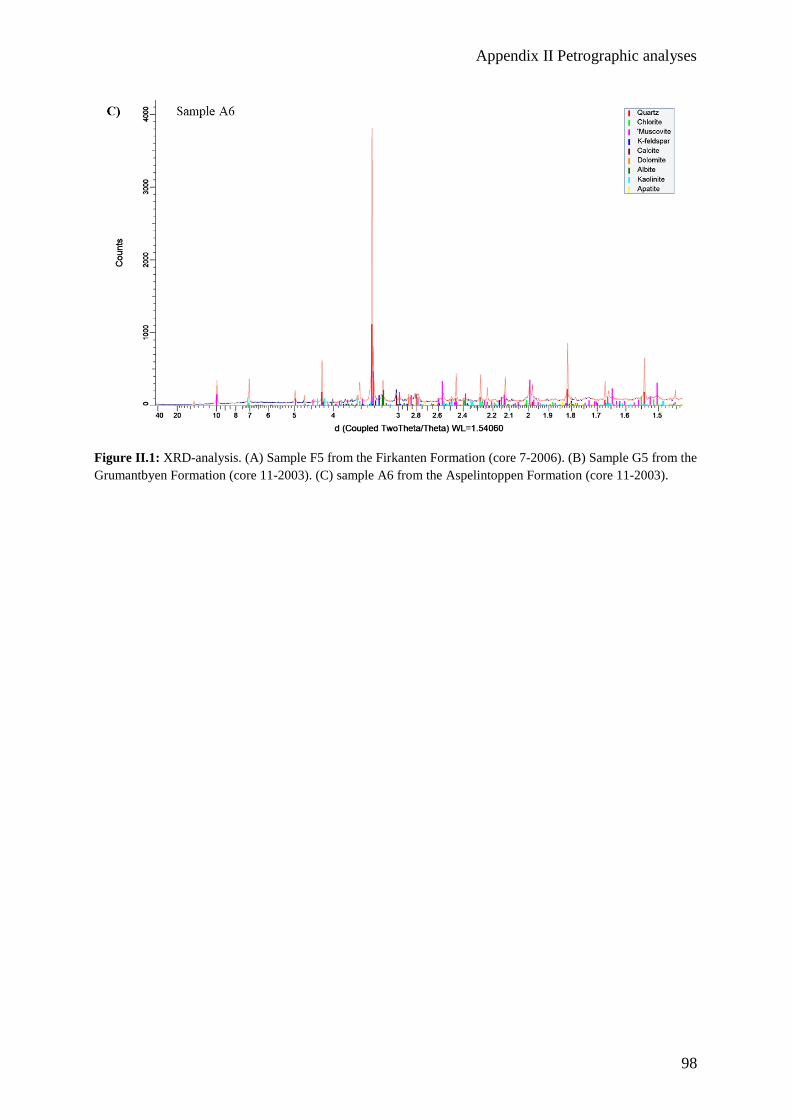
Appendix II Petrographic analyses
98
Figure II.1: XRD-analysis. (A) Sample F5 from the Firkanten Formation (core 7-2006). (B) Sample G5 from the
Grumantbyen Formation (core 11-2003). (C) sample A6 from the Aspelintoppen Formation (core 11-2003).
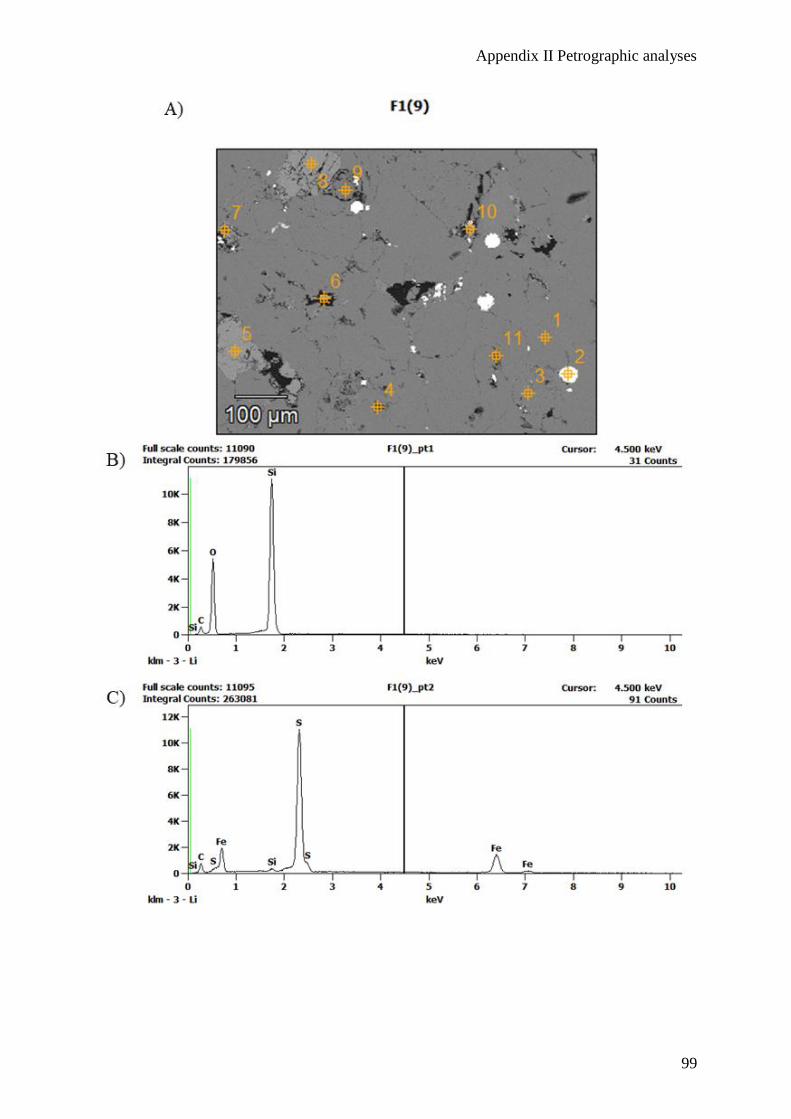
Appendix II Petrographic analyses
99
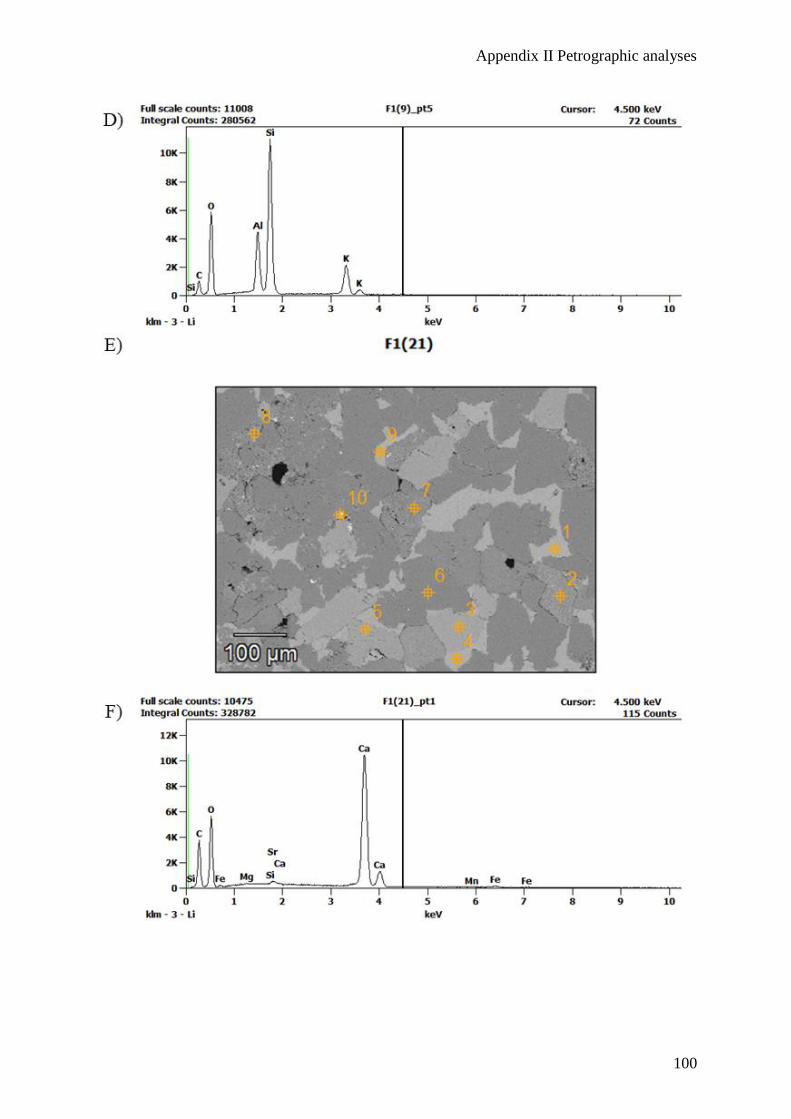
Appendix II Petrographic analyses
100
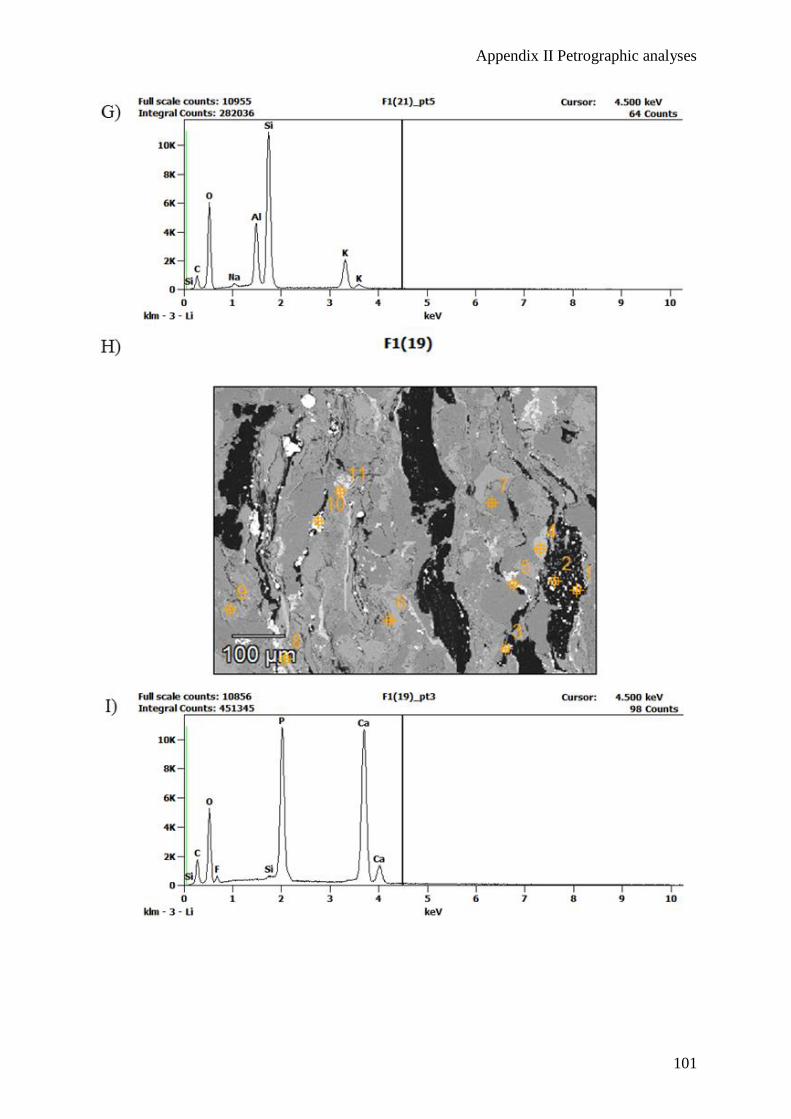
Appendix II Petrographic analyses
101
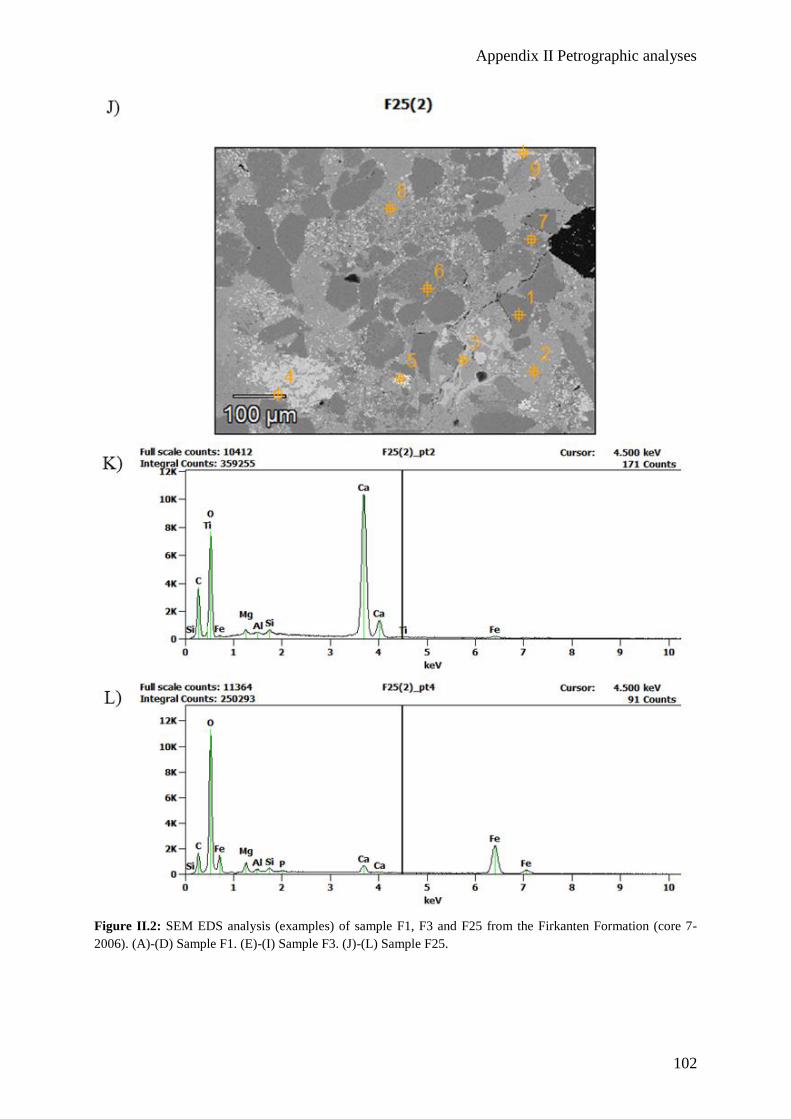
Appendix II Petrographic analyses
102
Figure II.2: SEM EDS analysis (examples) of sample F1, F3 and F25 from the Firkanten Formation (core 7-
2006). (A)-(D) Sample F1. (E)-(I) Sample F3. (J)-(L) Sample F25.
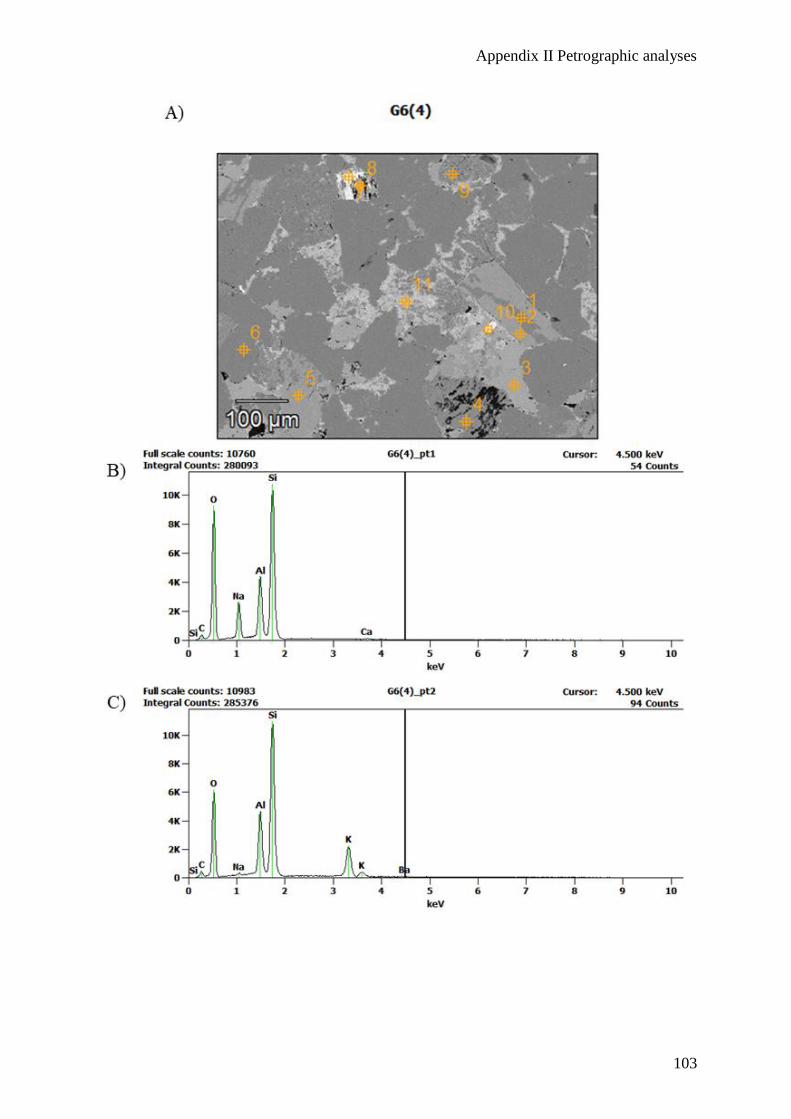
Appendix II Petrographic analyses
103
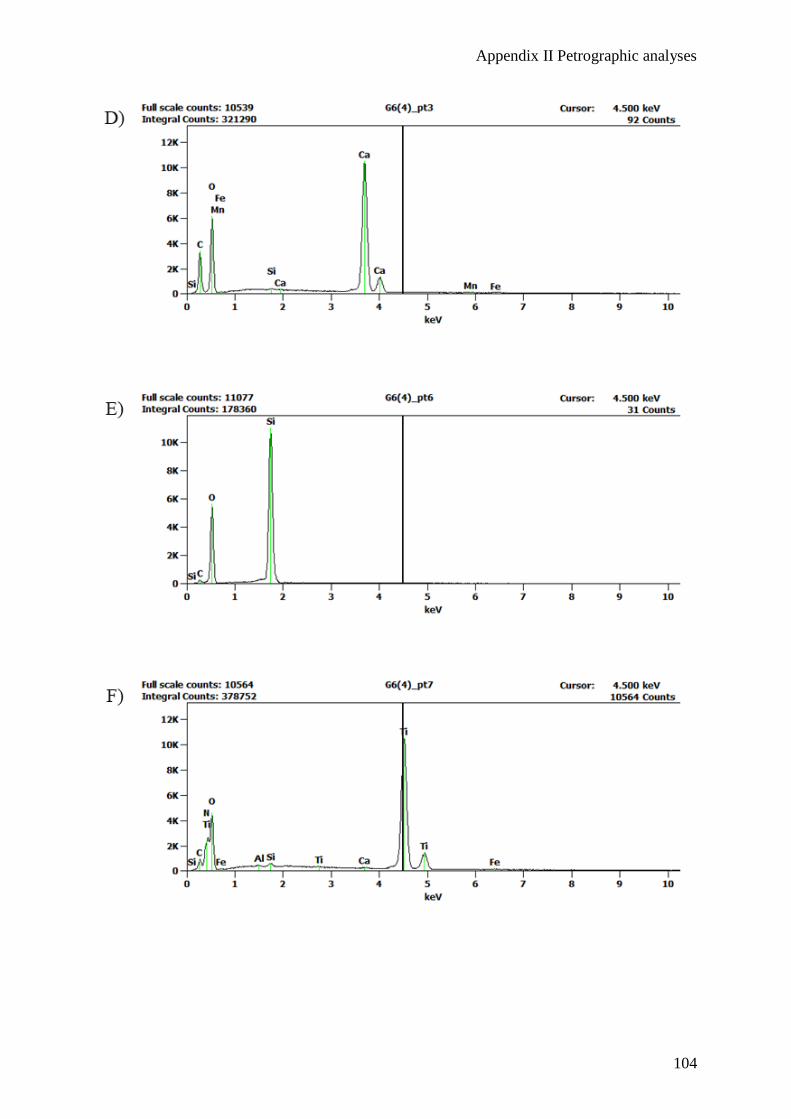
Appendix II Petrographic analyses
104
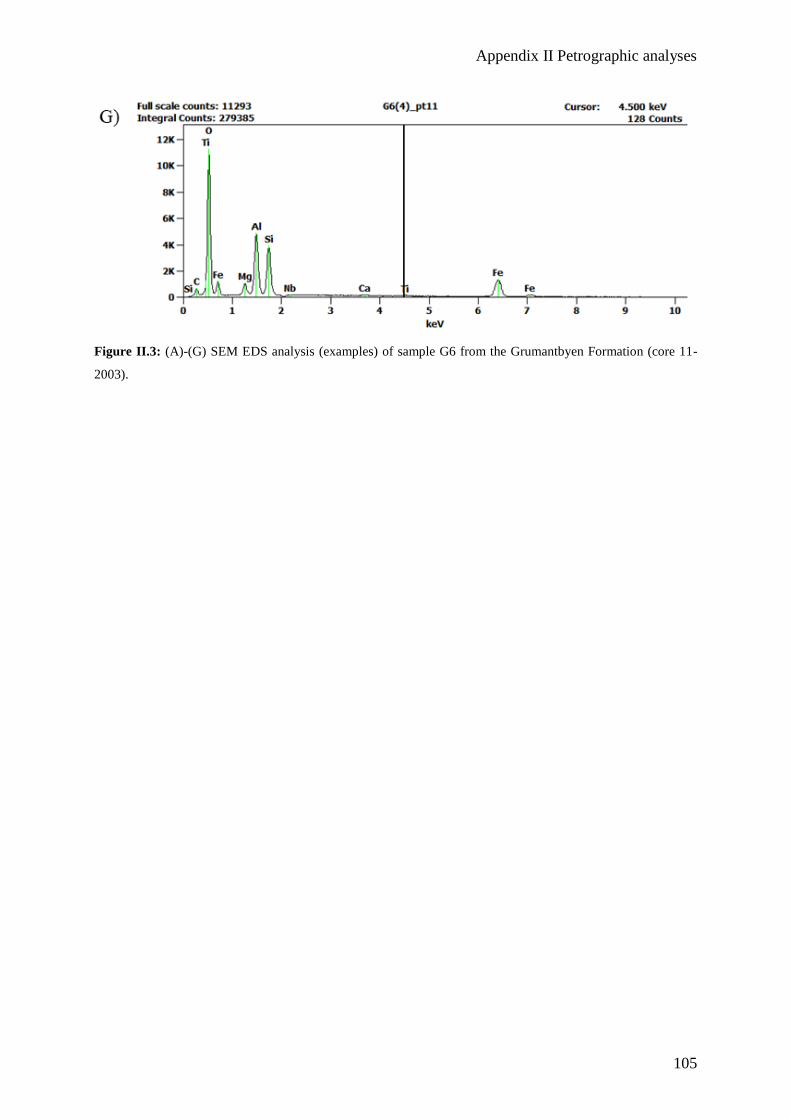
Appendix II Petrographic analyses
105
Figure II.3: (A)-(G) SEM EDS analysis (examples) of sample G6 from the Grumantbyen Formation (core 11-
2003).
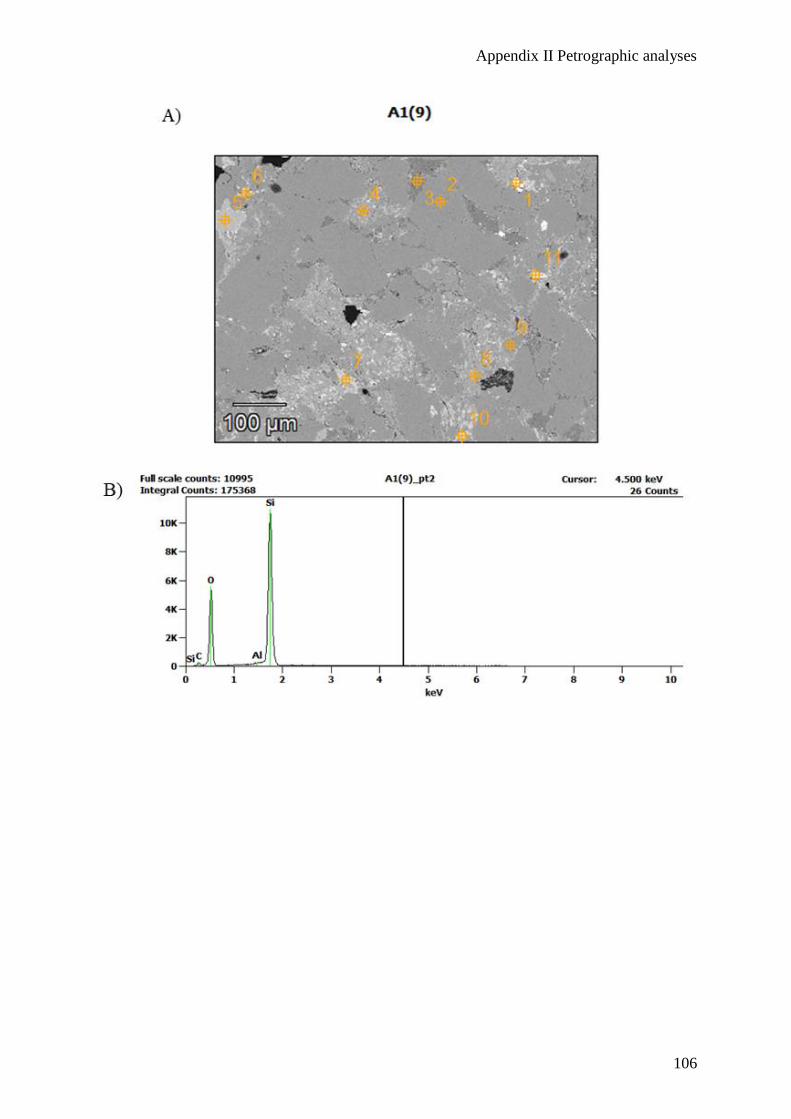
Appendix II Petrographic analyses
106
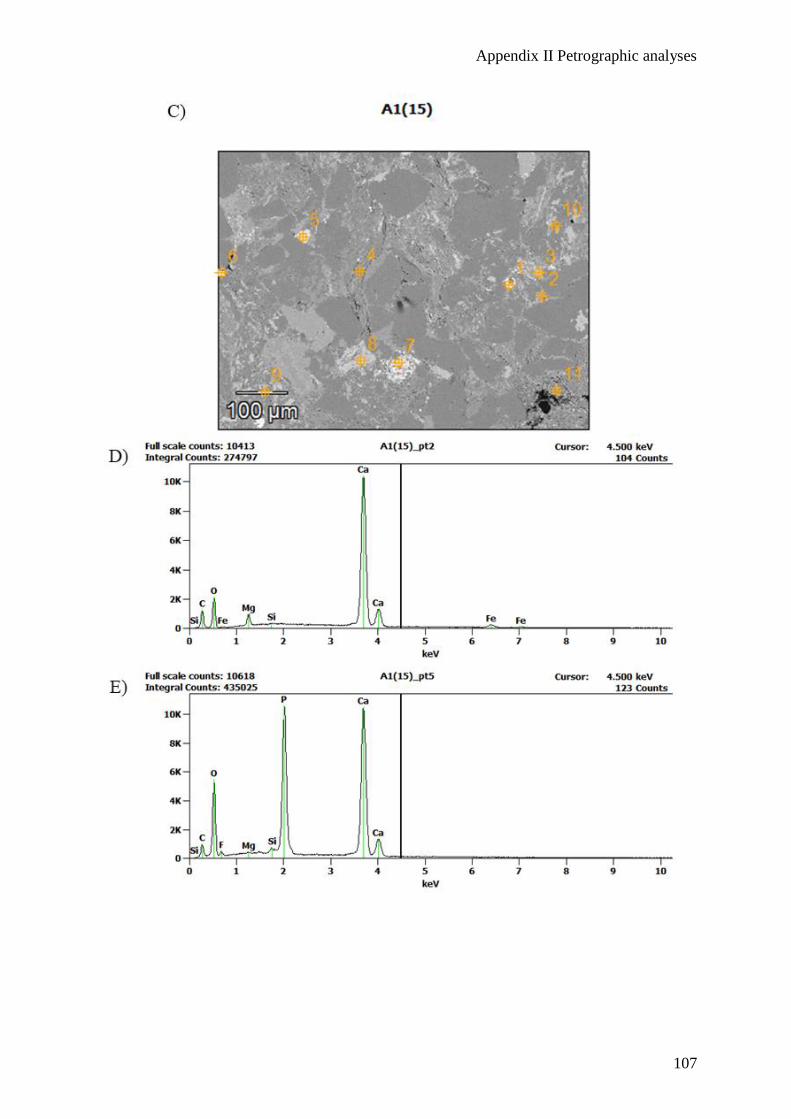
Appendix II Petrographic analyses
107
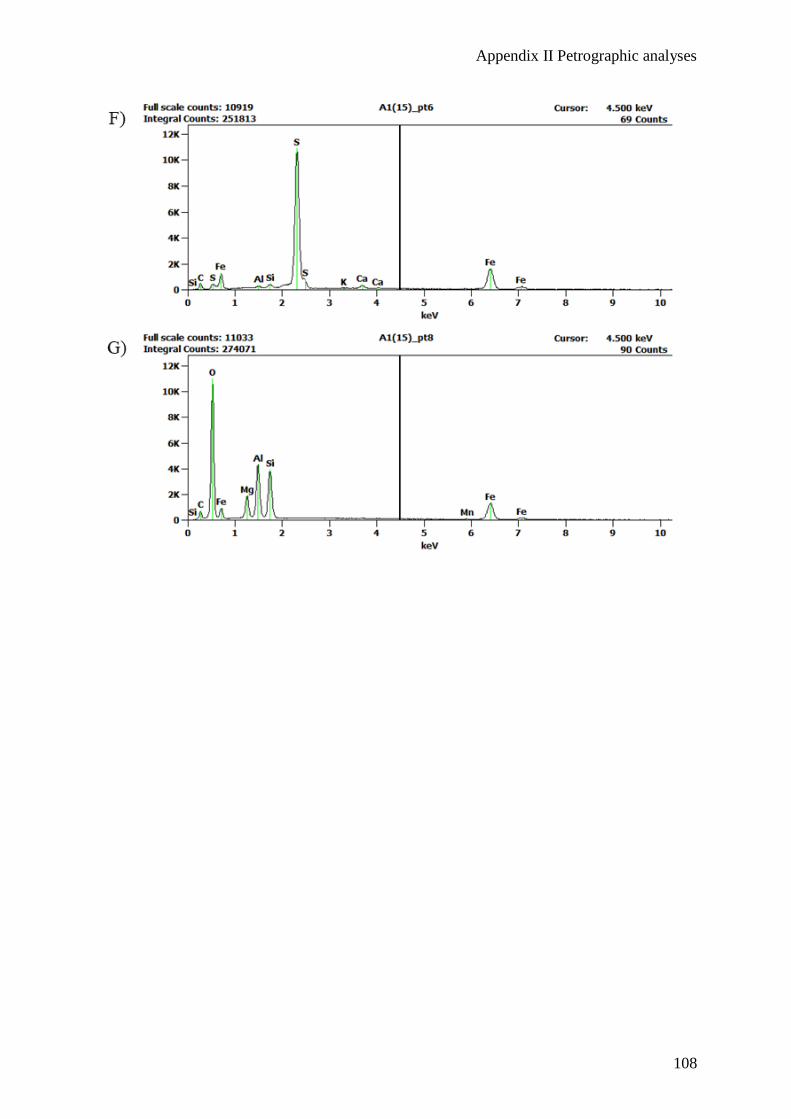
Appendix II Petrographic analyses
108
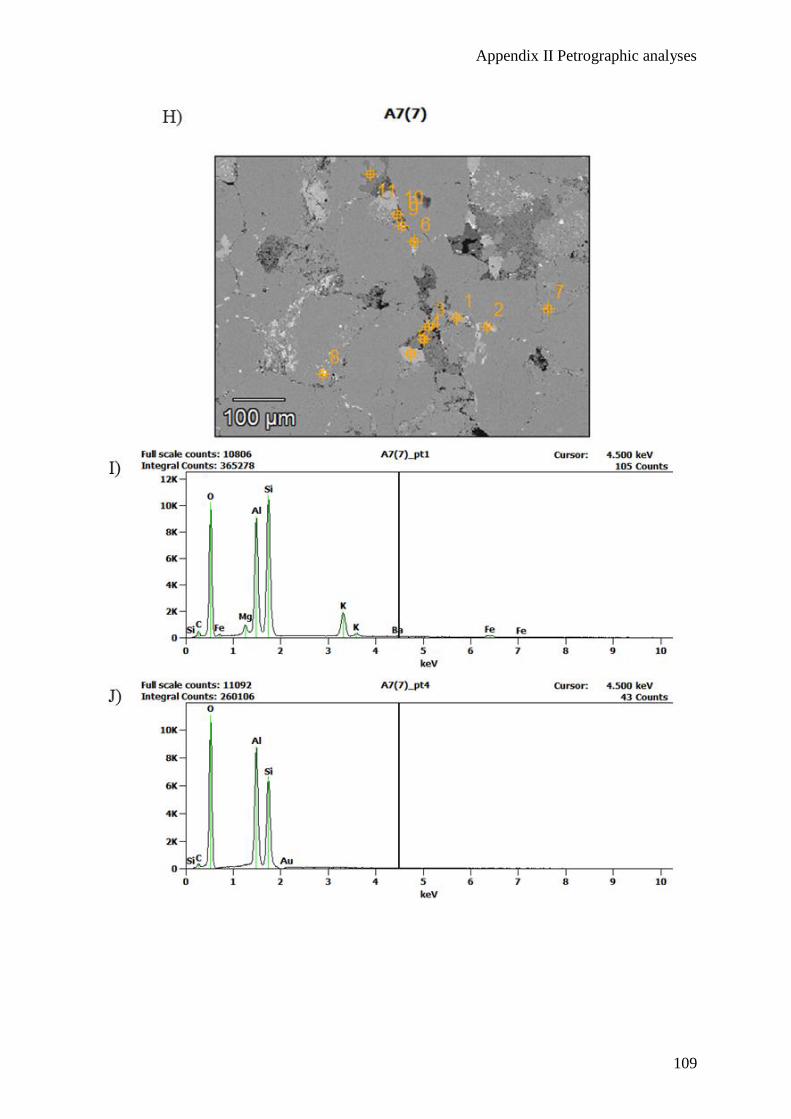
Appendix II Petrographic analyses
109
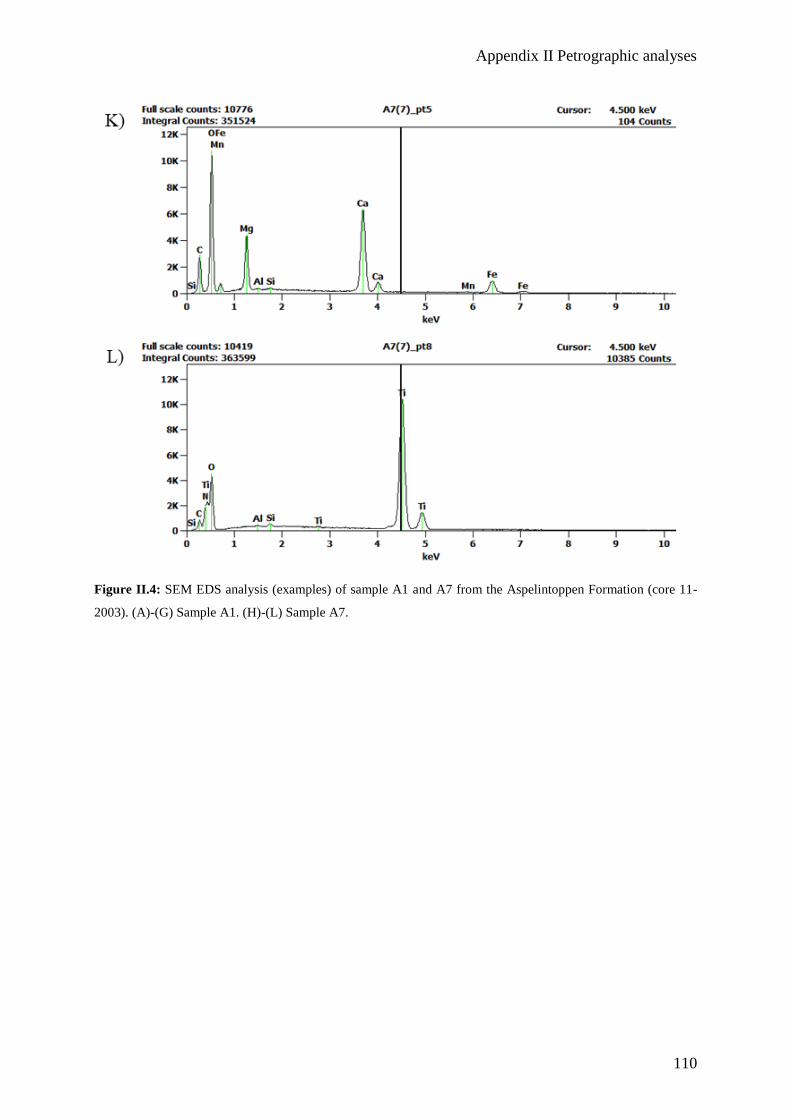
Appendix II Petrographic analyses
110
Figure II.4: SEM EDS analysis (examples) of sample A1 and A7 from the Aspelintoppen Formation (core 11-
2003). (A)-(G) Sample A1. (H)-(L) Sample A7.
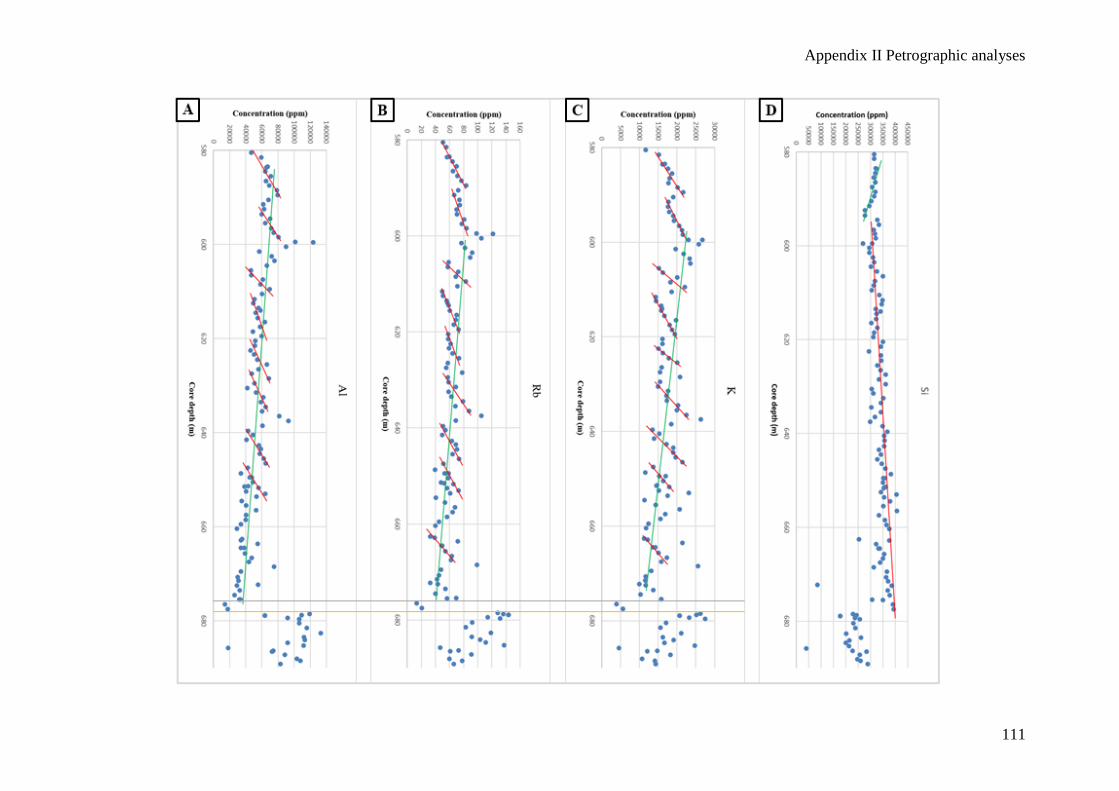
Appendix II Petrographic analyses
111
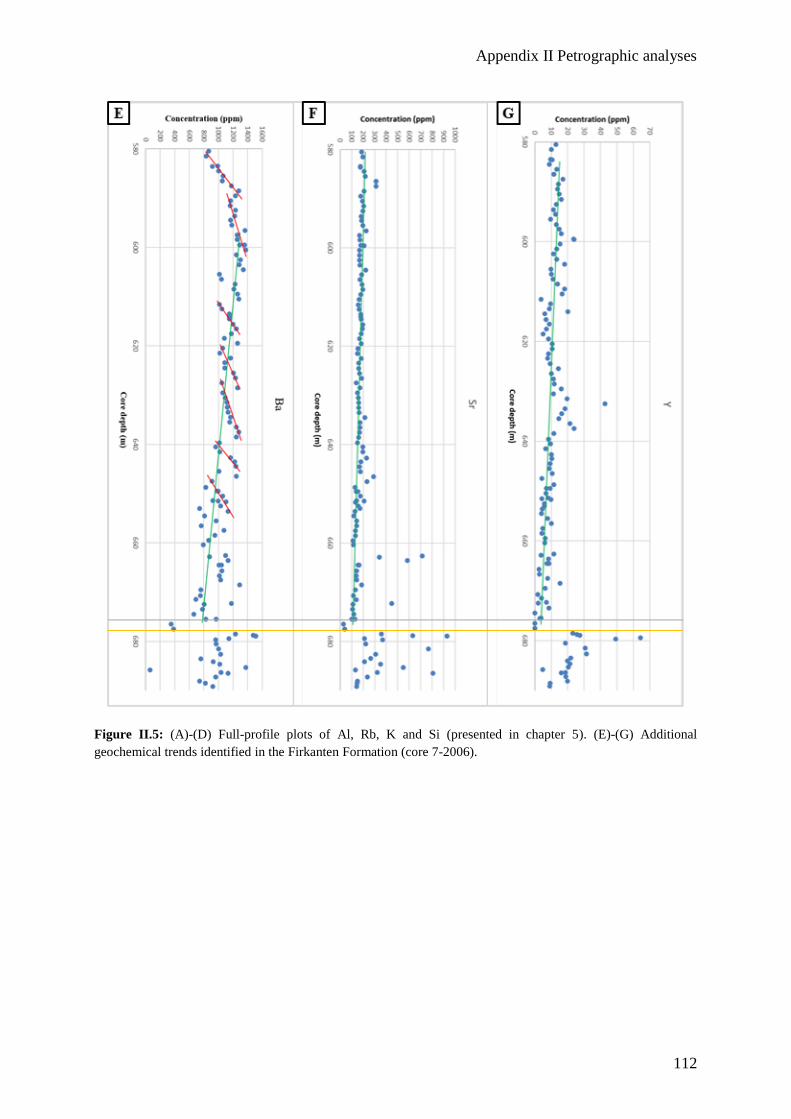
Appendix II Petrographic analyses
112
Figure II.5: (A)-(D) Full-profile plots of Al, Rb, K and Si (presented in chapter 5). (E)-(G) Additional
geochemical trends identified in the Firkanten Formation (core 7-2006).
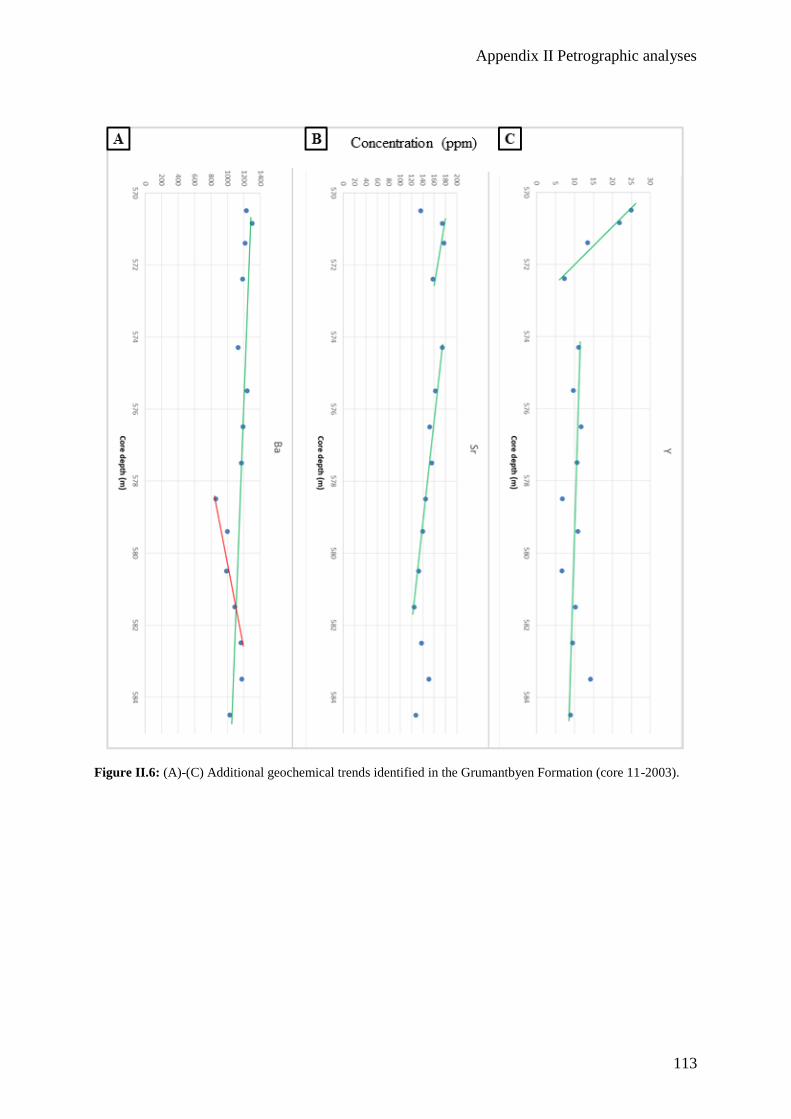
Appendix II Petrographic analyses
113
Figure II.6: (A)-(C) Additional geochemical trends identified in the Grumantbyen Formation (core 11-2003).
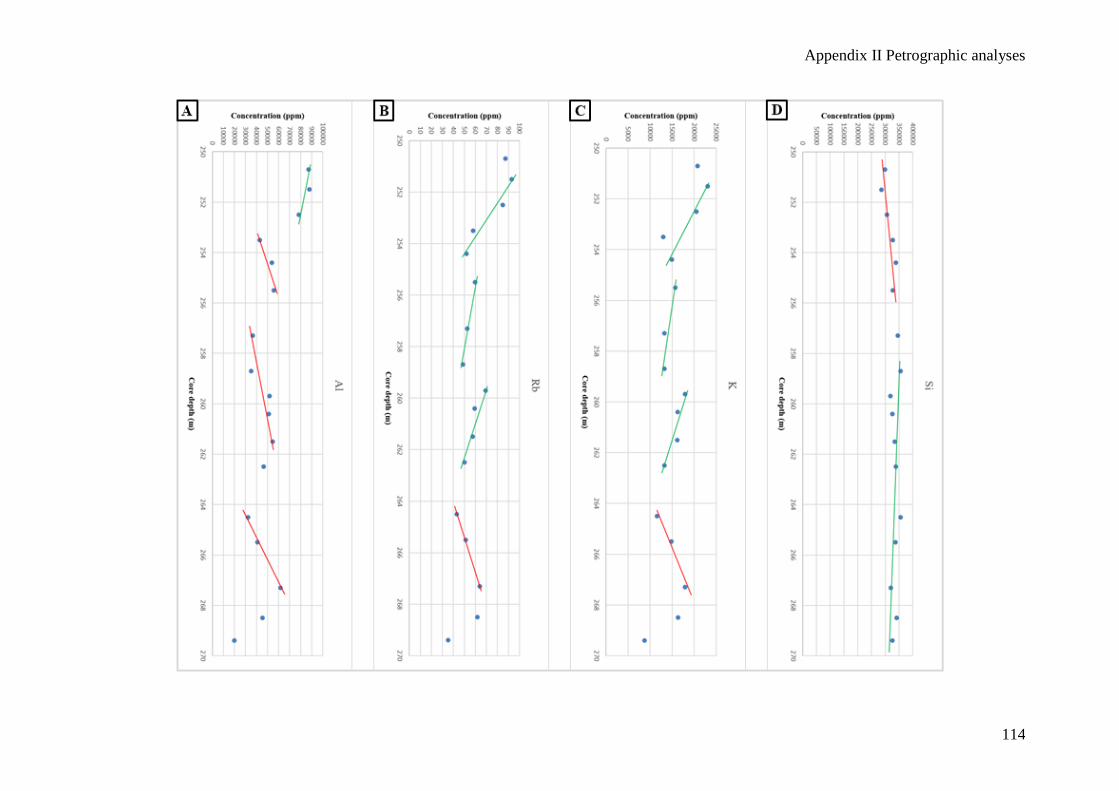
Appendix II Petrographic analyses
114
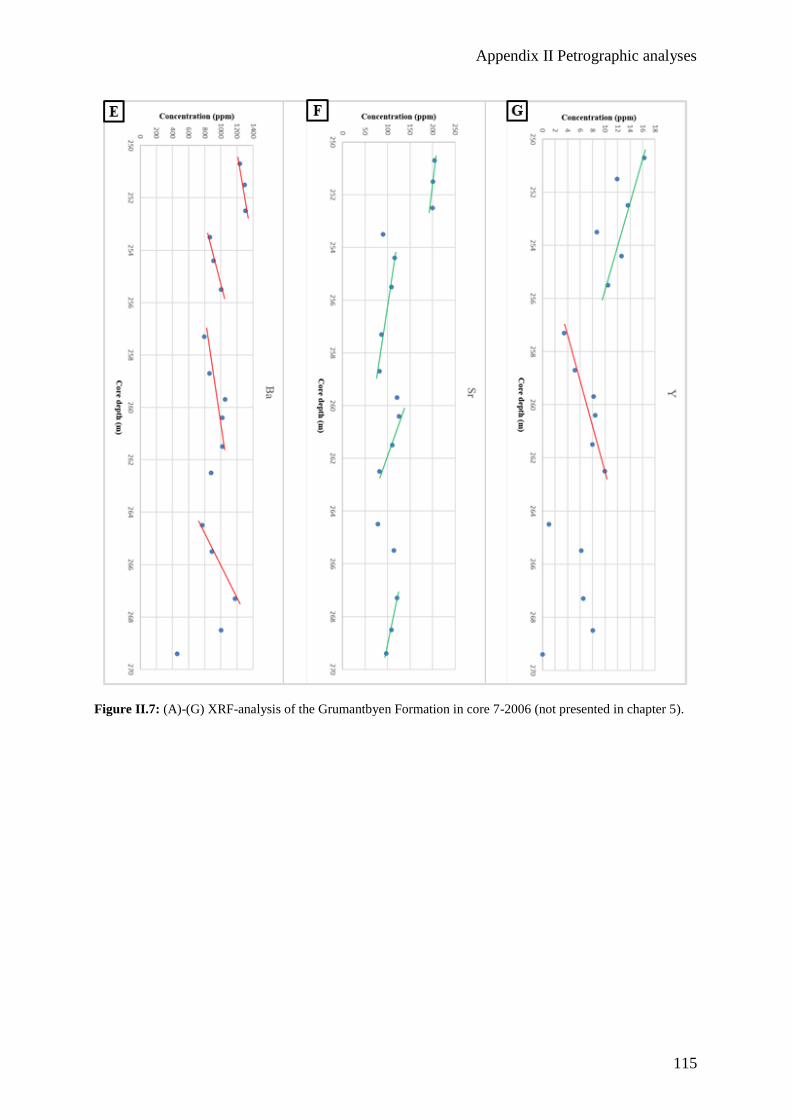
Appendix II Petrographic analyses
115
Figure II.7: (A)-(G) XRF-analysis of the Grumantbyen Formation in core 7-2006 (not presented in chapter 5).
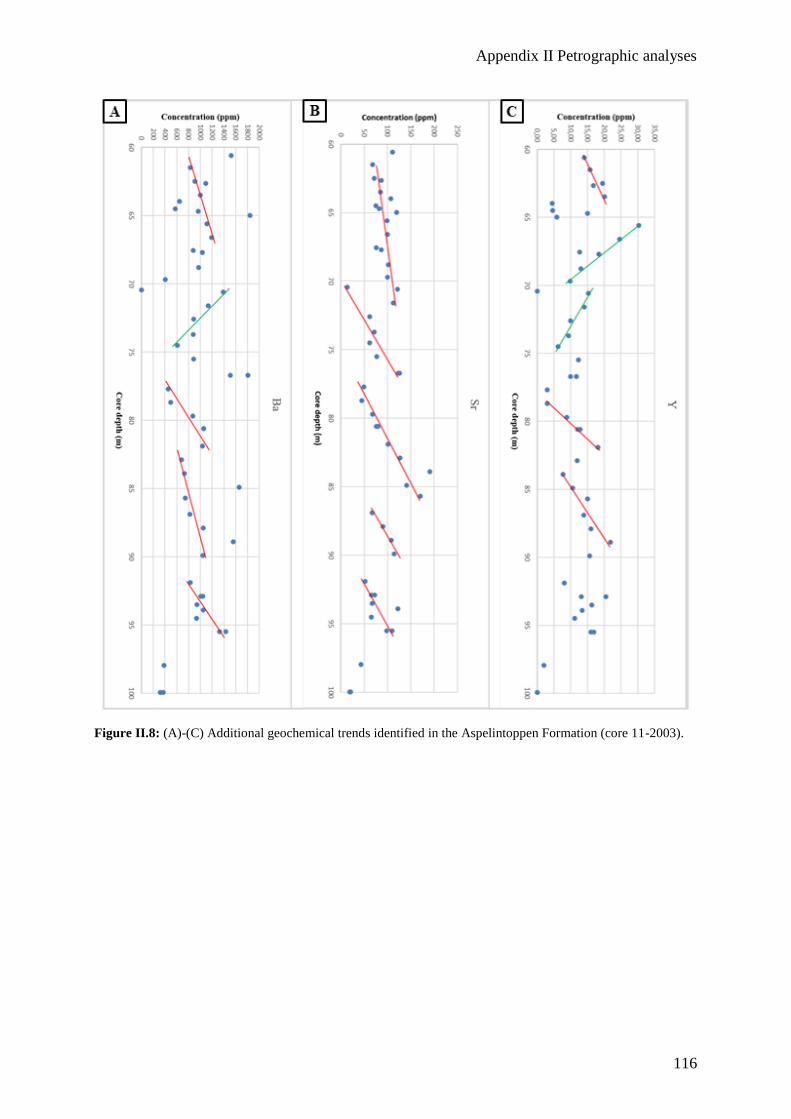
Appendix II Petrographic analyses
116
Figure II.8: (A)-(C) Additional geochemical trends identified in the Aspelintoppen Formation (core 11-2003).
Appendix III Optical micrographs
117
APPENDIX III: Optical micrographs
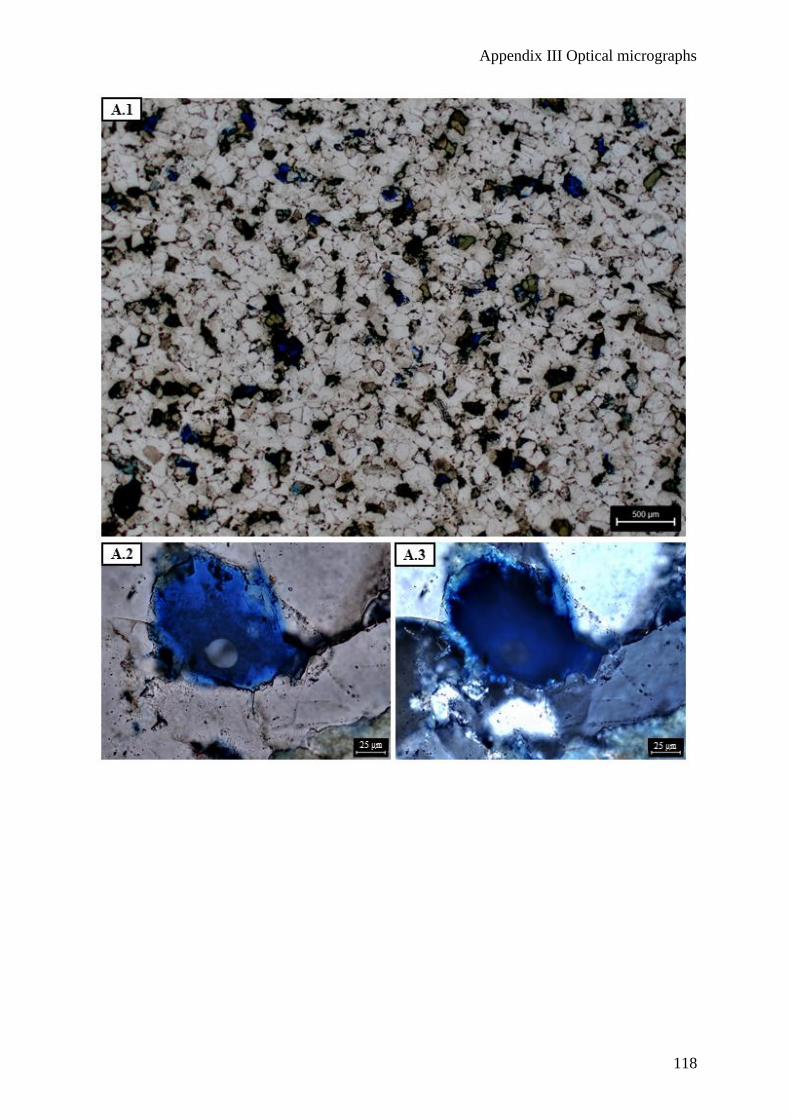
Appendix III Optical micrographs
118
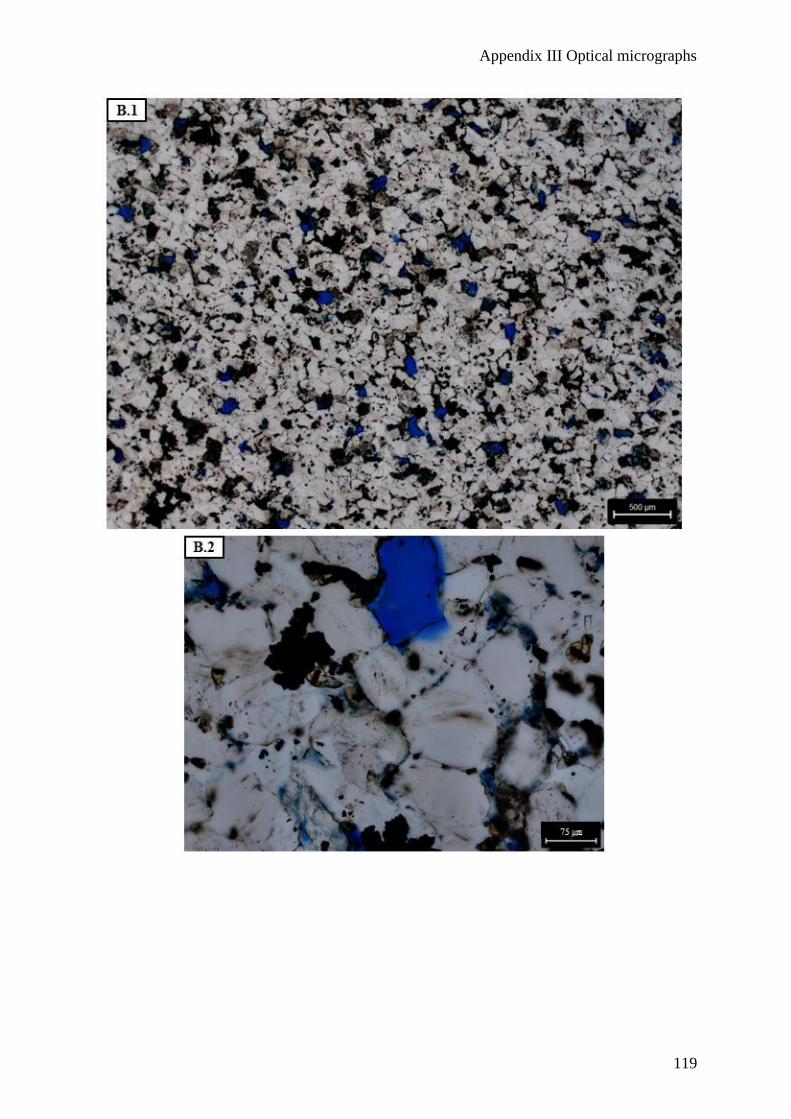
Appendix III Optical micrographs
119
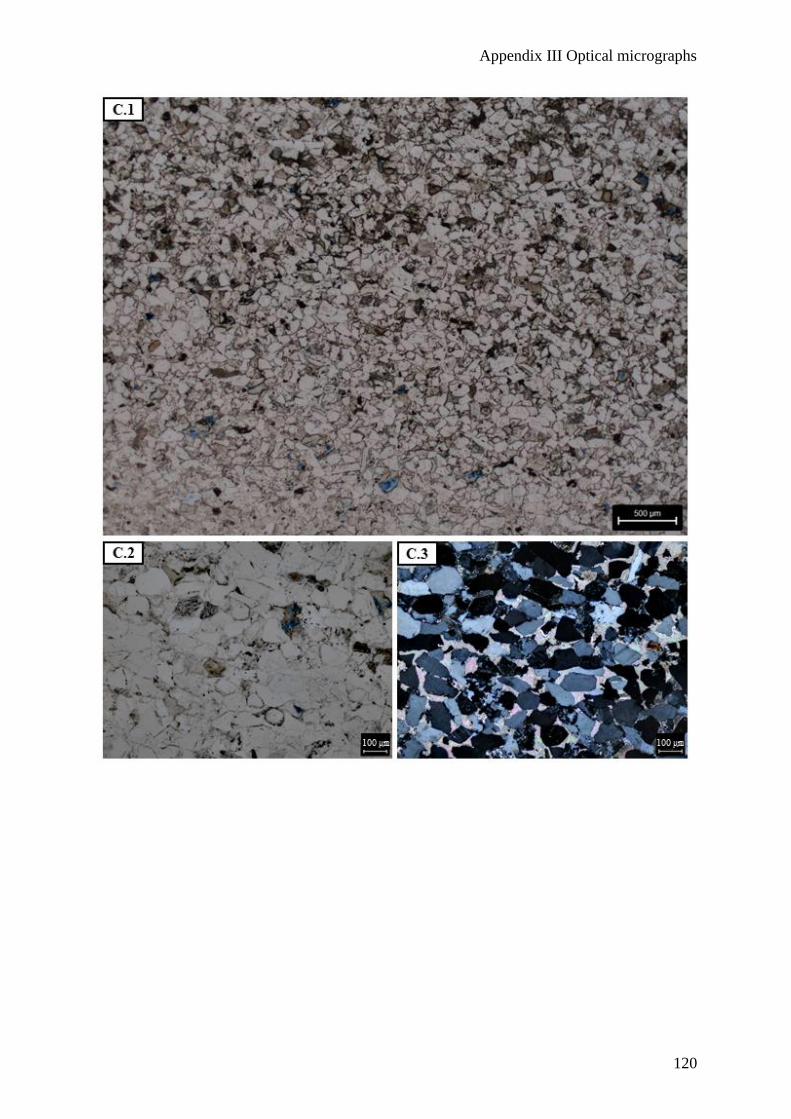
Appendix III Optical micrographs
120
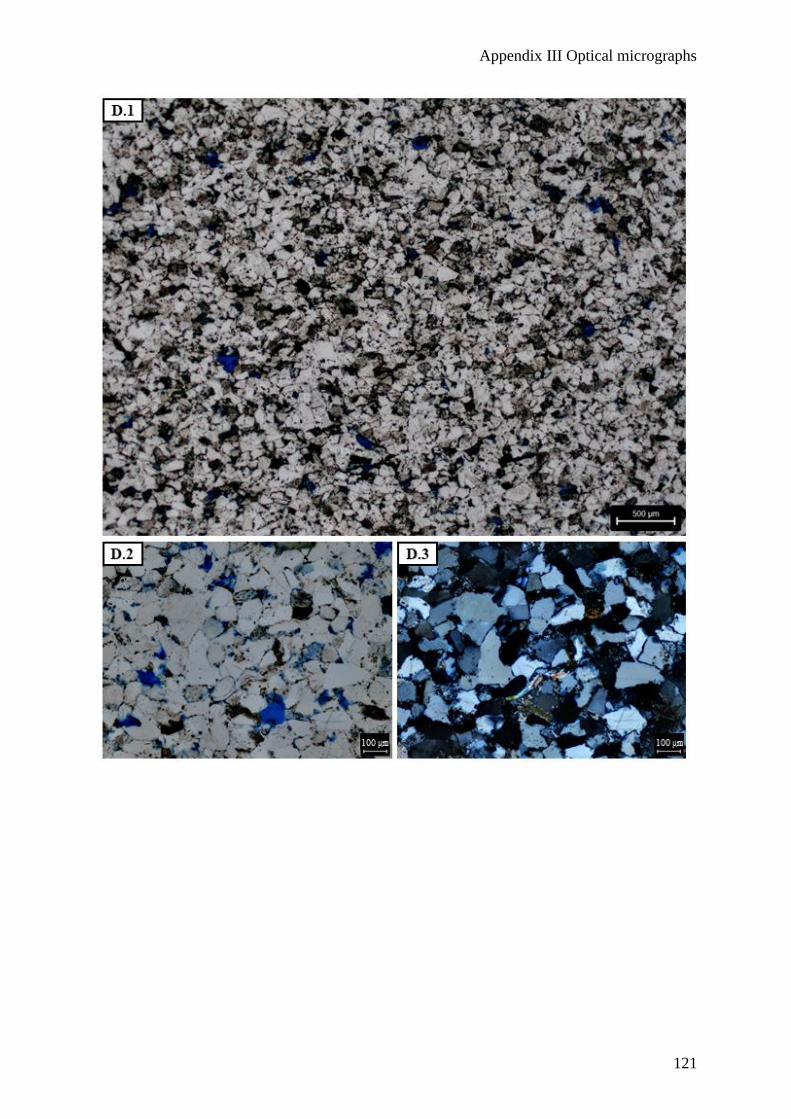
Appendix III Optical micrographs
121
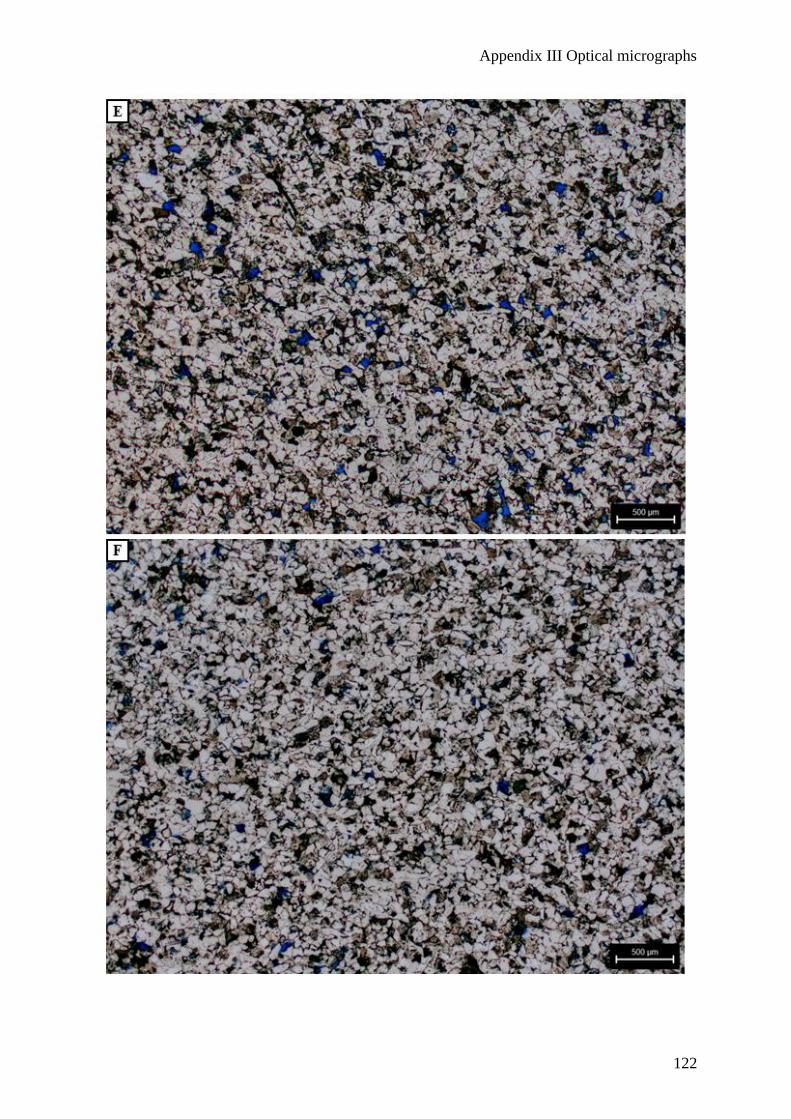
Appendix III Optical micrographs
122
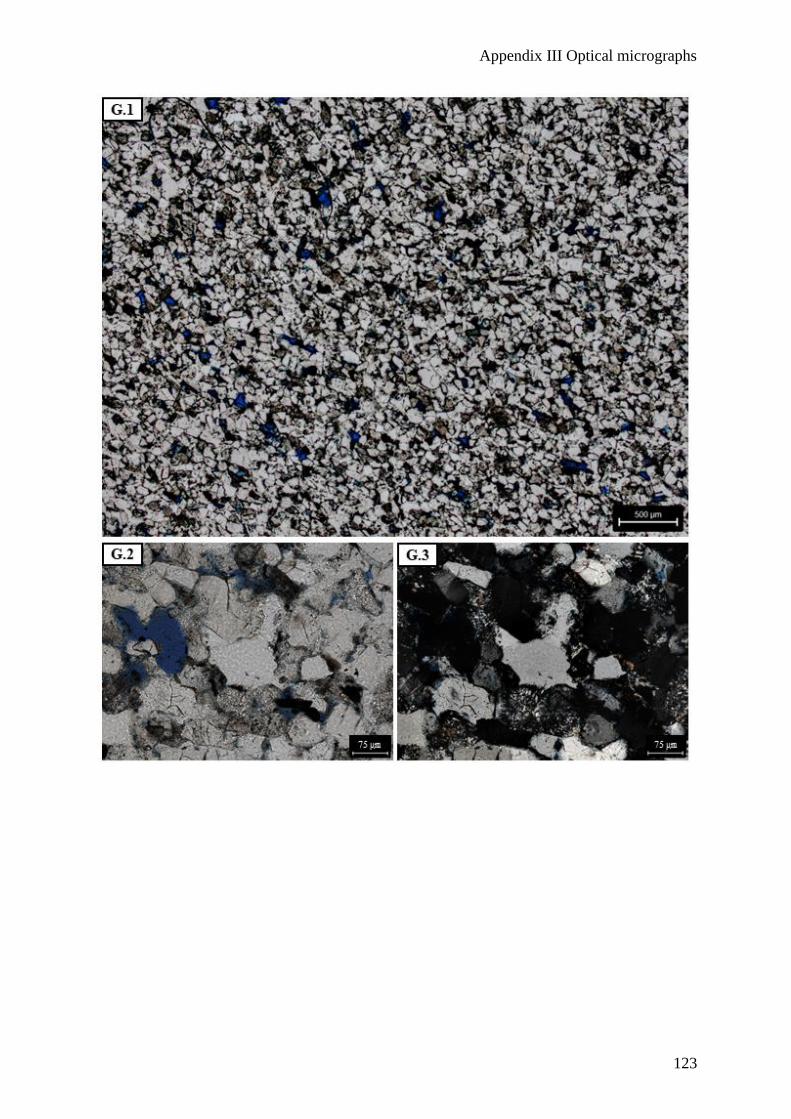
Appendix III Optical micrographs
123
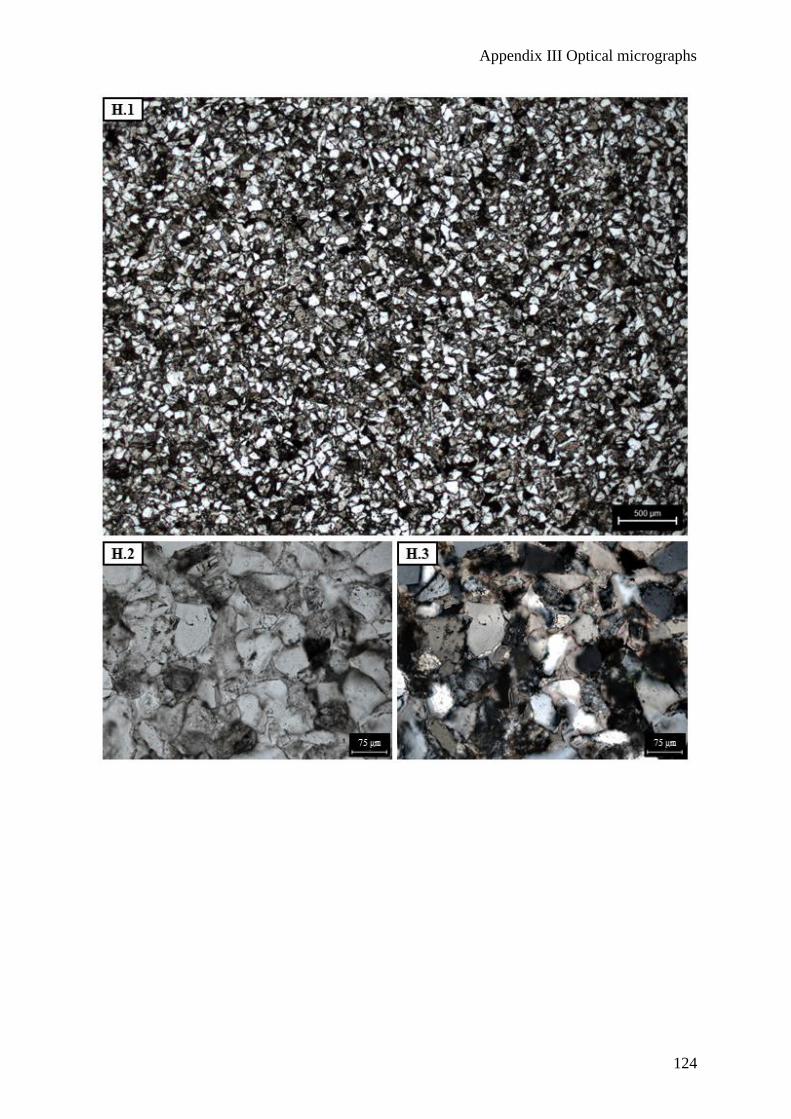
Appendix III Optical micrographs
124
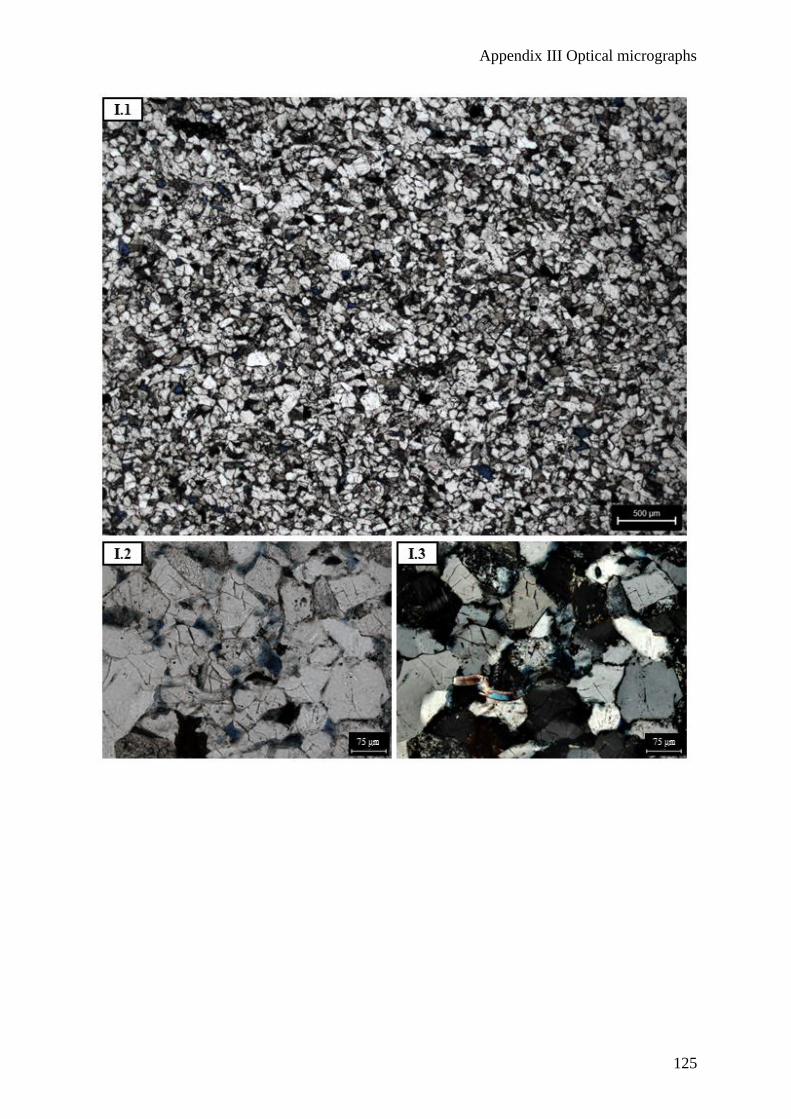
Appendix III Optical micrographs
125
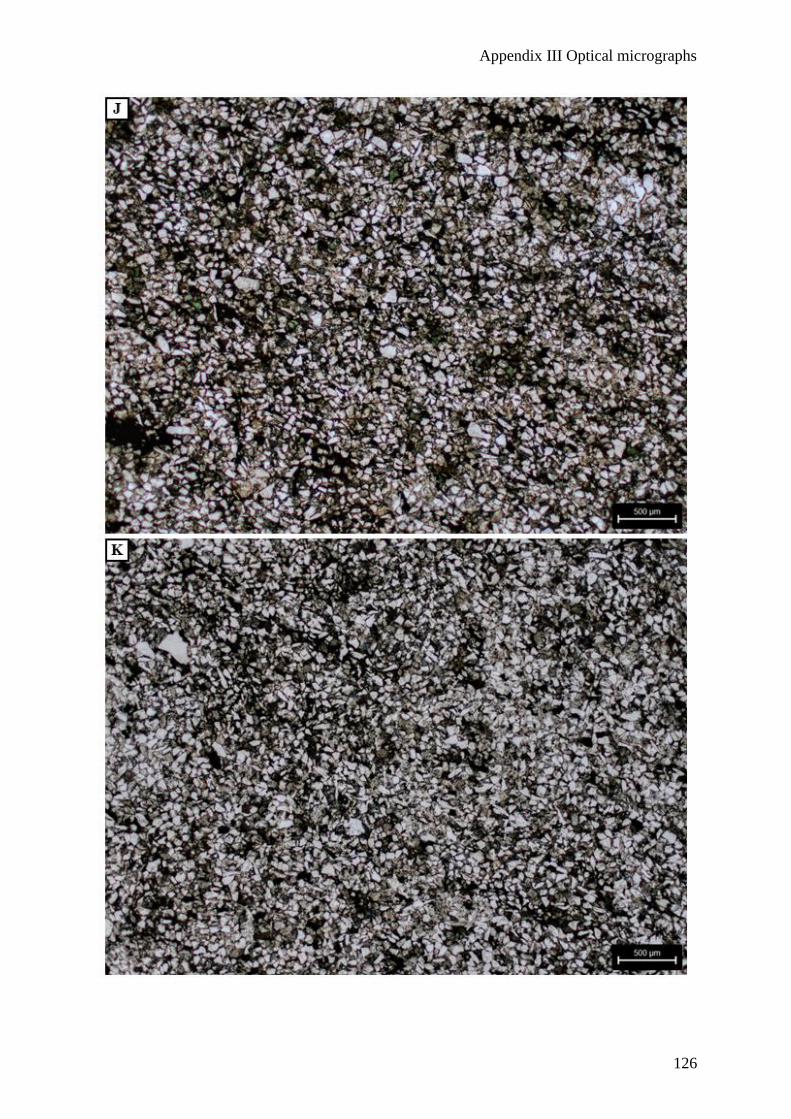
Appendix III Optical micrographs
126
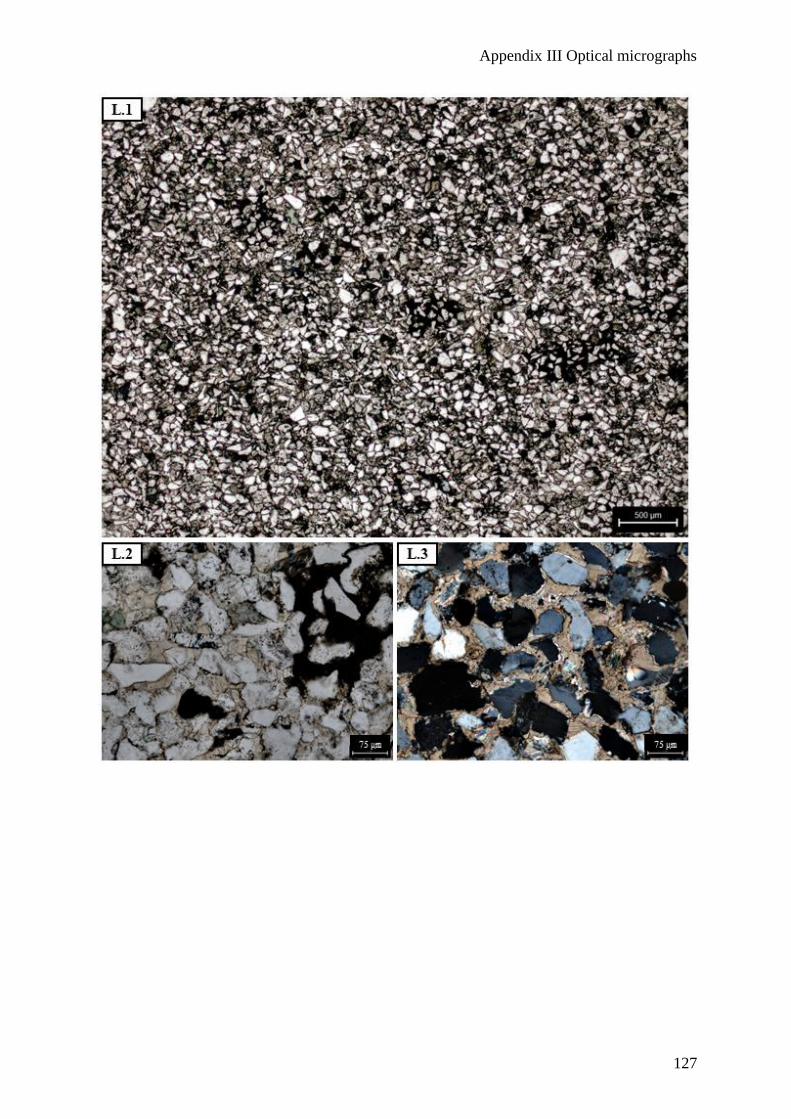
Appendix III Optical micrographs
127
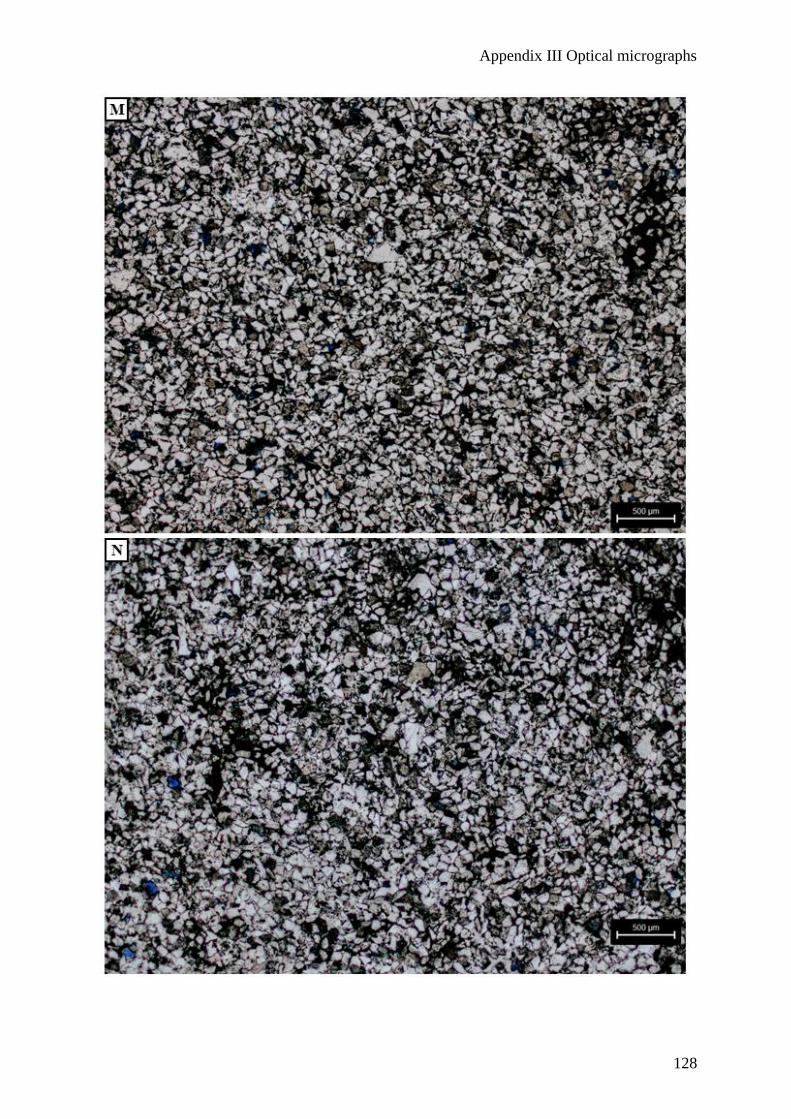
Appendix III Optical micrographs
128
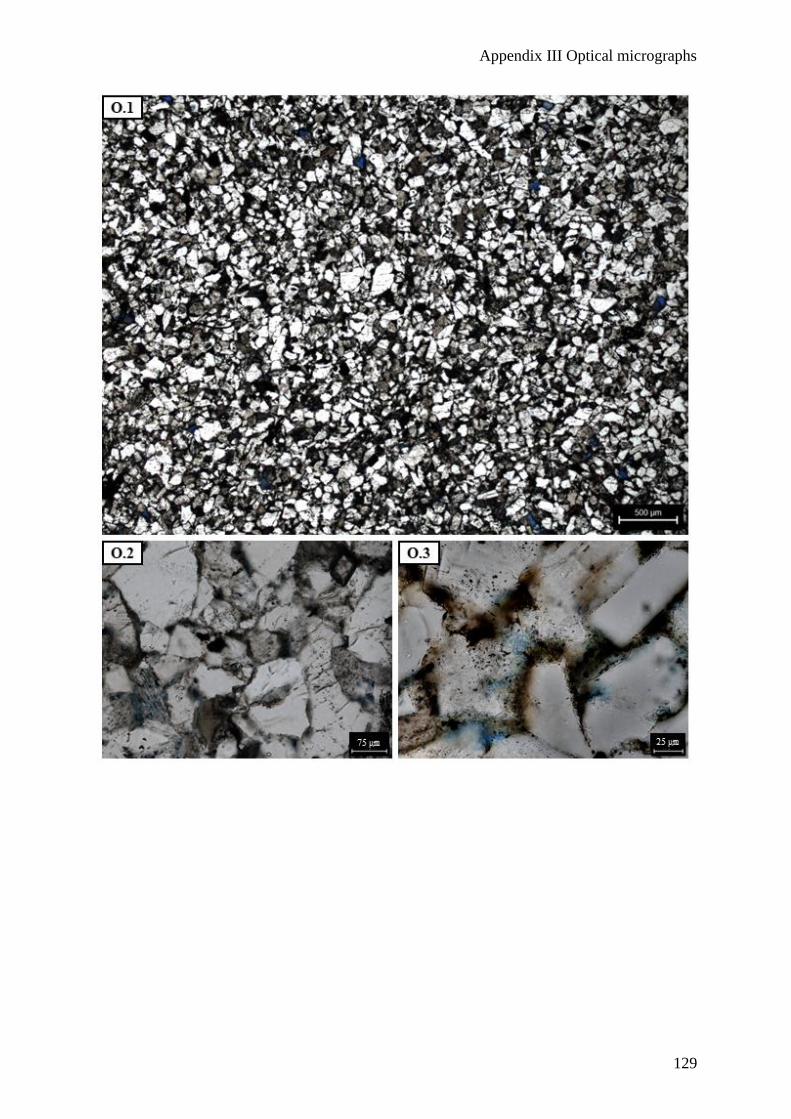
Appendix III Optical micrographs
129
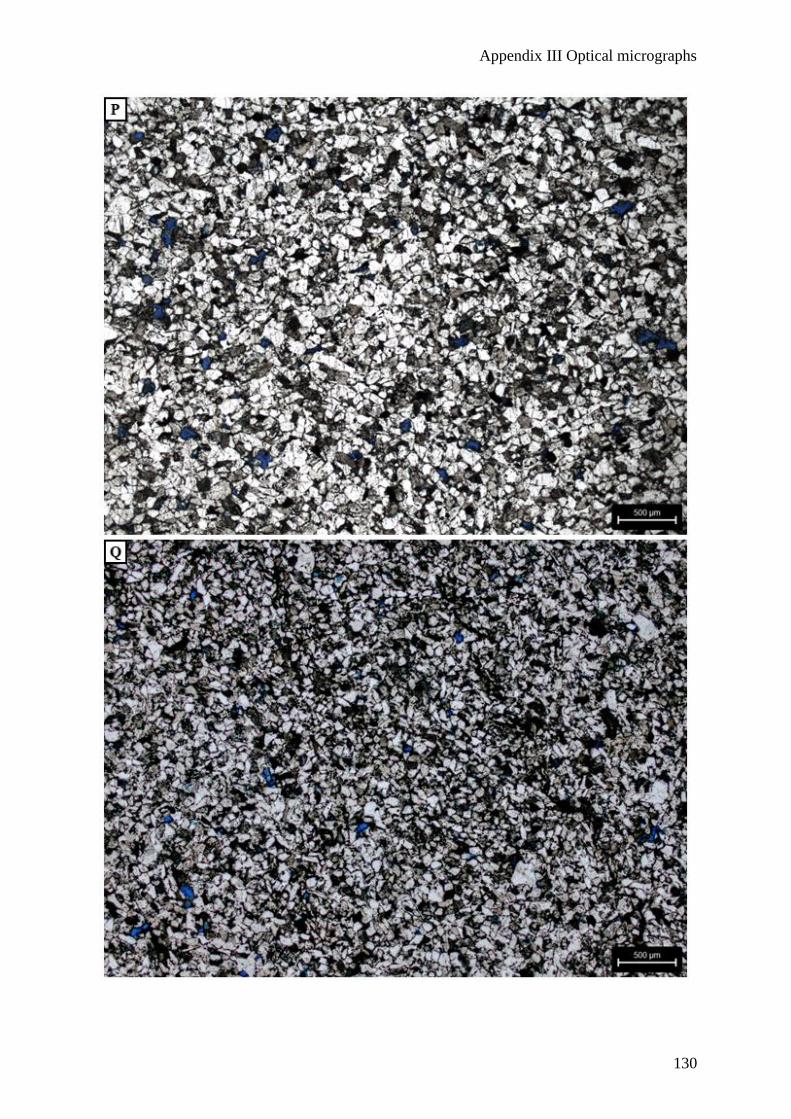
Appendix III Optical micrographs
130
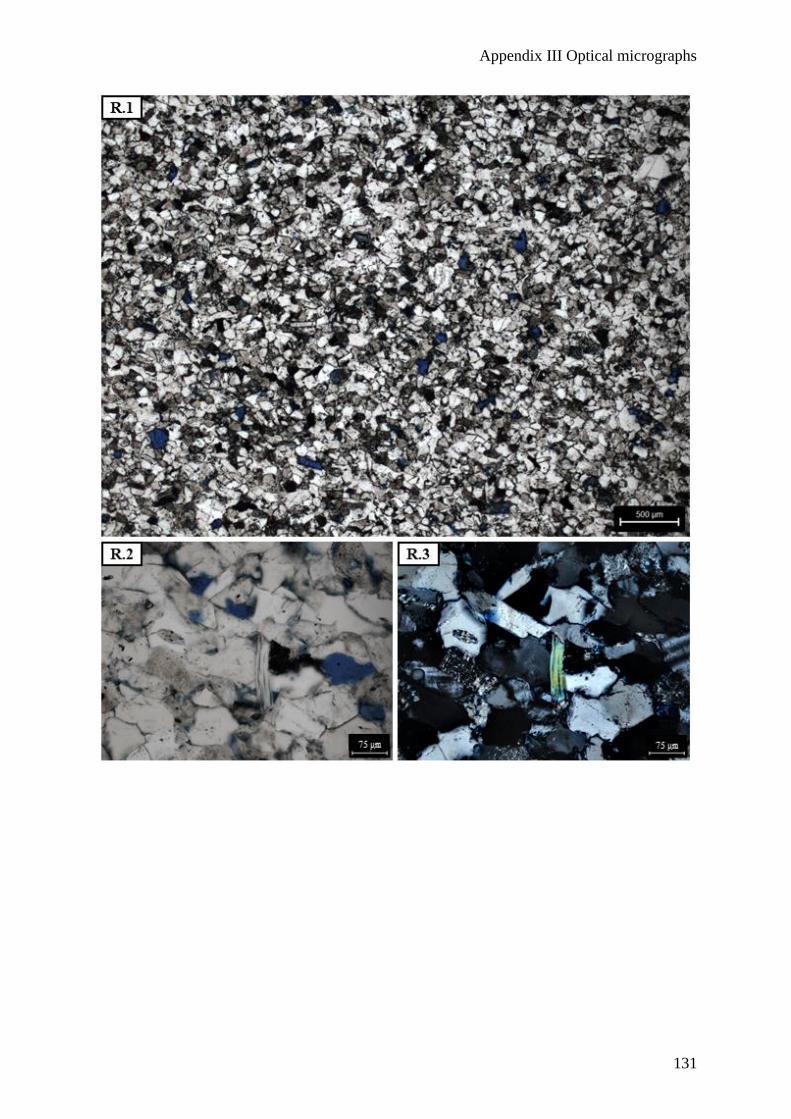
Appendix III Optical micrographs
131
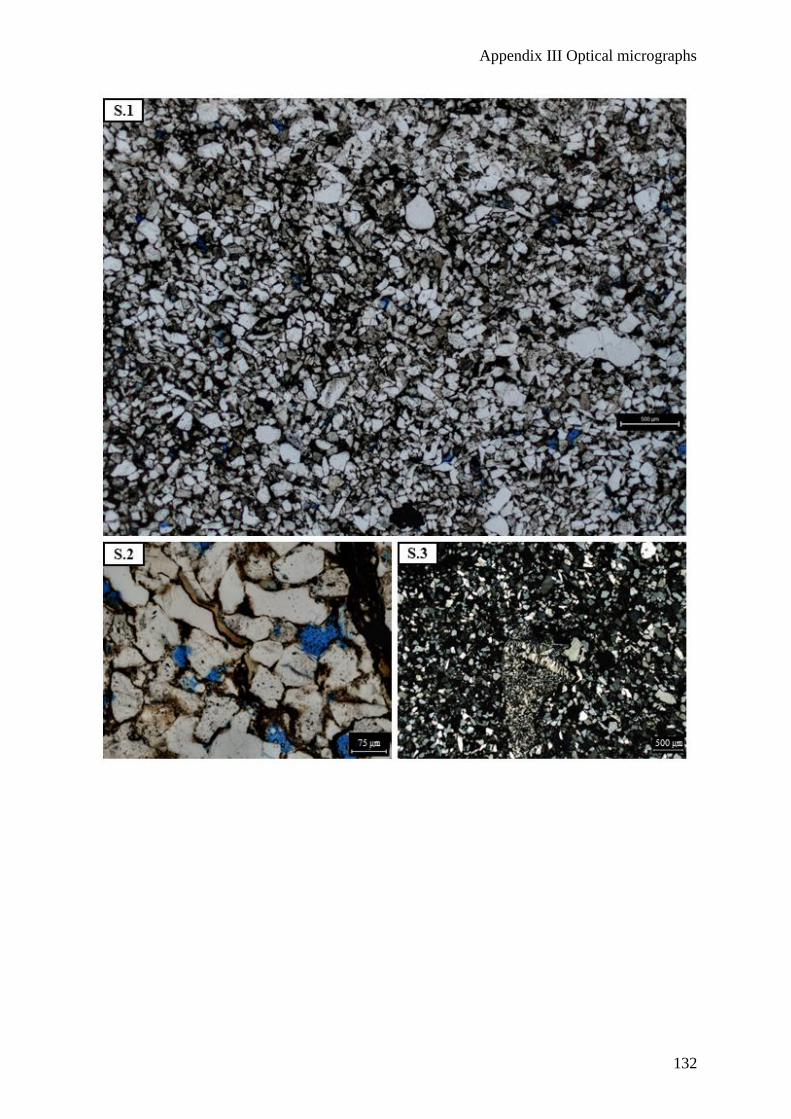
Appendix III Optical micrographs
132
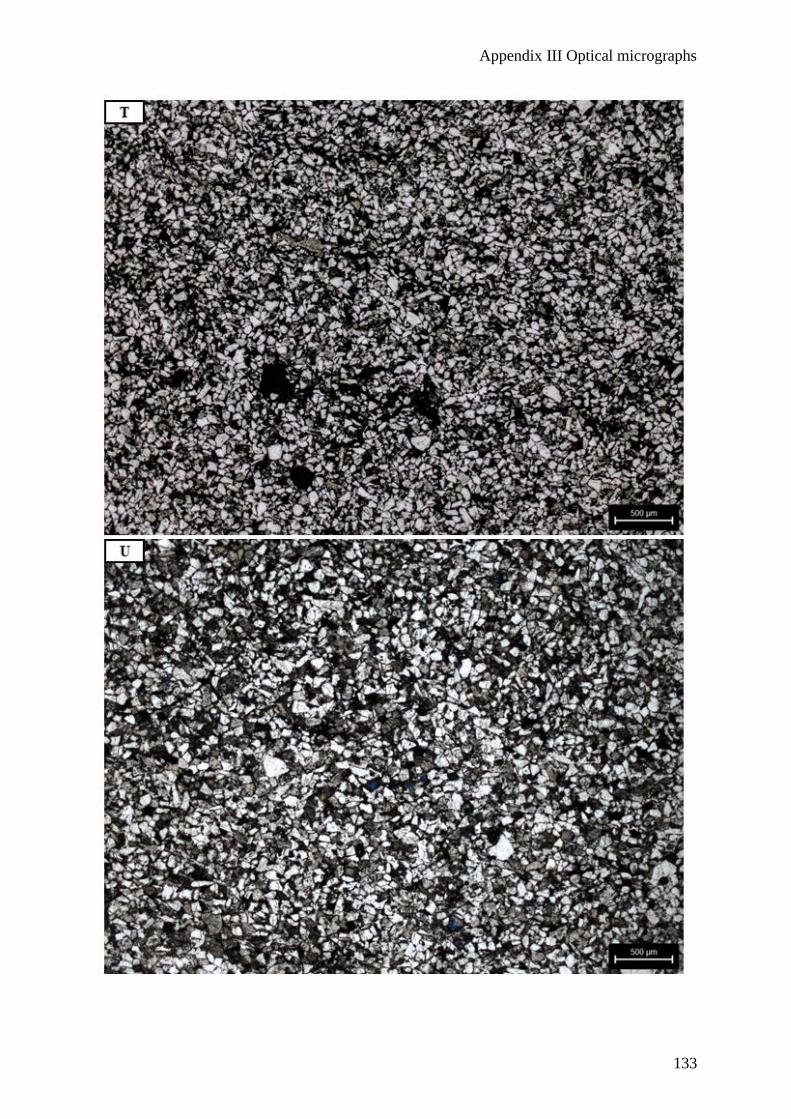
Appendix III Optical micrographs
133
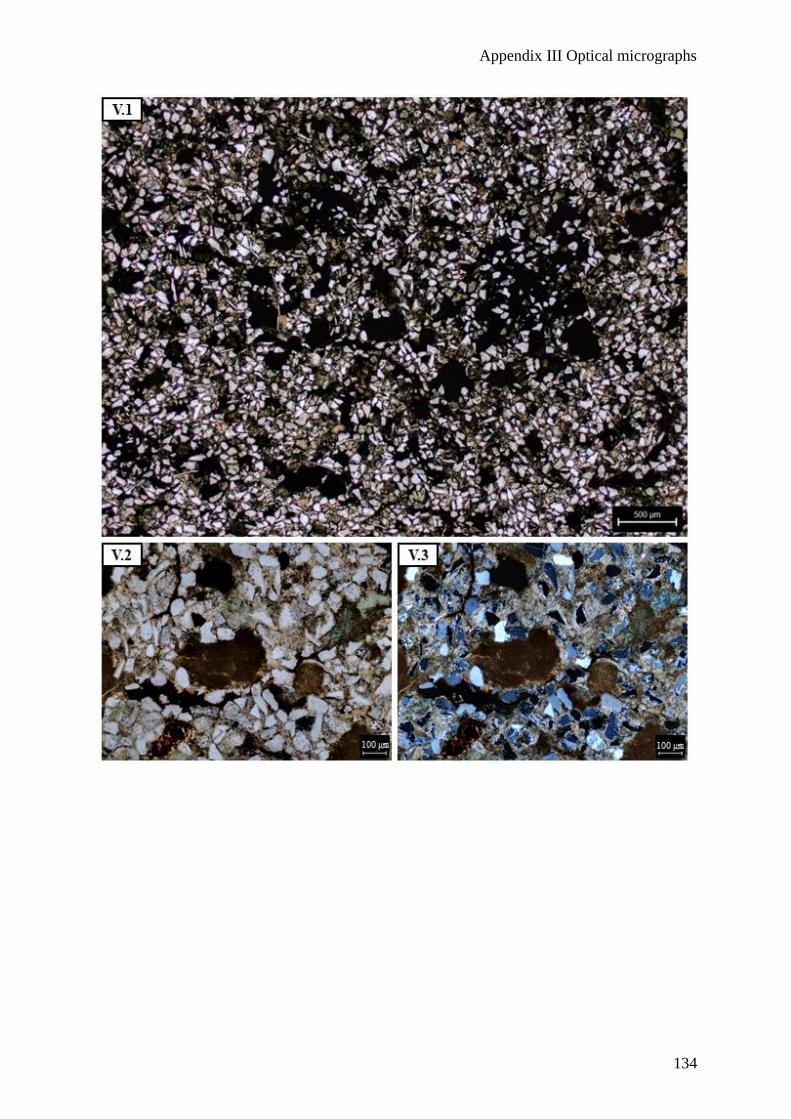
Appendix III Optical micrographs
134
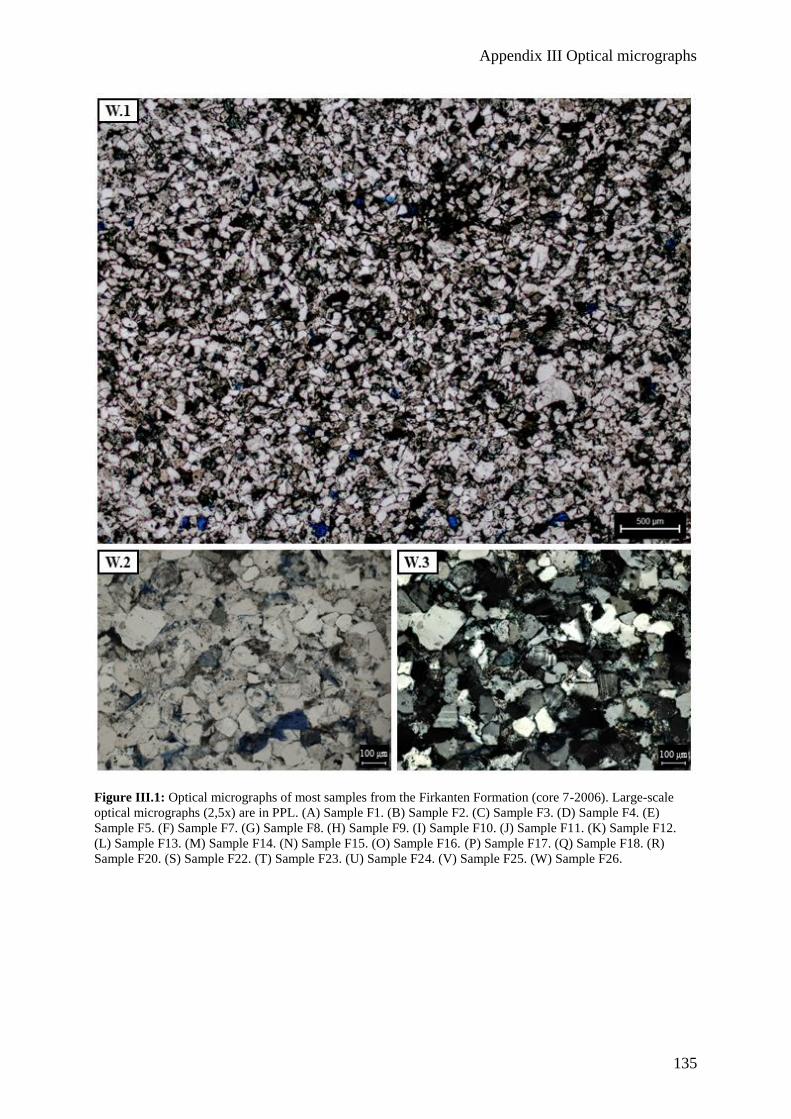
Appendix III Optical micrographs
135
Figure III.1: Optical micrographs of most samples from the Firkanten Formation (core 7-2006). Large-scale
optical micrographs (2,5x) are in PPL. (A) Sample F1. (B) Sample F2. (C) Sample F3. (D) Sample F4. (E)
Sample F5. (F) Sample F7. (G) Sample F8. (H) Sample F9. (I) Sample F10. (J) Sample F11. (K) Sample F12.
(L) Sample F13. (M) Sample F14. (N) Sample F15. (O) Sample F16. (P) Sample F17. (Q) Sample F18. (R)
Sample F20. (S) Sample F22. (T) Sample F23. (U) Sample F24. (V) Sample F25. (W) Sample F26.
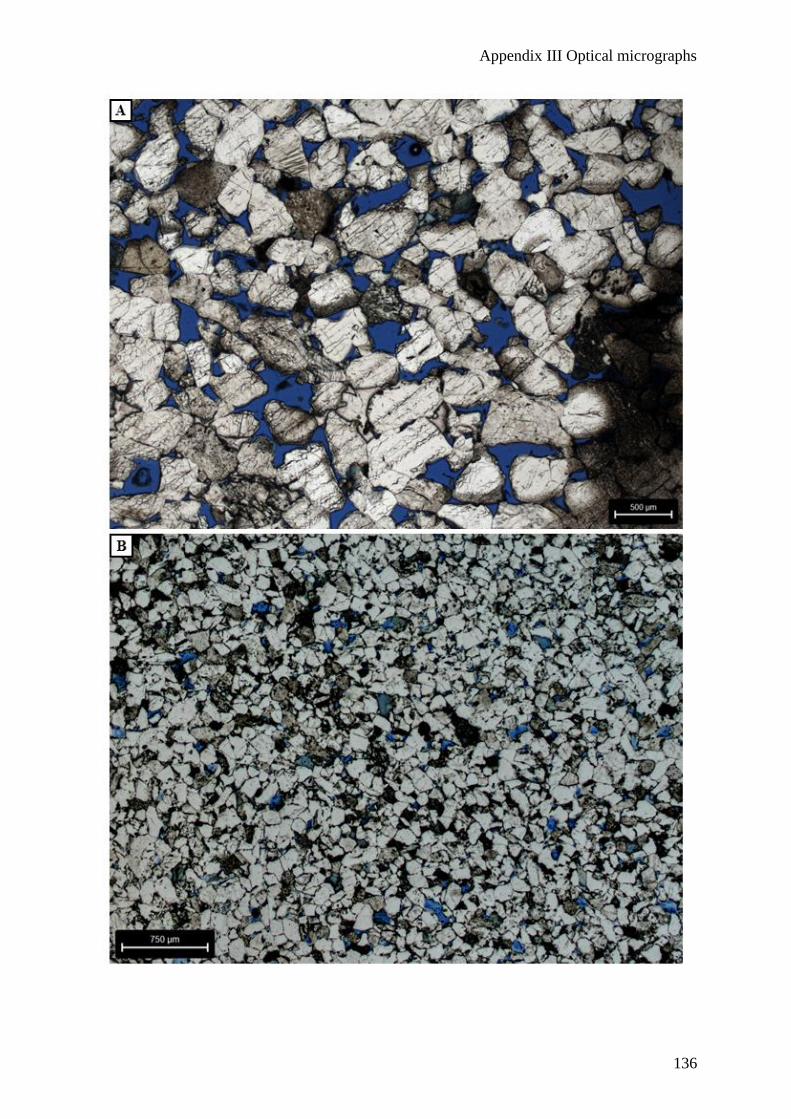
Appendix III Optical micrographs
136
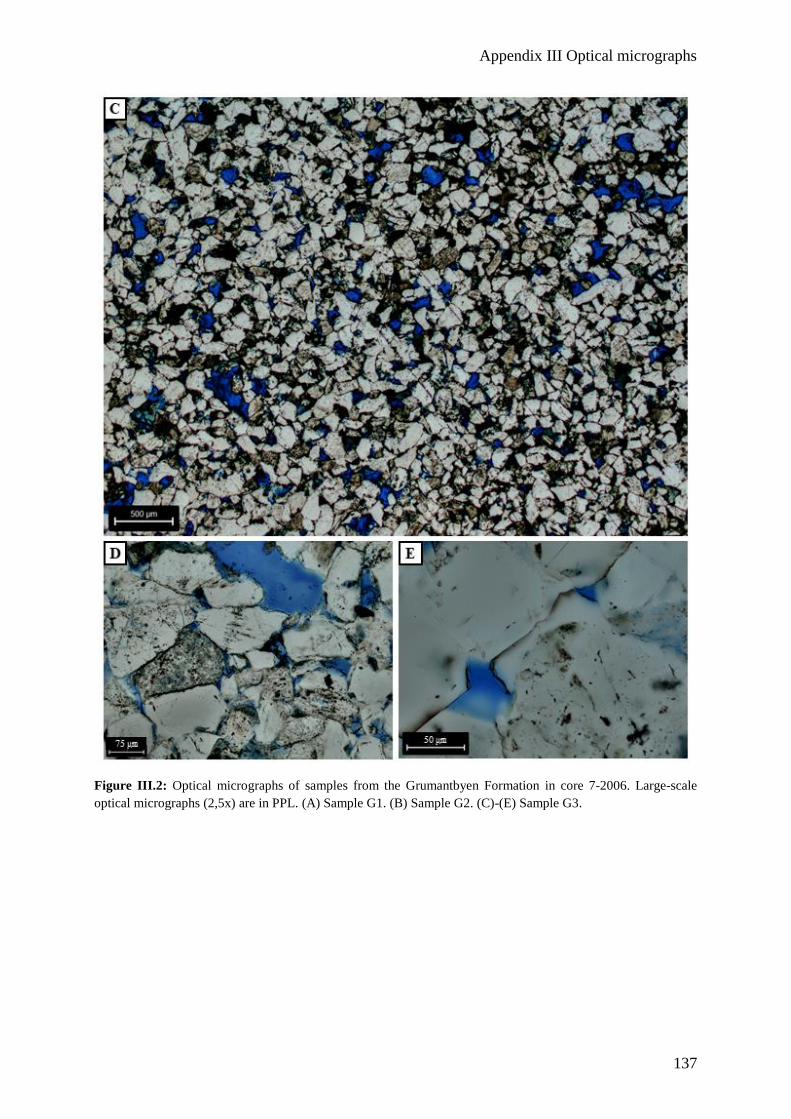
Appendix III Optical micrographs
137
Figure III.2: Optical micrographs of samples from the Grumantbyen Formation in core 7-2006. Large-scale
optical micrographs (2,5x) are in PPL. (A) Sample G1. (B) Sample G2. (C)-(E) Sample G3.
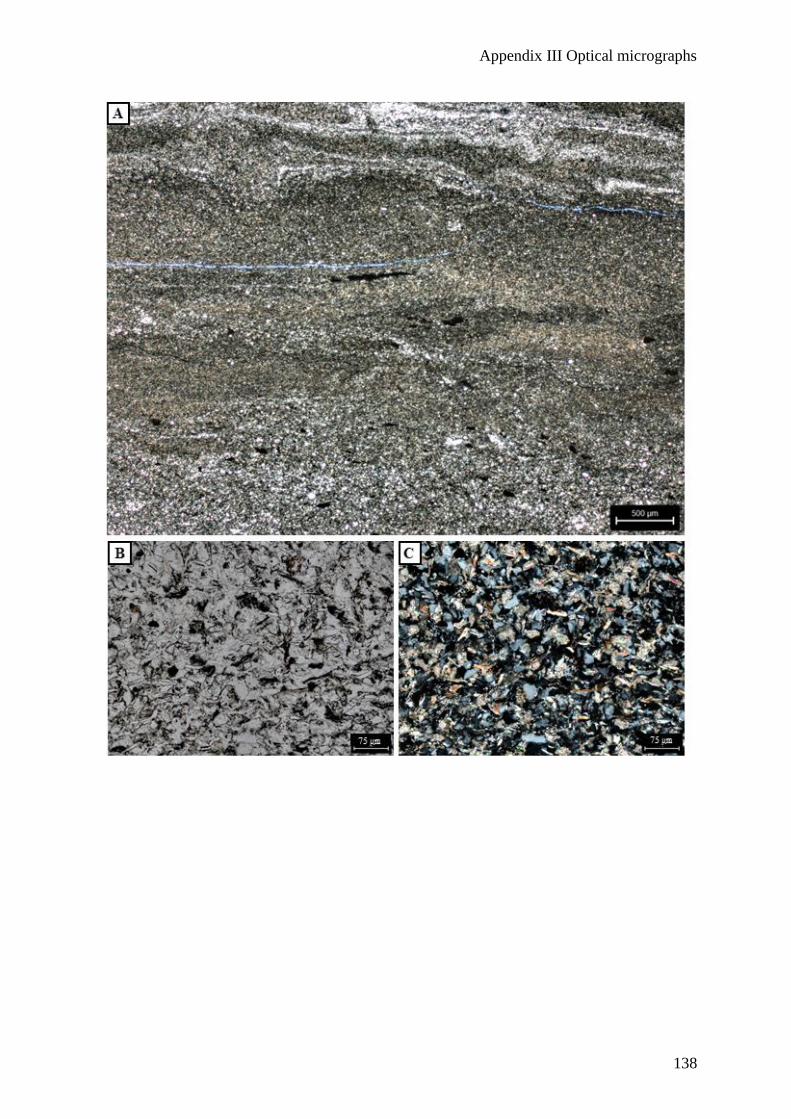
Appendix III Optical micrographs
138
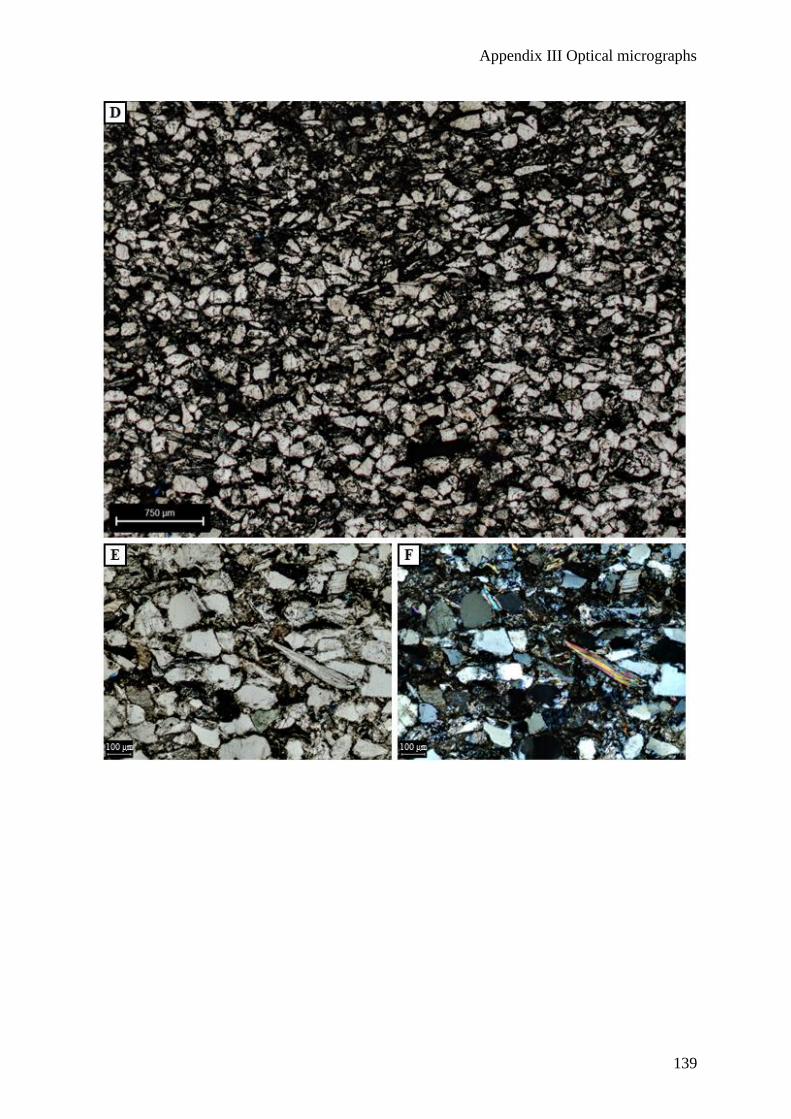
Appendix III Optical micrographs
139
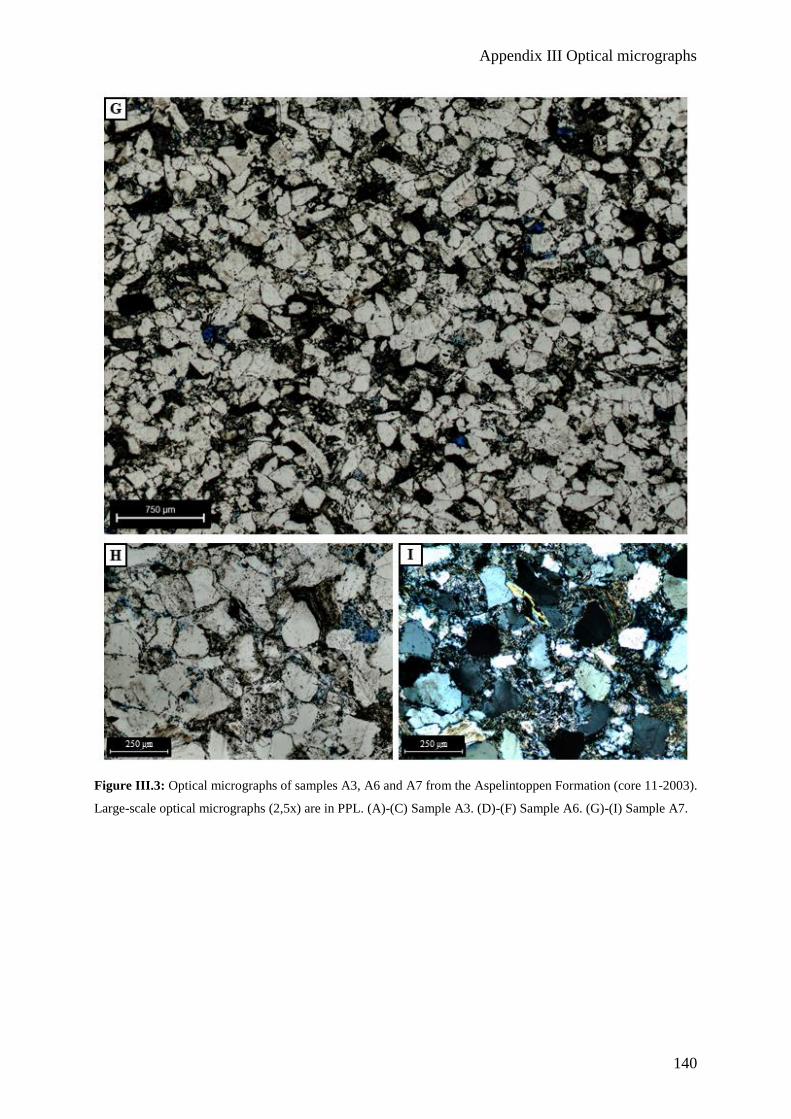
Appendix III Optical micrographs
140
Figure III.3: Optical micrographs of samples A3, A6 and A7 from the Aspelintoppen Formation (core 11-2003).
Large-scale optical micrographs (2,5x) are in PPL. (A)-(C) Sample A3. (D)-(F) Sample A6. (G)-(I) Sample A7.