Petrogenesis of High Heat Producing Granite: Implication ...€¦ · High Heat Producing granites...
65
Petrogenesis of High Heat Producing Granite: Implication for Mt Painter Province, South Australia Kamonporn Kromkhun, (M.Sc) Geology and Geophysics School of Earth & Environmental Science University of Adelaide Thesis submitted for the degree of Doctor of Philosophy in the Faculty of Science, University of Adelaide January 2010
Transcript of Petrogenesis of High Heat Producing Granite: Implication ...€¦ · High Heat Producing granites...
Petrogenesis of High Heat Producing
Granite: Implication for Mt Painter
Province, South Australia
Kamonporn Kromkhun, (M.Sc)
Geology and Geophysics
School of Earth & Environmental Science
University of Adelaide
Thesis submitted for the degree of Doctor of Philosophy
in the Faculty of Science, University of Adelaide
January 2010

Geology, Lithology and Petrography
1
Chapter 1 Overview
Granite is the most abundant rock type in continental crust and
typically contains higher concentrations of radioactive elements (U, Th and
K) than other rock types (Table 1.1; Haenel et al., 1988; Royden, 1991). Heat
production values per unit value (A) can be calculated from the equation of
Rybach (1988);
A = p(9.52cU+2.56cTh+3.48cK) 10-5
P Density in kg/m-3
CU Uranium concentration in ppm
CTh Thorium concentration in ppm
CK Potassium concentration as a percentage
Granites typically contain heat production values ranging between 2-
20 μWm-3 with an average of 2.53 μWm-3 (Table 1.1; Haenel et al., 1988).
Some granites are documented to contain unusually high concentrations of
radioactive elements leading to high values of heat production. In this study,
granites with heat production values more than 5 μWm-3 are classified as
High Heat Producing Granites (HHP Granites).
High Heat Producing granites are economically important because of
their association with some ore deposits and their potential for geothermal
energy. For example, uranium deposits are often found near HHP granite
provinces such as Mt Painter Province, South Australia (Coats and Blissett,
1971), the Gabal Ribdab Area, Southeast Desert Egypt (Ibrahim et al., 2001)
and the Streltsovka, Russia (Chabiron et al., 2003). Some tin deposits are also
related to HHP granites such as the Lake District, UK (Plant et al., 1986) and
the Patinga Mine, Brazil (Lenharo et al., 2003). HHP granites may also
provide the heat source for explorable geothermal energy resources. Studies
of possible geothermal resources are now developing in South Australia and
Europe (Hurter et al., 2003). However, the genesis of HHP granites has not
been studied in detail. The questions of why and how the granites contain
unusually high U, Th and K concentrations have not been satisfactorily
answered.

Chapter 2
2
The radioactive elements, U, Th and K, are mostly concentrated in
upper continental crust (Table 1.2). These elements are compatible with
partial melts, which leads to high U, Th and K concentrations within more
evolved rocks (Rudnick and Fountain, 1995). Thesse evolved rocks tend to
occurred at shallow depth in the crust. Therefore there is a generak trend for
decreasing U, Th and K concentrations with increasing depth in the crust.
Table 1.1 Average heat production of some rock types. Lithology U (ppm) Th (ppm) K (wt%) A (μWm-3)
Granite/Rhyolite 3.9 16 3.6 2.53
Granodiorite/Dacite 2.3 9 2.6 1.51
Diorite/Andesite 1.7 7 1.1 1.06
Gabbro/Basalt 0.5 1.6 0.4 0.29
Peridotite 0.02 0.06 0.006 0.01
Undepleted mantle 0.02 0.09 0.02 0.01
Ocean Island Basalt 1.02 4 1.2 0.67
Limestone 2.0 1.5 0.3 0.66
Shales and siltstone 3.7 12 2.7 2.1
Quartzite 0.6 1.8 0.9 0.37
Note: heat production values based on U, Th and K from Haenel et al., 1988 Table 1.2 Average U, Th and K concentrations of main lithospheric
reservoirs. U (ppm) Th (ppm) K2O (wt%) A (μWm-3) Source
Bulk crust 1.3 5.6 1.81 0.91 Kemp and Hawkesworth, 2003
Upper crust 2.7 10.5 2.80 1.71 Kemp and Hawkesworth, 2003
Middle crust 1.3 6.5 2.30 1.02 Kemp and Hawkesworth, 2003
Lower crust 0.02 1.2 0.61 0.15 Kemp and Hawkesworth, 2003
Depleted peridotites 0.006 0.04 0.01 0.01 Fowler, 1990
Undepleted mantle 0.02 0.1 0.02 0.01 Fowler, 1990
Chondritic meteorites 0.013 0.04 0.078 0.01 Turcotte and Schubert, 1982
1.1 Granite classification
Granites have been classified according to criteria such as the assumed
petrogenesis, mineralogy, geochemistry and tectonic setting. Examples are;
alphabetic classification (S-, I-, A-, C- and M-type granites; Chappell and
White, 1974; Kilpatrick and Ellis, 1992), magnetite- and ilmenite-series
granites (Ishihara, 1977), R1-R2 discrimination diagrams (De la Roche et al.,
1980), trace element discrimination diagrams (Pearce et al., 1984) and Fe
number, modified alkali-lime index (MALI) and aluminum saturation index
Geology, Lithology and Petrography
3
(ASI; Frost et al., 2001). However, none of these granite classification
schemes is based on U, Th and K elements, and thus HHP granites have not
yet been independently classified and may in fact transgress other
classifications. However most HHP granites are evolved calc-alkaline
intrusions emplaced late in orogenic cycles and are alkaline-subalkaline (Plant
et al., 1984), they are most typically a subtype of the A-type granite group
(Table 1.3). Moreover, definitions of A-type granites that are based on
petrochemical and geochemical criteria are granites characterised by high
LILEs (Large Ion Lithophile Elements) and HFSEs (High field strength
elements) abundances and alkali-calcic to alkalic compositions.
Table 1.3 Characteristics of S-, I- and A type granites. Granite type Tectonic
environment
Chemical signature Typical minerals
S-type Orogenic Metaluminous to strongly
peraluminous, high 18O/16O, 87Sr/86Sr
Muscovite, garnet, cordierite,
tourmarine
I-type Orogenic Metaluminous Biotite, hornblende
A-type Anorogenic, rift-
related
Metaluminous to mildly
peralkaline, Fe-enriched, high
LILE and HFSE
Fe-biotite, Na-amphibole, Na-
pyroxene, hedenbergite, fayalite,
titanite
1.2 A-type granites
The A-type granite category was firstly defined by Loiselle and
Wones (1979) to describe granites that have an alkaline composition, contain
anhydrous minerals, crystallized under low oxygen fugacity and emplaced in
intraplate or anorogenic settings. Since the introduction of the term A-type
granite, numerous studies have discussed their petrography, geochemistry,
sources characteristics, the role of fluids, isotopic signatures, petrogenesis and
tectonic settings. The results show that the category A-type granite has
diverse rock types, compositions and tectonic settings and may involve
multiple processes.
Most A-type granites are characterised by high K2O, Fe/(Fe+Mg), and
Rb/Sr, enriched high field strength elements (e.g. Zr, Hf, Nb and Ta) and
depleted Ca, Ba, Sr and Eu (King et al., 2001). Several genesis models of A-
type granites have been proposed, which involve crustal and mantle sources,
including; fractionation of mantle-derived magma, low degrees of partial

Chapter 2
4
melting of lower-crustal granulite, anatexis of undepleted I-type tonalitic
crustal sources and metasomatism of granitic magma (Jung et al. 1998 and
references therein). These granitic rocks have been recognized to have formed
in a variety of within-plate and late to post orogenic settings (Eby, 1992). A-
type granites are distributed throughout the geological times; however they
are more abundant in the Proterozoic period (Kemp and Hawkesworth, 2003).
Most of these granitic rocks are coeval with mafic intrusions that suggest
some components of mantle input.
1.3 High Heat Producing Granites
High K, Th and U granites are named according to their mineralogy
and mineral proportions including biotite granite, alkali granite,
monzogranite, albite granite, rapakivi granite and topaz granite. HHP granites
may be pink, red, white and grey, with variable grain size (fined- to coarse-
grained). They are mainly composed of quartz, coarsely perthitic alkali
feldspar, plagioclase, biotite, microcline, microperthite and Fe-hornblende,
and contain accessory zircon, titanite, allanite, apatite, thorite, Th-rich
uranitite, chevkinite, epidote, monazite, fluorite and magnetite. HHP granites
are generally leucocratic and typically exhibit porphyritic, granophyric or
rapakivi textures with some seriate textures. The granites are characterised by
high SiO2 (up to 78 wt%) and K2O compositions, and low levels of CaO,
MgO, P2O5, Al2O3, Fe2O3 and MgO. These characteristics of HHP granites
are also observed in tin granites (Tischendorf, 1977). They are high-K
granitiods with high alkali content and K2O/Na2O ratios. HHP granites
generally have high abundances of many trace elements (e.g. Rb, U, Th, Zr
and Ga), high HFSE, enriched in F, depleted in P and have high Ga/Al and
Rb/Sr ratios and negative Eu anomalies. Types of HHP granites are divided
by their petrographic, mineralogical and geochemical characteristics. They are
mainly metaluminous with some peraluminous to mildly peralkaline. The low
P2O5 content can be used to classify the granites as a subtype of topaz granites
(Taylor, 1992). Most HHP granites show mineralogical and petrographic
characteristics that correspond to within-plate granites on tectonic
discrimination diagrams using Rb and Y+Nb data (Pearce et al., 1984). They
are commonly emplaced during the late stage of an orogenic event and in

Geology, Lithology and Petrography
5
anorogenic settings (Bonin, 1987; Nardi and Bonin, 1991) and may be
associated with extensional fracture systems (Lenharo et al., 2002).
1.4 Distribution of High Heat Producing Granite
Based on definition of HHP granites containing heat production values
more than 5 μWm-3, HHP granites are found in Archaean, Proterozoic and
Phanerozoic terranes; however most are Proterozoic in age (Figure 1.1), with
examples being found in Asia, Australia, Europe, North America, South
America, Africa and Antarctica (e.g. Sandiford et al., 2002; Haapala and
Lukkari, 2005; Vander Auwera et al., 2003; Peterson et al., 2002; Liu, et al.,
2006).
Figure 1.1 Heat Production values versus age diagram (data from published
papers complied by Kromkhun, 2006).
1.4.1 Asia
HHP granites of Asia are found in India and China. In eastern China
and Inner Mongolia, HHP granites occur within the Central Asian Orogenic
belt (e.g. Qui, et al, 2004; Lui et al, 2005). The HHP granites (heat production
up to ~8 μWm-3) of Zhejiang and Fujian Provinces in SE China are Late
Cretaceous in age (Qui, et al, 2004). NE China granites range in age from

Chapter 2
6
Permian to early Cretaceous and normally do not have very high heat
production (<4 μWm-3, with the highest at 6 μWm-3; Wu et al, 2002). In
Northern Inner Mongolia, HHP granites show heat producing from 4 to 15
μWm-3 and their ages range from 149-111 Ma (Lui et al, 2005).
HHP granites in India are found in the Dharwar craton, Rajasthan and
eastern Singbhum and have ages ranging from Achaean to Mezoproterozoic
with heat production up to 13 μWm-3 (Kumar and Reddy, 2004; Misra et al.,
2002; Pandit and Khatatneh, 1998; Chaudhri et al., 2003).
1.4.2 Africa
In Africa, HHP granites have been reported from Egypt, South Africa,
Ethiopia, Nigeria and Namibia, with ages ranging from Phanerozoic to
Proterozoic. The Proterozoic Egyptian HHP granites are found in Gabal El
Fereyid and South Eastern Desert areas with the Arabo-Nubian Shield belt
(Adb El-Naby and Saleh, 2003; Abbady et al., 2006). They normally have
high uranium (up to 30 ppm) and low Th (up to 23 ppm) contents (Adb El-
Naby and Saleh, 2003; Abbady et al., 2006). Neoproterozoic HHP granites in
South Africa occur in the southwestern Saldania belt of the Western Cape
Province (Scheepers, 1995). The uranium and thorium concentrations are
correlated and they have a heat production average of 5 μWm-3 with the
highest being 12 μWm-3 (Scheepers, 1995). In Namibia, HHP granites are
found in central western Namibia and are known as the anorogenic
Damalaland and Gross Spitzkoppe granites (Frindt et al., 2004). They are
early Creataceous in age, with high radioactivity biotite granites having heat
production up to 22 μWm-3, with an average of 5 mWm-3. The Nigerian HHP
granites emplaced in the Cretaceous are known as Arfvedsonite granites.
They are prevalent in the northern sector of the Nigerian anorogenic ring-
complex province (Ogunleye et al., 2005) and are niobium- and uranium-rich
granites, with heat production up to 51 μWm-3 (Ogunleye et al., 2005).
1.4.3 North America
Proterozoic HHP granites of North America are reported from
Wyoming and central Colorado in the USA and from Canada. They have an
average heat production of 5 μWm-3. The 1.43 Ga Red Mountain monzonitic
Geology, Lithology and Petrography
7
granite of Wyoming is a Th-enriched HHP granite with heat production up to
8 μWm-3 (Anderson et al., 2003). In Colorado, the 1.08 Ga Pikes Peak
anorogenic granites commonly show low heat production values; however
fayalite-bearing granites show heat production values up to 6 m μWm-3
(Smith et al, 1999). The PalaeoproterozoicTrans-Hudson granites and
associated volcanic rocks in Canada have average heat production values of 7
μwm-3 with average U, Th and K2O of 8 ppm, 56 ppm and 5 wt% (Peterson et
al., 2002).
1.4.4 South America
In South America, Proterozoic HHP granites have mainly been
reported from the Amazonian and Sao Francisco Cratons within Brazil (e.g.
Agnol and de Oliveira, 2007; Costi et al., 2002; Juliani et al., 2002; Lenharo
et al., 2003). They are found in the Pitinga, the Goias areas of the Amazonian
Craton in Northern Brazil and along the border of the Sao Francisco craton in
northeast Brazil. The Pitinga Mine granites (2.2-2.4 Ga) show extremely high
radioactive element contents (U content up to 499 ppm and Th content up to
864 ppm) with heat production values up to 157 μWm-3 (Lenharo et al.,
2003). As a group, they comprise biotite granite, hornblende granite, rapakivi
and topaz-bearing granite (Lenharo et al., 2002; 2003) and they are associated
with greisen-, skarn-, and vein-type Sn (W-Be-Zn-Pb-Ag) mineralization. The
Goias HHP granites have lower heat production values than the Patinga
granites. The HHP granites of the Sao Francisco craton were intruded during
the Transamazonian cycle (~2.0 Ga) and have an average heat production of 5
μWm-3 (Pla Cid et al., 2000).
1.4.5 Europe
In Europe, Proterozoic HHP granites have been reported within the
Fennoscandian Shield of Norway, Finland and Poland. In southern Norway,
the HHP granites have heat production values up to 9 μWm-3 and show high
Th contents (Vander Auwera et al., 2003). The Wiborg granites (age of 1.65-
1.63 Ga) of Finland that have high heat production (heat production up to 17
μWm-3 with average 8 μWm-3) are rapakivi and topaz granites (Haapala and
Lukkari, 2005). Ferrro-potassic HHP granites of NE Poland include quartz
Chapter 2
8
monzonite, granodiorite and rapakivi-like granites, and were intruded at 1.5
Ga (Skridlaite et al, 2003). They have heat production values up to 12 μWm-3
and are characterized by high U and low Th contents. The Cretaceous HHP
granites were reported from Turkey and Permian HHP granites from Russia.
The Cretaceous HHP granites within Turkey are quartz monzonites and
syenite with HP values up to 16 μWm-3 with average of 6 μWm-3 (Kooksal et
al., 2004). They are typically Th-enriched with Th contents up to 121 ppm
(Kooksal et al., 2004).
1.4.6 Antarctica
HHP granites in Antarctica are poorly known. The HHP granites of
Antarctica are found in the Grove Mountains of East Antarctica an inland
continuation of the Pan-African Prydz Belt emplaced during 550 to 500 Ma
(Liu, et al., 2006). The granites at the Grove Mountains have heat production
up to 11 μWm-3 showing Th-riched HHP granites. Liu et al. (2006) suggested
that the granitoids of the Grove Mountains were emplaced in the extensional
environment of formerly overthickened crust. Proterozoic granites from the
Terre Adèlie Craton of Antarctica were collected from debris forming the
moraines contain low heat production values (less than 5 μwm-3) with average
U, Th and K2O contents of 3 ppm, 19 ppm and 5 wt%, respectively (Peucat et
al., 2002).
1.4.7 Australia
Many Proterozoic granites in Australia (more detail in Chapter 8) have
high heat production rates and these are shown in Table 1.4. In particular, the
HHP granites of the Mount Painter Province, Northern Flinders Ranges,
South Australia have average heat production values of 22 μWm-3, which is
approximately five times higher than normal granites. Because of extremely
high heat production values of the Mount Painter granites, these granites are
selected for detail studies which aim to understand petrogenesis of HHP
granites (see Chapters 2-7). Moreover, data from previous studies of
Australian regions where HHP granites are presented including Mount Isa
Inlier, Gawler Craton, Curnamona Craton (Broken Hill and Olary Domains)

Geology, Lithology and Petrography
9
and Arunta Inlier will be compared to the HHP granite of Mount Painter
Province (Chapter 8).
Table 1.4 Heat production values, age and U, Th, K2O contents of granites in Australia (data from Budd et al., 2001)
1.5 Thesis Aims
• To determine a definition and classification of HHP granites and
identify their sources and petrogenesis
• To describe the petrology, geochemistry, mineralogy and isotope
composition of felsic and mafic igneous rocks from Mount Painter Province,
• To identify the relative timing and petrogenesis relationship between
mafic and felsic igneous rocks from the Mount Painter Province
• To define tectonic evolutions of HHP granites and associated rocks
from the Mount Painter Province,
• To collate published data on the geochemical, geochronological,
isotopic characteristics of HHP granites from Australia to define, classify and
demonstrate their tectonic setting
1.6 Structure of Thesis
This thesis is divided into nine chapters;
• Chapter 1; this chapter introduces general characteristics of high heat
producing granites and their distribution. Aims of this project and thesis
structure are presented in this chapter.
a1172507
Text Box
NOTE: This table is included on page 9 of the print copy of the thesis held in the University of Adelaide Library.

Chapter 2
10
• Chapters 2 to 7 describe and characterize the Mesoproterozoic granites
and associated rocks from the Mt Painter Province. These chapters include
Chapter 2 summarizes the regional and local geological setting
and Mesoproterozoic igneous rock evolution based on previous works
at the Mount Painter Province and reports lithology and petrography
of felsic igneous rocks (including the Pepegoona Volcanics, Mt Neill,
Box Bore, Terrapinna, Wattleowie and Yerila granites and Yerila-
associated microgranular enclaves and mafic rocks. This chapter
describes their characteristics at outcrop, in hand specimen and thin-
section.
Chapter 3 presents geochemical characteristics of major and
accessory minerals (including feldspar, biotite, amphibole, zircon,
allanite, apatite, Ti minerals and U-Th minerals) from the felsic and
mafic igneous rocks. Descriptions of physical characteristics of
minerals are addressed using hand specimen and thin section samples.
The compositions (major and trace elements) of the minerals were
analysed using Electron Microprobe (EMP) and LA-ICP-MS at the
Adelaide Microscopy Centre, University of Adelaide.
Chapter 4 reports ages of the Mount Painter felsic and mafic
igneous rocks by in situ chemical U-Pb single zircon ages using LA-
ICP-MS at the Adelaide Microscopy Centre derived at the Adelaide
Microscopy Centre, University of Adelaide. This chapter also reports
zircon morphology and their U and Th contents and summarizes the
magmatic evolution of the Mount Painter Mesoproterozoic felsic-
mafic igneous rocks, between ~1600 to 1540 Ma.
Chapter 5 investigates the geochemistry of felsic and mafic
igneous rocks by studying the major, trace element and REE
concentrations using XRF and ICP-MS. Rock classifications, the
relationship between felsic and mafic rocks, their tectonic setting, and
petrogenesis of the Mount Painter rocks will be interpreted from
geochemical data from this study together with previous data (e.g.,
Johnson, 1987; Stewart and Foden, 2001).
Chapter 6 provides the radiogenic isotope compositions,
including Nd-Sm, Rb-Sr and Pb-Pb of whole rock samples, Pb-U

Geology, Lithology and Petrography
11
isotopic compositions of K-feldspar and Hf contents of zircons from
selected samples covering the dominant magmatic suites of both mafic
and felsic igneous rocks. Possible sources and petrogenetic processes
will be interpreted and discussed using data from this study and
previous work including whole rock Sm-Nd and Rb-Sr isotopes from
Stewart and Foden (2001) and Neumann (2001), and Pb isotope of
whole rock and K-feldspar from Neumann (2001). Analyses of whole-
rock Nd-Sm, Rb-Sr and Pb-Pb and K-feldspar Pb-U isotopes were
undertaken by using TIMS at University of Adelaide and the Hf
isotope composition of zircons was analysed by using MC-ICP-MS at
GEMOC, University of Sydney.
Chapter 7 addresses the petrogenesis of the HHP felsic and
mafic igneous rocks of the Mount Painter Province. Possible sources
and processes will be discussed and conclusion developed in this
chapter. Implications for the tectonic evolution of the HHP felsic-
mafic igneous rocks from the Mount Painter Province will be
discussed.
• Chapter 8 investigates the distribution of HHP granties from selected
terranes of Australia including Mount Isa Inlier, Gawler Craton, Curnamona
Craton (Broken Hill and Olary Domains) and Arunta Inlier. A possible
petrogenetic and magmatic evolution model for HHP granites for the
Australian continent will be discussed by using the geochemical database of
Geoscience Australia and published data.
• Chapter 9 presents a petrogenesis of HHP granites and concludes
characteristics and a petrogenesis for HHP granites from Mt Painter Province
and selected terranes of Australia.

Chapter 2
12
Chapter 2 Geology, Lithology and Petrography of magmatic rocks from Mt Painter Province
The Mt Painter Province is located in the northern Flinders Ranges,
approximately 680 kilometres NNE of Adelaide, South Australia (Figure 2.1).
It is part of the Curnamona Craton and has had a long history of mineral
exploration, particularly for uranium and copper although no major deposit
has been discovered. Copper mineralization was discovered in the overlying
Adelaidean sedimentary rocks and small secondary lead and zinc mines
operated between 1860 and 1920s (Hore et al., 2005). In addition, radium for
medical purposes was mined from uranium deposits near Mt Painter in the
1954. Since 1945, South Australia Department of Mines has explored and
identified a variety of mineralization types and more recently, epithermal gold
and breccias-hosted uranium mineralization has been targeted for exploration.
The area is also thought to have potential for geothermal energy, and this has
been the focus of recent work by energy companies (www.pir.sa.gov.au/
geothermal).
2.1 Previous work
Early geological studies of the Mt Painter Province focussed on the
copper and uranium mineralization of the basement and surrounding
Adelaidean sedimentary rocks (e.g. Mawson, 1923; Sprigg, 1954; Campana,
1956). Coats and Blissett (1971) provide the first detailed study of the
geology, structure, stratigraphy and economic geology of the Mt Painter
Province, focussing on the stratigraphy and timing relationships between the
sedimentary and igneous rocks of the basement and the Neoproterozoic cover.
Drexel et al. (1993) presented an update on the geochronology, stratigraphy,
structural and metamorphic geology of the Mt Painter Province, summarizing
the studies of Teale, (1979), Johnson (1980), Thornton (1980); Sheard et al.
(1992). The revision and distinction of the basement stratigraphy and
geochronology from Teale (1993a) and Teale and Flint (1993) provide a
comprehensive overview of the evolution of the Mt Painter Province as it was
understood at that time. Many investigations of the Mt Painter Province have
been carried out at the University of Adelaide (e.g. Wall, 1995; Neumann,

Geology, Lithology and Petrography
13
1996, 2001; Paul, 1998; McLaren, 2001) have added to the understanding of
the stratigraphic and tectonic-metamorphic relationships, and geological
evolution. Recent workers have studied the relationship between the high heat
flow and heat production of the Mt Painter Province and its metamorphic,
metasomatic and tectono-thermal history during the Phanerozoic (e.g. Paul et
al., 1999; McLaren et al., 2002; Elburg et al., 2001, 2003).
2.2 Geological setting
The Mt Painter Province consists of the Mt Painter and Mt Babbage
Inliers (MPI and MBI), two basement inliers located within the northeastern
most part of the Adelaide Fold Belt (Figure 2.1). The south-eastern margin of
the Mt Painter Province is the Paralana Fault Zone, a long-lived structure that
shows signs of movement druing mid-Tertiary (Froster et al., 1994). The
Flinders Ranges are adjacent to the Paralana Fault Zone that resulted in the
Mt Painter Province thrust contacted over the Curnamona craton (Teasdale,
1993). The Mt Babbage Inlier is separated from the Mt Painter Inlier by the
Yudnamutana Trough, a deep depositional trough that formed by a
transcurrent fault system, and in which over five kilometres of
Neoproterozoic Adelaidean sedimentary rocks were deposited (Johnson,
1980). The basement comprises metasediments deformed and metamorphosed
to amphibolite facies during the Paleoproterozic (Teale, 1993a). A number of
granitic bodies and associated felsic volcanics subsequently intruded in to the
metasediment-dominated basement during the time interval 1580-1550 Ma,
which was overlain by Neoproterozoic sedimentary rocks that are part of
Adelaide Fold Belt. Both the basement and cover rocks were deformed and
metamorphosed during the Delamerian Orogen approximately 515 - 450 Ma
and subsequently in the Ordovician (Elburg et al., 2001).
Paul (1998) suggests that there are three main tectono-thermal
episodes in the Mt Painter Province. The first episode includes the onset of
Palaeoproterozoic metasediment and the onset of Palaeoproterozoic
tectonothermal activity. The second episode involves a pause in
tectonothermal activity during which the Freeling Heights Quartzite was
deposited and accumulated in a Mesoproterozoic thermal event that included
the extrusion of HHP volcanic and granitic intrusions. There was then a 700

Chapter 2
14
Myr hiatus before the onset of the third episode which began with the
Neoproterozoic rifting and deposition of a thick package of sedimentary rocks
of the Adelaide Fold Belt, up to the end of the Delamerian Orogen.
Deformation of the Mt Painter Province and Mt Babbage Inliers are similar,
however Delamerian folding, which was controlled by pre-existing structural
grain, has caused different structural orientation in these two inliers (NE-SW
for the Mount Painter Inlier and E-W for the Mt Babbage Inlier; Robertson et
al., 1993). Tectonism at ~1550 Ma may have caused N-E trending shearing
and the formation of crustal fractures, shear zones and foliation which Late
Mesoproterozoic and Neoproterozoic mafic dykes were intruded along
(Robertson et al., 1993). The British Empire Granite, normal S-type granites
intruded into the Mt Painter Inlier at the end of Delamerian, has
crystallization ages of 440-450 Ma (McLaren et al., 2006).
2.3 Mesoproterozoic magmatic rocks
The Mesoproterozoic magmatic province of the Mt Painter Province
consists of a high volume of granitic rocks with lesser amounts of felsic
volcanic rocks and with minor mafic magmas occurring as enclaves and
dykes (Figure 2.2). The older Proterozoic magmatic episode resulted in the
extrusion of the Pepegoona porphyritic volcanics, are dated at 1645 Ma using
Rb/Sr method (Compston et al., 1966). The second magmatic event occurred
between about 1575 and 1560 Ma. During this event, felsic volcanic
magmatism formed the Hart Creek rhyolite (1576±2 Ma; Teale, 1993b) and
the Gunsight Prospect dacitic tuff (age of 1575±14 Ma; Teale, 1993b). The
Mt Neill granite was intruded at 1569±14 Ma (Teale, 1993b) and was altered
between 1575 Ma and 1560 Ma; (Stewart and Foden, 2002). The Petermorra
porphyritic volcanics of the northern Mt Babbage Inlier have been dated at
1560±3 Ma (Teale, 1993b). Box Bore gneissic granite that yields an age of
1555±15 Ma (Teale et al., 1995) is strongly deformed and altered. The
Terrapinna and Wattleowie granites are interpreted to be co-magmatic and
occur in the Mount Babbgae Inlier and the northern Mt Painter Inlier, with the
former having a crystallization age of 1557±6 Ma (Sheard et al., 1992). The
Yerila granite is found only in the Mount Babbage Inlier and has a
crystallization age of 1556±6 Ma (Johnson, 1980).

Geology, Lithology and Petrography
15
Figure 2.1 Map of the Mt Painter Province consisting of the Mt Painter and Mt Babbage Inliers modified after McLaren et al., 2006; a) major Proterozoic terranes in Australia. Location of b is shown by box, b) simplified geology of South Australia and location of the Mt Painter Province, c) aerial photo of the Mt Painter and Mt Babbage Inliers.

Chapter 2
16
Figure 2.2 Geological map of the Mt Painter Province showing Mesoproterozoic granitic and volcanic rocks.
2.4 Lithology of mafic-felsic magmatic rocks
Mesoproterozic mafic-felsic magmatic rocks of the Mount Painter
Province are divided into seven main lithological suites in this studies
including; 1) Pepegoona Volcanics, 2) Mt Neill Granite, 3) Box Bore Granite,
4) Terrapinna Granite, 5) Wattleowie Granite, 6) Yerila Granite and
associated microgranular enclaves and 7) mafic dykes. This section describes
lithological and petrographical characteristics of the magmatic suites based on
outcrop, hand specimen samples and thin section descriptions from Mt

Geology, Lithology and Petrography
17
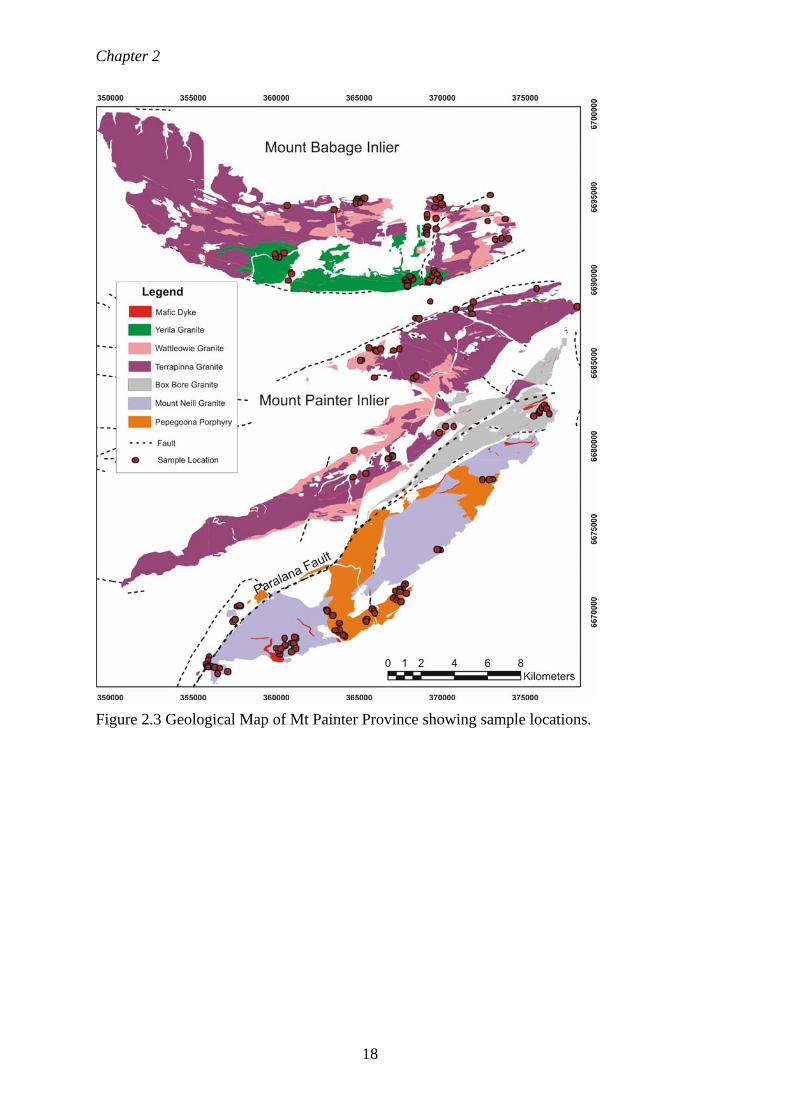
Babbage Inlier and northern Mt Painter Inlier. Figure 2.3 shows the granitic
and volcanic sample locations in the study area.
2.4.1 Pepegoona Volcanic
The Pepegoona Volcanics are interlayered with metasediments, which
are interpreted as shallow-water marine to non-marine clastic sedimentary
rocks (Teale, 1993b), and are found in south-east of the Mt Painter Inlier.
They are typically massive to blocky in outcrop and conformably overlie the
metasediments. The volcanics are intruded by the Mt Neill Granite (Figure
2.4). The boundary between the volcanic and metasedimentary rocks may be
difficult to recognise due to shearing during the Delamarian Orogen. A well-
developed foliation in the volcanics is typically consistent with lava flow
banding. The Pepegoona Volcanics are typically dark grey to red in colour;
fine-grained and porphyritic (Figure 2.5a). Pheonocrysts include pink K-
feldspar and blue quartz. The K-feldspar phenocrysts are subhedral, tubular to
round in shape and strongly altered. Based on their composition, the
Pepegoona Volcanics are rhyolite and dacites.
The Pepegoona Volcanic contain 40% rounded to sub-rounded quartz
(1-10 mm in size), tabular to sub-rounded plagioclase (2-15 mm in size),
strongly to intermediate sericite-altered clinopyroxene (2-10 mm in size) and
tabular K-feldspar (2-15 mm in size) phenocrysts and 60% fine-grained quartz
and feldspar groundmass. The quartz and feldspar groundmass shows
alignment following the outline of phenocrysts suggesting magmatic flow
(Figure 2.5b). Ovoid phenocrysts are typically rimmed by finer-grained
quartz. Muscovite, chlorite and sericite are found as secondary minerals, and
interpreted to have formed as a result of metamorphism and/or alteration.
Chapter 2
18
Figure 2.3 Geological Map of Mt Painter Province showing sample locations.

Geology, Lithology and Petrography
19
Figure 2.4 Contact between porphyritic Pepegoona volcanic and coarse-
grained Mount Neill granite.
Figure 2.5 Porphyritic Pepegoona volcanics: a) Strongly altered feldspar
phenocryst from sample MN008; b) Subrounded plagioclase (Plag) phenocrysts and rounded quartz (Qtz) phenocrysts in groundmass showing magmatic flowing bands from sample MN061 in plane polar.
2.4.2 Mount Neill Granite
The Mt Neill Granite crops out in the south-east, central and north of
the Mt Painter Inlier. It has intrusive contacts with the Pepegoona Volcanics.
Based on grain size, the Mt Neill Granite can be divided into two groups 1)
fine-grained and 2) medium- to coarse-grained (Figure 6a and 6b). The
medium- to coarse-grained granites are the dominant group in the study area

Chapter 2
20
and are characterised by equigranular to inequigranular, red- to pink-altered
phenocryst and groundmass, with rounded feldspar and blue quartz
phenocrysts in a finer quartz, feldspar and biotite groundmass. The
phenocrysts are medium to megacrystic in size (up to 5 cm). In thin sections,
the medium- to coarse-grained Mount Neill granites typically comprise
coarse-grained (phenocryst) and finer grained (groundmass) quartz (40-45%,
0.5-15 mm), fine- to coarse-grained microcline (30-35%, 0.5-15 mm),
plagioclase (15-20%, 2-4 mm), albite (5-10%, 2-3 mm) and biotite (10%, 0.5-
2 mm). Phenocrystic quartz typically has a rounded shape with sieve texture
and sometimes is rimmed by finer quartz grains as a resorption texture (Figure
2.6c). Coarse-grained microcline phenocrysts exhibit sieve texture and are
sometimes surrounded by sodic feldspar suggesting a rapakivi texture. K-
feldspar crystals are microperthite. Plagioclase phenocrysts show ovoided to
lath shapes. Biotite is generally segregated and may be metamorphosed.
Zircon, fluorite, magnetite, apatite, allanite, and monazite are found as
accessory minerals, and are more abundant in the medium- to coarse-grained
Mount Neill granite. Enclaves found in the medium- to coarse-grained Mount
Neill granite consist of 60% quartz and 40% clinopyroxene (Figure 2.6d). The
fine-grained granite that is massive, equigranular and red to pink in colour
comprise quartz, feldspar and biotite. Mafic enclaves are rarely found. The
fine-grained Mt Neill Granite is typically equigranular and subhedral to
anhedral and consists of quartz (35-40%, 0.5-4 mm), microcline (30-35%,
0.5-2 mm), clinopyroxene, (15%, 0.5-2 mm), perthite (5-10%, 1-2 mm),
plagioclase (5%, 2 mm) and biotite (3%, 0.5-1 mm). Quartz crystals
sometimes show shadow extinction resulting from deformation and
metamorphism and show granophyric texture (intergrowth of quartz and K-
felspar). Feldspars, amphibole and clinoproxene are generally replaced by
clay minerals and sericite. Muscovite is interpreted to have formed from the
metamorphism of biotite.

Geology, Lithology and Petrography
21
Figure 2.6 Mount Neill granite: a) Strongly altered K-feldspar phenocryst
from sample MN067; b) fine-grained equigranular granite from sample MN026; c) fine-grained quartz surround rounded K-felspar phenocryst; d) quartz, amphibole and clinopyroxene from xenolith within Mount Neill granite.
2.4.3 Box Bore Granite
The Box Bore Granite is strongly deformed showing augen quartz and
feldspar, and a gneissic texture (Figure 2.7a). It crops out in the north-eastern
Mt Painter Inlier and is separated from the Mt Neill Granite by the Paralana
fault zone and a mafic dyke. The granite is typically pink to red with altered
round coarse-grained (up to 5 cm) K-feldspar.
The Box Bore granite is typically characterised by an inequigranular
and porphyritic texture. A gneissic texture is also common. The granite
consists of quartz (40%, 5-50 mm), microcline (35%, 2-50 mm), biotite (10%,
1-3 mm) and plagioclase (5%, 1-4 mm). Phenocrystic microcline contains
microphertite, quartz and plagioclase grains and is rimmed by fine grained
quartz (Figure 7b). Quartz has recrystallised and shows an extinction shadow.

Chapter 2
22
Plagioclase normally is strongly altered to sericite. Zircon, allanite, sphene,
apatite and fluorite are abundant in this granite.
Figure 2.7 Box Bore granite; a) altered and foliated porphyritic Box Bore
granite outcrop from the East of Mt Painter Inlier; b) coarse-grained ovoidal K-feldspar phenocryst in the Box Bore granite.
2.4.4 Terrapinna Granite
The Terrapinna Granite has the largest area of outcrop in the study
area and occurs in both the Mt Painter and the Mt Babbage inliers. It is
typically medium- to coarse-grained, white to pale grey and porphyritic, with
ovoidal feldspar and quartz megacrysts (up to 15 cm) and biotite (Figure
2.8a). The granite has a strongly gneissic texture. The Terrapinna Granite is
intruded by the Wattleowie Granite.
The Terrapinna Granite is petrographically characterised by
inequigranular to equigranular, anhedral, medium- to coarsed-grained and
slightly to strongly metamorphosed with a gneissic texture. It comprises
feldspar (40%, 2-50 mm of K-feldspar; 20%, 5-30 mm of plagioclase), quartz
(25%, 0.5-15 mm) and biotite (7%, 1-5 mm). Megacrystic ovoid K-feldspars
show perthitic and albitic replacements, fine-grained quartz rim and a
granophyric texture (Figure 2.8b). Plagioclase which is intensively replaced
by sericite is found as overgrowths on K-feldspar megacrysts. Biotite laths
may show kink bands as a result of metamorphism and deformation, and may
contain zircon inclusions.

Geology, Lithology and Petrography
23
Figure 2.8 Terrapinna Granite; a) coarse-grained, rounded K-feldspar
phenocryst from sample MN103; b) fine-grained quartz rim-granophyric texture.
2.4.5 Wattleowie Granite
The Wattleowie Granite crops out in the northern the Mt Babbage
Inlier and central Mt Painter Inlier and is intruded by Mudnawatana tonalites.
It is spatially associated with the Terrapinna Granite with which it has a
gradational contact at some localities. The granite is typically white to pale
grey, equigranular, weakly deformed with a spotted appearance (Figure 2.9a
and 2.9b). In hand-specimen, its mineralogy consists of quartz, feldspar and
biotite.
The Wattleowie Granite is typically fine-grained and equigranular. It
consists of quartz (45%, 0.1-1 mm), microcline (25%, 1-3 mm), perthitic K-
feldspar (17%, 2-12 mm), and biotite (10%, 0.5-3 mm). This granite is
affected by metamorphism and/or alteration, showing a sieving texture,
extinction shadow in quartz and secondary minerals such as muscovite,
sericite and chlorite. Zircon is found in biotite, showing a radioactive halo.
Apatite and fluorite are accessory minerals.

Chapter 2
24
Figure 2.9 Wattleowie granite; a) Field outcrop characterise of the Wattleowie
granite at the north of the Mt Babbage Inlier; b) fine-grained equigranular Wattleowie granite.
2.4.6 Yerila granite and microgranular enclaves
The Yerila Granite is located in the southern Mt Babbage Inlier and is
typically deformed. It is characteristically pale grey, medium- to coarse-
grained and inequigranular. In hand specimen, its mineralogy consists of
tabular feldspar, quartz and feldspar. Yellow allanite grains may also be seen
in hand specimen. The Yerila Granite commonly contains mafic and felsic
enclaves (Figure 2.10a and 2.10b). Enclaves are sub-rounded to sub-angular
with minor irregular or fusion-form shapes and contact boundaries are sharp
to diffuse and may show fine-grained darker rims of ferromagnesian minerals.
Pegmatite and mafic dykes have a crosscutting relationship with the Yerila
Granite.
In thin section, the Yerila Granite is typically medium-grained,
euhedral to anhedral and inequigranular comprise phenocrysts of tabular
microcline (25%, 10-50 mm) and tabular plagioclase (15%, 10-30 mm) and
groundmass of quartz (40%), microcline (10%) and biotite (10%; Figure 10c).
Quartz is recrystallised and deformed showing fine-grained aggregates and
extinction shadows. Accessory minerals including zircon, apatite, allanite,
fluorite, sphene and magnetite are abundant in Yerila granite (up to 3%).
Allanite is generally found with biotite and is 3-5 mm in size. Mafic
enclaves are fine- to medium grained, and consist of 35% biotite (0.5-3 mm),
25% hornblende (1-5 mm), 15% plagioclase (1-3 mm), 10% K-feldspar (2-30
mm), 7% quartz (1-6 mm) and 3% allanite (Figure 2.10d). Phenocrystic K-
Geology, Lithology and Petrography
25
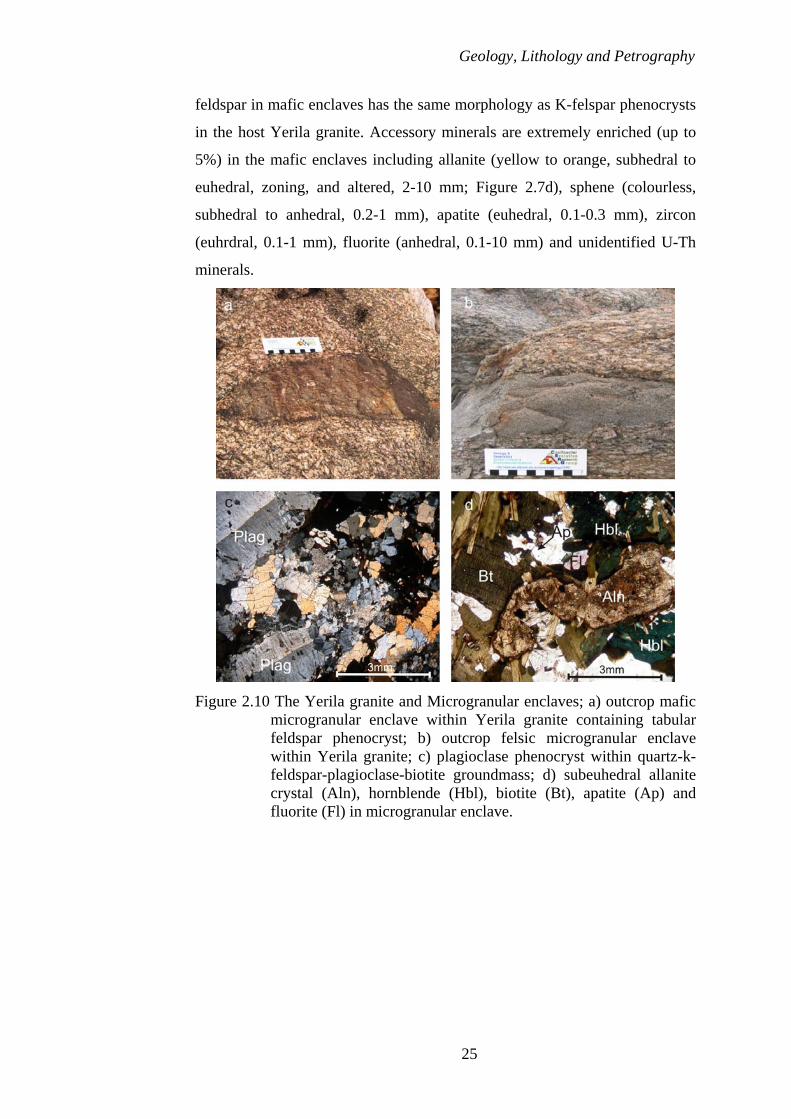
feldspar in mafic enclaves has the same morphology as K-felspar phenocrysts
in the host Yerila granite. Accessory minerals are extremely enriched (up to
5%) in the mafic enclaves including allanite (yellow to orange, subhedral to
euhedral, zoning, and altered, 2-10 mm; Figure 2.7d), sphene (colourless,
subhedral to anhedral, 0.2-1 mm), apatite (euhedral, 0.1-0.3 mm), zircon
(euhrdral, 0.1-1 mm), fluorite (anhedral, 0.1-10 mm) and unidentified U-Th
minerals.
Figure 2.10 The Yerila granite and Microgranular enclaves; a) outcrop mafic
microgranular enclave within Yerila granite containing tabular feldspar phenocryst; b) outcrop felsic microgranular enclave within Yerila granite; c) plagioclase phenocryst within quartz-k-feldspar-plagioclase-biotite groundmass; d) subeuhedral allanite crystal (Aln), hornblende (Hbl), biotite (Bt), apatite (Ap) and fluorite (Fl) in microgranular enclave.

Chapter 2
26
2.4.7 Mafic dyke
Mafic dykes are oriented NW-SE and NE-SW. They intrude into
volcanic, granitic and metasedimentary rocks as sills and dykes (Figure 2.11a
and 2.11b). The largest dykes are approximately 50 m wide and 2-3 km long.
There are at least two generations of mafic dykes; the first have been strongly
deformed and the second which are undeformed.
Mafic dykes of the study area are generally dark grey, fine-grained
and equigranular. Plagioclase and hornblende can be observed in hand
specimens, and they are altered to differing degrees.
Mafic dykes are mainly mafic to intermediate. Basaltic (doleritic)
dykes are typically fine-grained and equigranular, and consists of 40%
anhedral cluster to euhedral acicular amphibole (0.1-3 mm), 40% plagioclase
(0.2-1 mm), 7% biotite, 5-7% opaque minerals (ilmenite and magnetite) and
3% quartz (Figure 2.11c). Apatite, zircon and allanite are accessory minerals.
Andesite dykes comprise amphibole (35%, 0.2-2 mm), biotite (25%, 0.1-1
mm), quartz (20%, 0.1-0.3 mm), plagioclase (10%, 0.5-1 mm), clinopyroxene
(5%) and opaque minerals (Figure 2.11d). Zircon and apatite are abundant,
occurring as inclusion in amphibole and biotite. Allanite and titanite are also
found as accessory minerals. Metamorphic garnet is found in a Mount
Babbage andesitic dyke.
The strongly deformed mafic dykes that are coeval to the HHP
granites (see Chapter 4) are grouped as Mesoproterozoic mafic dykes. The
undeformed mafic dykes that have low heat production values (see Chapter 5)
are grouped as Paleozoic mafic dykes. Based on geochronological data (see
Chapter 4), Neoproterozic mafic dykes are also found in the Mt Painter
Province. Therefore, the mafic dykes in this study are divided into three
groups including Paleozoic, Neoproterozoic and Mesoproterozoic mafic
dykes.

Geology, Lithology and Petrography
27
Figure 2.11 Mafic dyke; a) An outcrop of mafic dyke and pegmatitic dyke
cross-cutting the Yerila granite in the south of the the Mt Babbage Inlier; b) mafic dyke cross-cutting the Yerila granite in the centre of the Mt Babbage Inlier; c) A photomicrograph of amphibole, plagioclase, biotite, ilmenite and magnetite in a mafic dyke (Sample MN090); d) A photomicrograph of garnet, hornblende, biotite and quartz in a mafic dyke (Sample BB06).

Chapter 3
28
Chapter 3 Mineralogy
This chapter describes the mineralogy of the granites and associated
rocks of the Mt Painter Province. These include feldspar, biotite, amphibole,
zircon, allanite, apatite, Ti-minerals and U-Th minerals. Mineral compositions
were determined using an electron microprobe for major elements and by LA-
ICPMS for trace elements. The methodology is given in Appendix 3.
3.1 Major minerals
3.1.1 Feldspar
Feldspars are found in all rock types in this study. Both plagioclase
and K-feldsapr are typically found in the felsic igneous rocks and
microgranular enclaves, whereas plagioclase is only feldspar found in the
mafic dykes.
The porphyritic Pepegoona Volcanics contain both plagioclase and K-
feldspar as phenocrysts and groundmass. Feldspar phenocrysts are 0.2 to 10
mm in size, subequant to ovoid in shape and partly replaced by sericite and
chlorite. Twinning and oscillatory zoning are rarely preserved in K-feldspar
phenocrysts.
Feldspars from Mt Neill and Box Bore Granites are fine- to coarse-
grained (1 to 15 mm), anhedral to subhedral with tabular to rounded shapes.
The coarse ovoid feldspars show resorption rims. Sericitic alteration is
commonly found in Mt Neill feldspars. The Terrapinna Granite typically
contains medium to megacrystic (2 cm long on average, but up to 10 cm long)
K-feldspar and plagioclase. The megacrystic feldspars are typically rounded
showing quartz-overgrowths. Sericite-altered plagioclase crystals are also
found. These could suggest recrystallization of the feldspars.
In the Wattleowie Granite, K-felspar and plagioclase are generally
anhedral to euhrdral, fine- grained (1-3 mm) and show zoning. Feldspar
grains contain muscovite and fine-grained quartz.
Feldspars from the Yerila Granite include plagioclase and K-feldspar,
occurring as phenocrysts and groundmass. The phenocrysts are mainly tabular
euhedral K-feldspar. The groundmass is finer grained K-feldspar, quartz and

Mineralogy
29
biotite. Microgranular enclaves contain K-feldspar phenocryst with the same
characteristics as the host Yerila Granite. Feldspar in mafic dykes is typically
equigranular, fine-grained and tabular plagioclase.
The Pepegoona Volcanic and the Mt Neill, Box Bore, Wattleowie and
Terrapinna Granites contains plagioclase, which is orthoclase and high albite
(An1-67), and K-feldspar, which is microcline and perthite (Or76-97; Table 3.1;
Figure 3.1). The Yerila Granite has plagioclase, which is andesine and
oligoclase (An29-32), and K-felpar, which is microcline (Or91-95; Figure 3.2).
Plagioclase of mafic microgranular enclaves has a range of composition from
oligoclase to andesine (An11-32), whereas Plagioclase of felsic microgranular
enclaves has a range of composition anothoclase, oligoclase and andesine
(An10-69). K-feldspr from the mafic and felsic enclaves is microcline (Or94-96).
Mafic dykes (Mesoproterozoic and Neoproterozoic mafic dykes) contain
plagioclase, which is oligoclase, andesine and labradorite A(n13-63; Figure
3.3).
Plots of Na versus Ca in feldspar display two variation trends
including a Major Series and Minor Series suggest different cationic
substitution (Figure 3.4). The Major Series, which includes plagioclase from
all rock units, has higher Na and Ca content than the Minor Series, which
include mainly plagioclase from microgranular enclaves. The ionic variation
in the Major Series suggest continuous albite substitute summarised as Ca2+ +
Al3+ <=> Na+ + Si4+ (Bowen, 1915). Palgioclase from the Minor Series
reflects cation deficieny in the Z-site and high Si in the X-site, which may due
to entry of Si or Al into the Z-site of a disordered crystal structure (Deer et al.,
1992).

Chapter 3
30
Table 3.1 Selected feldspar analyses to represent the different unit of granitic and volcanic rock from the Mt Painter Province. Sample MN092 MN092 MN096 MN096 SD047 SD047 MN02 BB021 MN061 BB025 BB018 BB18 HPG05 HPG05 SD010 SD010 MN090 SD004 MN099
Unit YG YG MME MME FME FME MN MN PV PV WT WT TP TP BB BB MMF NMF PMF
SiO2 63.38 56.53 62.72 60.52 62.65 62.28 62.81 64.99 64.13 63.43 62.74 64.38 63.59 66.23 64.61 65.53 59.19 58.51 55.78
Al2O3 18.04 22.93 17.24 23.68 17.74 22.73 17.66 22.38 17.98 22.15 17.48 21.19 17.93 20.70 18.00 20.88 25.68 25.65 27.28
FeO 0.03 0.01 0.36 0.41 0.08 0.33 0.02 0.00 0.03 0.09 0.00 0.00 0.04 0.08 0.10 0.07 0.23 0.05 0.01
CaO 0.00 6.22 0.00 6.03 0.00 4.12 0.00 3.37 0.01 3.72 0.01 2.91 0.06 0.72 0.00 1.67 7.54 7.82 9.60
Na2O 0.71 7.51 0.50 8.24 0.44 6.66 0.67 8.76 0.47 9.57 0.35 9.71 0.41 9.39 0.53 9.45 7.47 7.31 5.89
K2O 16.34 0.19 14.68 0.16 16.76 2.34 16.34 0.11 16.57 0.14 16.48 0.12 16.41 0.41 16.45 0.09 0.05 0.09 0.05
BaO 0.29 0.00 0.14 0.00 0.11 0.08 0.00 0.00 0.04 0.00 0.52 0.00 0.13 0.00 0.15 0.06 0.00 0.00 0.00
Toatal 98.81 93.39 95.70 99.10 97.83 98.68 97.59 99.66 99.26 99.20 97.65 98.49 98.71 97.60 100.00 97.79 100.16 99.56 98.61
Cations based on 32 oxygens
Si 12.221 10.899 12.094 11.668 12.080 12.009 12.111 12.531 12.366 12.231 12.097 12.413 12.261 12.769 12.457 12.635 11.412 11.282 10.755
Al 4.099 5.210 3.918 5.380 4.032 5.166 4.013 5.086 4.086 5.033 3.973 4.816 4.074 4.703 4.090 4.744 5.835 5.828 6.198
Fe(ii) 0.004 0.001 0.058 0.066 0.013 0.053 0.003 0.000 0.004 0.015 0.000 0.000 0.006 0.013 0.017 0.011 0.037 0.008 0.001
Ca 0.000 1.284 0.000 1.246 0.000 0.851 0.000 0.696 0.003 0.769 0.002 0.602 0.012 0.148 0.000 0.344 1.557 1.614 1.982
Na 0.264 2.808 0.187 3.079 0.164 2.489 0.252 3.275 0.174 3.577 0.133 3.631 0.153 3.511 0.199 3.533 2.792 2.734 2.202
K 4.019 0.046 3.609 0.040 4.122 0.576 4.020 0.026 4.074 0.034 4.052 0.029 4.036 0.101 4.046 0.022 0.013 0.023 0.012
Ba 0.022 0.000 0.011 0.000 0.008 0.006 0.000 0.000 0.003 0.000 0.039 0.000 0.009 0.000 0.011 0.005 0.000 0.000 0.000
TOTAL 20.629 20.248 19.877 21.479 20.419 21.150 20.400 21.615 20.710 21.659 20.295 21.491 20.553 21.246 20.821 21.294 21.647 21.489 21.150
Ab 6.17 67.86 4.93 70.53 3.82 63.56 5.90 81.93 4.09 81.67 3.17 85.19 3.64 93.36 4.68 90.61 64.00 62.54 52.48
An 0.00 31.04 0.00 28.55 0.00 21.72 0.00 17.42 0.07 17.56 0.04 14.12 0.29 3.95 0.00 8.83 35.69 36.93 47.24
Or 93.83 1.10 95.07 0.92 96.18 14.71 94.09 0.66 95.83 0.77 96.79 0.69 96.07 2.69 95.32 0.56 0.31 0.53 0.28
YG: Yerila Granite, MME: Mafic microgranular enclave, FME: Felsic microgranular enclave, MN: Mount Neill Granite, PV: Pepegoona Volcanic, WT: Wattleowie Granite, TP: Terrapinna Granite, BB: Box Bore
Granite, MMF: Mesoproterozic mafic dyke, NMF: Neoproterozoic mafic dyke, PMF: Palaeozoic mafic dyke.

Mineralogy
31
Figure 3.1 Variations of feldspar compositions from volcanic and granitic rocks of the Mount Painter Province.
Figure 3.2 Variations of feldspar compositions from the Yerila granite and
associated microgranular enclaves (Symbols; Red: Yerila Granite feldspar, Green: Mafic microgranular enclave, Blue: Felsic microgranular enclave).

Chapter 3
32
Figure 3.3 Variations of plagioclase feldspar compositions of mafic dykes
from Mount Painter Province.
Figure 3.4Variations of Na+ versus Ca2+ in feldspars of mafic and felsic
igneous rocks from the Mt Painter Province showing two trends that suggest differing cationic substitution (PV: Pepegoona volcanic, MN: Mt Neill granite, BB: Box Bore Granite; TP: Terrapinna Granite, WG: Wattleowie Granite, YG: Yerila Granite, ME: microgranular enclave, MF: mafic dyke).

Mineralogy
33
Feldspars from this study were plotted with the geothermometer based
on ternary feldspar compositions after Deer et al. (1992: Figure 3.5) Most
feldspars plot in the 700 °C field, however feldspars from felsic
microgranular enclaves plot in a higher temperature field (800-900 °C) and
one feldspar analysis from the Yerila Granite suggests a temperature of
formation of approximately 900°C.
Figure 3.5 Geothermometer of ternary feldspar compositions for mafic and
felsic igneous rocks from Mount Painter Province (after Deer et al., 1992).
Trace elements in feldspars from most rock units using LA-ICPMS are
lower than detection limits, except from the Yerila Granite and microgranular
enclaves. Feldspars from the Yerila Granite and microgranular enclaves have
low LREE contents and low to very low HREE, Y, Th and U contents.
Chondrite-normalized REE patterns generally show enriched LREE, flatter
HREE and positive Eu anomalies (Figure 3.6). REE contents in feldspars
from microgranular enclaves are relatively higher than feldspar from the
Yerila granite. The positive Eu anomaly of the feldspar suggests that the
feldspar disequilibrium occurs by trace-element undersatuaration which is

Chapter 3
34
ascribed to slow dissolution rates of accessory phases in water-poor melts
(Carrington and Watt, 1995).
Figure 3.6 Rare earth element concentrations normalised to chondrite values
(Sun and McDonald, 1989) of feldspar from Yerila granite and microgranular enclave (Symbol; closed triangular: Yerila granite and opened triangular: microgranula enclave)
The absence of simple twinning, oscillatory zoning, euhedral
inclusions of plagioclase and crystallographically controlled arrangements of
inclusions, which indicate igneous K-feldspar (e.g. Vernon, 1986; Vernon,
1999), suggest that the K-feldspar from all units in this study has been
affected by metamorphism. K-Feldspar megacrysts are interpreted to have
grown at a late stage, during cooling of the granitic magma in subsolidus
conditions (Vernon, 1986), so they formed by textural coarsening after the
groundmass crystallized at subsolidus temperatures (Johnson et al., 2006). K-
feldspar megacrysts have been suggested to form as a result of magma mixing
in granitic rocks (e.g. Vernon, 1990; Gagnevin et al., 2004; Collins et al.,
2006). K-feldspar phenocrysts from microgranular enclaves derived from
disintergration replenishment dykes of more mafic magma are indented by K-
feldspar phenocryst of the Yerila Granite, indicating the K-feldspar were
present before the microgranular enclave and the host granites solidified.
Alignment of K-feldspar phenocrysts in microgranular enclave and host
Yerila Granite interpreted to be a magmatic flow foliation implies that the K-
feldspar moved as independent crystals in liquid.
Mineralogy
35
3.1.2 Amphibole
Amphiboles are important mafic minerals because their variable
composition can record the chemical evolution of melt during their
crystallization and can yield information of magmatic evolution and
differentiation (e.g. Gualda and Vlach, 2007). Amphiboles in this study are
mainly found in mafic dykes and microgranular enclaves, where they are
petrographically and chemically different in each rock units. Amphiboles in
mafic dyke occur as tabular crystals and clumps of crystals together with
biotite and plagioclase and display pine green to brown pleochroism and often
display radioactive damage haloes. Amphiboles in the microgranular enclaves
are commonly pleochroic, green, tabular crystals and normally contain zircon,
apatite and U-Th minerals as mineral inclusions.
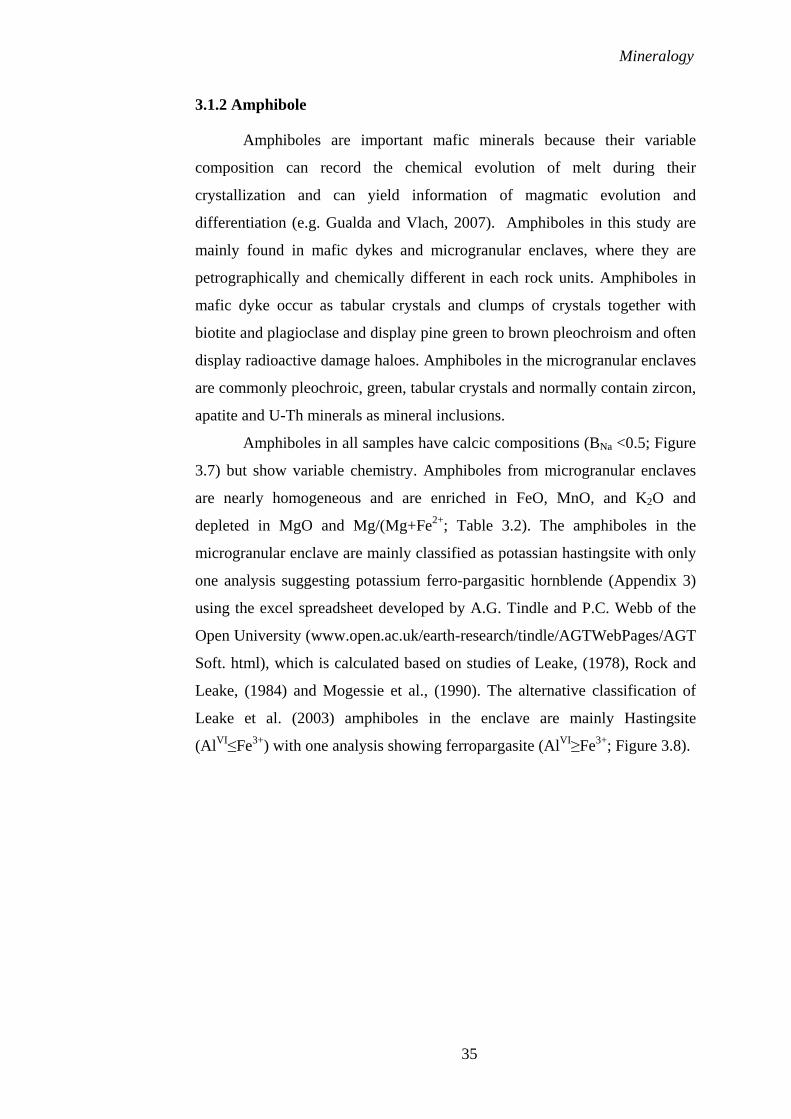
Amphiboles in all samples have calcic compositions (BNa <0.5; Figure
3.7) but show variable chemistry. Amphiboles from microgranular enclaves
are nearly homogeneous and are enriched in FeO, MnO, and K2O and
depleted in MgO and Mg/(Mg+Fe2+; Table 3.2). The amphiboles in the
microgranular enclave are mainly classified as potassian hastingsite with only
one analysis suggesting potassium ferro-pargasitic hornblende (Appendix 3)
using the excel spreadsheet developed by A.G. Tindle and P.C. Webb of the
Open University (www.open.ac.uk/earth-research/tindle/AGTWebPages/AGT
Soft. html), which is calculated based on studies of Leake, (1978), Rock and
Leake, (1984) and Mogessie et al., (1990). The alternative classification of
Leake et al. (2003) amphiboles in the enclave are mainly Hastingsite
(AlVI≤Fe3+) with one analysis showing ferropargasite (AlVI≥Fe3+; Figure 3.8).

Chapter 3
36
Figure 3.7 Amphibole classifications (BNa versus BCa) of magmatic-
amphibole from mafic dykes and microgranular enclaves showing calcic composition.
Amphiboles from Mesoproterozoic mafic dykes commonly have
widely varying major element contents but are depleted in K2O and Ti2O.
They show variation in amphibole types. The main classifications are
actinolitic hornblende and magnesio-hornblende with minor of actinolite,
tschermakite, ferrian-tschermakitic hornblende, subsilicic ferro-tschermakite
and alumino- tschermakite (Appendix 3). Mesoproterozoic mafic dyke
amphiboles are mainly classified as edenite with minor pargasite and
magnesiohastingsite (Figure 3.8: Leake et al. (2003). Amphiboles from
Neoproterozic mafic dykes commonly have high Na2O, and low MgO and
TiO2 contents. They are mainly classified as ferro-tschermakite with some
analyses showing ferro-tschermakitic hornblende, ferroan pargasite and
anthophyllite (Appendix 3); whereas Figure 3.8 displays the amphibole
classification after Leake et al. (2003) showing ferropargasite and hastingsite
types. Amphiboles of Palaeozoic mafic dykes are typically homogeneous,
contain high TiO2 and are consistently classified as magnesio-hornblende.
The classification of Leake et al. (2003) suggests that they are edenite (Figure
3.8).

Mineralogy
37
Table 3.2 Selected amphibole analyses to represent the different unit of granitic and volcanic rock from the Mt Painter Province.
Sample MN096 MN096 SD051 SD051 MN090 MN090 MN099 MN099
Unit ME ME NMF NMF MMF MMF PMF PMF
Spot Mn96_03 Mn96_04 Sd51_05 Sd51_08 Mn91_02 Mn91_10 Mn91_32 Mn91_35
SiO2 36.76 36.08 39.65 39.35 43.62 44.018 48.19 46.73
TiO2 0.53 0.53 0.32 0.41 0.42 0.401 0.61 0.80
Al2O3 12.22 12.42 14.44 11.90 10.63 10.713 7.62 8.54
FeO 28.62 28.28 21.12 22.27 18.32 17.141 15.80 15.83
MnO 0.58 0.53 0.42 0.40 0.39 0.306 0.28 0.19
MgO 2.22 2.32 6.02 6.67 9.33 9.792 11.76 10.67
CaO 11.00 10.44 11.70 10.47 11.80 11.958 11.96 12.03
Na2O 1.14 1.04 1.40 1.16 1.10 1.095 0.70 0.72
K2O 2.00 2.04 0.42 0.60 0.28 0.223 0.35 0.39
BaO 0.00 0.00 0.05 0.00 0.00 0.075 0.00 0.02
Structural formulae based on 23 oxygens
Si 6.027 5.962 6.145 6.194 6.591 6.643 7.069 7.007
Al iv 1.973 2.038 1.855 1.806 1.409 1.357 0.931 0.993
Al vi 0.388 0.380 0.781 0.402 0.485 0.549 0.387 0.515
Ti 0.065 0.066 0.037 0.048 0.048 0.045 0.067 0.090
Fe3+ 0.808 1.066 0.605 1.301 0.627 0.478 0.386 0.144
Fe2+ 3.116 2.842 2.131 1.631 1.689 1.686 1.553 1.841
Mn 0.081 0.074 0.055 0.053 0.049 0.039 0.035 0.024
Mg 0.542 0.571 1.390 1.565 2.102 2.203 2.572 2.385
Ca 1.933 1.848 1.942 1.766 1.911 1.934 1.880 1.933
Na 0.362 0.332 0.421 0.354 0.323 0.320 0.199 0.209
K 0.419 0.431 0.083 0.120 0.055 0.043 0.065 0.075
Ba 0.000 0.000 0.003 0.000 0.000 0.004 0.000 0.001
OH* 2 2 2 2 2 2 2 2
Total 17.714 17.611 17.449 17.241 17.289 17.301 17.144 17.219
(Ca+Na) (B) 2.000 2.000 2.000 2.000 2.000 2.000 2.000 2.000
Na (B) 0.067 0.152 0.058 0.234 0.089 0.066 0.120 0.067
(Na+K) (A) 0.714 0.611 0.446 0.241 0.289 0.297 0.144 0.218
Mg/(Mg+Fe2) 0.148 0.167 0.395 0.490 0.555 0.567 0.624 0.564
Fe3/(Fe3+Alvi) 0.676 0.737 0.437 0.764 0.564 0.465 0.499 0.218
Amphibole
names*
potassian-
hastingsite
potassian-
hastingsite
ferro-
tschermakite
ferri-
ferro-
tschermakite
magnesio-
hornblende
magnesio-
hornblende
magnesio-
hornblende
magnesio-
hornblende
T (C) ** 822.41 861.66 683.71 573.43 509.43 493.17 470.14 501.32
P (Kb) ** 4.81 3.65 9.87 8.87 6.90 6.85 2.90 4.48
* Leake (1978); Leake, (1984); Mogessie et al. (1990) **Anderson and Smith (1995); Holland and Blundy, 1994
ME: Microgranular enclave, MMF: Mesoproterozic mafic dyke, NME: Neoproterozoic mafic dyke, PMF: Palaeozoic mafic dyke.
Chapter 3
38
Figure 3.8 Amphibole classifications of Si versus Mg/(Mg+Fe2+) after Leake
et al. (2003) of mafic dykes and microgranular enclaves for amphibole which are CaB≥1.5; (Na+K)A≥0.5; Ti<0.5.
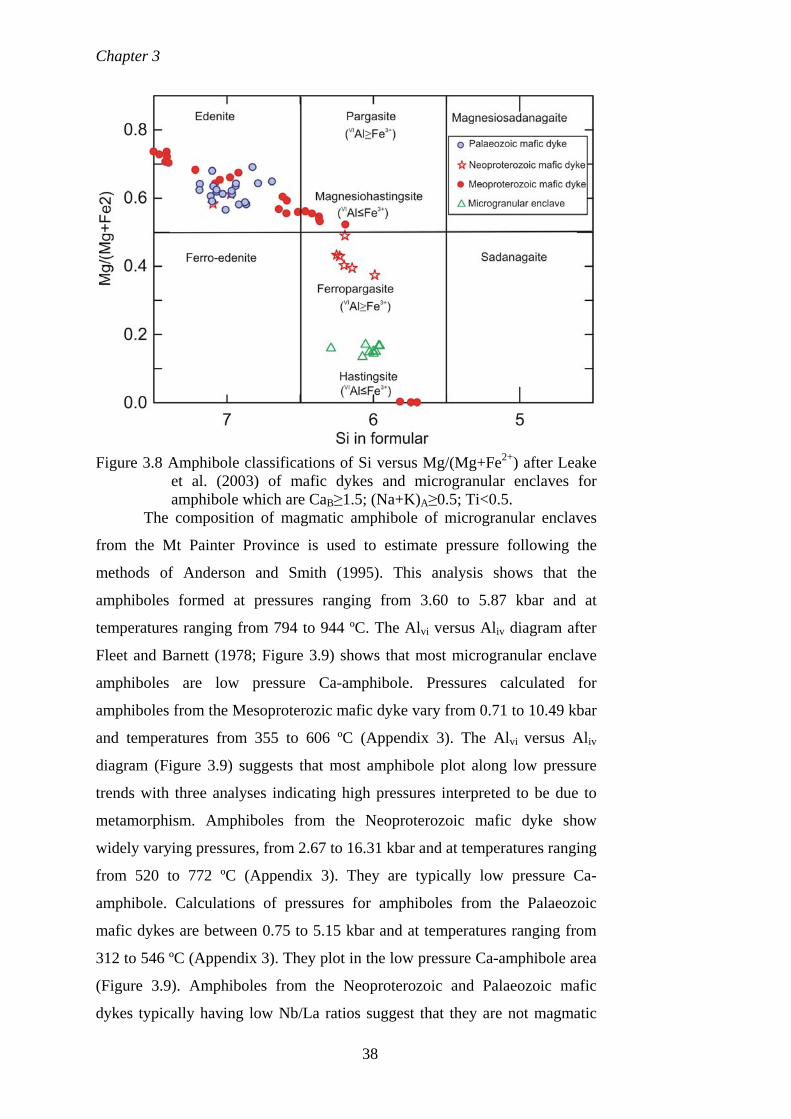
The composition of magmatic amphibole of microgranular enclaves
from the Mt Painter Province is used to estimate pressure following the
methods of Anderson and Smith (1995). This analysis shows that the
amphiboles formed at pressures ranging from 3.60 to 5.87 kbar and at
temperatures ranging from 794 to 944 ºC. The Alvi versus Aliv diagram after
Fleet and Barnett (1978; Figure 3.9) shows that most microgranular enclave
amphiboles are low pressure Ca-amphibole. Pressures calculated for
amphiboles from the Mesoproterozic mafic dyke vary from 0.71 to 10.49 kbar
and temperatures from 355 to 606 ºC (Appendix 3). The Alvi versus Aliv
diagram (Figure 3.9) suggests that most amphibole plot along low pressure
trends with three analyses indicating high pressures interpreted to be due to
metamorphism. Amphiboles from the Neoproterozoic mafic dyke show
widely varying pressures, from 2.67 to 16.31 kbar and at temperatures ranging
from 520 to 772 ºC (Appendix 3). They are typically low pressure Ca-
amphibole. Calculations of pressures for amphiboles from the Palaeozoic
mafic dykes are between 0.75 to 5.15 kbar and at temperatures ranging from
312 to 546 ºC (Appendix 3). They plot in the low pressure Ca-amphibole area
(Figure 3.9). Amphiboles from the Neoproterozoic and Palaeozoic mafic
dykes typically having low Nb/La ratios suggest that they are not magmatic
Mineralogy
39
amphiboles. Therefore, the pressures and temperatures that are calculated
from compositions of these amphiboles are not realistic.
In the Na+K versus Aiv plot (Figure 3.10) after Searle and Malpas
(1982), amphiboles from Mount Painter rocks plot along the high temperature
trend. Temperature, total pressure and pH2O are parameters controlling biotite
and amphibole Fe/(Fe+Mg) ratios (Wones, 1981). Along with these factors,
ƒO2 is the most important factor controlling amphibole compositions
(Anderson and Smith, 1995). The Fe/(Fe+Mg) in biotite and amphibole has a
negative relationship to ƒO2. Amphibole Fe/(Fe+Mg) ratios of low ƒO2
granite typically exceed 0.40-0.65. Therefore the magmatic amphiboles from
microgranular enclaves, which contain Fe/(Fe+Mg) ratios about 0.87, may
indicate low ƒO2 conditions. The primary hornblendes (magnesiohastingsite)
in microgranular enclaves suggest alkali-basalt and calc-alkali series and low
ƒH2O .
In the sequence of Bowen’s discontinuous series, hornblende should
crystallize before biotite. However hornblendes from the mafic enclaves
formed both before and after biotite which could suggest they were
crystallized from K-rich magma with low ƒH2O environment.
Figure 3.9 Avi versus Aiv diagram after Fleet and Barnett (1978) showing
most amphiboles plot within the low pressure Ca-amphibole field.

Chapter 3
40
Figure 3.10 Na+K versus Aiv diagram after Searle and Malpas (1982)
showing amphiboles from the Mount Painter rocks plot along high temperature trend.
Amphiboles from microgranular enclaves and Mesoproterozic mafic
dykes contain different levels of trace element contents. The
magnesiohastingsite from microgranular enclaves have relatively high trace
element concentrations including REE, Y, U and Th compared to
Mesoproterozic mafic dykes. REE patterns of the magnesiohastingsite show
positive trends with depleted LREE, slightly enriched HREE and strongly
negative Eu anomalies (Figure 3.11a). Depleted LREE in the microgranular
enclave amphiboles could suggests more extensive equilibration with other
phases and strongly negative Eu anomalies could indicate highly fractionatal
crystallization involving feldspar. On the other hand, REE patterns of
Mesoproterozic mafic dyke amphibole show depleted LREE, flatter HREE
and enriched MREE patterns, and negative Eu anomalies suggesting feldspar
fractionation crystallization (Figure 3.11b).

Mineralogy
41
Figure 3.11 Rare earth element concentrations normalised to chondrite values
(Sun and McDonald, 1989); a) amphibole REE patterns of microgranular enclave, b) amphibole REE patterns of Mesoproterozoic mafic dyke.
3.1.3 Biotite
Biotite in this study is typically pleochroic pale brown to dark brown,
has a strongly to slightly preferred orientation due to deformation. The biotite
sometimes shows chloritic alteration. Muscovite may be found in more
metamorphosed granites. Zircon, apatite, allanite, U-Th minerals and sphene
occur as inclusions in biotite. Dark brown halo damaging by radioactive
elements on biotite crystals, which mainly reside in zircon and U-Th minerals,

Chapter 3
42
are common. Biotite in mafic dykes and enclaves is typically subordinate to
amphibole.
Biotites from the Pepegoona Volcanics, the Mt Neill, Box Bore, and
Yerila granites, microgranular enclaves, and Neoproterzoic and
Mesoproterozic mafic dykes were analysed for their major and trace element
concentrations. The Fe/(Fe+Mg) ratios of biotite vary among different suites
(Table 3.3; Appendix 3). Biotites from felsic rocks including Pepegoona
Volcanics, Box Bore and Yerila granites are typically iron-rich; Fe/(Fe+Mg)
range from 0.74 to 0.91 with two analyses displaying Fe/(Fe+Mg) ratios of
0.55, so biotites are mainly classified as siderophyllite (Figure 3.12). Mt Neill
biotites have the lowest Fe/(Fe+Mg) ratios among felsic rocks, ranging
between 0.39 and 0.41. The Fe/(Fe+Mg) ratios of mafic microgranular
enclave biotites mainly vary between 0.74 and 0.86 with one analysis of 0.55.
Biotite from Mesoproterozic and Neoproterozoic mafic dykes contain
relatively lower Fe/(Fe+Mg) ratios than the felsic rocks. The Fe/(Fe+Mg)
ratios of Neoproterozoic mafic dyke biotite vary from 0.33 to 0.45 and for
Mesoproterozic mafic dykes they are mainly between 0.49 to 0.52, with one
analysis having a ratio of 0.87.
Figure 3.13 suggests that most biotites are re-equilibrated primary
biotite with some secondary biotites and primary biotites, in particular from
the Yerila Granite. These indicate that hydrothermal and/or metamorphic
processes affect the chemistry of biotite. Biotite from mafic enclaves and
mafic dykes coexist with amphibole (Figure 3.14). The geochemistry of
biotites from the Pepegoona Volcanics, Box Bore and Yerila Granite and the
mafic enclaves is typical of biotite from peraluminous magma. However,
some biotite analyses of the Yerila Granite and mafic enclaves plot in the
alkaline field. Biotite compositions in this study do not vary in a sysmatic
manner which could suggest they are no longer directly reflecting magmatic
compositions.

Mineralogy
43
Table 3.3 Selected biotite analyses to represent the different unit of granitic and volcanic rock from the Mt Painter Province.
Sample BB25 BB21 SD010 MN092 SD047 MN096 SD004 MN099
Spot BB2_01 BB21_02 SD10_01 MN92_02 SD47_01 MN97_07 SD04_01 MN99_02
Unit PV MN BB YG ME ME MMF PMF
SiO2 32.156 33.625 31.353 34.741 35.209 30.380 36.128 36.013
TiO2 2.790 1.328 2.788 3.048 2.200 1.550 2.447 2.454
Al2O3 17.443 18.511 15.239 15.592 15.535 12.896 14.952 15.472
FeO 28.883 16.867 27.912 27.230 30.040 21.480 18.410 20.136
MnO 0.443 0.223 0.548 0.265 0.444 0.214 0.156 0.121
MgO 3.213 13.852 6.057 4.317 3.505 4.198 12.450 10.606
CaO 0.103 0.000 1.274 0.022 0.062 0.007 0.000 0.047
Na2O 0.038 0.119 0.058 0.048 0.047 0.053 0.037 0.037
K2O 6.870 7.933 4.662 9.573 9.075 7.614 10.125 8.985
BaO 0.059 0.112 0.000 0.039 0.118 0.059 0.421 0.204
H2O* 3.631 3.874 3.573 3.741 3.758 3.141 3.901 3.863
Subtotal 95.628 96.444 93.463 98.617 99.993 81.591 99.029 97.937
Total 95.628 96.444 93.463 98.617 99.993 81.591 99.029 97.937
Si 5.310 5.204 5.262 5.568 5.619 5.800 5.553 5.590
Al iv 2.690 2.796 2.738 2.432 2.381 2.200 2.447 2.410
Al vi 0.706 0.582 0.277 0.514 0.541 0.702 0.263 0.421
Ti 0.347 0.155 0.352 0.367 0.264 0.222 0.283 0.287
Fe 3.989 2.183 3.918 3.650 4.009 3.430 2.367 2.614
Mn 0.062 0.029 0.078 0.036 0.060 0.035 0.020 0.016
Mg 0.791 3.196 1.516 1.031 0.834 1.195 2.853 2.454
Ca 0.018 0.000 0.229 0.004 0.011 0.001 0.000 0.008
Na 0.012 0.036 0.019 0.015 0.014 0.020 0.011 0.011
K 1.447 1.566 0.998 1.957 1.847 1.854 1.985 1.779
Ba 0.004 0.007 0.000 0.002 0.007 0.004 0.025 0.012
OH* 4 4 4 4 4 4 4 4
TOTAL 19.375 19.753 19.387 19.577 19.587 19.463 19.807 19.603
Y total 5.894 6.145 6.141 5.599 5.707 5.584 5.786 5.792
X total 1.481 1.609 1.246 1.978 1.880 1.880 2.022 1.810
Al total 3.395 3.377 3.015 2.946 2.922 2.902 2.709 2.831
Fe/Fe+Mg 0.83 0.41 0.72 0.78 0.83 0.74 0.45 0.52
T(C)* 885.06 870.27 887.83 898.13 865.85 864.96 916.69 906.82
*Luhr et al. (1984); YG: Yerila Granite, ME: Microgranular enclave, MN: Mount Neill Granite, PV: Pepegoona Volcanic, BB: Box Bore Granite, MMF: Mesoproterozic mafic dyke, PMF: Palaeozoic mafic dyke.
Chapter 3
44
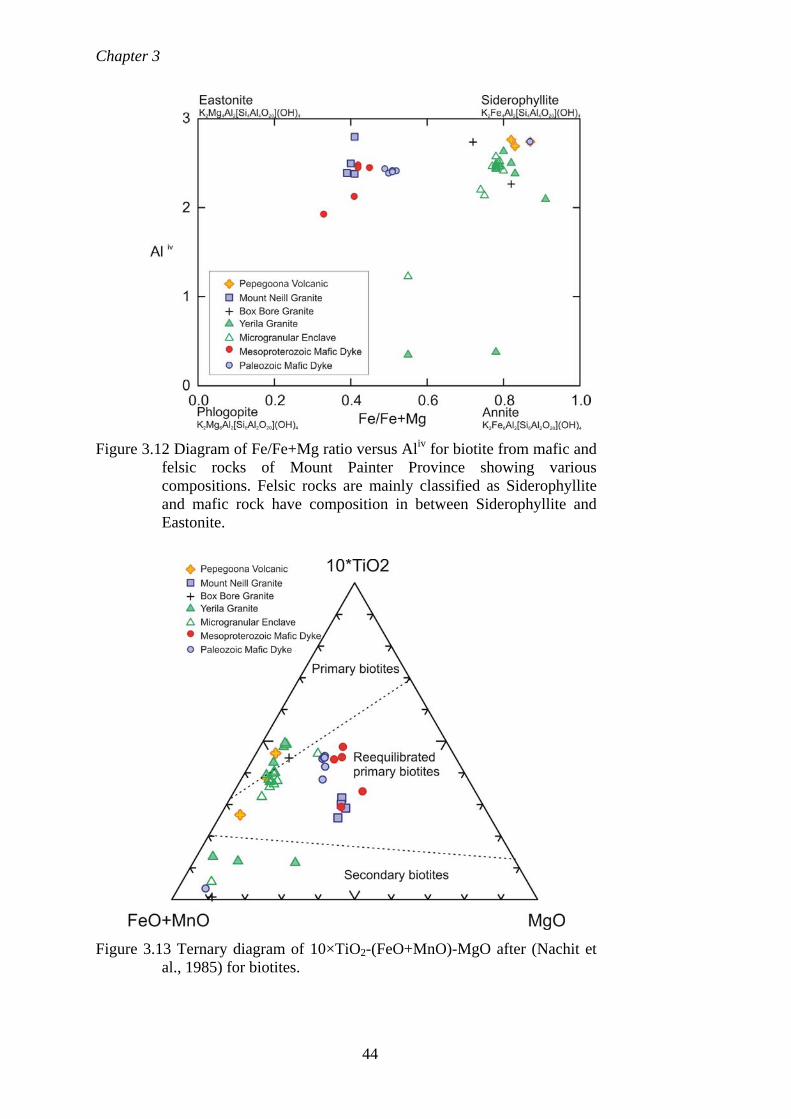
Figure 3.12 Diagram of Fe/Fe+Mg ratio versus Aliv for biotite from mafic and
felsic rocks of Mount Painter Province showing various compositions. Felsic rocks are mainly classified as Siderophyllite and mafic rock have composition in between Siderophyllite and Eastonite.
Figure 3.13 Ternary diagram of 10×TiO2-(FeO+MnO)-MgO after (Nachit et
al., 1985) for biotites.

Mineralogy
45
Figure 3.14 Ternary diagram of FeO-MgO-Al2O3 after de Albuquerque
(1973) for biotite of mafic-felsic igneous rocks from Mount Painter Province, most biotites co-exist with amphibole.
Biotites from the Yerila Granite, microgranular enclaves,
Neoproterozic and Mesoproterozic mafic dykes were analysed for trace
elements. Their REE patterns are shown in Figure 3.15. REE concentrations
in the biotites are commonly low (<1 ppm). However, a few analyses from the
Yerila Granite and microgranular enclave biotites contain more than 1 ppm
(Appendix 3) which may be found in U-rich granites (Bea, 1996). The REE
patterns of the Yerila Granite and microgranular enclave biotites show
negative trends with negative Eu anomalies. The microgranular enclave
biotites display relatively high fractionation compared to the Yerila Granite
biotites, whereas biotites from mafic dykes show very low REEs with
flattened flatter REE patterns.
Chapter 3
46
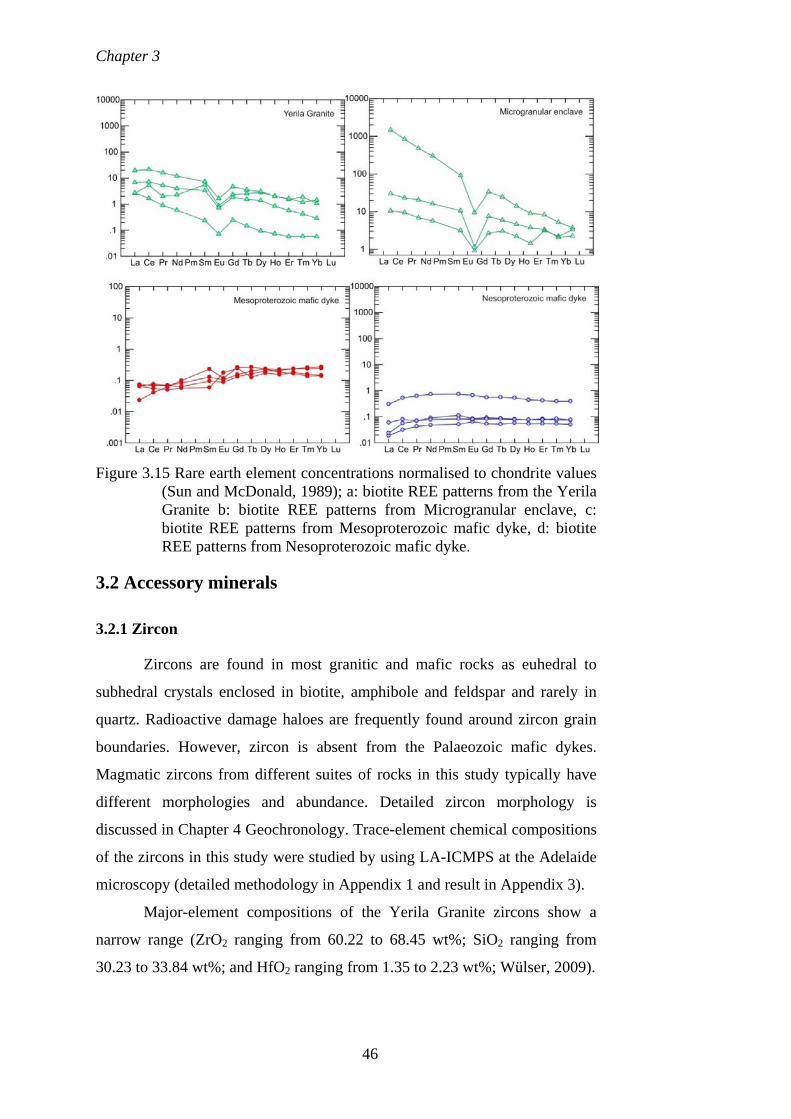
Figure 3.15 Rare earth element concentrations normalised to chondrite values
(Sun and McDonald, 1989); a: biotite REE patterns from the Yerila Granite b: biotite REE patterns from Microgranular enclave, c: biotite REE patterns from Mesoproterozoic mafic dyke, d: biotite REE patterns from Nesoproterozoic mafic dyke.
3.2 Accessory minerals
3.2.1 Zircon
Zircons are found in most granitic and mafic rocks as euhedral to
subhedral crystals enclosed in biotite, amphibole and feldspar and rarely in
quartz. Radioactive damage haloes are frequently found around zircon grain
boundaries. However, zircon is absent from the Palaeozoic mafic dykes.
Magmatic zircons from different suites of rocks in this study typically have
different morphologies and abundance. Detailed zircon morphology is
discussed in Chapter 4 Geochronology. Trace-element chemical compositions
of the zircons in this study were studied by using LA-ICMPS at the Adelaide
microscopy (detailed methodology in Appendix 1 and result in Appendix 3).
Major-element compositions of the Yerila Granite zircons show a
narrow range (ZrO2 ranging from 60.22 to 68.45 wt%; SiO2 ranging from
30.23 to 33.84 wt%; and HfO2 ranging from 1.35 to 2.23 wt%; Wülser, 2009).
Mineralogy
47
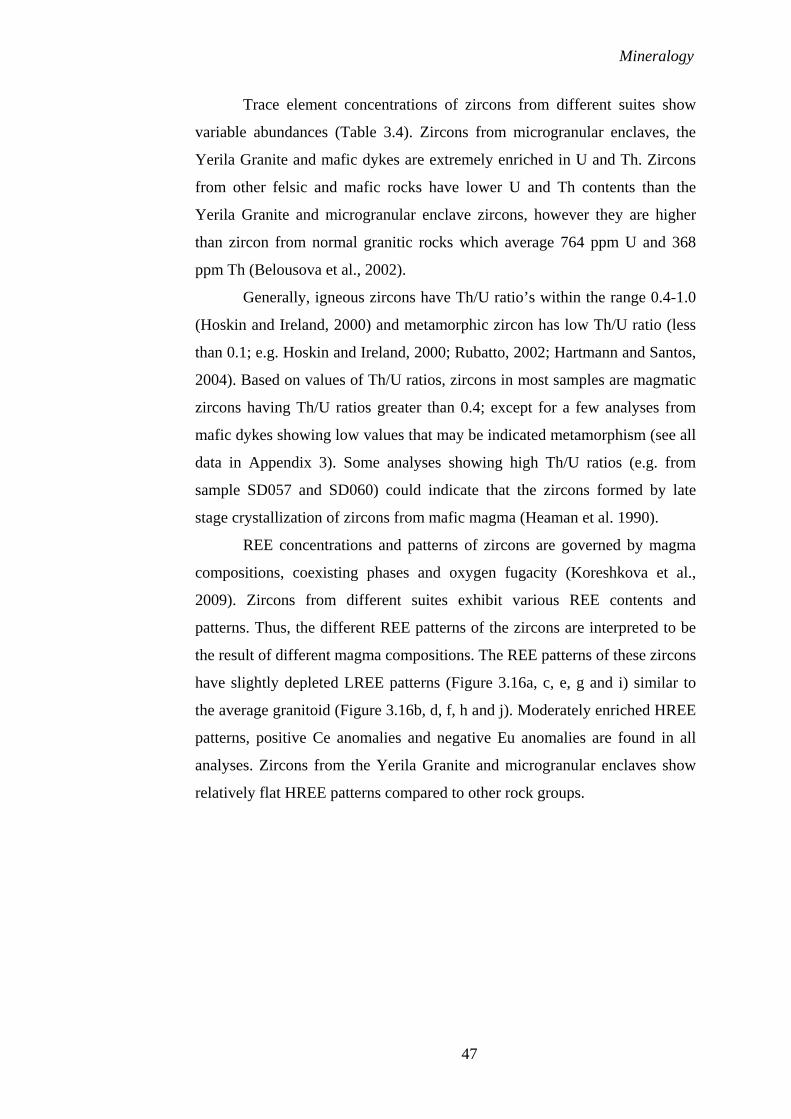
Trace element concentrations of zircons from different suites show
variable abundances (Table 3.4). Zircons from microgranular enclaves, the
Yerila Granite and mafic dykes are extremely enriched in U and Th. Zircons
from other felsic and mafic rocks have lower U and Th contents than the
Yerila Granite and microgranular enclave zircons, however they are higher
than zircon from normal granitic rocks which average 764 ppm U and 368
ppm Th (Belousova et al., 2002).
Generally, igneous zircons have Th/U ratio’s within the range 0.4-1.0
(Hoskin and Ireland, 2000) and metamorphic zircon has low Th/U ratio (less
than 0.1; e.g. Hoskin and Ireland, 2000; Rubatto, 2002; Hartmann and Santos,
2004). Based on values of Th/U ratios, zircons in most samples are magmatic
zircons having Th/U ratios greater than 0.4; except for a few analyses from
mafic dykes showing low values that may be indicated metamorphism (see all
data in Appendix 3). Some analyses showing high Th/U ratios (e.g. from
sample SD057 and SD060) could indicate that the zircons formed by late
stage crystallization of zircons from mafic magma (Heaman et al. 1990).
REE concentrations and patterns of zircons are governed by magma
compositions, coexisting phases and oxygen fugacity (Koreshkova et al.,
2009). Zircons from different suites exhibit various REE contents and
patterns. Thus, the different REE patterns of the zircons are interpreted to be
the result of different magma compositions. The REE patterns of these zircons
have slightly depleted LREE patterns (Figure 3.16a, c, e, g and i) similar to
the average granitoid (Figure 3.16b, d, f, h and j). Moderately enriched HREE
patterns, positive Ce anomalies and negative Eu anomalies are found in all
analyses. Zircons from the Yerila Granite and microgranular enclaves show
relatively flat HREE patterns compared to other rock groups.
Chapter 3
48
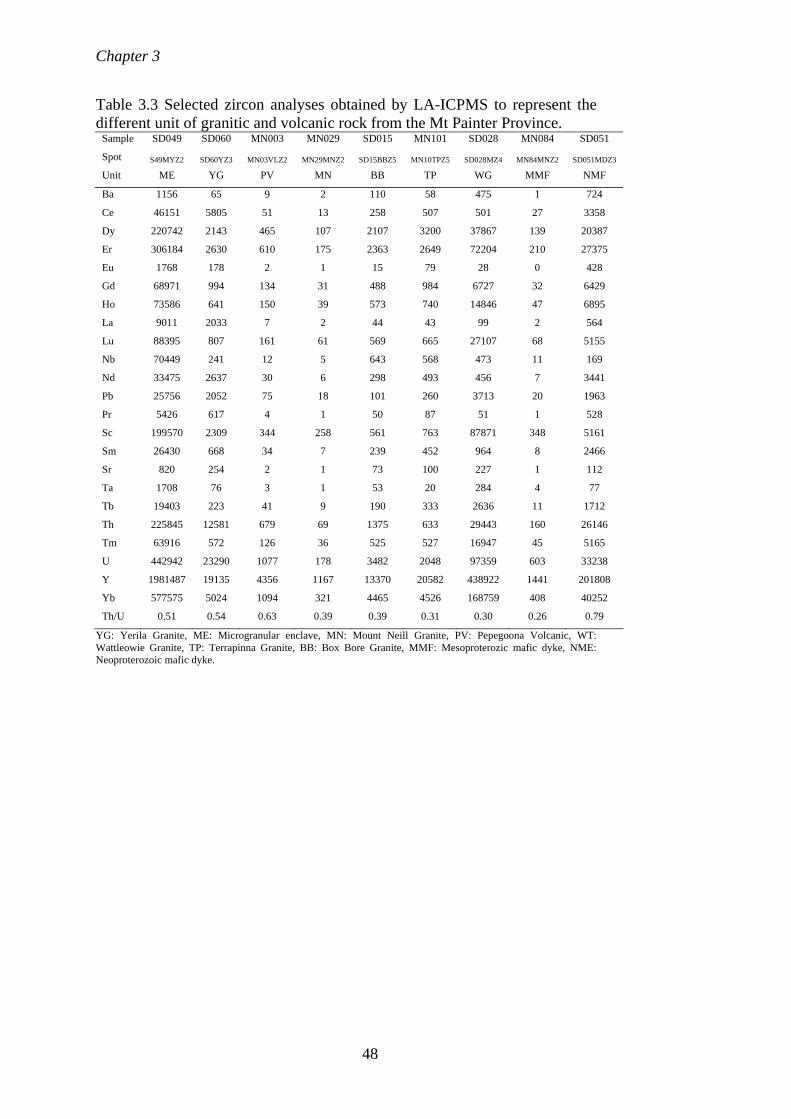
Table 3.3 Selected zircon analyses obtained by LA-ICPMS to represent the different unit of granitic and volcanic rock from the Mt Painter Province.
Sample SD049 SD060 MN003 MN029 SD015 MN101 SD028 MN084 SD051
Spot S49MYZ2 SD60YZ3 MN03VLZ2 MN29MNZ2 SD15BBZ5 MN10TPZ5 SD028MZ4 MN84MNZ2 SD051MDZ3
Unit ME YG PV MN BB TP WG MMF NMF
Ba 1156 65 9 2 110 58 475 1 724
Ce 46151 5805 51 13 258 507 501 27 3358
Dy 220742 2143 465 107 2107 3200 37867 139 20387
Er 306184 2630 610 175 2363 2649 72204 210 27375
Eu 1768 178 2 1 15 79 28 0 428
Gd 68971 994 134 31 488 984 6727 32 6429
Ho 73586 641 150 39 573 740 14846 47 6895
La 9011 2033 7 2 44 43 99 2 564
Lu 88395 807 161 61 569 665 27107 68 5155
Nb 70449 241 12 5 643 568 473 11 169
Nd 33475 2637 30 6 298 493 456 7 3441
Pb 25756 2052 75 18 101 260 3713 20 1963
Pr 5426 617 4 1 50 87 51 1 528
Sc 199570 2309 344 258 561 763 87871 348 5161
Sm 26430 668 34 7 239 452 964 8 2466
Sr 820 254 2 1 73 100 227 1 112
Ta 1708 76 3 1 53 20 284 4 77
Tb 19403 223 41 9 190 333 2636 11 1712
Th 225845 12581 679 69 1375 633 29443 160 26146
Tm 63916 572 126 36 525 527 16947 45 5165
U 442942 23290 1077 178 3482 2048 97359 603 33238
Y 1981487 19135 4356 1167 13370 20582 438922 1441 201808
Yb 577575 5024 1094 321 4465 4526 168759 408 40252
Th/U 0.51 0.54 0.63 0.39 0.39 0.31 0.30 0.26 0.79
YG: Yerila Granite, ME: Microgranular enclave, MN: Mount Neill Granite, PV: Pepegoona Volcanic, WT: Wattleowie Granite, TP: Terrapinna Granite, BB: Box Bore Granite, MMF: Mesoproterozic mafic dyke, NME: Neoproterozoic mafic dyke.

Mineralogy
49
Figure 3.16 Rare earth element concentrations of zircons from MP mafic and
felsic igneous rocks normalised to chondrite values (Sun and McDonald, 1989).

Chapter 3
50
The abundance of REEs in microgranular enclave and Yerila Granite
zircons might increase during crystallization. A negative Eu anomaly, which
is a common characteristic of granitic zircons (e.g. Murali et al, 1983; Hoskin
and Ireland, 2000), could reflect coexistence of zircon and K-feldspar (Murali
et al, 1983; Hinton and Upton, 1991) or to Eu depletion of the rock as a whole
(Schaltegger et al., 1999), moreover it also reflects the presence of Eu2+ in the
melt related to reducing conditions (Hoskin and Schaltegger, 2003).
Generally, a positive Ce anomaly in igneous zircons has been suggested to
indicate an abundance of Ce4+, or oxidising conditions, which allows Ce4+ to
readily substitute for Zr4+ (Hoskin and Schaltegger, 2003). However, a small
positive Ce anomaly in meteorites, lunar and mantle-affinity zircons is
consistent with reducing conditions during zircon formation. Based on the
negative Eu and small positive Ce anomalies the zircons from the Mt Painter
Province are interpreted to have formed under reducing conditions. Lower
HREE enrichment in the Yerila Granite and microgranular enclave zircons
compared to other groups could be caused by sub-solidus recrystallization
(Hoskin and Black, 2000; Rubatto, 2002). Normally, melts enriched in
incompatible elements such as the LREE, U and Th are related to fractional
crystallization (Hoskin, 2005) which results in enrichment in incompatible
elements at the outer part of the crystal relative to the inner part. The analyses
of large zircon grains from microgranular enclaves (Sample SD047; Table
3.4) do not show consistent patterns, with increasing U and Th concentrations
found both toward the cores and toward the rims of different grains. The
zircons from the Mt Painter Province are enriched in REE, U and Th, in
particular zircons from the Yerila Granite and microgranular enclaves have
similar patterns to hydrothermal zircon from the Boggy Plain zoned pluton
aplite, eastern Australia (Figure 3.17; Hoskin, 2005). This suggests that zircon
from the Mt Painter Province granites could have precipitated from melts
evolved from magma during the final stages of crystallization.

Mineralogy
51
Table 3.4 U and Th contents anf Th/U ratio of core and rim zircons from sample SD047 (microgranular enclaves). Spot Core/Rim Th (ppm) U (ppm) Th/U
1 Core 3495 4392 0.8
Rim 406 1581 0.3
2 Core 2412 8430 0.3
Rim 155 1034 0.1
3 Core 1107 1961 0.6
Rim 1990 9989 0.2
4 Core 6858 4533 1.5
Rim1 3840 5772 0.7
Rim2 1530 12466 0.1
5 Core 1593 4493 0.4
Rim 1083 6033 0.2
6 Core 8693 7336 1.2
Rim1 4811 12376 0.4
Rim2 3594 27522 0.1
7 Core 4448 10487 0.4
Rim 714 5556 0.1
8 Core 1779 1408 1.3
Rim 1905 12468 0.2
9 Core 3382 3366 1.0
Rim1 358 1916 0.2
Rim2 817 3437 0.2
Figure 3.17 REE patterns of zircons from mafic and felsic magmatic rocks of
the Mt Painter Province compare to magmatic and hydrothermal zircons from (data from Hoskin, 2005) and average granitiod zircon (from Belousova et al, 2002).

Chapter 3
52
3.2.2 Allanite
Allanite is typically an important host for U and Th and is the main
repository for LREE in the continental crust (Gromet and Silver, 1983; Bea
1996). Studying the geochemistry of allanites could assist in determining the
genesis of the enriched U-Th grainitic rocks of the Mt Painter Province.
In this study, allanites are found in both felsic and mafic rocks;
however they are more abundant in the Yerila Granite and its enclaves. The
allanites are typically large euhedral to subeuhedral and yellow to yellowish
brown crystals (average of 3 mm and up to 5 mm). The allanite crystals
contain fissures and tracks of alpha-particles, a texture like that of primary
allanite in A-type granites from Graciosa Province, Brazil (Vlach and Gualda,
2007), and may indicate replacement of metamict allanite. Darker zones
generally appear along fractures and boundaries between allanite and other
minerals. These suggest that the allanites were affected by hydrothermal
alteration, which was later increased by radioactive damage and related
chemical transformations (Poitrasson, 2002). However, some allanite grains
preserve patchy zoning indicating a primary magmatic origin. Allanite in the
mafic dykes is smaller (<100 μm) and more affected by hydrothermal
alteration than the Yerila Granite allanites. Apatite, zircon, ilmenite and
magnetite inclusions and rims of epidote are observed in these allanites. The
allanite is found as inclusions in biotite and may itseft contain biotite
inclusions. This evidence is interpreted to suggest that the allanites began to
crystallize at about the same time as biotite but after feldspar, amphibole, and
apatite. Fluorite is found surrounding allanite grains, having formed from late
F-rich fluids.
Allanites from Yerila Granite and micrograular enclaves were
analysed for their chemical compositions in this study. They are much
enriched in Ce compare to other REE (Table 3.5). Based on the classification
of Ercit (2002) using major REE contents of allanite-(Ce), allanite-(La) and
allanite-(Y), the allanite grains are identified as allanite-(Ce). These allanites
can be further classified further more as Mn-poor allanite-(Ce) showing
Mn<0.14 apfu (atoms per formula unit; Table 3.5 and Appendix 3) which is
linked to the magmatic series granitic rocks (Hoshino et al., 2006). Wülser

Mineralogy
53
(2009) analysed the Yerila Granite allanites and suggested that the allanite
compositions are between allanite-Ce and ferriallanite-(Ce). The ThO2 content
in the Yerila Granite and microgranular enclave allanites widely ranges from
0.90 to 2.91 wt% and from 0.96 to 2.64 wt%, respectively. The U2O content
ranges from 0.04 to 0.26 wt% for enclave allanites and 0.04 to 0.29 wt% for
Yerila granite allanites.
The allanite from the Yerila granite and its enclaves contain high
concentrations of trace elements. The total of REE, Th and U of these allanite
are generally high (up to 168494 ppm; Table 3.5).
Table 3.5 Selected allanite analyses obtained by LA-ICPMS from the Yerila Granite and micrgranular enclave from the Mt Painter Province. Sample MN096 MN096 MN096 MN096 MN092 MN092 MN092 MN092
Spot MN96ALN1 MN96ALN2 MN96ALN5 MN96ALN6 MN92ALN3 MN92ALN4 MN92ALN5 92ALC0S1
Unit ME ME ME ME YG YG YG YG
Ba 390 150 78 55 93 112 91 230
Ce 48386 122578 85038 86664 54644 110231 67560 79755
Cr 46 48 45 26 15 26 26 37
Dy 2975 1581 1314 681 451 1564 1297 1471
Er 1232 486 421 218 152 575 435 540
Eu 48 63 43 27 32 72 71 83
Ga 87 237 177 179 141 144 145 180
Gd 2115 3250 2316 1345 823 2288 2091 2360
Ho 499 225 192 99 67 253 195 238
La 1780 67703 46228 54931 41832 27789 30904 41305
Lu 141 42 37 20 16 52 38 50
Mn 2468 2332 1969 2385 854 2278 2204 2078
Nb 14 28 42 26 156 449 111 333
Nd 3846 39714 27546 22020 14080 19121 21070 23074
Pb 1951 2667 2233 1019 824 1717 1310 1793
Pr 887 12264 8552 7690 4734 5800 6449 7104
Rb 457 9 18 5 8 11 8 15
Sc 69 54 54 25 49 206 129 149
Sm 1381 5395 3708 2337 1464 3200 3168 3478
Sr 110 1431 1354 892 2363 981 1117 1144
Tb 435 350 270 145 94 294 252 289
Th 64089 16854 15014 9820 10056 15234 11014 20383
Ti 2045 11242 10698 13474 6319 9123 6438 9100
Tm 151 55 47 26 20 67 49 63
U 7845 2170 568 347 648 2049 2272 2441
V 193 221 196 174 51 208 453 292
Y 9474 6631 4996 2783 2008 6797 6126 5533
Yb 943 329 284 152 108 386 284 368
Zr 191 651 660 84 6936 2310 159 4794
Σ REE 62846 241401 167123 168494 113659 165455 127092 139844

Chapter 3
54
The chondrite-normalised REE patterns of the allanites from the
Yerila Granite and microgranular enclaves display a similar pattern with
enriched LREE, depleted HREE and negative Eu anormalies (Figure 3.18),
which are typical for allanite-(Ce). Decreasing LREE in some allanite
analyses may be caused by hydrothermal alteration by oxidizing fluids
(Poitrasson, 2002). The allanite in this study is overgrown by epidote, which
is REE-poor, but the reverse is not seen. The allanite REE patterns are very
similar to the whole-rock Yerila Granite and microgranular enclave, which
suggest that the allanites contain the majority of the REE in the rocks. The
textural relationships between allanite and epidote could be used for estimate
minimum crystallization temperature for allanite. Early allanite crystallized at
temperature exceeding the stability field of epidote (above 700 °C; Oberli et
al., 2004).
Figure 3.18 Rare earth element concentrations of allanites normalised to
chondrite values (Sun and McDonald, 1989) from a) the Yerila granite and b) microgranular enclave.

Mineralogy
55
3.2.3 Apatite
Apatite is one of the major hosts for REE, Sr, Y and Mn in granites
and other rock types and typically forms as an early magmatic phase (O’reilly
et al., 1991; Casillas et al., 1995). Apatite is present in all rock units in the Mt
Painter Province mafic and felsic rocks but is most common in mafic dykes. It
appears as euhedral to subhedral needles and grains in various size and is
found as inclusion in biotite, quartz, feldspar, allanite and zircon.
Apatites from the Yerila Granites are fluorine-rich (fluroapatite;
Wülser, 2009) with Y-enriched compositions (Y2O3 content up to 2.5 wt%;
Wülser, 2009). Two populations of fluoroapatite including Y-poor and Y-rich
and Si-bearing populations are found in the Yerila Granites (Wülser, 2009).
Apatites from the Yerila Granite, microgranular enclave and
Mesoproterozoic mafic dyke were analysed for their trace elements and they
typically contain low concentrations of REEs (Table 3.4).
REE patterns of the apatites are mainly depleted in LREE, enriched in
HREE and have negative Eu anomalies, however, some apatites from the
microgranular enclaves and mafic dykes show negative REE trends (Figure
3.19). The behaviour of HREE and LREE in apatites strongly reflects the
crystallization environment in host rocks (Belousova et al., 2001). Enriched
LREE and steeper LREE patterns may indicate more oxidised granites and
high degrees of fractionation (Belousova et al., 2001) and are characteristic
of I-type granites (Broska et al., 2004). On the other hand, apatite REE
patterns with LREE depletion and HREE enrichment may indicate a more
reduced condition, which is found within the Yerila Granite, microgranular
enclaves and mafic dykes. Enriched HREE in the REE pattern of the apatites
is common in S-type and A-type granites (Broska et al., 2004). Sr contents in
apatites, which vary from low to high contents (Appendix 3) could indicate
different degrees of fractionation.

Chapter 3
56
Table 3.3 Selected apatite analyses obtained by LA-ICPMS from the Yerila Granite, microgranular enclave and mafic dyke from the Mt Painter Province.
Sample BB06 BB06 MN092 MN092 MN092 MN092 MN092 MN096 MN096
Spot BB6AP1 BB6AP2 92pc1s1 92pc3s1 92pc4s1 MN92AP1 MN92AP3 MN96AP4 MN96AP6
Unit Mafic
Dyke
Mafic
Dyke
Yerila
Granite
Yerila
Granite
Yerila
Granite
Yerila
Granite
Yerila
Granite Enclave Enclave
Ce 489 744 172 658 497 381 784 119 69
Co <0.30 <0.240 3 1 1 0 <0.21 <0.16 <0.072
Cu <0.68 <0.64 59 3 1 <0.62 <0.59 <0.149 <0.084
Dy 227 276 490 2011 1805 2861 2210 612 360
Er 95 120 430 1812 1386 2180 1770 450 264
Eu 32 30 15 39 37 56 63 6 4
Ga 0 1 4 10 18 0 1 0 0
Gd 295 331 206 878 1053 1643 1361 352 207
Ho 40 50 128 528 435 711 561 143 83
La 147 381 49 192 113 111 213 26 15
Lu 7 8 69 292 205 312 312 65 40
Nb 0 0 1 2 1 0 0 0 0
Nd 603 618 173 711 873 898 1166 213 118
Pb 4 4 7 47 19 27 22 1 2
Pr 93 106 31 119 117 100 170 29 16
Rb <0.35 <0.34 3 7 85 2 2 2 0
Sm 234 237 95 405 550 726 659 149 85
Sr 312 275 31 30 26 21 20 9 6
Tb 39 46 54 218 226 348 271 75 44
Th 2 3 71 540 317 725 567 155 122
Tm 11 13 63 278 204 328 289 65 39
U 28 30 32 171 117 229 184 61 46
Y 1159 1346 4089 17226 13368 22265 20770 4757 2678
Yb 54 65 419 1878 1352 2083 1918 442 266
Zr 0 0 11 58 7 2 4 0 0
Σ REE 3488 4329 6500 27565 22313 35383 32812 7584 4363

Mineralogy
57
Figure 3.19 Rare earth element concentrations of apatites normalised to
chondrite values (Sun and McDonald, 1989) from a) the Yerila Granite; b) microgranular enclaves and c) mafic dyke.
3.2.4 Ti minerals
Ti minerals are found in both mafic and felsic rocks. They are
characterised by anhedral to subhedral morphologies. Ti minerals from the
Yerila Granite and microgranular enclaces are typically colourless in thin
section but are reddish brown to opaque in samples from mafic dykes. The Ti
minerals occur within allanite, plagioclase, amphibole, quartz, biotite and K-
feldspar.
Chemical compositions of Ti minerals were analysed by EMP and
LA-ICPMS (Appendix 1). Ti minerals identified in mafic dykes, including
rutile (TiO2), ilmenite (FeTiO3) and titanite (CaTiSiO5) are typically altered.
Colourless Ti minerals including sphene or titanite and altered ilmenite found
in the U- and Th-enriched Yerila Granite and microgranular enclaves have
unusual compositions, having high Y and REE contents (Y2O3 up to 2.5
wt%), moderate Al2O3 and Fe2O3 concentrations (average of 5.8 and 1.6 wt%,
respectively) and high fluorine contents (>2 wt%; Wülser, 2009).
Sphenes from the microgranular enclaves have U and Th contents
ranging from 34 to 148 ppm and 53 to 198 ppm, respectively (Appendix 3).

Chapter 3
58
The Yerila Granite sphenes have higher U and Th contents, ranging from 52
to 531 ppm and 4 to 300 ppm, respectively. Yerila Granite ilmenites contain
high U and Th concentrations from 3752 to 5421 ppm and 155 to 271 ppm
respectively. Ti minerals from mafic dykes have high U (up to 86338 ppm)
and Th contents (up to 10386 ppm; Table 3.4).
Table 3.4 Selected Ti minerals analyses obtained by LA-ICPMS from the Yerila Granite, microgranular enclave and mafic dyke from the Mt Painter Province.
Sample MN096 MN096 MN092 MN092 MN090 SD007 SD007 BB06 BB06 Spot MN96TIN3 MN96TIN7 MN92TI3 MN92TI4 90ilc1s1 SD07TIN1 SD07TIN4 MN99TI1 MN99TI2
Unit ME ME YG YG MF MF MF MF MF
Ba 1 8 3 3 10068 10068 1 1
Ce 1625 601 710 289 6180 370 13291 7707 2211
Co 0 2 <0.34 0 86728 1109 1439 49523 41167
Cr 14 11 7 8 19987 37626 195398 296750 48782
Cu 2 2 4 6 10070 6951 32344 18035 348
Dy 3510 2523 2458 2014 237 172 1358 1058 901
Er 2086 1591 1519 1751 222 159 786 650 519
Eu 52 31 41 34 77 77 406 244 294
Ga 8 10 8 9 1193 1927 1444 3422 414
Gd 2326 1329 1320 680 630 320 1891 885 808
Hf 25 12 11 9 237 2415 11932 219 6147
Ho 720 534 521 527 69 60 355 227 171
La 272 109 229 92 3891 337 8084 4084 725
Lu 230 181 178 275 62 60 298 93 71
Nb 6253 5762 5646 6839 371219 844036 6341536 59967 12004
Nd 3015 1141 875 385 2320 253 5408 4534 2121
Ni <0.30 1 <0.69 <0.66 18591 700 3468 28496 2658
Pb 28 63 94 102 41761 237 8855 1729 1182
Pr 427 159 129 61 718 43 1303 1089 392
Rb 2 7 3 4 136 22493 4414 1141 1608
Sc 18 13 36 57 6044 245010 823419 11278 772
Sm 1609 755 784 303 645 269 1428 1133 718
Sr 5 9 7 6 5074 1080 25409 3339 301
Ta 683 624 1732 735 17886 67676 769546 2509 495
Tb 482 322 313 205 55 42 308 174 137
Th 148 48 303 191 155 202 10386 212 600
Tm 314 240 246 310 65 59 277 110 70
U 186 198 532 345 3753 11420 86338 444 373
V 137 122 144 117 1919888 790510 4264862 172745 32255
Y 20869 15326 15583 16236 865 88 5044 5522 4830
Yb 2005 1543 1602 2145 319 170 1401 666 508
Zr 239 135 167 220 5610 82655 419633 7804 283695
ΣREE 42780 31004 31278 31761 385253 846262 6377767 83610 24356
ME:Microgranular Enclave, YG: Yerila Granite, MF: Mafic Dyke

Mineralogy
59
REE patterns of Ti minerals are shown in Figure 3.20. Sphenes from
the Yerila Granite and microgranular enclaves show predominately LREE
depleted, MREE enriched patterns and negative Eu anomalies (Figure 3.20a
and b). Chondrite normalised REE patterns that display relative enrichment of
Ce over La are typical for alkaline rocks (Hode and Ulf, 2005). Depleted
REEs in some analyses of Ti minerals, which occur as residual or
fractionating phases during partial melting or fractional crystallization in the
derived magmas, can be found.
The sphene from the Yerila Granite were formed at low to moderate
pressures at high temperatures (<6 kbar; >400 C) corresponding to late-to
post-magmatic conditions (Wülser, 2009).
Figure 3.20 Rare earth element concentrations of Ti-minerals normalised to
chondrite values (Sun and McDonald, 1989) from a) the Yerila Granite; b) microgranular enclaves and c) mafic dyke.
3.2.5 U-Th minerals
U-Th minerals occurring as primary disseminated phases are found as
minor accessory constituents in the HHP mafic and felsic rocks of the Mt
Painter Province. They are more abundant in the Yerila Granite and
microgranular enclaves and are found at lesser levels in other suites. The U-
Th minerals of the Yerila Granite and microgranular enclaves typically occur
as euhedral to anhedral, solitary crystals, with grain sizes ranging between 10
to 100 μm. They are hosted by amphibole, biotite, quartz, plagioclase and K-

Chapter 3
60
feldspar and often are adjacent to zircon and apatite. They have generated
radioactive damage zones on biotite, feldspar and amphibole at grain
boundaries. Wülser et al. (2005) suggested that the original magmatic U-Th
minerals include uranothorite, Th-enriched uraninite, uraninite, thorite,
coffinite and uraniferous apatite from the HHP granite of Mt Painter Province.
Table 3.5 shows trace element concentrations in the U-Th minerals.
REE patterns of U-Th minerals from the Yerila Granite and microgranular
enclaves are shown in Figure 3.21. They display negative patterns (enriched
LREE and depleted HREE) with negative Eu anomalies (Eu/Eu* = 0.09-
0.30). The U-Th minerals of Yerila Granite show positive Ce anomalies.
Negative Eu anomaly in the REE patterns indicates reducing conditions at the
mineral forming stage. The REE patterns are similar for both the U-Th
minerals and the host Yerila Granite.
Wülser (2005) suggested that the original magmatic U-Th minerals
were overprinted by a late-magmatic metasomatic event. Flow of F-rich fluids
through the rocks during a Late-Ordovician magmatic-thermal event played
an important role in the U-Th-rich rocks forming secondary U-Th minerals,
which replaced primary U-Th minerals within fracrure in allanite, apatite,
titanite/ilmenite, zircon, K-feldspar and amphibole (Elburg et al., 2003).
3.3 Discussion
3.3.1 Relationships between accessory minerals and whole rocks
In the Mesoproterproterozic HHP rocks from the Mt Painter Province,
most of the LREEs reside within allanite and U-Th minerals, with the
remainder in biotite, feldspar and amphibole. Most of the HREEs reside
within zircon, apatite, Ti minerals and amphibole. Most of the Y resides in
accessory mineral including apatite, allanite, Ti-minerals, U-Th mineral and
zircon with lees amounts in amphibole. Feldspar is the most important Eu
reservoir containing most of the Eu. Th is mainly found within accessory
minerals such as allanite, U-Th minerals, Ti minerals (sphene) and zircon. U
mainly contain within zircon, U-Th minerals, allanite and Ti minerals with
minor in apatite.

Mineralogy
61
Table 3.5 U-Th mineral analyses obtained by LA-ICPMS from the Yerila Granite and microgranular enclave from the Mt Painter Province.
Sample MN092 MN092 MN092 MN096
Spot MN92U1 MN92U3 MN92UZ3 MN96U
Unit Yerila Granite Yerila Granite Yerila Granite Enclave
Ba 22 33 3 660
Ca 1 1 1 8
Ce 850 6850 548 40604
Co 4 1 0 56
Cr 2 36 0 44
Cu 9 7 2 133
Dy 39 100 92 477
Er 13 34 57 141
Eu 6 8 5 99
Ga 12 13 1 259
Gd 56 174 83 1358
Hf 35 26 9 843
Ho 6 16 20 72
La 230 3174 151 29756
Lu 1 4 8 12
Mg 3815 446 43 124883
Mn 319 279 29 4912
Nb 58 80 179 733
Nd 250 1676 205 14145
Ni 2 0 0 28
Pb 884 383 161 1462
Pr 63 521 48 4591
Rb 93 1 0 1419
Sc 7 11 3 55
Sm 57 254 68 2065
Sr 15 85 6 2683
Ta 1 4 21 4
Tb 7 21 13 121
Th 22931 1328 4441 259370
Ti 1265 1621 5051 28133
Tm 2 5 9 15
U 829 551 489 6117
V 7 7 10 173
Y 147 413 653 2382
Yb 9 32 60 81
Zr 2160 1124 513 40623
ΣREE 1735 13281 2021 95919
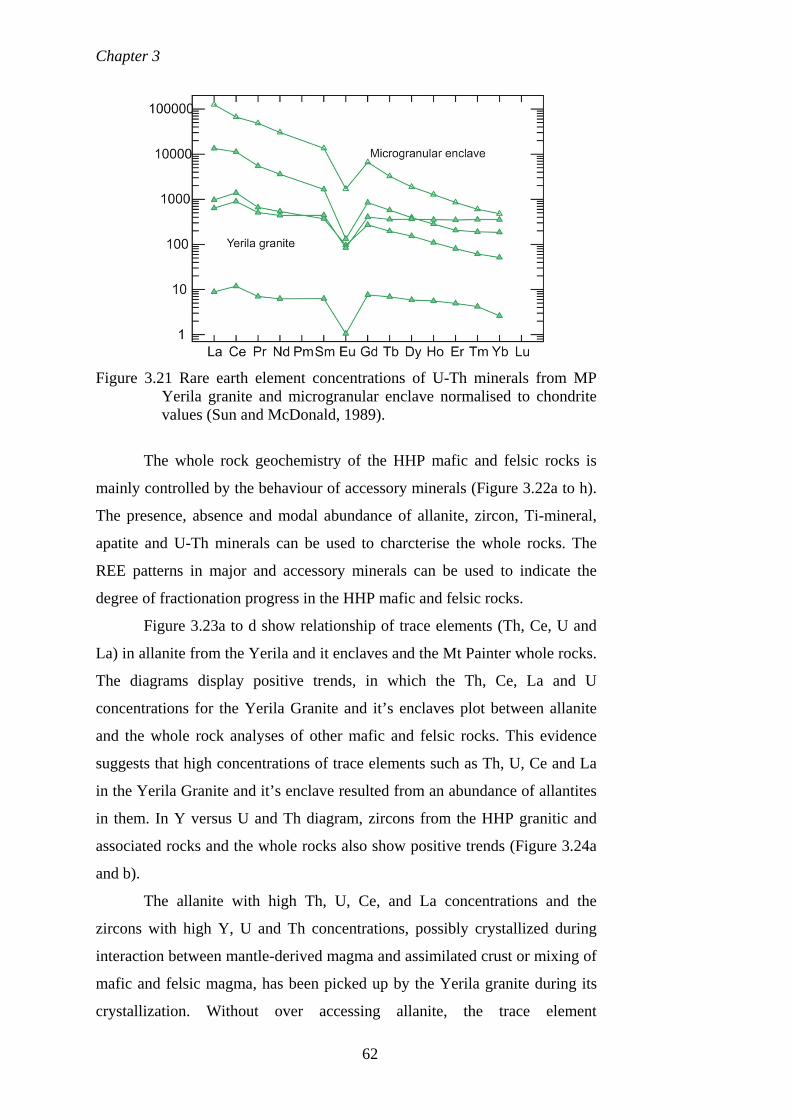
Chapter 3
62
Figure 3.21 Rare earth element concentrations of U-Th minerals from MP
Yerila granite and microgranular enclave normalised to chondrite values (Sun and McDonald, 1989).
The whole rock geochemistry of the HHP mafic and felsic rocks is
mainly controlled by the behaviour of accessory minerals (Figure 3.22a to h).
The presence, absence and modal abundance of allanite, zircon, Ti-mineral,
apatite and U-Th minerals can be used to charcterise the whole rocks. The
REE patterns in major and accessory minerals can be used to indicate the
degree of fractionation progress in the HHP mafic and felsic rocks.
Figure 3.23a to d show relationship of trace elements (Th, Ce, U and
La) in allanite from the Yerila and it enclaves and the Mt Painter whole rocks.
The diagrams display positive trends, in which the Th, Ce, La and U
concentrations for the Yerila Granite and it’s enclaves plot between allanite
and the whole rock analyses of other mafic and felsic rocks. This evidence
suggests that high concentrations of trace elements such as Th, U, Ce and La
in the Yerila Granite and it’s enclave resulted from an abundance of allantites
in them. In Y versus U and Th diagram, zircons from the HHP granitic and
associated rocks and the whole rocks also show positive trends (Figure 3.24a
and b).
The allanite with high Th, U, Ce, and La concentrations and the
zircons with high Y, U and Th concentrations, possibly crystallized during
interaction between mantle-derived magma and assimilated crust or mixing of
mafic and felsic magma, has been picked up by the Yerila granite during its
crystallization. Without over accessing allanite, the trace element

Mineralogy
63
concentration of in the Yerila Granite could possibly be same amount of the
other mafic and felsic rocks of the Mt Painter Province.
Figure 3.22a to h Rare earth element patterns of major and accessory minerals
comparing to whole rocks of the Mt Painter rocks.
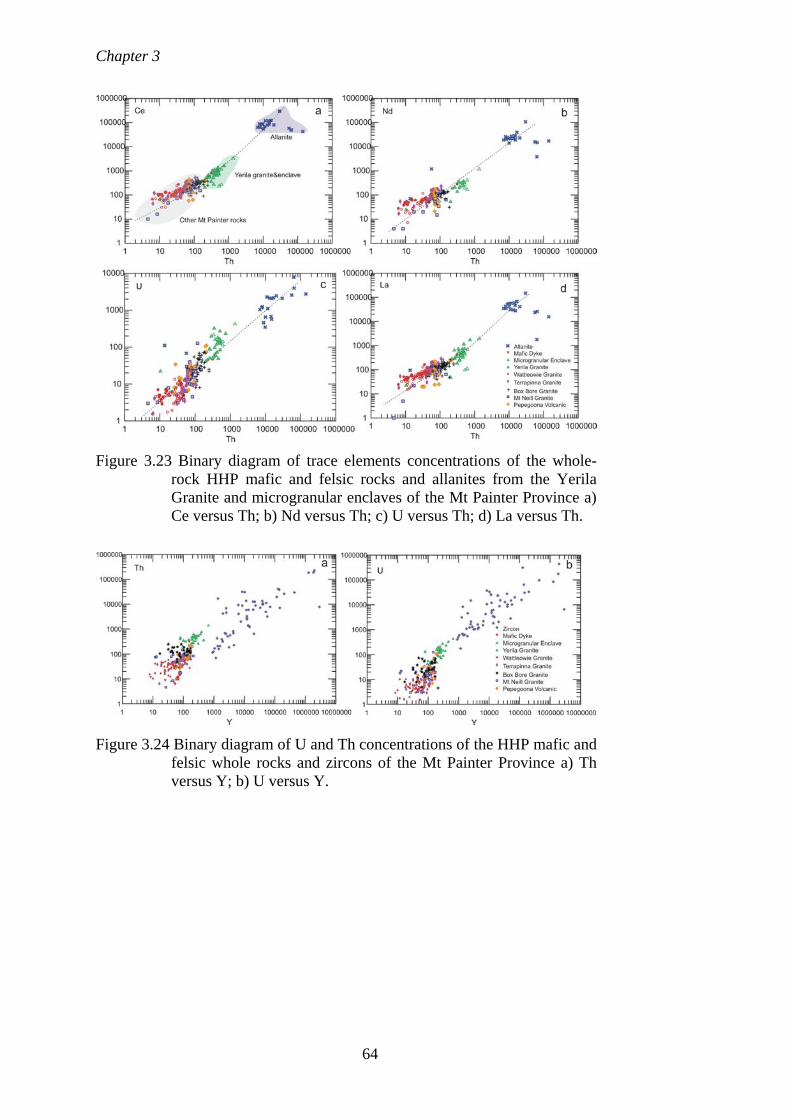
Chapter 3
64
Figure 3.23 Binary diagram of trace elements concentrations of the whole-
rock HHP mafic and felsic rocks and allanites from the Yerila Granite and microgranular enclaves of the Mt Painter Province a) Ce versus Th; b) Nd versus Th; c) U versus Th; d) La versus Th.
Figure 3.24 Binary diagram of U and Th concentrations of the HHP mafic and
felsic whole rocks and zircons of the Mt Painter Province a) Th versus Y; b) U versus Y.