PETROGENESIS OF GRANITOID ROCKS AND ORIGIN OF URANIUM MINERALIZATIONS OF UM SAFI AREA CENTRAL...
15
279 PETROGENESIS OF GRANITOID ROCKS AND ORIGIN OF URANIUM MINERALIZATIONS OF UM SAFI AREA, CENTRAL EASTERN DESERT, EGYPT. M. E. Ibrahim*, A. M. Osman**, M. Y. Attawiya* and I. H. Ibrahim* * Nuclear Materials Authority, Cairo, Egypt. ** Geology Department, Faculty of Science, Ain Shams University, Cairo, Egypt. ABSTRACT: The granitoid rocks of Um Safi area have been subdivided according to their field relationships, petrography as well as geochemical characteristics into three categories termed magmatic cycles of emplacement during successive tectonic events. Granites of the first magmatic cycle (diorites, quartz diorites, tonalites and gneissic granodiorites) have calc-alkaline, metaluminous, I-type character and emplaced during pre-plate collision to post collision uplift regime under a high water-vapour pressured (5-10 k-bar) and high temperature (800-840 o C). The second magmatic cycle is represented by biotite granites and perthite sub-leucogranites and characterized by calc-alkaline, metaluminous magma and emplaced during late-orogenic regime. Granites of the third magmatic cycle are mainly peraluminous muscovite sub-leucogranites in composition and crosscut all other rock types in the region and were emplaced during syn-collision regime. The latter two magmatic cycles were emplaced at moderate water-vapour pressure (2-5 k-bar) and temperature (760-800 o C). The average eU- and eTh-contents increase gradually from older granitoids (3 ppm eU & 7 ppm eTh) through biotite granites (6 ppm eU & 13 ppm eTh), perthite sub-leucogranites (7 ppm eU & 15 ppm eTh) to muscovite sub-leucogranites (9 ppm eU & 17 ppm eTh). The shear zone in muscovite sub-leucogranites is considered as a good trap for uranium mineralizations (288 ppm eU and 28 ppm eTh). The occurrence of secondary U-mineralizations (zippeite and beta-uranophane) along the shear zone indicates that, these two minerals occurred as a result of leaching of pre-existing uranium minerals in peraluminous muscovite sub-leucogranites by circulating water. Finally, Um Safi peraluminous muscovite sub-leucogranites could represent a favorable source for U-deposits, but total uranium content does not automatically give a measure of fertility. Keywords: Um Safi – petrogenesis - uranium mineralizations. 1. INTRODUCTION Generally, the older granitoids were previously mapped as grey granites by Hume (1935), older grey granites (formed at depth by the granitization of pre- existing masses) by El Ramly and Akaad (1960), syn- to late-orogenic plutonites by El Shazly (1964) and synorogenic granitoids of El Gaby (1975). They pertain to the earlier phases of calc-alkaline granite series by El-Gaby and Habib (1982), and G 1 -granites (subduction related I-type granite formed above old Benioff zones) by Hussein et al., (1982). The emplacement of the older granitoids occurred at around 850-930Ma, possibly extend to 711Ma (El Manharawy, 1977; Dixon, 1979; Hashad, 1980; Rogers and Greenberg, 1983). The younger granites have been referred in Egyptian literature as Gattarian granites (Hume, 1935), younger intrusive red and pink granites (El Ramly and Akaad, 1960), late- to post-orogenic granites (El Gaby, 1975) and G-II to G-III granites (Hussein et al., 1982). They are emplaced around 430-622Ma, which are contemporaneous with the Pan-African tectonic thermal events (El Manharawy, 1977; Dixon, 1979; Hashad, 1980; Rogers and Greenberg, 1983). Most of the Egyptian uranium occurrences in granites (G. Um Ara, G. Gattar, G. Missikat and El- Erediya) belong to metaluminous to slightly peraluminous granites (biotite only or biotite + hornblende, with subordinate secondary muscovite). Uranium deposits associated with this type of granites are less common than those associated with peraluminous granites (Cuney, 1998). This work is a contribution to the understanding of geology, geochemistry, petrogenesis and origin of uranium mineralization along the shear zone in Um Safi muscovite sub-leucogranites. Egyptian Journal of Geology, v. 45/1, 2001, pp. 279-294
Transcript of PETROGENESIS OF GRANITOID ROCKS AND ORIGIN OF URANIUM MINERALIZATIONS OF UM SAFI AREA CENTRAL...

279
PETROGENESIS OF GRANITOID ROCKS AND ORIGIN
OF URANIUM MINERALIZATIONS OF UM SAFI AREA,
CENTRAL EASTERN DESERT, EGYPT.
M. E. Ibrahim*, A. M. Osman**, M. Y. Attawiya* and I. H. Ibrahim*
* Nuclear Materials Authority, Cairo, Egypt.
** Geology Department, Faculty of Science, Ain Shams University, Cairo, Egypt.
ABSTRACT:
The granitoid rocks of Um Safi area have been subdivided according to their field relationships, petrography as
well as geochemical characteristics into three categories termed magmatic cycles of emplacement during
successive tectonic events. Granites of the first magmatic cycle (diorites, quartz diorites, tonalites and gneissic
granodiorites) have calc-alkaline, metaluminous, I-type character and emplaced during pre-plate collision to post
collision uplift regime under a high water-vapour pressured (5-10 k-bar) and high temperature (800-840 oC). The
second magmatic cycle is represented by biotite granites and perthite sub-leucogranites and characterized by
calc-alkaline, metaluminous magma and emplaced during late-orogenic regime. Granites of the third magmatic
cycle are mainly peraluminous muscovite sub-leucogranites in composition and crosscut all other rock types in
the region and were emplaced during syn-collision regime. The latter two magmatic cycles were emplaced at
moderate water-vapour pressure (2-5 k-bar) and temperature (760-800 oC).
The average eU- and eTh-contents increase gradually from older granitoids (3 ppm eU & 7 ppm eTh) through
biotite granites (6 ppm eU & 13 ppm eTh), perthite sub-leucogranites (7 ppm eU & 15 ppm eTh) to muscovite
sub-leucogranites (9 ppm eU & 17 ppm eTh). The shear zone in muscovite sub-leucogranites is considered as a
good trap for uranium mineralizations (288 ppm eU and 28 ppm eTh).
The occurrence of secondary U-mineralizations (zippeite and beta-uranophane) along the shear zone indicates
that, these two minerals occurred as a result of leaching of pre-existing uranium minerals in peraluminous
muscovite sub-leucogranites by circulating water. Finally, Um Safi peraluminous muscovite sub-leucogranites
could represent a favorable source for U-deposits, but total uranium content does not automatically give a
measure of fertility.
Keywords: Um Safi – petrogenesis - uranium mineralizations.
1. INTRODUCTION
Generally, the older granitoids were previously
mapped as grey granites by Hume (1935), older grey
granites (formed at depth by the granitization of pre-
existing masses) by El Ramly and Akaad (1960),
syn- to late-orogenic plutonites by El Shazly (1964)
and synorogenic granitoids of El Gaby (1975). They
pertain to the earlier phases of calc-alkaline granite
series by El-Gaby and Habib (1982), and G1-granites
(subduction related I-type granite formed above old
Benioff zones) by Hussein et al., (1982). The
emplacement of the older granitoids occurred at
around 850-930Ma, possibly extend to 711Ma (El
Manharawy, 1977; Dixon, 1979; Hashad, 1980;
Rogers and Greenberg, 1983).
The younger granites have been referred in Egyptian
literature as Gattarian granites (Hume, 1935),
younger intrusive red and pink granites (El Ramly
and Akaad, 1960), late- to post-orogenic granites (El
Gaby, 1975) and G-II to G-III granites (Hussein et
al., 1982). They are emplaced around 430-622Ma,
which are contemporaneous with the Pan-African
tectonic thermal events (El Manharawy, 1977;
Dixon, 1979; Hashad, 1980; Rogers and Greenberg,
1983).
Most of the Egyptian uranium occurrences in
granites (G. Um Ara, G. Gattar, G. Missikat and El-
Erediya) belong to metaluminous to slightly
peraluminous granites (biotite only or biotite +
hornblende, with subordinate secondary muscovite).
Uranium deposits associated with this type of
granites are less common than those associated with
peraluminous granites (Cuney, 1998). This work is a
contribution to the understanding of geology,
geochemistry, petrogenesis and origin of uranium
mineralization along the shear zone in Um Safi
muscovite sub-leucogranites.
Egyptian Journal of Geology, v. 45/1, 2001, pp. 279-294

280
2. Methodology
Fourteen samples from older granitoids and twenty
samples from younger granites representing the
different granitoid rocks in Um Safi area were
subjected to modal analyses for computing the
volumetric percentages of their mineral assemblage
and also for the proper identification and
nomenclature. Data were given in Table (1). The
quartz, plagioclase and potash feldspar percentages
are recalculated to 100 % and represented in the Q-
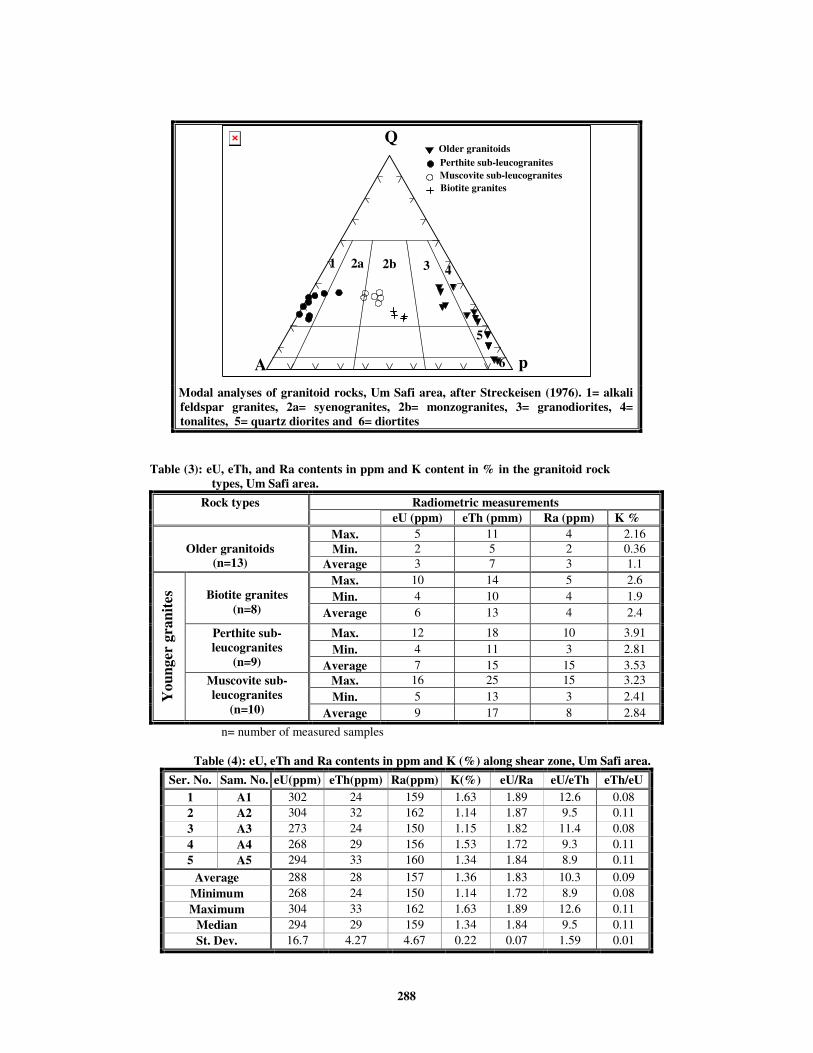
A-P diagram after Streckeisen (1976). Figure (2)
shows that, the older granitoids lie in quartz diorites,
tonalites and granodiorites fields. The biotite granite
lie in monzogranite field, the perthite sub-
leucogranites lie in alkali feldspar granite except
one-sample lies in the syenogranite field, while the
muscovite sub-leucogranites plot mainly in
monzogranite and slightly syenogranite fields.
Chemical analyses of major oxides (by wet chemical
technique after Shapiro and Brannock, 1962) as well
as some trace elements (using the X-ray
fluorescence techniques) of different granitoid
samples were carried out and the results are given in
(Table 2). The equivalent uranium (eU) and thorium
(eTh) have been measured radiometrically by using
multichannel analyzer γ-ray detector (Gamma-
spectrometer-technique).
3. Geologic Setting
The basement rock units in Um Safi area can be
chronologically arranged with the oldest as follows;
ophiolitic assemblage (serpentinites and ortho-
amphibolites), melange, arc assemblage
(metavolcanics, volcaniclastic and volcano-
sedimentary association, older granitoids and
volcanic rocks), molasse sediments, younger
gabbros (normal gabbros, hornblende gabbros and
noritic troctolites), younger granites (biotite granites,
perthite sub-leucogranites and muscovite sub-
leucogranites), post granitic dykes, and trachyte plug
(Fig. 1).
3.1. Older granitoids The older granitoids crop out in three localities
covering about 61.2 km2, representing 21.2 % of the
total basement rocks of the mapped area (Fig. 1).
The first exposure, occurrs in the northeastern part
of the mapped area, extending from Marwit El
Siwiqat in the east to westward until southern of G.
Atwani. The second exposure occurs as elongated
mass with NW-SE trend, located in the southeastern
sector with sharp contacts with gabbroic mass, while
the third exposure occupies the southwestern corner
of the mapped area, forming an extensive mass crops
out along south entrance of W. Siwiqat Um Lassaf.
These rocks are medium- to coarse-grained, grey to
dark grey in colour, exfoliated, fractured and
enclosed elongate amphibolite xenoliths. The older
granitoids intrude the older rocks with intrusive
sharp contacts. They are sheared especially in the
extreme southern pluton, forming an elongated belt
(20 km long in NW-SE trend) of cataclastic
gneissose granodiorites extending from G. El Hadid
to eastward out side the study area. They are
crosscut by numerous dykes of variable
compositions and trends, including felsic and mafic
ones (N-S, NE-SW and ENE-WSW trends) and
dissected by strike slip faults.
The older granitoids consist of different varieties
(diorites, quartz diorites, tonalites and granodiorites)
without contacts in between. Diorite is composed of
plagioclase (An16-38), hornblende, biotite, orthoclase
and quartz in decreasing order. Opaques, zircon,
apatite, sphene, epidote and prehnite are accessory
minerals. Quartz diorite is composed of plagioclase
(An 34-40), hornblende, quartz, biotite, and orthoclase.
Opaques, epidote, zircon, apatite and sphene are the
main accessory minerals. Tonalites are composed of
plagioclase (An 18-35), quartz, hornblende, biotite,
and potash feldspars (orthoclase and microperthite).
Opaques, epidote, zircon, sphene and apatite and
prehnite are accessories. Granodiorites are showing
gneissic texture and comprise two-varieties (i)
hornblende granodiorites which are composed of
plagioclase (An 23-36), quartz, orthoclase and
hornblende. Opaques, apatite, zircon and epidote are
accessories. (ii) biotite granodiorites which are
affected by muscovitization and composed of
plagioclase (An 21-35), quartz, orthoclase and biotite.
Opaques, apatite, sphene, zircon and epidote are
accessories. Muscovite, chlorite, epidote, zoisite,
and carbonate represent secondary minerals. The
older granites are extremely normal in eU (2-5 ppm)
and eTh (5-11 ppm) (Table 3).
3.2. Younger granites They cover about 50.2 km
2, representing 17.3 % of
the total basement rocks. The larger exposures of the
younger granites are exposed in the central and
southern parts, as well as, small masses scattered in
the northeast of the mapped area (Fig. 1). They
involve three types, biotite granites, perthite sub-
leucogranites and muscovite sub-leucogranites,
which are corresponding to phases II and III of the
Egyptian younger granites. They form a very high
relief and intruded serpentinites, melange, volcano-
sedimentary association, older granitoids and
younger gabbros with intrusive sharp contacts. The

281
younger granites send offshoots in the older rocks,
also barren pegmatitic veins and pockets are
common especially near their contacts. The younger
granites are invaded by dykes of different
composition ranging from felsic (rhyolite, aplite and
felsite) to mafic (basalt) through alkaline ones
(bostonite) and dissected by several strike-slip faults
(N-S, NW-SE and NE-SW trends).
Biotite granites form low topography cropping at the
eastern bank of Khour Um Safi, covering about 8.6
km2, representing 2.9 % of the total basement rocks.
They intruded older rocks and are intruded by
perthite sub-leucogranites with sharp contacts. They
are medium-grained of pinkish grey colour, showing
massive, boulder appearance. They are also
characterized by exfoliation and presence of
cavernous as a result of intensive weathering. Biotite
granites are composed of plagioclase (An 8-28),
potash feldspars (microperthite and orthoclase
microperthite), quartz and biotite. Opaques, sphene,
fluorite, zircon and apatite are accessories. Chlorite,
epidote, muscovite and sericite are secondary
minerals. The biotite granites show a variation in eU
and eTh contents ranging from 4-10 ppm with an
average of 6 ppm and from 10-14 ppm with an
average of 13 ppm respectively (Table 3).
Perthite sub-leucogranites are medium- to coarse-
grained, covering about 28.3 km2, representing 9.8
% of the total basement rocks. They are represented
by G. Um Bakra and G. Um Samra and elongated in
a WNW-ESE direction parallel to the regional
structure. They are pink to reddish pink in colour
and characterized by boulder and blocky appearance,
exfoliation and highly fractured in different
directions. The perthite sub-leucogranite is non-
xenolithic, with the exception of a single occurrence
towards the southern foothills of G. Um Bakra,
where gabbroic rocks form xenolithic bodies either
as thin elongated or even dyke-like masses.
Silicification and hematitization along the fracture
planes represent the post-magmatic hydrothermal
alteration features. These rocks are dissected by
strike-slip fault filled by quartz, which sometimes
contains violet fluorite and sulphide mineralization.
Perthite sub-leucogranites are composed of potash
feldspars (microperthite, orthoclase microperthite
and microcline microperthite), quartz, plagioclase
(An 5-13), hornblende and biotite. Opaques, fluorite,
zircon, apatite and sphene are accessories. Kaolinite,
chlorite, epidote and muscovite mainly represent the
secondary minerals. The perthite sub-leucogranites
show a variation in eU and eTh contents from 4-12
ppm with an average of 7 ppm and from 11-18 ppm
with an average of 15 ppm respectively (Table 3).
Muscovite sub-leucogranites are medium- to coarse-
grained, whitish to reddish pink in colour, covering
about 13.3 km2, representing 4.6 % of the total
basement rocks. They crop out in the eastern bank of
G. Um Bakra and intruded in perthite sub-
leucogranites, as well as, carried them as roof
pendant. In the northeastern part of the study area,
they intruded the older granitoids and are extruded
by trachyte and quartz boss of Marwit El Siwiqat.
They are also present either as a minor intrusion at
the footwall of G. Atwani or elongated sheet-like
masses trending NW to WNW accompanied with the
regional structures. Silicification, hematitization,
kaolinitization and spotty or dendrite manganese
oxides along the fracture planes mainly represent the
post-magmatic hydrothermal alteration features.
They are crosscut by strike slip fault (N20oW-
S20oE) filled by jasperoid veins, along shear zone
(6m thick.) characterized by highly silicification,
kaolinitization and higher intensity of radioactivity.
Muscovite sub-leucogranites are composed of potash
feldspars (microcline, orthoclase microperthite and
microcline microperthite), quartz, plagioclase (An 6-
18), muscovite and subordinate biotite. Opaques,
fluorite, garnet, zircon, monazite and apatite are
mainly accessories. They show a wide variation in
eU and eTh contents from 5-16 ppm with an average
of 9 ppm and from 13-25 ppm with an average of 17
ppm respectively (Table 3). Along the shear zone the
eU-content ranges from 268-304 ppm with an
average of 288 ppm and the eTh-content ranges from
24-33 ppm with an average of 28 ppm. The eU/eTh
ratio ranges from 8.9 to 12.6 with an average of 10.3
(Table 4).
The occurrence of secondary uranium
mineralizations zippeite [K4 (UO2)6 (SO4)3
(OH)10.4H2O] and beta-uranophane [Ca (UO2)2
(SiO3)2 (OH).5H2O] confirmed by the present
authors (Table 5) indicate that these minerals
occurred as a result of leaching of pre-existing
uranium minerals in peraluminous muscovite sub-
leucogranites by circulating water.
4. GEOCHEMISTRY

282
4.1. Classification The granitoid rocks under consideration can be
classified by applying the relation between Q= 1/3
Si- (K+Na+2/3 Ca) and P= K-(Na+Ca) after Debon
and LeFort (1983). The diagram given in (Fig. 3)
shows that, the data points of the older granitoids
fall within granodiorite, monzonite-quartz diorite,
quartz diorite and tonalite fields. The data plots of
the younger granites show that the biotite granites
and perthite sub-leucogranites fall within adamellite
field, while the muscovite sub-leucogranites fall at
the boundary between granite and adamellite fields.
Genetically, the I-type granites have been generated
from igneous source materials and the S-type
granites from sedimentary materials and both types
originated in the continental crust (White and
Chappell, 1977). The subgroups of the I-type
granites include those derived from recycled or
dehydrated continental crust (A-type) and those
derived directly from melting of subducted oceanic
crust or mantle (M-type). The K2O-Na2O diagram
(Fig. 4) after White and Chappell (1983) and Liew et
al., (1989) is used to distinguish between I-type, S-
type and T-type (transition) granites. The transition
(T-type) field represents a primitive magma
signature produced by more or less deep crustal
magmas mixing and assimilation. The plot (Fig. 4)
shows that, most of granitoid samples are plotted in
I-type field, except muscovite sub-leucogranites
which are falling in the transition (T-type) field.
4.2. Magma type and tectonic setting All the older granitoid samples have normative
(Di+Hy), indicating silica saturation and
metaluminous nature. The younger granitoid
samples (Table 3) divided between those with
normative Cor (all muscovite sub-leucogranite
samples and two from perthite sub-leucogranites),
indicating peraluminous nature and those without
normative Cor but have normative Di+Hy (all biotite
granites and remainder perthite sub-leucogranites),
indicating silica saturation and metaluminous nature
On the A–B binary diagram (Fig. 5), where A= Al-
(K+Na+2Ca) and B= (Fe+Mg+Ti) of Debon and
LeFort, (1983), the older granitoid and biotite
granitoid samples are calc-alkaline and
metaluminous in characters. The muscovite sub-
leucogranite samples (granite to rarely adamellite in
composition) lie in peraluminous domain. The
perthitic leucogranite samples lie between
metaluminous and peraluminous domains. In the A-
B diagram, the degree of differentiation is indicated
by the decrease in the B-parameter which mainly
represents the amount of biotite + magnetite in the
rock. Generally, the previous diagram indicates calc-
alkaline magma origin, not originated from
peralkaline magma type. However, instead the
majority of the analyzed samples indicate
metaluminous to peraluminous magma regime.
Rittmann (1973) used Log σ = Log
(Na2O+K2O)2/(SiO2-43) versus Log µ=Log (Al2O3-
Na2O)/(P2O5+TiO2) diagram (Fig. 6), to discriminate
magmatic igneous rocks in the orogenic belts and
mature island arcs environment from the non-
orogenic ones. All the plots of older and younger
granites lie within the field of magmatic rocks
situated in orogenic belt and island arcs.
Batchelor and Bowden (1985) used R1 - R2
multications relation of De La Roche et al., (1980) to
discriminate between the different tectonic setting of
the granitoid rocks (Fig. 7). The plot shows that the
older granitoids are emplaced during the pre-plate
collision to post-collision uplift stage. The younger
granites (biotite granites and perthite sub-
leucogranites) are intruded at late orogenic stage,
whereas the muscovite sub-leucogranites are
intruded during syn-collision stage.
4.3. Temperatures and pressures estimation
Plotting normative Ab-Q-Or values on the ternary
diagram (Figs. 8&9) where the first figure shows the
water-vapour pressures up to 3 K- bar after Tuttle
and Bowen (1958) and 5 to 10 K-bars after Luth et
al., (1964). The second diagram shows the
temperature isotherms for crystallization of the
rocks. The older granitoids fall in a high water-
vapour pressure, varying between 5-10 K-bar and
high temperature ranging about (800-840 oC),
indicating that, they were possibly formed at
relatively deep levels in the crust. The younger
granites fall in a region of low to moderate water-
vapour pressure ranging from 2 to 5 K-bars and
temperature about (760-800 oC), suggesting that,
they were possibly formed at moderate levels in the
crust.
4.4. Petrogenesis The origin of the study granitic rocks can be
deduced through a group of relationships. Generally,
the older and younger granites of the studied area are
impoverished in Rb, Ba and Sr except the average
Ba value of the older granitoids (534 ppm) which is
higher than corresponding value of high-Ca-granites
(420 ppm) when compared with the average world
values of Turekian and Wedepohl, (1961) (Table 6).
The K-Rb diagram (Fig. 10) shows that the
magmatic trend (1000-200 MT) is given by Shaw,
(1968), while the average crustal K/Rb ratio is 250
(Taylor, 1965) or 217 ± 69 (Harris et al., 1983). The
older granitoid samples plot around the mantle line

283
(K/Rb= 1000), while the younger granites scatter
within a large field extending from below the mantle
line to below the crustal line (K/Rb ~175). This
indicates that the studied older granitoid rocks were
generated from source regions depleted in Rb or
generated by partial melting of the lower or upper
mantle, (Gast, 1965 & Hart and Aldrich, 1969). The
lower K/Rb ratios in the younger granites indicate
more differentiated and more evolved granitic
liquids.
Mason (1966) used K-Ba variation diagram in which
the crustal average ratio (K/Ba= 65). Applying this
diagram as shown in figure (11) it can be seen that
the older granitoid samples plot below the average
crustal ratio of Mason, exhibiting lower K2O
contents and hence they have K/Ba ratios (<65). The
younger granites plot above the average crustal ratio
with K/Ba ratio (>65), showing Ba depletion with
K2O enrichment which indicates the involvement of
a second process acting with the crystal fractionation
and leading to depletion of Ba with differentiation.
The Ba-Rb diagram shows that Ba is depleted
relative to Rb (Fig. 12). The older granitoid samples
plot above average crustal (Ba/Rb= 4.4) of Mason,
whereas the younger granitic samples plot around
the average crustal values and range between (4.4
and 4.4 × 10⁻¹). This is also consistent with the high
degree of evolution of the younger granitic magmas
and confirms the previous statement of the
involvement of an additional process during the
differentiation of these younger granitic rocks.
The Rb/Sr ratio is used as a measure of magmatic
differentiation increasing with higher degree of
differentiation. The older granitoids and biotite
younger granite samples show Rb/Sr= 0.1 (Fig. 13),
while the perthitic and muscovite leucogranite
samples that show the Rb/Sr ratios (1-10), are more
fractionated during the crystallization of these rocks.
Depletion of Sr with differentiation from the older
granitoids towards the younger granite samples is
shown on the Sr-CaO diagram (Fig. 14). The K/Rb
ratio against Rb is useful parameters for comparing
of different sources (Fig. 15). As this plot shows the
same trend for all members of petrogenitic
sequences of granitoid rocks, a single process could
produce them. The curved relationships on the Ba-
Rb, Rb-Sr, Sr-CaO and K/Rb-Rb diagrams could
suggest that crystal fractionation was the dominating
process during magmatic differentiation.
4.5. Interelement Relationship The eU-content increases with eTh (Fig. 16) and
decreases with eTh/eU ratios (Fig. 17) from older
granitoids to younger granites. This type of behavior
indicates that U in the peraluminous muscovite sub-
leucogranites is mostly located in Th-rich accessory
minerals such as monazite. Such a trend results in
the preferential leaching of the U fraction located in
uraninite-easily leachable in oxidizing supergene
conditions whereas the U fraction located in
monazite remains essentially undisturbed (Cuney
and Friedrrich, 1987).
It is well know that Rb, Y, U, Th and Nb have a
large radii or higher electric charges. These ions are
less extensive to substituting for major ions in
common silicate minerals (Krauskopf, 1979), so
they segregated and concentrated at late stage in
granitic melt. If magmatic processes controlled U-
and Th- contents, these elements would be expected
to increase. The relation between Rb-eU (Fig. 18),
Y-eU (Fig. 19) and Zr-eU (Fig. 20) shows that, the
eU-contents increase with the increase of Rb, Y and
Zr contents, a fact which is related to magmatic
processes. The positive correlation between eU and
Y as well as eTh and Nb (Fig. 21) indicates that, the
magma from which the two granitic mass had been
developed was emplaced at shallow depths (Briqueu
et al., 1984).
4.6. Origin of Uranium Mineralizations In general, the uranium and thorium increase from
basaltic rocks to low Ca-granite during magmatic
differentiation. From the distribution of eU- and
eTh-contents in the different rock types of Um Safi
area, it is clear that, the average eU- and eTh-
contents increase gradually from older granitoids (3
ppm eU & 7 ppm eTh) through biotite granites (6
ppm eU & 13 ppm eTh) to perthite sub-
leucogranites (7 ppm eU & 15 ppm eTh) and
muscovite sub-leucogranites (9 ppm eU & 17 ppm
eTh). This can be attributed to the tendency of the
radioactive elements to concentrate in the residual
magma indicating that, the enrichment is due to
magmatic processes. These coincide with the
presence of zircon, sphene, rutile, monazite and
epidote as accessory minerals associated with violet
fluorite, pyrite and goethite.
The source of uranium especially in the shear zone
may come from leaching of the mobile element from
the surrounding rocks especially muscovite sub-
leucogranites and later accumulated in open shear
zone.
Thus the shear zone can be considered as a good trap
for uranium mineralizations for the following
factors; a) the high U-contents of muscovite sub-
leucogranites could represent a good source, b) a
barrier of silica or jaspar veins (5 - 50 cm) along the
shear zone and c) tectonically, the N-S and NNW-

284
SSE fault trends played at least a role in the
remobilization of uranium along the shear zone.
5. DISCUSSION AND CONCLUSION
Um Safi granitoids are composed of a succession of
metaluminous calc-alkaline and metaluminous to
peraluminous sub-alkaline sub-leucogranites
emplaced during successive tectonic events. The
first tectonic is represented by older granitoids
characterized by calc- alkaline, metaluminous and
were emplaced under a high water- vapour pressure
(5-10 k-bar) and compressional stresses. They were
emplaced during island arc regimes and formed by
fractional crystallization with crustal contamination.
After a period of time, where thickened crust is
affected by shearing and thrust the second tectonic
event occurs, characterized by biotite granites and
perthite sub-leucogranites, which have calc-alkaline
affinity and metaluminous in nature. Granites of the
third tectonic event are represented by peraluminous
muscovite sub-leucogranites and were emplaced
during syn-collision regime. The granites of the
second and third tectonic events are produced
through closed-system of fractional crystallization of
metaluminous magmas at shallow to moderate levels
in the crust under low to moderate water-vapour
pressures (2-5 k-bar) and converted finally to
peraluminous magma.
Uranium distribution actually observed in
peraluminous granitoids results from five
main phenomena: partial melting, magmatic
differentiation, late-magmatic processes,
hydrothermal and meteoric alterations (Friedrich et
al., 1987).
The present studies provide an evidence of a strong
increase in eU-content in the shear zone. Such an
increase in the uranium quantity available for
subsolidus reworkings obviously favours the
mineralizing efficiency of the hydrothermal
circulations.
Mineral fractionations, defined by chemical-
mineralogical diagrams indicate the simultaneous
fractionation of Fe-Mg minerals and monazite. This
type of relation, together with the low solubility of
monazite in peraluminous melt and the absence of
cordierite and / or garnet, suggests that muscovite
and monazite were essentially resistitic minerals,
scavenged by the magmas from the anatectic zone
(White and Chappell, 1977). However, this type of
fractionation is very different from S-type granites
of Australia (White and Chappell, op. cit), which
show a much higher content of mafic minerals (B
parameter) and a simultaneous decrease of the
peraluminous character (A parameter) and the mafic
mineral content.
Um Safi sub-leucogranites might have undergone
subsolidus alteration (either hydrothermal or
meteoric), which may strongly disturb the primary U
content especially in supergene conditions. It is
noticeable that the U content increases (268-304
ppm) during late magmatic stage (shear zones) and
associated with pyrite, fluorite, goethite, muscovite,
monazite, zircon, rutile, zippeite and beta-
uranophane. Also muscovite occurs in three forms;
euhedral early magmatic crystals, or as interstitial
late magmatic filling between the essential minerals
or as fine inclusion in quartz and feldspar crystals.
Finally, Um Safi peraluminous muscovite sub-
leucogranites could represent a favorable source for
U-deposits, but total uranium content does not
automatically give a measure of fertility. An
accurate specification of the percentage of U host
minerals is required in the different stages of magma
evolution as well as a drilling program can be
proposed.
REFERENCES
Batchelor, R. A. and Bowden, P. (1985): Petrogenetic interpretation of granitoid rock
series using multicationic parameters. Chem.
Geol., 48, 43-55.
Briqueu, L., Bougault, H. and Joron, J. L. (1984): Quantification of Nb, Ta, Ti and V anomalies in
magmas associated with subduction zones;
Petrogenetic implications. Earth Planet. Sci.
Lett., 68, 297-308.
Cathelineau, M., (1987): U-Th-REE mobility
during albitization and quartz dissolution in
granitoids: evidence from southeast French
Massif Central .Bull. Mineral.,110 ,249-259.
Cuney, M. (1998): Metallogenic studies and
uranium exploration in Eastern Desert granites,
Egypt. Unpublished internal report.
Cuney, M. and Friedrrich, M. (1987): Physicochemical and crystal chemical controls
on accessory mineral paragenesis in granitiods.
Implications on uranium metallogensis. Bull.
Mineral., 110, 235-247.
Debon, F. and Le Fort, P. (1983): A chemical-
mineralogical classification of common plutonic
rocks and association. Trans. R. Soc: Edinburgh:
Earth Science., 73,135-149.
De la Roche, H., Leterrier, J., Grandclaude, P. and Marchal, M. (1980): A classification of
volcanic and plutonic rocks using R1-R2 diagram
and major element analyses; Its relationships

285
with current nomenclature. Chem. Geol., 29,
183-210.
Dixon, T. H. (1979): The evolution of continental
crust in the late Precambrian Egyptian Shield.
Ph.D. Thesis, Univ. Calif. San Diego.
El Gaby, S. (1975): Petrochemistry and
geochemistry of some granites from Egypt. Neu.
Jb. Miner. Abh., 124, 147-189.
El Gaby, S. and Habib, M. S. (1982): Geology of
the area SW of Port Safaga, with especial
emphasis on the granitic rocks, Eastern Desert,
Egypt. Ann. Geol. Surv. Egypt, 12, 47-71.
El Manharawy, M. S. (1977): Geochronological
investigation of some basement rocks in central
Eastern Desert, Egypt between lat. 25o and 26
o
N. Ph.D Thesis, Cairo Unv., Egypt. 216 p.
El Ramly, M. F. and Akaad, M. K. (1960): The
basement complex in the Central Eastern Desert
of Egypt between lat. 24o 30` and 25o 40` N.
Geol. Surv. Egypt, Paper no. 8, 35 p.
El Shazly, E. M. (1964): On the classification of the
Precambrian and other rocks of magmatic
affiliation in Egypt. XXII Inter. Geol. Congr.
Proc. Sect. 10, India, 88-101.
Friedrich, M., Cuney, M. and Poty, B., (1987): Uranium geochemistry in peraluminous
leucogranites. Uranium, 3,353-385.
Gast, P. W. (1965): Terestrial ratio of potassium to
rubidium and the composition of the Earth’s
mantle. Science, 147, 858-860.
Harris, N. B. W., Hawkesworth, C. J. and Ries, A.
C. (1983): The trace elements and isotope
geochemistry of the Sabaloka igneous complex,
Sudan, J. Geol. Soc. London, 140, 245-256.
Hart, S. R. and Aldrich, L. T. (1969):
Franctionation of potassium/rubidium by
amphiboles: Implications regarding mantle
composition. Science, 155, 325-327.
Hashad, A. H. (1980): Present status of
geochronological data on the Egyptian basement
complex. Inst. App. Geol. Bull., Jeddah, 4, 31-
46.
Hume, W. F. (1935): Geology of Egypt. Vol. II,
Part II. The later plutonic and intrusive rocks.
Geol. Surv. Egypt. Government press, Cairo,
301-688.
Hussein, A. A., Ali, M. M. and El Ramly, M. F.
(1982): A proposed new classification of the
granites of Egypt. J. Volc. Geoth. Res., 14, 187-
198.
Krauskopf, K. B. (1979): Introduction to
geochemistry. 2nd Ed. McGraw- Hill Book Co.,
London, 617 p.
Luth, W. C., Jams, R. H. and Tuttle, O. F. (1964): The granite system at pressure of 4 to 10
kilobars. J. Geophys. Res., 69, 759 -773.
Mason, B. (1966): Principles of geochemistry.
3rd
Ed., John-Wiley & Sons, New York, 239
p.
Pagel, M. (1982): The mineralogy and geochemistry
of uranium, thorium and rare elements in two
radioactive granites of Vosges France. Min.
Mag., 46 (339), 149-161.
Rittmann, A. (1973): Stable minerals assemblages
of igneous rocks. A method of calculation.
Springer-Verlag, Berlin, 262 p.
Rogers, J. J. W. and Greenberg, J. K. (1981): Alkali granites and their relationship to
cratonization. Geol. Soc. Am. Bull., Part II, 92,
57 - 93.
Shapiro, L. and Brannock, W. W. (1962): Rapid
analysis of silicate, carbonate and phosphate
rocks, U. S. Geol. Surv. Bull. 114A, 56 p.
Shaw, D. M. (1968): A review of K/Rb
fractionation trends by covariance
analysis. Geochim. Cosmo-chim.,
Acta, 32, 573-601. Streckeisen, A. (1976): To each plutonic rocks
its proper name. Earth Sci. Rev., 12, 1-33.
Taylor, S. R. (1965): The application of trace
element data problems in petrology. In:
Ahrens, L.H., Press, F., Runcor, S.R. and
Urey, H. C. (eds); Physical and chemical
of the earth. 133-213. Turkian, K. K., and Wedepohl, K. H. (1961):
Distribution of the elements in some major
units of the earth’s crust. Geol. Soc. Am.
Bull., 72, 175-192.
Tuttle, O. F. and Bowen, N. L. (1958): Origin of
granite in the light of experimental studies in the
system Na Al Si3O8 - K Al Si3O8 - SiO2-H2O.
Geol. Soc. Am. Mem., 74, 153 p.
White, A. J. R. and Chappell, B. W. (1977): Ultrametamorphism and granitoid genesis.
Tectonophysics, 43, 7-22.
White, A. J. R. and Chappell, B. W. (1983):
Granitoid types and their distribution in the
Lachalan fold belt, Southeastern Australia. Geol.
Soc. Am. Mem., 159, 21-34.

286
Table (1): Modal composition of granitoid rocks, Um Safi area.
Sr.
No.
Sm.
No.
Qz K-
Feld.
Plag. Bio. Hb. Ms. Op. Acc. Q A P
1 39 32.9 9.4 45.8 - 10.0 - 0.3 1.5 37.3 10.7 52.0
2 40 30.6 10.5 47.8 - 9.8 - 0.4 0.9 34.4 11.8 53.8
Average 31.7 10.0 46.8 - 9.9 - 0.3 1.2 35.9 11.2 52.9
3 74 26.3 11.2 51.4 10.6 - - 0.1 0.4 29.6 12.6 57.8
4 75 25.5 12.4 50.0 11.3 - - 0.2 0.6 29.0 14.1 56.9
Average 25.9 11.8 50.7 11.0 - - 0.1 0.5 29.3 13.4 57.3
5 43 32.1 4.2 47.7 11.0 1.2 - 0.4 0.7 38.2 5.0 56.8
6 59 23.2 5.6 64.2 5.3 0.2 - 0.7 0.5 24.9 6.2 68.9
7 105 18.3 2.5 62.2 5.2 10.9 - 0.6 0.3 22.1 3.0 74.9
8 107 20.2 2.8 62.6 6.0 7.5 - 0.5 0.4 23.6 3.3 73.1
9 155 20.4 1.9 54.8 1.7 19.9 - 0.9 0.4 26.4 2.5 71.1
Average 22.8 3.4 58.3 5.9 8.0 - 0.6 0.5 27.1 4.0 68.9
10 104 12.0 1.4 61.7 5.2 19.0 - 0.4 0.3 16.0 1.9 82.1
11 147 7.8 3.2 61.9 4.8 20.6 - 1.2 0.5 10.7 4.4 84.9
12 154 10.9 1.6 57.1 11.8 17.9 - 0.4 0.3 15.7 2.3 82.0
Average 10.2 2.1 60.2 7.3 19.2 - 0.6 0.4 14.1 2.9 83.0
13 171 2.9 3.5 60.4 6.5 25.9 - 0.5 0.3 4.3 5.3 90.4
14 117 2.1 2.6 56.3 12.1 26.2 - 0.4 0.3 3.5 4.3 92.2
Average 2.5 3.1 58.3 9.3 26.1 - 0.4 0.3 3.9 4.8 91.3
15 5 23.7 29.9 39.3 4.9 - - 1.4 0.8 25.5 32.2 42.3
16 122 22.7 28.7 39.2 5.1 - - 1.7 2.6 25.1 31.7 43.2
17 169 22.8 31.9 35.3 7.3 - - 1.4 1.3 25.3 35.4 39.2
18 170 23.6 32.2 35.2 6.2 - - 1.6 1.2 25.9 35.4 38.7
Average 23.2 30.7 37.2 5.9 - - 1.5 1.5 25.4 33.7 40.9
19 26 34.2 56.6 5.5 0.3 1.8 - 0.7 0.9 35.5 58.8 5.7
20 113 28.9 60.5 0.8 2.7 3.5 - 1.0 2.6 32.0 67.1 0.9
21 131 31.5 58.2 2.6 1.6 - 0.3 2.3 3.5 34.1 63.1 2.8
22 133 34.8 50.2 9.5 1.8 1.7 - 0.4 1.6 36.8 53.1 10.1
23 134 22.5 68.1 5.4 0.5 - 0.2 1.7 1.6 23.4 70.9 5.6
24 143 23.6 66.0 4.8 1.1 1.6 - 1.1 1.8 25.0 69.9 5.1
25 160 28.2 68.2 0.5 0.3 1.5 - 0.5 0.8 29.1 70.4 0.5
26 161 31.6 63.7 0.8 0.1 2.1 - 0.6 1.1 32.9 66.3 0.8
27 164 24.8 72.2 0.7 0.2 0.9 - 0.7 0.5 25.4 73.9 0.7
Average 28.9 62.6 3.4 0.9 1.5 0.1 1.0 1.6 30.4 66.0 4.6
28 1 33.2 39.5 20.9 0.2 - 5.8 0.1 0.3 35.5 42.2 22.3
29 2 32.8 41.0 21.2 0.3 - 4.1 0.1 0.5 34.5 43.2 22.3
30 3 32.6 40.2 21.4 0.2 - 5.1 0.1 0.4 34.6 42.7 22.7
31 9 29.1 37.4 28.9 0.1 - 3.7 0.4 0.4 30.5 39.2 30.3
32 41 31.5 32.1 26.8 0.2 - 6.9 0.1 2.4 33.3 36.8 29.9
33 42 32.0 34.3 26.9 0.3 - 4.4 0.5 1.6 34.3 36.8 28.9
34 44 31.9 36.3 25.7 0.2 - 4.9 0.3 0.7 34.0 38.7 27.3
Average 31.9 37.3 24.5 0.2 - 5.0 0.2 0.9 34.0 39.8 26.2
Sr. No.= serial number, Sm. No.= sample number, Qz= quartz, K-feld.= potash feldspar
including perthite, Plag.= plagioclase, Bio.= biotite, Hb.= hornblende, Ms.= muscovite,
Acc. = accessory, Op= opaques, Q= quartz content, A= potash feldspar content and P=
plagioclase content.
1-2= hornblende granodiorites, 3-4= biotite granodiorites, 5-9= tonalites, 10-12 = quartz
diorites, 13-14= diorites, 15-18= biotite granites, 19-27= perthite sub-leucogranites and 28-
34 = muscovite sub-leucogranites.
Note: All values are in volume percent.

287
Table ( 2 ): Chemical analyses and CIPW normative minerals for granitoid rocks,
Um Safi area.
Younger granites Older granitoids
(n=13)
Biotite granites
(n=4)
Perthite sub-
leucogranites (n=9)
Muscovite sub-
leucogranites (n=7) Major
Oxides Range Average Range Average Range Average Range Average
SiO2 60.40-65.40 63.19 67.57-69.5 68.39 70.9-74.18 72.79 72.96-75.1 73.19
TiO2 0.30-0.62 0.49 0.39-0.53 0.46 0.12-0.28 0.2 0.11-0.15 0.12
Al3O3 13.70-17.40 15.73 12.59-14.13 13.52 11.44-13.72 12.42 13.01-14.54 13.46
Fe2O3 2.20-5.20 3.6 3.10-3.40 3.27 1.92-3.79 2.56 1.18-1.56 1.48
FeO 0.20-2.0 1.31 0.7-1.34 1.14 0.8-1.32 1.12 0.2-0.84 0.49
MnO 0.08-0.17 0.1 0.05-0.08 0.06 0.03-0.07 0.06 0.02-0.07 0.04
MgO 1.61-2.80 2.21 1.10-1.80 1.53 0.4-1.2 0.7 0.4-0.8 0.6
CaO 4.00-5.40 4.65 1.85-2.36 2.10 0.84-1.12 0.99 0.56-1.14 0.79
Na2O 3.47-4.73 4.2 3.89-4.19 4.09 3.85-4.05 3.95 3.47-3.69 3.58
K2O 2.12-3.24 2.76 4.22-4.46 4.34 3.99-4.69 4.35 4.62-4.9 4.7
P2O5 0.01-0.24 0.12 0.07-0.24 0.17 0.11-0.13 0.12 0.11-0.12 0.11
L.O.I 0.64-1.91 1.37 0.63-0.91 0.78 0.31-0.95 0.64 0.19-0.81 0.46
Trace elements (in ppm)
Rb 6.-33 19.1 58-67 62.3 59-169 98 58-210 116.7
Sr 204-689 418.5 336-374 352 12-14 13 20-37 25.9
Ba 464-612 534.6 26-29 27.3 253-475 332.7 170-453 300.3
Zr 37-169 102.9 187-218 197 214-423 285.9 125-170 144.9
Y 11-30 23.6 61-72 64.5 52-138 90.4 32-49 38
Nb 14-18 15.9 28-31 29.8 28-33 30.8 27-34 31.1
Zn 17-35 28.5 49-53 51 56-88 74 34-51 46.4
Pb 32-40 35 25-28 26.8 24-29 26.9 23-29 25.9
V 20-105 48.4 26-28 27 5-10 8.8 2-5 3
Cr 48-83 64 74-89 83 72-111 91.2 71-104 90.9
Ni 0-5 2.2 2-3 2.8 2-3 2.6 2-3 2.7
Co 5-9 6.8 3-4 3.8 3-4 3.2 2-3 2.7
Ga 12-21 17.7 21-24 22.5 23-32 26.7 16-42 29.4
U* 2-4 2.9 4-8 5.3 4-12 7.2 6-16 8.9
Th* 5-11 6.8 10-19 13 12-17 15 13-20 16
CIPW normative values
Q 12.14-21.28 16.87 21.03-23.46 22.45 26.17-33.69 30.63 31.29-34.56 32.8
Or 12.73-19.39 16.6 24.94-26.36 25.65 23.58-28.31 25.75 27.42-28.96 27.78
Ab 29.56-40.45 36.07 32.91-35.45 34.65 32.57-34.27 33.42 29.36-39.36 31.74
An 8.36-21.83 16.11 2.69-7.59 5.71 1.13-3.68 2.79 1.93-4.94 3.14
Di 1.22-10.99 5.05 1.05-6.66 2.80 0.0-2.84 1.05 0.0 0.0
Hy 0.0-5.64 3.34 0.9-3.72 2.51 0.41-2.57 1.26 1.0-2.14 1.55
C 0.0 0.0 0.0 0.0 0.0-1.09 0.19 0.61-2.17 1.33
Mt 0.0-4.09 1.61 1.32-3.71 2.65 2.34-3.7 3.15 0.46-1.71 1.25
Hm 0.35-2.28 0.98 0.91-2.29 1.54 0.0-1.37 0.38 0.0-1.06 0.62
Il 0.0-0.6 0.06 0.74-1.01 0.89 0.21-0.65 0.39 0.21-0.28 0.23
Ap 0.02-0.53 0.27 0.17-0.57 0.41 0.26-0.31 0.28 0.26-0.31 0.27
*= radiometric analyses
n= number of measured samples.
288
A p
Q
1 2a 2b 3 4
5
6
Older granitoids
Perthite sub-leucogranites
Muscovite sub-leucogranites
Biotite granites
): Modal analyses of granitoid rocks, Um Safi area, after Streckeisen (1976). 1= alkali
feldspar granites, 2a= syenogranites, 2b= monzogranites, 3= granodiorites, 4=
tonalites, 5= quartz diorites and 6= diortites
Table (3): eU, eTh, and Ra contents in ppm and K content in % in the granitoid rock
types, Um Safi area.
Radiometric measurements Rock types
eU (ppm) eTh (pmm) Ra (ppm) K %
Max. 5 11 4 2.16
Min. 2 5 2 0.36
Older granitoids
(n=13) Average 3 7 3 1.1
Max. 10 14 5 2.6
Min. 4 10 4 1.9
Biotite granites
(n=8) Average 6 13 4 2.4
Max. 12 18 10 3.91
Min. 4 11 3 2.81
Perthite sub-
leucogranites
(n=9) Average 7 15 15 3.53
Max. 16 25 15 3.23
Min. 5 13 3 2.41 Yo
un
ger
gra
nit
es
Muscovite sub-
leucogranites
(n=10) Average 9 17 8 2.84
n= number of measured samples
Table (4): eU, eTh and Ra contents in ppm and K (%) along shear zone, Um Safi area.
Ser. No. Sam. No. eU(ppm) eTh(ppm) Ra(ppm) K(%) eU/Ra eU/eTh eTh/eU
1 A1 302 24 159 1.63 1.89 12.6 0.08
2 A2 304 32 162 1.14 1.87 9.5 0.11
3 A3 273 24 150 1.15 1.82 11.4 0.08
4 A4 268 29 156 1.53 1.72 9.3 0.11
5 A5 294 33 160 1.34 1.84 8.9 0.11
Average 288 28 157 1.36 1.83 10.3 0.09
Minimum 268 24 150 1.14 1.72 8.9 0.08
Maximum 304 33 162 1.63 1.89 12.6 0.11
Median 294 29 159 1.34 1.84 9.5 0.11
St. Dev. 16.7 4.27 4.67 0.22 0.07 1.59 0.01

289
Table (5): XRD pattern of zippeite and beta-uranophane in shear zone of muscovite
sub-leucogranites.
Sample 1 Sample 2 Zippeite
(8-402)
Zippeite
(8-401)
Beta-uranophane
(8-301)
d/Ao I/IO d/Ao I/IO d/Ao I/IO d/Ao I/IO d/Ao I/IO
8.61 8 8.61 6 8.65 40
7.73 100 7.72 81 7.31 100 7.06 100 7.83 100
6.38 2 6.45 20 6.66 40
5.76 17 5.76 11 5.57 10 5.44 40
4.78 5 4.79 4 4.77 10 4.85 40
4.43 7 4.47 7 4.55 40
4.26 7 4.25 22 4.27 10 4.27 50
4.17 9 4.10 40
3.87 54 3.87 38 3.86 40 3.9 90
3.77 9 3.75 10
3.53 7 3.53 8 3.51 50 3.51 80 3.51 60
3.42 16 3.42 12 3.41 10
3.31 9 3.34 100 3.35 20
3.13 26 3.13 18 3.15 80 3.12 90 3.12 90
3.01 9 3.01 7 3.04 40
2.88 19 2.86 12 2.86 40 2.86 60 2.91 20
284 11 2.83 40
2.7 3 2.69 5 2.66 30 2.72 30
2.58 8 2.53 3 2.53 40 2.59 50
2.46 3 2.46 10 2.45 10
2.39 4 2.39 3 2.41 40
2.22 4 2.28 6 2.25 20 2.21 40 2.21 20
2.18 3 2.18 3 2.14 30
2.16 8 2.16 5 2.17 10
2.08 9 2.08 5 2.08 20 2.09 20
2.06 6 2.06 4 2.002 40 2.05 50 2.04 10
1.98 5 1.99 7 1.96 20 2.01 10
1.88 5 1.88 3 1.88 20 1.877 30
1.82 2 1.82 9 1.821 20 1.841 30
1.77 3 1.77 2 1.749 40 1.74.5 60 1.778 20
1.69 4 1.701 40 1.701 20
1.67 4 1.67 7 1.621 20 1.658 10
1.58 2 1.56 3 1.583 30 1.598 50 1.541 15
1.5 4 1.494 10
-250 -200 -150 -100 -50 0 50
50
100
150
200
250
P= K-(Na+Ca)
Q =
Si/3
-(K+
Na
+2/3
Ca)
TH
OL
ALKO
S
CALK
ALKSSALKD
SA
LK
LP
ota
ssic
Q~20%
Q~5%
Q~45%
K-feldsparPlagioclase
granodio
rite
adamel
lite
gran
ite
tonalit
e
quartz syenite
quartz
monzo
nitemonzonite
quartz diorite
quartzdiorite
Fig. (3): Q versus P diagram for granitoid rocks, Um Safi area, after Debon and
LeFort, (1983). (Symbols as in Fig. 2)

290
0 1 2 3 4 5 62
3
4
5
6
I-type T-type
S-type
Na 2
O (
%)
K2O (%)
40 80 120
-100
-50
0
50
100
B= Fe+Mg+Ti
A=
Al-
(K+
Na
+2
Ca
)
Pera
lum
inou
s Dom
ain
Meta
lum
ino
us D
om
ain
*gd
*to
*mzq
*gr
*S
VVI
I II
III
IV
Bi >Ms
Bi < Ms
Bi = Ms
Leu
cogra
nit
es
CALK
*ad
Fig. (4): Na2O versusK2O diagram for granitoid rocks, Um Safi
area, after White and Chappell, (1983) and Liew et al.,
(1989). (Symbols as in Fig. 2)
Fig. (5): Characterisitic mineral diagram for granitoid rocks of
Um Safi area, after Debon and LeFort, 1983). (Symbols as
in Fig. 2)
-0.5 0.0 0.5 1.0 1.50.0
0.4
0.8
1.2
1.6
2.0
Log o
Lo
g u
B
C
A
0 500 1000 1500 2000 2500 30000
500
1000
1500
2000
2500
5
4
3
2
1
6
7
1 - Mantle Fractionates2 - Pre-Plate Collision
3 - Post-Collision Uplift
4 - Late-Orogenic5 - Anorogenic
6 - Syn-Collision
7 - Post-Orogenic
R1= 4Si-11(Na+K)-2(Fe+Ti)
R2=
6C
a+
2M
g+
Al
Fig. (6): Log u-Logo diagram for granitoid rocks, Um Safi
area, after Rittmann, (1973). A= Magmatic rocks
situated in non-orogenic regions, B= magmatic
rocks situated in orogenic belts and island arcs and
C= alkali derivatives of magmatic rocks linked to
either A or B. (Symbols as in Fig. 2)
Fig. (7): R1-R1 binary diagram for granitoid rocks, Um Safi
area, after Batchelor and Bowden, (1985). (Symbols as in
Fig. 2)
Ab Or
Q
1 kb2 kb
3 kb5 kb
10 kb
Ab Or
Q
840
760
800
800
840
Fig. (8): Ab-Q-Or ternary diagram for granitoid rocks, Um Safi
area. The dashed line represents the variation in position of
the minimum melting points in the granite system at
different water-vapour pressures. 1,2,3 k-bar after Tuttle
and Bowen, (1958). 5,10 k-bar after Luth et al., (1964).
(Symbols as in Fig. 2)
Fig. (9): Ab-Q-Or ternary diagram for granitoid rocks, Um Safi
area, after Tuttle and Bowen, (1958). (Symbols as in Fig. 2 )

2
Table (6): Average Rb, Ba and Sr of the studied granitoids in comparison with World values.
Um Safi Area Turekian and Wedepohl (1961)
Older granitoids Younger granites High Ca-granites Low Ca-granites
Rb 19 97 116 170
Ba 534 318 420 840
Sr 418 90 440 100
10 100 1000
1
10
Rb (ppm)
K (
%) K/R
b= 1
000
K/R
b= 2
50K
/Rb= 1
00
5 10 100 10001
10
Ba (ppm)K
(%
)
K/B
a= 6
5
Fig. (10): K-Rb variation diagram for granitoid rocks, Um Safi
area, after Shaw, (1968), crustal K/Rb ratio after Taylor,
(1965). (Symbols as in Fig. 2)
Fig. (11): K-Ba variation diagram for granitoid rocks, Um Safi
area, average crustal ratio after Mason, (1966). (Symbols as
in Fig. 2)
5 10 100 10005
10
100
1000
Rb (ppm)
Ba (
pp
m)
Ba/Rb= 4
.4
Ba/Rb= 4
.4x10 -1
Ba/Rb= 4.4x10 -2
10 100 10001
10
100
1000
Sr (ppm)
Rb
(p
pm
)
Rb/Sr= 10
Rb/Sr= 1
Rb/Sr= 0.1
Fig. (12): Ba-Rb diagram for granitoid rocks, Um Safi area,
after Mason, (1966). (Symbols as in Fig. 2)
Fig. (13): Rb-Sr diagram for granitoid rocks, Um Safi area.
(Symbols as In Fig. 2)
0 1 2 3 4 5 65
10
100
1000
CaO (%)
Sr
(pp
m)
- ve
0 100 2000
1000
2000
3000
Rb (ppm)
K/R
b
Excepected differentiation trend
Fig. (14): Sr-Ca variation diagram for granitoid rocks, Um Safi
area. (Symbols as in Fig. 2)
Fig. (15): K/Rb-Rb variation diagram for granitoid rocks, Um
Safi area. (Symbols as in Fig. 2)

3
4 10 302
10
30
eTh (ppm)
eU (
pp
m)
2 10 201
6
eU (ppm)
eTh
/eU
Fig. (16): eU-eTh variation diagram for granitoid rocks, Um
Safi area. (Symbols as in Fig. ).
Fig. (17): eU-Th/U relationship for granitoid rocks, Um Safi
area. (Symbols as in Fig. ).
2 10 205
10
100
400
eU (ppm)
Rb
(p
pm
)
1 10
10
100
Y (
pp
m)
eU (ppm)
200
20
Fig. (18): Rb-eU variation diagram for granitoid rocks,
Um Safi area. (Symbols as in Fig. )
Fig. (19): Y-eU variation diagram for granitoid rocks, Um
Safi area. (Symbols as in Fig. )
1 2030
100
700
Zr
(pp
m)
10
eU (ppm)
10 405
10
20
Nb (ppm)
eT
h (
pp
m)
Fig. (20): eU-Zr variation diagram for granitoid rocks,
Um Safi area. (Symbols as in Fig. )
Fig. (21): eTh-Nb variation diagram for granitoid rocks, Um
Safi area. (Symbols as in Fig. )

4
�������� ���� � � ������� ���� ����� ��� ��� �� ������ ��� ������� ��� ��� �!� � ���.
��#���$ %� &� � � *�(�)* � � ������ �* **�����* +!�� � � *-��#��$ (! ��#���$ *
* ������� ���� ����– � .
** ���������� ���– ������ ���� –�� ��� ���� .
����� ��� �!��� ��� ��� ���"! ��# �$�� ��� �$�%� �� !��� �$�� ��� �$��"&�� �$�'��� ('$� � )%�� �# �"
�*�!� ����!�! (&� ('� ����!! ��!�� � � �+'+ ,�- ������������ . ��$� ($�!� ,$��.� �$�!���� �$�& ��
) � ����0 � ��1! ����� 0 �����!�� – � ����� ��� ( 3 ����� 43� �# �� �� 5 ��$����.� �$ ���! 6�!& �
7���� � ��� ���!�� ��� (�� (����� ����� �� & ���!� ���! 5 ����� )��� t I-type �$ 81� �9��- ���!� ���!�
��: .� ; �"�� ��� � ����"�� �%�:<� =�� > ?����� . � ��� ��$� ($�!% �$���+�� ������� ��& �� �# $��
�$���!�!�� �$�& �� )% ���! 5 ����� )��� 5 ������.� � ���! 6�!& �3 ,�� @!�*�� ,!�+ ���� ��� ��� � ,!�!�����
; �A!�� . ��$����.� � ; %� �3 ,�� @!�*�� ,!�%����� ,!��� ��� ��� (�!% �+��+�� ��!���� ��& �� �# . �# $���
�� ����+�� ��!�& �� �%�:<� =�� > ,�*��� ��: .� ; �"�� ��� �9��- ���!� ,�B�:! ,��!�! �+A! &! �!���! �+��+�
���! ,�- (��� ,�� ��� �C: &!� ��: .� ; �"�� � =*�� 6�!� &! ?����� ��� � ����"�� .
�1� ��� �+��� ����� ���� 8,%�� 6�!& �# ������<� ��� �� 9D# ��"�� ��!��� ��� ����� � ���� ! )E
����� �� ������ )% 81�– F ��� �+ ������ )% 81� ( ,!�!����� ��� ��� ����)G ����� �� ������ )% 81� – HE 81$�
��� �+ ������ )% ( @!�*�� ,!�+ ���� ��� ��� ��� �#)F ����� �� ������ )% 81� HI �+ ��$���� )% 81� ��$� ( �$���
����� ��� ��� ��� @!�*�� ,!�% )J ����� �� ������ )% 81� – HF ��� �+ ������ )% 81� .( ���!�� ���!�� K��� �#
������ ��� ��� ��� ���! )���% @!�*�� ,!�%)LMM ����� �� ������ )% 81� – LM��� �+ ������ )% 81� .(
�� ���!���� ,�� ��� �$��������� �$��� ,$�- ���!� ���!�� K��� )% �����+ ����� �� ���� ����3�� � ��%�
�"&N . �$� ���&�� ��!��� ��� (!��� � ����� ���� =�� O &! �# ; �� P�& ,�- �- 81��� �39� ����� ���� ;��1 61���
K�"��� O�! ('� ; ��� ������ (���&�� K� � . � (� � ��$����.� �$ ; %����3 @!�*�� ,!�%����� ��� ��� ��� �- ,�
����� ���� ���!� � �!��.