Petrobras Business and Management Plan 2013-2017 Webcast - March 19th
53
2013 – 2017 Business and Management Plan
-
Upload
petrobras -
Category
Investor Relations
-
view
15.655 -
download
0
Transcript of Petrobras Business and Management Plan 2013-2017 Webcast - March 19th

2013 – 2017
Business and Management Plan

March, 19th 2013
2013 – 2017
Business and Management Plan
Webcast
3
FORWARD-LOOKING STATEMENTS:
DISCLAIMER
The presentation may contain forward-looking statements about future
events within the meaning of Section 27A of the Securities Act of 1933, as
amended, and Section 21E of the Securities Exchange Act of 1934, as
amended, that are not based on historical facts and are not assurances of
future results. Such forward-looking statements merely reflect the
Company’s current views and estimates of future economic
circumstances, industry conditions, company performance and financial
results. Such terms as "anticipate", "believe", "expect", "forecast", "intend",
"plan", "project", "seek", "should", along with similar or analogous
expressions, are used to identify such forward-looking statements.
Readers are cautioned that these statements are only projections and may
differ materially from actual future results or events. Readers are referred
to the documents filed by the Company with the SEC, specifically the
Company’s most recent Annual Report on Form 20-F, which identify
important risk factors that could cause actual results to differ from those
contained in the forward-looking statements, including, among other
things, risks relating to general economic and business conditions,
including crude oil and other commodity prices, refining margins and
prevailing exchange rates, uncertainties inherent in making estimates of
our oil and gas reserves including recently discovered oil and gas
reserves, international and Brazilian political, economic and social
developments, receipt of governmental approvals and licenses and our
ability to obtain financing.
We undertake no obligation to publicly update or revise any
forward-looking statements, whether as a result of new
information or future events or for any other reason. Figures for
2013 on are estimates or targets.
All forward-looking statements are expressly qualified in their
entirety by this cautionary statement, and you should not place
reliance on any forward-looking statement contained in this
presentation.
NON-SEC COMPLIANT OIL AND GAS RESERVES:
CAUTIONARY STATEMENT FOR US INVESTORS
We present certain data in this presentation, such as oil and gas
resources, that we are not permitted to present in documents filed
with the United States Securities and Exchange Commission
(SEC) under new Subpart 1200 to Regulation S-K because such
terms do not qualify as proved, probable or possible reserves
under Rule 4-10(a) of Regulation S-X.
DISCLAIMER
4
2.5
4.2
1,000
2,000
3,000
4,000
5,000
2011 2012 2013 2014 2015 2016 2017 2018 2019 2020
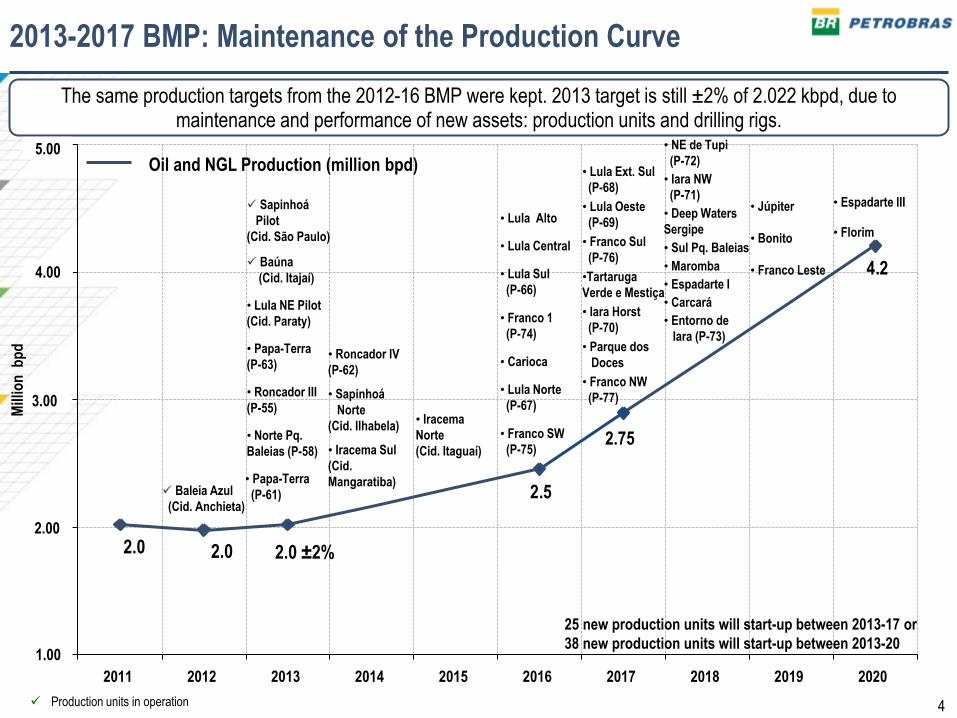
2013-2017 BMP: Maintenance of the Production Curve
• Roncador III
(P-55) • Iracema
Norte
(Cid. Itaguaí)
• Norte Pq.
Baleias (P-58)
Baleia Azul
(Cid. Anchieta)
25 new production units will start-up between 2013-17 or
38 new production units will start-up between 2013-20
Sapinhoá
Pilot
(Cid. São Paulo)
Baúna
(Cid. Itajaí)
• Lula NE Pilot
(Cid. Paraty)
• Papa-Terra
(P-63)
• Iracema Sul
(Cid.
Mangaratiba)
• Roncador IV
(P-62)
• Sapinhoá
Norte
(Cid. Ilhabela)
• Papa-Terra
(P-61)
2.0 2.0
The same production targets from the 2012-16 BMP were kept. 2013 target is still ±2% of 2.022 kbpd, due to maintenance and performance of new assets: production units and drilling rigs.
2.0 ±2%
• Florim
• Júpiter • Lula Alto
• Lula Central
• Lula Sul
(P-66)
• Franco 1
(P-74)
• Carioca
• Lula Norte
(P-67)
• Franco SW
(P-75)
• Lula Ext. Sul
(P-68)
• Lula Oeste
(P-69)
• Franco Sul
(P-76)
•Tartaruga
Verde e Mestiça
• Parque dos
Doces
• Maromba
• Iara Horst
(P-70)
• Franco NW
(P-77)
• Entorno de
Iara (P-73)
• NE de Tupi
(P-72)
• Iara NW
(P-71)
• Sul Pq. Baleias
• Espadarte I
• Deep Waters
Sergipe
• Carcará
• Bonito
• Franco Leste
• Espadarte III
Production units in operation
1,00
2,00
3,00
4,00
5,00
2011 2012 2013 2014 2015 2016 2017 2018 2019 2020
2.75
5.00
4.00
3.00
2.00
1.00
Oil and NGL Production (million bpd)
Mill
ion
bp
d

5
001
002
003
004
005
006
1905ral 1905ral 1905ral 1905ral 1905ral 1905ral 1905ral 1905ral 1905ral 1905ral
2.0 2.0
Mill
ion
bo
ed
2.0 ±2%
4.2
1,00
2,00
3,00
4,00
5,00
2011 2012 2013 2014 2015 2016 2017 2018 2019 2020
2.5
2.4 2.4
3.0
5.2
Oil and NGL Production (million bpd)
Oil, NGL and Natural Gas Production (million boe)
2.4 ±2%
2013-2017 BMP: Maintenance of the Production Curve
The same production targets from the 2012-16 BMP were kept. 2013 target is still ±2% of 2.022 kbpd, due to maintenance and performance of new assets: production units and drilling rigs.
6.00
5.00
4.00
3.00
2.00
1.00
2.75
3.4

6
Investments in 2012 totaled R$ 84.1 Billion, which represents 101% of the projected in the Plan
R$
Bill
ion
Annual Investment
Individual Physical and Financial Monitoring of 174 projects (S Curves): Average physical realization of 104.8% and financial realization of 110.6%.
+1%
2012 Accomplished
84.1
Projected 2012
2012-16 BMP
83.3
34%
51%
Biofuels
Distribution
Corporate
G&E
International
Downstream
E&P
6% 5%
2% 1,6%
0,4%
Investment by Area Main Projects
Investments and Physical and Financial Monitoring 2012: Alignment of Forecasts and Accomplishments: Physical Progress Tracking Financial Progress
E&P: Production Development Projects of Baleia
Azul (Cid. de Anchieta), Sapinhoá (Cid. de São
Paulo), Roncador Modules 3 and 4 (P-55 and P-62)
and Papa-Terra (P-61 and P-63).
Downstream: RNEST and Comperj.
G&P: UFN-III, Bahia Regasification Terminal and
UPGN Cabiúnas.
International: Production Development Projects of
Cascade and Saint-Malo.

7
Physical and Financial Performance: RNEST
RNEST Construction – 33 years after the last refinery (1980)
Suape Industrial Complex (PE) – Feb/13
Accumulated Physical Realization: 70.6%
Accumulated Financial Realization: US$ 11.7 Billion
RNEST: Physical Monitoring Curve
RNEST: Financial Monitoring Curve

8
RNEST: Physical Monitoring Curve
RNEST: Financial Monitoring Curve
Northeast Refinery (RNEST) Physical and Financial Monitoring of the Project: Planning Fullfilled
dez
/12
2012
Accomplished: R$ 4.9 bi*
2012-16 BMP: R$ 5.0 bi
2012
Accomplished: 19.9%
2012-16 BMP: 19.7%
dez
/12
dez
/11
Dec
/12
Dec
/11
Mar
/12
Jun
/12
Sep
/12
Mar
/13
dez
/12
dez
/11
Dec
/12
Dec
/11
Mar
/12
Jun
/12
Sep
/12
Mar
/13
* Considers R$ 100 Million of claims
already negotiated
9
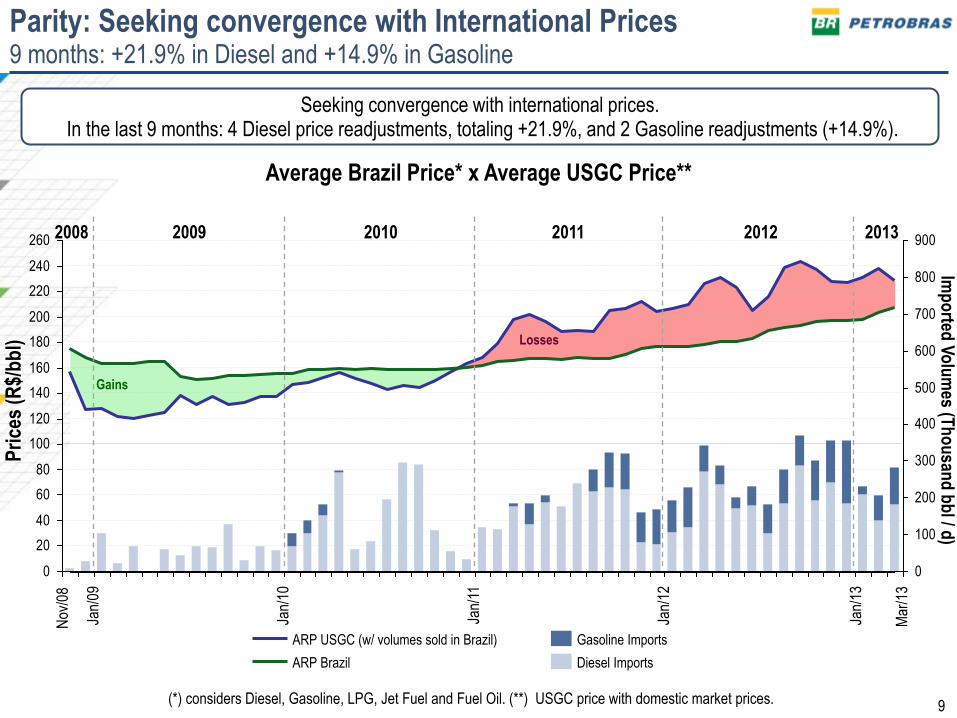
Seeking convergence with international prices. In the last 9 months: 4 Diesel price readjustments, totaling +21.9%, and 2 Gasoline readjustments (+14.9%).
(*) considers Diesel, Gasoline, LPG, Jet Fuel and Fuel Oil. (**) USGC price with domestic market prices.
Parity: Seeking convergence with International Prices 9 months: +21.9% in Diesel and +14.9% in Gasoline
Jan/
13
Jan/
12
Jan/
10
Jan/
09
Jan/
11
Imp
orted
Vo
lum
es (Th
ou
sand
bb
l / d)
Pri
ces
(R$/
bb
l)
Gasoline Imports
Diesel Imports
ARP USGC (w/ volumes sold in Brazil)
ARP Brazil
Average Brazil Price* x Average USGC Price**
Mar
/13
0
100
200
300
400
500
600
700
800
900
0
20
40
60
80
100
120
140
160
180
200
220
240
260
Losses
Gains
2009 2010 2011 2012 2013 2008
Nov
/08

10
Jan/
13
Jan/
12
Jan/
10
Jan/
09
Jan/
11
Imp
orted
Vo
lum
es (Th
ou
sand
bb
l / d)
Pri
ces
(R$/
bb
l)
Gasoline Imports
Diesel Imports
ARP USGC (w/ volumes sold in Brazil)
ARP Brazil
Average Brazil Price* x Average USGC Price**
Mar
/13
0
100
200
300
400
500
600
700
800
900
0
20
40
60
80
100
120
140
160
180
200
220
240
260
Losses
Gains
2009 2010 2011 2012 2013 2008
Nov
/08
1Q12 1Q13
Brent (US$/bbl):
FX Rate (R$/US$):
105
1.67
113
1.99 +19%
(*) considers Diesel, Gasoline, LPG, Jet Fuel and Fuel Oil. (**) USGC price with domestic market prices.
Parity: Seeking convergence with International Prices 9 months: +21.9% in Diesel and +14.9% in Gasoline
Seeking convergence with international prices. In the last 9 months: 4 Diesel price readjustments, totaling +21.9%, and 2 Gasoline readjustments (+14.9%).
11
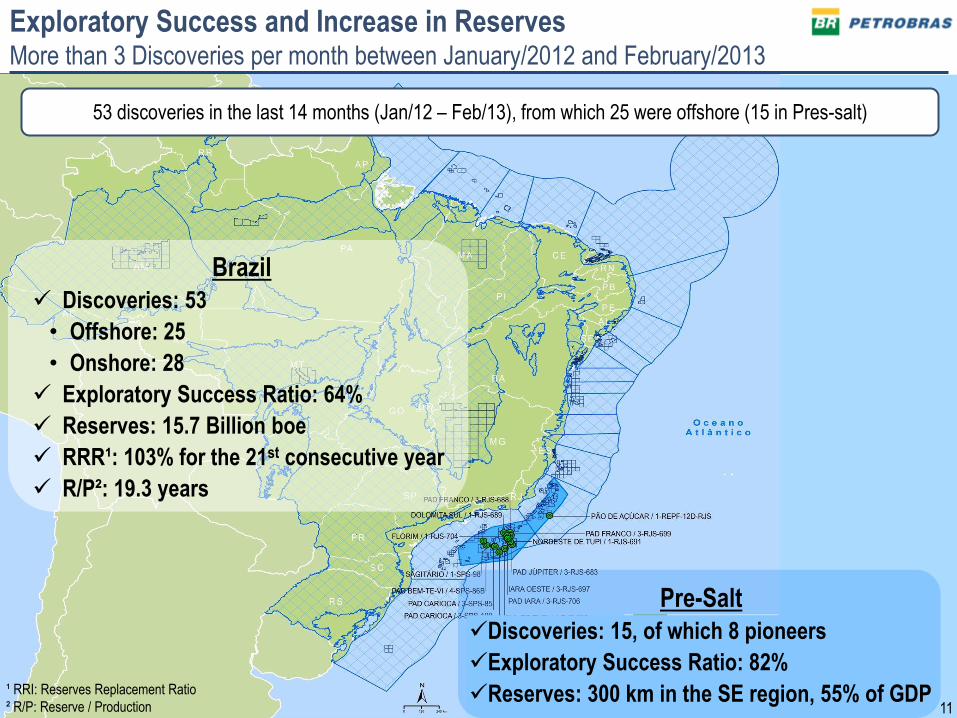
Exploratory Success and Increase in Reserves More than 3 Discoveries per month between January/2012 and February/2013
53 discoveries in the last 14 months (Jan/12 – Feb/13), from which 25 were offshore (15 in Pres-salt)
¹ RRI: Reserves Replacement Ratio
² R/P: Reserve / Production
Pre-Salt
Discoveries: 15, of which 8 pioneers
Exploratory Success Ratio: 82%
Reserves: 300 km in the SE region, 55% of GDP
Brazil
Discoveries: 53
• Offshore: 25
• Onshore: 28
Exploratory Success Ratio: 64%
Reserves: 15.7 Billion boe
RRR¹: 103% for the 21st consecutive year
R/P²: 19.3 years
11

12
Pre-Salt Production is a Reality Production reached 300 thousand barrels of oil per day in Feb/20/2013
Pre-Salt Production Data
Oil Production reached 300 kbpd (of which 249 kbpd
is Petrobras’ stake), 43% in Santos Basin and 57% in
Campos Basin;
This level was reached with only 17 producing wells, 6
in Campos Basin and 11 in Campos Basin;
Level reached only 7 years after discovery:
• Campos Basin: 11 years
• US Gulf of Mexico: 17 years
• North Sea: 9 years
Production of 1 million bpd operated by Petrobras will
be reached by 2017 and the 2.1 million bpd threshold
will be reached by 2020.
Technological Challenges Surmounted
High Resolution Seismic: higher exploratory
success
Geological and numerical modelling: better
production behaviour forecast
Reduction of well construction time from 134
days in 2006 to 70 day in 2012: lower costs
Selection of new materials: lower costs
Qualification of new systems for production
gathering: higher competitiveness
Separation of CO2 from natural gas in deep
waters and reinjection: lower emissions and
increase in recovery factor

13
Refining in Brazil: Oil Products Output
Oil Products output increases every year and will continue to grow with the start-up of the new refineries. Successive records in oil processing have been broken.
96% 93% 93% 93% 92%
• RNEST
Phase 1
Nov/14
• RNEST
Phase 2
May/15
• Comperj
Phase 1
Apr/15
• Premium I
Phase 1
Oct/17
• Premium II
Dec/17
• Comperj
Phase 2
Jan/18
• Premium I
Phase 2
Oct/20
Refineries in Operation Refineries under Construction Refineries in Design Phase
Oil Products Output in Brazil (Million bbl / day)
2.10 MMbpd
(Aug)
2.11 MMbpd
(Jan)
2.12 MMbpd
(Mar)
Daily Oil Processing records
Utilization Factor
3.5
3.0
2.5
2.0
1.5
1.0

14
Thermo power generation, Petrobras and Third Parties¹, above the 10,000 MW threshold in October/2012. We had successive power generation records in 2012 and 2013.
Thermo Power Generation in the National Grid System 10,000 MW: Petrobras Supplies Fuel for 16% of the System Needs
MW
avg
¹ Where Petrobras has a stake or supplies fuel
0
2.000
4.000
6.000
8.000
10.000
12.000
01
-Ja
n-1
02
1-J
an
-10
10
-Fe
b-1
00
2-M
ar-
10
22
-Ma
r-1
01
1-A
pr-
10
01
-Ma
y-1
02
1-M
ay-
10
10
-Ju
n-1
03
0-J
un
-10
20
-Ju
l-1
00
9-A
ug
-10
29
-Au
g-1
01
8-S
ep
-10
08
-Oct
-10
28
-Oct
-10
17
-No
v-1
00
7-D
ec-
10
27
-De
c-1
01
6-J
an
-11
05
-Fe
b-1
12
5-F
eb
-11
17
-Ma
r-1
10
6-A
pr-
11
26
-Ap
r-1
11
6-M
ay-
11
05
-Ju
n-1
12
5-J
un
-11
15
-Ju
l-1
10
4-A
ug
-11
24
-Au
g-1
11
3-S
ep
-11
03
-Oct
-11
23
-Oct
-11
12
-No
v-1
10
2-D
ec-
11
22
-De
c-1
11
1-J
an
-12
31
-Ja
n-1
22
0-F
eb
-12
11
-Ma
r-1
23
1-M
ar-
12
20
-Ap
r-1
21
0-M
ay-
12
30
-Ma
y-1
21
9-J
un
-12
09
-Ju
l-1
22
9-J
ul-
12
18
-Au
g-1
20
7-S
ep
-12
27
-Se
p-1
21
7-O
ct-1
20
6-N
ov-
12
26
-No
v-1
21
6-D
ec-
12
05
-Ja
n-1
32
5-J
an
-13
14
-Fe
b-1
30
6-M
ar-
13
Petrobras - Gas Third Parties - Gas Petrobras - Oil Third Parties - Oil
2011 2012 2010 2013
10,485 MWavg
(Feb/06) 10,149 MWavg
(Nov/23)
12,000
10,000
8,000
4,000
2,000
0
6,000

15
2013-17 Business and Management Plan Fundamentals
• Management
focused on
reaching
physical and
financial targets
of each project
PERFORMANCE
• Guarantee the
expansion of
the business
with solid
financial
indicators
CAPITAL
DISCIPLINE
• Priority for
oil and
natural gas
exploration &
production
projects in
Brazil
PRIORITY
2013 2017
Financiability Assumptions
• Investment Grade rating maintenance
• No new equity issuance
• Convergence with International Prices (Oil Products)
• Divestments in Brazil and, mainly, abroad

16
2013-2017 BMP Investments: Approved by Petrobras’ Board of Directors in 03/15/13
2013-2017 Period
US$ 236.7 Billion
• Investment Grade Rating maintenance:
− Leverage lower than 35%
− Net Debt/EBITDA lower than 2.5x
• No new equity issuance
• Convergence with International Prices (Oil
Products)
• Divestments in Brazil and, mainly, abroad
* Pbio = Petrobras Biofuel │ETM = Engineering, Technology and Materials │Other Areas = Financial, Strategy and Corporate
Financiability Assumptions
28%
International ETM* Other Areas* Pbio* E&P Distribuition Downstream G&E
E&P 62.3%
(US$ 147.5 bi)
27.4% (US$ 64.8 bi)
1.0% (US$ 2.3 bi)
1.4% (US$ 3.2 bi)
1.1% (US$ 2.9 bi)
2.2% (US$ 5.1 bi)
4.2% (US$ 9.9 bi)
0.4% (US$ 1.0 bi)

17
2013-2017 BMP Investments: Implementation x Evaluation
Under Implementation
US$ 207.1 Billion
Under Evaluation
US$ 29.6 Billion
+ = Total
US$ 236.7 Billion
All E&P projects in Brazil and projects of the
remaining segments in phase IV
Projects for the remaining segments,
excluding E&P, currently in phase I, II and III.
770 projects 177 projects 947 projects
62.3%
(US$ 147.5 Billion) 27.4%
(US$ 64.8 Billion)
1.0%
(US$ 2.3 Billion)
1.4%
(US$ 3.2 Billion)
1.1%
(US$ 2.9 Billion)
2.2%
(US$ 5.1 Billion)
4.2%
(US$ 9.9 Billion)
0.4%
(US$ 1.0 Billion)
71.2%
(US$ 147.5 Billion) 20.9%
(US$ 43.2 Billion)
1.1%
(US$ 2.3 Billion)
1.4%
(US$ 2.9 Billion)
0.5%
(US$ 1.1 Billion)
1.5%
(US$ 3.2 Billion)
2.9%
(US$ 5.9 Billion)
0.5%
(US$ 1.0 Bililon)
73.0%
(US$ 21.6 Billion)
1.0%
(US$ 0.3 Billion)
13.5%
(US$ 4.0 Billion)
6.4%
(US$ 1.9 Billion)
6.1%
(US$ 1.8 Billion)
Phase I: Opportunity Identification; Phase II: Conceptual Project; Phase III: Basic Project ; Phase IV: Execution
* Pbio = Petrobras Biofuel │ETM = Engineering, Technology and Materials │Other Areas = Financial, Strategy and Corporate
International ETM* Other Areas* Pbio* E&P Distribuition Downstream G&E

18
INVESTMENTS UNDER IMPLEMENTATION
INVESTMENTS UNDER EVALUATION
* US$ 207.1 Billion include ETM (US$ 2,3 bi) and Other Areas (US$ 1,0 bi) investments
2013-2017 Business and Management Plan : Project Portfolio Management
Implementation of
Projects under
Evaluations contingent
on:
Results of Technical-
Economical Feasibility
studies;
Availability of Resources
(financiability);
Competition for available
resources.
US$ 147.5 Billion
E&P
US$ 43.2 Billion
Downstream
US$ 5.9 Billion
Gas & Energy
US$ 3.2 Billion
International
US$ 2.9 Billion
Distribution
US$ 1.1 Billion
Biofuels
-
E&P
US$ 21.6 Billion
Downstream
US$ 4.0 Billion
Gas & Energy
US$ 1.9 Billion
International
US$ 0.3 Billion
Distribution
US$ 1.8 Billion
Biofuels
US$
207.1 bi*
US$
29.6 bi*
19
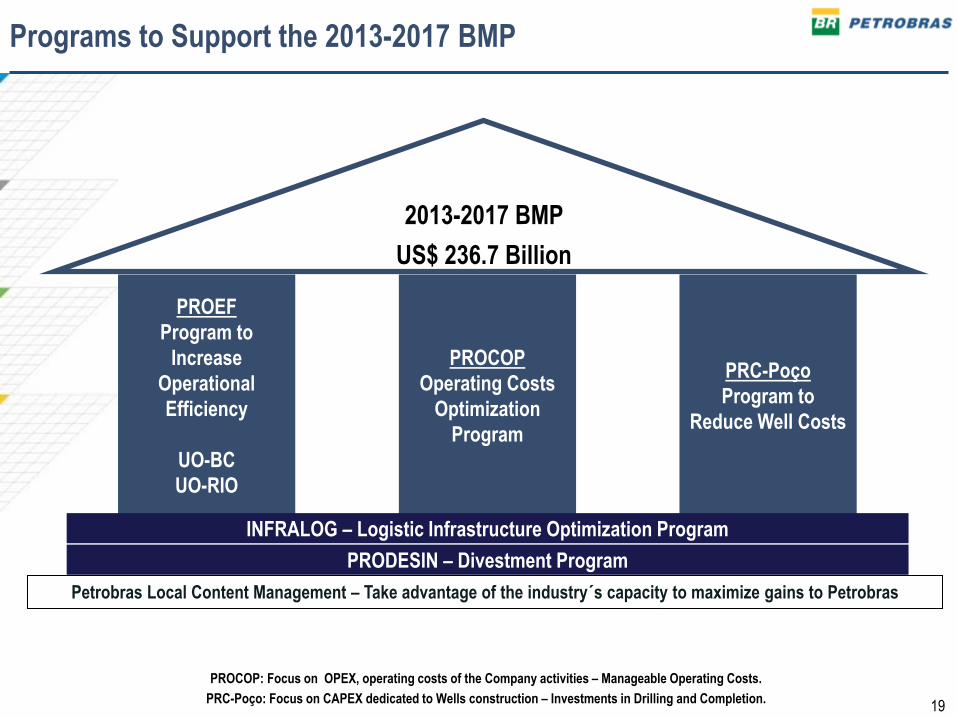
Programs to Support the 2013-2017 BMP
2013-2017 BMP
US$ 236.7 Billion
PRC-Poço
Program to
Reduce Well Costs
PROEF
Program to
Increase
Operational
Efficiency
UO-BC
UO-RIO
PROCOP
Operating Costs
Optimization
Program
INFRALOG – Logistic Infrastructure Optimization Program
PRODESIN – Divestment Program
PROCOP: Focus on OPEX, operating costs of the Company activities – Manageable Operating Costs.
PRC-Poço: Focus on CAPEX dedicated to Wells construction – Investments in Drilling and Completion.
Petrobras Local Content Management – Take advantage of the industry´s capacity to maximize gains to Petrobras
20
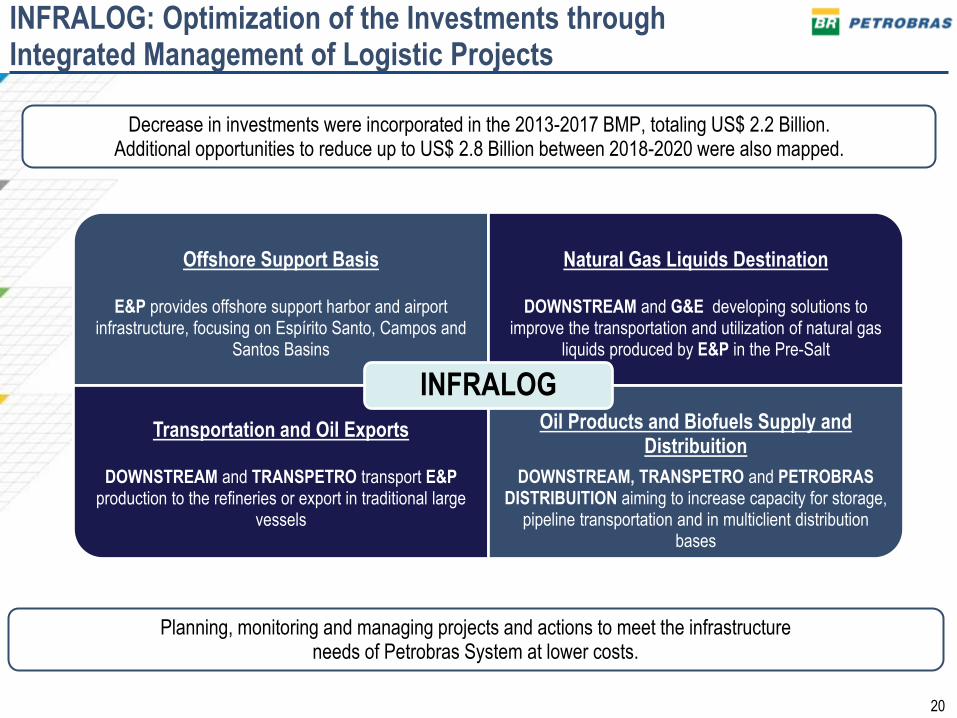
INFRALOG: Optimization of the Investments through Integrated Management of Logistic Projects
Planning, monitoring and managing projects and actions to meet the infrastructure needs of Petrobras System at lower costs.
Offshore Support Basis
E&P provides offshore support harbor and airport infrastructure, focusing on Espírito Santo, Campos and
Santos Basins
Natural Gas Liquids Destination
DOWNSTREAM and G&E developing solutions to improve the transportation and utilization of natural gas
liquids produced by E&P in the Pre-Salt
Transportation and Oil Exports
DOWNSTREAM and TRANSPETRO transport E&P production to the refineries or export in traditional large
vessels
Oil Products and Biofuels Supply and
Distribuition
DOWNSTREAM, TRANSPETRO and PETROBRAS DISTRIBUITION aiming to increase capacity for storage,
pipeline transportation and in multiclient distribution bases
INFRALOG
Decrease in investments were incorporated in the 2013-2017 BMP, totaling US$ 2.2 Billion. Additional opportunities to reduce up to US$ 2.8 Billion between 2018-2020 were also mapped.
21
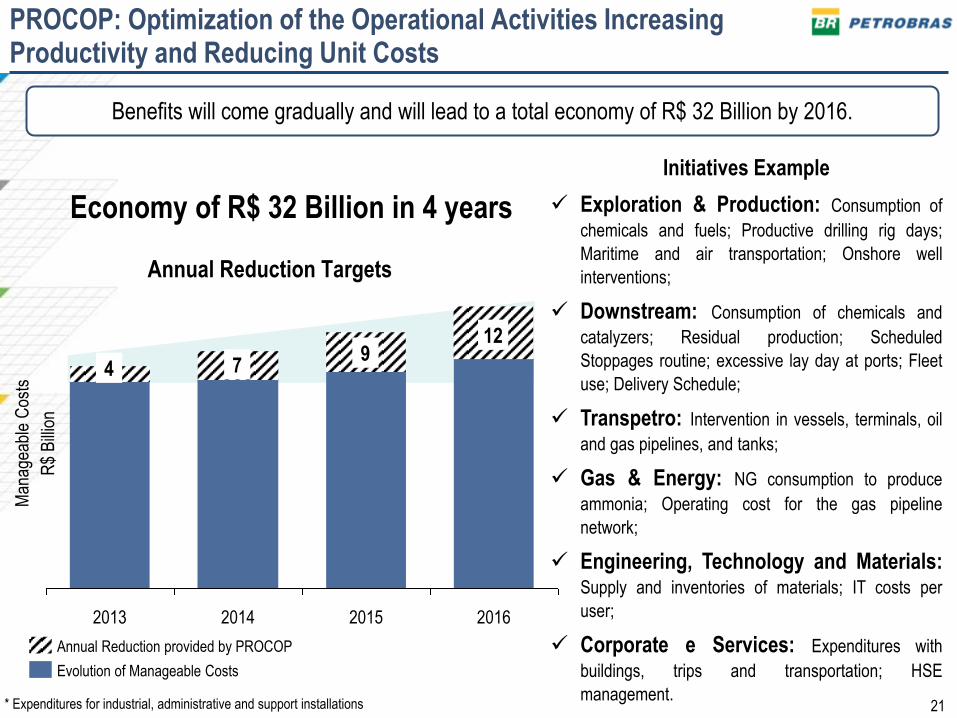
2014 2013 2016 2015
Annual Reduction Targets
Economy of R$ 32 Billion in 4 years
Benefits will come gradually and will lead to a total economy of R$ 32 Billion by 2016.
4 7 9
12
PROCOP: Optimization of the Operational Activities Increasing Productivity and Reducing Unit Costs
Initiatives Example
Exploration & Production: Consumption of
chemicals and fuels; Productive drilling rig days;
Maritime and air transportation; Onshore well
interventions;
Downstream: Consumption of chemicals and
catalyzers; Residual production; Scheduled
Stoppages routine; excessive lay day at ports; Fleet
use; Delivery Schedule;
Transpetro: Intervention in vessels, terminals, oil
and gas pipelines, and tanks;
Gas & Energy: NG consumption to produce
ammonia; Operating cost for the gas pipeline
network;
Engineering, Technology and Materials: Supply and inventories of materials; IT costs per
user;
Corporate e Services: Expenditures with
buildings, trips and transportation; HSE
management.
* Expenditures for industrial, administrative and support installations
Annual Reduction provided by PROCOP
Evolution of Manageable Costs
Man
agea
ble
Cos
ts
R$
Bill
ion

22
16%
(24.3) 73%
(106.9) 11%
(16.3)
Infrastructure and Support
Exploration
Production Development
2013-2017 Period US$ 147.5 Billion
22
Exploration & Production

23
E&P Investments
25%
(26.2)
43%
(46.4)
32%
(34.3)
Production Development
US$ 106.9 Billion
70%
(17.1)
24%
(5.8)
6%
(1.4)
Post-Salt
Pre-Salt
Transfer of Rights
Exploration
US$ 24.3 Billion
2013-2017 Period
Aside from Exploration and Production Development, E&P infrastructure investments total US$ 16.3 Billion.
24
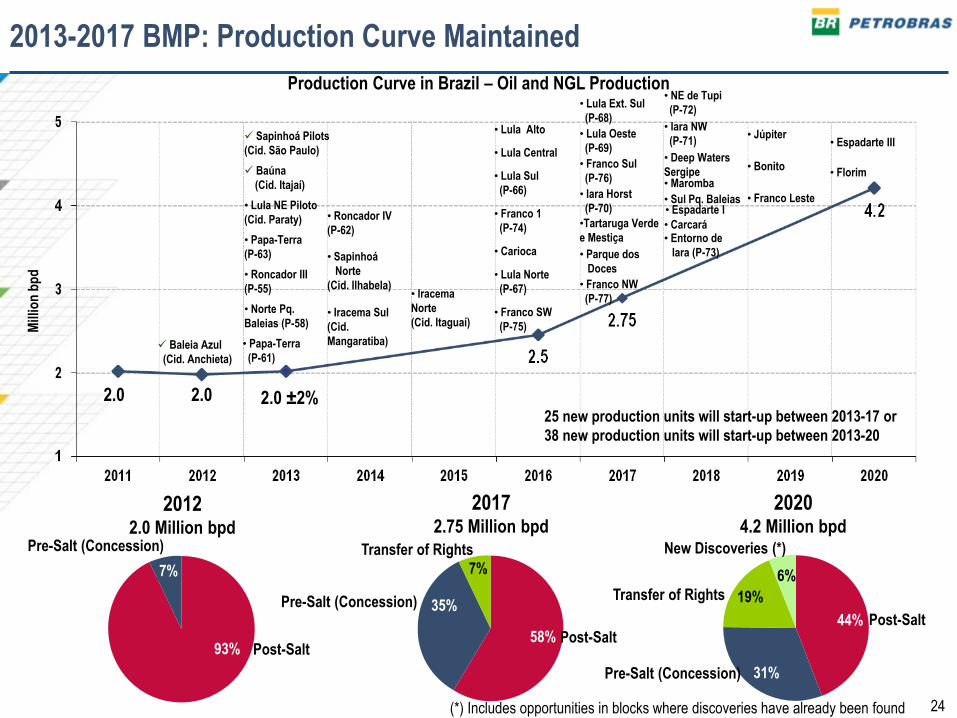
2013-2017 BMP: Production Curve Maintained
Production Curve in Brazil – Oil and NGL Production
• Roncador III
(P-55) • Iracema
Norte
(Cid. Itaguaí)
• Florim
• Júpiter
• Norte Pq.
Baleias (P-58)
Baleia Azul
(Cid. Anchieta)
Sapinhoá Pilots
(Cid. São Paulo)
Baúna
(Cid. Itajaí)
• Lula NE Piloto
(Cid. Paraty)
• Papa-Terra
(P-63)
• Iracema Sul
(Cid.
Mangaratiba)
• Roncador IV
(P-62)
• Sapinhoá
Norte
(Cid. Ilhabela)
• Lula Alto
• Lula Central
• Lula Sul
(P-66)
• Franco 1
(P-74)
• Carioca
• Lula Norte
(P-67)
• Franco SW
(P-75)
• Lula Ext. Sul
(P-68)
• Lula Oeste
(P-69)
• Franco Sul
(P-76)
•Tartaruga Verde
e Mestiça
• Parque dos
Doces
• Maromba • Iara Horst
(P-70)
• Franco NW
(P-77)
• Entorno de
Iara (P-73)
• NE de Tupi
(P-72)
• Iara NW
(P-71)
• Sul Pq. Baleias • Espadarte I
• Deep Waters
Sergipe
• Carcará
• Bonito
• Franco Leste
• Espadarte III
• Papa-Terra
(P-61)
2.0 ±2% 2.0 2.0
Mill
ion
bp
d
2012 2.0 Million bpd
2017 2.75 Million bpd
2020 4.2 Million bpd
Pre-Salt (Concession)
7%
93%
Transfer of Rights
7%
Pre-Salt (Concession) 35%
Post-Salt 58%
New Discoveries (*)
6%
Transfer of Rights 19%
Pre-Salt (Concession) 31%
Post-Salt 44%
Post-Salt
(*) Includes opportunities in blocks where discoveries have already been found
25 new production units will start-up between 2013-17 or
38 new production units will start-up between 2013-20

25
Production Curve in Brazil – Oil and NGL Production
2013
• Roncador III
(P-55) • Iracema
Norte
(Cid. Itaguaí)
• Florim • Júpiter
• Norte Pq.
Baleias (P-58)
Baleia Azul
(Cid. Anchieta)
Sapinhoá Pilot
(Cid. São Paulo)
Baúna
(Cid. Itajaí)
• Lula NE Pilot
(Cid. Paraty)
• Papa-Terra
(P-63)
• Iracema Sul
(Cid.
Mangaratiba)
• Roncador IV
(P-62)
• Sapinhoá
Norte
(Cid. Ilhabela)
• Lula Alto
• Lula Central
• Lula Sul
(P-66)
• Franco 1
(P-74)
• Carioca
• Lula Norte
(P-67)
• Franco SW
(P-75)
• Bonito
• Franco Leste
• Espadarte III
• Papa-Terra
(P-61)
2.0 ±2% 2.0 2.0
Mill
ion
bp
d
2013-2017 BMP: Production Curve Maintained
25 new production units will start-up between 2013-17 or
38 new production units will start-up between 2013-20
• Lula Ext. Sul
(P-68)
• Lula Oeste
(P-69)
• Franco Sul
(P-76)
•Tartaruga Verde
e Mestiça
• Parque dos
Doces
• Maromba
• Iara Horst
(P-70)
• Franco NW
(P-77)
• Entorno de
Iara (P-73)
• NE de Tupi
(P-72)
• Iara NW
(P-71)
• Sul Pq. Baleias
• Espadarte I
• Deep Waters
Sergipe
• Carcará
Production units in operation

26
Sapinhoá Pilot Project: Drilling, completion and interconnection of 13 wells to a chartered FPSO from Schahin/Modec with capacity to process120 kbpd
of oil and 5 million m3/d of natural gas.
Sapinhoá Pilot Project: Operating since January 5th, 2013 FPSO Cidade de São Paulo: 120 kbpd
FPSO Cidade de São Paulo anchored in field – Mar/13 TOTAL PHYSICAL COMPLETION - Forecast: 59.9% / Accomplished: 54.0%
TOTAL LOCAL CONTENT – Commitment with ANP: 30% / Planned: 57%
26

27
Baúna Project: Drilling, completion and interconnection of 13 submarine well to chartered FPSO Cidade de Itajaí, with capacity to process 80 kbpd of oil and
2 million m3/d of gas.
Baúna Project: Operating since February 16th, 2013 FPSO Cidade de Itajaí: 80 kbpd
FPSO Cidade de Itajaí anchored in field - Jan/13 TOTAL PHYSICAL COMPLETION - Forecast: 69.8% / Accomplished: 53.5%
TOTAL LOCAL CONTENT – Commitment with ANP: 60%
27

28
Lula NE Pilot Project – 1st Oil on May 28th, 2013 FPSO Cidade de Paraty: 120 kbpd Lula NE Pilot Project: Drilling, completion and interconnection of 14 wells to a FPSO chartered from QGOG/SBM with capacity to process 120 kbpd of oil
and 5 million m3/d of gas.
FPSO Cidade de Paraty Integration at BrasFELS Shipyard, Angra dos Reis/RJ, Mar/13.
UNIT's PHYSICAL COMPLETION - Forecast: 99.0% / Accomplished: 97.8%
UNIT's LOCAL CONTENT – Planned: 65%
TOTAL LOCAL CONTENT – Commitment with ANP: 30% / Planned: 60%
28

29 P-63 Integration at Honório Bicalho Shipyard, in Rio Grande (RS) – Feb/2013
Papa-Terra Project: 1st Oil of P-63 on July 15th, 2013 FPSO P-63: 140 kbpd
Papa-Terra Project: Drilling, completion and interconnection of 30 wells to P-61 TLWP (Tension Leg Wellhead Plataform) and P-63 (FPSO) with capacity to
produce 140 kbpd and 1 MM m2/day of gas.
UNIT’s PHYSICAL COMPLETION - Forecast: 98.5% / Accomplished: 94.1%
UNIT’s LOCAL CONTENT – Planned: 65%
TOTAL LOCAL CONTENT – Commitment with ANP: 0% / Planned: 46%
29

30
Roncador Project Module III - 1st Oil on September 30th, 2013 SS P-55: 180 kbpd Roncador Project Module III: Drilling, completion and interconnection of 17 wells to SS P-55 with capacity to process 180 kbpd of oil and 6 million m3/d of
gas.
SS P-55 Integration at ERG1 Shipyard in Rio Grande/RS – Feb/2013
UNIT’s PHYSICAL COMPLETION - Forecast: 87.5% / Accomplished: 89.2%
UNIT’s LOCAL CONTENT – Planned: 65%
TOTAL LOCAL CONTENT – Commitment with ANP: 0% / Planned : 50%
30

31
Parque das Baleias Project: Drilling, completion and interconnection of 24 wells to FPSO P-58, with a processing capacity of 180 kbpd of oil and 6 MM
m³/d of gas.
FPSO P-58 Integration at Honório Bicalho Shipyard , in Rio Grande/RS – Mar/2013
Parque das Baleias Project: 1st Oil on November 30th, 2013 FPSO P-58: 180 kbpd
UNIT’s PHYSICAL COMPLETION – Forecast: 86.0% / Accomplished: 90.6%
UNIT’s LOCAL CONTENT – Planned: 62%
TOTAL LOCAL CONTENT – Commitment with ANP: 0% / Planned : 58%
31

32
Papa-Terra Project: 1st Oil of P-61 on December 31st, 2013 TLWP P-61 Papa-Terra Project: Drilling, completion and interconnection of 30 wells to P-61 – TLWP (Tension Leg Wellhead Plataform) and to P-63 (FPSO) with capacity
to process 140 kbpd and 1 MM m³/day of gas.
Topside and hull of P-61 at BrasFELS Shipyard (RJ) – Jan/2013
UNIT’s PHYSICAL COMPLETION – Forecast: 94.9% / Accomplished: 76.2%
UNIT’s LOCAL CONTENT – Planned: 65%
TOTAL LOCAL CONTENT – Commitment with ANP: 0% / Planned : 46%
32

33
2013-2017 BMP: Production Curve Maintained
Production Curve in Brazil – Oil and NGL Production
2014
• Roncador III
(P-55)
• Norte Pq.
Baleias (P-58)
Baleia Azul
(Cid. Anchieta)
Sapinhoá Pilot
(Cid. São Paulo)
Baúna
(Cid. Itajaí)
• Lula NE Pilot
(Cid. Paraty)
• Papa-Terra
(P-63)
• Papa-Terra
(P-61)
2.0 ±2% 2.0 2.0
Mill
ion
bp
d
• Iracema
Norte
(Cid. Itaguaí)
• Iracema Sul
(Cid.
Mangaratiba)
• Roncador IV
(P-62)
• Sapinhoá
Norte
(Cid. Ilhabela)
• Florim • Júpiter • Lula Alto
• Lula Central
• Lula Sul
(P-66)
• Franco 1
(P-74)
• Carioca
• Lula Norte
(P-67)
• Franco SW
(P-75)
• Bonito
• Franco Leste
• Espadarte III
• Lula Ext. Sul
(P-68)
• Lula Oeste
(P-69)
• Franco Sul
(P-76)
•Tartaruga Verde
e Mestiça
• Parque dos
Doces
• Maromba
• Iara Horst
(P-70)
• Franco NW
(P-77)
• Entorno de
Iara (P-73)
• NE de Tupi
(P-72)
• Iara NW
(P-71)
• Sul Pq. Baleias
• Espadarte I
• Deep Waters
Sergipe
• Carcará
Production units in operation

34 P-62 Integration at Atlântico Sul Shipyard, Ipojuca (PE) – Jan/2013
Roncador Project Module IV: Drilling, completion and interconnection of 17 wells to FPSO P-62 with a processing capacity of 180 kbpd of oil and 6 MM
m³/d of gas.
Roncador Project Module IV – 1st Oil on March/2014 FPSO P-62: 180 kbpd
UNIT’s PHYSICAL COMPLETION – Forecast: 70.5% / Accomplished: 88.4%
UNIT’s LOCAL CONTENT – Planned: 64%
TOTAL LOCAL CONTENT – Commitment with ANP: 0% / Planned : 56%
34

35
Sapinhoá Norte Project: 1st Oil on September/2014 FPSO Cidade de Ilhabela: 150 kbpd Sapinhoá Norte Project: Drilling, completion and interconnection of 15 wells to a production unit chartered from QGOG/SBM with processing capacity of 150
kbpd of oil and compression of 6 MM m³/day of gas.
FPSO Cidade de Ilhabela’s Hull Conversion at CSSC Shipyard, in China - Feb/2013
UNIT’s PHYSICAL COMPLETION – Forecast: 41% / Accomplished: 62%
UNIT’s LOCAL CONTENT – Planned: 65%
TOTAL LOCAL CONTENT – Commitment with ANP: 30% / Planned : 56.3%
35
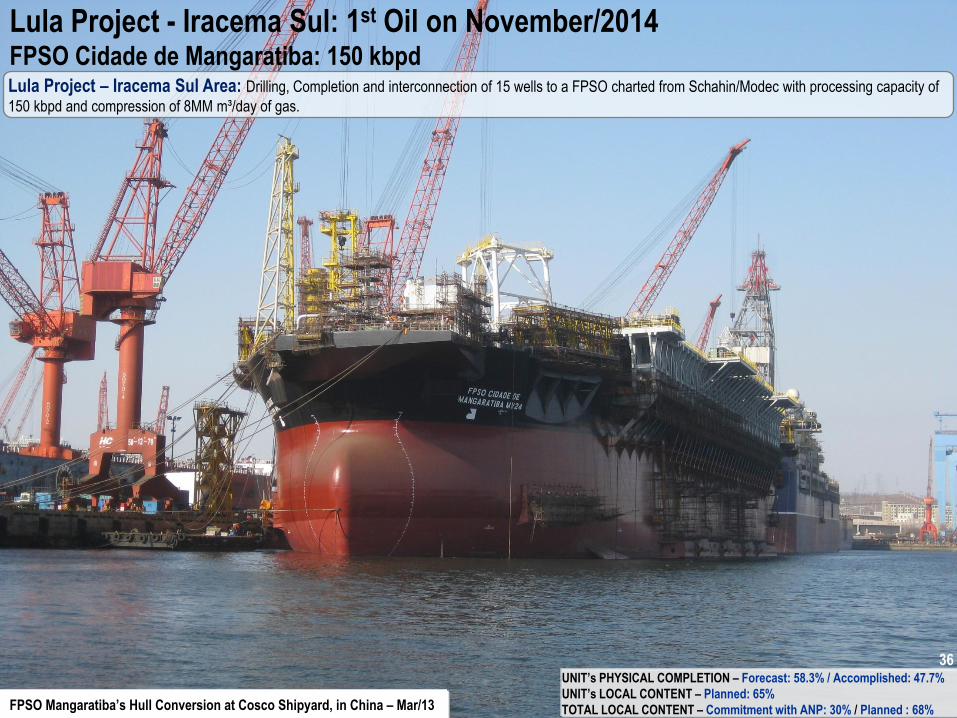
36
Lula Project - Iracema Sul: 1st Oil on November/2014 FPSO Cidade de Mangaratiba: 150 kbpd Lula Project – Iracema Sul Area: Drilling, Completion and interconnection of 15 wells to a FPSO charted from Schahin/Modec with processing capacity of
150 kbpd and compression of 8MM m³/day of gas.
FPSO Mangaratiba’s Hull Conversion at Cosco Shipyard, in China – Mar/13
UNIT’s PHYSICAL COMPLETION – Forecast: 58.3% / Accomplished: 47.7%
UNIT’s LOCAL CONTENT – Planned: 65%
TOTAL LOCAL CONTENT – Commitment with ANP: 30% / Planned : 68%
36

37
2013-2017 BMP: 24 Contracted Units and 15 to Be Contracted between 2013-17
Production Curve in Brazil – Oil and LGN Production
• Roncador III
(P-55) • Iracema
Norte
(Cid. Itaguaí)
• Florim • Júpiter
• Norte Pq.
Baleias (P-58)
Baleia Azul
(Cid. Anchieta)
Sapinhoá Pilot
(Cid. São Paulo)
Baúna
(Cid. Itajaí)
• Lula NE Pilot
(Cid. Paraty)
• Papa-Terra
(P-63)
• Iracema Sul
(Cid.
Mangaratiba)
• Roncador IV
(P-62)
• Sapinhoá
Norte
(Cid. Ilhabela)
• Bonito
• Franco Leste
• Espadarte III
• Papa-Terra
(P-61)
2.0 ±2% 2.0 2.0
Mill
ion
bp
d
• Lula Alto (*)
• Lula Central (*)
• Lula Sul
(P-66) (**)
• Franco 1
(P-74) (***)
• Carioca
• Lula Norte
(P-67) (**)
• Franco SW
(P-75) (***)
• Lula Ext. Sul
(P-68) (**)
• Lula Oeste
(P-69) (**)
• Franco Sul
(P-76) (***)
•Tartaruga
Verde e Mestiça
• Parque dos
Doces
• Maromba
• Iara Horst
(P-70) (**)
• Franco NW
(P-77) (***)
• Entorno de
Iara (P-73) (**)
• NE de Tupi
(P-72) (**)
• Iara NW
(P-71) (**)
• Sul Pq. Baleias
• Espadarte I
• Deep Waters
Sergipe
• Carcará
Production units in operation (*) Units in final contraction phase
• 24 Production Units contracted, 3 already in operation (**) Hull being built in Rio Grande Shipyard (RS)
(***) Hull being converted in Inhaúma Shipyard (RJ)
• 15 new Production Units to be contracted between 2013-17

38
Exploration Investments in Brazil Target: Keep R/P > 12 Minimizing Dry-Well Risks
Transfer
of Rights
24%
(5.8)
Pre-Salt
70%
(17.1) Post-Salt
Consolidation and delimitation of Pre-Salt and Transfer of Rights areas, besides Post-Salt Sergipe-Alagoas and Espirito Santo basins.
Selective investments in New Frontiers: Equatorial and East Margin.
Ser
gip
e-A
lag
oas
, E
spír
ito
San
to,
New
Fro
nti
ers
Co
nso
lidatio
n an
d
Delim
itation
1.96
1.561.15
0.760.640.58
2007 2008 2009 2010 2011 2012
Finding Cost (US$ / boe)
Petrobras Costs Lower than Majors'
Majors (2007-2011): US$ 3.2 to 4.5 / boe
Equatorial
Margin
East
Margin
US$ 24.3 Billion
6%
(1.4)
Concession Areas March, 2012
Petrobras
Other Companies
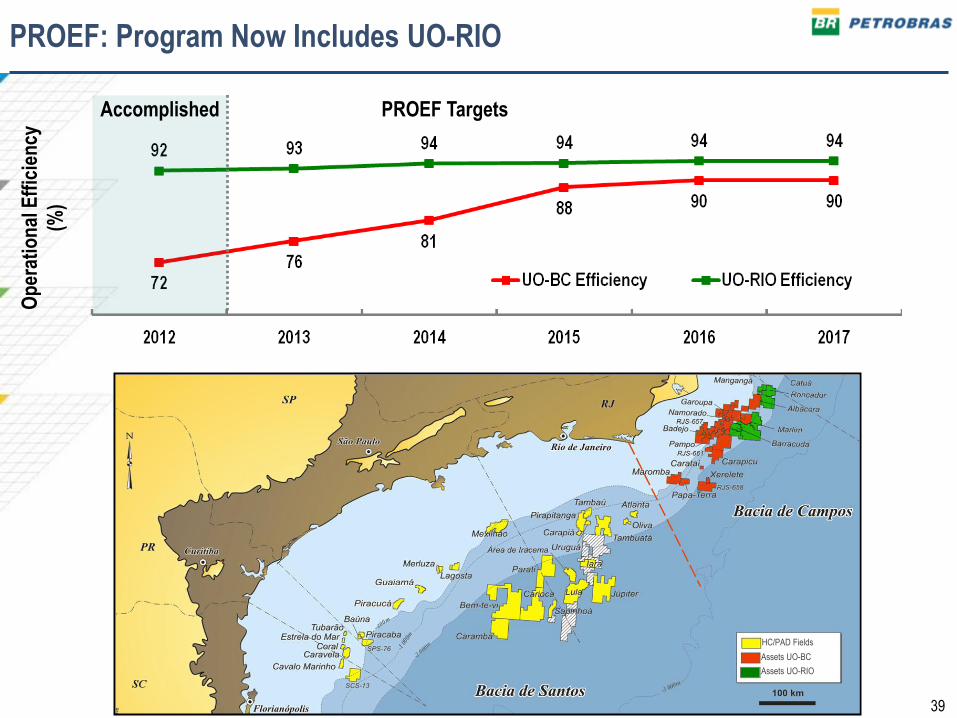
39
Op
erat
ion
al E
ffic
ien
cy
(%)
Accomplished PROEF Targets
PROEF: Program Now Includes UO-RIO
Assets UO-RIO
Assets UO-BC
HC/PAD Fields

40
PRC-Poço: Program to Reduce Well Costs Well Construction is a Relevant Portion in Investments
Exploratory and Production
Development Well Investments
total US$ 75 billion
2013-2017 BMP
Investments
E&P
Other Areas 89.2
147.5
236.7
147.5
106.9
24.3
Infra-structure and Support 16.3
Exploration
Production Development
Brazil E&P
Investments
Increase of drilling rigs fleet and logistic resources
• Petrobras currently has 69 floating drilling rigs for well construction and maintenance in Brazil
Well construction represents:
• 32% of Petrobras investments in 2013-2017 BMP
• 51% of Brazil E&P Investments
41
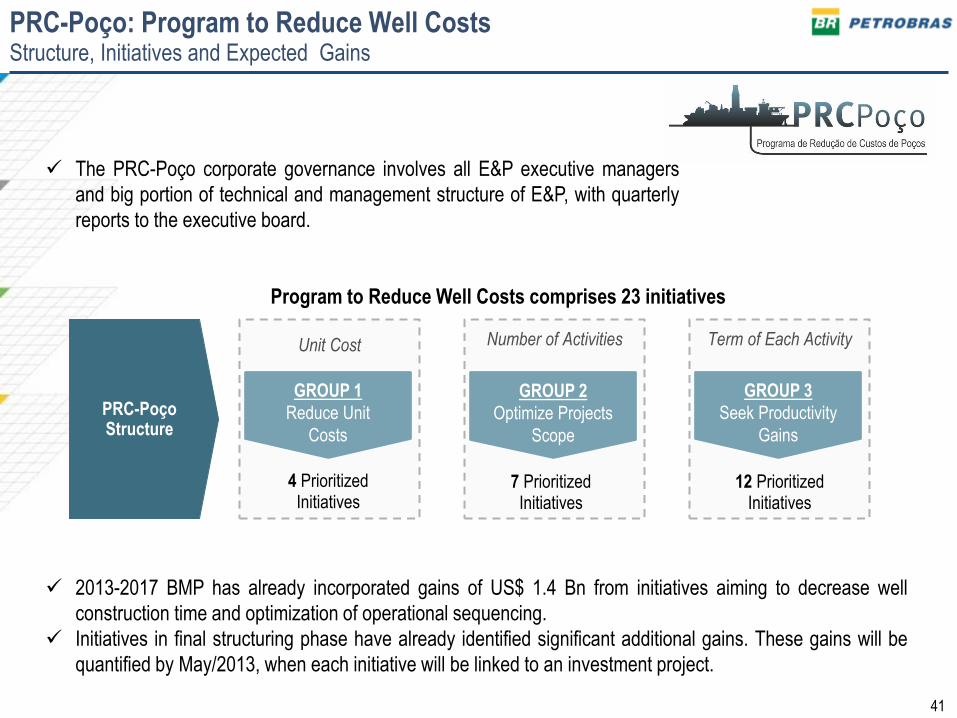
PRC-Poço: Program to Reduce Well Costs Structure, Initiatives and Expected Gains
PRC-Poço Structure
4 Prioritized Initiatives
7 Prioritized Initiatives
12 Prioritized Initiatives
GROUP 1
Reduce Unit
Costs
GROUP 2
Optimize Projects
Scope
GROUP 3
Seek Productivity
Gains
Term of Each Activity Unit Cost Number of Activities
Program to Reduce Well Costs comprises 23 initiatives
2013-2017 BMP has already incorporated gains of US$ 1.4 Bn from initiatives aiming to decrease well
construction time and optimization of operational sequencing.
Initiatives in final structuring phase have already identified significant additional gains. These gains will be
quantified by May/2013, when each initiative will be linked to an investment project.
The PRC-Poço corporate governance involves all E&P executive managers
and big portion of technical and management structure of E&P, with quarterly
reports to the executive board.
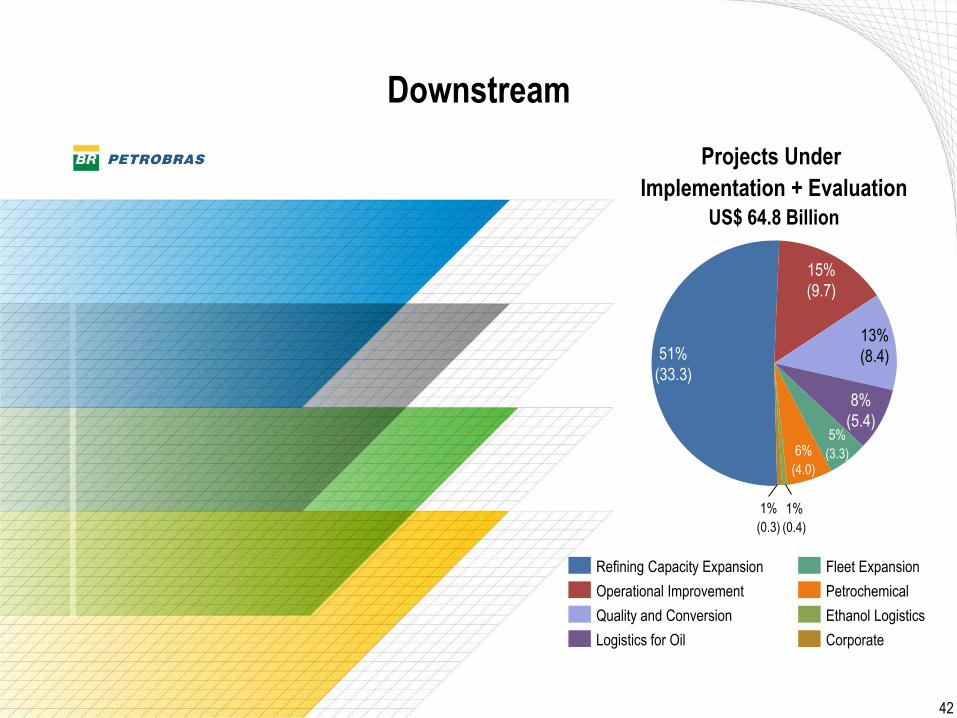
42
Downstream
8%
(5.4)
13%
(8.4)
15%
(9.7)
51%
(33.3)
Corporate
Fleet Expansion
Ethanol Logistics
Petrochemical
Logistics for Oil
Quality and Conversion
Operational Improvement
Refining Capacity Expansion
Projects Under
Implementation + Evaluation
US$ 64.8 Billion
5%
(3.3) 6%
(4.0)
1%
(0.4)
1%
(0.3)
42

43
Downstream Investments
Refining capacity expansion on the Under
Implementation Portfolio: RNEST (Pernambuco)
and COMPERJ 1st Phase (Rio de Janeiro)
Refining capacity expansion in design phase:
Premium I (Maranhão), Premium II (Ceará) and
COMPERJ 2nd Phase (Rio de Janeiro)
Diesel and Gasoline Quality Portfolio: REPLAN,
RPBC, REGAP, REFAP and RLAM
Fleet expansion: PROMEF – 45
Oil and Oil Products transportation vessels
2013-2017 HIGHLIGHTS
Projects Under Implementation
US$ 43.2 billion
Corporate Ethanol Logistics Fleet Expansion Petrochemical
Logistics for Oil Quality and Conversion Operational Improvement Refining Capacity Expansion
11%
(4.9)
21%
(9.2)
45%
(19.4)
6%
(2,8)
6%
(2.4)
1%
(0.4)
1%
(0.3)
Projects Under Evaluation
US$ 21.6 billion
64%
(13.8)
16%
(3.5)
3%
(0.5)
7%
(1.5)
2%
(0.5)
6%
(2.8)
9%
(3.7)
8%
(1.7)

44
1
1
8
8
9
2
3
8
6
7
8
4 4
6
5
(1) Oil and oil products storage area; (2) Atmospheric distillation unit; (3) Power House; (4) Coking Unit; (5) Intermediary products tanks; (6) Contractors yard; (7) Acid water treatment
unit; (8) Pipelines; (9) Hydrotreatment units
6 6
6 6
7
Northeast Refinery (RNEST): Start-up on November/14 Processing capacity: 230 kbpd
RNEST construction – Feb/13 TOTAL PHYSICAL PROGRESS- Forecast: 70.3% / Accomplished: 70.6%
LOCAL CONTENT- Target: 75% / Planned: 86.5%
44

45
Relevance of refining capacity expansion for the oil product market supply and demand balance
(kbpd)
Demand for oil products in Brazil grows 4.2% p.a. between 2012 and 2020.
Without Premium I, Premium II and Comperj 2nd phase, Brazil will import 29% of its oil product demand
Brazil’s oil product market in 2020
New Refineries Under Implemantation
• Premium I – 1st Phase 300 kbpd - Oct/17
• Premium II - Trem 1 300 kbpd - Dec/17
• Premium I - 2nd Phase 300 kbpd - Oct/20
• Comperj – 2nd Phase
300 kbpd - Jan/18 • Comperj 1st phase: under
construction
165 kbpd - Apr/15
• RNEST: under construction
1st phase - 115 kbpd - Nov/14
2nd phase - 115 kbpd - May/15
New Refineries in Design Phase
Deficit
- 972
Demand
3380
Processing
capacity
2408

46
46%
(4.6)
8%
(0.8)
20%
(2.0)
25%
(2.5)
Gas-chemical plants
LNG
Network
Electric Energy
Projects Under Implementation
+ Under Evaluation
US$ 9.9 billlion
Gas & Energy
46

47
Gas & Energy Investments
Projects Under Implementation
US$ 5.9 billion
Conversion of Natural Gas into fertilizers and
other gas chemical products: UFN III at Três
Lagoas (Mato Grosso do Sul)
Natural gas processing and transportation:
NGPU Cabiúnas (Rio de Janeiro)
Electric energy generation: Thermal Power
Plant Baixada Fluminense (Rio de Janeiro)
LNG Regasification: Bahia Terminal (Bahia)
Units in Design Phase: UFN IV (Espírito Santo)
and UFN V (Minas Gerais)
2013-2017 HIGHLIGHTS
Gas-chemical plants
LNG
Network
Electric Energy
43%
(2.6)
32%
(1.9)
19%
(1.1)
6%
(0.3)
Projects Under Evaluation
US$ 4.0 billion
12%
(0.5)
34%
(1.4) 51%
(2.0)
3%
(0.1)
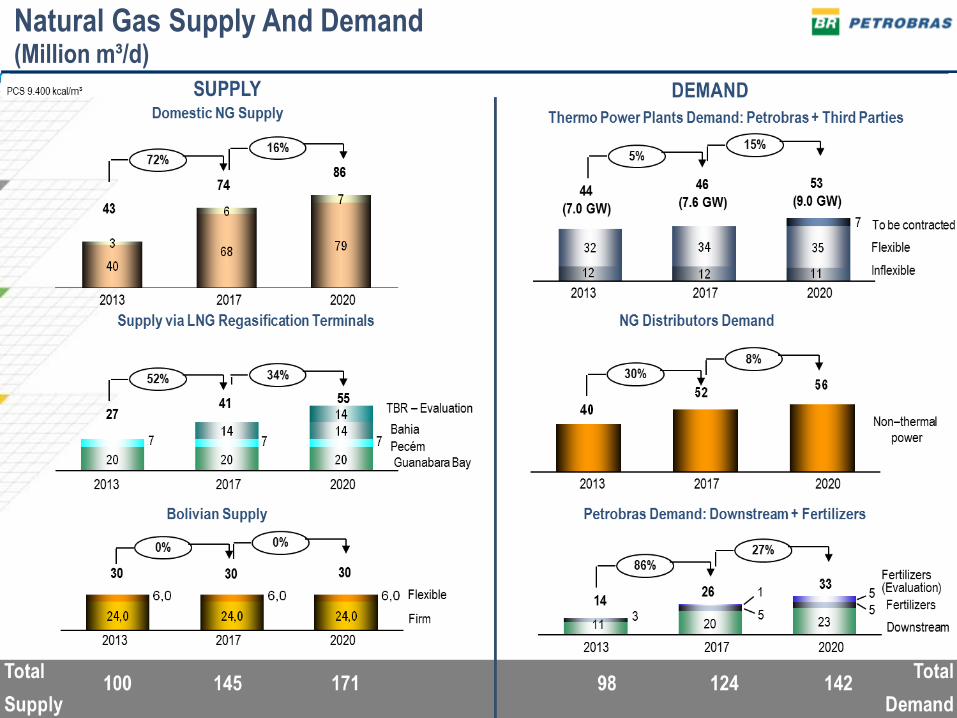
48
Natural Gas Supply And Demand (Million m³/d)
49
Financiability
49

50
Financial Planning Assumptions Financing analysis only incorporates projects under implementation
Main assumptions for cash flow generation and investment levels
2013-17 BMP is based on constant currencies from 2013.
Brent prices (US$/bbl) US$ 107 in 2013, declining to US$ 100 in the long term
Average exchange rate (R$/US$) R$ 2.00 in 2013, strengthening to R$ 1.85 in the long term
Leverage Limit: < 35% │ Maximum leverage in 2013 and 2014 (34%), declining after 2015
Net debt / EBITDA Limit : < 2.5x │ Limit will be surpassed in 2013 and will fall below 2.0x after 2015
Oil product prices in Brazil Convergence to international prices
Divestments US$ 9.9 billion
Returns on new E&P projects Pre-salt projects breakeven between US$ 40-45/barrel
Big post-salt projects have returns similar to pre-salt’s
No equity issuance Investment grade maintenance

51
Operating Cash Flow and Funding Needs
Divestments and restructurings
Cash utilization
Third-party resources (Debt)
Operating cash flow (after dividends)
Investments
Amortization
Additional financing needs will be funded exclusively through
new debt. No equity issuance is envisaged.
Free cash flow, before dividends, after 2015.
Annual borrowing needs (2013-2017)
Gross – US$ 12.3 billion │Net – US$ 4.3 billion
Net borrowing needs 50% below previous Plan due to:
• 2017 production, versus 2012, leading to higher
operating cash flows
• Declining downstream investments
• Long-term Brent prices (US$ 100 vs US$ 90 in the
previous Plan) and long-term F/X rate (R$ 1.85 vs R$
1.73)
US
$ B
illio
n
246.9
61.3
10.7 9.9
Fontes
165.0
Usos
207.1
39.8
246.9

52
Leverage
• Declining leverage, within the Company’s self-imposed limits
• Net Debt/EBITDA surpasses limit at some points in time, during the Plan period
BMP Target (< 35%)
2017 2016 2015 2014 2013 2017 2016 2015 2014 2013
Leverage Net Debt/EBITDA
BMP Target (< 2,5x)

53
The End