Peter Foster , Bob Wark , David Ryan , John Richardson · rectification works, ... The original...
12
ANCOLD Proceedings of Technical Groups 1 Damage to the Fairbairn Dam Spillway and Subsequent Analyses and Design of the Remedial Works Peter Foster 1 , Bob Wark 2 , David Ryan 3 , John Richardson 4 1 Principal Engineer (Dams), MWH, Wellington, New Zealand. 2 Technical Director-Dams, GHD, Perth, Western Australia. 3 Principal Engineer, SunWater, Brisbane, Queensland. 4 Consultant, SunWater, Brisbane, Queensland. Fairbairn Dam is a zoned embankment dam completed in 1972 and located in central Queensland near the town of Emerald. The spillway, which is located toward the left abutment, consists of a 168 metres wide concrete ogee crest, converging concrete chute and dissipater basin. The overall length from the ogee to the downstream end of the concrete spillway is approximately 195 m. The chute and dissipater basin are underlain by a matrix of longitudinal and transverse drains for pressure relief of the anchored concrete slabs. Minor repairs to damaged chute slabs were undertaken following the 2011 flood event. During these rectification works, large voids up to 0.3 metre in depth were found under sections of the concrete chute slabs as well as damage and blockage to the sub-surface drainage system. Discoloured water was also observed discharging from sections of the sub-surface drainage system. Some of the 24 mm diameter bars designed to anchor the slabs to the foundation were found to have corroded at the concrete/foundation interface and subsequent pull-out tests showed that the anchors had minimal or no structural capacity. These investigations led to a review of the hydraulic design of the spillway, upgrade to the sub-surface drainage system and apron slabs, and installation of replacement anchor bars. An understanding of the transmission of pressures and dynamic pressure coefficients resulting from spillway discharge and the effects of the hydraulic jump was an essential component of the design for the new anchor and drainage system. This paper provides detail on the investigations undertaken, the hydraulic modelling that is underway including physical hydraulic and computational fluid dynamics (CFD) and the design approach for what is described in this paper as the Stage 1 component of works. Keywords: Concrete spillway, Dynamic pressure coefficients, Anchors, Sub-surface drains . Introduction Fairbairn Dam, completed in 1972, is located in central Queensland near the town of Emerald. The embankment is of zoned earth construction, 828 metres in length with a maximum height of 44 metres and storage capacity of 1.3 million mega litres. The spillway, which is located toward the left abutment, consists of a 168 metres wide concrete ogee crest with a converging concrete chute and dissipater basin. The chute slabs extend downstream for approximately 75 metres and are underlain by a matrix of longitudinal and transverse drains for uplift pressure relief of the anchored chute slabs. The dissipater basin has an average width of 115 m and includes chute blocks and dentated end sill which are of similar arrangement to a Type III basin (USBR 1987). The overall length from the ogee to the downstream end of the spillway is approximately 195 m. A bridge spans the spillway at the location of the ogee crest to provide vehicle access along the crest of the embankment. Six piers support the bridge deck and are founded within the spillway crest monos. Figure 1 shows an overall view of the spillway and dissipater basin. Minor repairs to damaged chute slabs were undertaken following the 2011 flood event where up to 5.6 m depth of water flowed over the spillway. During these rectification works, it was reported that sections of the concrete slabs appeared to sound ‘drummy’ and discoloured water was discharging from some of the sub-surface drainage outlets. Additional inspections were undertaken using ground penetrating radar (GPR) and intrusive investigations (excavation and drilling). These investigations revealed large voids up to 0.3 metre in depth under sections of the concrete as well as damage and blockage to the sub-surface drainage system. Some of the 24 mm diameter bars that were designed to anchor the chute slabs to the foundation were exposed as part of the investigations. The majority had suffered corrosion at the concrete/foundation interface and pull-out tests on the exposed anchors indicated they had minimal structural capacity with some completely corroded at the interface. These investigations led to a review of the hydraulic design of the spillway including physical hydraulic and computational fluid dynamics (CFD) modelling, design upgrade of the chute and apron slabs, repairs to the sub-surface drain system and installation of replacement anchor bars. The first stage of the design is complete with the construction
Transcript of Peter Foster , Bob Wark , David Ryan , John Richardson · rectification works, ... The original...
ANCOLD Proceedings of Technical Groups 1
Damage to the Fairbairn Dam Spillway and Subsequent Analyses and Design of the Remedial Works
Peter Foster1, Bob Wark2, David Ryan3, John Richardson4 1Principal Engineer (Dams), MWH, Wellington, New Zealand.
2Technical Director-Dams, GHD, Perth, Western Australia.
3Principal Engineer, SunWater, Brisbane, Queensland.
4Consultant, SunWater, Brisbane, Queensland.
Fairbairn Dam is a zoned embankment dam completed in 1972 and located in central Queensland near the town
of Emerald. The spillway, which is located toward the left abutment, consists of a 168 metres wide concrete
ogee crest, converging concrete chute and dissipater basin. The overall length from the ogee to the downstream
end of the concrete spillway is approximately 195 m. The chute and dissipater basin are underlain by a matrix
of longitudinal and transverse drains for pressure relief of the anchored concrete slabs.
Minor repairs to damaged chute slabs were undertaken following the 2011 flood event. During these
rectification works, large voids up to 0.3 metre in depth were found under sections of the concrete chute slabs as
well as damage and blockage to the sub-surface drainage system. Discoloured water was also observed
discharging from sections of the sub-surface drainage system. Some of the 24 mm diameter bars designed to
anchor the slabs to the foundation were found to have corroded at the concrete/foundation interface and
subsequent pull-out tests showed that the anchors had minimal or no structural capacity.
These investigations led to a review of the hydraulic design of the spillway, upgrade to the sub-surface drainage
system and apron slabs, and installation of replacement anchor bars. An understanding of the transmission of
pressures and dynamic pressure coefficients resulting from spillway discharge and the effects of the hydraulic
jump was an essential component of the design for the new anchor and drainage system.
This paper provides detail on the investigations undertaken, the hydraulic modelling that is underway including
physical hydraulic and computational fluid dynamics (CFD) and the design approach for what is described in
this paper as the Stage 1 component of works.
Keywords: Concrete spillway, Dynamic pressure coefficients, Anchors, Sub-surface drains
.
Introduction
Fairbairn Dam, completed in 1972, is located in central Queensland near the town of Emerald. The embankment is of
zoned earth construction, 828 metres in length with a maximum height of 44 metres and storage capacity of 1.3 million
mega litres. The spillway, which is located toward the left abutment, consists of a 168 metres wide concrete ogee crest
with a converging concrete chute and dissipater basin. The chute slabs extend downstream for approximately 75 metres
and are underlain by a matrix of longitudinal and transverse drains for uplift pressure relief of the anchored chute slabs.
The dissipater basin has an average width of 115 m and includes chute blocks and dentated end sill which are of similar
arrangement to a Type III basin (USBR 1987). The overall length from the ogee to the downstream end of the spillway is
approximately 195 m. A bridge spans the spillway at the location of the ogee crest to provide vehicle access along the
crest of the embankment. Six piers support the bridge deck and are founded within the spillway crest monos. Figure 1
shows an overall view of the spillway and dissipater basin.
Minor repairs to damaged chute slabs were undertaken following the 2011 flood event where up to 5.6 m depth of water
flowed over the spillway. During these rectification works, it was reported that sections of the concrete slabs appeared to
sound ‘drummy’ and discoloured water was discharging from some of the sub-surface drainage outlets. Additional
inspections were undertaken using ground penetrating radar (GPR) and intrusive investigations (excavation and drilling).
These investigations revealed large voids up to 0.3 metre in depth under sections of the concrete as well as damage and
blockage to the sub-surface drainage system. Some of the 24 mm diameter bars that were designed to anchor the chute
slabs to the foundation were exposed as part of the investigations. The majority had suffered corrosion at the
concrete/foundation interface and pull-out tests on the exposed anchors indicated they had minimal structural capacity
with some completely corroded at the interface.
These investigations led to a review of the hydraulic design of the spillway including physical hydraulic and
computational fluid dynamics (CFD) modelling, design upgrade of the chute and apron slabs, repairs to the sub-surface
drain system and installation of replacement anchor bars. The first stage of the design is complete with the construction

2 Dams, a Lasting Legacy
planned for completion by the end of 2016. Second stage design is underway along with an intensive and ongoing
program of CFD and physical hydraulic modelling.
Figure 1: View of the Fairbairn Dam Spillway
The Original Design
The original design for the chute slabs could be described as a waffle slab type arrangement. The slabs include gravel
filter drains of nominal width 1.5 m and 150 mm thick that run parallel to the spillway flow. They are located on top of
the excavated foundation surface and are integral with the spillway slab. The concrete thickness above the filter section
was set at 300mm and these drains are separated by a 450 mm thick section that accommodates the spillway chute anchor
bars. The 450 mm section is nominally 0.9 m wide and includes a line of 25 mm anchor bars set 3 m into the foundation,
spaced at nominal 1.8 m centres.
The slabs are nominally 12 m in width with lengths of approximately 11.5 m. The upstream end of each slab includes a
cut-off type trench with a transverse drain located adjacent to the trench. Figure 2 shows a typical cross section view of a
spillway chute slab.
Figure 2: Cross Section View of spillway Chute Slab
Gravel Filter
Drains
Chute blocks (8.7 m long, 8.25 m
wide, max. height 4.3m)
Dentated end sill (max. height
4.3m)
300 mm dia. Longitudinal Drains

ANCOLD Proceedings of Technical Groups 3
Figure 3 shows a long section view of the spillway. The first stage of remedial works was directed to the 1H:2V section
of the spillway. This covers a length of approximately 36 m and width converging from 135 to 123 m nominal width with
a total surface area of around 4,600 m2.

4 Dams, a Lasting Legacy
Figure 3: Long Section of Spillway showing extent of Stage 1 Works
Seepage entering sub-surface gravel filter drainage system is captured by a series of open jointed earthenware pipes that
run transverse to the spillway flow and are located at Joints 2 to 8 inclusive (Refer Figure 3). These transverse pipes
intersect with the longitudinal pipes which exit on the vertical downstream face of the chute blocks as indicated in Figure
3. The dissipater basin, which extends from the chute blocks to the dentated end sill also contains a sub-surface drainage
system of similar arrangement to the chute blocks. These drains also exit at the vertical downstream face of the chute
blocks.
In order to contain the hydraulic jump, the stilling basin chute blocks and dentated end sill were sized to minimise the
energy of the water as it exited the stilling basin. Ten (10) chute blocks each with dimensions of 8.7 m length, 8.25 m
width and 4.3 m maximum height were constructed to assist with the containment of the hydraulic jump.
The Investigations and Scope of Works
The investigations included geotechnical drilling to assess the foundation conditions and ground penetrating radar (GPR)
to determine the extent of voids under the spillway chute slabs. The geotechnical investigations confirmed the weak
nature of the foundation material especially at the concrete to foundation interface where in some areas, the material
properties were more typical of a soil than rock. Using the GPR, a number of areas were identified where voids were
likely and twenty-five (25) cored holes were subsequently drilled to confirm the existence and extent of the potential
voids.
The findings from the investigations included:
Some of the earthen-ware pipes were broken and had collapsed (possibly even as a result of construction
activity);
Some pipes were blocked as a result of the gravel filter material being washed into the pipes;
Exposure and pull-out testing of ten (10) anchor bars showed that all bars failed to reach any reasonable load
capacity as a result of corrosion at the foundation/concrete interface and some had completely corroded at that
location. The corrosion was likely due to a combination of lack of protection of the anchor bar (black
reinforcing bar) at the concrete foundation interface and the corrosive nature of the water seeping through the
foundations. The conclusion from these tests was that there could be no confidence in any structural capacity of
the existing anchor bars in the 1V:2H section of the spillway.
The design team, which included experienced SunWater personnel and external consultants, undertook an assessment of
the scope of works and prioritised the works program taking into consideration the constraints of the annual wet season
and the requirement to maintain a functional spillway structure.
The scope of works adopted to repair the 1V:2H section of the chute slabs included:
Rectification of the transverse drainage;
Installation of a series of passive ground anchors that would resist the design uplift loads;
Installation of a reinforced concrete overlay to accommodate the new anchors.
The investigation and design undertaken for this component of work would then be used to plan for the following stages
of repair to the spillway. Survey of the drainage system and a review of all geotechnical data, both historic and current,
was undertaken to assist with an understanding of the foundation materials.
Stage 1 works on the 1V:2H section
of the Spillway Chute.
Exit point for sub-surface drainage
system in the vertical face of the
chute blocks

ANCOLD Proceedings of Technical Groups 5
The Foundation
The spillway is founded on relatively horizontal sedimentary rock of the Permian age. The dominant material at the site
is fine to medium grained sandstone interbedded with conglomerate, pebbly sandstone, siltstone and thin beds of coal.
Geological investigations at the time of construction showed there is a general dip of the bedding of less than 10 to the
north east (approximately downstream). Cross bedding dips in the sandstone range up to 200. Recent geotechnical
investigations undertaken as part of this Stage 1 works confirmed the general findings of the earlier investigations and
also noted that there is a variable interbedded sequence of arenite (sandstone) and siltstone. Bed thickness ranges from
thin laminations of less than 5 mm up to layers of 1 m to 2 m thick.
Distinct beds of conglomerate, gravel and carbonaceous material were identified in the most recently drilled boreholes.
Correlation of these beds between boreholes is possible in some instances, however the variability of their elevation and
presence indicates that these beds are likely to be laterally discontinuous as a result of the local migration of sedimentary
environments during deposition. The recent geotechnical investigations also suggest that the depth of weathering is
related to elevation. In the boreholes drilled upstream of the spillway, weathering in the foundation materials extends up
to 18 m depth. In the chute area, the weathering extends at least 10 m, reducing to 2 m depth in the area of the dissipater
basin.
In some areas, the upper section of the foundation has been described as dense to very dense un-cemented to weakly to
moderately cemented sand (a soil) underlain by rock (sandstone) ranging from very low to high strength. The
geotechnical drilling investigations in the dissipater basin area encountered artesian-like conditions (water rising above
ground level) at depths of around 12 m below ground level. These conditions were not unexpected given the geology of
the area.
Given the foundation properties in some areas are in geological terms a soil rather than rock and there is the potential for
artesian-type conditions within the foundation, it was important that such factors be considered in the determination of
anchor type and drilling methodology, depth of anchorage and arrangement of the anchor bars. Limitations on anchor
design loads and the decision to fully grout the anchor bars were adopted in the design criteria.
The Hydraulic Modelling
Both a physical hydraulic model and Computational Fluid Dynamics (CFD) model have been prepared in order to
provide data including pressures and pressure fluctuations on the spillway chute and within the dissipater basin.
For the CFD model, a three-dimensional geometry of the spillway structure and under-drainage network was constructed
using the ‘Ansys’ software package in order to create a suitable domain for the CFD analysis. A visual representation of
portion of the model showing the sub-surface drain system is shown in Figure 4.
Figure 4: CFD Graphical Representation of the Fairbairn Dissipater Basin
Sub-surface drain system
Exit point for sub-surface drainage
system in the vertical face of the
chute blocks

6 Dams, a Lasting Legacy
The CFD model features the following conditions:
Implicit unsteady transient simulation;
Eulerian multi-phase flow and K-Epsilon turbulence;
5 maximum inner iterations per solver time step (time steps of 0.01 sec).
The mesh that was generated for the modelling featured a variable cell size from 0.05 to 2 m and comprised
approximately 13.5 million cells depending on the design option being modelled. Prism meshing (inflation of the mesh
along wall boundaries) was utilised throughout the CFD model to ensure a sufficiently fine resolution at all solid
boundaries.
The physical hydraulic model has been constructed at SunWater’s hydraulic model laboratory in Rocklea, Brisbane. The
model is a three-dimensional fixed bed model of the spillway, including approach and discharge channel areas to ensure
the area is modelled as closely as possible to the real situation. The model scale is 1:50 and extends a minimum of 500 m
upstream and downstream of the spillway. In order to make the model as versatile as possible, 3D printing of the main
features within the model such as chute blocks and dentated end sill has been undertaken. The model will initially contain
the profile of the existing structure and then be adjusted to accommodate the overlay slab for both this stage and
subsequent stages of design hence the ability to remove sections such as chute blocks was an essential component in the
planning of the model.
The modelling also includes the strategic placement of approximately 50 pressure transducers, signal conditioning
analogue-digital conversion equipment and storage of the data for post processing and analysing. Static pressure is also
recorded on the spillway crest, chute and within the stilling basin. Pressures will also be recorded on both sides of the
spillway and at quarter points in the stilling basin in order to gain an understanding of the pressures across the full width
of the spillway. In the original hydraulic model SMEC (1970) 4 transducers were installed in stilling basin area. These
locations have been replicated in this latest model.
The CFD model has 50 pressure nodes positioned in the same locations as for the physical model. All pressure
transducers for the physical hydraulic model are located within the area defined by the 1H:2V slope of the spillway chute
and the stilling basin. The general layout is shown in Figure 5.
Figure 5: Layout of Pressure Transducers in the Physical Hydraulic and CFD Models
Chute Blocks
Dentated End Sill

ANCOLD Proceedings of Technical Groups 7
With the investigations undertaken on both models to date, there is a good comparison of results. These results indicate
that:
Pressure fluctuations are larger in areas immediately downstream of the chute blocks. As the location of the sub-
surface drain outlets is in this area, it would be advantageous to move these outlets to less turbulent areas;
The flow patterns between the chute blocks are more favourable to the location of the outlet drains and CFD
analyses is being used to optimise the outlet profile for the outlets. This will be confirmed in the physical
hydraulic model;
The chute blocks and dentated end sill appear to manage the hydraulic jump without sweep-out.
The design estimates for uplift loads on the spillway slabs appears to be conservative as this assumes an even distribution
of the uplift pressures over the spillway slabs. The CFD model indicates these high fluctuation pressure areas are more
likely to be concentrated immediately downstream of the chute blocks rather than over the entire area of the stilling
basin.
Further testing using both models is planned and the results will be used to compare with assumptions made for the
Stage-1 works and the design approach for the remaining stages.
The Design
The design stage was instigated to progress remedial works as soon as possible but within the constraints of the
Queensland wet seasons. Following a site inspection and workshop with participants from the design team and external
Technical Review Panel (TRP), a consensus was reached to secure the 1V:2H slope section of the spillway chute as first
priority as this section was identified as having the highest risk to the stability of the spillway and dam should a major
flood eventuate. Other sections of the spillway including the crest and dissipater basin would be upgraded in a staged
approach.
The normal design criteria for stilling basin design based on USBR practice has been to consider:
Uplift in the stilling basin as the difference in levels from the tailwater to the depth of water in the basin;
When the basin is dewatered, to check for any uplift persisting at the time compared with any tailwater
effects.
In addition to these load cases, additional forces were considered that related to the presence of dynamic uplift of the
concrete chute slabs due to severe pressure fluctuations that may enter the joints between the slabs or be injected back up
through the drainage system.
Research was undertaken of papers including Toso and Bowers (1988), Bellin and Fiorotto (1995), Fiorotto and Salandin
(2000) and Bollaert (2009) where investigations were undertaken of severe pressure fluctuations associated with energy
dissipation in hydraulic jumps. These studies looked at the probability distributions of the coincidence of low pressures
occurring on the top of the slabs combined with high pressure waves injected under the slabs through slab joints and
openings such as outlet pipes, resulting in a net pressure wave causing uplift under the slab. The magnitude of the uplift
and the forces in the anchors from the slabs into the foundation is affected by the anchor spacing, the size of the concrete
slabs and the persistence time of the pressure waves.
Fiorotto and Salandin (2000) suggested that the slab thickness could be determined using the equation:
s =
Where Ω is the dimensionless coefficient related to the spatial distribution of the pulsating pressure, Cp+ and Cp
- are the
positive and negative pressure coefficients, ϒ and ϒc are the specific weights of water and concrete. The Ω coefficient
depends on the slab thickness Ɩ1 and Ɩ2, the depth of the incident flow y and the integral scales in the longitudinal and
transverse directions I1 and I2.
Under normal circumstances with no water-stop or a single flexible water-stop at the concrete joint in a saturated
environment, the transmission of such pressures through the joints would seem feasible. However, for Fairbairn Dam the
design for repair works incorporated a new slab (overlay slab) on top of the existing slab which includes water-stops
along longitudinal joints that are offset from the joints in the existing slabs. The purpose of offsetting the joints was to
provide another line of defence against the ingress of pressures under the slab.

8 Dams, a Lasting Legacy
A 450 mm thick overlay slab was designed to accommodate the anchor head for the new anchor bars that extend deep
into the foundation. With the combination of a prepared bond surface to the top of the existing slab, the offset joints and
the double water-stop arrangement, it was considered that the transmission of transient pressures through joints will be
significantly dampened. The design also considered the outlets from the sub-surface drainage system. These pressures
could be from tailwater pressures or the peak pressures in spillway at the drainage outlets that exit on the downstream
vertical face of the chute blocks.
The actual pressures transmitted under the slabs are normally recognised as being a function of the elastic nature of the
anchors (acting as springs) plus the stiffness of the slabs. However nearly all the work researched to date has assumed a
rigid foundation. At Fairbairn Dam, the foundation is fairly soft and that condition would be expected to dampen the
transmission of any pressure waves.
These factors suggest that some reduction in the absolute margins of safety should be possible without significantly
endangering the performance of the works. Following discussions between the design team and the TRP, it was decided
that a more rational approach would be to use the information gained from the investigations of damage to the Karnafuli
Dam spillway which had an arrangement similar to Fairbairn. It was subsequently agreed that the model data that came
out of the Karnafuli studies would be the preferred methodology to determine the differential uplift on the 1H:2V chute
slabs at Fairbairn.
The Karnafuli Data
During construction of the Karnafuli hydroelectric project in east Pakistan in 1961, the spillway chute was severely
damaged from a flood event which had flows up to 123,000 cubic feet per second (cfs) (3,482 m3/s) over the spillway.
An investigation followed which included the construction of a physical hydraulic model that was used to replicate the
events leading up to the damage in the spillway. The results suggested that the fluctuating pressures above and below the
spillway slabs were the primary cause of failure. The overall arrangement of the spillway at Karnafuli is similar to that at
Fairbairn where the spillway chute directed flow to a stilling basin that included chute blocks and end sill. Discharges up
to 640,000 cfs (18,122 m3/s) were modelled and results indicated that differential pressures on the slabs in the order of 9
to 12 m could be expected.
For Fairbairn dam, the design flow of 17,800 m3/s was adopted which equated to the dam crest flood (DCF). Unit
discharges were used to correlate between the flows modelled for Karnafuli and those for Fairbairn. For the 1V:2H slope
on the Fairbairn spillway chute, the anchorage design for differential pressure on the chute slabs has evolved as the
design progressed and considered two procedures.
The initial design approach was based on the derivation values for Cp+ Cp
- and Ω values as described in papers by
Fiorotto, Rinaldo et al that aligned with the Karnafuli differentials and effectively gave a design uplift based on a
proportion of the velocity head. The differential uplift was to be resisted by a series of anchors consisting of 2xN40
bundled anchor bars distributed in a nominal grid of 1.7 m centres over the chute slab area. Up to 1,136 anchors 15 m in
depth would be required over the surface area of approximately 4,600 m2 for the 1V:2H section of the spillway chute.
These bars would be drilled perpendicular to the spillway chute slope in order to minimise the anchor length required.
Following a value engineering study, the design was modified to consider larger 75 mm diameter anchor bars (passive
anchors) drilled vertically into the foundation. The advantage in using the larger anchors resulted in a reduction to 538
anchors being required and by using vertical holes, the concern regarding alignment of the anchor hole and compliance
with tolerances on hole dimensions and profile was minimised.
The modified design adopted the Karnafuli approach where Pmax at the drain outlets was equivalent to tailwater
pressure. The average minimum pressure measured on the lower chute slabs for the 640,000 cfs discharge (18,122 m3/s)
at Karnafuli was 2.1 m above the slab surface. On the assumption that the tailwater level (TWL) minus the minimum
water level (pressure) recorded on the lower chute slabs is a function of the velocity head, the minimum pressure on the
1V:2H slabs at Fairbairn is estimated to be 2.8 m for the dam crest flood. For the Fairbairn lower chute slabs, the average
minimum pressure (Pmin) adopted was taken as an average value of 2.45 m. Transient pressure measurements for the
flow of 640,000cfs at Karnafuli measured a peak differential pressure of 72% of TWL-Pmin. As there were no
comparable transient pressures measured at Fairbairn, the Stage 1 design proceeded on the basis of 100% of TWL-Pmin.
The design uplift was assessed on the criteria of the greater value determined by:
1. 20% of the velocity head on the chute slab surface; OR
2. Tailwater level minus Pmin, where Pmin is adopted as being 2.45 m above the chute slab surface on the 1H:2V
slope section of the spillway.
The use of the 20% velocity head criteria is based on methodology described by McLellan (1976) where it was suggested
that up to 20% of the velocity head could be converted to pressure head and transmitted to the underside of the chute
slab. The design criterion was applied to sections downstream of the spillway and a table developed to determine the

ANCOLD Proceedings of Technical Groups 9
uplift pressures at critical locations along the length of the spillway. An extract of the table used in the design process is
included as Table 1 below. The values are based on the design flood of 17,800 m3/s with a corresponding tailwater level
of EL 195.4 m AHD.
Table 1: Design Uplift Loads (Spillway Discharge 17,800 m3/s)
Distance
from Ogee
Crest (m)
Spillway
Floor Level
(m AHD)
Water
Surface Level
(m AHD)
Velocity
(m/s)
Velocity
Head
(m)
Uplift =
0.2V2/2g
(m)
Tailwater –
(floor level
+ 2.45m)
Design
Uplift (m)
15 (Jt2) 197.41 203.8 17.9 16.34 3.27 N/A 3.27
25 (Jt3) 196.41 202.9 18.4 17.21 3.44 N/A 3.44
40 (Jt4) 194.41 200.9 19.3 19.07 3.81 N/A 3.81
55 (Jt6) 190.14 196.3 21.5 23.5 4.70 2.81 4.70
65 (Jt7) 185.14 190.9 23.7 28.73 5.75 7.81 7.81
75 (Jt8) 180.14 185.7 25.7 33.78 6.76 12.81 12.81
90 (Jt9) 173.45 178.9 28.1 40.28 8.06 19.5 19.5 Note:
Jt2, Jt3 etc. refer to the joint locations as shown on Figure 3.
1V:2H slope starts at Jt6
Dynamic/Fatigue Effects
Investigations included the possibility of anchor load fluctuations caused by the dynamic pressure waves that could lead
to fatigue failure of the anchor bar. The original model study showed a dominance of the pressure wave frequencies in
the range of 0 to 1 Hz which is similar to the data recorded in the Karnafuli model. At one (1) Hz, there are
approximately 100,000 cycles per day. A review of the hydrology suggested that the peak flow rates are unlikely to
generate more than 400 thousand cycles at the peak flow rates.
Research on the fatigue strength limits of anchor bars (NCHRP 2011) showed that in the cycle range of 70 to 80% of the
0.1% proof load, the bars did not fail after 2 million cycles. Three fatigue tests on a 32 mm bar tendon with 2 million
stress cycles in the range of 66 to 74% of the 0.1% proof load at 10 Hz indicated no fatigue failure was observed in the
anchorage components and no loss of tensile element cross section. These bars were tested in the range of 550 to 580
MPa. With the design stress limit of around 200 MPa for the anchor bars, it is expected that the fatigue resistance will be
well within the limits of the capacity of the bar.
Anchor Bar Design and Installation
Post tensioned anchors were initially considered for the Stage 1 works however given the weak nature of the foundation
and the location of the anchors, it would be difficult to monitor the condition and retained load in the anchor. Any applied
loads to the post tensioned anchor would also need to be limited so that they do not overstress the foundation.
Consequently, passive anchors were used in the design.
Two grades of passive anchor bar were considered, a grade 500 and grade 1030 bar. Both bars are threaded for their full
length which allows ease of connectivity to couplers and end plates for the various anchor lengths required. As the design
limits the stress in the bar to around 200 MPa, a grade 500 bar was chosen for both practicality and economy. The bars
are fully grouted with a de-bonded length of 2 m below the chute slab to allow the strain in the bar to 0.1% or a
displacement of 2 mm to develop the anchor load. In order to secure the anchor bar to the overlay slab, an anchor head
comprising a 500 mm square plate 70 mm thick was designed. This was located toward the upper face of the 450 mm
thick overlay slab and tied to the upper layer of reinforcement. A bearing pressure under design load of 3.6 MPa was
determined under the plate which is well within the capacity of the concrete. Figure 6 shows a typical detail of the
anchor head arrangement.
Depending on the location down the 1V:2H spillway slope, the anchor bar lengths varied from 12 to 16 and 22 m in
length. A total of 538 anchor bars with a total length of 9,800 m of anchor bar was designed for the 1V:2H slope section.
For the installation of the anchor bars, one of the areas that has been seen as the most problematic is the very low strength
of the rock in the areas under the chute. The rock layers have deteriorated to soil strength particularly in the higher
elevations and the ensuring adequate bond strength was a major component of design.
The rock in the foundation weathers on exposure to the atmosphere and the concern with the drilling for the anchor bars
is that should this exposure be more than a few hours, the weaker sections of the anchor hole may deteriorate and the
bond strength could be compromised.

10 Dams, a Lasting Legacy
The specifications included the requirement that the drilling of anchor holes is to follow a fairly rigid procedure including
water-testing and water-proof grouting of the anchor holes before they are accepted for installation of the anchor
arrangement. Where artesian-type conditions are found, pressure grouting was specified but limited to ensure jacking of
the foundations was avoided. Hammer drill with air was used in order to avoid excessive amounts of water used in the
anchor installation process.
The anchor bars are also double corrosion protected to provide another level of resistance against corrosion. The
corrugated sheathing used in the installation arrangement has been extended up into the overlay slab so as to reduce the
potential for seepage and water contact with the anchor bar.
Figure 6 shows the anchor bar and anchor head arrangement. Eight 32 mm diameter hooked ‘reid-bars’ connect the 500
mm x 500 mm x 70 mm thick anchor plate to the upper layer of steel in the overlay slab.
Figure 6: Typical Anchor Head Arrangement for the 1V:2H Slope Section of the Spillway
The Overlay Slab
The design of the overlay slab was based on yield line analysis of the one-way slab action and the yield strength of the
existing slabs was estimated to be 4.5 m head for uplift loads. The allowable load based on 60% yield is 2.7 m. This
capacity would be supplemented by both the new anchor system and the overlay slab required to accommodate the
anchor head.
The overlay slab is designed to be placed continuously using slip-form for the full length of the 1V:2H slope (excluding
the area around the chute blocks) similar to concrete faced dam techniques. The slabs will be of similar width to the
existing slabs but the joints offset such that each overlay slab sits centrally over the longitudinal joints in the existing
slabs.
ANCOLD Proceedings of Technical Groups 11
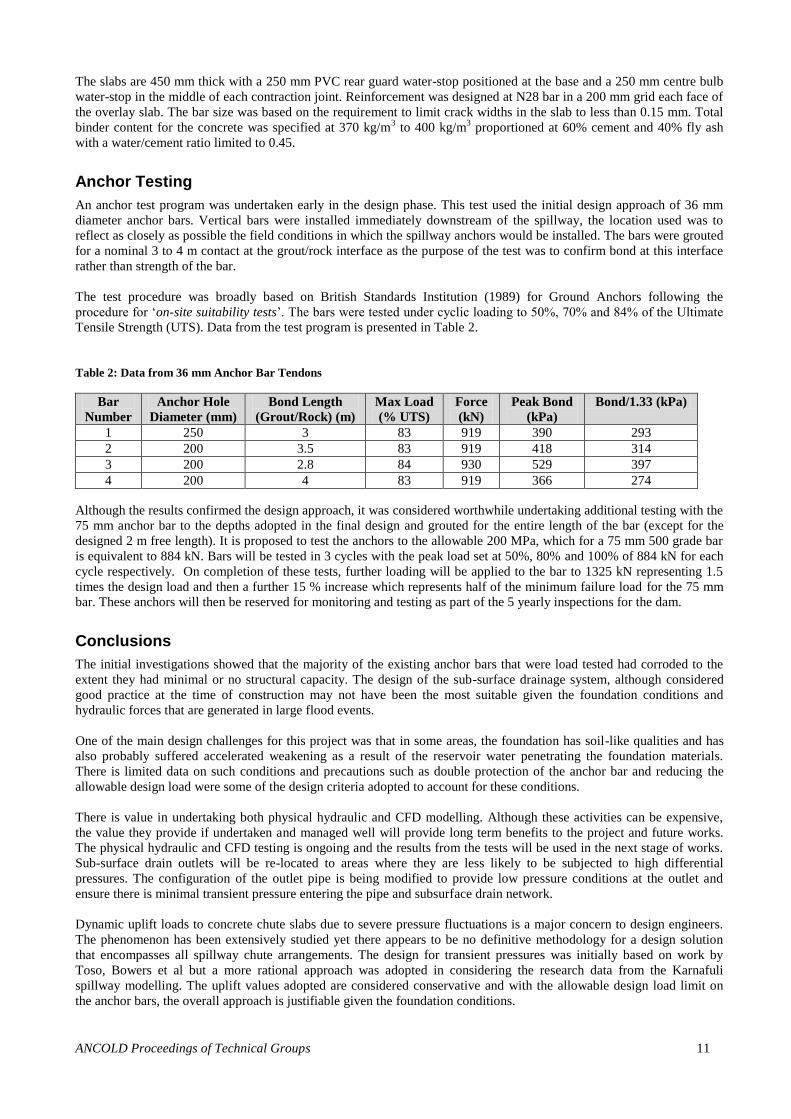
The slabs are 450 mm thick with a 250 mm PVC rear guard water-stop positioned at the base and a 250 mm centre bulb
water-stop in the middle of each contraction joint. Reinforcement was designed at N28 bar in a 200 mm grid each face of
the overlay slab. The bar size was based on the requirement to limit crack widths in the slab to less than 0.15 mm. Total
binder content for the concrete was specified at 370 kg/m3 to 400 kg/m
3 proportioned at 60% cement and 40% fly ash
with a water/cement ratio limited to 0.45.
Anchor Testing
An anchor test program was undertaken early in the design phase. This test used the initial design approach of 36 mm
diameter anchor bars. Vertical bars were installed immediately downstream of the spillway, the location used was to
reflect as closely as possible the field conditions in which the spillway anchors would be installed. The bars were grouted
for a nominal 3 to 4 m contact at the grout/rock interface as the purpose of the test was to confirm bond at this interface
rather than strength of the bar.
The test procedure was broadly based on British Standards Institution (1989) for Ground Anchors following the
procedure for ‘on-site suitability tests’. The bars were tested under cyclic loading to 50%, 70% and 84% of the Ultimate
Tensile Strength (UTS). Data from the test program is presented in Table 2.
Table 2: Data from 36 mm Anchor Bar Tendons
Bar
Number
Anchor Hole
Diameter (mm)
Bond Length
(Grout/Rock) (m)
Max Load
(% UTS)
Force
(kN)
Peak Bond
(kPa)
Bond/1.33 (kPa)
1 250 3 83 919 390 293
2 200 3.5 83 919 418 314
3 200 2.8 84 930 529 397
4 200 4 83 919 366 274
Although the results confirmed the design approach, it was considered worthwhile undertaking additional testing with the
75 mm anchor bar to the depths adopted in the final design and grouted for the entire length of the bar (except for the
designed 2 m free length). It is proposed to test the anchors to the allowable 200 MPa, which for a 75 mm 500 grade bar
is equivalent to 884 kN. Bars will be tested in 3 cycles with the peak load set at 50%, 80% and 100% of 884 kN for each
cycle respectively. On completion of these tests, further loading will be applied to the bar to 1325 kN representing 1.5
times the design load and then a further 15 % increase which represents half of the minimum failure load for the 75 mm
bar. These anchors will then be reserved for monitoring and testing as part of the 5 yearly inspections for the dam.
Conclusions
The initial investigations showed that the majority of the existing anchor bars that were load tested had corroded to the
extent they had minimal or no structural capacity. The design of the sub-surface drainage system, although considered
good practice at the time of construction may not have been the most suitable given the foundation conditions and
hydraulic forces that are generated in large flood events.
One of the main design challenges for this project was that in some areas, the foundation has soil-like qualities and has
also probably suffered accelerated weakening as a result of the reservoir water penetrating the foundation materials.
There is limited data on such conditions and precautions such as double protection of the anchor bar and reducing the
allowable design load were some of the design criteria adopted to account for these conditions.
There is value in undertaking both physical hydraulic and CFD modelling. Although these activities can be expensive,
the value they provide if undertaken and managed well will provide long term benefits to the project and future works.
The physical hydraulic and CFD testing is ongoing and the results from the tests will be used in the next stage of works.
Sub-surface drain outlets will be re-located to areas where they are less likely to be subjected to high differential
pressures. The configuration of the outlet pipe is being modified to provide low pressure conditions at the outlet and
ensure there is minimal transient pressure entering the pipe and subsurface drain network.
Dynamic uplift loads to concrete chute slabs due to severe pressure fluctuations is a major concern to design engineers.
The phenomenon has been extensively studied yet there appears to be no definitive methodology for a design solution
that encompasses all spillway chute arrangements. The design for transient pressures was initially based on work by
Toso, Bowers et al but a more rational approach was adopted in considering the research data from the Karnafuli
spillway modelling. The uplift values adopted are considered conservative and with the allowable design load limit on
the anchor bars, the overall approach is justifiable given the foundation conditions.

12 Dams, a Lasting Legacy
The drilling program which incorporates water-proof grouting of the hole and double protection of the anchor bar will
provide armouring to the anchor that is more robust than the previous arrangement. A program of ongoing testing of the
anchor bars used in the test program will provide valuable information on the integrity of the anchor bars in the spillway
slabs. The monitoring of these test anchors will be incorporated into the five yearly comprehensive inspection at the dam.
The design for Stage 1 is complete. The specifications have been prepared and construction of the first stage of works is
due for completion by the end of 2016. As with these types of projects, not only is the design solution a critical
component, but equally is the construction approach and the rigour in compliance with the design and specifications.
Acknowledgements
This project was undertaken and managed by SunWater with input from external consultants Peter Foster, MWH New
Zealand and Bob Wark, GHD, Perth who were engaged to assist SunWater with the task of identifying the most practical
solution for the project. Sincere thanks is extended to all involved including the members of the TRP who not only
challenged the design, but encouraged the design team to investigate alternatives to design solutions.
References
1. Bellin, A., and Fiorotto, V. (1995). ‘Direct Dynamic Force Measurement on Slabs in Spillway Stilling Basins.’
Journal of Hydraulic Engineering., ASCE 121(10), 686-693.
2. Bollaert, E.F.R. (2009). ‘Dynamic Uplift of Concrete Linings: Theory and Case Studies.’ 29th
Annual USSD
Conference Nashville, Tennessee, April 2009.
3. Bowers, C.E., Tsai, F.Y., and Khua, R.M. (1964). ‘Hydraulic Studies of the Spillway of the Karnafuli
Hydroelectric Project, East Pakistan.’ University of Minnesota, Project Report No. 73.
4. British Standards Institution (1989). ‘British Standard Code of Practice for Ground Anchors.’ British Standards
Institution, BS 8081:1989.
5. Fiorotto, V. and Salandin, P. (2000). ‘Design of Anchored Slabs in Spillway Stilling Basins.’ Journal of
Hydraulic Engineering., ASCE 126(7), 502-512.
6. McLellan, G. (1976). ‘Chute Spillway Sub-drainage and Anchorage.’ Commission Internationale Des Grands
Barrages.
7. NCHRP (2011). ‘Design of Concrete Structures Using High-Strength Steel Reinforcement.’ Report 679,
National Cooperative Highway Research Program, Transportation Research Board, Washington, D.C. 2011.
8. Snowy Mountains Hydro-Electric Authority (SMEC). (1970). ‘Fairbairn Dam Spillway Model Study.’ SMEC,
February 1970.
9. Snowy Mountains Hydro-Electric Authority (SMEC). (1974). ‘Fairbairn Dam Design Report.’ SMEC, August
1974.
10. Soltani, A., Harries, K.A., Shahrooz, B.M., Russell, H.G., Miller, R.A. (2012). ‘Fatigue Performance of High-
Strength Reinforcing Steel’, Journal of Bridge Engineering, ASCE, June 2012.
11. SunWater (2009). ‘Fairbairn Dam Comprehensive Risk Assessment.’ SunWater, November 2009 (Hb #
881752).
12. Toso, J.W., and Bowers, C.E. (1988). ‘Extreme Pressures in Hydraulic Jump Stilling Basins.’ Journal of
Hydraulic Engineering., ASCE, 114(8), 829-843.
13. USBR (1987). ‘Design of Small Dams.’ United States Department of the Interior, Bureau of Reclamation,
Denver, Colorado.