Peter Damoah-Afari, Xiao-li Ding, Zhong Lu, Zhiwei Li and...
21
Magnitude and Extent of Six Years of Land Subsidence in Shanghai Revealed by JERS-1 SAR Data 477 X Magnitude and Extent of Six Years of Land Subsidence in Shanghai Revealed by JERS-1 SAR Data 1 Peter Damoah-Afari, 2 Xiao-li Ding, 3 Zhong Lu, 4 Zhiwei Li and 5 Makoto Omura 1,2 The Hong Kong Polytechnic University, Hong Kong 3 U.S Geological Survey, USA 4 Central South University, China 5 Kochi Women’s University, Japan 1. Introduction Many provinces in China including Shanghai, Tianjin, Jiansu, Hubei, Hangzhou, Suzhou, Changzhou, Cangzhou, and Jianxing (Deng and Ju, 1994; Ding et al., 2005; Hu et al., 2004; Xue et al., 2005; Yang et al., 2005) are subsiding owing to rapid development and urbanization. The cause identified with these subsidence phenomena has been mainly due to excessive withdrawal of groundwater (Chai et al., 2004; Shi and Bao, 1984; Xue et al., 2005; Yang et al., 2005). The subsidence phenomenon in China occurs mostly in medium-seized and large cities with common characteristics of being slow, accumulative and irreversible (Xue et al., 2005). At least, 45 cities and municipalities (China Daily, 2003b; Deng and Ju, 1994; Hu et al., 2004) are experiencing this geological problem owing to massive exploitation of underground water to meet the needs of the rapid evolving industries and urbanisation. In the case of Shanghai, the massive construction of high-rise buildings in the downtown area has also contributed to the subsidence problem (China Daily, 2003b; Zhang et al., 2002). About 11 cities, including Shanghai, have recorded accumulative subsidence values exceeding 1 m at their subsidence centres (Hu et al., 2004; Yang et al., 2005; Zhang et al., 2002). The most affected cities, since the early 1900s, are Shanghai, Tianjin and Taiyuan, with each of them having accumulative subsidence value greater than 2m (China Daily, 2003b). The Chinese government has spent billions of Yuan (RMB$), as direct and indirect economic costs, in addressing land subsidence problems in China. Hu et al. (2004) mentioned that the estimated total economic loss due to land subsidence in Tianjin is RMB$189.6 billion. In the three areas of Suzhou, Wuxi and Changzhou, the total economic loss is estimated at RMB$46.87 billion (Yang et al., 2005). For Shanghai, the China Daily (2003b) and Yang et al. (2005) quoted the total economic losses of about RMB$290 billion, in the last 40 years, due to land subsidence and its related problems. 25 www.intechopen.com
Transcript of Peter Damoah-Afari, Xiao-li Ding, Zhong Lu, Zhiwei Li and...

Magnitude and Extent of Six Years of Land Subsidence in Shanghai Revealed by JERS-1 SAR Data 477
Magnitude and Extent of Six Years of Land Subsidence in Shanghai Revealed by JERS-1 SAR Data
Peter Damoah-Afari, Xiao-li Ding, Zhong Lu, Zhiwei Li and Makoto Omura
X
Magnitude and Extent of Six Years of Land Subsidence in Shanghai Revealed by
JERS-1 SAR Data
1Peter Damoah-Afari, 2Xiao-li Ding, 3Zhong Lu, 4Zhiwei Li and 5Makoto Omura
1,2The Hong Kong Polytechnic University, Hong Kong 3U.S Geological Survey, USA
4Central South University, China 5 Kochi Women’s University, Japan
1. Introduction
Many provinces in China including Shanghai, Tianjin, Jiansu, Hubei, Hangzhou, Suzhou, Changzhou, Cangzhou, and Jianxing (Deng and Ju, 1994; Ding et al., 2005; Hu et al., 2004; Xue et al., 2005; Yang et al., 2005) are subsiding owing to rapid development and urbanization. The cause identified with these subsidence phenomena has been mainly due to excessive withdrawal of groundwater (Chai et al., 2004; Shi and Bao, 1984; Xue et al., 2005; Yang et al., 2005). The subsidence phenomenon in China occurs mostly in medium-seized and large cities with common characteristics of being slow, accumulative and irreversible (Xue et al., 2005). At least, 45 cities and municipalities (China Daily, 2003b; Deng and Ju, 1994; Hu et al., 2004) are experiencing this geological problem owing to massive exploitation of underground water to meet the needs of the rapid evolving industries and urbanisation. In the case of Shanghai, the massive construction of high-rise buildings in the downtown area has also contributed to the subsidence problem (China Daily, 2003b; Zhang et al., 2002). About 11 cities, including Shanghai, have recorded accumulative subsidence values exceeding 1 m at their subsidence centres (Hu et al., 2004; Yang et al., 2005; Zhang et al., 2002). The most affected cities, since the early 1900s, are Shanghai, Tianjin and Taiyuan, with each of them having accumulative subsidence value greater than 2m (China Daily, 2003b). The Chinese government has spent billions of Yuan (RMB$), as direct and indirect economic costs, in addressing land subsidence problems in China. Hu et al. (2004) mentioned that the estimated total economic loss due to land subsidence in Tianjin is RMB$189.6 billion. In the three areas of Suzhou, Wuxi and Changzhou, the total economic loss is estimated at RMB$46.87 billion (Yang et al., 2005). For Shanghai, the China Daily (2003b) and Yang et al. (2005) quoted the total economic losses of about RMB$290 billion, in the last 40 years, due to land subsidence and its related problems.
25
www.intechopen.com

Geoscience and Remote Sensing, New Achievements478
The city of Shanghai has been experiencing land subsidence mainly due to anthropogenic induced factors: (1) intensive exploitation of ground water (Chai et al., 2004; China Daily, 2003a; 2003b; Hu et al., 2004; Shi and Bao, 1984; Xue et al. 2005; Zhang et al., 2002), and (2) massive construction of high-rise buildings in the downtown area (China Daily, 2003a; 2003b; Gong et al., 2005; Xue et al. 2005; Zhang and Wei, 2005; Zhang et al., 2002). It is estimated that the high-rise buildings contribute about 30 to 40 per cent of the subsidence problem. According to Gong et al. (2005), there exist about 7000 high-rise buildings with different altitudes (storeys) in Shanghai; additional 2000 high-rise buildings are yet to be built. They provided the height distribution of high-rise buildings in Shanghai as follows: 53% have 9-17 storeys, 31% have 18-24 storeys, 11% have 25-30 storeys, and 5% have over 30 storeys. Results of dynamic monitoring indicates that, the city centre subsided by 36 mm between 1986 and 1990, 53.8 mm between 1991 and 1995, and 98.8 mm between 1996 and 2000 (Zhang and Wei, 2005). To support the assertion that the concentration of high-rise buildings have contributed to the subsidence problem in Shanghai, the China Daily, 11 December 2003 Edition, added that the Pudong New Area, which houses 1.4 million people in a 520 square-kilometre area, suffers most from severe subsidence.
Fig. 1. Historical development of land subsidence in Shanghai from 1921-2000 (source: Zhang et al., 2002) The problem of land subsidence in Shanghai was first reported in 1921 (Shi and Bao, 1984), and the problem continued till 1963 when its impact became more severe. A cumulative subsidence value of 2.63 m was observed with greatest subsidence occurring between 1956 and 1959, at an annual rate of 98 mm. The historical development of land subsidence in Shanghai at 6 epochs during the period 1921-2000 is provided in Figure 1. In 1963, some
measures such as restriction and rational usage of ground water, artificial recharge of ground water, and adjustment of exploited aquifers (Deng and Ju, 1994; Shi and Bao, 1984), were put in place to check the subsidence problem. The enforcement of those measures resulted in considerable rebound of water level between 1963 and 1965. The Shanghai Municipal Government in 1995 came out with another policy that limited the usage of underground water of the whole city to less than 10 million cubic meters per year, and also demanded that all deep wells in the city are to operate with official permits (China Daily, 2003a; Xue et al., 2005). In spite of these measures, Shanghai is still experiencing some degree of subsidence (China Daily, 2003a; Xue et al., 2005). The average land subsidence rates, gathered from Shanghai Geological Survey Institute are 12.12 mm in 2000, 10.94 mm in 2001, and 10.22 mm in 2002 (China Daily, 2003a), and the targeted land subsidence rates as perceived by the Shanghai Municipal Land and Resources Administration Bureau are at most 10 mm by 2005 and 5 mm by 2010 (Zhang and Wei, 2005). Subsidence phenomenon in Shanghai has been previously measured or monitored using the surveyor’s method of precise levelling, and more recently the global positioning system (GPS). Although these methods provide precise measurements they are labour and time intensive, costly and are restricted to specific points in the terrain. They cannot therefore be used to provide information on detailed ground motions if the area of ground subsidence is large. Interferometric synthetic aperture radar (InSAR), a space geodetic method, has demonstrated the capability of mapping extensive areas, on pixel-by-pixel basis, and in a more convenient manner than the aforementioned geodetic methods. InSAR is capable of detecting ground surface elevation changes with very high precisions (Bürgmann et al., 2000; Gabriel et al., 1989; Zebker et al., 1997). Chen et al. (2000) argued that InSAR is presently the only technology capable of monitoring the deformation of the Earth’s surface in a large area with dense points, quickly and cost-effective, in day and night under all weather conditions. In this paper, we present results of using the L-Band Japanese Earth Resource Satellite 1 (JERS-1) SAR data to map the extent and magnitue of land subsidence in Shanghai with the differential interferometric synthetic aperture radar (DInSAR) technique. The choice of L-Band JERS-1 SAR data over the C-Band Earth Resources Satellite 1 and 2 (ERS-1/2) SAR data was based on analysis made using appropriate SAR parameters, and results obtained from coherence analysis performed using both the C-band and L-band SAR data over a section of Shanghai. The JERS-1 SAR has a longer wavelength, and hence a larger critical baseline, than the ERS-1/2 SAR. In addition, L-band SAR can penetrate vegetation to retrieve ground-surface, making it superior to C-band ERS SAR for mapping vegetated areas or low coherence areas such as Shanghai.
2. Coherence Analysis
Coherence which is a measure to check the quality of an interferogram is degraded from three different sources, namely spatial, thermal, and temporal decorrelations (Zebker and Villasenor, 1992; Zebker et al., 1992). Decorrelation significantly affects the accuracy of InSAR measurements (Zebker and Villasenor, 1992; Zebker et al., 1992), and it is a common problem associated with the repeat-pass InSAR technique as a result of discrepancies that
www.intechopen.com

Magnitude and Extent of Six Years of Land Subsidence in Shanghai Revealed by JERS-1 SAR Data 479
The city of Shanghai has been experiencing land subsidence mainly due to anthropogenic induced factors: (1) intensive exploitation of ground water (Chai et al., 2004; China Daily, 2003a; 2003b; Hu et al., 2004; Shi and Bao, 1984; Xue et al. 2005; Zhang et al., 2002), and (2) massive construction of high-rise buildings in the downtown area (China Daily, 2003a; 2003b; Gong et al., 2005; Xue et al. 2005; Zhang and Wei, 2005; Zhang et al., 2002). It is estimated that the high-rise buildings contribute about 30 to 40 per cent of the subsidence problem. According to Gong et al. (2005), there exist about 7000 high-rise buildings with different altitudes (storeys) in Shanghai; additional 2000 high-rise buildings are yet to be built. They provided the height distribution of high-rise buildings in Shanghai as follows: 53% have 9-17 storeys, 31% have 18-24 storeys, 11% have 25-30 storeys, and 5% have over 30 storeys. Results of dynamic monitoring indicates that, the city centre subsided by 36 mm between 1986 and 1990, 53.8 mm between 1991 and 1995, and 98.8 mm between 1996 and 2000 (Zhang and Wei, 2005). To support the assertion that the concentration of high-rise buildings have contributed to the subsidence problem in Shanghai, the China Daily, 11 December 2003 Edition, added that the Pudong New Area, which houses 1.4 million people in a 520 square-kilometre area, suffers most from severe subsidence.
Fig. 1. Historical development of land subsidence in Shanghai from 1921-2000 (source: Zhang et al., 2002) The problem of land subsidence in Shanghai was first reported in 1921 (Shi and Bao, 1984), and the problem continued till 1963 when its impact became more severe. A cumulative subsidence value of 2.63 m was observed with greatest subsidence occurring between 1956 and 1959, at an annual rate of 98 mm. The historical development of land subsidence in Shanghai at 6 epochs during the period 1921-2000 is provided in Figure 1. In 1963, some
measures such as restriction and rational usage of ground water, artificial recharge of ground water, and adjustment of exploited aquifers (Deng and Ju, 1994; Shi and Bao, 1984), were put in place to check the subsidence problem. The enforcement of those measures resulted in considerable rebound of water level between 1963 and 1965. The Shanghai Municipal Government in 1995 came out with another policy that limited the usage of underground water of the whole city to less than 10 million cubic meters per year, and also demanded that all deep wells in the city are to operate with official permits (China Daily, 2003a; Xue et al., 2005). In spite of these measures, Shanghai is still experiencing some degree of subsidence (China Daily, 2003a; Xue et al., 2005). The average land subsidence rates, gathered from Shanghai Geological Survey Institute are 12.12 mm in 2000, 10.94 mm in 2001, and 10.22 mm in 2002 (China Daily, 2003a), and the targeted land subsidence rates as perceived by the Shanghai Municipal Land and Resources Administration Bureau are at most 10 mm by 2005 and 5 mm by 2010 (Zhang and Wei, 2005). Subsidence phenomenon in Shanghai has been previously measured or monitored using the surveyor’s method of precise levelling, and more recently the global positioning system (GPS). Although these methods provide precise measurements they are labour and time intensive, costly and are restricted to specific points in the terrain. They cannot therefore be used to provide information on detailed ground motions if the area of ground subsidence is large. Interferometric synthetic aperture radar (InSAR), a space geodetic method, has demonstrated the capability of mapping extensive areas, on pixel-by-pixel basis, and in a more convenient manner than the aforementioned geodetic methods. InSAR is capable of detecting ground surface elevation changes with very high precisions (Bürgmann et al., 2000; Gabriel et al., 1989; Zebker et al., 1997). Chen et al. (2000) argued that InSAR is presently the only technology capable of monitoring the deformation of the Earth’s surface in a large area with dense points, quickly and cost-effective, in day and night under all weather conditions. In this paper, we present results of using the L-Band Japanese Earth Resource Satellite 1 (JERS-1) SAR data to map the extent and magnitue of land subsidence in Shanghai with the differential interferometric synthetic aperture radar (DInSAR) technique. The choice of L-Band JERS-1 SAR data over the C-Band Earth Resources Satellite 1 and 2 (ERS-1/2) SAR data was based on analysis made using appropriate SAR parameters, and results obtained from coherence analysis performed using both the C-band and L-band SAR data over a section of Shanghai. The JERS-1 SAR has a longer wavelength, and hence a larger critical baseline, than the ERS-1/2 SAR. In addition, L-band SAR can penetrate vegetation to retrieve ground-surface, making it superior to C-band ERS SAR for mapping vegetated areas or low coherence areas such as Shanghai.
2. Coherence Analysis
Coherence which is a measure to check the quality of an interferogram is degraded from three different sources, namely spatial, thermal, and temporal decorrelations (Zebker and Villasenor, 1992; Zebker et al., 1992). Decorrelation significantly affects the accuracy of InSAR measurements (Zebker and Villasenor, 1992; Zebker et al., 1992), and it is a common problem associated with the repeat-pass InSAR technique as a result of discrepancies that
www.intechopen.com

Geoscience and Remote Sensing, New Achievements480
arise between two related SAR signals over same location at different epochs. It is therefore necessary to assess the temporal coherence situation of scatterers prior to any serious studies involving the use of InSAR techniques. Temporal decorrelation occurs when scatterers change their behaviors over time. It is one of the major problems that affect interferograms covering Shanghai metropolis. Studies conducted by Ding et al. (2005), Damoah-Afari et al. (2007) and Damoah-Afari et al. (2008) show that coherence is not maintained in Shanghai metropolis after a period of about 10 months with the C-band ERS-1/2 SAR data. Therefore, it is problematic to use ERS-1/2 SAR data with long temporal baselines to monitor land subsidence characterized by very slow movement, as in the case of Shanghai. Coherence analysis was performed in a section of Shanghai covering the downtown area where the problem of land subsidence is severe in order to assess the behaviour of scatterers in Shanghai over time. The region of interest selected for coherence analysis spans approximately 9 km in azimuth direction and 8 km in range direction. The coherence analysis was also performed to assess which of the SAR data, either the C-band or the L-band, would be suitable for mapping the subsidence phenomena in Shanghai. Figure 2 shows both the region of interest selected for the entire study and the coherence analysis using ERS-2 SAR amplitude image of Shanghai acquired on 31 March 1998 as a base.
Fig. 2. Regions of interest selected for both the entire study and coherence analysis 2.1 Data selection, processing and results Data from both the C-band ERS-1/2 and L-band JERS-1 SAR systems were used for the analysis. In order to minimize the effect of baseline decorrelation on the final results, only InSAR pairs having smaller normal baselines were selected. In the case of ERS-1/2 SAR data, interferograms having a normal baseline of at most 200 m were selected, whiles a cut-off baseline of 1350 m was used for the JERS-1 SAR data. Twenty-seven JERS-1 and 33 ERS-1/2 interferograms were generated for the coherence analysis. The distribution of normal
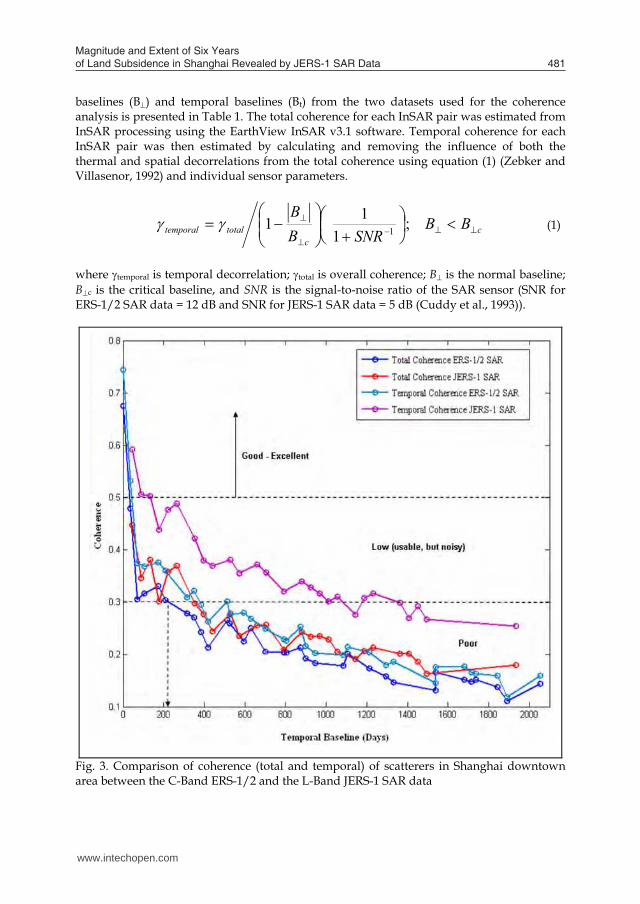
baselines (B⊥) and temporal baselines (Bt) from the two datasets used for the coherence analysis is presented in Table 1. The total coherence for each InSAR pair was estimated from InSAR processing using the EarthView InSAR v3.1 software. Temporal coherence for each InSAR pair was then estimated by calculating and removing the influence of both the thermal and spatial decorrelations from the total coherence using equation (1) (Zebker and Villasenor, 1992) and individual sensor parameters.
cc
totaltemporal BBSNRB
B⊥⊥−⊥
⊥ <
+
−= ;
111 1γγ (1)
where γtemporal is temporal decorrelation; γtotal is overall coherence; B⊥ is the normal baseline; B⊥c is the critical baseline, and SNR is the signal-to-noise ratio of the SAR sensor (SNR for ERS-1/2 SAR data = 12 dB and SNR for JERS-1 SAR data = 5 dB (Cuddy et al., 1993)).
Fig. 3. Comparison of coherence (total and temporal) of scatterers in Shanghai downtown area between the C-Band ERS-1/2 and the L-Band JERS-1 SAR data
www.intechopen.com
Magnitude and Extent of Six Years of Land Subsidence in Shanghai Revealed by JERS-1 SAR Data 481
arise between two related SAR signals over same location at different epochs. It is therefore necessary to assess the temporal coherence situation of scatterers prior to any serious studies involving the use of InSAR techniques. Temporal decorrelation occurs when scatterers change their behaviors over time. It is one of the major problems that affect interferograms covering Shanghai metropolis. Studies conducted by Ding et al. (2005), Damoah-Afari et al. (2007) and Damoah-Afari et al. (2008) show that coherence is not maintained in Shanghai metropolis after a period of about 10 months with the C-band ERS-1/2 SAR data. Therefore, it is problematic to use ERS-1/2 SAR data with long temporal baselines to monitor land subsidence characterized by very slow movement, as in the case of Shanghai. Coherence analysis was performed in a section of Shanghai covering the downtown area where the problem of land subsidence is severe in order to assess the behaviour of scatterers in Shanghai over time. The region of interest selected for coherence analysis spans approximately 9 km in azimuth direction and 8 km in range direction. The coherence analysis was also performed to assess which of the SAR data, either the C-band or the L-band, would be suitable for mapping the subsidence phenomena in Shanghai. Figure 2 shows both the region of interest selected for the entire study and the coherence analysis using ERS-2 SAR amplitude image of Shanghai acquired on 31 March 1998 as a base.
Fig. 2. Regions of interest selected for both the entire study and coherence analysis 2.1 Data selection, processing and results Data from both the C-band ERS-1/2 and L-band JERS-1 SAR systems were used for the analysis. In order to minimize the effect of baseline decorrelation on the final results, only InSAR pairs having smaller normal baselines were selected. In the case of ERS-1/2 SAR data, interferograms having a normal baseline of at most 200 m were selected, whiles a cut-off baseline of 1350 m was used for the JERS-1 SAR data. Twenty-seven JERS-1 and 33 ERS-1/2 interferograms were generated for the coherence analysis. The distribution of normal
baselines (B⊥) and temporal baselines (Bt) from the two datasets used for the coherence analysis is presented in Table 1. The total coherence for each InSAR pair was estimated from InSAR processing using the EarthView InSAR v3.1 software. Temporal coherence for each InSAR pair was then estimated by calculating and removing the influence of both the thermal and spatial decorrelations from the total coherence using equation (1) (Zebker and Villasenor, 1992) and individual sensor parameters.
cc
totaltemporal BBSNRB
B⊥⊥−⊥
⊥ <
+
−= ;
111 1γγ (1)
where γtemporal is temporal decorrelation; γtotal is overall coherence; B⊥ is the normal baseline; B⊥c is the critical baseline, and SNR is the signal-to-noise ratio of the SAR sensor (SNR for ERS-1/2 SAR data = 12 dB and SNR for JERS-1 SAR data = 5 dB (Cuddy et al., 1993)).
Fig. 3. Comparison of coherence (total and temporal) of scatterers in Shanghai downtown area between the C-Band ERS-1/2 and the L-Band JERS-1 SAR data
www.intechopen.com

Geoscience and Remote Sensing, New Achievements482
SAR Sensor
Normal Baselines (m) Min. Max. Mean Std Dev.
ERS-1/2 1 189 76 53
JERS-1 1 1313 517 363
Temporal Baselines (days) ERS-1/2 1 2054 891 614
JERS-1 44 1936 794 507
Table 1. Distribution of normal and temporal baselines of SAR datasets used for the coherence analysis The result of coherence analysis is presented in Figure 3. It can be seen from the figure that temporal coherence for both sensors are higher than their respective total coherences. It is also evident from the figure that JERS-1 SAR interferograms have higher coherence (both total and temporal) than the ERS-1/2 SAR over the study area, despite the larger normal and longer temporal baselines used in the case of JERS-1 SAR data. It can be seen that ERS-1/2 SAR data do not maintain good coherence levels after a temporal baseline of 7 months. It is evident from Figure 3 that majority of the interferometric pairs used in this study have coherence levels that fall below the optimum, 0.3.
3. InSAR qualitative mapping of land subsidence in Shanghai
The power of DInSAR is not only limited to its ability to do quantitative measurements, but can also consistently and accurately map out the extent or limits of ground surface deformation phenomena. This advantage makes DInSAR a powerful cartographic tool for qualitative mapping. DInSAR provides very dense and accurate observations with a very high level of precision (Gabriel et al., 1989). The results of DInSAR mapping can serve as reconnaissance or a base map for engineers in making decisions regarding the location and placement of benchmarks for GPS surveys or spirit leveling, and extensometers (Bawden et al., 2003). In this section, we present the results of using L-band JERS-1 SAR differential interferograms acquired during the period October 1992 to August 1998 to delimit and to track the stages of the land subsidence phenomenon of Shanghai. From the previous section, it was shown that most of the interferograms produced for coherence analysis had their coherence levels falling below the optimum, 0.3. However, they were very useful for qualitative analysis of the land subsidence phenomenon in Shanghai.
3.1 Data selection, processing and results When using the DInSAR technique to monitor land subsidence that is characterized by a very slow velocity, such as the case of land subsidence phenomena in Shanghai, it is important to use InSAR pairs with longer temporal baselines. InSAR pairs with longer temporal baselines, however, have problem due to temporal decorrelation. It is therefore important to set criteria for selecting the kind of SAR data and SAR image pairs that can provide satisfactory interferograms for such a study. We used the critical baseline together with the result of coherence analysis (Figure 3) to support our choice of using the L-band
JERS-1 SAR data other than the C-band ERS-1/2 SAR data for this study. The critical baseline, Bc is defined as (Zebker and Villasenor, 1992)
θλ
2cos2 yc R
rB = (2)
where λ is radar wavelength, Ry is range resolution, r is the distance between the sensor and the center of the resolution pixel, and θ is the incidence angle. Substituting individual sensor parameters (i.e., For ERS-1/2: θ = 23°, Ry = 25 m and r = 853 km; for JERS-1: θ = 39°, Ry = 18 m and r = 693 km) into equation (2) gives Bc of approximately 1150 m for ERS-1/2 SAR data and Bc of approximately 6750 m for the JERS-1 SAR data. Based on the above analyses, we interpret that JERS-1 SAR enables us to extend the normal baseline and the temporal baseline further than the ERS-1/2 SAR to achieve satisfactory interferograms. This in fact, is the advantage of longer wavelength SAR data over shorter ones for interferometric applications, especially in areas where there are known problems of loss of coherence. A total of 19 L-band differential interferograms and 2 DEMs were generated to track the developmental stages of land subsidence in Shanghai. The data has minimum relative temporal baseline of 44 days, maximum relative temporal baseline of 1056 days, minimum relative normal baseline of 2 m, and maximum relative normal baseline of 971 m. One of the DEMs was used to check the effectiveness of using the other to remove topographic phase from raw interferograms generated. Table 2 presents JERS-1 DInSAR pairs used for the qualitative mapping of land subsidence phenomenon in Shanghai. A major problem associated with using JERS-1 SAR data for interferometric applications is with precise orbit data to facilitate the removal of flat-earth phase from raw interferograms. Unlike the ERS-1/2 satellites which have very good orbit information to aid in interferogram flattening process, the JERS-1 SAR system had inaccurate orbit data. It was therefore necessary to refine the baseline during data processing. It is worthy to mention here that ground control points could have been used to aid in the baseline refinement. Unfortunately there were no available ground control points at the time of undertaking this study. The interferogram flattening was therefore achieved by using a baseline refinement method embedded in the EV-InSAR software, where both the normal baseline and the slave yaw angle were adjusted intuitively and interactively. Figure 4 shows the results of JERS-1 interferogram flattening process using the baseline refinement tool. The figure presents JERS-1 differential interferogram pair of 19971024-19980715, with normal baseline of 207 m and temporal baseline of 264 days. Experiment indicated that a change in normal baseline of -48.5 m and a change in slave yaw angle of 0.0004 rad were good to provide suitable flattened interferogram. Results of the JERS-1 differential interferograms are shown in Figure 5 and 6. A closed examination of the JERS-1 differential interferograms in Figure 5 and 6 revealed three stages of land subsidence in Shanghai during the period 1992 to 1998. The first stage stretches from October 1992 up to April 1995. The second stage emerged by the end of 1995 and continued
www.intechopen.com

Magnitude and Extent of Six Years of Land Subsidence in Shanghai Revealed by JERS-1 SAR Data 483
SAR Sensor
Normal Baselines (m) Min. Max. Mean Std Dev.
ERS-1/2 1 189 76 53
JERS-1 1 1313 517 363
Temporal Baselines (days) ERS-1/2 1 2054 891 614
JERS-1 44 1936 794 507
Table 1. Distribution of normal and temporal baselines of SAR datasets used for the coherence analysis The result of coherence analysis is presented in Figure 3. It can be seen from the figure that temporal coherence for both sensors are higher than their respective total coherences. It is also evident from the figure that JERS-1 SAR interferograms have higher coherence (both total and temporal) than the ERS-1/2 SAR over the study area, despite the larger normal and longer temporal baselines used in the case of JERS-1 SAR data. It can be seen that ERS-1/2 SAR data do not maintain good coherence levels after a temporal baseline of 7 months. It is evident from Figure 3 that majority of the interferometric pairs used in this study have coherence levels that fall below the optimum, 0.3.
3. InSAR qualitative mapping of land subsidence in Shanghai
The power of DInSAR is not only limited to its ability to do quantitative measurements, but can also consistently and accurately map out the extent or limits of ground surface deformation phenomena. This advantage makes DInSAR a powerful cartographic tool for qualitative mapping. DInSAR provides very dense and accurate observations with a very high level of precision (Gabriel et al., 1989). The results of DInSAR mapping can serve as reconnaissance or a base map for engineers in making decisions regarding the location and placement of benchmarks for GPS surveys or spirit leveling, and extensometers (Bawden et al., 2003). In this section, we present the results of using L-band JERS-1 SAR differential interferograms acquired during the period October 1992 to August 1998 to delimit and to track the stages of the land subsidence phenomenon of Shanghai. From the previous section, it was shown that most of the interferograms produced for coherence analysis had their coherence levels falling below the optimum, 0.3. However, they were very useful for qualitative analysis of the land subsidence phenomenon in Shanghai.
3.1 Data selection, processing and results When using the DInSAR technique to monitor land subsidence that is characterized by a very slow velocity, such as the case of land subsidence phenomena in Shanghai, it is important to use InSAR pairs with longer temporal baselines. InSAR pairs with longer temporal baselines, however, have problem due to temporal decorrelation. It is therefore important to set criteria for selecting the kind of SAR data and SAR image pairs that can provide satisfactory interferograms for such a study. We used the critical baseline together with the result of coherence analysis (Figure 3) to support our choice of using the L-band
JERS-1 SAR data other than the C-band ERS-1/2 SAR data for this study. The critical baseline, Bc is defined as (Zebker and Villasenor, 1992)
θλ
2cos2 yc R
rB = (2)
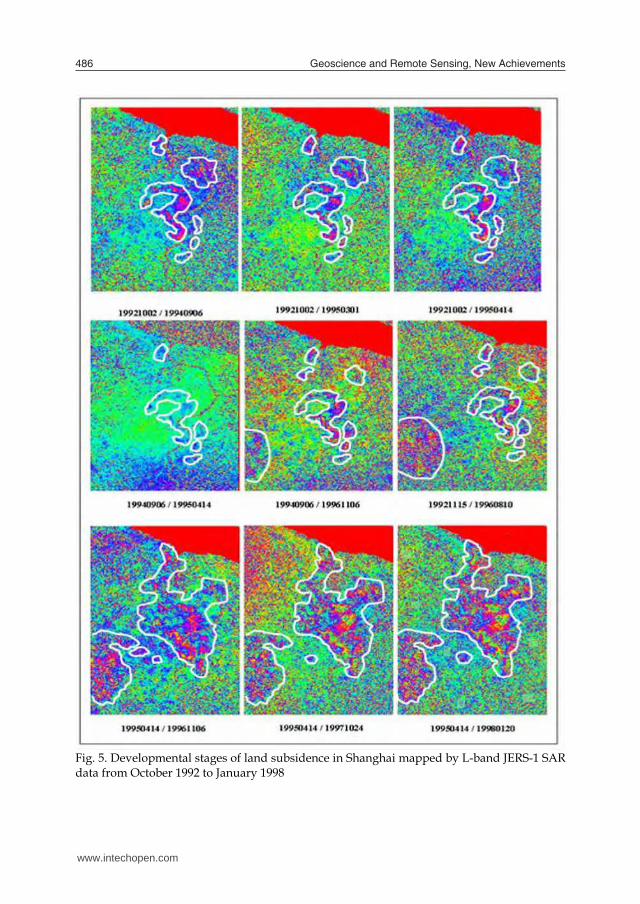
where λ is radar wavelength, Ry is range resolution, r is the distance between the sensor and the center of the resolution pixel, and θ is the incidence angle. Substituting individual sensor parameters (i.e., For ERS-1/2: θ = 23°, Ry = 25 m and r = 853 km; for JERS-1: θ = 39°, Ry = 18 m and r = 693 km) into equation (2) gives Bc of approximately 1150 m for ERS-1/2 SAR data and Bc of approximately 6750 m for the JERS-1 SAR data. Based on the above analyses, we interpret that JERS-1 SAR enables us to extend the normal baseline and the temporal baseline further than the ERS-1/2 SAR to achieve satisfactory interferograms. This in fact, is the advantage of longer wavelength SAR data over shorter ones for interferometric applications, especially in areas where there are known problems of loss of coherence. A total of 19 L-band differential interferograms and 2 DEMs were generated to track the developmental stages of land subsidence in Shanghai. The data has minimum relative temporal baseline of 44 days, maximum relative temporal baseline of 1056 days, minimum relative normal baseline of 2 m, and maximum relative normal baseline of 971 m. One of the DEMs was used to check the effectiveness of using the other to remove topographic phase from raw interferograms generated. Table 2 presents JERS-1 DInSAR pairs used for the qualitative mapping of land subsidence phenomenon in Shanghai. A major problem associated with using JERS-1 SAR data for interferometric applications is with precise orbit data to facilitate the removal of flat-earth phase from raw interferograms. Unlike the ERS-1/2 satellites which have very good orbit information to aid in interferogram flattening process, the JERS-1 SAR system had inaccurate orbit data. It was therefore necessary to refine the baseline during data processing. It is worthy to mention here that ground control points could have been used to aid in the baseline refinement. Unfortunately there were no available ground control points at the time of undertaking this study. The interferogram flattening was therefore achieved by using a baseline refinement method embedded in the EV-InSAR software, where both the normal baseline and the slave yaw angle were adjusted intuitively and interactively. Figure 4 shows the results of JERS-1 interferogram flattening process using the baseline refinement tool. The figure presents JERS-1 differential interferogram pair of 19971024-19980715, with normal baseline of 207 m and temporal baseline of 264 days. Experiment indicated that a change in normal baseline of -48.5 m and a change in slave yaw angle of 0.0004 rad were good to provide suitable flattened interferogram. Results of the JERS-1 differential interferograms are shown in Figure 5 and 6. A closed examination of the JERS-1 differential interferograms in Figure 5 and 6 revealed three stages of land subsidence in Shanghai during the period 1992 to 1998. The first stage stretches from October 1992 up to April 1995. The second stage emerged by the end of 1995 and continued
www.intechopen.com

Geoscience and Remote Sensing, New Achievements484
till the ending of 1997, where the third stage began to progress. Figure 7 presents the developmental stages of land subsidence phenomenon in Shanghai for the period October 1992 to August 1998 revealed by L-band JERS-1 SAR data. The accumulative land subsidence map of Shanghai produced from land survey methods is shown in Figure 7 (Bottom right). It is evident from Figure 7 that the accumulative subsidence map of Stage 3, obtained from InSAR, has close similarities to that produced by other survey methods. However, the extents of the subsidence phenomena have been accurately mapped by InSAR technique. Some areas marked as stable with land survey methods have been mapped otherwise as deforming areas, and vice versa, by InSAR technique.
No.
Master Image
Slave Image
B⊥ (m)
Bt
(days) DEM
1 19960810 19960923 -893.835 44 2 19960923 19961106 -546.643 44
InISAR 1 19921002 19940906 344.525 704 2 19921002 19950301 -418.261 880 3 19921002 19950414 442.313 924 4 19921115 19930327 814.734 132 5 19940906 19950414 97.118 220 6 19940906 19961106 971.135 792 7 19950301 19971024 167.897 968 8 19950301 19971207 -91.867 1012 9 19950301 19980120 861.803 1056 10 19950414 19961106 871.718 572 11 19950414 19971024 -691.515 924 12 19950414 19980120 1.882 1012 13 19961106 19980120 -870.420 440 14 19961220 19980601 248.301 528 15 19970501 19980601 -255.113 396 16 19970910 19980828 481.129 352 17 19971024 19980715 39.576 264 18 19971207 19980715 298.076 220 19 19980120 19980715 -655.105 176
Table 2. JERS-1 SAR DInSAR pairs used for mapping the extent and stages of land subsidence in Shanghai
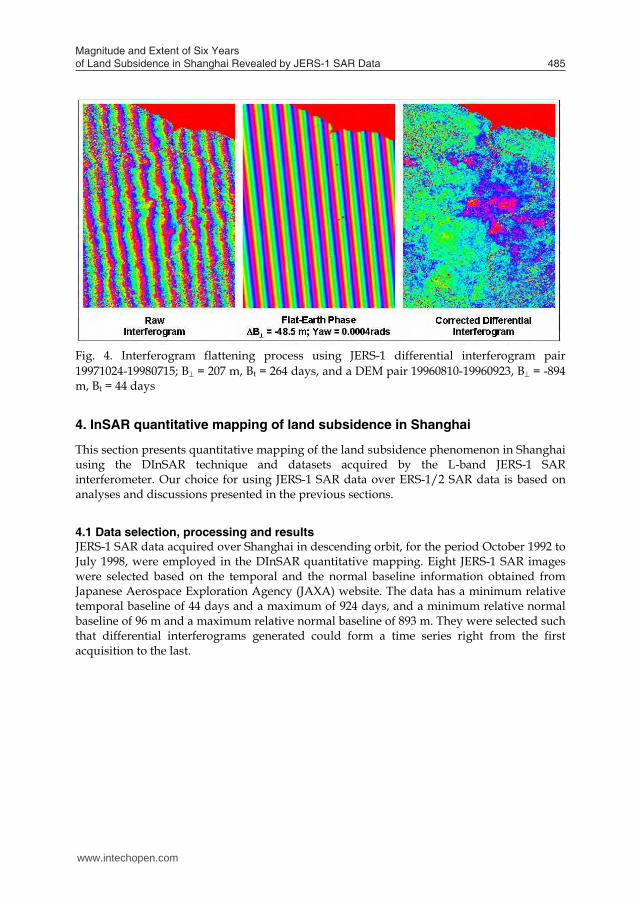
Fig. 4. Interferogram flattening process using JERS-1 differential interferogram pair 19971024-19980715; B⊥ = 207 m, Bt = 264 days, and a DEM pair 19960810-19960923, B⊥ = -894 m, Bt = 44 days
4. InSAR quantitative mapping of land subsidence in Shanghai
This section presents quantitative mapping of the land subsidence phenomenon in Shanghai using the DInSAR technique and datasets acquired by the L-band JERS-1 SAR interferometer. Our choice for using JERS-1 SAR data over ERS-1/2 SAR data is based on analyses and discussions presented in the previous sections.
4.1 Data selection, processing and results JERS-1 SAR data acquired over Shanghai in descending orbit, for the period October 1992 to July 1998, were employed in the DInSAR quantitative mapping. Eight JERS-1 SAR images were selected based on the temporal and the normal baseline information obtained from Japanese Aerospace Exploration Agency (JAXA) website. The data has a minimum relative temporal baseline of 44 days and a maximum of 924 days, and a minimum relative normal baseline of 96 m and a maximum relative normal baseline of 893 m. They were selected such that differential interferograms generated could form a time series right from the first acquisition to the last.
www.intechopen.com
Magnitude and Extent of Six Years of Land Subsidence in Shanghai Revealed by JERS-1 SAR Data 485
till the ending of 1997, where the third stage began to progress. Figure 7 presents the developmental stages of land subsidence phenomenon in Shanghai for the period October 1992 to August 1998 revealed by L-band JERS-1 SAR data. The accumulative land subsidence map of Shanghai produced from land survey methods is shown in Figure 7 (Bottom right). It is evident from Figure 7 that the accumulative subsidence map of Stage 3, obtained from InSAR, has close similarities to that produced by other survey methods. However, the extents of the subsidence phenomena have been accurately mapped by InSAR technique. Some areas marked as stable with land survey methods have been mapped otherwise as deforming areas, and vice versa, by InSAR technique.
No.
Master Image
Slave Image
B⊥ (m)
Bt
(days) DEM
1 19960810 19960923 -893.835 44 2 19960923 19961106 -546.643 44
InISAR 1 19921002 19940906 344.525 704 2 19921002 19950301 -418.261 880 3 19921002 19950414 442.313 924 4 19921115 19930327 814.734 132 5 19940906 19950414 97.118 220 6 19940906 19961106 971.135 792 7 19950301 19971024 167.897 968 8 19950301 19971207 -91.867 1012 9 19950301 19980120 861.803 1056 10 19950414 19961106 871.718 572 11 19950414 19971024 -691.515 924 12 19950414 19980120 1.882 1012 13 19961106 19980120 -870.420 440 14 19961220 19980601 248.301 528 15 19970501 19980601 -255.113 396 16 19970910 19980828 481.129 352 17 19971024 19980715 39.576 264 18 19971207 19980715 298.076 220 19 19980120 19980715 -655.105 176
Table 2. JERS-1 SAR DInSAR pairs used for mapping the extent and stages of land subsidence in Shanghai
Fig. 4. Interferogram flattening process using JERS-1 differential interferogram pair 19971024-19980715; B⊥ = 207 m, Bt = 264 days, and a DEM pair 19960810-19960923, B⊥ = -894 m, Bt = 44 days
4. InSAR quantitative mapping of land subsidence in Shanghai
This section presents quantitative mapping of the land subsidence phenomenon in Shanghai using the DInSAR technique and datasets acquired by the L-band JERS-1 SAR interferometer. Our choice for using JERS-1 SAR data over ERS-1/2 SAR data is based on analyses and discussions presented in the previous sections.
4.1 Data selection, processing and results JERS-1 SAR data acquired over Shanghai in descending orbit, for the period October 1992 to July 1998, were employed in the DInSAR quantitative mapping. Eight JERS-1 SAR images were selected based on the temporal and the normal baseline information obtained from Japanese Aerospace Exploration Agency (JAXA) website. The data has a minimum relative temporal baseline of 44 days and a maximum of 924 days, and a minimum relative normal baseline of 96 m and a maximum relative normal baseline of 893 m. They were selected such that differential interferograms generated could form a time series right from the first acquisition to the last.
www.intechopen.com
Geoscience and Remote Sensing, New Achievements486
Fig. 5. Developmental stages of land subsidence in Shanghai mapped by L-band JERS-1 SAR data from October 1992 to January 1998
Fig. 6. Developmental stages of land subsidence in Shanghai mapped by L-band JERS-1 SAR data from March 1995 to August 1998
www.intechopen.com

Magnitude and Extent of Six Years of Land Subsidence in Shanghai Revealed by JERS-1 SAR Data 487
Fig. 5. Developmental stages of land subsidence in Shanghai mapped by L-band JERS-1 SAR data from October 1992 to January 1998
Fig. 6. Developmental stages of land subsidence in Shanghai mapped by L-band JERS-1 SAR data from March 1995 to August 1998
www.intechopen.com

Geoscience and Remote Sensing, New Achievements488
Fig. 7. Developmental stages of land subsidence in Shanghai from 1992-1998 mapped by JERS-1 SAR data. (Top left) Stage 1: accumulative subsidence up to April 1995; (Top right) Stage 2: accumulative subsidence up to October 1997; (Bottom left) Stage 3: accumulative subsidence map up to August 1998; and (Bottom right) accumulative subsidence map from 1990-1998 obtained from other survey methods (Source: Zhang et al., 2002)
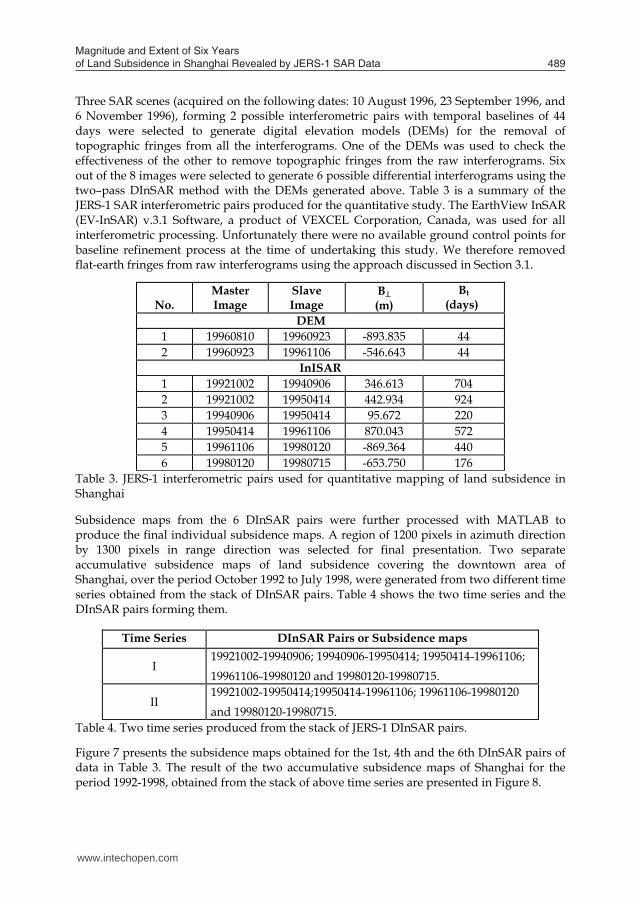
Three SAR scenes (acquired on the following dates: 10 August 1996, 23 September 1996, and 6 November 1996), forming 2 possible interferometric pairs with temporal baselines of 44 days were selected to generate digital elevation models (DEMs) for the removal of topographic fringes from all the interferograms. One of the DEMs was used to check the effectiveness of the other to remove topographic fringes from the raw interferograms. Six out of the 8 images were selected to generate 6 possible differential interferograms using the two–pass DInSAR method with the DEMs generated above. Table 3 is a summary of the JERS-1 SAR interferometric pairs produced for the quantitative study. The EarthView InSAR (EV-InSAR) v.3.1 Software, a product of VEXCEL Corporation, Canada, was used for all interferometric processing. Unfortunately there were no available ground control points for baseline refinement process at the time of undertaking this study. We therefore removed flat-earth fringes from raw interferograms using the approach discussed in Section 3.1.
No.
Master Image
Slave Image
B⊥ (m)
Bt (days)
DEM 1 19960810 19960923 -893.835 44 2 19960923 19961106 -546.643 44
InISAR 1 19921002 19940906 346.613 704 2 19921002 19950414 442.934 924 3 19940906 19950414 95.672 220 4 19950414 19961106 870.043 572 5 19961106 19980120 -869.364 440 6 19980120 19980715 -653.750 176
Table 3. JERS-1 interferometric pairs used for quantitative mapping of land subsidence in Shanghai Subsidence maps from the 6 DInSAR pairs were further processed with MATLAB to produce the final individual subsidence maps. A region of 1200 pixels in azimuth direction by 1300 pixels in range direction was selected for final presentation. Two separate accumulative subsidence maps of land subsidence covering the downtown area of Shanghai, over the period October 1992 to July 1998, were generated from two different time series obtained from the stack of DInSAR pairs. Table 4 shows the two time series and the DInSAR pairs forming them.
Time Series DInSAR Pairs or Subsidence maps
I 19921002-19940906; 19940906-19950414; 19950414-19961106;
19961106-19980120 and 19980120-19980715.
II 19921002-19950414;19950414-19961106; 19961106-19980120
and 19980120-19980715. Table 4. Two time series produced from the stack of JERS-1 DInSAR pairs.
Figure 7 presents the subsidence maps obtained for the 1st, 4th and the 6th DInSAR pairs of data in Table 3. The result of the two accumulative subsidence maps of Shanghai for the period 1992-1998, obtained from the stack of above time series are presented in Figure 8.
www.intechopen.com
Magnitude and Extent of Six Years of Land Subsidence in Shanghai Revealed by JERS-1 SAR Data 489
Fig. 7. Developmental stages of land subsidence in Shanghai from 1992-1998 mapped by JERS-1 SAR data. (Top left) Stage 1: accumulative subsidence up to April 1995; (Top right) Stage 2: accumulative subsidence up to October 1997; (Bottom left) Stage 3: accumulative subsidence map up to August 1998; and (Bottom right) accumulative subsidence map from 1990-1998 obtained from other survey methods (Source: Zhang et al., 2002)
Three SAR scenes (acquired on the following dates: 10 August 1996, 23 September 1996, and 6 November 1996), forming 2 possible interferometric pairs with temporal baselines of 44 days were selected to generate digital elevation models (DEMs) for the removal of topographic fringes from all the interferograms. One of the DEMs was used to check the effectiveness of the other to remove topographic fringes from the raw interferograms. Six out of the 8 images were selected to generate 6 possible differential interferograms using the two–pass DInSAR method with the DEMs generated above. Table 3 is a summary of the JERS-1 SAR interferometric pairs produced for the quantitative study. The EarthView InSAR (EV-InSAR) v.3.1 Software, a product of VEXCEL Corporation, Canada, was used for all interferometric processing. Unfortunately there were no available ground control points for baseline refinement process at the time of undertaking this study. We therefore removed flat-earth fringes from raw interferograms using the approach discussed in Section 3.1.
No.
Master Image
Slave Image
B⊥ (m)
Bt (days)
DEM 1 19960810 19960923 -893.835 44 2 19960923 19961106 -546.643 44
InISAR 1 19921002 19940906 346.613 704 2 19921002 19950414 442.934 924 3 19940906 19950414 95.672 220 4 19950414 19961106 870.043 572 5 19961106 19980120 -869.364 440 6 19980120 19980715 -653.750 176
Table 3. JERS-1 interferometric pairs used for quantitative mapping of land subsidence in Shanghai Subsidence maps from the 6 DInSAR pairs were further processed with MATLAB to produce the final individual subsidence maps. A region of 1200 pixels in azimuth direction by 1300 pixels in range direction was selected for final presentation. Two separate accumulative subsidence maps of land subsidence covering the downtown area of Shanghai, over the period October 1992 to July 1998, were generated from two different time series obtained from the stack of DInSAR pairs. Table 4 shows the two time series and the DInSAR pairs forming them.
Time Series DInSAR Pairs or Subsidence maps
I 19921002-19940906; 19940906-19950414; 19950414-19961106;
19961106-19980120 and 19980120-19980715.
II 19921002-19950414;19950414-19961106; 19961106-19980120
and 19980120-19980715. Table 4. Two time series produced from the stack of JERS-1 DInSAR pairs.
Figure 7 presents the subsidence maps obtained for the 1st, 4th and the 6th DInSAR pairs of data in Table 3. The result of the two accumulative subsidence maps of Shanghai for the period 1992-1998, obtained from the stack of above time series are presented in Figure 8.
www.intechopen.com
Geoscience and Remote Sensing, New Achievements490
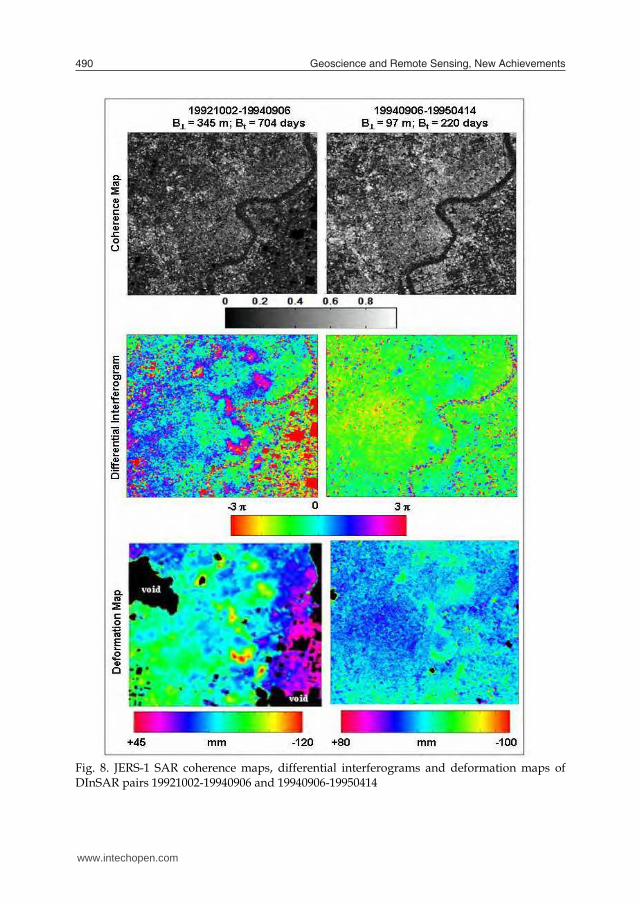
Fig. 8. JERS-1 SAR coherence maps, differential interferograms and deformation maps of DInSAR pairs 19921002-19940906 and 19940906-19950414
Fig. 9. JERS-1 SAR coherence maps, differential interferograms and deformation maps of DInSAR pairs 19921002-19940414 and 19940414-19961106
www.intechopen.com

Magnitude and Extent of Six Years of Land Subsidence in Shanghai Revealed by JERS-1 SAR Data 491
Fig. 8. JERS-1 SAR coherence maps, differential interferograms and deformation maps of DInSAR pairs 19921002-19940906 and 19940906-19950414
Fig. 9. JERS-1 SAR coherence maps, differential interferograms and deformation maps of DInSAR pairs 19921002-19940414 and 19940414-19961106
www.intechopen.com

Geoscience and Remote Sensing, New Achievements492
Fig. 10. JERS-1 SAR coherence maps, differential interferograms and deformation maps of DInSAR pairs 19961106-19980120 and 19980120-19980715
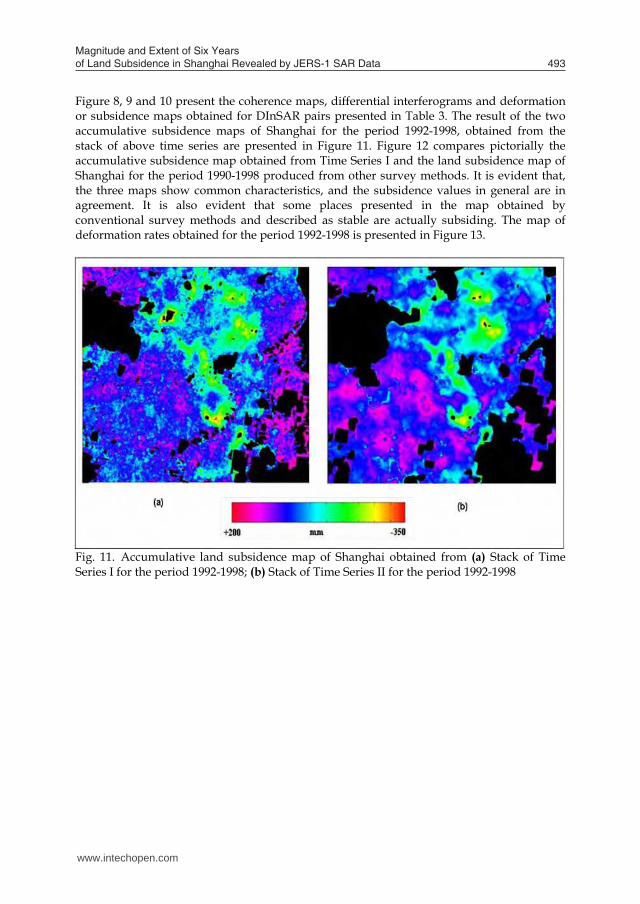
Figure 8, 9 and 10 present the coherence maps, differential interferograms and deformation or subsidence maps obtained for DInSAR pairs presented in Table 3. The result of the two accumulative subsidence maps of Shanghai for the period 1992-1998, obtained from the stack of above time series are presented in Figure 11. Figure 12 compares pictorially the accumulative subsidence map obtained from Time Series I and the land subsidence map of Shanghai for the period 1990-1998 produced from other survey methods. It is evident that, the three maps show common characteristics, and the subsidence values in general are in agreement. It is also evident that some places presented in the map obtained by conventional survey methods and described as stable are actually subsiding. The map of deformation rates obtained for the period 1992-1998 is presented in Figure 13.
Fig. 11. Accumulative land subsidence map of Shanghai obtained from (a) Stack of Time Series I for the period 1992-1998; (b) Stack of Time Series II for the period 1992-1998
www.intechopen.com
Magnitude and Extent of Six Years of Land Subsidence in Shanghai Revealed by JERS-1 SAR Data 493
Fig. 10. JERS-1 SAR coherence maps, differential interferograms and deformation maps of DInSAR pairs 19961106-19980120 and 19980120-19980715
Figure 8, 9 and 10 present the coherence maps, differential interferograms and deformation or subsidence maps obtained for DInSAR pairs presented in Table 3. The result of the two accumulative subsidence maps of Shanghai for the period 1992-1998, obtained from the stack of above time series are presented in Figure 11. Figure 12 compares pictorially the accumulative subsidence map obtained from Time Series I and the land subsidence map of Shanghai for the period 1990-1998 produced from other survey methods. It is evident that, the three maps show common characteristics, and the subsidence values in general are in agreement. It is also evident that some places presented in the map obtained by conventional survey methods and described as stable are actually subsiding. The map of deformation rates obtained for the period 1992-1998 is presented in Figure 13.
Fig. 11. Accumulative land subsidence map of Shanghai obtained from (a) Stack of Time Series I for the period 1992-1998; (b) Stack of Time Series II for the period 1992-1998
www.intechopen.com

Geoscience and Remote Sensing, New Achievements494
Fig. 12. Accumulative land subsidence map of Shanghai obtained from (a) Stacking Time Series I for the period 1992-1998; (b) Land surveys for the period 1990-1998 (Source: Zhang et al., 2002).
Fig. 13. The map of deformation rates obtained for the period 1992-1998 by Stacking Time Series I (see Table 3 and Table 4)
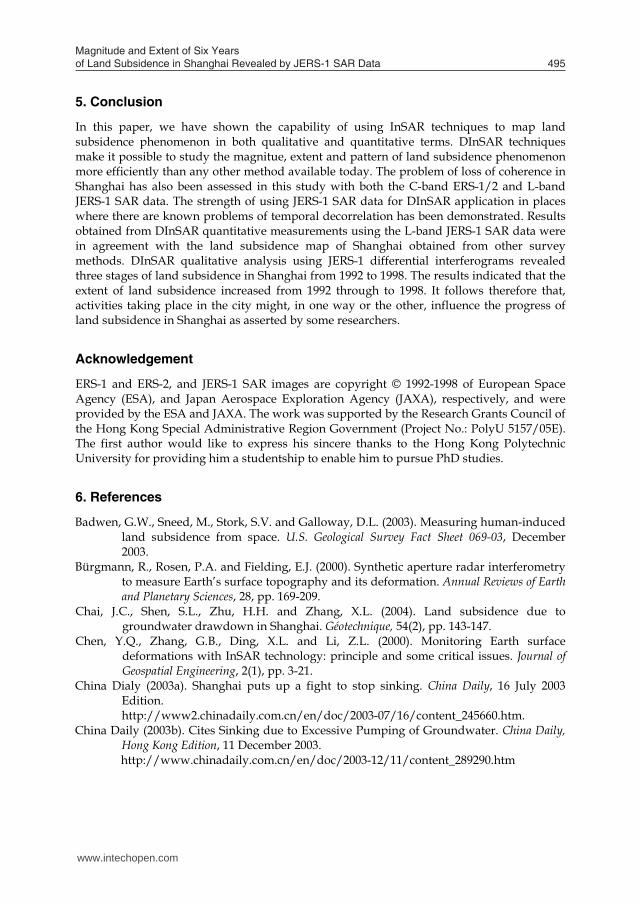
5. Conclusion
In this paper, we have shown the capability of using InSAR techniques to map land subsidence phenomenon in both qualitative and quantitative terms. DInSAR techniques make it possible to study the magnitue, extent and pattern of land subsidence phenomenon more efficiently than any other method available today. The problem of loss of coherence in Shanghai has also been assessed in this study with both the C-band ERS-1/2 and L-band JERS-1 SAR data. The strength of using JERS-1 SAR data for DInSAR application in places where there are known problems of temporal decorrelation has been demonstrated. Results obtained from DInSAR quantitative measurements using the L-band JERS-1 SAR data were in agreement with the land subsidence map of Shanghai obtained from other survey methods. DInSAR qualitative analysis using JERS-1 differential interferograms revealed three stages of land subsidence in Shanghai from 1992 to 1998. The results indicated that the extent of land subsidence increased from 1992 through to 1998. It follows therefore that, activities taking place in the city might, in one way or the other, influence the progress of land subsidence in Shanghai as asserted by some researchers.
Acknowledgement
ERS-1 and ERS-2, and JERS-1 SAR images are copyright © 1992-1998 of European Space Agency (ESA), and Japan Aerospace Exploration Agency (JAXA), respectively, and were provided by the ESA and JAXA. The work was supported by the Research Grants Council of the Hong Kong Special Administrative Region Government (Project No.: PolyU 5157/05E). The first author would like to express his sincere thanks to the Hong Kong Polytechnic University for providing him a studentship to enable him to pursue PhD studies.
6. References
Badwen, G.W., Sneed, M., Stork, S.V. and Galloway, D.L. (2003). Measuring human-induced land subsidence from space. U.S. Geological Survey Fact Sheet 069-03, December 2003.
Bürgmann, R., Rosen, P.A. and Fielding, E.J. (2000). Synthetic aperture radar interferometry to measure Earth’s surface topography and its deformation. Annual Reviews of Earth and Planetary Sciences, 28, pp. 169-209.
Chai, J.C., Shen, S.L., Zhu, H.H. and Zhang, X.L. (2004). Land subsidence due to groundwater drawdown in Shanghai. Géotechnique, 54(2), pp. 143-147.
Chen, Y.Q., Zhang, G.B., Ding, X.L. and Li, Z.L. (2000). Monitoring Earth surface deformations with InSAR technology: principle and some critical issues. Journal of Geospatial Engineering, 2(1), pp. 3-21.
China Dialy (2003a). Shanghai puts up a fight to stop sinking. China Daily, 16 July 2003 Edition. http://www2.chinadaily.com.cn/en/doc/2003-07/16/content_245660.htm.
China Daily (2003b). Cites Sinking due to Excessive Pumping of Groundwater. China Daily, Hong Kong Edition, 11 December 2003. http://www.chinadaily.com.cn/en/doc/2003-12/11/content_289290.htm
www.intechopen.com
Magnitude and Extent of Six Years of Land Subsidence in Shanghai Revealed by JERS-1 SAR Data 495
Fig. 12. Accumulative land subsidence map of Shanghai obtained from (a) Stacking Time Series I for the period 1992-1998; (b) Land surveys for the period 1990-1998 (Source: Zhang et al., 2002).
Fig. 13. The map of deformation rates obtained for the period 1992-1998 by Stacking Time Series I (see Table 3 and Table 4)
5. Conclusion
In this paper, we have shown the capability of using InSAR techniques to map land subsidence phenomenon in both qualitative and quantitative terms. DInSAR techniques make it possible to study the magnitue, extent and pattern of land subsidence phenomenon more efficiently than any other method available today. The problem of loss of coherence in Shanghai has also been assessed in this study with both the C-band ERS-1/2 and L-band JERS-1 SAR data. The strength of using JERS-1 SAR data for DInSAR application in places where there are known problems of temporal decorrelation has been demonstrated. Results obtained from DInSAR quantitative measurements using the L-band JERS-1 SAR data were in agreement with the land subsidence map of Shanghai obtained from other survey methods. DInSAR qualitative analysis using JERS-1 differential interferograms revealed three stages of land subsidence in Shanghai from 1992 to 1998. The results indicated that the extent of land subsidence increased from 1992 through to 1998. It follows therefore that, activities taking place in the city might, in one way or the other, influence the progress of land subsidence in Shanghai as asserted by some researchers.
Acknowledgement
ERS-1 and ERS-2, and JERS-1 SAR images are copyright © 1992-1998 of European Space Agency (ESA), and Japan Aerospace Exploration Agency (JAXA), respectively, and were provided by the ESA and JAXA. The work was supported by the Research Grants Council of the Hong Kong Special Administrative Region Government (Project No.: PolyU 5157/05E). The first author would like to express his sincere thanks to the Hong Kong Polytechnic University for providing him a studentship to enable him to pursue PhD studies.
6. References
Badwen, G.W., Sneed, M., Stork, S.V. and Galloway, D.L. (2003). Measuring human-induced land subsidence from space. U.S. Geological Survey Fact Sheet 069-03, December 2003.
Bürgmann, R., Rosen, P.A. and Fielding, E.J. (2000). Synthetic aperture radar interferometry to measure Earth’s surface topography and its deformation. Annual Reviews of Earth and Planetary Sciences, 28, pp. 169-209.
Chai, J.C., Shen, S.L., Zhu, H.H. and Zhang, X.L. (2004). Land subsidence due to groundwater drawdown in Shanghai. Géotechnique, 54(2), pp. 143-147.
Chen, Y.Q., Zhang, G.B., Ding, X.L. and Li, Z.L. (2000). Monitoring Earth surface deformations with InSAR technology: principle and some critical issues. Journal of Geospatial Engineering, 2(1), pp. 3-21.
China Dialy (2003a). Shanghai puts up a fight to stop sinking. China Daily, 16 July 2003 Edition. http://www2.chinadaily.com.cn/en/doc/2003-07/16/content_245660.htm.
China Daily (2003b). Cites Sinking due to Excessive Pumping of Groundwater. China Daily, Hong Kong Edition, 11 December 2003. http://www.chinadaily.com.cn/en/doc/2003-12/11/content_289290.htm
www.intechopen.com

Geoscience and Remote Sensing, New Achievements496
Cuddy, D., Chen, M.J. and Bicknell, T. (1993). Alaska SAR processor implementation for JERS-1. IEEE Proceedings of the International Geoscience and Remote Sensing Symposium, 1993, 4, 2130-2132.
Damoah-Afari, P., Ding, X.L., Lu, Z. and Li, Z.W. (2008). Detecting ground settlement of Shanghai using interferometric synthetic aperture radar (InSAR) techniques. Proceedings of Commission VII, International Society of Photogrammetry and Remote Sensing (ISPRS2008) Congres, Beijing, 2008, vol. XXXVII, part B7, pp. 117-124.
Damoah-Afari, P., Ding, X.L., Li, Z.W., Lu, Z. and Omura, M. (2007). Six years of land subsidence in Shanghai revealed by JERS-1 SAR data. IEEE Proceedings on International Geoscience and Remote Sensing Symposium, 2007, pp. 2093-2097.
Deng, A.S. and Ju, J.H. (1994). Land subsidence, sinkhole collapse and Earth fissure occurrence and control in China. Journal of Hydrological Sciences, 39(3), pp. 245-256.
Ding, X.L., Li, Z.W., Damoah-Afari, P., Liu, G.X. and Huang, C. (2005). Study of ground subsidence in Shanghai with satellite radar remote sensing. Proceedings of the First International Symposim of Cloud-prone and Rainy Areas Remote Sensing (1st CARRS) Hong Kong, 2005, pp. 298-316.
Gabriel, A.K., Goldstein, R.M. and Zebker, H.A. (1989). Mapping small elevation changes over large areas: differential radar interferometry. Journal of Geophysical Research, 94(B7), pp. 9183-9191.
Gong, S.L., Wu, J.Z. and Yan, X.X. (2005). Analysis of land subsidence due to construction engineering in soft soil region of Shanghai. In: Proceedings of the 7th International Symposium on Land Subsidence, Shanghai, China, Vol. 1, pp. 82-87.
Hu, R.L., Yue. Z.Q., Wang, L.C. and Wang, S.J. (2004). Review on current status and challenging issues of land subsidence in China. Engineering Geology, 76, pp. 65-77.
Shi, L.X. and Bao, M.F. (1994). Case History No. 9.2 – Shanghai, China. In Poland, J.F. ed. Guidebook to studies of land subsidence due to groundwater withdrawal, UNESCO, Paris. http://wwwrcamn.wr.usgs.gov/rgws/Unesco/PDF-Chapters/Chapeter9-2.pdf.
Xue, Y.Q., Zhang, Y., Ye, S.J., Wu, J.C. and Li Q.F. (2005). Land subsidence in China. Environmental Geology, 2005, 48, 713-720.
Yang, G.F., Wei, Z.X. and Huang, C.S. (2005). Advances and challenge in research on land subsidence in China. In: Proceedings of the 7th International Symposium on Land Subsidence, Shanghai, China, Vol. 1, pp. 3-9.
Zebker, H.A., Rosen, P.A. and Hensley, S. (1997). Atmospheric effects in inteferformetric synthetic aperture radar surface deformation and topographic maps. Journal of Geophysical Research, 1997, 102(B4), 7547-7563.
Zebker, H.A. and Villasenor, J. (1992). Decorrelation in interferometric radar echoes. IEEE Transactions on Geoscience and Remote Sensing, 30(5), pp. 950-959.
Zebker, H.A., Villasenor, J. and Madsen, S.N. (1992). Topographic mapping from ERS-1 and SEASAT radar interferometry. Proceedings of the IEEE International Geoscience and Remote Sensing Symposium, 1992, 387-388.
Zhang, A.G., Luo, D.Y., Shen X.G., Lü, L.A., Chen, H.W., Wei, Z.X., Yan, X.X., Fang, Z., and Shi, Y.Q. (2002). Shanghai Geological Environmental Atlas: Editorial Board (SGEAEB). Geological Publishing House, Beijing, pp. 130-133.
Zhang, A.G. and Wei, Z.X. (2005). Prevention and cure with Shanghai land subsidence and city sustaining development. In: Proceedings of the 7th International Symposium on Land Subsidence, Shanghai, China, Vol. 1, pp. 10-17.
www.intechopen.com

Geoscience and Remote Sensing New AchievementsEdited by Pasquale Imperatore and Daniele Riccio
ISBN 978-953-7619-97-8Hard cover, 508 pagesPublisher InTechPublished online 01, February, 2010Published in print edition February, 2010
InTech EuropeUniversity Campus STeP Ri Slavka Krautzeka 83/A 51000 Rijeka, Croatia Phone: +385 (51) 770 447 Fax: +385 (51) 686 166www.intechopen.com
InTech ChinaUnit 405, Office Block, Hotel Equatorial Shanghai No.65, Yan An Road (West), Shanghai, 200040, China
Phone: +86-21-62489820 Fax: +86-21-62489821
Our planet is nowadays continuously monitored by powerful remote sensors operating in wide portions of theelectromagnetic spectrum. Our capability of acquiring detailed information on the environment has beenrevolutionized by revealing its inner structure, morphology and dynamical changes. The way we now observeand study the evolution of the Earth’s status has even radically influenced our perception and conception ofthe world we live in. The aim of this book is to bring together contributions from experts to present newresearch results and prospects of the future developments in the area of geosciences and remote sensing;emerging research directions are discussed. The volume consists of twenty-six chapters, encompassing boththeoretical aspects and application-oriented studies. An unfolding perspective on various current trends in thisextremely rich area is offered. The book chapters can be categorized along different perspectives, amongothers, use of active or passive sensors, employed technologies and configurations, considered scenario onthe Earth, scientific research area involved in the studies.
How to referenceIn order to correctly reference this scholarly work, feel free to copy and paste the following:
Peter Damoah-Afari, Xiao-li Ding, Zhong Lu, Zhiwei Li and Makoto Omura (2010). Magnitude and Extent of SixYears of Land Subsidence in Shanghai Revealed by JERS-1 SAR Data, Geoscience and Remote Sensing NewAchievements, Pasquale Imperatore and Daniele Riccio (Ed.), ISBN: 978-953-7619-97-8, InTech, Availablefrom: http://www.intechopen.com/books/geoscience-and-remote-sensing-new-achievements/magnitude-and-extent-of-six-years-of-land-subsidence-in-shanghai-revealed-by-jers-1-sar-data